


Abstract
Feedback is central to formative e-assessment. How long students spend on it may itself be associated with whether they correct an error on a second attempt. This study examined the association between feedback-screen time (FST) and second-attempt accuracy (SAA) in mathematics, and whether it varies across items. We analyzed 8051 interactions from 1654 students following an incorrect first attempt on eight differential calculus items in the MathUP e-assessment platform. A generalized estimating equation, clustered by student, modeled SAA as a function of FST (a piecewise linear spline selected through a pre-registered, cross-validated protocol), feedback type (diagnostic plus worked-example vs. worked-example alone), and item identity. Predicted SAA rose steeply up to approximately 3.4 s of FST (61.0%) and changed little thereafter (69.1% at 640 s). Neither the FST × item nor the feedback type × item interaction improved out-of-sample performance. Item identity was associated with SAA. Feedback type showed only a marginal association, based on 143 self-selected worked-example-only interactions. Within one course and one institution, SAA was associated with FST mainly over the first few seconds. These observational findings do not establish causality and warrant replication in other contexts.
1. Introduction
Feedback is widely recognized as one of the most powerful influences on student learning and achievement (Muñiz-Rodríguez et al., 2017). Its primary purpose is to reduce the discrepancies between a student’s current understanding and a desired educational goal (Hattie & Timperley, 2007). Traditional assessment methodologies often involve substantial delays in feedback, which constrain the effectiveness of pedagogical interventions and limit students’ ability to promptly identify and correct misconceptions and errors (Van der Kleij et al., 2015).
However, the impact of feedback is highly variable and depends on its content and focus (Mandouit & Hattie, 2023). Elaborated, formative feedback is indispensable for correcting faulty interpretations and reducing uncertainty, in contrast to simple verification that merely states if an answer is right or wrong (Shute, 2008). Furthermore, feedback is significantly more powerful when directed at the process level to help reject false hypotheses (Hattie & Timperley, 2007). Its overall effectiveness increases when it contains a high level of information to guide the students’ next steps (Wisniewski et al., 2020).
In recent years, e-assessment platforms have transformed how this information is delivered. Immediate, automated feedback allows students to identify gaps, encourages self-paced learning, and supports iterative “test-feedback-retest” cycles. A widely adopted mechanism is the multiple-choice question. When each incorrect option represents a specific misconception, the system can deliver tailored, error-specific feedback alongside a worked, step-by-step explanation of the solution (Kinnear et al., 2024). The application of artificial intelligence and learning analytics for such assessment and feedback has been shown to successfully enhance student outcomes and reduce instructor workload in higher education environments (Hooda et al., 2022). MathUP, the platform under study, implements this dual-feedback model and additionally allows students to select “I cannot find my answer,” an option that may signal explicit metacognitive awareness of a genuine cognitive gap and triggers only the worked, step-by-step feedback. Because students thus self-select into their feedback condition, comparing those who acknowledge such a gap with those who commit a specific error may reveal fundamentally different learner behaviors, raising the question of whether observed differences in performance reflect the content of the feedback itself or the disposition of the learner who received it.
The provision of feedback, however, does not guarantee its utilization. In digital environments, learning requires students to actively monitor their own progress. This shifts the focus toward “feedback literacy” in e-assessments, a capacity defined as the learner’s ability to appreciate, interpret, and act on the feedback provided (Wongvorachan et al., 2022). This concept repositions the student from a passive recipient in a transmission model to an active agent who exercises shared responsibility in the assessment process (Boud & Molloy, 2013).
A well-documented phenomenon in interactive learning environments is “gaming the system,” in which students attempt to advance through a curriculum by systematically guessing or misusing a platform’s help features instead of engaging with the material (Baker et al., 2004). Because this disengaged behavior is difficult to distinguish from a genuine attempt on the basis of the response alone, response time has been used as a behavioral marker: very short engagement windows are associated with guessing rather than deliberate processing, though threshold-based classification of guessing from response time carries non-trivial misclassification error (Holopainen et al., 2025), within the broader psychometric framework for jointly modeling response time and accuracy (van der Linden, 2007). This suggests that the amount of time a student spends with feedback, not merely whether feedback was provided, may itself carry information about how that feedback was used.
To measure this active engagement, trace data from e-assessments must be grounded in learning theories rather than merely counting clicks or time online (Gašević et al., 2015). From a self-regulated learning perspective, cognitive processing is reflected in observable behavioral traces, such as the time spent engaging with instructional information (Ye et al., 2024). Accordingly, feedback-screen time (FST) is examined here as a behavioral trace that has been proposed as a proxy for engagement, feedback literacy and the metacognitive effort the student invests before attempting to solve the problem again. Within a Vygotskian framework, effective feedback operates within the learner’s Zone of Proximal Development (Vygotsky, 1978): there may be an optimal window of engagement in which sufficient time to reflect on feedback supports learning. This study operationalizes that window through FST.
For the purposes of this study, every item presents its own characteristics. Even within a single conceptual family, individual items differ in their wording, in how their distractors are constructed, in the specific misconceptions they are designed to elicit, in the mathematical function or procedure involved, in the transfer demands they place on the student, and in the length of the feedback associated with them. Because FST and error recovery are examined here at the level of individual interactions with specific items, this study treats item identity as an explicit unit of analysis.
Beyond its role as a continuous behavioral proxy, the time students spend on the feedback screen can also be examined descriptively, by grouping interactions according to how long they lasted: from very brief to moderate, extended or prolonged times on the feedback screen. These groupings may echo distinctions already present in the literature: reduced deliberation, most consistent with guessing-like engagement at its fastest end (Baker et al., 2004; Holopainen et al., 2025), efficient allocation of cognitive resources (Simon, 1957; Sweller, 1988), a performance plateau within a single session of continued engagement, and sustained, effortful re-engagement consistent with high feedback literacy (Boud & Molloy, 2013). These groupings are treated here as descriptive, interaction-level bands, examined separately from, and secondary to, the continuous analysis of FST.
These dynamics are particularly relevant in higher mathematics e-assessment, where iterative test-feedback-retest cycles are common and the cognitive demands of individual tasks vary from one item to the next (Sweller, 2023; Hettiarachchi & Huertas, 2012). Understanding how the time students invest in feedback, the type of feedback they receive, and the specific item they are solving are associated with error recovery in this setting is relevant both to feedback theory and to the design of adaptive assessment platforms. Accordingly, this study addresses the following research questions.
RQ1: What is the functional form of the association between feedback-screen time (FST) and second-attempt accuracy (SAA)?
RQ2: Is the FST–SAA association consistent across items and across feedback types, or does it depend on which item the student is solving or which type of feedback they received?
RQ3: Controlling for item identity and FST, is the type of feedback received associated with second-attempt accuracy?
RQ4 (exploratory): Do descriptive, interaction-level FST bands show a distributional pattern consistent with the continuous FST–SAA association established in RQ1?
2. Materials and Methods
2.1. Instrument
MathUP is an e-assessment tool based on multiple-choice questions that provides immediate, diagnostic and/or worked-example feedback. It supports iterative “test–learn–retest” cycles, thereby promoting formative assessment and continuous learning.
When a student answers correctly, MathUP confirms the correct answer and displays the Worked-Example Feedback as reinforcement. When a student fails their first attempt, MathUP provides Diagnostic Feedback plus Worked-Example Feedback (DF + WEF). The DF part is included as a comment tailored to the specific distractor chosen, combined with the WEF part as a general step-by-step explanation. If the student selected “I cannot find my answer,” only the Worked-Example Feedback is provided. The diagnostic component addresses the student’s specific error, consistent with what Narciss (2008) describes as knowledge about mistakes, while the worked-example component follows that studying a fully worked solution reduces extraneous cognitive load relative to unsupported problem solving (Sweller & Cooper, 1985). The feedback valence in MathUP is then positive after a correct answer and negative after an error, but nuanced to orient towards the correct answer. This nuance is important, because negative performance feedback has been associated experimentally with increased cognitive effort, in ways that vary with individual differences in emotional regulation (Mizrahi et al., 2025). Since FST is analyzed only after an incorrect first attempt, every FST examined in this study corresponds to time on a screen showing this type of feedback. The second attempt is generated using random parameters (Greenhow, 2015) while maintaining the same structural design as the first. Because WEF documents the fully worked solution to the specific numerical instance of the item failed on the first attempt, and not to the parametrically varied item presented on the second attempt, it functions as a worked example (Renkl, 2014) that students can apply to the same procedure with new parameter values.
The following is an example of an item taken from MathUP that illustrates how distractors are designed to target specific misconceptions: students must identify the equation of a horizontal tangent line, choosing among options that include the correct answer () and two distractors that each encode a distinct error, described below.
Although this item can be answered without executing the procedural steps of differentiation by noting that only has the algebraic form of a horizontal line (y equal a constant), correctly ruling out the remaining options still requires conceptual understanding of the relationship between a horizontal tangent and its equation. The two incorrect options were deliberately designed, based on instructors’ accumulated experience with this item across multiple cohorts, to target two distinct and well-documented student misconceptions: corresponds to confusing the derivative function with the tangent line’s equation, and x = −6 corresponds to confusing the x-coordinate of the point of tangency with the equation of the tangent line itself. This distinction between procedural and conceptual knowledge (Hiebert & Lefevre, 1986; Rittle-Johnson & Schneider, 2015) is consistent with the item’s classification under the “doing mathematics” cognitive demand category (Stein & Smith, 1998) described below.
Students who select an incorrect option have either committed a common misconception, in which case the diagnostic component of DF + WEF targets that specific error, or guessed at random, in which case it would not correspond to the student’s actual error. Students who select “I cannot find my answer” acknowledge an explicit cognitive gap and therefore receive only WEF.
MathUP captures fine-grained performance metrics for each anonymized student, recording first-attempt outcomes and the corresponding response latency. When the first attempt is incorrect, MathUP records FST, regardless of the feedback type received, along with the outcome of the second attempt.
The study was conducted in a differential calculus topic as part of the math courses taken by second-semester Business Administration students. MathUP is organized into topics and subtopics; the subtopic selected for analysis was required to meet two criteria: a first-attempt success rate reflecting moderate task difficulty, and an average FST long enough to support meaningful analysis of FST. Among all subtopics in MathUP, spanning from Algebra to Differential Calculus, “Slope and Equation of the Tangent Line” fulfilled both criteria, with a first-attempt success rate of 44.9% and an average FST of 13.26 s. This subtopic belongs to the Derivative Concept topic and comprises 8 exercises covering a foundational concept in differential calculus with direct applications in marginal analysis and optimization.
The subtopic comprises 8 exercises following a scaffolded progression. Students first verify whether the slope of a tangent line to a curve coincides with the derivative of the function at the same x-value (RT10), then compute the slope at a specified x-value (RT20). The sequence then reverses the perspective: one exercise requires determining the x-value corresponding to a given slope (RT21), and two exercises address the case where the slope is zero (RT22 and RT23). The final exercises progress to computing the equation of the tangent line at a specified point (RT24) and determining the equations of the horizontal tangent lines for quadratic and cubic functions (RT25 and RT26). In terms of cognitive demand (Stein & Smith, 1998), RT10 and RT20 correspond to procedures-with-connections, specifically intending to develop deeper understanding tasks (verifying and computing slope-derivative equivalence), while RT21-RT23 require reversing the problem-solving direction by connecting underlying conceptual ideas (finding x or recognizing zero-slope cases), with increased cognitive demand. RT24-RT26 integrate multiple procedures and require exploring and understanding the nature of derivatives and relationships, and were empirically the most difficult items, consistent with their higher cognitive demand classification: “doing mathematics.” While tasks are sequenced within the same conceptual family and share underlying skills, they are not strictly linearly dependent: each item is scored independently, and students may reattempt a given item as many times as needed until it is answered correctly, with completion of all eight exercises required to finish the homework activity.
The order of the eight exercises is fixed and identical for all students, so any carry-over effect from earlier items applies uniformly across the sample and equally to the DF + WEF and WEF subgroups within each item, and therefore cannot differentially bias the feedback-type contrast examined in RQ3. This fixed order does not, however, resolve every question about sequence: as Section 3.2 makes explicit, item identity and sequence position cannot be statistically separated within the primary analytic sample.
2.2. Participants
Participants are second-semester Business Administration students from a university in Guadalajara, Mexico, whose data were anonymized prior to analysis. Data were collected from 2017 to 2025 across nine academic cohorts. After each class session, differential calculus instructors assign homework as formative assessments, in which students may attempt each exercise multiple times and receive feedback. As this study focuses on a single subtopic within one differential calculus course at one institution, findings should be interpreted within this scope; generalizability to other mathematical domains or institutional contexts is discussed in Section 4.1. This study focuses on interactions in which the first attempt was incorrect; inclusion criteria were a valid FST and a recorded second-attempt outcome. This yields a research group of 12,258 observations nested within 2089 unique students across 8 items; at this stage, observations still include loose, individually attempted exercises and activities completed across multiple sessions or left incomplete, not yet restricted to a single coherent session per student. Most of the observations excluded by that restriction (2408 of 4207, 57.2%) come from students who did complete a single coherent session but did so more than once; only each student’s first such pass is retained, because a repeated attempt necessarily involves items and feedback the student has already seen, which would confound feedback-screen time as a proxy for a first-time encounter with the material. The remaining excluded observations (1799 of 4207, 42.8%) come from students who never completed all eight items within a single session at all. The final analytic sample for the model reported in Section 2.4 restricts this research group to 8051 observations nested within 1654 unique students, with a mean of 4.9 observations per student (range 1–8, median 5). Observations are nested within students (the clustering unit used in the model described in Section 2.4); items are treated as a fixed categorical predictor rather than as a random/nesting factor, which we state explicitly.
The data cleaning process follows an adapted PRISMA flow and is summarized in Table 1, which reports the sample size at each filtering stage and the resulting research group.
Table 1.
Data cleaning report (PRISMA flow). “% of total” is always relative to the raw extraction (31,626) and decreases monotonically down the table; “% of parent group” applies only to the two branch points (baseline vs. research group; research group vs. final analytic sample) and shows composition within that immediate parent instead.
The final analytic sample is the primary analytic sample for the model reported in Section 2.4.
Establishing an appropriate upper FST threshold was necessary to ensure construct validity by distinguishing genuine cognitive engagement from off-task behavior, such as session abandonment or extended inactivity. Initial diagnostic tests revealed that the log-transformed FST (ln-FST) distribution still exhibited severe positive skewness and heavy tails (excess kurtosis = 12.1), violating the assumption of log-normality and rendering parametric cutoffs unreliable. A non-parametric, percentile-based approach was therefore adopted to include genuine, albeit slower, cognitive efforts, such as students performing manual calculations on paper. The threshold was set at the 99.5th percentile of the analytic sample, corresponding to 640 s (approximately 10.6 min). FST values exceeding this cutoff were classified as non-cognitive idle time, preserving 99.5% of valid learning interactions while excluding extreme observations. The lower bound (0.1 s) reflects the minimum plausible time to register a genuine response, excluding likely system artifacts, such as double-clicks or connection errors.
2.3. Measures
The dependent variable is second-attempt accuracy (SAA), a binary outcome coded 1 for a correct second attempt and 0 otherwise. The second attempt is made immediately after the feedback screen, on a parameter-varied version of the same item (Section 2.1).
Feedback type. Feedback type was coded as a binary variable: DF + WEF when the student selected an incorrect option reflecting a specific misconception, in which case both the diagnostic and worked-example components were delivered, and WEF when the student selected “I cannot find my answer,” in which case only the worked-example component was provided. Because the DF + WEF condition includes the complete worked-example solution in addition to a tailored diagnostic comment, students in this condition are exposed to at least as much feedback text as those in the WEF-only condition.
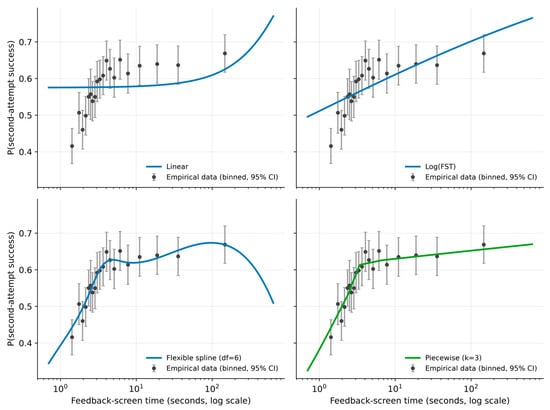
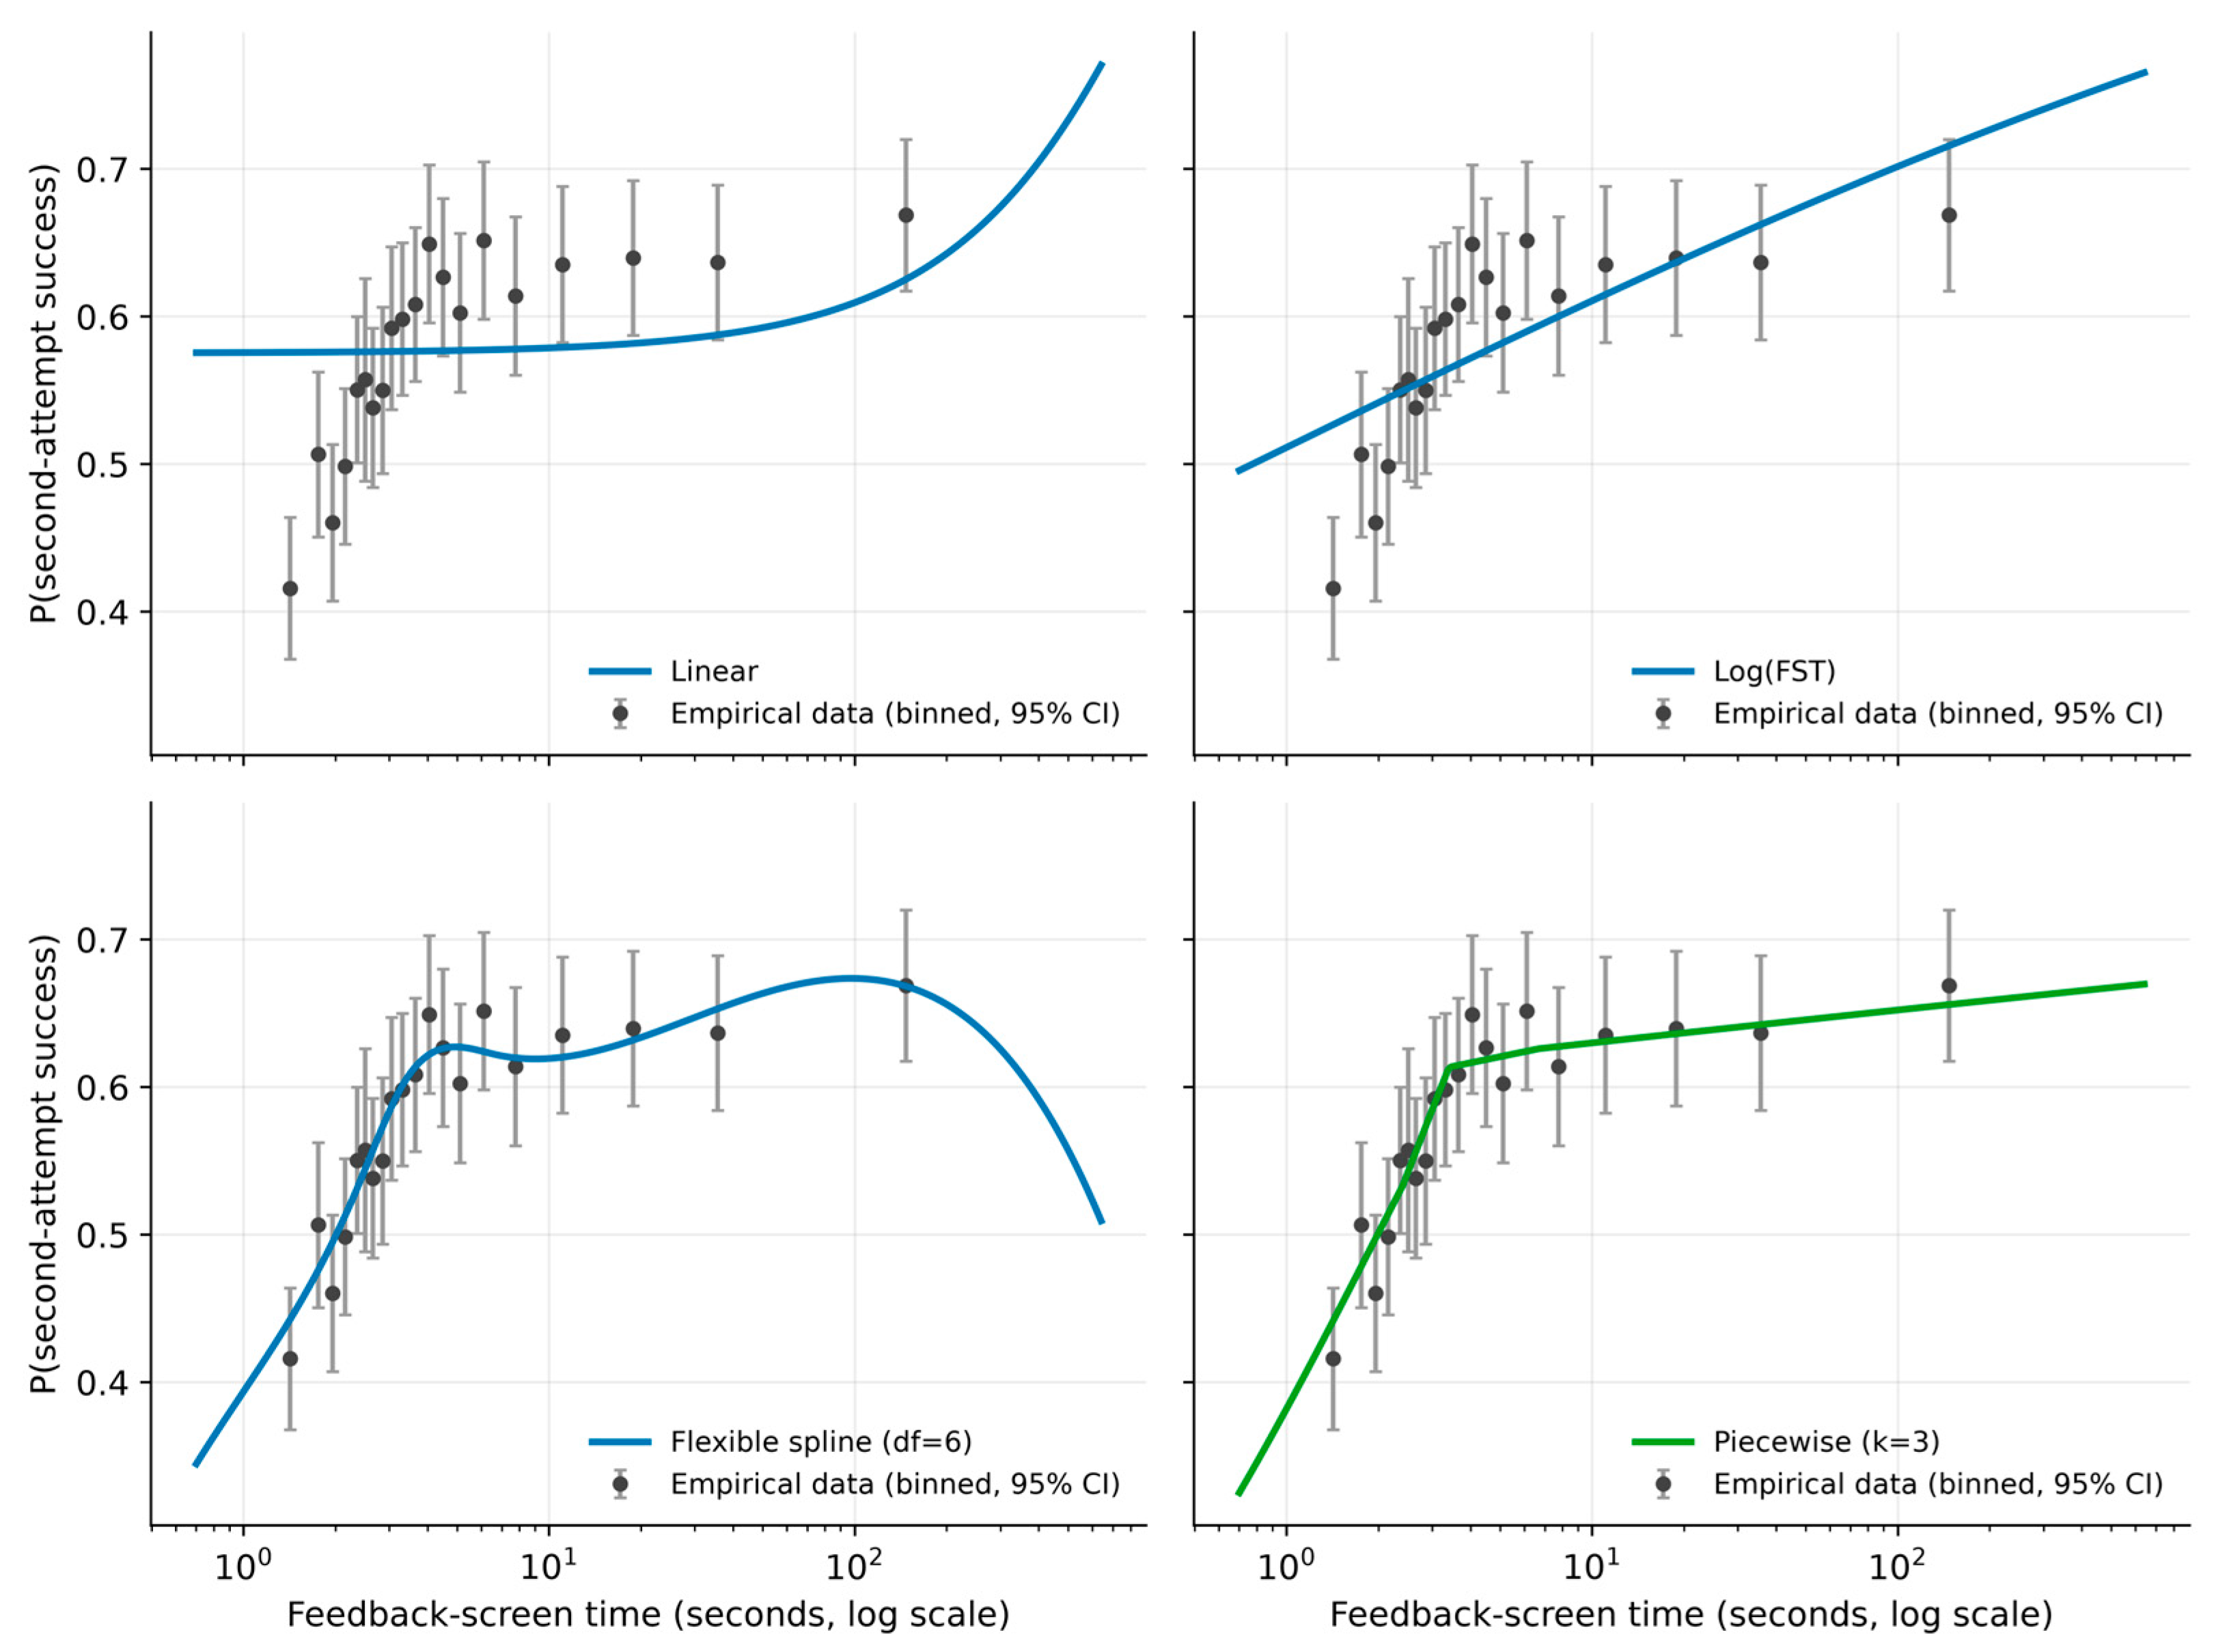
Feedback-screen time. FST runs from the moment the student, having selected an option, clicks the button to submit the first answer, when the platform shows whether it was correct together with the feedback, until the student clicks the button to try again, which opens the second attempt. It therefore records how long the feedback screen remained open; it does not indicate whether, or how much of, the feedback was read, nor whether the student was attending to the screen during that time. FST was log-transformed (ln-FST) to correct positive skewness and stabilize variance. Rather than assuming a specific functional form for the association between ln-FST and SAA, this study selected the functional form empirically through a pre-registered comparison protocol, run on the final analytic sample (N = 8051). Four candidate specifications were evaluated: FST entered linearly, ln-FST entered linearly, a flexible cubic smoothing spline, and a piecewise linear spline with three knots (see Figure 1). Model comparison combined a held-out test set (20% of students, 1607 interactions, never touched until the final check) with repeated 10 × 2 cross-validation on the remaining 80%, evaluated using Alpaydın’s (1999) combined F-test, adapted here from its original 5 × 2 design to 10 × 2 cross-validation, rather than a single train/test split. A single split, and even ordinary cross-validation, risk reporting model differences that are artifacts of a particular partition, because cross-validation folds violate the independence assumption behind standard significance tests and can inflate false-positive rates (Dietterich, 1998). Repeated 10 × 2 cross-validation combined with Alpaydın’s (1999) F-test corrects for this dependency while retaining more statistical power than Dietterich’s original paired t-test. The held-out test set was excluded from every step of model comparison and selection, so the winning specification’s performance could be confirmed on data that played no role in choosing it, avoiding circularity between model selection and evaluation.
Figure 1.
Fitted P(SAA) curves for the four candidate functional forms of the FST–SAA association (development set, 80% of students; empirical data binned with 95% CI), evaluated under the same protocol as the comparison reported above: linear FST, log-linear FST, a flexible cubic spline (df = 6), and the piecewise linear spline with three knots (in green) ultimately selected.
The piecewise linear spline (three knots) achieved the best average out-of-sample Brier score, statistically indistinguishable from the flexible cubic spline (F = 2.11, p = 0.112) and significantly outperforming the log-linear model, a difference that remains significant after Bonferroni correction across the six pairwise comparisons tested (F = 5.38, p = 0.0046). It was preferred for its interpretability over the tied flexible spline, since its segment-wise slopes and knot locations can be reported directly in seconds. The flexible spline also outperformed the log-linear model, though that difference did not remain significant after Bonferroni correction (F = 4.61, p = 0.0084); all candidates outperformed a strictly linear specification (p < 0.0001 in every comparison). The held-out test set confirmed the same ranking (Brier: piecewise = 0.2400, flexible = 0.2401, log = 0.2407, linear = 0.2433).
The piecewise term was constructed as a degree-1 B-spline, bs(ln-FST, degree = 1, knots = [k1, k2, k3]), a continuous, linear piecewise function with three knots placed at the quartiles of ln-FST in the training data (approximately 2.4 s, 3.4 s, and 6.7 s). The resulting basis is continuous at each knot but allows the slope of the FST–SAA association to change across the four resulting segments, combining a spline basis with GEE estimation as a standard approach for semiparametric regression with clustered data (Lin & Carroll, 2001). The fixed location of the knots at the quartiles of ln-FST was itself checked under the same held-out protocol. An unconstrained global search for the best-fitting knot locations (for three, and for two and four knots as alternatives) improved the in-sample fit but did not improve, and slightly worsened, out-of-sample Brier score relative to the quartile placement (0.2402–0.2403 vs. 0.2400), with the optimized knots migrating into the sparse upper tail of the FST distribution (beyond 60 s). Quartile placement was retained on this basis.
Item. Item identity was modeled as a categorical fixed effect with eight levels (reference category: RT10). With only eight items, fixed effects provide a directly interpretable estimate for each item. The magnitude and statistical significance of each item’s association with second-attempt accuracy are reported in Table 2 and discussed in Section 3.2, while descriptive statistics for each item are presented in Table 3.
Table 2.
GEE coefficients (final analytic sample, N = 8051).
Table 3.
Interactions with an incorrect first attempt and observed second-attempt accuracy, by item (final analytic sample, N = 8051).
2.4. Statistical Analysis
SAA was modeled with a generalized estimating equation (GEE), binomial family, logit link, with student as the clustering unit and an exchangeable working correlation structure, to account for the repeated-measures structure of the data (multiple items per student). The fitted model is:
fit on the final analytic sample (N = 8051 interactions, 1654 students), with RT10 (item), DF + WEF (feedback type), and the observed minimum of FST (0.70 s, the mathematical lower bound of the spline basis) set as reference categories. Full coefficients and a joint Wald test of the model are reported at the start of Section 3 (Table 2); the results of the three interaction terms tested for inclusion are reported in Section 3.2.
SAA ~ piecewise(ln-FST, 3 knots) + feedback_type (WEF vs. DF + WEF) + item
(7 fixed effects, ref = RT10)
(7 fixed effects, ref = RT10)
Interaction terms were also formally tested for inclusion under the same protocol used for functional-form selection (Section 2.3). The three interaction terms tested were FST by item, feedback type by item, and FST by feedback type. An in-sample Wald test followed by repeated 10 × 2 cross-validation with Alpaydın’s combined F-test (results in Section 3.2).
Robustness of the primary model was assessed on three grounds: 95% robust confidence intervals, the choice of working-correlation structure (exchangeable vs. independence), and a pre/post-COVID split, reported in Table 4 (Section 3.2).
Table 4.
Robustness of the primary model (final analytic sample, N = 8051).
The model estimates associations between item, feedback type, FST, and second-attempt accuracy. The out-of-sample comparisons used throughout this study (Section 2.3, Section 3.2: Brier score, cross-validated F-tests) support the selected model.
2.5. Exploratory Analysis: Descriptive FST Bands (Supports RQ4)
Beyond its role as a continuous term in the primary model, feedback-screen time was also examined descriptively, by grouping interactions into FST bands according to how long they lasted. This analysis is reported separately from, and is secondary to, the primary GEE model in Section 2.4.
The continuous model in Section 2.4 is specified to estimate SAA as well as possible; its knots (Section 2.3) are therefore chosen using an outcome-based, cross-validated criterion and are not themselves a description of how FST is distributed. The descriptive bands try to describe whether FST, considered on its own, separates into natural groups. A Gaussian Mixture Model (GMM) fitted to ln-FST alone favored four components by BIC (BIC = 19,598.5, vs. 19,624.0 for three components and 19,621.9 for five; two- and six-component alternatives fit worse still, BIC = 19,785.1 and 19,655.5 respectively; component means at approximately 2.4 s, 5.0 s, 19.6 s, and 101.6 s). The four descriptive bands are defined by the boundaries at which adjacent components are equally likely (3.91 s, 10.34 s, and 55.91 s). To check that these boundaries do not depend on the data they are later used to describe, the same GMM procedure was repeated on the same partition used in Section 2.3 (80% of students) and the resulting boundaries were applied to the held-out 20% of students.
The four resulting FST bands are as follows: brief (FST ≤ 3.91 s), moderate (3.91 s < FST ≤ 10.34 s), extended (10.34 s < FST ≤ 55.91 s), and prolonged (FST > 55.91 s). Only 32.8% of students remain within a single band across their interactions, which is why these bands are treated here as descriptive, interaction-level categories. Candidate theoretical anchors for each band are developed as motivated hypotheses: reduced deliberation for the briefest band, most consistent with guessing-like engagement at its fastest end (Baker et al., 2004; Holopainen et al., 2025), efficient allocation of cognitive resources for the moderate band (Simon, 1957; Sweller, 1988), a plateau in the FST–SAA association itself for the extended band (Section 3.1), and sustained, effortful re-engagement consistent with high feedback literacy for the prolonged band (Boud & Molloy, 2013).
A separate robustness check on whether SAA itself varies systematically across the FST distribution, and the resulting band-level descriptive statistics, are reported in Section 3.4 (Table 5).
Table 5.
Descriptive FST bands (N = 8051).
During the preparation of this manuscript, the authors used Gemini and GPT-6 to improve English phrasing and grammar in Section 1, Section 2 and Section 4, as the authors are not native English speakers. The authors have reviewed and edited the output and take full responsibility for the content of this publication.
3. Results
The primary model (Section 2.4) was fit on the final analytic sample (N = 8051 interactions, 1654 students; QIC = 10,313.01). Table 2 reports the full set of coefficients. The reference categories (RT10, DF + WEF, and the observed minimum of FST) define a mathematical baseline. A joint Wald test evaluated the null hypothesis that all coefficients for item, ln-FST (piecewise), and feedback type were simultaneously equal to zero: χ2(12) = 486.53, p < 0.001. The subsections below interpret each part of this model in turn: the functional form of the FST–SAA association (Section 3.1), whether it varies across items and feedback types (Section 3.2), and the association between feedback type and second-attempt accuracy considered on its own (Section 3.3). Section 3.4 then reports a separate, exploratory descriptive check (RQ4) that does not draw on this model’s coefficients.
3.1. Functional Form of the FST–SAA Association (RQ1)
The selected piecewise specification (Section 2.3) produced a fitted probability curve with two clearly distinguishable phases: a rise followed by a sustained plateau.
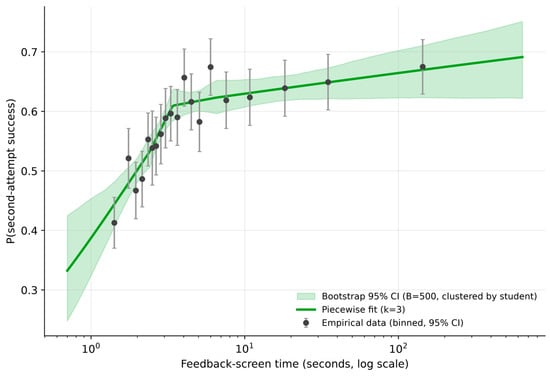
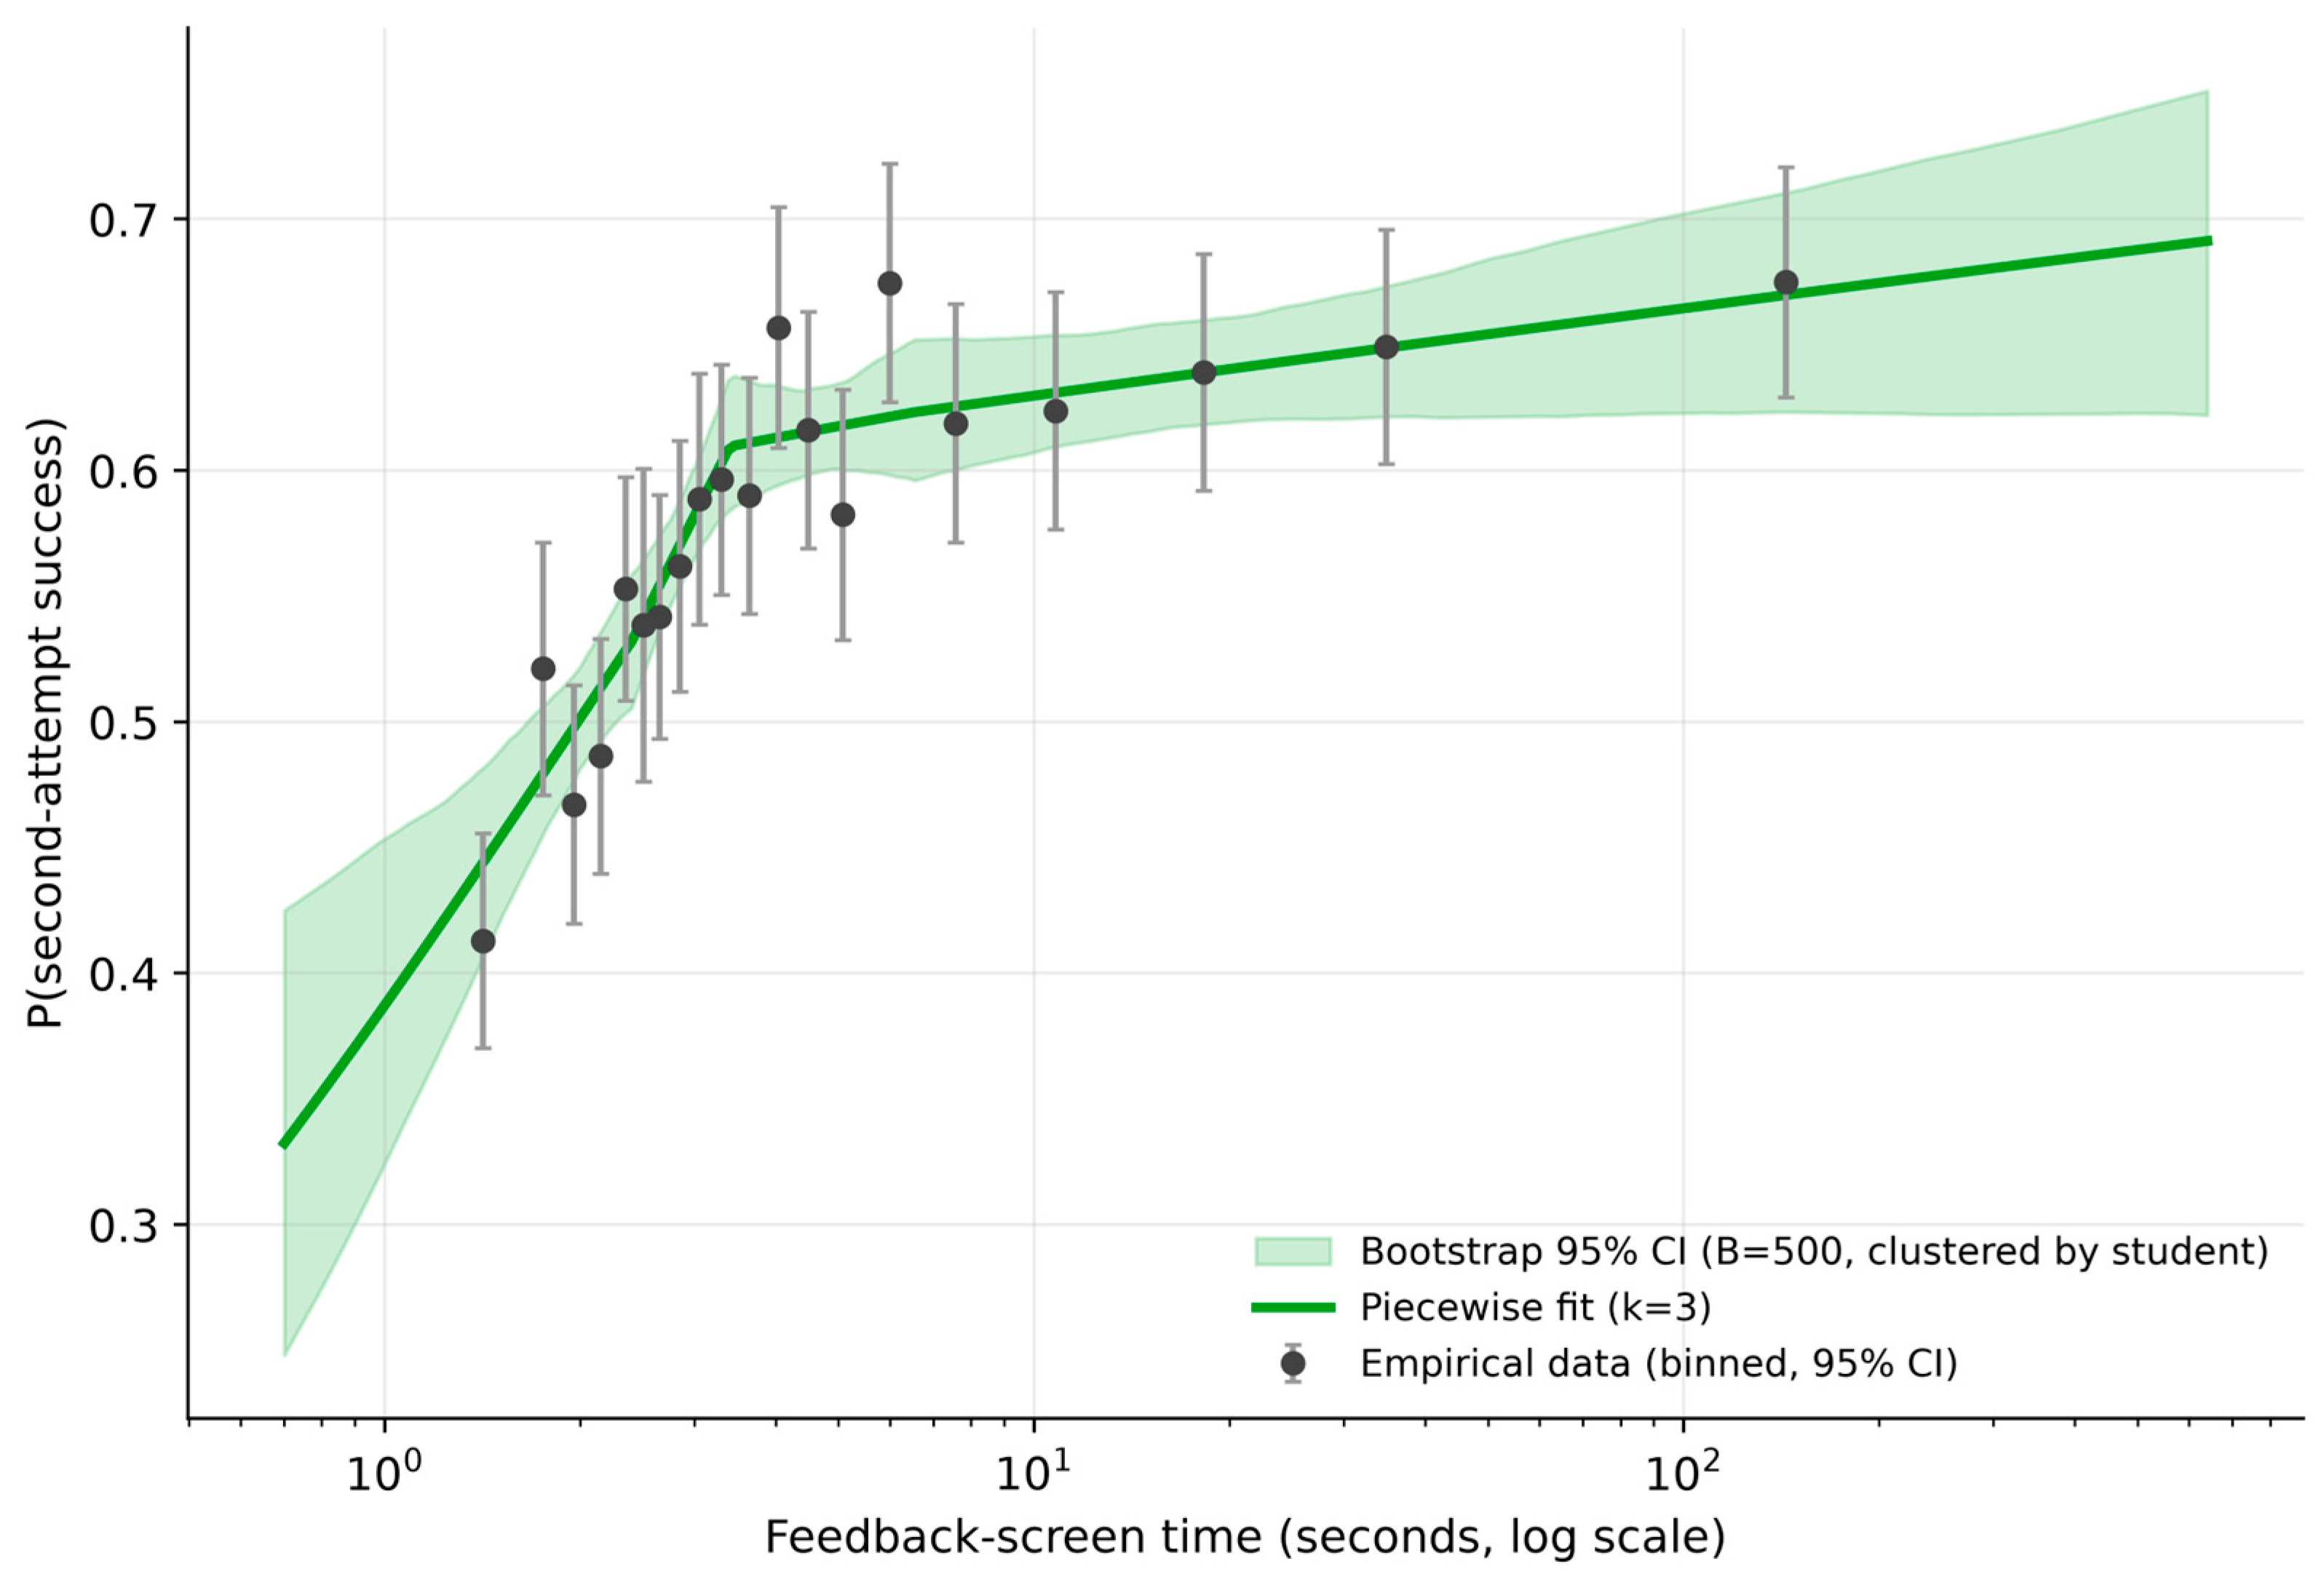
Second-attempt accuracy rises sharply as feedback-screen time increases from the observed minimum (0.70 s) to approximately 3.4 s, then changes little across the remainder of the observed range, up to 640 s: predicted P(SAA) from the fitted model is 61.0% at 3.4 s (the plateau’s onset) and 69.1% at 640 s (the far end of the observed range), an 8-percentage-point difference across nearly two orders of magnitude in FST. The bootstrap uncertainty band widens considerably beyond roughly 20 s, reflecting the small number of interactions with very long feedback-screen times. The fitted probability curve is presented in Figure 2.
Figure 2.
Predicted P(SAA) as a function of feedback-screen time (piecewise fit, three knots), with 95% bootstrap confidence bands (B = 500, clustered by student), overlaid on binned empirical data with 95% confidence intervals.
3.2. Variation in the FST–SAA Association Across Items and Feedback Types (RQ2)
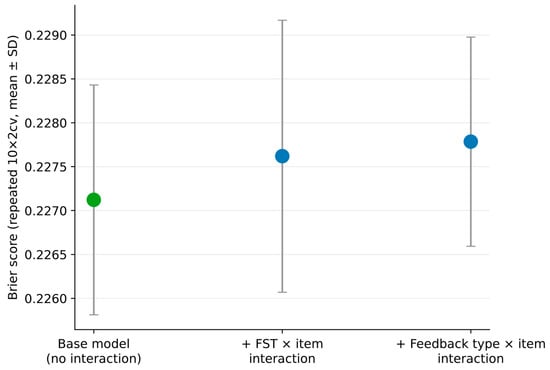
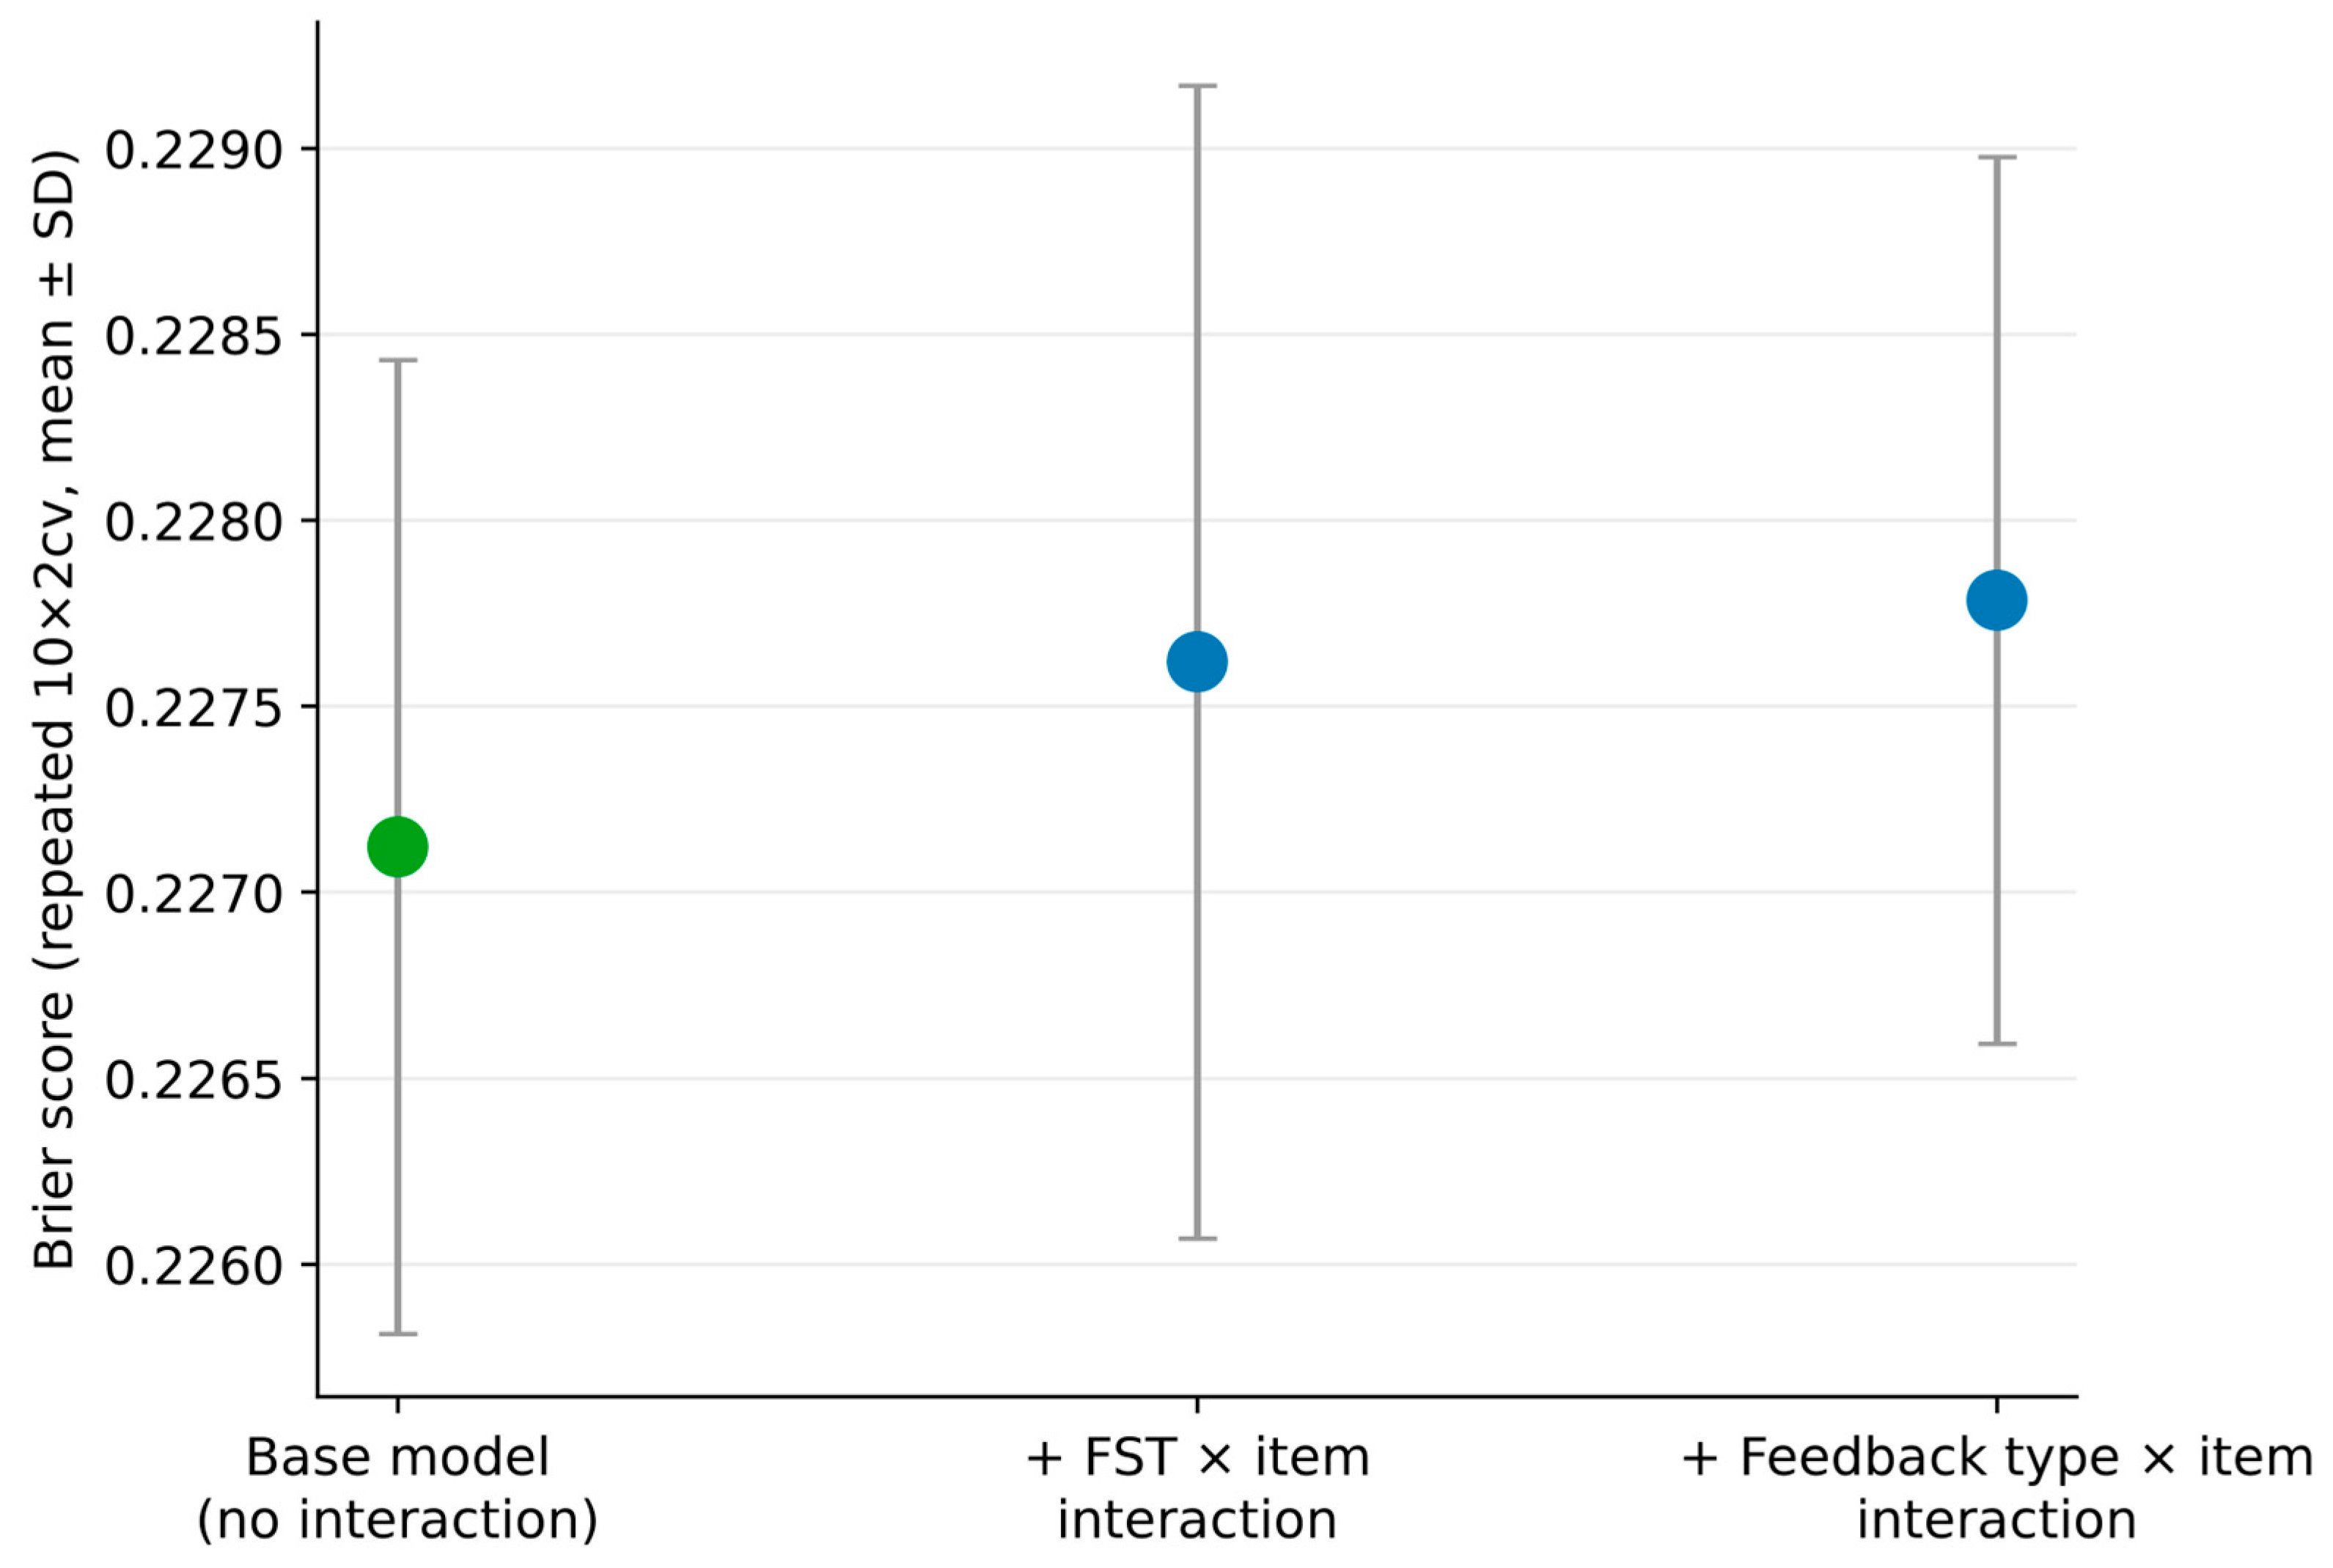
The interaction terms feedback-screen time by item, and feedback type by item were formally tested for inclusion under the same rigorous protocol used for functional-form selection (Section 2.3): an in-sample Wald test followed by repeated 10 × 2 cross-validation with Alpaydın’s combined F-test. Neither interaction improved out-of-sample performance, and both were excluded from the final model. The FST (piecewise) × item interaction was significant in-sample (χ2(28) = 55.24, p = 0.0016) but did not improve out-of-sample prediction (F = 2.39, p = 0.079), with the no-interaction model achieving the better average out-of-sample Brier score. The feedback type × item interaction was not significant in-sample (χ2(7) = 4.79, p = 0.686) and was numerically unstable out-of-sample, failing to converge in 6 of 10 cross-validation repetitions due to sparse item × feedback cells. Both interactions were therefore tested under a pre-registered, cross-validated protocol (Figure 3).
Figure 3.
Out-of-sample performance (Brier score) of the model without interactions and of the models adding the FST × item or the feedback type × item interaction, across repeated cross-validation folds. The FST × feedback type interaction is not shown because it could not be evaluated reliably out of sample (Section 3.2).
Taken together, allowing the FST–SAA association to vary across the eight items did not improve out-of-sample prediction; this indicates no detected predictive improvement, not that the association is the same for every item. An FST × feedback type interaction was also examined, as an exploratory analysis, using the same procedure. It was not significant in-sample (χ2(4) = 6.47, p = 0.166) and could not be evaluated reliably out of sample: predictions were not finite in 10 of 20 cross-validation folds, because only 8 of the 143 WEF-only interactions had an FST below 3.4 s, the range in which most of the association occurs. The data therefore do not allow a conclusion on whether the FST–SAA association differs by feedback type.
Table 3 summarizes each item in the final analytic sample.
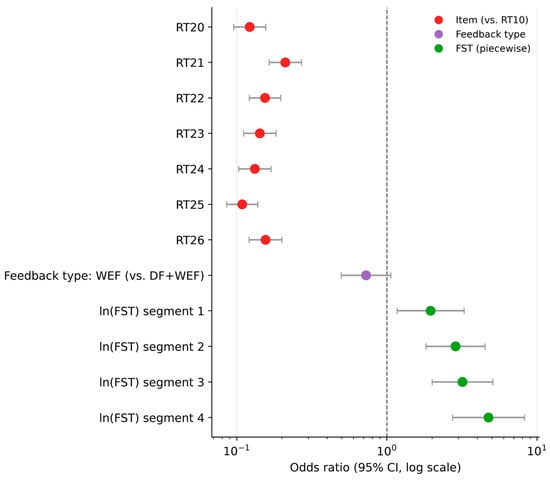
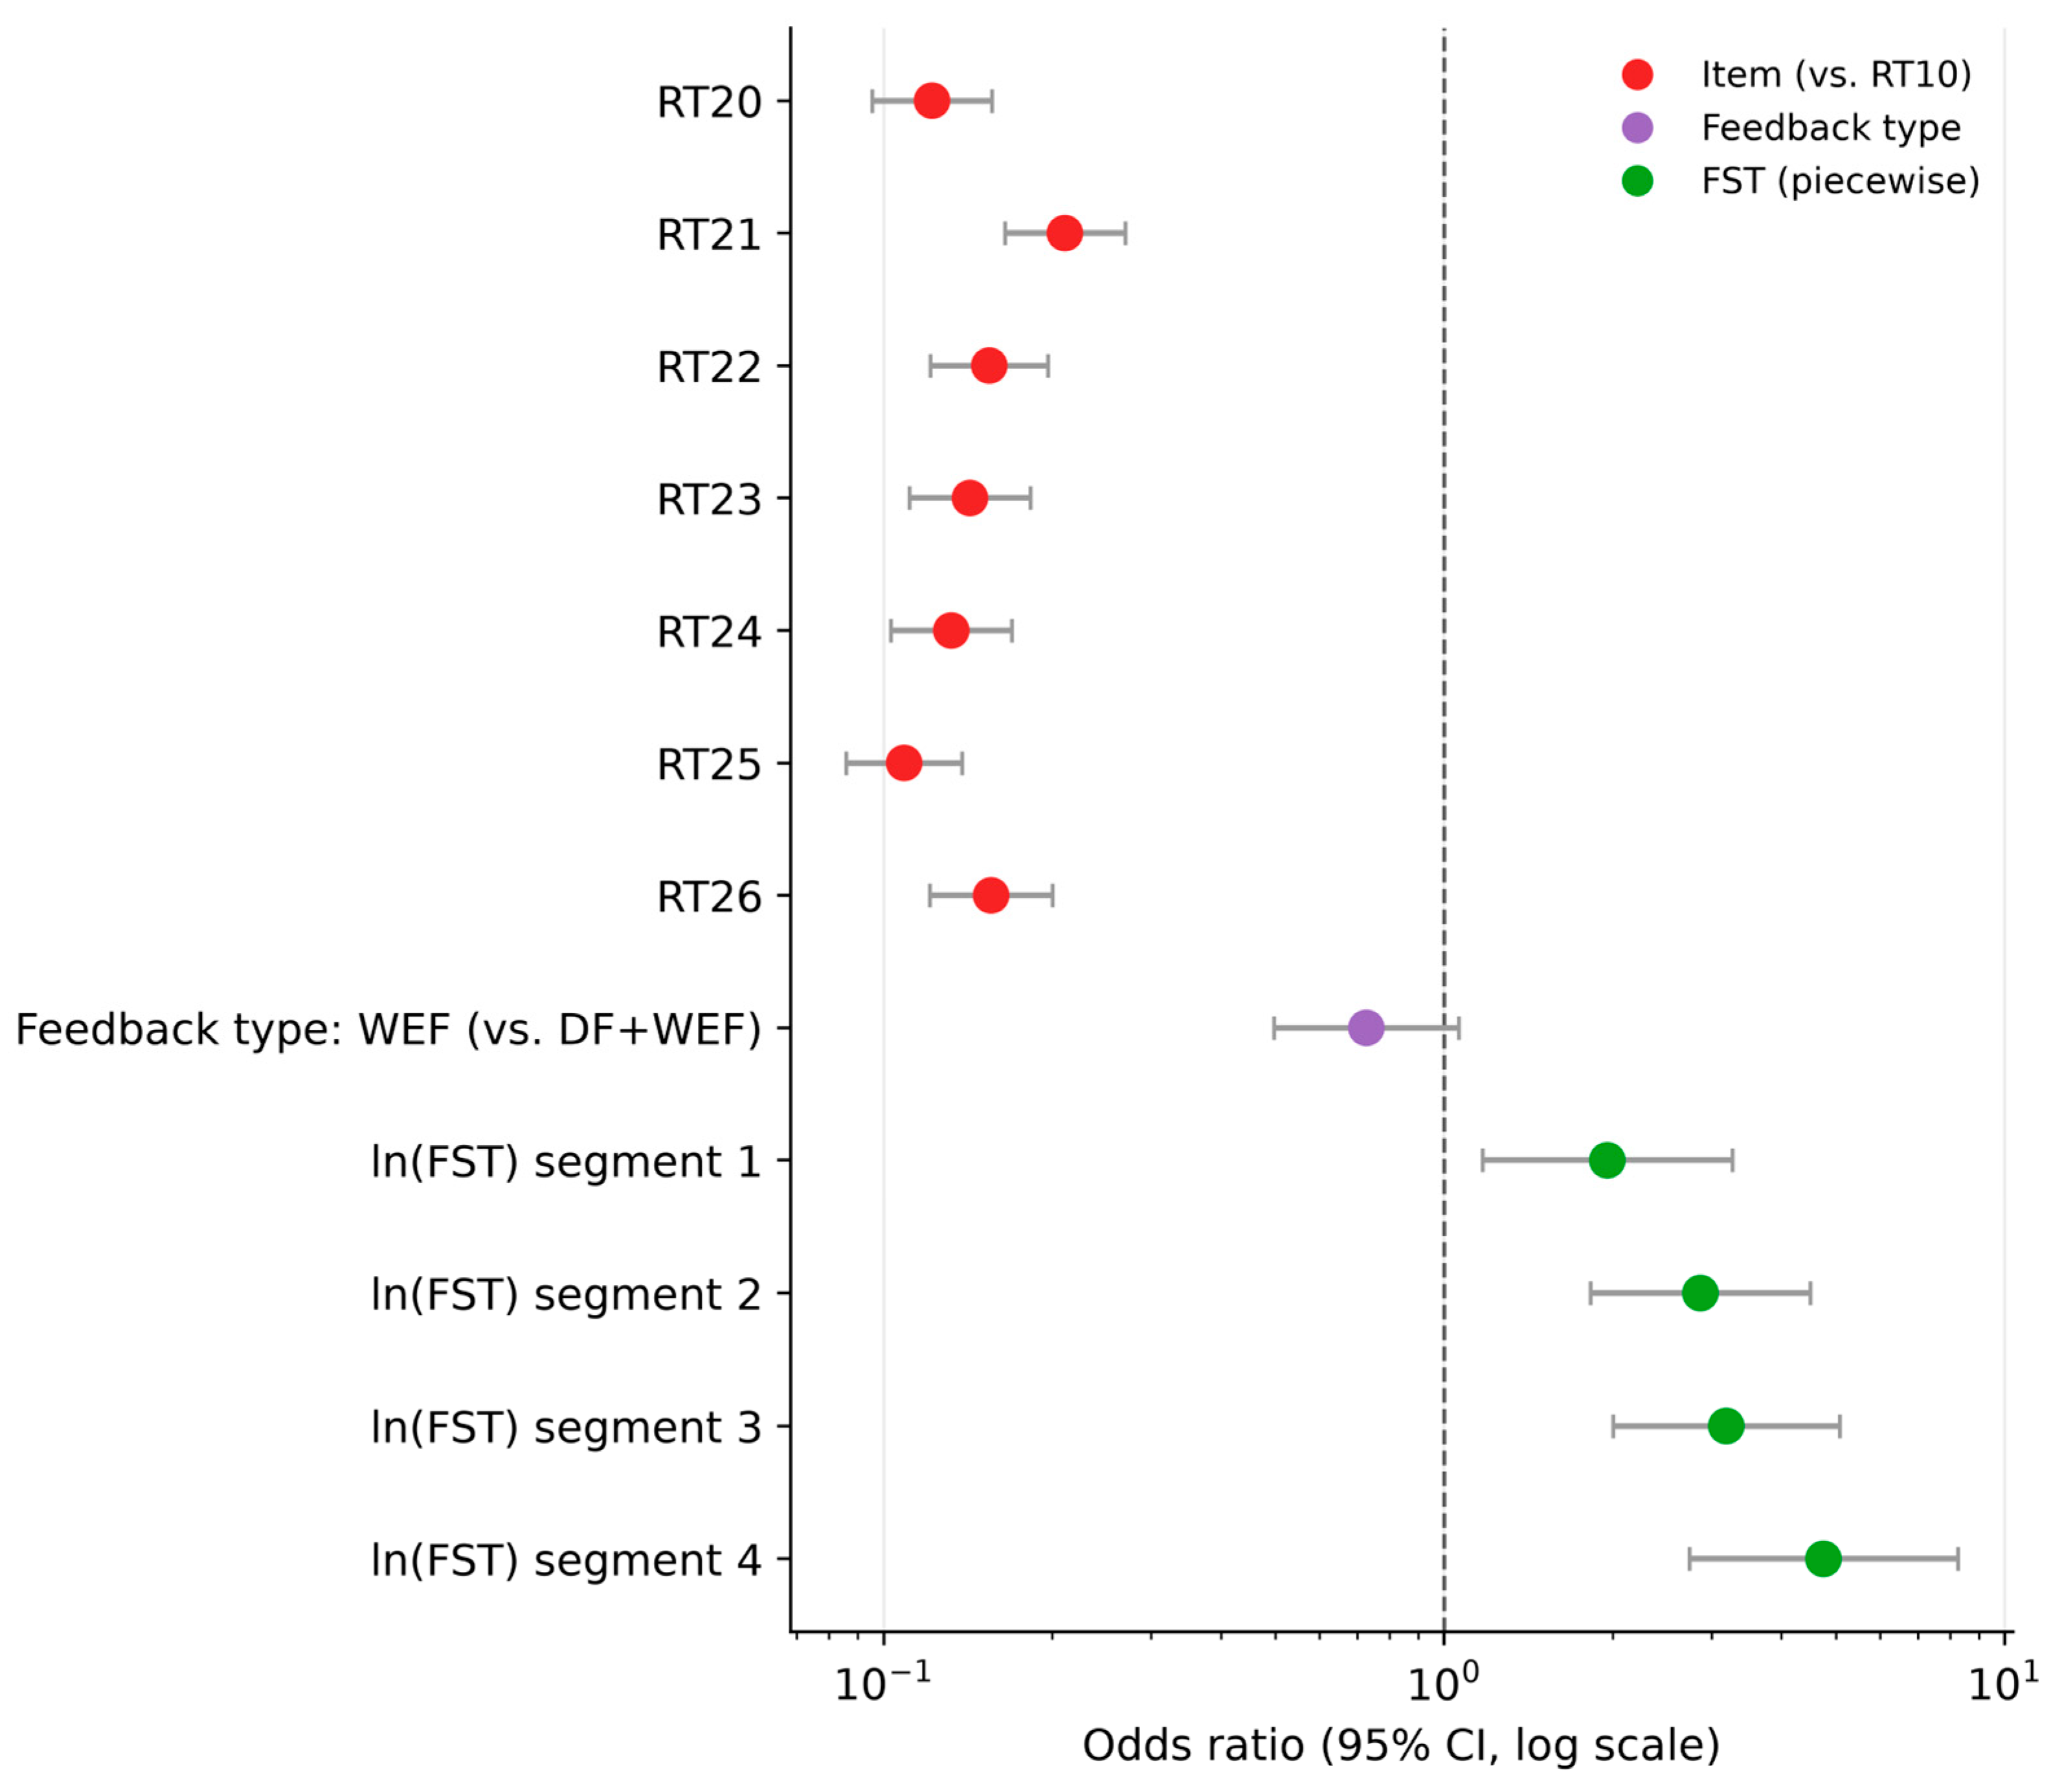
Item identity, which cannot be separated from sequence position (see below), is strongly associated with second-attempt accuracy. All seven items differ from the reference item (RT10) with p < 10−33, and odds ratios ranging from 0.109 (RT25) to 0.211 (RT21) (Table 2). This is a five- to nine-fold reduction in the odds of second-attempt success relative to RT10, even after accounting for feedback-screen time and feedback type (Figure 4). This spread indicates that item identity carries information specific to each item, nearly a two-fold range in odds ratio among the seven non-reference items themselves (0.109 to 0.211).
Figure 4.
Odds ratios (95% CI) for item, feedback type, and the FST piecewise segments. Magnitude comparisons across bars are valid for the item and feedback-type coefficients.
Every student encounters the eight items in the same fixed order, so item identity and sequence position are perfectly collinear by construction. As a result, the model cannot separate an item’s own effect from the effect of its position in the sequence; the item coefficients reported above (Table 2) should be read as item/position effects that cannot be further decomposed within this sample. This is a structural property of the platform’s fixed exercise order and is stated here as an explicit limitation of the analysis.
Robustness of this model was assessed on three grounds, summarized in Table 4: 95% robust (sandwich) confidence intervals exclude 1 for all seven item coefficients by a wide margin; the WEF coefficient does not exclude 1 (CI = [0.497, 1.062], consistent with p = 0.099); ln-FST excludes 1 for all four segments. The exchangeable working-correlation structure (QIC = 10,313.01) performed comparably to an independence structure (QIC = 10,311.76; within-student correlation α = 0.0472) and was retained on design grounds, given the repeated-measures structure of the data. A pre/post-COVID split showed no confounding effect on the model (OR = 1.029, p = 0.621). None of the three checks changed the substantive conclusions above.
3.3. Association Between Feedback Type and Second-Attempt Accuracy (RQ3)
Controlling for item identity and feedback-screen time, feedback type (Worked-Example Feedback alone, WEF, vs. Diagnostic Feedback plus Worked-Example Feedback, DF + WEF) showed only a marginal association with second-attempt accuracy (OR = 0.726, 95% CI [0.497, 1.062], p = 0.099). The confidence interval includes 1, and the association should not be described as an effect of feedback content.
This condition is also markedly imbalanced: 7908 of the 8051 final analytic sample interactions (98.22%) received DF + WEF, and only 143 (1.78%) received WEF alone, because WEF is triggered only when a student self-selects “I cannot find my answer” rather than committing to a specific incorrect option. Students who make this selection may constitute a self-filtered subgroup by acknowledging a genuine cognitive gap rather than guessing, which would itself be associated with second-attempt outcomes independently of anything about the feedback content received.
This self-selection hypothesis cannot be adjudicated with the available data, but it offers a more parsimonious account of the marginal association. The severity of the imbalance was the reason a formal feedback type × item interaction could not be estimated stably (Section 3.2).
3.4. Exploratory Analysis: Descriptive FST Bands (RQ4)
Table 5 reports second-attempt success rates for the four descriptive FST bands defined in Section 2.5, whose boundaries are the GMM’s own component-crossing points, independent of the piecewise model’s knots.
This grouping shows a pattern broadly consistent with the continuous association in Section 3.1: second-attempt accuracy rises sharply from 53.2% in the briefest band (≤3.91 s) to 62.9% (3.91–10.34 s), then changes little into the extended band (64.1%, 10.34–55.91 s), with a further, more modest rise to 68.1% in the longest band (>55.91 s). A chi-square test on 20 equal-sized quantile bins of FST confirms that SAA varies systematically across the FST distribution (χ2(19) = 167.65, p = 8.19 × 10⁻²⁶). As in the continuous model, most of the association is concentrated in the earliest transition. Unlike the continuous model, this four-group summary also shows a small additional gain in the longest band, which the continuous piecewise fit attributes to its widest and most sparsely populated segment (Section 3.1).
The bands were also examined out of sample (Section 2.5). Fitted on the development set alone, the GMM again favored four components, with boundaries at 3.93 s, 10.53 s, and 57.88 s, all within 3.5% of those obtained on the full sample; applied to the held-out students, these boundaries assigned 99.75% of held-out interactions to the same band as the full-sample boundaries. In the held-out set, second-attempt accuracy followed the same pattern as in Table 5 (52.4%, 62.9%, 65.5%, and 72.1% from the brief to the prolonged band), with the brief-to-moderate transition again the clearest (+10.5 percentage points, 95% CI [4.5, 16.7], bootstrap clustered by student, B = 2000). A GMM fitted independently to the held-out set alone, however, favored three rather than four components (ΔBIC = 12.5).
As established in Section 2.5, only 32.8% of students remain within a single band across their interactions, so these bands describe interactions, not stable learner types, and are reported here strictly as a descriptive complement to the continuous association reported in Section 3.1.
4. Discussion
This study examined how the time students spend on the feedback screen (feedback-screen time, FST) relates to whether they correct their error on a second attempt (second-attempt accuracy, SAA) in a mathematical e-assessment platform, and whether that relationship depends on which item a student is solving or which type of feedback they received. Across 8051 interactions from 1654 students, time on the feedback screen is associated with error recovery, and allowing this association to vary across items did not improve out-of-sample prediction. Because only 143 interactions received WEF alone, and students entered each condition through their own first response, the data say little about whether the diagnostic component adds to second-attempt accuracy.
In detail, second-attempt accuracy increases sharply as feedback-screen time rises from a few tenths of a second to roughly 3–4 s, and then changes little across the remainder of the observed range, up to several minutes. This is different from the continuously diminishing-returns pattern that a logarithmic transformation of FST would imply. Most of the association between FST and error recovery is concentrated in the first few seconds on the feedback screen; additional time is associated with only a small further gain.
In the DF + WEF condition, which accounts for 98.2% of interactions, the Diagnostic Feedback is a one- or two-sentence comment on the specific error behind the chosen distractor; a message of this length can be read in about 3 s, a time that allows no more than a brief look at the step-by-step Worked-Example Feedback. The early rise in SAA could therefore be consistent with students using the DF, rather than the full worked example, before their second attempt. FST cannot confirm this, since it records how long the feedback screen remained open, not whether its content was read; establishing how students process each component would require more direct measures, such as eye tracking or think-aloud protocols.
Together, these results are consistent with using feedback as a pedagogical opportunity. From a Vygotskian perspective, the time a student spends on that feedback could offer an opportunity for growth within the learner’s Zone of Proximal Development (Vygotsky, 1978), although the present data cannot show whether it does. The platform offers the same structured opportunity to every student who fails a first attempt, and, within this study, the time spent on the feedback screen is associated with whether that opportunity translates into a corrected second attempt.
Item identity, which cannot be separated from sequence position, was the covariate most strongly and consistently associated with second-attempt accuracy, which raises a question this dataset cannot answer directly the following question: what about each item drives this difference? The model establishes that item identity matters without explaining why. Answering that would require examining the qualitative content of each item: its wording, distractor construction, the specific misconceptions each distractor is designed to surface, the transfer demands it places on the student. These specifics are not captured in the platform’s trace data. This is a direction for future work, but for this study it is consistent to treat item identity as a unit of analysis (Section 1).
The four descriptive FST bands examined in Section 2.5 and Section 3.4 are derived from the FST distribution alone and are independently observed. They give a qualitative picture that mirrors the continuous association. Most interactions fall in the briefest band, which shows that short FST is the norm on this platform. Guessing in the sense described by Baker et al. (2004) and Holopainen et al. (2025) is more plausibly confined to the fastest end of that band. The clearest change in error recovery occurs between the brief and moderate bands. This suggests that this change occurs within a time sufficient to read the DF, although whether students actually read it cannot be determined from screen time alone. Beyond that time, longer FST is associated with little further change in SAA, consistent with the plateau in Section 3.1 and possibly with an efficient allocation of cognitive resources that saturates early (Simon, 1957; Sweller, 1988). Only the small group of interactions with prolonged FST shows a modest further gain, which could be consistent with the sustained re-engagement associated with high feedback literacy (Boud & Molloy, 2013). These readings describing the interactions are offered as hypotheses based on the general overview of the students but more studies are required before having evidence to corroborate them.
4.1. Limitations
FST measures how long the feedback screen remained open; it is not a direct measure of reading or of engagement with the feedback content, and it cannot distinguish sustained reflection from idle time, distraction, leaving the browser open, reading speed, disability or language proficiency, external calculations, prior knowledge, device performance, multitasking, or other on-screen behavior that does not involve processing the feedback’s content (Kovanovic et al., 2015; Van der Kleij et al., 2015). The findings come from a single subtopic within one differential calculus course at one institution, and generalizability to other mathematical domains, course levels, or institutional contexts should not be assumed. The final analytic sample includes only students who completed all eight items within a single session (Section 2.2). Students who left the activity unfinished are therefore not represented, and they may differ from those retained, for example in engagement or persistence; the association reported here may not extend to them. In the research group, these students had a slightly lower second-attempt accuracy than those retained and a similar FST. The feedback type comparison (Section 3.3) is limited by a severe class imbalance (98% DF + WEF vs. 2% WEF) arising from self-selection into feedback condition, which the available data cannot resolve. This same imbalance also prevented a feedback type × item interaction from being estimated stably (Section 3.2), and both findings involving feedback type should be read as bounded by this constraint rather than as evidence that feedback content has no association with outcomes. Because every student encounters the eight items in the same fixed order, item identity and sequence position are perfectly collinear by construction (Section 3.2): the reported item effects cannot be decomposed into an item-specific component and a position-specific component. Other possible confounds, i.e., fatigue across the eight-item sequence, cumulative learning specific to this subtopic’s content, general platform familiarity, are not modeled here and remain open. The FST bands are exploratory: their boundaries were stable out of sample, but the four-component structure was not independently reproduced in the held-out set. The model is associational and was not validated as a prediction model; no calibration or discrimination assessment was performed.
4.2. Future Research
Various directions follow directly from the limitations established. First, whether the FST association is maintained in different mathematical activities and courses. Another is explaining rather than merely detecting the item-level heterogeneity documented in Section 3.2. This would require examining the qualitative content of the eight items directly, including their wording, distractor design, and the misconceptions they target. A third direction is to validate FST against direct measures of reading. Eye-tracking studies on the same platform could establish how much of the time on the feedback screen is actually spent reading the feedback, and which of its components (DF or WEF) is read. Calibrating FST against these measures would turn a screen-time proxy into an estimate of reading time that could then be derived at scale from the platform’s trace data.
4.3. Conclusions
Within the scope of a single subtopic, one differential calculus course, and one institution, the time students spend on the feedback screen is associated with whether they correct their error on a second attempt; allowing this association to vary across items did not improve out-of-sample prediction. We frame this as a hypothesis supported by one dataset and worth testing elsewhere: platform developers and instructors designing e-assessment feedback may benefit from attending to the conditions under which students engage with the feedback they already receive, alongside continued attention to the content of that feedback itself.
Author Contributions
Conceptualization, M.A.-R. and C.E.-W.; methodology, M.A.-R. and C.E.-W. software, M.A.-R. and C.E.-W.; formal analysis, M.A.-R.; and C.E.-W.; data curation, M.A.-R. and C.E.-W.; writing—original draft preparation, M.A.-R. and C.E.-W.; writing—review and editing, M.A.-R. and C.E.-W.; visualization, M.A.-R. and C.E.-W.; supervision, M.A.-R. and C.E.-W. All authors have read and agreed to the published version of the manuscript.
Funding
This research received no external funding.
Institutional Review Board Statement
The study was conducted in accordance with the Declaration of Helsinki, and approved by the Ethics Committee of Universidad Panamericana (protocol code UP-EC-2026-GDL-008 and date of approval: 29 May 2026).
Informed Consent Statement
Informed consent was obtained from all subjects involved in the study. The research protocol, including the methodology, data processing, and protocols for information handling and confidentiality, ensuring anonymity, was reviewed and approved.
Data Availability Statement
The dataset is available upon request from the authors.
Conflicts of Interest
The authors declare no conflicts of interest.
Abbreviations
The following abbreviations are used in this manuscript:
| FST | Feedback-Screen Time |
| ln-FST | log-transformed FST |
| GEE | Generalized Estimating Equations |
| GMM | Gaussian Mixture Model |
| MathUP | Mathematical e-assessment Platform |
| SAA | Second Attempt Accuracy |
| RQ | Research Question |
| DF | Diagnostic Feedback |
| WEF | Worked-example Feedback |
References
- Alpaydın, E. (1999). Combined 5 × 2 cv F test for comparing supervised classification learning algorithms. Neural Computation, 11(4), 975–982. [Google Scholar] [CrossRef] [Scilit] [PubMed]
- Baker, R. S., Corbett, A. T., Koedinger, K. R., & Wagner, A. Z. (2004). Off-task behavior in the cognitive tutor classroom: When students “game the system”. In Proceedings of the SIGCHI conference on human factors in computing systems (pp. 383–390). ACM. [Google Scholar]
- Boud, D., & Molloy, E. (2013). Feedback in higher and professional education: Understanding it and doing it well. Routledge. [Google Scholar]
- Dietterich, T. G. (1998). Approximate statistical tests for comparing supervised classification learning algorithms. Neural Computation, 10(7), 1895–1923. [Google Scholar] [CrossRef] [Scilit] [PubMed]
- Gašević, D., Dawson, S., & Siemens, G. (2015). Let’s not forget: Learning analytics are about learning. TechTrends, 59(1), 64–71. [Google Scholar] [CrossRef] [Scilit]
- Greenhow, M. (2015). Effective computer-aided assessment of mathematics; principles, practice and results. Teaching Mathematics and Its Applications, 34(3), 117–137. [Google Scholar] [CrossRef] [Scilit]
- Hattie, J., & Timperley, H. (2007). The power of feedback. Review of Educational Research, 77(1), 81–112. [Google Scholar] [CrossRef] [Scilit]
- Hettiarachchi, E., & Huertas, M. A. (2012). Temporal aspects of mathematical e-assessment systems. eLearn Center Research Paper Series. Available online: https://www.researchgate.net/publication/277091916_Temporal_Aspects_of_Mathematical_E-Assessment_Systems (accessed on 29 October 2026).
- Hiebert, J., & Lefevre, P. (1986). Conceptual and procedural knowledge in mathematics: An introductory analysis. In J. Hiebert (Ed.), Conceptual and procedural knowledge: The case of mathematics (pp. 1–27). Lawrence Erlbaum. [Google Scholar]
- Holopainen, S., Metsämuuronen, J., Laakso, M.-J., & Kujala, J. (2025). Gauging misclassification in rapid guessing identification in a fast-paced vocabulary test. Applied Measurement in Education, 38(1), 25–42. [Google Scholar] [CrossRef] [Scilit]
- Hooda, M., Rana, C., Dahiya, O., Rizwan, A., & Hossain, M. S. (2022). Artificial intelligence for assessment and feedback to enhance student success in higher education. Mathematical Problems in Engineering, 2022(1), 5215722. [Google Scholar] [CrossRef] [Scilit]
- Kinnear, G., Jones, I., Sangwin, C. J., Alarfaj, M., Davies, B., Fearn, S., Foster, C., Heck, A., Henderson, K., Hunt, T., Iannone, P., Kontorovich, I., Larson, N., Lowe, T., Meyer, J. C., O’Shea, A., Rowlett, P., Sikurajapathi, I., & Wong, T. (2024). A collaboratively-derived research agenda for e-assessment in undergraduate mathematics. International Journal of Research in Undergraduate Mathematics Education, 10(1), 201–231. [Google Scholar] [CrossRef] [Scilit]
- Kovanovic, V., Gašević, D., Dawson, S., Joksimovic, S., & Baker, R. (2015). Does time-on-task estimation matter? Implications on validity of learning analytics findings. Journal of Learning Analytics, 2(3), 81–110. [Google Scholar] [CrossRef] [Scilit]
- Lin, X., & Carroll, R. J. (2001). Semiparametric regression for clustered data using generalized estimating equations. Journal of the American Statistical Association, 96(455), 1045–1056. [Google Scholar] [CrossRef] [Scilit]
- Mandouit, L., & Hattie, J. (2023). Revisiting “The Power of Feedback” from the perspective of the learner. Learning and Instruction, 84, 101718. [Google Scholar] [CrossRef] [Scilit]
- Mizrahi, D., Laufer, I., & Zuckerman, I. (2025). Attachment style, task difficulty, and feedback type: Effects on cognitive load. Behavioral Sciences, 15(4), 427. [Google Scholar] [CrossRef] [Scilit] [PubMed]
- Muñiz-Rodríguez, L., Alonso, P., Rodríguez-Muñiz, L. J., & Valcke, M. (2017). La retroalimentación: Uno de los factores de mayor influencia durante los procesos de enseñanza-aprendizaje. In VIII Congreso Iberoamericano de Educación Matemática: Libro de Actas (pp. 167–179). FESMP. [Google Scholar]
- Narciss, S. (2008). Feedback strategies for interactive learning tasks. In J. M. Spector, M. D. Merrill, J. van Merriënboer, & M. P. Driscoll (Eds.), Handbook of research on educational communications and technology (3rd ed., pp. 125–143). Routledge. [Google Scholar]
- Renkl, A. (2014). Toward an instructionally oriented theory of example-based learning. Cognitive Science, 38(1), 1–37. [Google Scholar] [CrossRef] [Scilit] [PubMed]
- Rittle-Johnson, B., & Schneider, M. (2015). Developing conceptual and procedural knowledge of mathematics. In R. Cohen Kadosh, & A. Dowker (Eds.), The Oxford handbook of numerical cognition (pp. 1118–1134). Oxford University Press. [Google Scholar]
- Shute, V. J. (2008). Focus on formative feedback. Review of Educational Research, 78(1), 153–189. [Google Scholar] [CrossRef] [Scilit]
- Simon, H. A. (1957). A behavioral model of rational choice. In Models of man, social and rational: Mathematical essays on rational human behavior in a social setting (pp. 241–260). Wiley. [Google Scholar]
- Stein, M. K., & Smith, M. S. (1998). Mathematical tasks as a framework for reflection: From research to practice. Mathematics Teaching in the Middle School, 3(4), 268–275. [Google Scholar] [CrossRef] [Scilit]
- Sweller, J. (1988). Cognitive load during problem solving: Effects on learning. Cognitive Science, 12(2), 257–285. [Google Scholar] [CrossRef] [Scilit]
- Sweller, J. (2023). The development of cognitive load theory: Replication crises and incorporation of other theories can lead to theory expansion. Educational Psychology Review, 35(4), 95. [Google Scholar] [CrossRef] [Scilit]
- Sweller, J., & Cooper, G. A. (1985). The use of worked examples as a substitute for problem solving in learning algebra. Cognition and Instruction, 2(1), 59–89. [Google Scholar] [CrossRef] [Scilit] [PubMed]
- Van der Kleij, F. M., Feskens, R. C. W., & Eggen, T. J. H. M. (2015). Effects of feedback in a computer-based learning environment on students’ learning outcomes: A meta-analysis. Review of Educational Research, 85(4), 475–511. [Google Scholar] [CrossRef] [Scilit]
- van der Linden, W. J. (2007). A hierarchical framework for modeling speed and accuracy on test items. Psychometrika, 72(3), 287–308. [Google Scholar] [CrossRef] [Scilit]
- Vygotsky, L. S. (1978). Mind in society: The development of higher psychological processes. Harvard University Press. [Google Scholar]
- Wisniewski, B., Zierer, K., & Hattie, J. (2020). The power of feedback revisited: A meta-analysis of educational feedback research. Frontiers in Psychology, 10, 3087. [Google Scholar] [CrossRef] [Scilit] [PubMed]
- Wongvorachan, T., Bulut, O., Tsai, Y.-S., & Lindner, M. A. (2022). Improving student feedback literacy in e-assessments: A framework for the higher education context. Trends in Higher Education, 1(1), 16–29. [Google Scholar] [CrossRef] [Scilit]
- Ye, W., Ren, W., Lian, Y., & Zou, Q. (2024). Fostering self-regulated learning-focused feedback: Getting preservice teachers prepared. System, 126, 103483. [Google Scholar] [CrossRef] [Scilit]

Disclaimer/Publisher’s Note: The statements, opinions and data contained in all publications are solely those of the individual author(s) and contributor(s) and not of MDPI and/or the editor(s). MDPI and/or the editor(s) disclaim responsibility for any injury to people or property resulting from any ideas, methods, instructions or products referred to in the content. |
© 2026 by the authors. Licensee MDPI, Basel, Switzerland. This article is an open access article distributed under the terms and conditions of the Creative Commons Attribution (CC BY) license.