


Abstract
Socioeconomic status (SES) strongly influences cognitive development, yet its relationship with creativity remains comparatively underexplored. This study examined how three SES dimensions (family structure, economic status, cultural capital) relate to verbal and figural creativity. 230 middle school students (58.26% girls; grades 7–9) took part in this study. They completed the PIC, TTCT (Figural), DAT-5, and a sociodemographic survey. Seven structural equation models (MLR estimation) and a regularized network analysis (EBICglasso) were estimated. A model specifying a latent SES factor associate with a general cognitive factor (subsuming intelligence and creativity) showed the best fit (χ2 = 1.53, CFI = 0.99, RMSEA = 0.048, SRMR = 0.019). Network analysis revealed that economic SES retained no unique conditional associations with cognitive/creative variables. Conversely, cultural SES is directly linked to verbal intelligence (rpartial = 0.155) and figural creativity (rpartial = 0.205). The sole direct bridge between intelligence and creativity subsystems was non-verbal intelligence to figural creativity (rpartial = 0.112). Therefore, cultural SES emerged as the most consistently relevant SES-related component, showing unique associations with cognitive and creative functioning. These findings highlight the importance of culturally and cognitively stimulating opportunities within families and the potential role of schools in ensuring equitable access to enriched learning and creative experiences.
1. Introduction
Is “more always more”? The Matthew effect posits that individuals with higher privileges benefit from greater opportunities that further facilitate the development of their skills (Gladwell, 2008; Merton, 1968).
The idea that families with higher socioeconomic status (SES) produce more intelligent children appears to be a widely accepted premise. However, how can this phenomenon be explained? From a pure biological perspective, superior economic resources ensure better nutrition (e.g., protein intake), which facilitates enhanced neuronal myelination, thereby improving cognitive processing. Concurrently, from a sociological standpoint, higher economic resources are associated with increased opportunities, enriched life experiences, and robust educational advantages. These factors contribute to superior academic performance, the development of cognitive and linguistic skills, and other indicators of positive neurocognitive development (Li et al., 2021; Rakesh et al., 2025a, 2025b; Sak et al., 2026).
Conversely, lower socioeconomic levels have been linked to poorer academic achievement and distinct variations in executive functioning, particularly in core executive functions such as working memory, inhibitory control, and cognitive flexibility—in both children and adolescents (Lawson et al., 2018). These functions are critically important, as they enable individuals to navigate novel situations, regulate behavior and thoughts, and adapt to changing circumstances (Diamond, 2012), thereby supporting both self-regulation and complex problem-solving (Diamond, 2012; Benedek et al., 2014).
However, findings from the Warsaw studies (examining children in the post-World War II era) challenge this hypothesis. These studies revealed that Intelligence Quotient (IQ) was not heavily influenced by parental income or economic standing but rather by parental education (Firkowska-Mankiewicz, 2011). This insight prompted a reconceptualization of SES, demonstrating that it cannot be defined merely by a family’s financial position or income level.
SES is a multidimensional construct that reflects the relative position an individual or family occupies within the social structure (Munir et al., 2023). Traditionally, it is operationalized through three core components: income level, educational attainment, and occupation. Rather than operating independently, these indicators are deeply interrelated and exhibit consistent patterns across diverse sociocultural contexts, suggesting the existence of relatively universal regularities in the organization of SES (Connolly & Lindh, 2025).
More recently, research interest into the effects of SES has extended to the domain of creativity (Kupczyszyn et al., 2024; Parsasirat et al., 2013), which is conceptualized as the ability to generate ideas that are simultaneously original and useful (Runco & Jaeger, 2012). Creativity constitutes a fundamental component of human development and plays a pivotal role in problem-solving, innovation, and adaptation to complex, rapidly changing environments (Feist, 2007; Sternberg & Lubart, 1999). From a psychological perspective, creative output relies on various cognitive processes; among these, working memory, inhibitory control, and cognitive flexibility have been identified as core executive functions underlying creative performance (Benedek et al., 2014).
It is important to bear in mind that creativity is not confined solely to cognitive components; it is also heavily influenced by personality traits and environmental contexts. Indeed, the development of an individual’s creative potential may sometimes depend on contextual serendipity or situational affordances rather than purely individual capabilities (Csikszentmihalyi, 1997; Gardner, 1997).
Regarding the inquiry into the relationship between creativity and SES, two different perspectives are of interest: how creativity enhances the attainment of greater socio-economic wealth (typically examined in adult populations), or, conversely, whether higher family wealth fosters creative development during youth. In this regard, a study by Acar et al. (2022) suggests that the correlation between the SES of the family of origin and individual creativity progressively diminishes with age.
In addition, this relationship represents a complex and methodologically challenging phenomenon to analyze. On one hand, certain research contexts are characterized by pronounced social stratification and extreme disparities between socioeconomic strata (e.g., India, Saudi Arabia). On the other hand, other investigations are situated within welfare states (e.g., European countries), where class differences do not manifest as extreme deprivation but rather represent variations in luxury and discretionary spending—discerning, for instance, between local leisure travel and international vacations.
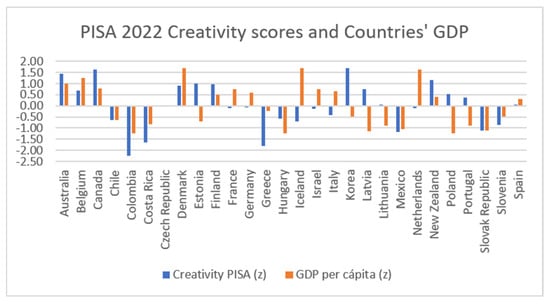
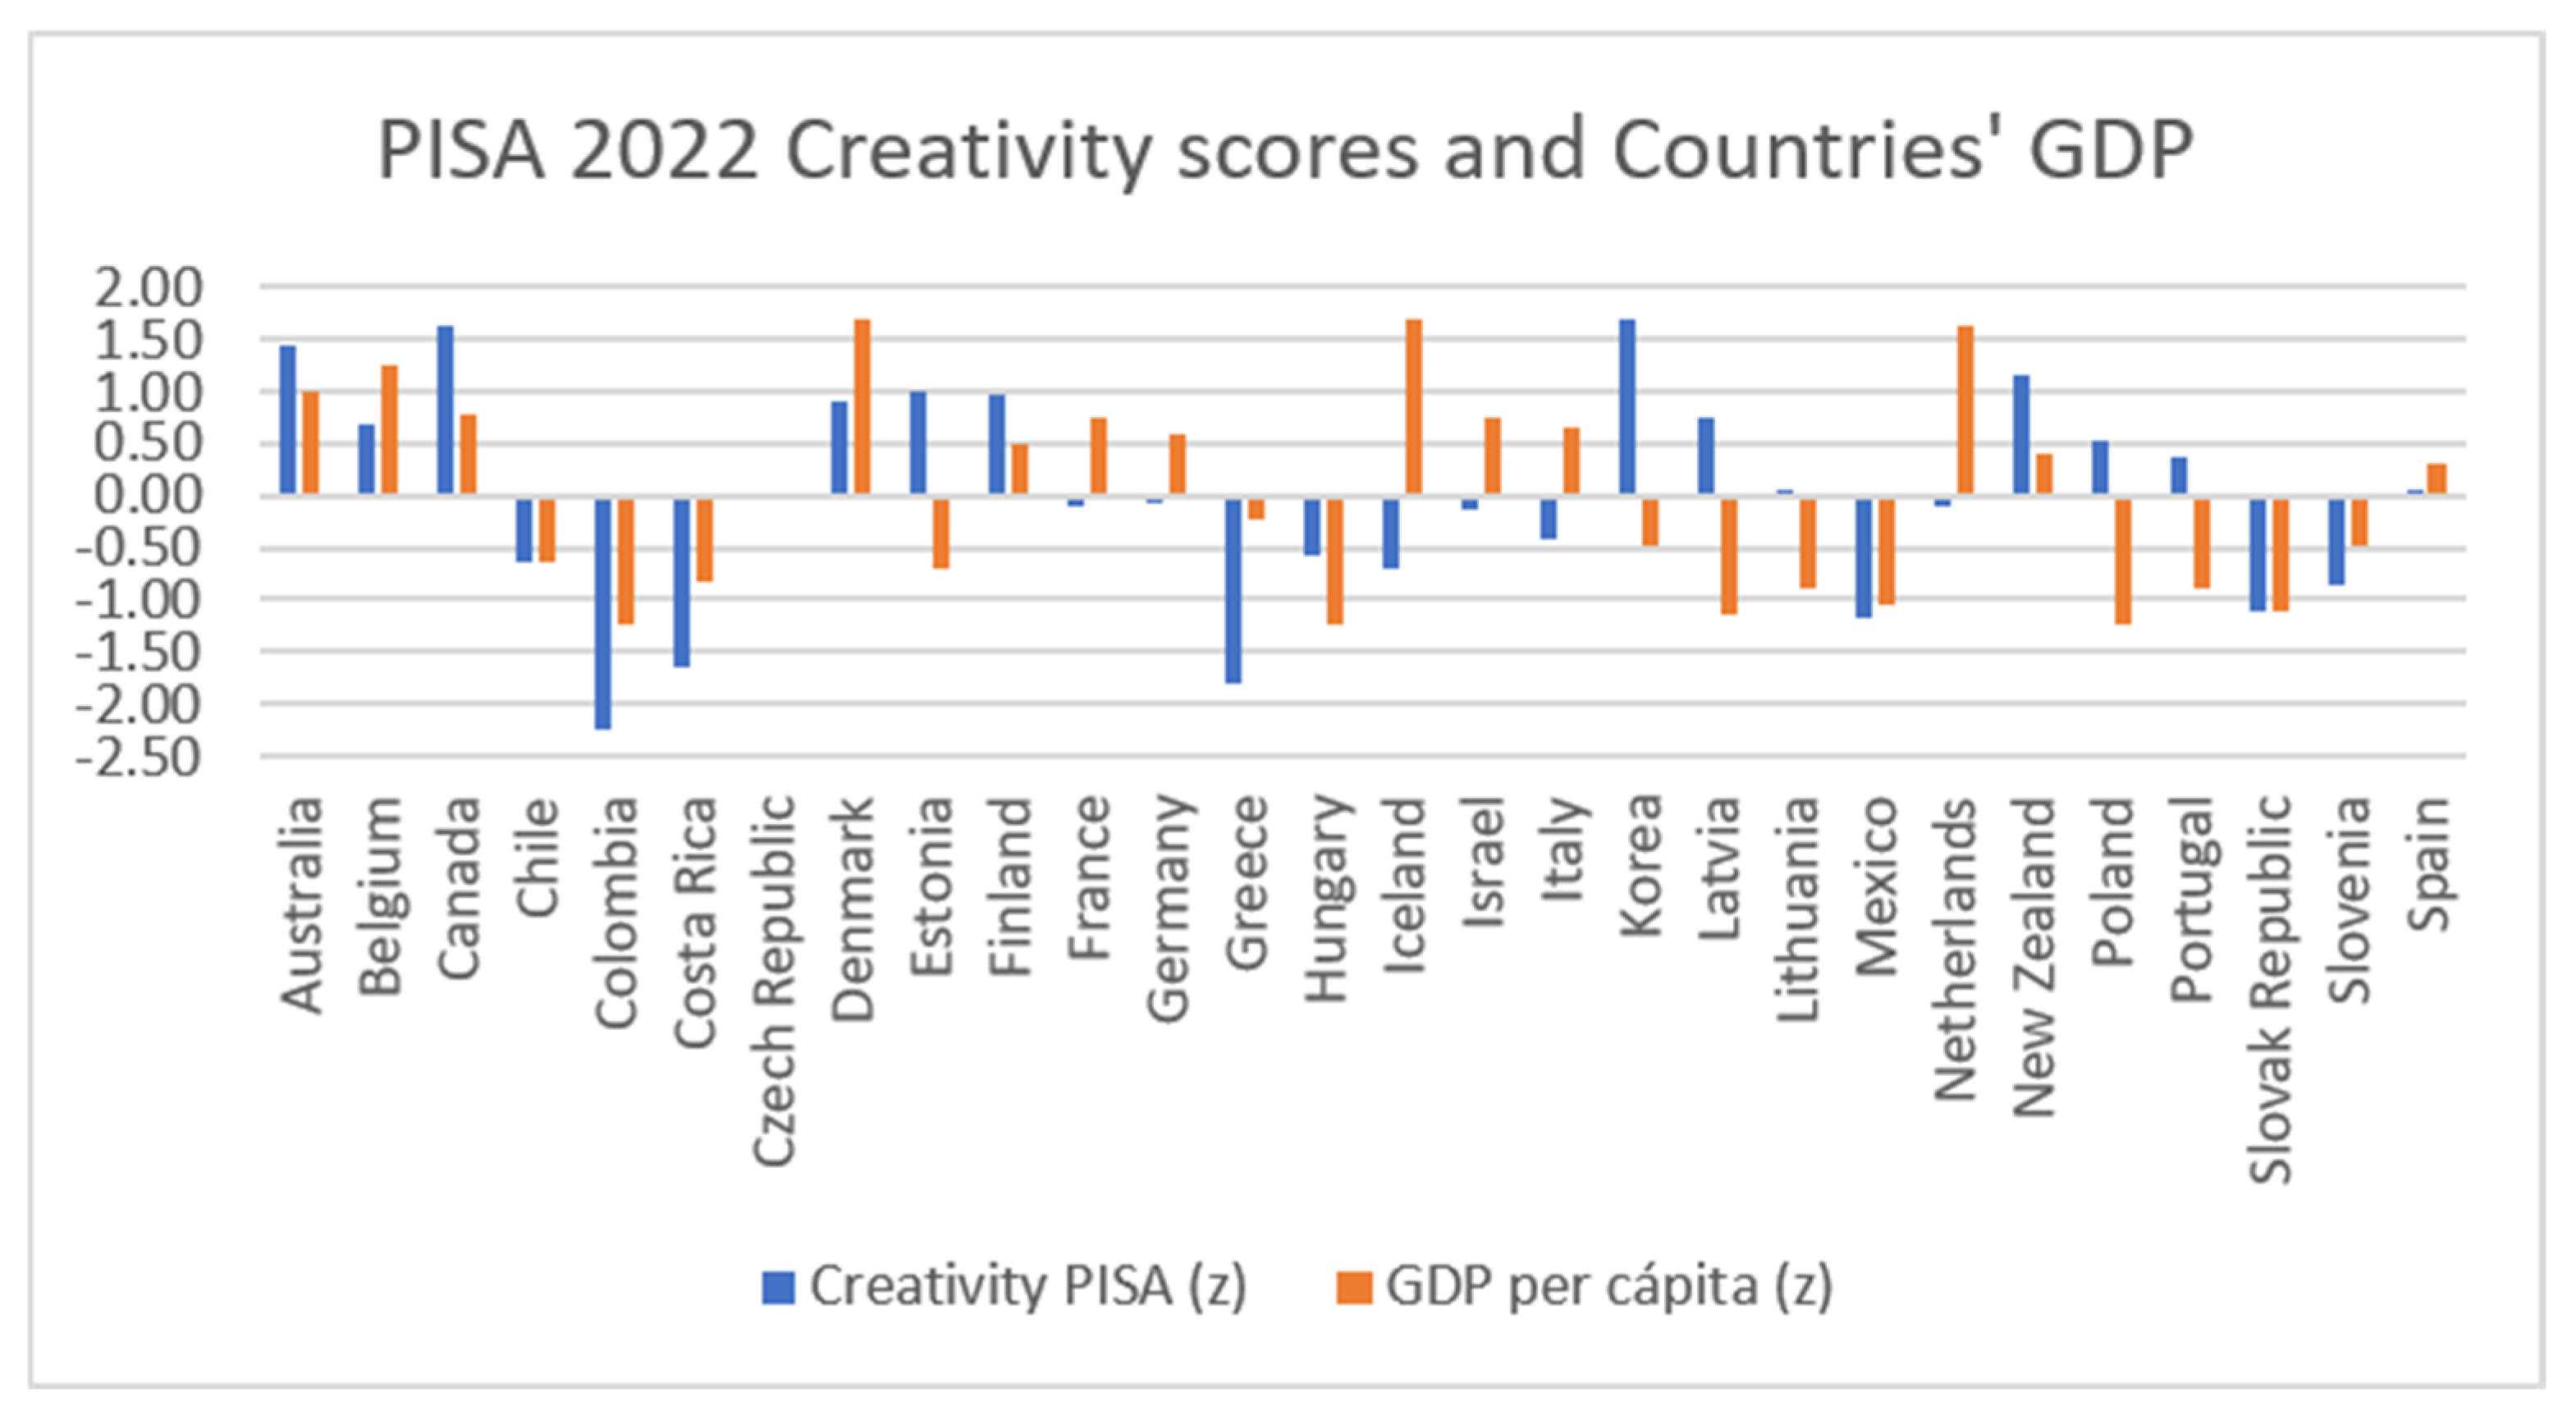
When examining the global landscape—cross-referencing data from the PISA 2022 assessment (which empirically measured students’ creative thinking) with the Gross Domestic Product (GDP) per capita of the participating nations—a specific trend emerges (Figure 1):
Figure 1.
Graphical representation of PISA scores on creativity and countries’ Gross Domestic Product in 2022.
As illustrated in this graph, higher levels of creativity are generally associated with a higher GDP. However, notable exceptions exist, such as Estonia, France, Germany, Iceland, Italy, Latvia, Lithuania, the Netherlands, Poland, Portugal, and South Korea. This macro-level snapshot suggests that the relationship between income and creativity is not entirely direct or linear.
To further elucidate this phenomenon, independent country-level analyses can be conducted, such as the approach adopted by Goecke et al. (2026). These authors analyzed the PISA creativity scores and correlated them with the SES indexes of individual students. Of particular interest is the standardized regression coefficients predicting creativity from SES across each participating nation. Across all countries involved in the PISA assessment, the correlation between SES and creativity was consistently greater than zero; nevertheless, the magnitude of this effect varied significantly depending on the cultural and economic context. The weakest correlations were predominantly observed in non-Western or transitional economies (e.g., Uzbekistan, Kazakhstan, Saudi Arabia, Morocco, South Korea, Hong Kong, and Azerbaijan). Many of these nations possess state-directed or semi-directed economies characterized by a strong governmental presence and a lower reliance on the “educational marketplace”. This structure potentially reflects lower effective inequality in access to basic education, or at least a more uniform distribution of school experiences. In these environments, higher financial resources do not necessarily purchase superior creative education or afford more stimulating environments, as the cultural and educational offerings remain relatively standardized. Consequently, SES possesses limited capacity to generate differential advantages.
Furthermore, Goecke et al.’s (2026) study demonstrates that in several European nations—including Bulgaria, Hungary, and France—the relationship between SES and creativity is significantly stronger. This represents a counterintuitive finding; one might expect that in these contexts, characterized by established welfare systems, robust middle classes, and lower overall social inequality, class disparities would exert a lesser impact. In light of Goecke et al.’s (2026) results, it could be posited that when an educational or social system fails to provide an environment where creativity can flourish broadly, individual SES ceases to be a differentiating factor. However, when the system does permit creative development, SES becomes a decisive determinant.
It must be noted that SES within the PISA framework was not operationalized solely through income; rather, it incorporated broader family-level variables, including indicators related to parenting styles.
When examining the existing literature on the relationship between creativity and SES, empirical research remains relatively scarce (see Supplementary Material, Table S1). Most of these prior studies report either a positive correlation between both variables, significant mean differences favoring high-SES over low-SES groups, or a significant predictive value of SES on creative performance. These findings collectively support the hypothesis that superior socioeconomic resources afford greater developmental opportunities.
Nevertheless, the few studies reporting null associations warrant careful attention. In this regard, the meta-analysis conducted by Acar et al. (2022) revealed that although the relationship between SES and creativity is statistically significant, its effect size is remarkably small (r = 0.12). Two primary theoretical frameworks have been proposed to explain this weak or absent relationship between SES and creative capabilities: the Hidden Talents framework and the Cognitive Disaggregation framework.
The “Hidden Talents” posits that children raised in adverse, unpredictable, or resource-constrained environments may develop specific, highly adaptive cognitive strengths as a mechanism of environmental adaptation and survival (Rawlings et al., 2025). Rather than exhibiting global deficits, individuals facing socio-economic adversity often develop heightened proficiency in improvisation, problem-solving under pressure, and flexible thinking. Under this framework, it is argued that creative thinking may function as a resilient cognitive asset against environmental inequality, capable of emerging across a broad spectrum of contextual conditions (Berzenski et al., 2022).
On the other hand, the “Cognitive Disaggregation” considers that creativity is not a unitary construct and must be analyzed at a more granular level to accurately decipher its relationship with SES (Wrightson, 2019). Early foundational studies, such as those by Rohwer (1971) and Kaltsounis (1974) (both cited in Warden & Prawat, 1975, pp. 715 and 718), observed that students from low-SES backgrounds occasionally outperformed their high-SES peers in specific dimensions such as fluency and originality.
Consequently, there is a critical need to differentiate among the specific creative processes under evaluation. Rather than searching for global, overarching differences in creativity, this approach deconstructs creative capacity into distinct components, including divergent thinking, insight, and associative processing.
In line with this view, Herranz Torres (2018) notes that verbal creative tasks are more deeply intertwined with general cognitive intelligence and, as a result, are substantially more sensitive to the participant’s socioeconomic background. From this perspective, basic divergent thinking—specifically ideational fluency and originality—tends to be distributed more equitably across social strata, irrespective of financial resources. What varies instead is the structural profile or phenotypic distribution of these skills: individuals from lower-SES backgrounds frequently excel in figural or pictorial creativity tasks, whereas their higher-SES counterparts tend to perform better in tasks reliant on the verbal domain.
A crucial finding reinforcing this framework is that while SES significantly predicts associative processing and insight—both of which rely heavily on vocabulary, acquired knowledge, and formal academic training—it does not necessarily predict basic divergent thinking (fluency and originality), which appears to be more evenly distributed across all socioeconomic strata (Wrightson, 2019). This granular distinction has been empirically supported by the comprehensive meta-analysis of Acar et al. (2022).
As previously noted, investigating this phenomenon presents considerable methodological challenges due to two primary factors. The first is related to the inherent complexity of creativity itself: specifically, whether assessments are designed to measure creative potential, creative productivity, or distinct underlying cognitive processes. The second factor involves the conceptualization and operationalization of SES. While early research conventionally defined socioeconomic status as a combination of social prestige and financial income, recent investigations favor composite scores that incorporate parental educational attainment, parenting styles, and family structure (Acar et al., 2022).
All this together reveals limited research on the SES-creativity relationship with two main gaps: treating SES as a unitary construct (when SES often takes into account different dimensions such as parenting) and taking creativity as a general ability, disregarding the evidence on domain specificity and the sub-abilities involved in creative thinking. In addition, few studies have controlled intelligence and how intelligence may be mediating the relationship between SES and creativity.
To address these gaps, the present study aims to examine the relationships among economic, cultural, and family dimensions of SES, verbal and non-verbal intelligence, and verbal and figural creativity in adolescents. Specifically, the study sought to determine: (1) whether the different dimensions of SES show distinct associations with intelligence and creativity; (2) whether intelligence contributes to the relationship between SES and creative performance; and (3) whether these relationships differ across verbal and non-verbal/figural domains. To this end, this research seeks to contribute to a more integrated understanding of the link between SES and creativity, accounting for both the underlying cognitive processes and the environmental conditions within which they develop.
2. Materials and Methods
2.1. Research Design
The study adopted a quantitative approach using a non-experimental, cross-sectional, and correlational-explanatory design.
2.2. Participants
This study is part of a broader research project that involved a total of 1247 students from 11 schools. Schools were initially contacted by the research team, and headmasters subsequently communicated with families to obtain written informed consent for participation in the study. Convenience sampling was used.
Within this larger sample, students from 3 of the schools in the Region of Murcia (Spain) completed the SES questionnaire. This subsample comprised a total of 230 students attending the 1st, 2nd, and 3rd years of Compulsory Secondary Education (Educación Secundaria Obligatoria [ESO]; about 12–15 years old). Using indicators of the Tax Agency by zone and area, two of the schools (RLG and JM) were classified as medium socioeconomic status and one (PCC) was classified as medium-low socioeconomic status. JM is a semi-public school in the capital of Murcia; PCC is a public school situated in the center of a middle-size city in the southeast, an urban area surrounded by large rural areas; RLG is also a public school situated in the northeast, in a small city characterized by a rural environment.
Table 1 provides detailed information regarding the demographic distribution of this sample:
Table 1.
Distribution of participants.
2.3. Instruments
2.3.1. Creativity Measures
Two instruments were employed to assess creativity: the Creative Imagination Test for Young People (Prueba de Imaginación Creativa para Jóvenes [PIC-J]; Artola et al., 2008) and the Torrance Tests of Creative Thinking (TTCT)—Figural Form A (Torrance, 1974).
Torrance Tests of Creative Thinking (TTCT)—Figural Form A: The Spanish adaptation by Prieto Sánchez et al. (2003) was utilized. This test assesses creativity through drawing tasks that require participants to complete or transform ambiguous figural stimuli into meaningful productions. It yields scores for fluency, flexibility, originality, and elaboration, alongside an overall figural creativity index. Specifically, the test comprises three tasks: “Picture Construction” (starting from a small piece of green adhesive paper), “Picture Completion” (utilizing 10 incomplete line drawings), and “Parallel Lines” (consisting of 30 pairs of parallel lines from which the student must complete original drawings).
Creative Imagination Test for Young People (PIC-J): This instrument consists of four tasks (“games”) designed to measure both narrative/verbal and graphic creativity. It evaluates dimensions such as fluency (number of ideas), flexibility (variety of categories), originality (infrequent responses), elaboration (added details), titles, and special details, providing specific scores for each dimension as well as composite scores for graphic, narrative, and total creativity. In Task 1, participants are presented with an ambiguous scene and must generate as many ideas as possible regarding what might be occurring. Task 2 requires generating alternative uses for a rubber tube. Task 3 involves a “what would happen if …” hypothetical scenario. Finally, Task 4 presents several incomplete drawings that participants must complete originally and provide with a title; this task scores fluency, flexibility, originality, graphic elaboration, title quality, and special details.
To derive an overall creativity score, a principal component analysis (PCA) was conducted on the Z-scores of all variables from both instruments (PIC-J and TTCT), computed across the full sample of 1247 participants from the original research project (see Appendix A Table A1). The resulting factor score was used in subsequent analyses.
2.3.2. Intelligence Measure
The Differential Aptitude Test, Fifth Edition (DAT-5; Bennett et al., 2000), was administered as a measure of cognitive ability. The DAT-5 is a standardized multiple-aptitude battery that evaluates seven core cognitive abilities: verbal reasoning, numerical reasoning, abstract reasoning, mechanical reasoning, space relations, perceptual speed and accuracy, and spelling. An exploratory factor analysis (EFA) using principal component extraction was performed on the test variables, forcing a single-factor solution. The score from this single factor was utilized as an index of general cognitive ability (Intelligence General). Similarly, factors for verbal (intelligence) and non-verbal (intelligence) dimensions were calculated.
2.3.3. SES Measure
Socioeconomic aspects were assessed using an ad hoc questionnaire developed by referencing the instrument by Gil Flores (2013) and school institutional documents. The questionnaire encompasses family characteristics (number of siblings, language spoken at home, perceived economic level), parental variables (nationality, native language, marital status, occupation, educational attainment, and hobbies), housing traits (including geographical residential zone), and cultural environment indicators (reading habits, use of new technologies, and attendance at cultural events such as concerts or cinema), alongside the students’ subjective perception of their family’s economic status. Initially parents’ occupation was also recorded, but unfortunately these data could not be used due to lack of precision on students’ answers (i.e., “civil-servant”, “entrepreneur”, “self-employed”, “[he or she] works in a factory” …).
Following the methodology of Bernal et al. (2022), three distinct dimensions from the questionnaire were operationalized: economic, cultural, and family. The three-dimensional structure was supported by a categorical principal components analysis, with the three dimensions accounting for 45.6% of the total variance (see Appendix A Table A2). Table 2 outlines the specific variables included within each dimension. To calculate a composite score for each dimension, separate principal component analyses (PCA) were conducted, including the respective variables for each domain. The resulting factor scores were saved and utilized for all subsequent analyses. Those scores are SES_culture, SES_Economic and SES_Family. An analysis of the relationships among the three components is included in Appendix A Table A3. The correlation between dimensions was weak, suggesting that they were relatively independent. Cultural and economic dimensions showed a significant but low correlation, whereas family and economics showed a negative correlation.
Table 2.
Information in the socio-economic questionnaire and its codification.
2.4. Procedure and Data Analysis
Participant centers were formally contacted, and parents were fully informed regarding the research objectives to secure their participation. The ethics committee approved this study [M10/2025/701].
The assessment instruments were administered during regular school hours by experienced evaluators with training in psychology and educational sciences. Given that the instruments required lengthy administration times and demanded significant cognitive effort from the participants, the testing sessions were distributed across different days. This scheduling strategy was implemented to mitigate fatigue and to optimize student engagement and motivation throughout the evaluation process.
The assessment was conducted in two sessions on separate days, each lasting two hours. During the first half of each session, students completed the DAT, while during the second half, they completed either the TTCT or the PIC. This order was chosen because creativity tasks were considered more enjoyable and less demanding for students. The SES questionnaires were subsequently collected by the school counselor.
Of the 230 participants, missing data were limited for DAT-5 (1.7–2.2%) and ranged from 3.0% to 8.3% across the three TTCT activities, whereas higher proportions were observed for the PIC narrative (18.7%) and figural (21.3%) measures. Missing values were not imputed. Factor scores were calculated using available complete observations, resulting in different sample sizes across composite measures.
Data analyses were performed using R (version 4.4.3) within the RStudio environment (version 2024.12.1.563).
First, descriptive statistics (means and standard deviations) and Pearson correlation analyses were computed using the psych package in R.
To evaluate the relationships among the variables, confirmatory Structural Equation Modeling (SEM) was conducted. Model estimation was performed using the Robust Maximum Likelihood (MLR) estimator, which is well-suited for continuous data exhibiting moderate deviations from multivariate normality. Model fit was evaluated using the Comparative Fit Index (CFI), the Tucker–Lewis Index (TLI), the Root Mean Square Error of Approximation (RMSEA) with its 90% confidence interval, and the Standardized Root Mean Square Residual (SRMR). Values of CFI and TLI ≥ 0.95, RMSEA ≤ 0.06 and SRMR ≤ 0.08 were considered indicative of an excellent model fit. All SEM analyses were carried out utilizing the lavaan package (version 0.8.1), along with complementary packages for model visualization and the calculation of additional fit criteria, such as semTools (version 0.5.8).
Traditionally, positive correlations among diverse cognitive abilities have been explained by the existence of a common general intelligence factor (g). Conversely, the network analysis approach posits that these relationships may emerge because the abilities themselves mutually influence and reinforce one another, thereby eliminating the need to assume an underlying common latent factor (Hevey, 2018).
To complement the structural equation modeling analyses, a network analysis was conducted to examine the pattern of conditional associations among SES, intelligence, and creativity. Unlike SEM, which tests directional hypotheses, network analysis estimates the unique relationships among variables after controlling for all remaining variables in the network.
The network was estimated using the Extended Bayesian Information Criterion graphical Least Absolute Shrinkage and Selection Operator (EBICglasso) implemented in the R packages bootnet (Epskamp et al., 2018) and qgraph (Epskamp et al., 2012), and edge stability and centrality indices were evaluated via resampling procedures using bootnet (version 1.6). This procedure estimates a regularized Gaussian Graphical Model (GGM), in which edges represent regularized partial correlations between variables while shrinking small associations to zero, thereby reducing the likelihood of spurious connections.
The analysis included six continuous variables: cultural SES, economic SES, verbal intelligence, non-verbal intelligence, verbal creativity, and figural creativity. Intelligence and creativity variables were standardized scores derived from the corresponding psychometric instruments, whereas SES indicators corresponded to the standardized factor scores obtained from the SES questionnaire. Missing data were handled using listwise deletion within the network estimation procedure.
The network was estimated using the default EBIC hyperparameter γ = 0.50, which provides a balance between sensitivity and specificity in edge selection. Default regularization parameters implemented in EBICglasso were retained. No additional edge threshold was imposed (threshold = FALSE), and therefore all non-zero regularized partial correlations selected by the EBIC procedure were retained for interpretation.
Node centrality was examined using standardized strength indices. To evaluate the precision and stability of the estimated network, non-parametric bootstrapping with 1000 resamples was performed using the bootnet package. Bootstrap confidence intervals were inspected to assess the accuracy of edge-weight estimates.
3. Results
Table 3 displays the descriptive statistics for the variables analyzed in this study, as well as the bivariate correlations among them. First, the demographic characteristics of the sample (age and sex) are presented. Second, the variables corresponding to cognitive intelligence (general intelligence, verbal intelligence, and non-verbal intelligence), creativity, and SES are detailed.
Table 3.
Means, standard deviations, and correlations with confidence intervals.
The results indicate that the distinct dimensions of SES exhibit differentiated correlation patterns (Table 3). Specifically, while cultural SES displays a weak correlation with both intelligence and creativity measures, economic SES correlates significantly only with creativity variables. Conversely, family-level SES does not show significant correlations with the analyzed constructs, with the notable exception of global creativity, with which it exhibits a significant negative correlation (r = −0.17, p = 0.033).
3.1. Relationship Between Creativity and SES
To examine the relationship between SES, intelligence, and creativity, seven structural equation models (SEMs) were specified and compared. Each model represented a different theoretical assumption regarding the mechanisms through which SES may influence cognitive and creative performance (see Table 4).
Table 4.
Fit index of SEM models tested.
The first model (Model_1) was based on the hypothesis that SES exerts differential effects on verbal and non-verbal abilities. SES was specified as a latent construct composed of cultural, economic, and family dimensions. This latent factor was assumed to predict verbal intelligence, which in turn predicted verbal creativity, and non-verbal intelligence, which subsequently predicted figural creativity. Although theoretically plausible, this model showed only moderate fit to the data (CFI = 0.893, RMSEA = 0.115), suggesting that the proposed distinction between verbal and non-verbal pathways was not fully supported.
A second model (Model_2) adopted a more parsimonious approach by assuming that both general intelligence and general creativity reflected a common latent factor labeled Cognition, which was predicted by SES. In this specification, SES was defined by its cultural, economic, and family components. Inspection of the standardized factor loadings revealed that the family component contributed only weakly to the latent SES construct. Consequently, this indicator was removed, resulting in Model_3, in which SES was represented only by its cultural and economic dimensions.
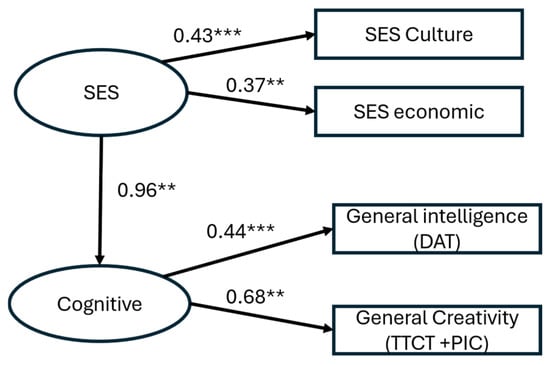
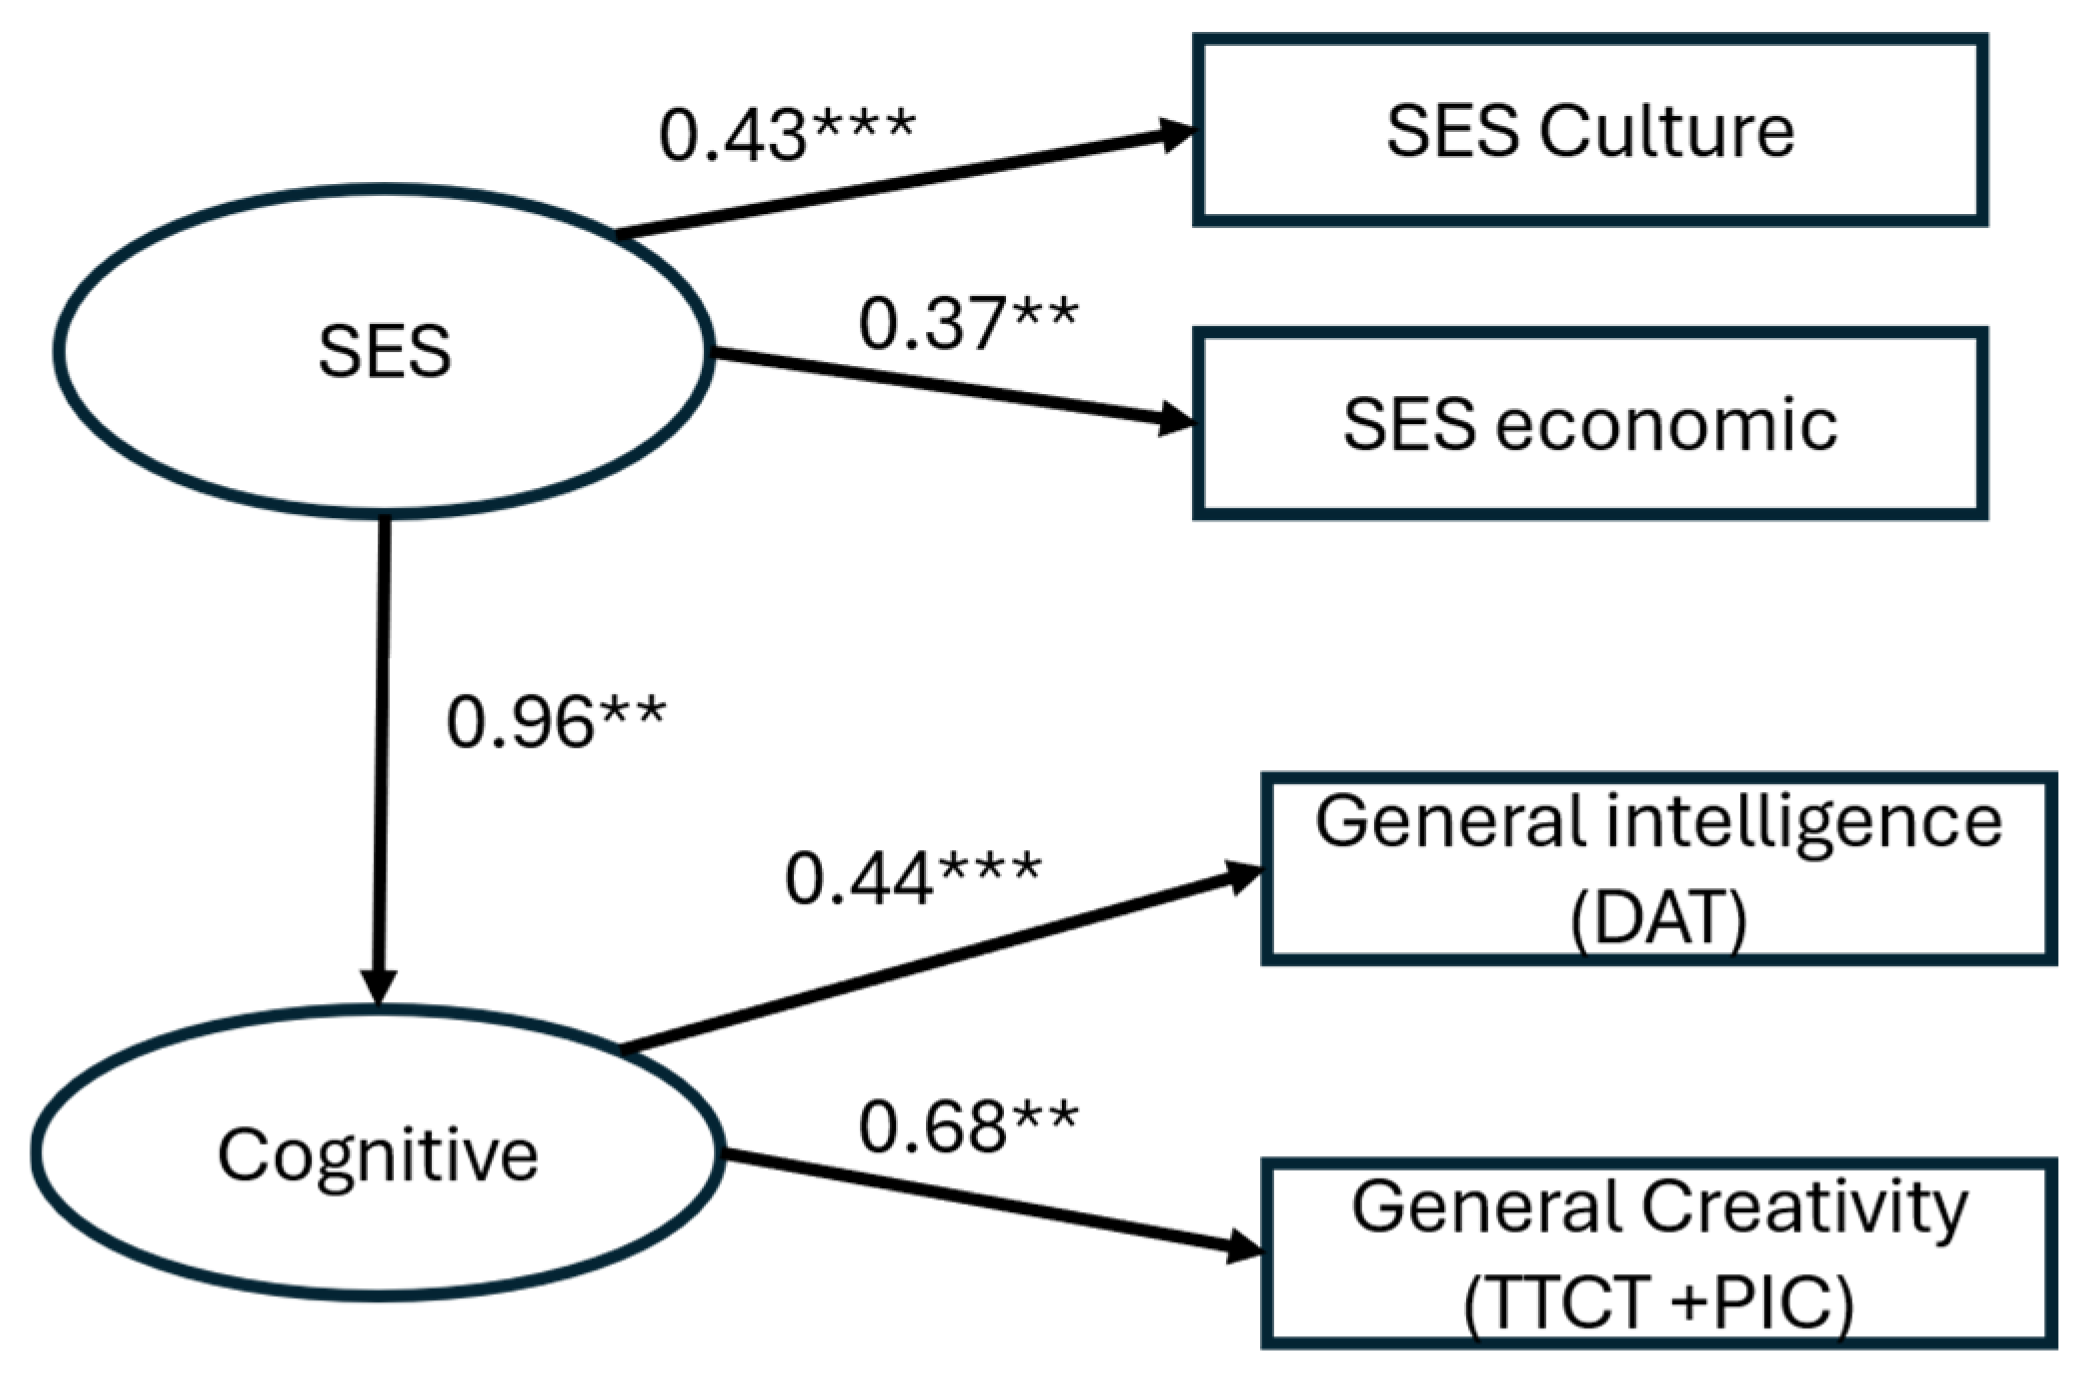
Model_3 provided the best overall fit among all the models tested so far (χ2 = 1.53, df = 1, p = 0.217, CFI = 0.987, RMSEA = 0.048, SRMR = 0.019). However, because intelligence and creativity were represented by composite scores, this model did not provide detailed information regarding the contribution of the different cognitive domains.
To explore this issue further, a more detailed measurement model (Model_4) was specified. In this model, the latent Cognition factor was defined by four observed indicators: verbal intelligence, non-verbal intelligence, verbal creativity, and figural creativity. Interestingly, intelligence measures showed substantially higher standardized loadings on the latent factor (λ = 0.86 for verbal intelligence and λ = 0.95 for non-verbal intelligence) than creativity measures (λ = 0.33 for verbal creativity and λ = 0.32 for figural creativity). This pattern suggested that intelligence and creativity might represent related but distinguishable constructs rather than indicators of a single cognitive dimension.
Based on this finding, Model_5 was specified by separating intelligence and creativity into two independent latent variables. In this model SES (defined by cultural and economic dimensions) predicted intelligence, which in turn predicted creativity. Although the overall model fit was only moderate, the structural path from Intelligence to creativity was statistically significant, supporting the hypothesis that intelligence constitutes an important antecedent of creative performance.
Model_6 examined whether SES exerted a direct influence on creativity in addition to its indirect effect through intelligence. Therefore, a direct structural path from SES to creativity was added. Once this direct path was included, the predictive effect of intelligence on creativity was no longer statistically significant. The attenuation of both structural paths after including the direct association suggests substantial shared variance between SES and intelligence in explaining creativity.
Finally, given previous evidence emphasizing the role of non-verbal abilities in creative performance among children from lower socioeconomic backgrounds, an additional model was examined (Model_7). In this model, SES predicted the latent intelligence factor, while observed non-verbal intelligence directly predicted the latent creativity factor.
Overall, two models emerged as the most informative. Model_3 shows the best statistical fit and supported a parsimonious interpretation in which SES predicts a general cognitive factor encompassing both intelligence and creativity. In contrast, Model_7 also presented a good fit and was more consistent with the theoretical framework proposed in previous research by distinguishing intelligence and creativity as separate constructs and modeling intelligence as an intermediate mechanism linking SES to creativity. However, although the overall model fit for Model_7 was acceptable, the solution yielded inadmissible parameter estimates (e.g., standardized coefficients > 1 and negative residual variance), indicating model misspecification. Consequently, this alternative model was not retained for substantive interpretation. This model probably failed because the verbal intelligence node (which is part of the latent variable of intelligence) also serves as a predictor for creativity; this is a complex model given the sample size of the present study.
Figure 2 presents the standardized path diagrams for Model_3 displaying only statistically significant paths. Detailed parameter estimates for this model are reported in Table 5.
Figure 2.
Graphical representation of Model_3. Note. ** p < 0.01; *** p < 0.001.
Table 5.
Standardized parameter for Model_3.
3.2. Network Analysis
Although structural equation modeling allows the evaluation of theoretically specified causal structures, it requires the researcher to define a priori the direction of the relationships among variables. Given that several theoretically plausible SEMs showed comparable levels of fit but differed in the pattern of direct and indirect effects, a complementary network analysis was conducted. Unlike SEM, network analysis does not impose a predefined causal structure but estimates the conditional associations among variables simultaneously, allowing the identification of the most central variables within the system and the strongest direct relationships after controlling for all remaining variables.
To complement the structural equation modeling analyses, a network analysis was conducted to examine the unique associations among SES, intelligence, and creativity. The network was estimated using regularized partial correlations with the Extended Bayesian Information Criterion graphical least absolute shrinkage and selection operator (EBICglasso). This procedure estimates conditional associations between variables while shrinking trivial edges towards zero, resulting in a sparse and interpretable network.
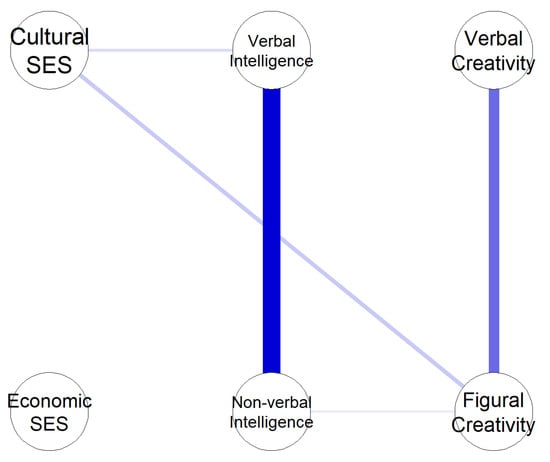
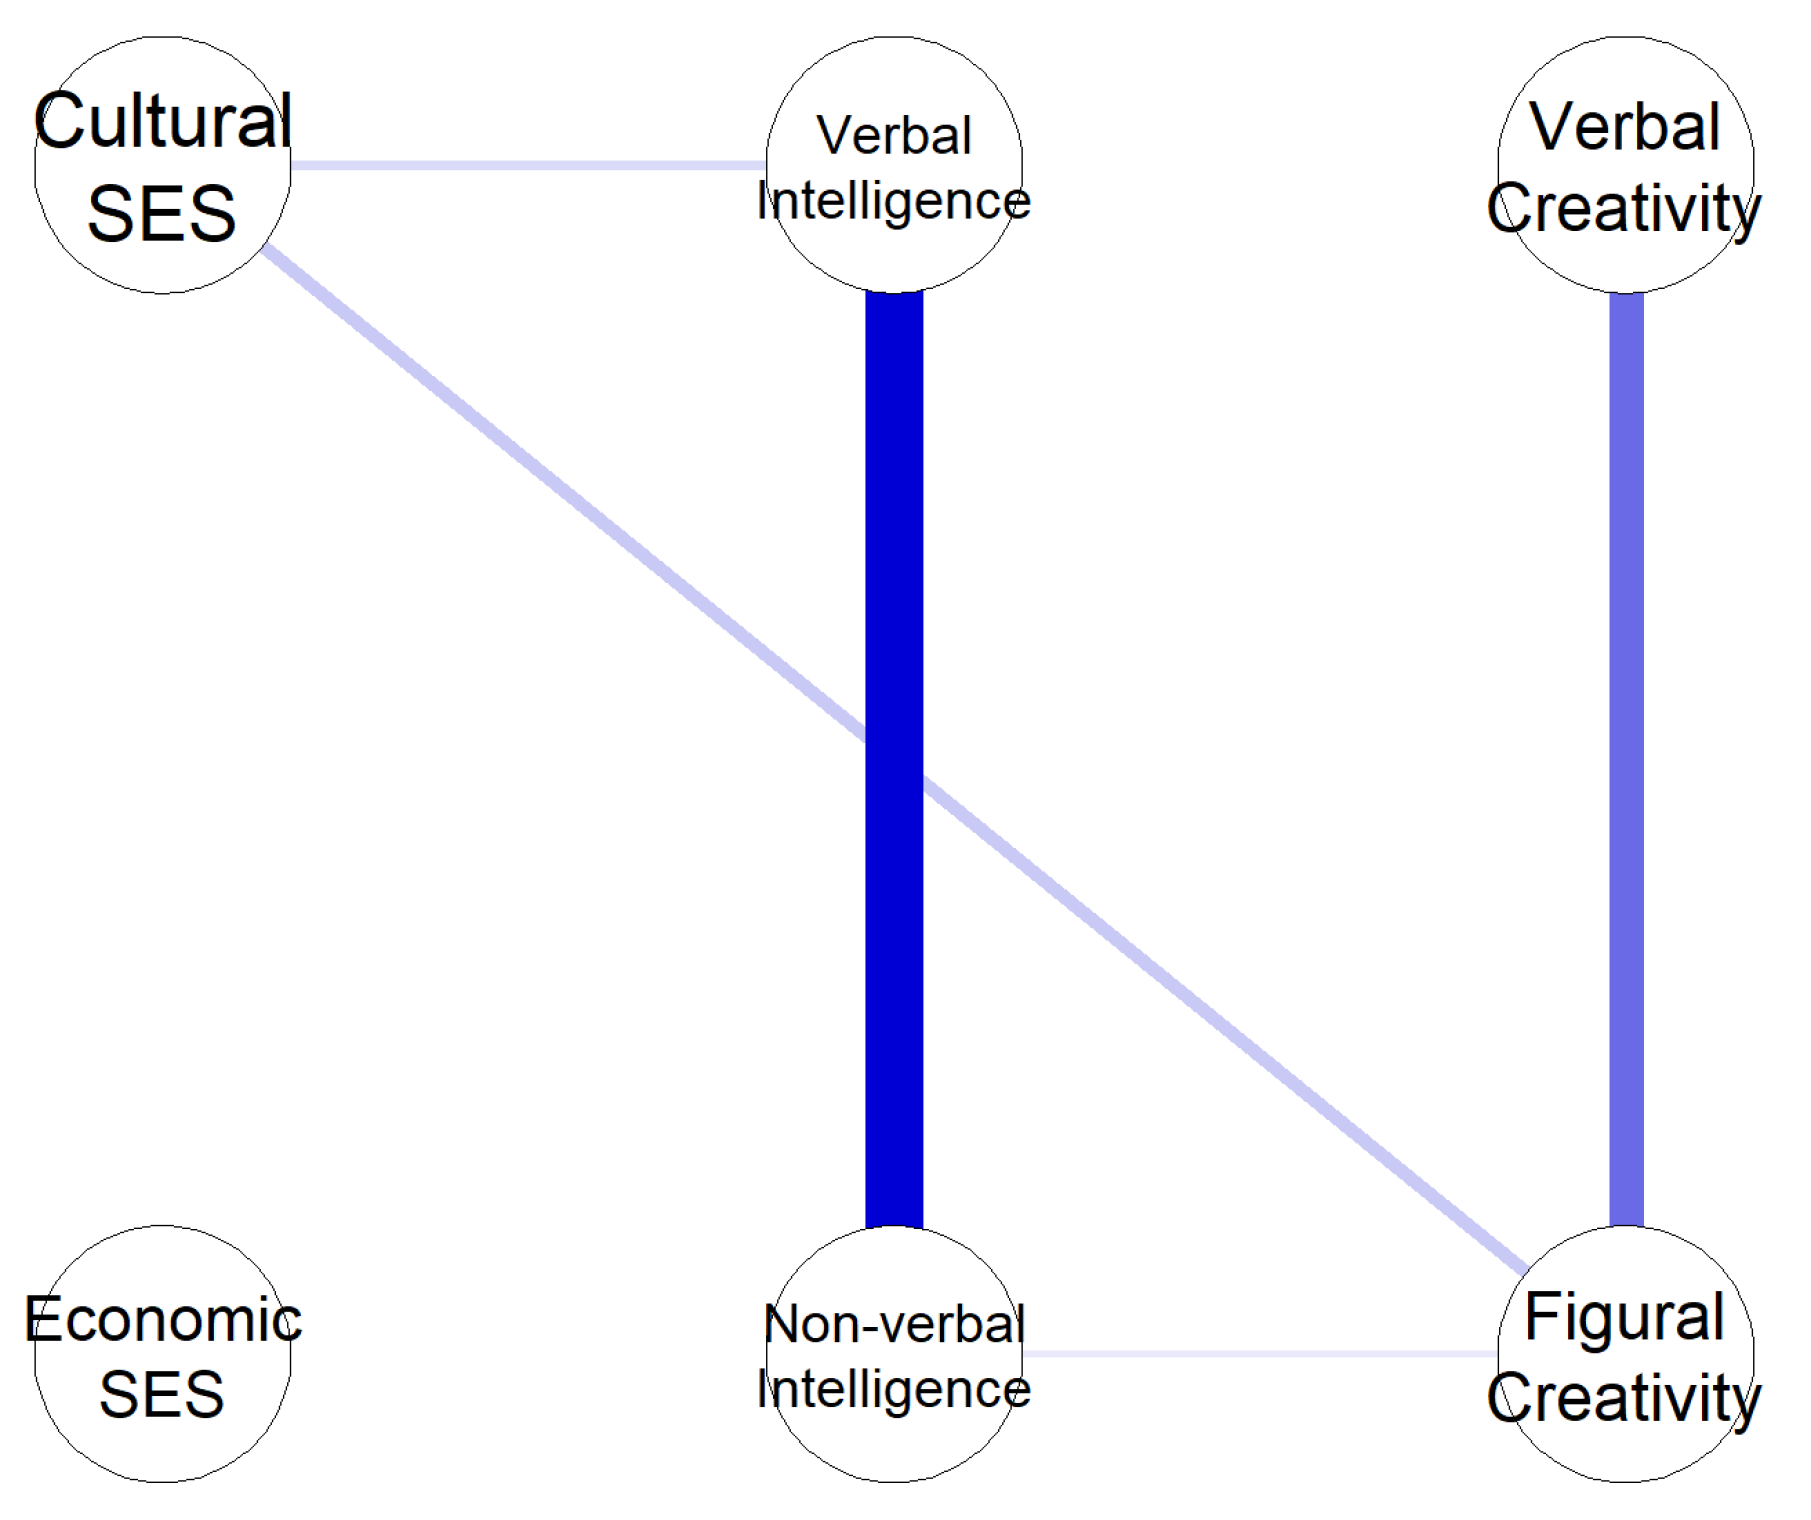
Figure 3 presents the estimated undirected network. In this representation, nodes correspond to the observed variables, whereas edges represent regularized partial correlations after controlling for all remaining variables in the network. Because the network is undirected, the edges indicate conditional associations but do not imply causal direction.
Figure 3.
Network analysis graph representation. Variables on the left are related to socio-economic variables; central variables are related to intelligence; and variables on the right are related to creativity.
Table 6 shows the matrix of regularized partial correlations among cultural SES, economic SES, verbal intelligence, non-verbal intelligence, verbal creativity, and figural creativity.
Table 6.
Partial correlations.
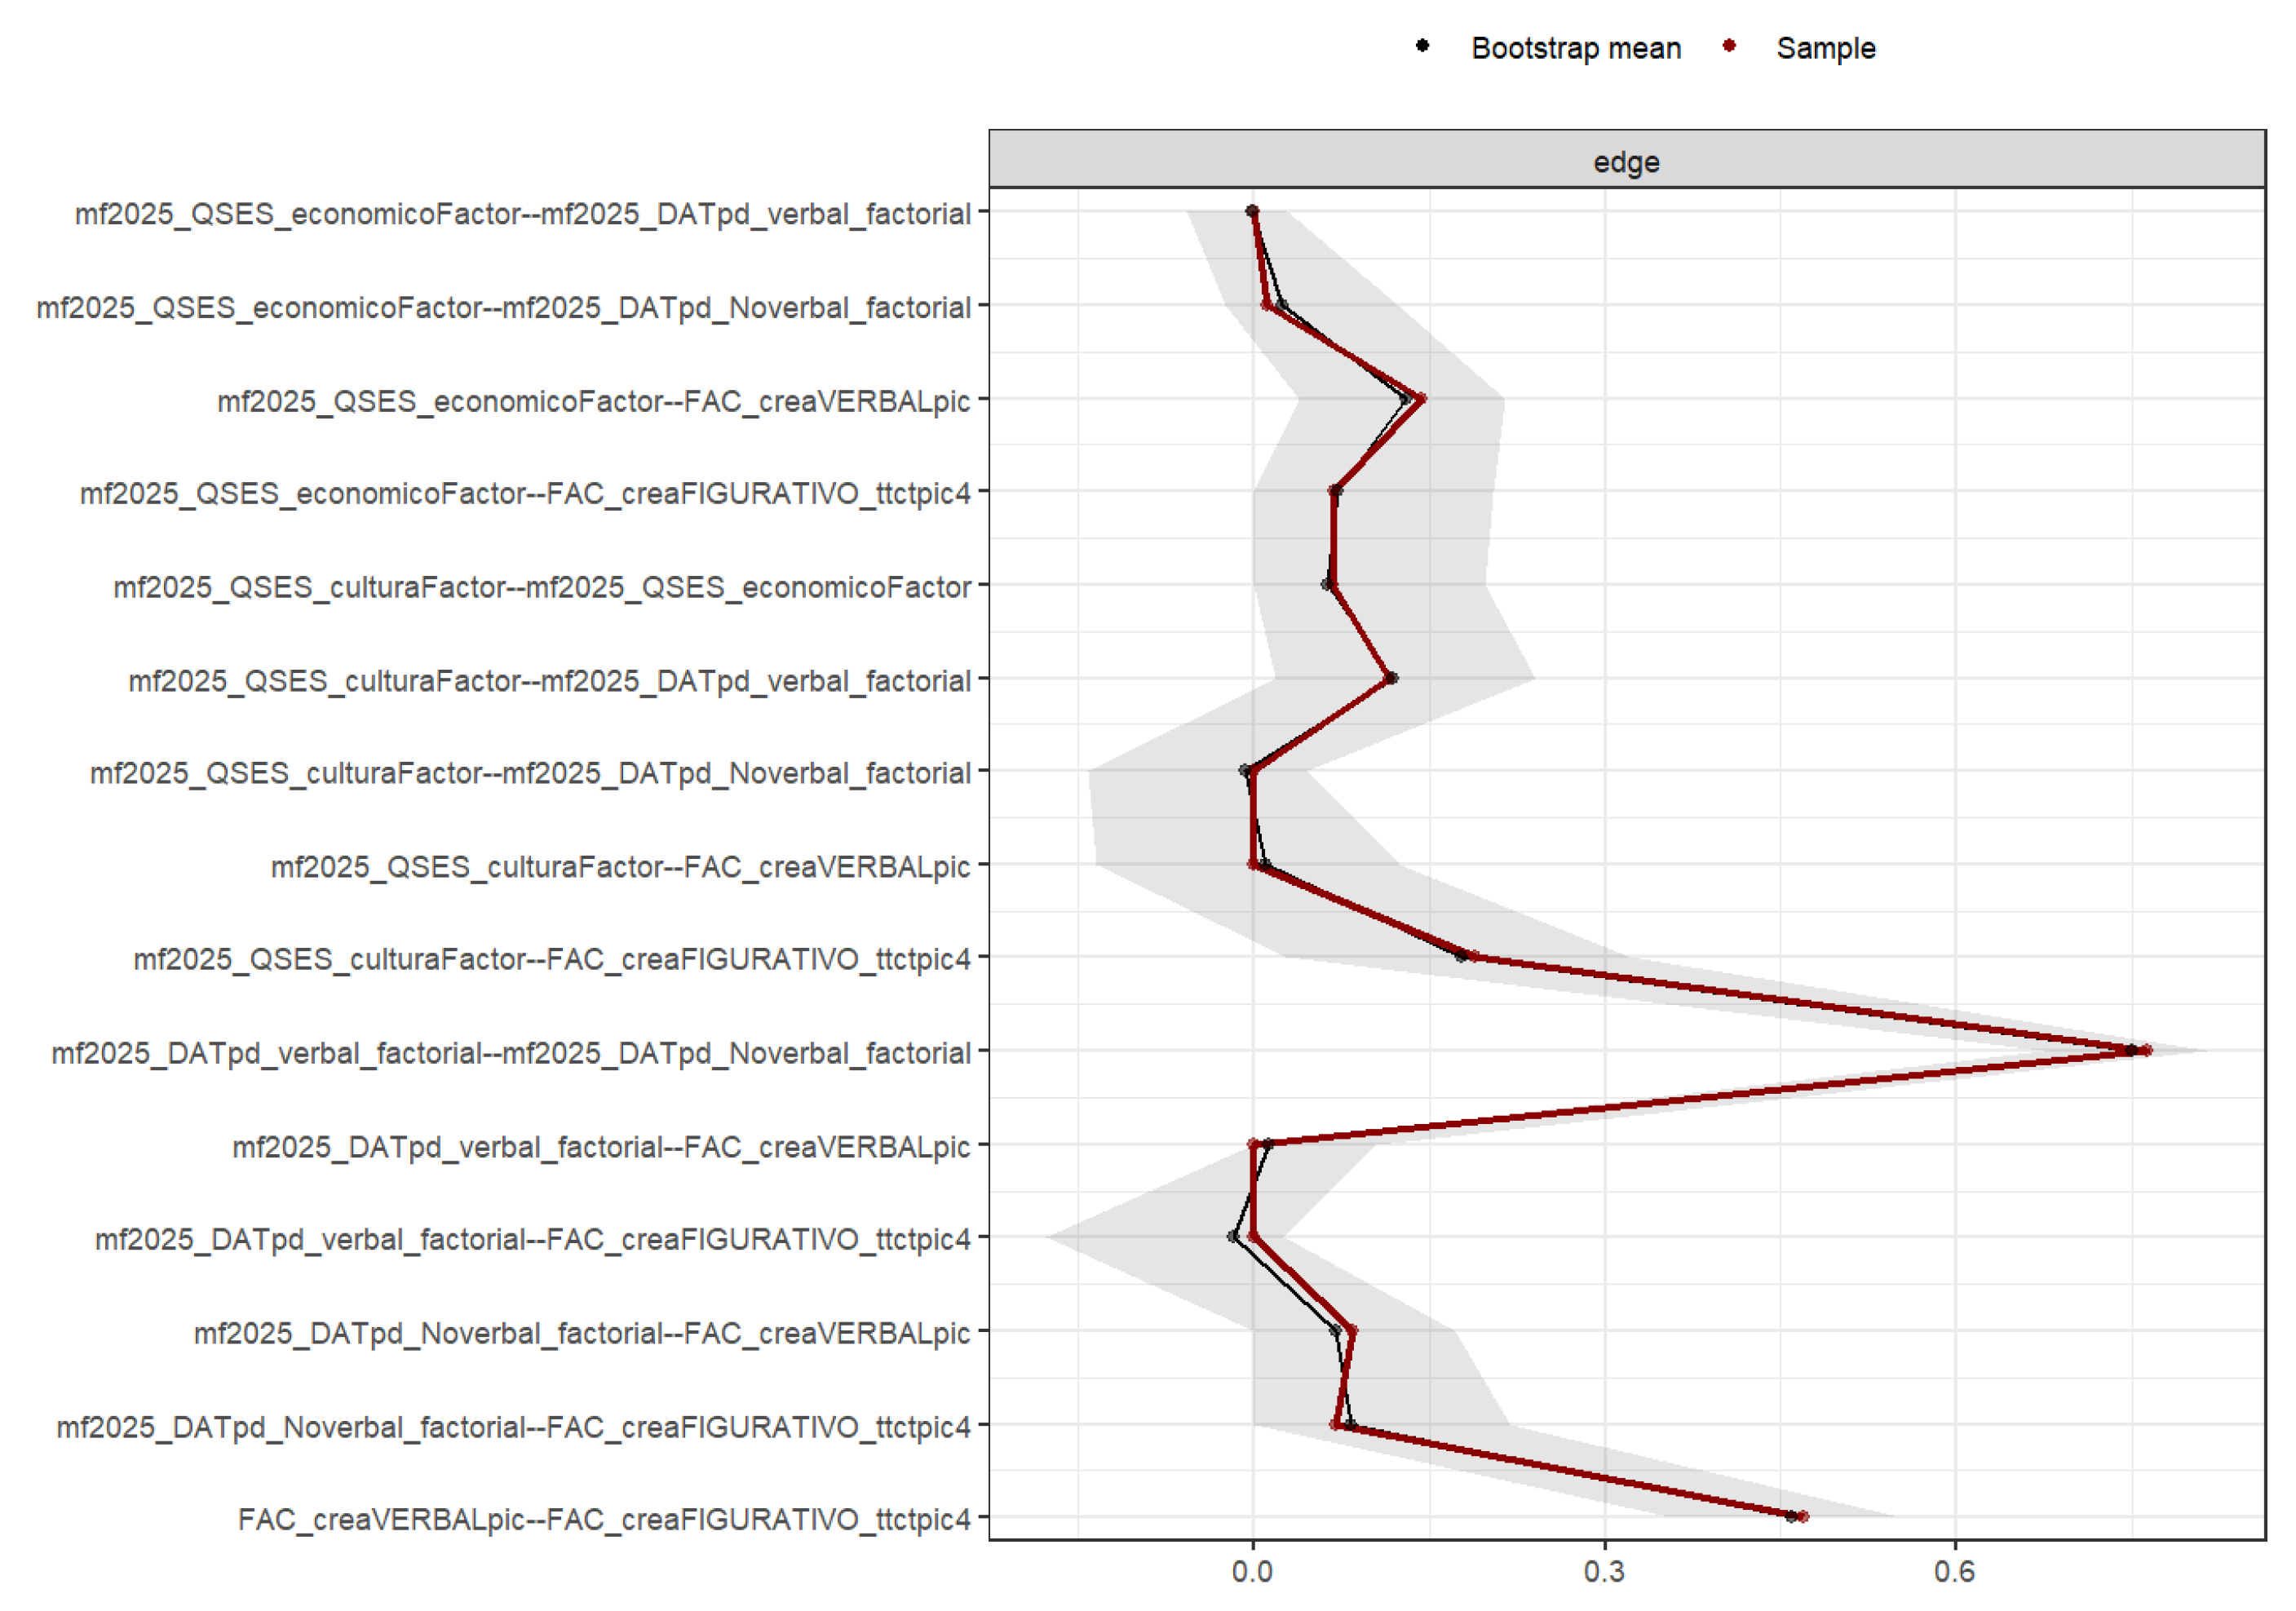
To evaluate the stability of the estimated network, a non-parametric bootstrap procedure (1000 iterations) was conducted using the bootnet package (Epskamp et al., 2018). Bootstrap confidence intervals for the edge weights are presented in Appendix A Figure A1. Overall, the strongest connections showed relatively narrow confidence intervals, indicating acceptable estimation stability.
The network revealed several meaningful patterns. First, verbal and non-verbal intelligence formed the strongest connection in the network (rpartial = 0.782), suggesting that both measures constitute a highly cohesive cognitive subsystem. Likewise, verbal and figural creativity were moderately associated (rpartial = 0.478), indicating that both creativity measures clustered within a second subsystem.
In contrast, economic SES showed only zero partial correlations with all of the remaining variables after regularization, suggesting that it did not contribute unique information once the shared variance with the rest of the network was taken into account. Cultural SES, however, remained connected to verbal intelligence (rpartial = 0.155) and, independently, to figural creativity (rpartial = 0.205).
The only direct association between intelligence and creativity that remained after controlling for all other variables was observed between non-verbal intelligence and figural creativity (rpartial = 0.112). No unique association was retained between verbal intelligence and verbal creativity.
Centrality indices (Figure 3) further indicated that non-verbal intelligence occupied the most central position within the network, followed by verbal intelligence and figural creativity. In contrast, cultural SES showed relatively low centrality, whereas economic SES exhibited the lowest centrality, reflecting its lack of unique connections with the remaining variables.
Overall, the network analysis largely converged with the SEM findings while providing additional information regarding the organization of the variables. Rather than supporting a single sequential pathway, the network suggested the existence of two highly interconnected domains—intelligence and creativity—linked primarily through non-verbal intelligence and figural creativity. Furthermore, cultural SES, rather than economic SES, emerged as the only socioeconomic component maintaining unique associations with cognitive and creative performance.
4. Discussion
The present study examined the relationships between SES, intelligence, and creativity during early adolescence by adopting a multidimensional approach to SES and combining Structural Equation Modeling (SEM) with network analysis. This methodological approach constitutes a notable advancement in the field, as the vast majority of prior studies have relied on composite or “conglomerate” measures that aggregate distinct socioeconomic indicators without disaggregating their unique effects (e.g., Alcock et al., 2024; Castillo-Vergara et al., 2018; Lu et al., 2024; Yang et al., 2020).
Two primary findings emerged from this investigation:
4.1. Multidimensionality of SES: Cultural Capital Versus Gross Economic Resources
The first fundamental finding indicates that the relationship between socioeconomic background and cognitive-creative functioning is not uniform across the different dimensions of SES. While cultural SES exhibited the most consistent associations with both intelligence and creativity—retaining direct conditional connections with verbal intelligence (rpartial = 0.155) and figural creativity (rpartial = 0.205) within the regularized network—economic SES failed to retain any unique conditional associations after controlling for the remaining variables in the system. Furthermore, family-structure SES (related to household composition) yielded negligible factor loadings and was consequently excluded from the finalized structural model. Bring into account that the relationship between family structure and culture dimension was not significant and showed a negative correlation with the economic dimension. Indeed, larger households may offer additional opportunities for interpersonal interaction, but household size should not be equated with greater cultural or educational capital. Moreover, the socioeconomic meaning of family size may vary across demographic and cultural contexts. In Spain, for example, differences in fertility patterns and household composition across population groups may complicate the interpretation of family size as a straightforward indicator of socioeconomic advantage or disadvantage. In addition, housing access is more difficult for low-income individuals, which may result in bigger household sizes.
The predictive supremacy of cultural capital over purely financial resources aligns with recent empirical literature. At a macro level, international PISA 2022 assessments demonstrate that SES is a consistent predictor of creative thinking (Goecke et al., 2026); however, the Economic, Social, and Cultural Status (ESCS) index utilized by PISA does not measure financial wealth in isolation but rather assigns substantial weight to household cultural and educational resources, as well as home learning practices. Our micro-level findings elucidate this underlying mechanism: consistent with reports by Godfrey-Kalio and Wadi (2025), Parsasirat et al. (2013), and Zhao (2021), the impact of the family environment on creativity is primarily driven by parental educational attainment and sociocultural capital rather than gross monetary income.
These findings converge with the conceptual distinction between material resources and developmental opportunities outlined in the Family Investment Model (Conger & Donnellan, 2007). While family financial assets establish initial material conditions, their cognitive relevance ultimately depends on the extent to which they are translated into concrete opportunities for learning, intellectual exploration, and cultural engagement. This distinction explains why economic SES displayed bivariate correlations with creativity but lost its unique predictive power within the network once cultural variables were controlled for.
When contextualizing our results within the broader literature on SES and creativity, it is essential to address the notable discrepancies reported across prior studies, which diverge in two main directions:
First, why do certain studies fail to observe significant relationships between SES and creativity (e.g., Khan & Kumar, 2025; Kumari, 2012; Rawlings et al., 2025; Steinbüchel et al., 2018)? These non-significant findings can be attributed to methodological factors regarding the nature of the creative tasks employed (specifically, the use of “culture-fair” cognitive tasks that are largely detached from formal academic instruction; Rawlings et al., 2025) or to the equalizing role of the school environment. In contexts with universal, highly equitable educational or early childhood systems, schools act as a compensatory equalizer that mitigates socioeconomic disparities before they manifest as differences in divergent performance.
Second, why do some studies report significant associations with economic factors but not with parental education (e.g., Beniwal & Singh, 2017; Hanh et al., 2022)? This apparent contradiction can be understood by examining the socio-educational contexts of those studies. In developing nations or underserved regions where access to information technology, enriched extracurricular activities, and well-equipped school infrastructure depends strictly on direct private expenditure or tuition fees, family financial standing operates as a primary structural bottleneck and an indispensable baseline threshold for the expression of creative potential.
4.2. Cognitive Architecture and the Relationship Between Intelligence and Creativity
Regarding cognitive architecture, the combination of SEM and network analysis offers an integrated perspective on the interplay between intelligence and creativity. The optimal Structural Equation Model (Model_4) supported the existence of an overarching latent dimension of General Cognition that subsumes both intelligence and creativity. Alternative models forcing a strict separation between both constructs mediated by SES (Model_7) resulted in misspecification and inadmissible parameter estimates.
Concurrently, network analysis revealed a finer-grained conditional structure: although verbal and non-verbal intelligence were strongly interconnected (rpartial = 0.782), and verbal and figural creativity formed their own distinct subsystem (rpartial = 0.478), the sole direct bridge connecting both cognitive domains was established between non-verbal intelligence and figural creativity (rpartial = 0.112).
This specific bridge suggests that the flexible manipulation of non-verbal information and spatial representation constitutes the common cognitive interface between intellectual capability and figural divergent expression. This finding is highly consistent with recent meta-analyses on the intelligence–divergent thinking relationship (Acar et al., 2022; Gerwig et al., 2021), reinforcing the notion that creativity and intelligence represent interconnected yet non-redundant cognitive dimensions.
In this study, the “cognitive desegregation” supposition was not supported, as the associations between the economic dimension of SES and verbal and non-verbal creativity were of similar magnitude. The “hidden talent” hypothesis was not supported either. This may be because hidden talents do exist, but such cases are exceptional and therefore particularly noteworthy. Their visibility may also be amplified by social media, which often highlights stories of self-made individuals from disadvantaged backgrounds.
5. Practical Implications
From a practical perspective, the findings highlight the importance of the family cultural environment in supporting adolescents’ cognitive and creative development. Beyond economic resources, families can provide culturally and cognitively stimulating experiences through reading, conversation, exposure to diverse cultural and artistic activities, encouragement of curiosity and exploration, and opportunities for adolescents to pursue their interests and engage in open-ended activities. Importantly, nowadays (thanks to the advance of technology), many of these experiences do not necessarily require substantial financial resources, suggesting that supporting families in creating culturally enriching home environments may represent a meaningful avenue for fostering cognitive and creative potential. The question that arises then is how to help families initially not interested in culturally stimulating environments? We may think of three exes: community-based cultural mentoring programs (i.e., big-brother or family godfathers that connect the family to cultural events). Decentralizing cultural opportunities (taking culture beyond the museums or specific buildings, bringing cultural activities into underserved communities, street exhibitions, and science divulgators). An additional possibility worth exploring is the use of family-level incentives to encourage cultural engagement; such initiatives could offer modest benefits to parents or caregivers who facilitate their children’s participation in reading, artistic, or other culturally enriching activities. Rather than rewarding children’s academic performance, these incentives would aim to encourage parental involvement and reduce barriers to initial participation (i.e., one dollar per book read; cafeteria points like the Starbucks points system).
Family-oriented cultural initiatives could adopt a gradual approach. At an initial level, incentives could encourage parents or caregivers to facilitate their children’s access to cultural and educational opportunities, even when adults themselves have limited interest in participating. A more ambitious level would involve promoting shared cultural experiences between parents and children, potentially encouraging the gradual incorporation of such activities into everyday family life.
Schools and educational institutions can complement this role by promoting family–school initiatives that provide families with accessible resources and guidance for supporting intellectual and creative engagement at home, while also ensuring equitable access to cultural, artistic, scientific, and enrichment experiences within and beyond the school. In this regard, Bernal et al. (2022) highlight the relevance of socioeconomic context to students’ cognitive abilities, drawing attention to the broader educational environments in which these associations emerge. School contexts may also differ in their socioeconomic and cultural composition, partly reflecting families’ resources and educational preferences. Accordingly, schools serving socioeconomically disadvantaged communities may play a particularly important role in broadening access to enrichment opportunities that are less readily available in students’ home environments. As stated in the literature review by examining Goecke et al.’s (2026) work, countries that offer more equal schools tend to show smaller correlations between children’s creativity and their family socioeconomic background.
Finally, because observed cognitive and creative performance may partly reflect unequal opportunities for development and expression, identification and assessment practices should take students’ socioeconomic and cultural contexts into account to reduce the risk of overlooking potential among those from less advantaged backgrounds.
6. Limitations and Future Directions
Several limitations should be considered when interpreting the present findings. First, the cross-sectional design precludes causal or developmental inferences regarding the relationships between SES, intelligence, and creativity. Longitudinal research is needed to determine how these associations evolve across adolescence and whether changes in family socioeconomic and cultural circumstances are accompanied by changes in cognitive and creative functioning. Furthermore, and in line with parental-styles research (Tucker-Drob & Harden, 2012), child characteristics may encourage different courses of action from parents (i.e., a creative child may demand more cognitive stimulus from parents than a non-creative child). Second, although the multidimensional operationalization of SES represents a strength of the study, the indicators used capture only selected aspects of the family socioeconomic environment; for instance, no data on parents’ occupation status was used. Future research should incorporate more comprehensive and objective indicators of economic and cultural resources, together with direct measures of the experiences through which these resources may be translated into developmental opportunities.
The relatively modest sample size and restricted age range also warrant caution regarding the generalizability and stability of the SEM and regularized network estimates. Replication in larger and more socioeconomically and culturally diverse samples would allow more robust examination of the observed conditional associations. Moreover, the findings are necessarily dependent on the specific measures of intelligence and creativity employed; consequently, the distinctive associations of cultural SES with verbal intelligence and figural creativity should be replicated using alternative measures and across different domains of creative functioning.
As the sample size was limited, the “cognitive desegregation” hypothesis could not be fully investigated because it implies multiplying the variables for analysis.
A particularly relevant direction for future research is to examine the mechanisms connecting family resources with developmental opportunities. Longitudinal and mediation designs could investigate whether cognitive stimulation at home, cultural participation, access to books and learning materials, extracurricular activities, parent–adolescent intellectual engagement, and opportunities for exploration and creative expression explain how socioeconomic and cultural resources become associated with cognitive and creative outcomes. Such research would help determine whether it is the availability of resources per se or the developmental opportunities into which those resources are translated that is most relevant to the development and expression of adolescents’ cognitive and creative potential.
7. Conclusions
The principal conclusions of this investigation can be summarized as follows:
The relationship between socioeconomic status and adolescents’ cognitive and creative abilities cannot be reduced to financial family resources; rather, it fundamentally depends on household cultural capital.
Because economic assets influence cognitive development primarily when converted into stimulating opportunities, educational policies must prioritize the creation of culturally enriched school environments that democratize access to artistic events, design tasks, libraries, and digital tools, thereby compensating for home-based sociocultural disparities.
Given that non-verbal intelligence and figural creativity serve as the central bridging pathway across the cognitive network, instructional practices grounded in visual thinking and open-ended graphical problem-solving represent an optimal strategy to cultivate flexible cognition, particularly for students originating from socio-culturally disadvantaged backgrounds.
Supplementary Materials
The following supporting information can be downloaded at: https://www.mdpi.com/article/10.3390/educsci16111818/s1, Table S1: Summary of previous studies on the relationship between creativity and socioeconomic status (SES).
Author Contributions
Conceptualization, M.F.-P.; methodology, M.F.-P., C.F.; software, M.F.-P., C.F.; validation, C.F.; formal analysis, M.F.-P., C.F.; investigation, M.F.-P., C.F. and R.M.P.; data curation, M.F.-P., C.F.; writing—original draft preparation, M.F.-P., C.F. and R.M.P.; writing—review and editing, M.F.-P., C.F.; visualization, R.M.P., C.F.; supervision, C.F., R.M.P.; project administration, M.F.-P., C.F. and R.M.P. All authors have read and agreed to the published version of the manuscript.
Funding
This research received no external funding.
Institutional Review Board Statement
The study was conducted in accordance with the Declaration of Helsinki, and approved by the Ethics Committee of Universidad de Murcia (ACTA28/2026/CEI, 10 February 2026).
Informed Consent Statement
Informed consent was obtained from all subjects involved in the study.
Data Availability Statement
The data supporting the report results are publicly available on the Open Science Framework (OSF) at https://doi.org/10.17605/OSF.IO/4RZQY.
Conflicts of Interest
The authors declare no conflict of interest.
Appendix A
To derive a composite measure of creativity, a principal component analysis (PCA) was conducted using the standardized scores (z scores) from the PIC and TTCT creativity measures. A single-component solution was specified to capture the shared variance across the 22 creativity indicators. The extracted component had an eigenvalue of 6.90 and accounted for 31.37% of the total variance. Table A1 presents the component loadings and communalities for each indicator.
Table A1.
Principal components analysis on creativity dimensions of PIV and TTCT.
Figure A1.
Represents the bootstrap from the network analysis.
Analysis about the internal structure on the SES Socioeconomic-status questionnaire.
Table A2.
Categorical Principal Components Analysis Results.
Table A3.
Correlation Between Socio-Economic Status Dimensions.
- Use of Artificial Intelligence
Generative artificial intelligence tools were used solely as supportive tools during the preparation of this manuscript. ChatGPT (GPT-6) (OpenAI) was consulted to assist in locating publicly available 2022 gross domestic product (GDP) per capita data for countries participating in PISA and to facilitate its comparison with country-level creative-thinking data. All data sources, extracted values, data matching procedures, and resulting analyses were independently checked and verified by the authors.
ChatGPT was also used to provide technical assistance with R programming, including identifying minor syntax issues (e.g., missing commas), suggesting code modifications, and clarifying the specification of graphical outputs. The authors independently selected the statistical procedures, wrote and reviewed the final scripts, executed all analyses, verified the outputs, and interpreted the findings.
Gemini (Google) was used to support the translation of selected manuscript sections into academic English. The authors subsequently reviewed, edited, and approved all translated text and remain fully responsible for its accuracy, originality, scientific content, and adherence to the journal’s standards.
No artificial intelligence tool was used to make research decisions, interpret results independently, generate original data, determine authorship, or replace the authors’ scholarly judgment. The authors assume full responsibility for the integrity of the work.
| Rol oficial en inglés | QUIEN | Cuándo marcarlo |
| Conceptualization | MF | Planteamiento de la idea, pregunta, objetivos generales, hipótesis o marco conceptual |
| Methodology | MF; CF | Diseño metodológico, selección de medidas, diseño de análisis, creación de modelos |
| Software | MF; CF | Programación, desarrollo o implementación de código; por ejemplo, scripts propios en R |
| Validation | CF | Comprobación de resultados, reproducibilidad, consistencia de análisis o verificación de procedimientos |
| Formal analysis | MF; CF | Aplicación de análisis estadísticos, matemáticos o computacionales a los datos |
| Investigation | MF; CF; RP | Recogida de datos, ejecución del estudio, trabajo de campo, experimentos o búsqueda/obtención sistemática de evidencia |
| Resources | X | Provisión de materiales, instrumentos, muestras, acceso a bases de datos, equipamiento o recursos informáticos |
| Data curation | MF; CF | Organización, depuración, codificación, documentación, anonimización o mantenimiento de la base de datos y metadatos |
| Writing—original draft | MF; RP; CF | Elaboración inicial sustantiva del manuscrito, incluida la traducción sustantiva |
| WrWriting—reviewnd editing | MF; CF | Revisión crítica, comentarios, reescritura, edición y corrección del manuscrito |
| Visualization | RP; CF | Tablas, figuras, gráficos, diagramas, presentación visual de resultados |
| Supervision | CF; RP | Dirección científica, liderazgo académico, mentoría y supervisión de la ejecución |
| Project administration | MF; CF, RP | Coordinación operativa: cronograma, reuniones, tareas, logística y seguimiento |
| Funding acquisition | X | Obtención competitiva de fondos destinados específicamente al estudio |
References
- Acar, S., Tadik, H., Uysal, R., Myers, D., & Inetas, B. (2022). Socio-economic status and creativity: A meta-analysis. The Journal of Creative Behavior, 57(1), 138–172. [Google Scholar] [CrossRef] [Scilit]
- Alcock, S., Ferreira-Correia, A., Israel, N., & Cockcroft, K. (2024). The relationship between fluid intelligence, divergent and convergent thinking in older adults: The moderating effects of demographic and contextual variables. Thinking Skills and Creativity, 53, 101557. [Google Scholar] [CrossRef] [Scilit]
- Artola, T., Baraca, J., Mosteiro, P., Martín, C., Ancillo, I., & Poveda, B. (2008). PIC-J: Prueba de Imaginación Creativa para Adolescentes y Jóvenes. TEA Ed. [Google Scholar]
- Benedek, M., Jauk, E., Sommer, M., Arendasy, M., & Neubauer, A. C. (2014). Intelligence, creativity, and cognitive control: The common and differential involvement of executive functions in intelligence and creativity. Intelligence, 46, 73–83. [Google Scholar] [CrossRef] [Scilit]
- Beniwal, P., & Singh, C. K. (2017). Role of socio-economic status in enhancing adolescents’ creative thinking. International Journal of Humanities and Social Sciences, 6(1), 37–42. [Google Scholar]
- Bennett, G., Seashore, G., & Wesman, A. (2000). DAT-5, test de aptitudes diferenciales. TEA Ediciones S.A. [Google Scholar]
- Bernal, A., Ferrando, F., & Sainz, M. (2022). Influencia del contexto socioeconómico en la capacidad cognitiva de una muestra de educación secundaria. Sobredotação, 17, 99–114. [Google Scholar]
- Berzenski, S. R., LaSalle-Castro, R., Marcelo, A. K., & Yates, T. M. (2022). The development of divergent thinking despite poverty: Moderating factors. Cognitive Development, 64, 101244. [Google Scholar] [CrossRef] [Scilit]
- Castillo-Vergara, M., Galleguillos, N. B., Cuello, L. J., Alvarez-Marin, A., & Acuña-Opazo, C. (2018). Does socioeconomic status influence student creativity? Thinking Skills and Creativity, 29, 142–152. [Google Scholar] [CrossRef] [Scilit]
- Conger, R. D., & Donnellan, M. B. (2007). An interactionist perspective on the socioeconomic context of human development. Annual Review of Psychology, 58, 175–199. [Google Scholar] [CrossRef] [Scilit]
- Connolly, F. F., & Lindh, A. (2025). Socioeconomic status, need fulfillment, and subjective well-being. Journal of Happiness Studies, 26(6), 108. [Google Scholar] [CrossRef] [Scilit]
- Csikszentmihalyi, M. (1997). Flow and creativity. Namta Journal, 22(2), 60–97. [Google Scholar]
- Cumming, G. (2014). The New Statistics: Why and how: Why and how. Psychological Science, 25(1), 7–29. [Google Scholar] [CrossRef] [Scilit]
- Diamond, A. (2012). Executive functions. Annual Review of Psychology, 64, 135–168. [Google Scholar] [CrossRef] [Scilit]
- Epskamp, S., Borsboom, D., & Fried, E. I. (2018). Estimating psychological networks and their accuracy: A tutorial paper. Behavior Research Methods, 50(1), 195–212. [Google Scholar] [CrossRef] [Scilit]
- Epskamp, S., Cramer, A. O. J., Waldorp, L. J., Schmittmann, V. D., & Borsboom, D. (2012). qgraph: Network visualizations of relationships in psychometric data. Journal of Statistical Software, 48(4), 1–18. [Google Scholar] [CrossRef] [Scilit]
- Feist, G. J. (2007). The psychology of science and the origin of the scientific mind. Yale University Press. [Google Scholar]
- Firkowska-Mankiewicz, A. (2011). Adult careers: Does childhood IQ predict later life outcome? Journal of Policy and Practice in Intellectual Disabilities, 8(1), 1–9. [Google Scholar] [CrossRef] [Scilit]
- Gardner, H. (1997). Extraordinary minds: Portraits of exceptional individuals and an examination of our extraordinariness. Basic Books. [Google Scholar]
- Gerwig, A., Miroshnik, K., Forthmann, B., Benedek, M., Karwowski, M., & Holling, H. (2021). The relationship between intelligence and divergent thinking—A meta-analytic update. Journal of Intelligence, 9(2), 23. [Google Scholar] [CrossRef] [Scilit]
- Gil Flores, J. (2013). Medición del nivel socioeconómico familiar en el alumnado de Educación Primaria. Revista de Educación, 362, 298–322. [Google Scholar]
- Gladwell, M. (2008). Outliers: The story of success. Penguin UK. [Google Scholar]
- Godfrey-Kalio, I. A., & Wadi, B. W. (2025). Parental socio-economic status on the development of creative and critical thinking skills among preschoolers in early childhood centres in Rivers State. KING-UK International Journal of Academic Anthology, 9(1), 139–154. [Google Scholar]
- Goecke, B., Benedek, M., Diedrich, J. G., Forthmann, B., Patzl, S., & Weiss, S. (2026). Being female and being well-situated implies higher performance on creative thinking tests: Evidence across 62 countries from PISA 2022. Thinking Skills and Creativity, 59, 101963. [Google Scholar] [CrossRef] [Scilit]
- Hanh, H. P., Dien, B. T., Lien, N. H., Lan, T. T. N., Thai, L. V., & Vinh, L. A. (2022). The role of school and family education in the development of creative thinking for youths: Evidence from Vietnamese context. Journal of Educational and Social Research, 12(2), 34–48. [Google Scholar] [CrossRef] [Scilit]
- Herranz Torres, N. (2018). Análisis de la relación entre clase social y creatividad en adolescentes. TALINCREA. Revista Talento, Inteligencia y Creatividad, 4(8), 28–39. [Google Scholar] [CrossRef] [Scilit]
- Hevey, D. (2018). Network analysis: A brief overview and tutorial. Health Psychology and Behavioral Medicine, 6, 301–328. [Google Scholar] [CrossRef] [Scilit]
- Kaltsounis, B. (1974). Race, socioeconomic status, and creativity. Psychological Reports, 35, 164–166. [Google Scholar] [CrossRef] [Scilit]
- Khan, W., & Kumar, S. (2025). Effect of smartphone usage, and socio-demographic factors on creativity of students. The International Journal of Indian Psychology, 13(2), 2985–2992. [Google Scholar] [CrossRef]
- Kumari, P. (2012). Problem solving and creative thinking ability among high school children [Master’s thesis, University of Agricultural Sciences]. [Google Scholar]
- Kupczyszyn, K. H., Filippetti, V. A., & Oros, L. (2024). Socioeconomic status effects on children’s creativity: The mediating role of executive functions. Thinking Skills and Creativity, 51, 101437. [Google Scholar] [CrossRef] [Scilit]
- Lawson, G. M., Hook, C. J., & Farah, M. J. (2018). A meta-analysis of the relationship between socioeconomic status and executive function performance among children. Developmental Science, 21(2), e12529. [Google Scholar] [CrossRef] [Scilit]
- Li, Y., Yang, H., & Luo, L. (2021). Poverty exposure and cognitive abilities of children in rural China: Causation and the roles of family investments. Children and Youth Services Review, 121, 105747. [Google Scholar] [CrossRef] [Scilit]
- Lu, Z., Ding, Y., & Nie, Y. (2024). How does family socioeconomic status affect creativity? The role of creative self-efficacy and critical thinking disposition. Current Psychology, 43(6), 5674–5681. [Google Scholar] [CrossRef] [Scilit]
- Merton, R. K. (1968). The Matthew effect in science. Science, 159(3810), 56–63. [Google Scholar] [CrossRef] [Scilit]
- Munir, J., Faiza, M., Jamal, B., Daud, S., & Iqbal, K. (2023). The impact of socioeconomic status on academic achievement. Journal of Social Sciences Review, 3(2), 695–705. [Google Scholar] [CrossRef] [Scilit]
- Parsasirat, Z., Foroughi, A., Yusooff, F., Subhi, N., Nen, S., & Farhadi, H. (2013). Effect of socioeconomic status on emersion adolescent creativity. Asian Social Science, 9(4), 105. [Google Scholar] [CrossRef] [Scilit]
- Prieto Sánchez, M. D. P., Martínez, O. L., García, C. F., & García, M. R. B. (2003). Adaptación de la prueba figurativa del test de pensamiento creativo de Torrance en una muestra de alumnos de los primeros niveles educativos. Revista de Investigación Educativa, 21(1), 201–213. [Google Scholar]
- Rakesh, D., Flournoy, J. C., & McLaughlin, K. A. (2025a). Associations between socioeconomic status and mental health trajectories during early adolescence: Findings from the adolescent brain cognitive development study. JCPP Advances, 5(4), e70001. [Google Scholar] [CrossRef] [Scilit]
- Rakesh, D., Lee, P. A., Gaikwad, A., & McLaughlin, K. A. (2025b). Annual research review: Associations of socioeconomic status with cognitive function, language ability, and academic achievement in youth: A systematic review of mechanisms and protective factors. Journal of Child Psychology and Psychiatry, 66(4), 417–439. [Google Scholar] [CrossRef] [Scilit]
- Rawlings, B. S., Basu, A., Di Bernardo, A., Craton, W., Edmonds, K., Foulkes, E., Greenwood, H., Johnstone, E., Keag, S., Shen, M., & Vella, E. R. (2025). Creative minds, equal ground: No socioeconomic gaps in UK children’s divergent and convergent thinking. Acta Psychologica, 261, 105811. [Google Scholar] [CrossRef] [Scilit]
- Rohwer, W. D., Jr. (1971). Learning, race, and school success. Review of Educational Research, 41(3), 191–210. [Google Scholar] [CrossRef]
- Runco, M. A., & Jaeger, G. J. (2012). The standard definition of creativity. Creativity Research Journal, 24(1), 92–96. [Google Scholar] [CrossRef] [Scilit]
- Sak, U., Durdağı, S. D., & Genç, A. (2026). Braided pathways: Parental education and occupation as parallel channels to children’s intelligence. Intelligence, 115, 102002. [Google Scholar] [CrossRef] [Scilit]
- Steinbüchel, N., Meeuwsen, M., Poinstingl, H., & Kiese-Himmel, C. (2018). The test for creative thinking–Drawing production test in preschool children with predominantly migration background—Psychometrics of the German TCT-DP. Creativity Research Journal, 30(2), 195–204. [Google Scholar] [CrossRef] [Scilit]
- Sternberg, R. J., & Lubart, T. I. (1999). The concept of creativity: Prospects and paradigms. In R. J. Sternberg (Ed.), Handbook of creativity (pp. 3–15). Cambridge University Press. [Google Scholar]
- Torrance, E. P. (1974). The torrance tests of creative thinking-normstechnical manual research edition-verbal tests, forms a and B-figural tests, forms A and B. Personnel Press. [Google Scholar]
- Tucker-Drob, E. M., & Harden, K. P. (2012). Early childhood cognitive development and parental cognitive stimulation: Evidence for reciprocal gene–environment transactions. Developmental Science, 15(2), 250–259. [Google Scholar] [CrossRef] [Scilit]
- Warden, P. G., & Prawat, R. S. (1975). Convergent and divergent thinking in black and white children of high and low socioeconomic status. Psychological Reports, 36(3), 715–718. [Google Scholar] [CrossRef] [Scilit]
- Wrightson, C. (2019). The creative cognitive profiles of students from different socioeconomic environments [Ph.D. thesis, Johns Hopkins University]. [Google Scholar]
- Yang, Y., Xu, X., Liu, W., & Pang, W. (2020). Hope and creative self-efficacy as sequential mediators in the relationship between family socio-economic status and creativity. Frontiers in Psychology, 11, 438. [Google Scholar] [CrossRef] [Scilit]
- Zhao, Y. (2021). A comparison of the creative thinking abilities among urban, migrant, and rural adolescents in Western China [Ph.D. thesis, The Pennsylvania State University]. [Google Scholar]

Disclaimer/Publisher’s Note: The statements, opinions and data contained in all publications are solely those of the individual author(s) and contributor(s) and not of MDPI and/or the editor(s). MDPI and/or the editor(s) disclaim responsibility for any injury to people or property resulting from any ideas, methods, instructions or products referred to in the content. |
© 2026 by the authors. Licensee MDPI, Basel, Switzerland. This article is an open access article distributed under the terms and conditions of the Creative Commons Attribution (CC BY) license.