


Abstract
Agricultural cooperatives in developing economies struggle with capital access and typically depend on subsidized credit with rigid repayment schedules that create vulnerability during low-production cycles. In this paper, we present a mathematical framework implemented through a smart contract to tokenize cooperative capital. Our mathematical framework uses magnified accumulators (scaled accumulator variables) to maintain temporal fairness, allocating dividends proportionally based on token holding periods through correction factors. The dividend distribution model operates with computational complexity, regardless of cooperative size. The CooperativeToken smart contract combines ERC20 standards with automated dividend distribution, democratic governance mechanisms, and a hybrid payment architecture supporting both cryptocurrency and fiat transactions. Deployment verification and a gas analysis demonstrate operational viability with consistent performance and minimal transaction costs, enabling scalability from small to large cooperatives. The proposed system offers agricultural cooperatives a debt-free alternative to conventional financing, democratizing access to tokenized capital structures that were previously restricted to large agribusinesses. While the model is validated via Ethereum Sepolia testnet simulation, real-world deployment and field testing in active cooperatives remain necessary to confirm practical feasibility. This study provides the algorithmic and economic foundation for such pilots.
1. Introduction
Agricultural cooperatives are a key organizational structure for small farmers, as they facilitate collective bargaining, infrastructure sharing and economies of scale by bringing together several farmers. In Brazil, cooperatives play an important role in the agribusiness sector, as they involve more than one million small farmers who contribute to national agricultural production and generate annual revenues exceeding billions in local currency (Empresa Brasileira de Pesquisa Agropecuária (Embrapa), 2024; Organização das Cooperativas Brasileiras [OCB], 2024). Agricultural cooperatives, despite their economic importance, face restrictions on access to capital which constrain productivity improvements, investment in modern infrastructure and the well-being of their members.
Agricultural financing in Brazil depends mainly on government-subsidized credit programs, particularly the National Plan for the Strengthening of Family Agriculture (Programa Nacional de Fortalecimento da Agricultura Familiar—PRONAF), which provides loans at lower than market interest rates and with multi-year repayment periods (Climate Policy Initiative/Pontifical Catholic University of Rio de Janeiro [CPI/PUC-Rio], 2023; Organisation for Economic Co-Operation and Development [OECD], 2023). While PRONAF has expanded credit access, its fixed-rate debt structures create vulnerability during years of low production, exacerbated by regional inequalities and climate change (Climate Policy Initiative [CPI/PUC-Rio], 2023; Moreira-Dantas et al., 2023). The mismatch between the variability of agricultural production and the rigidity of debt obligations creates a systemic fragility for smallholder agricultural cooperatives.
Capital-based collective funding offers a viable alternative. Members contribute capital in exchange for shares and receive dividends tied to cooperative performance instead of fixed interest. When productivity drops, dividends can be reduced or suspended without triggering default, yet members benefit fully from a strong harvest or favorable markets (da Silva et al., 2025). However, this capital-based model often relies on the manual recording of members’ shares, unclear dividend calculations, and cumbersome administrative processes, leading to disputes, limited liquidity for departing members, and obstacles to external investment (Chaddad & Cook, 2004; Hendrikse & Bijman, 2002).
Digital transformation initiatives have partially addressed these administrative burdens: cooperative management software and enterprise resource planning (ERP) systems have improved record-keeping and reduced manual errors (Cao et al., 2025; Zheng et al., 2025). However, these solutions remain centralized and trust-dependent, relying on intermediaries to maintain data integrity, with no cryptographically verifiable proof of ownership or transparent audit trail accessible to members or external partners. This opacity perpetuates financing barriers, as potential investors and lenders cannot independently verify share registers or dividend histories.
Blockchain technology and smart contracts address these structural limitations while maintaining cooperative governance principles. Immutable distributed ledgers provide cryptographically verifiable ownership records, smart contracts automate dividend calculations and transfers without intermediaries, and on-chain transparency enables real-time auditing by members and partners (Gurusamy et al., 2025; Kumarathunga et al., 2022). Beyond cooperative contexts, the global growth of asset tokenization with over $25 billion tokenized by mid-2025 demonstrates that on-chain representation of real-world economic rights is technically mature and increasingly adopted (Mafrur, 2025).
In this article, we propose a tokenized cooperative financing system on a blockchain, designed specifically for agricultural cooperatives integrated into digital farming environments, such as Embrapa’s Semear Digital project1. The proposed system makes three fundamental contributions: (i) a mathematical framework for dividend distribution with a computational complexity of , independent of the number of members; (ii) a detailed implementation of smart contracts that combine payments in crypto assets and traditional fiat methods (such as bank transfers and credit card payments); and (iii) governance mechanisms that preserve the democratic principles inherent in cooperatives while leveraging the transparency, immutability, and automation offered by blockchain technology.
The remainder of this paper is structured as follows. Section 2 reviews related work on blockchain-based finance applied to agriculture. Section 3 presents the mathematical framework for complexity dividend distribution. Section 4 details the Caconde coffee cooperative case study with financial projections and comparative analysis. Section 5 describes the smart contract implementation, gas cost analysis, and deployment to Ethereum Sepolia testnet, and finally, Section 6 provides the conclusions.
2. Related Work
In this article, we bring together three fields of research: (i) decentralized finance (DeFi) systems on blockchain, (ii) the design of low-complexity smart contracts for proportional dividend distribution, and (iii) cooperative financing models in the agricultural sector. Through a review of the state of the art, we highlight the current limitations that support our proposal.
2.1. Blockchain and Asset Tokenization
The literature on asset tokenization using blockchain primarily focuses on markets with established digital infrastructure. For example, (Cong et al., 2025; Zetzsche et al., 2020) analyze the European regulatory framework (MiCA) for the custody of tokenized digital assets, while (Mafrur, 2025) shows that $25.3 billion in assets have been tokenized as of June 2025. This adoption is concentrated in US Treasury bonds (78%), with secondary markets representing only 2% of the volume in private credit.
These studies assume infrastructure that is absent from small and medium-sized agricultural cooperatives, which lack publicly verifiable ownership records, liquid secondary markets, and automated transfers. Furthermore, cooperative share management operates through fragmented processes such as non-integrated spreadsheets, duplicate records without cryptographic verification, and manual distribution of quotas and dividends, hindering real-time transparency. Our work addresses this gap by proposing a tokenization system using smart contracts designed for the operational conditions of agricultural cooperatives comprising small farmers.
2.2. Dividend Distribution Algorithms
Dividend distribution algorithms are critical for the scalability of smart contracts that manage tokenized capital (Li et al., 2026). The magnified accumulator pattern, cited in (Johnson, 2018) and widely adopted in Ethereum tokens, achieves a complexity of by maintaining a continuously updated global accumulator during distributions and adjusting correction factors during transfers. This optimization avoids iteration over all token holders.
Furthermore, recent works such as (Barakbayeva et al., 2025; Yanovich et al., 2025) confirm the scalability advantages, also analyzing gas costs for accumulator-based dividend distribution smart contracts. In this paper, we extend the magnified accumulator pattern to cooperative contexts, incorporating time equity.
2.3. Agricultural Finance and Cooperatives
The structure and functioning of agricultural cooperatives have been the subject of research within development economics. For example, Hendrikse and Bijman (2002) analyzes the organizational structures of cooperatives and identifies share capitalization as a persistent challenge due to members’ illiquidity and the reluctance of external investors. (Cao et al., 2025; Zheng et al., 2025) highlight the need for digital transformation to improve financing and operational efficiency. These studies highlight the role of innovative financing mechanisms that preserve member control while attracting capital, particularly through the adoption of technology for resilience and market access.
Recent studies in Brazil show that PRONAF increases access to credit for small family farmers, but it generates financial fragility when fixed debt structures are combined with regional inequalities (Faria de Abreu Campos et al., 2024; Souza Machado et al., 2024). Credit allocation disproportionately favors the south, and spatial dependencies restrict access in the Amazon (Moreira-Dantas et al., 2023).
Although digital infrastructure projects like Embrapa’s Semear Digital expand connectivity and precision agriculture tools in Brazilian cooperatives (EMBRAPA Agricultura Digital, 2024), these programs focus on production technology (da Silva et al., 2025). Financial innovations, such as tokenized capital, decentralized mechanisms, or performance-based models, remain absent from digital agriculture initiatives. This gap persists despite the infrastructure that could support blockchain-based cooperative finance.
2.4. Research Gap and Contribution
Despite advances in asset tokenization, dividend distribution algorithms, and cooperative structures, no previous work has integrated these domains for small-scale agricultural cooperatives, combining democratic governance, time equity in dividend distribution, and practical operational constraints.
This work addresses this gap through the following:
- Mathematical Framework: We formalize the extension of the magnified accumulator pattern with time equity guarantees for cooperative capital systems, achieving dividend distribution while ensuring the accuracy of accumulated dividends during token transfers.
- Design for Agricultural Cooperatives: We develop a tokenized capital system specifically for small producer cooperatives, integrating democratic governance and hybrid payment methods (cryptocurrency/fiat) adapted to different levels of technical literacy.
- Verifiable Implementation: We provide deployed smart contracts with essential operational features (wallet recovery, fiat integration, transfer restrictions) to ensure viability in real-world cooperative environments.
Recent information systems research has examined barriers to blockchain adoption in organizational contexts. Studies on manager resistance to blockchain systems highlight concerns over loss of control and regulatory uncertainty, factors directly relevant to cooperative leadership (Walsh et al., 2021). Similarly, research in the AEC industry identifies interoperability and governance as critical success factors for blockchain deployment (Wang et al., 2024). More broadly, incorporating blockchain technology into information systems research requires attention to usability, institutional trust, and decentralized governance mechanisms (Dubey et al., 2023). This study engages with these themes by proposing democratic governance workflows (Section 5.3) and wallet recovery mechanisms (Section 5.3) that address manager and member concerns.
Furthermore, emerging work on decentralized autonomous organizations (DAOs) (Han et al., 2025) and member-controlled cooperative platforms provides governance models that can inform future iterations of tokenized cooperatives. The AgriTrust framework (Bergier et al., 2026) offers a complementary approach, integrating semantic governance with verifiable credentials for agricultural data sharing. While AgriTrust focuses on the data trust and fragmentation problem for compliance (e.g., EUDR), our work addresses a distinct but related gap: the economic and algorithmic mechanisms for tokenizing cooperative capital. Together, these approaches suggest a converging research agenda where semantic governance and algorithmic finance could be integrated to create both trustworthy and liquid cooperative capital markets.
3. Mathematical Model for Automated Dividend Distribution
In this section, we present a mathematical framework for the proportional and scalable distribution of dividends in tokenized cooperative shares. We propose a model that operates using smart contracts on an EVM-compatible blockchain, automating the distribution of profits among members in a transparent and immutable manner.
3.1. General Proportional Dividend Distribution Mechanism
Consider a cooperative collectively owning an agricultural processing plant, , tokenized through fungible ERC-20 tokens managed by smart contract on an EVM blockchain. Each token represents fractional ownership of , available for acquisition by small producers, local investors, and other stakeholders.
We define each token as a fixed capital unit. Using Brazilian real as reference, we establish the relationship 1 token = R$1.00. This direct equivalence simplifies economic interpretation for members unfamiliar with digital assets by linking token value directly to tangible capital contributions. All model variables use these nominal token units, preserving financial intuition while maintaining on-chain precision.
3.1.1. System State Variables
Table 1 defines the state variables for dividend distribution. We structure the token economy around a fixed total supply, , representing the initial collective investment needed to build and equip the processing facility. The smart contract holds a time-varying reserve, , for infrastructure upgrades and emergency maintenance.
Table 1.
Core system state variables.
The tokens circulating among members at time t are given by:
Individual holdings can change over time. Tokens may be transferred among members in secondary markets, issued via additional capital calls, or adjusted when new members join or existing ones leave the cooperative.
The net profit corresponds to revenue less operating costs during the period t. We allocate a fraction, , as dividends for token holders, retaining for reserves and improvements; thus, the total dividend pool at time t is given by:
3.1.2. Dividend Distribution Algorithm
Dividends are distributed proportionally to token holdings. Thus, for member i at time t, the dividend entitlement is given by:
Proportional dividend allocation aligns returns directly with each member’s capital contribution. The cooperative reserve automatically handles reinvestment, while the system adapts to membership changes and token transfers without reconfiguration.
We designed the system to work with any commodity, location, or currency. It requires meeting three conditions: (i) net profit must be reliably measured and verified, either through oracles or cooperative accounting systems; (ii) token ownership must accurately reflect members’ equitable capital participation; and (iii) the dividend distribution policy must be collectively agreed upon and immutably encoded in smart contract .
3.1.3. Return on Investment Under Constant Holdings
We now derive a closed-form expression for return on investment (ROI) under the simplifying assumption of constant token holdings. This baseline scenario serves for cooperative financial planning, while dynamic token adjustments are discussed in Section 3.1.5.
Consider member i, who invests at time , where is the initial token price. Maintaining a fixed balance of tokens over T periods, the member receives cumulative dividends:
To obtain a tractable expression, we further assume a constant circulating supply, , and a geometric growth in net profit as:
where is the base net profit for the first year, and reflects annual operational improvements. This assumption is standard in agricultural investment evaluation (OECD, 2022). Thus, Equation (4) simplifies to:
On the other hand, the return on investment (ROI) is defined as:
where Equation (7) shows that the ROI does not depend on , that is, although absolute dividends scale with token holdings, the percentage return is the same for everyone. For example, a member with 1000 tokens gets the same ROI as one with 100,000, equally benefiting investors of any size. This reinforces democratic principles and simplifies financial projections.
3.1.4. Efficient Dividend Accumulator Algorithm
Iterating over n token holders to distribute dividends has a complexity of , which is impractical on a blockchain due to gas costs and block limits as the cooperative grows. To avoid this, we adopted the magnified accumulator pattern, achieving a complexity of through a continuously updated global accumulator during distributions and individual correction factors adjusted during token transfers.
Definition 1
(Global Dividend Accumulator). Let denote the scaled cumulative dividend per token, which tracks total dividends distributed per circulating token up to time t. To enable high-precision fixed-point arithmetic on the EVM (which lacks native floating-point operations), dividends are scaled by factor of . The accumulator updates as:
which expands recursively to:
Definition 2
(Individual Dividend Entitlement). At time t, the cumulative dividend entitlement for member i is:
where is an adjustment term that corrects for changes in token ownership over time (e.g., transfers, issuances, or exits). The mechanism behind is detailed in Section 3.1.5.
Definition 3
(Withdrawable Dividends). The amount that member i can withdraw at time t is the difference between their total entitlement and what they have already claimed:
where are the accumulated dividends claimed by member i. After withdrawal:
3.1.5. Temporal Adjustment for Dynamic Token Holdings
When one member transfers tokens to another, dividends must be allocated equitably; that is, the sender retains dividends until the time of transfer, and the recipient earns them only from the time of acquisition. Without this correction, the recipient could claim dividends from before owning the tokens.
Definition 4
(Temporal Adjustment Term). We maintain an integer adjustment term, , per member, initialized to zero. Thus, when member a transfers τ tokens to member b at time t, the adjustment terms are updated as:
This preserves the sender’s past rights and prevents improper claims by the receiver.
Theorem 1
(Total Dividends Conservation). At any time, t, the sum of dividend rights plus dividends claimed equals the total dividends distributed:
Proof.
See Appendix A. □
This conservation property guarantees that token transfers do not create or destroy dividend rights; they only redistribute them, maintaining accounting consistency and auditability.
3.1.6. Net Profit from Operations
The dividend mechanism uses the cooperative’s net profit, , whose calculation varies, depending on the commodity, method, and cost structure. However, follows standard accounting principles given by:
where is the operating income (processing fees, value-added services), and is the total operating costs (fixed and variable) in period t. For long-term ROI projections, we model the time dynamics of profits according to Equation (5).
3.1.7. Robustness Analysis: Extreme Scenarios
The dividend mechanism assumes positive profits and stable token holding patterns under normal operation. We examine three extreme scenarios, deriving outcomes from the mathematical invariants in Theorem 1 and the adjustment mechanism in Equations (13) and (14).
(i) Negative profits (). When the cooperative incurs a net loss, Equation (2) sets because would be negative. No dividends are distributed, the accumulator does not update, and members cannot withdraw dividends. This preserves the cooperative’s capital base without requiring additional member contributions. The system remains in a consistent state, awaiting future profitable periods.
(ii) Mass token transfers (e.g., 40% of circulating supply moved simultaneously). From the conservation property in Theorem 1 (), mass transfers preserve dividend fairness without double-counting. For each transfer of tokens from member a to b, Equations (13) and (14) increase by and decrease by the same amount. Summing over arbitrary transfer patterns, the net change to remains zero; consequently, from Equation (10) is invariant under arbitrary transfer patterns, and no dividend rights are created or destroyed. Gas costs scale linearly with the number of transfer events, not with the token amount, because each transfer triggers the same _update hook, regardless of .
(iii) Membership surge (e.g., 200% increase within one cycle). New members receive tokens from the reserve or through new issuance with initialized. The circulating supply updates to reflect the new total, so subsequent distributions in Equation (8) share proportionally among all holders. Because and already encodes past distributions, new members cannot claim dividends from periods before they joined. The sum across all members remains zero because new members contribute zero. Existing members’ values are unchanged; no dilution of past dividend entitlements occurs.
4. Model Instantiation and Economic Projection: Coffee Cooperative Scenario in Caconde
We demonstrate the practical applicability and economic viability of the mathematical framework (Section 3) using a hypothetical coffee cooperative in Caconde, São Paulo, Brazil. Although this is a projected scenario and not a real-world deployment, we use parameters from: (i) existing cooperatives in Caconde (Ronquim & Chies, 2023), (ii) financial benchmarks for small-scale agricultural processing (Rainato et al., 2012; Sebrae, 2023), and (iii) current conditions of Brazilian agricultural financing.
4.1. Regional Context and Agricultural Structure
Caconde is a municipality in the interior of São Paulo, Brazil, and the largest coffee-producing municipality in the state (Ronquim et al., 2023). The region is recognized for Arabica coffee cultivated predominantly at elevations above 800 m, conditions that enhance bean quality and command market premiums (Ronquim & Chies, 2023). The agricultural structure is dominated by smallholder farms: approximately 2000 producers operating across 11,145 hectares, with 96.3% on holdings of less than 88 hectares and average farm sizes between 8 and 15 hectares. Collectively, these farms produce an average of approximately 15,800 tons of coffee annually based on recent production data (2018–2024), with output ranging from 10,000 to 19,320 tons depending on biennial yield cycles.2 This production volume makes coffee central to the local economy (Agrolink, 2024).
The region has been designated as a pilot site for Embrapa’s Semear Digital project, which established an Agrotechnological District (DAT) to advance digital agriculture technologies among smallholder producers (EMBRAPA Agricultura Digital, 2024).
Historically, most farmers sell unprocessed coffee cherries to intermediaries, losing an estimated 30–40% of potential value (Sebrae, 2023). This gap motivates shared processing infrastructure that allows for capturing further margins and strengthening production autonomy.
4.2. Investment Structure and Token Design
We assume a cooperative that invests BRL3 800,000 to build and operate a wet processing facility with an annual capacity of 800 tons that transforms fresh cherries into dry parchment coffee serving 100–150 small producers (5% of Caconde’s production). This cost of BRL 1000 per ton aligns with regional benchmarks for wet facilities in São Paulo (Cantor, 2023; Christo et al., 2021; Companhia Nacional de Abastecimento (Conab), 2025; Sebrae, 2023).
The investment covers processing equipment (pulpers, tanks, channels), drying systems, storage, fair trade certifications, and technical training (Carvalho, 2022; Embrapa, 2022).
With a 1:1 token-to-capital ratio (), we issued 800,000 tokens: 720,000 (90%) for local producers and investors and 80,000 (10%) in reserve. This corresponds to 800,000, = 80,000, and = 720,000, according to Equation (1).
4.3. Operational Parameters and Financial Projections
Based on the 800,000 token structure and a capacity of 800 tons, we projected the cooperative’s financial performance using operational parameters from the Caconde coffee sector (Bordin et al., 2017; Borém et al., 2008; Embrapa, 2004; Matiello et al., 2024). Table 2 consolidates the key parameters and their sources to make the calibration transparent and reproducible.
Table 2.
Key operational parameters for the Caconde case study with sources.
In the first year, the facility will operate at 85% capacity, processing 680 tons (11,300 bags of 60 kg). With the assumption of a processing fee of BRL 22/bag (approximately 1% of the market price of BRL 2223/bag in São Paulo (Agrolink, 2024)) and average operational costs of approximately BRL 12/bag, the contribution margin is 45%, allowing coverage of operational reserves and maintenance.
Thus, the projected financial results for Year 1 are given by:
Under the assumption that the cooperative will distribute 70% of profits () to token holders, retaining 30% for reserves and maintenance (Santinato et al., 2015; Sebrae, 2023). Dividends will be proposed annually and will require governance approval (Section 5). Thus, for Year 1, this results in BRL 79,100 distributed and BRL 33,900 retained.
The economic projections rely on three key assumptions. First, geometric profit growth at per year, reflecting efficiency improvements and capacity utilization increasing from 85% to 90% by Year 3, consistent with OECD agricultural processing benchmarks (OECD, 2022). Second, constant circulating supply: is held fixed for projection purposes; Section 3.1.6 shows the contract handles dynamic membership changes. Third, token price stability at 1:1 BRL peg, treating tokens as capital contributions rather than speculative assets.
Assuming an annual growth rate of 5% () and reaching 90% capacity utilization in Year 3 (OECD, 2022), we have:
Applying (7) with , , , , and , the projected 10-year return is:
That is, an investment of BRL 1000 will generate approximately BRL 1380 in accumulated dividends over 10 years. The smart contract allows adjusting distributions based on actual performance, as detailed in Section 5.
4.4. Comparative Economic Analysis
We compared our cooperative-tokenized financing model against PRONAF, Brazil’s main agricultural credit program. Both assume financing of BRL 800,000, but with different economic structures.
PRONAF offers loans at 8% annual interest with 10-year terms and negotiated guarantees (BNDES, 2025). Our model, on the other hand, issues 800,000 tokens at a 1:1 ratio with BRL: 720,000 tokens (90%) for member acquisition, and 80,000 (10%) remain in reserve for future needs.
Table 3 summarizes the differences over 10 years, where we can see that the tokenized model eliminates BRL 390,000 in interest (a 33% reduction), does not require collateral that excludes small producers, and reduces the time to access capital to 15–30 days (includes member onboarding, identity verification, KYC, smart contract deployment, and token distribution) versus 90–180 days for PRONAF for credit analysis and collateral assessment. Furthermore, it converts debt into equity: members retain permanent ownership and receive variable dividends instead of fixed payment obligations.
Table 3.
Tokenized model vs. PRONAF financing (10-year comparison).
In agriculture, this flexibility is crucial. In years of poor harvest, the cooperative suspends dividends without default, while PRONAF’s fixed debt service persists regardless of performance, increasing the risk of bankruptcy in difficult years.
5. Smart Contract Implementation
In this section, we implement the mathematical framework of Section 3 using a smart contract. We cover the contract architecture, the distribution algorithms, cooperative governance functions, gas costs, and verified deployment on the Ethereum Sepolia testnet.
5.1. Smart Contract Architecture
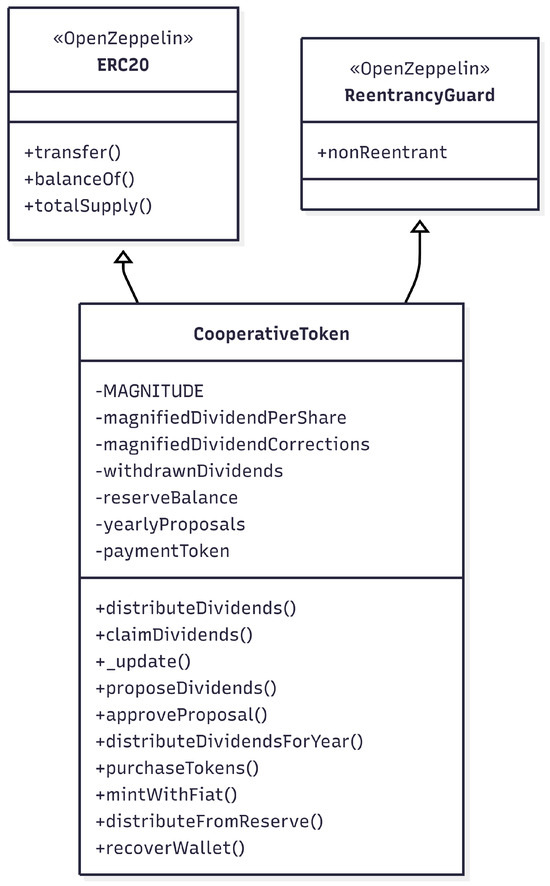
Our smart contract, CooperativeToken, extends ERC-204 with dividend distribution. It inherits from ERC20 OpenZeppelin for standard functionality and from ReentrancyGuard for reentrancy protection. The architecture separates token mechanics from dividend accounting, enabling flexibility for cooperative governance. Figure 1 shows the inheritance structure and main components of CooperativeToken.
Figure 1.
Smart contract architecture showing inheritance structure, core state variables for dividend distribution and governance, and principal functions for token management and dividend operations.
As shown in Figure 1, the CooperativeToken implementation contains seven core state variables that directly support the mathematical framework, as shown in Table 4. The global dividend accumulator magnifiedDividendPerShare implements from Equation (8), while magnifiedDividendCorrections maintains temporal adjustment factors from Equations (13) and (14) to preserve fairness during token transfers. The MAGNITUDE constant enables precise fixed-point arithmetic without floating-point operations, and withdrawnDividends tracks member withdrawal history to prevent double-claiming. Additional variables manage reserve tokens, governance proposals, and payment token integration.
Table 4.
Core state variables in the CooperativeToken smart contract.
Further, the smart contract implements eleven principal functions organized into four operational categories, which can be seen in Table 5. Core dividend operations maintain computational complexity, implementing the mathematical framework from Section 3 through Algorithms 1–3.
Table 5.
Principal smart contract functions organized by operational category.
Governance functions enable democratic control over annual distributions through proposal-approval workflows. Token acquisition functions support both cryptocurrency payments at a 1:1 ratio and off-chain fiat transactions with cooperative staff authorization. Management functions provide operational flexibility for reserve allocation and wallet recovery in cases of key loss.
| Algorithm 1 Dividend distribution with complexity |
|
| Algorithm 2 Dividend Withdrawal with complexity |
|
| Algorithm 3 Temporal adjustment with complexity |
5.2. Core Dividend Distribution Mechanism
This subsection details the three core dividend algorithms that achieve computational complexity through the magnified accumulator pattern with scaling factor .
5.2.1. Dividend Distribution
Algorithm 1 implements Equation (8) to inject dividends into the system. It updates the global accumulator in constant time by calculating the dividend increment per token and adding it to the previous value of the accumulator. At time t, circulating supply excludes contract-held tokens, preventing reserves and unsold tokens from receiving dividends. Unlike traditional approaches that iterate over all holders ( gas cost), this operation maintains constant complexity, regardless of the membership size.
5.2.2. Dividend Withdrawal
Algorithm 2 implements Equations (10) and (11) for dividend claims, where the withdrawable amount is computed using the member’s current balance, , the global accumulator , the correction factor , and the withdrawal history in operations. Members claim dividends to their wallet address or designate an alternate recipient wallet, enabling direct payments without intermediate transfers.
On the other hand, Algorithm 3 implements Equations (13) and (14) to preserve fairness during token transfers. Thus, the EVM automatically invokes this hook when tokens move between members, adjusting the of the sender and receiver to ensure that: (i) the sender retains dividends accumulated before the transfer, and (ii) the receiver does not inherit historical dividends. This mechanism preserves proportionality (Section 3) where dividends depend on how many tokens a member held at the time dividends were distributed, not how many they hold when withdrawing.
5.3. Governance and Operational Functions
In addition to dividend distribution, the contract implements governance and operational functions, which are summarized in Table 5. This subsection details the governance of annual dividends, token acquisition, reserve management, and wallet recovery.
5.3.1. Annual Dividend Governance
A proposal-approval workflow separates dividend planning from execution. Management proposes annual dividends based on operational results, requiring governance approval before distribution. This approach enables profitability-based adjustments while maintaining transparency.
The system operates in three steps. First, proposeDividends(year, amount) records the proposed amount and marks it as pending. Second, approveProposal(year) approves the proposal, making it immutable. Finally, distributeDividendsForYear(year) executes the payment using Algorithm 1, updates , and marks the year as distributed to prevent duplicate payouts.
5.3.2. Token Acquisition
The contract supports two acquisition methods. The first allows direct purchases with stable cryptocurrencies, and the second uses traditional off-chain payments.
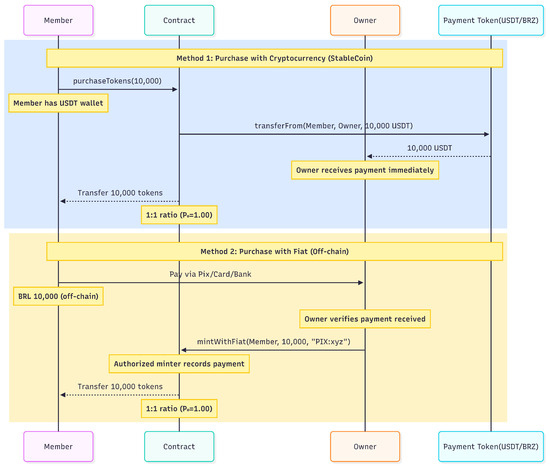
The function purchaseTokens(paymentAmount) implements a fixed 1:1 price, , allowing members to acquire cooperative tokens by transferring cryptocurrency to the cooperative via the smart contract. The contract accepts a stable cryptocurrency configured during the contract deployment (typically USDT or USDC for US dollars, or BRZ or BBRL for Brazilian reais).5 The function validates token availability, excluding reserved tokens, and executes the transfer atomically.
For members without access to cryptocurrencies, the function mintWithFiat(to, amount, method) enables purchases through traditional payment methods such as credit cards or bank transfers. Authorized cooperative staff verify off-chain payments and then invoke this function to issue cooperative tokens to the buyer. The method parameter records the payment reference (e.g., transaction ID or invoice number) for auditability, bridging blockchain operations with traditional financial systems. This dual approach removes technological barriers that could exclude members with limited digital connectivity.
Figure 2 illustrates both acquisition flows.
Figure 2.
Token acquisition methods showing payment flows. Method 1 (cryptocurrency): member transfers stable cryptocurrency directly to the cooperative via the smart contract and immediately receives cooperative tokens at a 1:1 ratio. Method 2 (fiat): member pays via traditional methods (credit card, bank transfer); staff verifies the off-chain payment and subsequently issues cooperative tokens on-chain using an authorized function.
5.3.3. Reserve Management
We allocate a configurable portion of the total token supply as an operational reserve. For Caconde (Section 4), this amounts to 10% of supply (80,000 tokens), held by the contract and excluded from dividend calculations. Deployment sets the reserve percentage based on growth projections, typically 5–15%.
This reserve enables membership expansion and provides liquidity for contingencies. The function distributeFromReserve(recipient, amount) distributes reserve tokens, , to new members or for operational needs. Only the cooperative may invoke this function. When executed, it decrements reserveBalance and transfers tokens to the recipient, keeping track of the circulating supply versus the reserve. This facilitates onboarding new members without relying on illiquid secondary markets in rural contexts. Additionally, the reserve can cover unforeseen expenses such as emergency repairs or cash flow gaps without diluting existing members’ ownership stakes.
5.3.4. Wallet Recovery
The function recoverWallet(oldWallet, newWallet) addresses private key loss on the blockchain. In traditional cooperatives, members recover accounts through identity verification. While blockchain immutability ensures transactions, it also introduces the risk of permanent asset loss if keys are compromised or forgotten.
This function transfers both tokens and accrued dividends from a lost wallet to a new wallet designated by the member. Only the cooperative may invoke this function, and only after completing off-chain identity verification (e.g., in-person validation, government-issued ID, or member testimonials). This design prioritizes member protection over pure decentralization, reflecting cooperative principles of mutual aid and ensuring that technical failures do not result in permanent loss of member equity.
5.3.5. Operational Workflow Summary
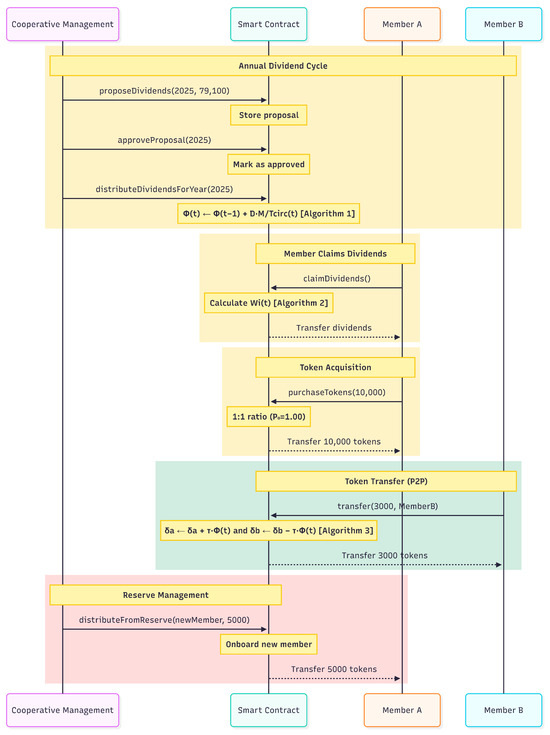
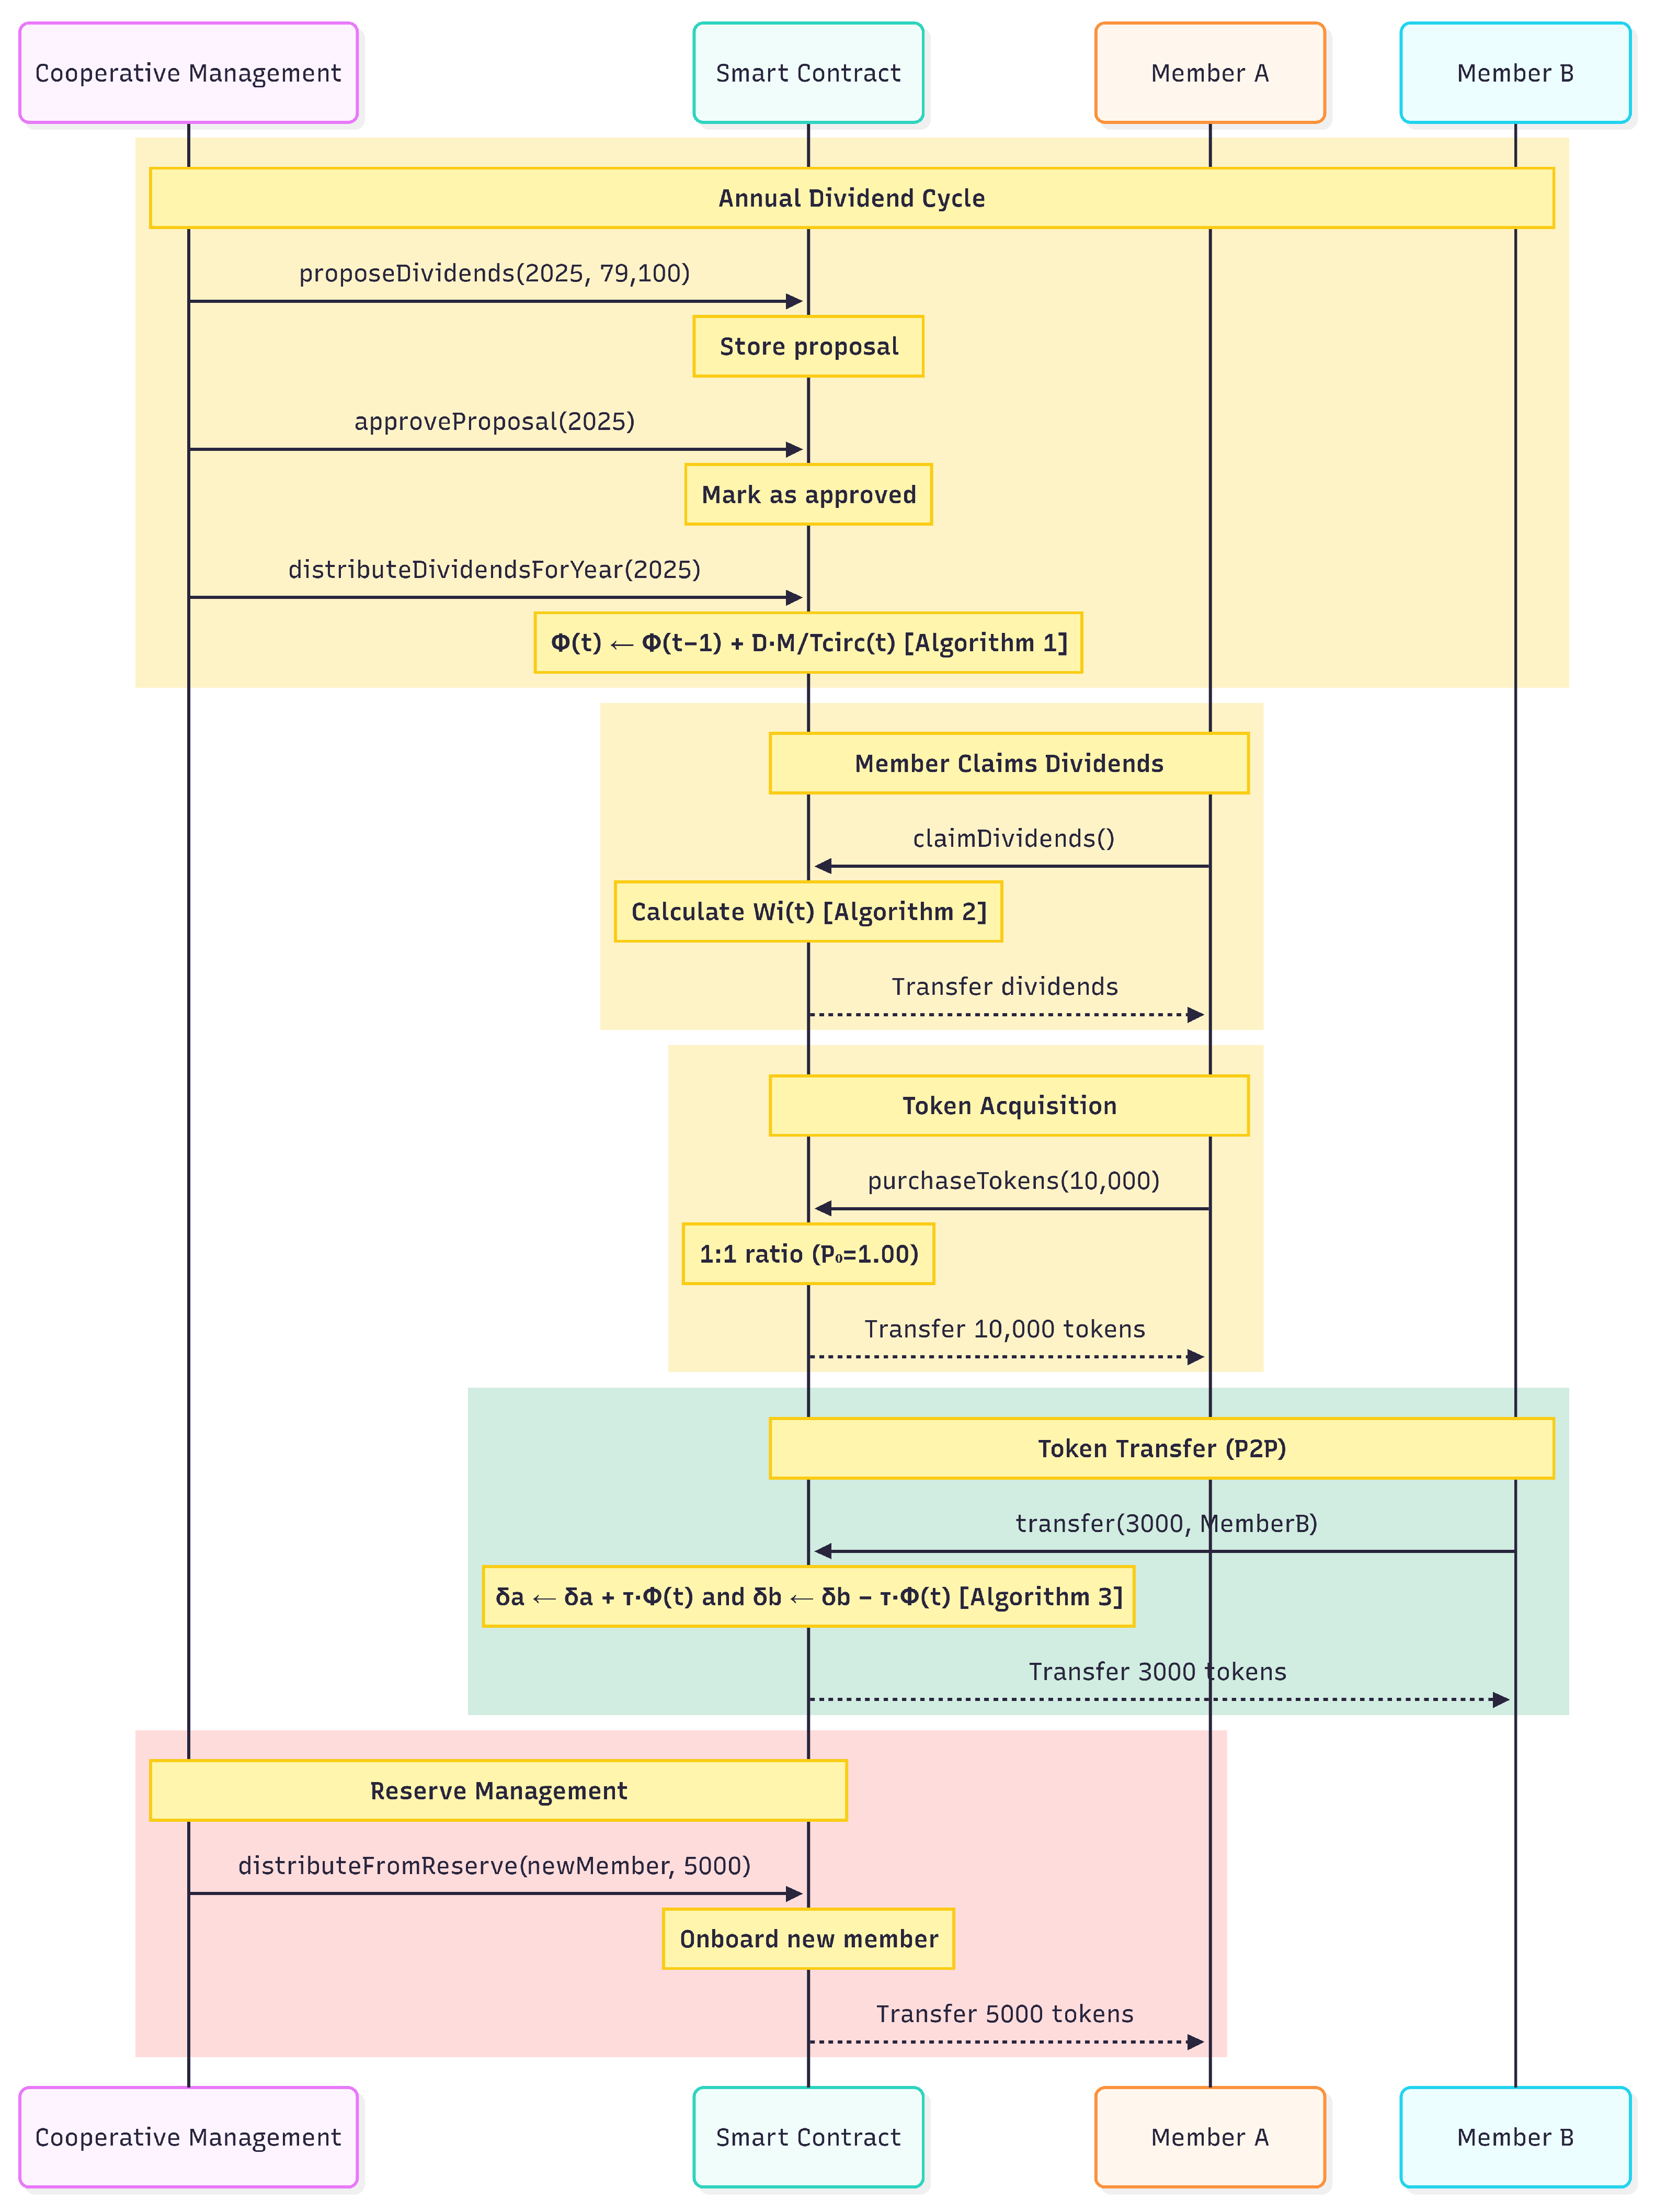
Figure 3 summarizes the integration of the components described. The diagram shows the annual dividend cycle (proposal, approval, distribution, and claim), token acquisition via stable cryptocurrencies or fiat payments, token transfers with automatic temporal adjustment and reserve management for new member onboarding.
Figure 3.
Integrated system workflow showing interaction between cooperative management, smart contract, and members throughout the annual dividend cycle.
5.4. Gas Cost and Scalability Analysis
We measured the gas consumption of the contract’s core operations to verify the computational efficiency of the mechanism. The tests were executed in Hardhat6 that replicates the EVM gas accounting without incurring network fees.
5.4.1. Test Environment
The measurements were performed using the parameters from the Caconde case study:
- Total supply: 800,000 tokens (6 decimals).
- Circulating supply: 720,000 tokens (90%).
- Reserve: 80,000 tokens (10%).
- Payment token: MockBRL stablecoin for testing (6 decimals, simulating BRL-pegged stablecoins such as BRZ or BBRL).
- Initial distribution: 2 member addresses with equal token holdings.
Measurements represent transaction gas costs averaged over multiple executions, excluding intrinsic transaction overhead (21,000 gas base cost). The Solidity compiler optimization was enabled with 200 runs, balancing the deployment cost against execution efficiency.
5.4.2. Gas Consumption and Cost Analysis
Table 6 presents measured gas consumption for core smart contract operations, obtained on the Ethereum Sepolia testnet. All dividend-related functions exhibit constant gas costs independent of cooperative membership size, validating the complexity analysis from Section 5.2.
Table 6.
Measured gas consumption and estimated operational costs on Polygon mainnet. Gas measurements collected on Ethereum Sepolia testnet with identical EVM execution.
To assess economic viability for production deployment, cost estimates are calculated using current Polygon mainnet parameters (2 gwei gas price, POL price approximately $0.12 as of December 2025)7. Sepolia was chosen for testing due to its cost-free environment and public verification capabilities on Etherscan, while Polygon is selected for production due to its significantly lower transaction fees making the system affordable even for small cooperatives. For comparison, equivalent operations on Ethereum mainnet (30 gwei gas price, ETH ≈ $3500) would cost approximately two to three orders of magnitude more, rendering the system economically impractical for frequent use by resource-constrained agricultural cooperatives.
The gas measurements in Table 6 reveal several key performance characteristics. The most gas-intensive operation, distributeDividends, consumes 144,393 gas, which is equivalent to approximately $0.000035 on Polygon mainnet. This cost remains constant, whether distributing dividends to 10 members or 10,000 members, demonstrating the scalability advantage of the magnified accumulator pattern. The annual dividend distribution in Caconde would generate fees lower than $0.0001, negligible compared to traditional financial intermediation costs.
Claiming dividends a second time consumes approximately 23% less gas than the initial claim, as the variables are already initialized in storage (warm access). In the EVM, reading previously accessed storage slots (warm reads) costs 100 gas compared to 2100 gas for cold storage reads, resulting in the observed efficiency gain. Token transfers with temporal adjustment via the _update hook add approximately 20,000 gas over standard ERC20 transfers to preserve dividend fairness across token movements.
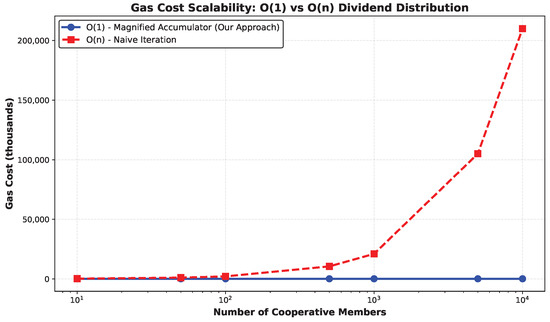
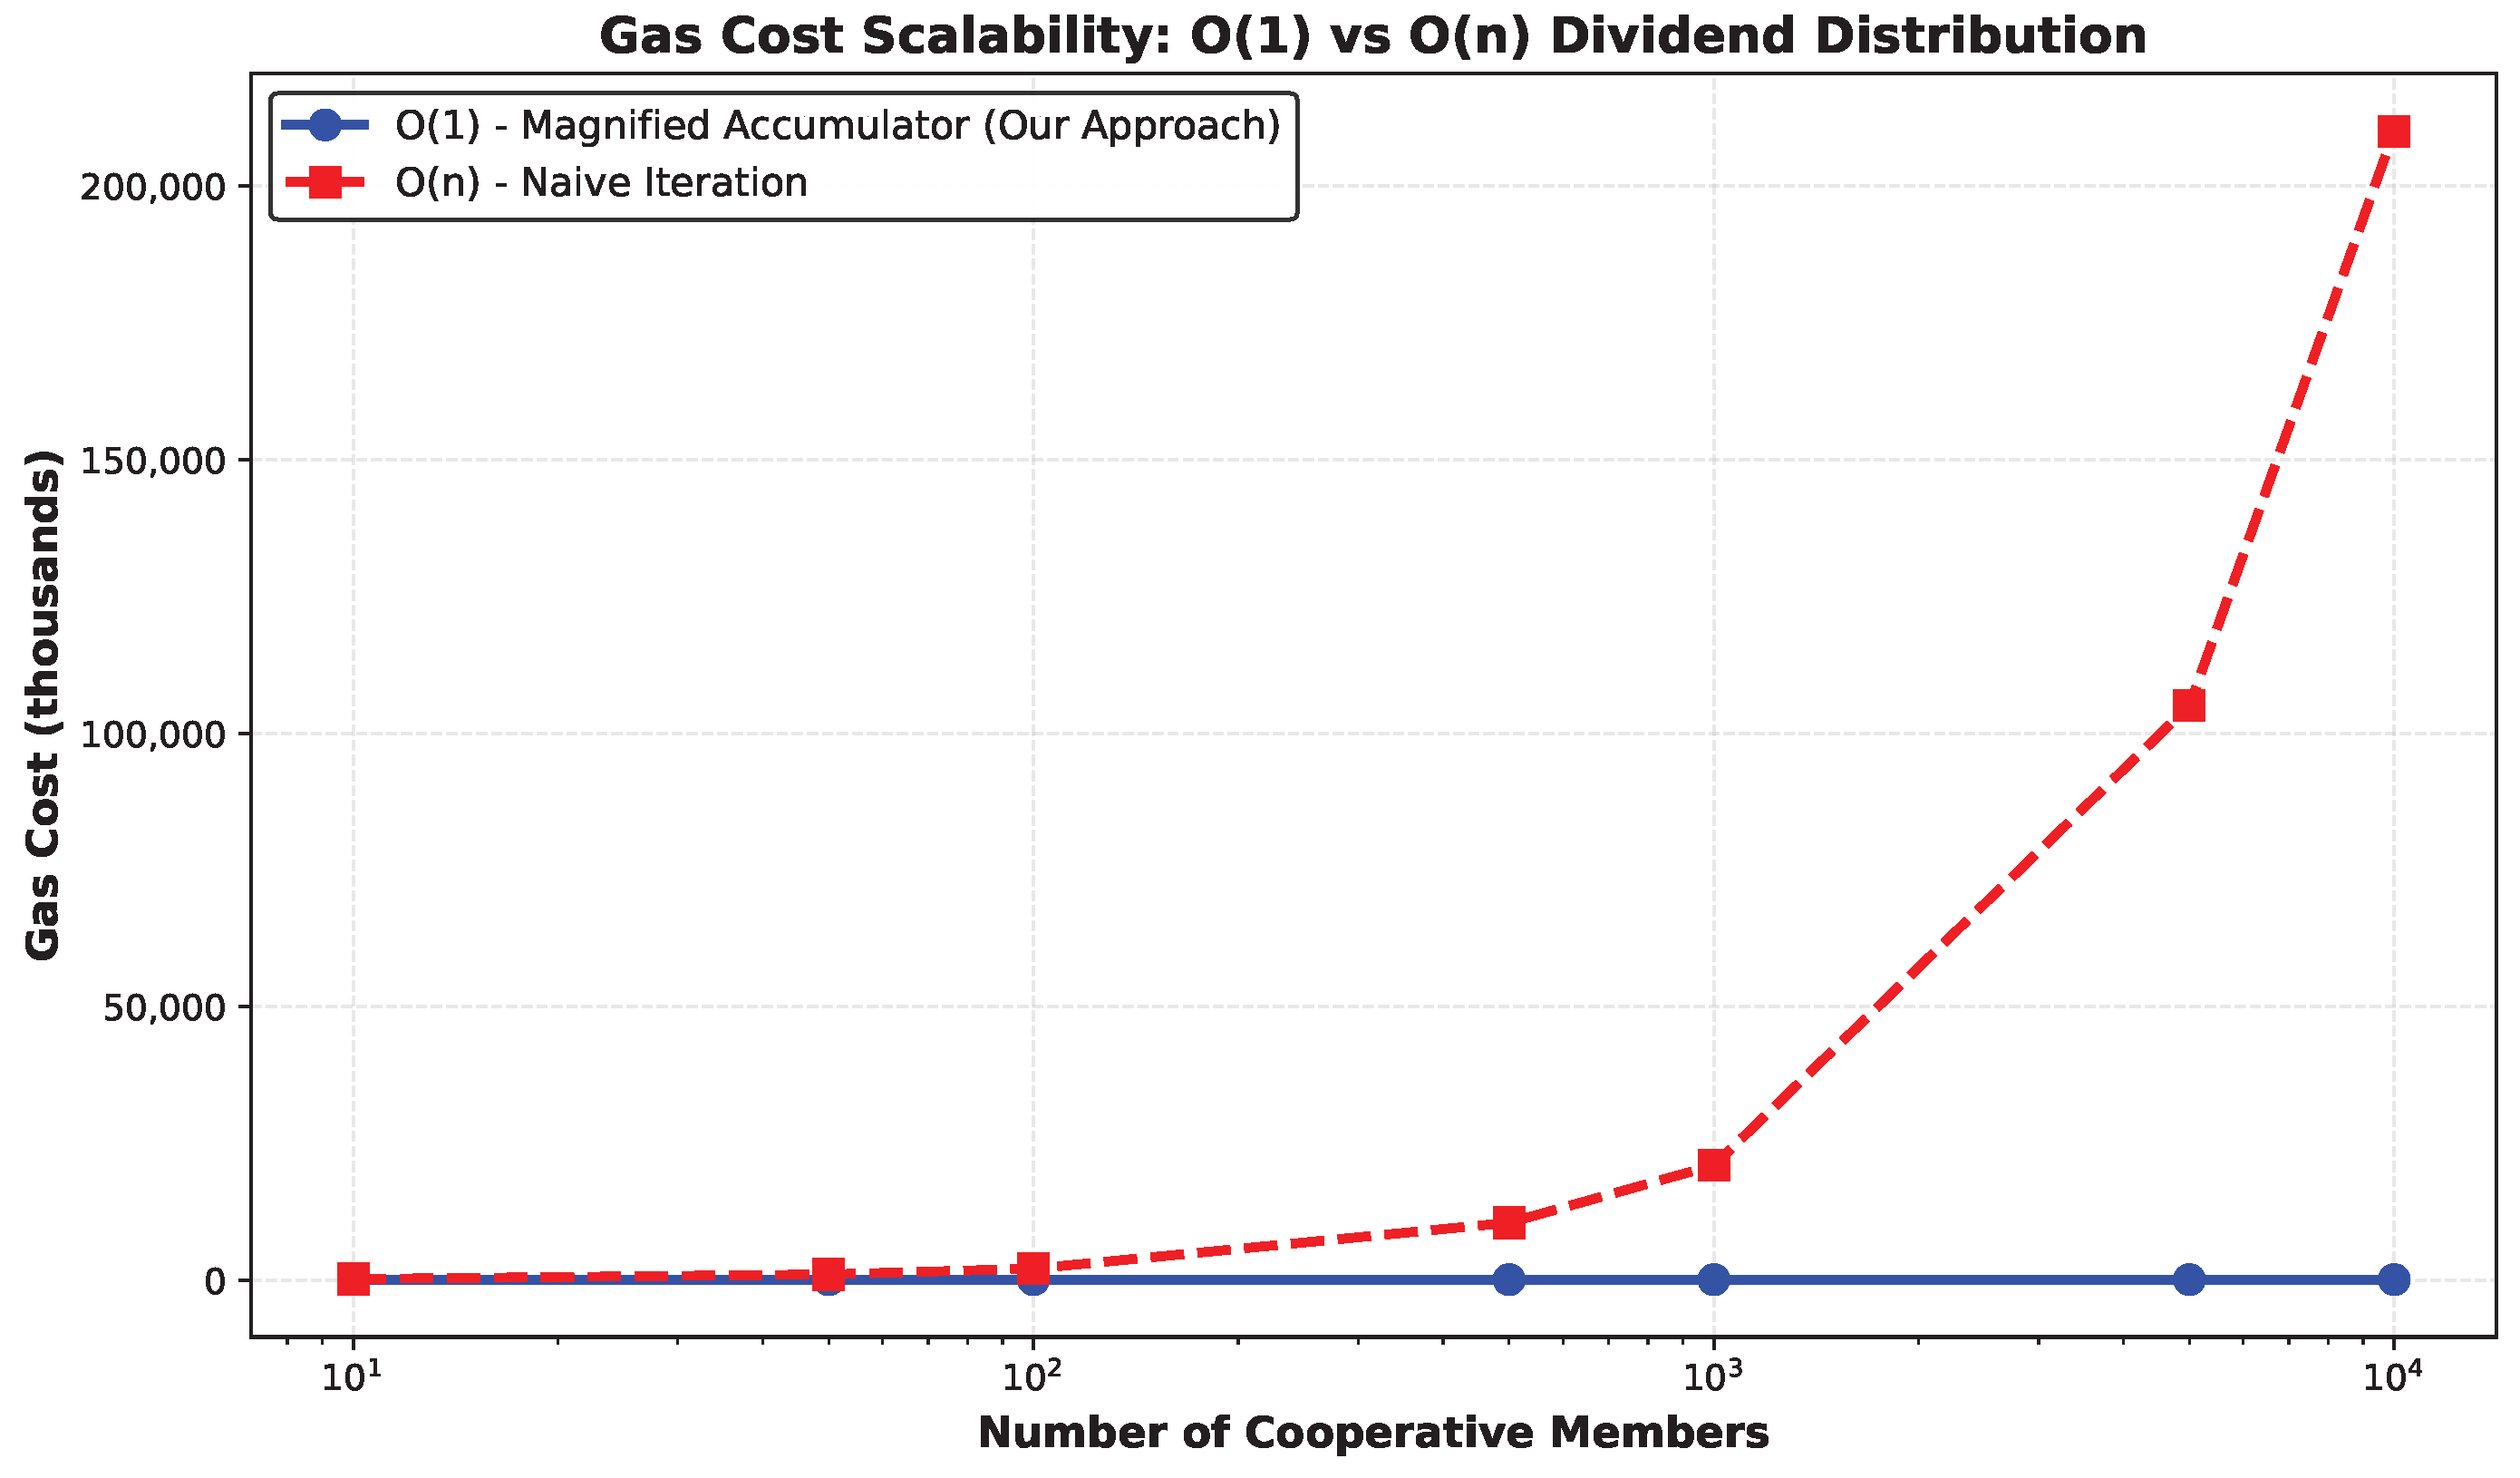
Figure 4 compares gas consumption for the magnified accumulator pattern, , against a naive iteration approach, , and across varying cooperative sizes. The approach maintains constant gas cost at 144,393, regardless of membership, while the naive approach scales linearly, becoming economically prohibitive beyond 1000 members. For a 10,000-member cooperative, the naive approach would consume approximately 1460× more gas than the magnified accumulator, demonstrating the critical importance of algorithmic efficiency for large-scale cooperative deployment.
Figure 4.
Gas cost scalability comparison between magnified accumulator pattern and naive iteration approach. The horizontal line demonstrates constant-time dividend distribution regardless of cooperative size, while the ascending line shows linear growth in the naive approach.
5.5. Deployment and Verification
The CooperativeToken smart contract and supporting MockBRL payment token were deployed to Ethereum Sepolia testnet for public verification and demonstration.8 Sepolia provides a cost-free environment for testing and public verification, while gas costs observed on the testnet align with Hardhat local measurements (see Table 6), confirming the accuracy of the complexity analysis in a live blockchain environment.
Contract deployment was performed using Hardhat’s deployment framework with the following configuration:
- Solidity compiler version: 0.8.26.
- Optimization enabled: 200 runs.
- Network: Ethereum Sepolia testnet.
- Block explorer: Etherscan (https://sepolia.etherscan.io) (accessed on 29 December 2025).
Both contracts were verified on Etherscan, making the complete source code publicly accessible and auditable. Verification confirms a match between the deployed bytecode and the source code, enabling transparency and community review.
Operational Demonstration
To validate the end-to-end functionality, we executed a complete operational cycle on the Sepolia testnet with four members of the cooperative. Table 7 summarizes the scenario using the CCC token and the MockBRL stablecoin.
Table 7.
Demo scenario on Sepolia testnet.
The demo executed the following operational sequence:
- Token acquisition: Four members acquired a total of 49,000 CCC tokens: three purchased tokens using MockBRL via purchaseTokens. Member 3 acquired 19,000 tokens through mintWithFiat after off-chain credit card payment authorized by cooperative staff.
- Governance workflow: The cooperative proposed a dividend distribution of 10,000 MockBRL using proposeDividends. After approval via approveProposal, distributeDividendsForYear injected the funds into the contract and updated according to Equation (8). The 49,000 circulating tokens determined token allocation.
- Peer-to-peer transfers: Token transfers between members automatically adjusted temporal factors via the _update hook, preserving fairness, as defined in Equations (13) and (14).
5.6. Discussion: Regulatory, Security, and User Adoption Barriers
5.6.1. Regulatory and Legal Risks of Tokenized Equity
The tokenized capital model proposed here operates in a legally uncertain environment. Brazil’s Lei 14.478/2022 (Brazil, 2022) established the legal framework for virtual asset service providers, but agricultural cooperative shares may or may not be classified as collective investment contracts. If classified as securities under CVM Resolution 88/2022 (Comissão de Valores Mobiliários [CVM], 2022), the cooperative would need to register with CVM, file prospectuses, and comply with ongoing disclosure requirements—burdens that many small cooperatives cannot meet without external legal support. The CVM maintains a regulatory sandbox through which cooperatives may seek advance regulatory rulings before a full public offering. Cooperatives should also verify whether Lei 5.764/1971 (Brazil, 1971) constrains token transferability to non-members.
Similarly, the EU MiCA Regulation (2023/1114) (European Parliament and Council of the European Union, 2023) treats asset-referenced tokens as subject to capital reserves and white-paper mandates. If a European cooperative adopts this model, tokenized equity could require authorized custodians and transaction reporting.
A practical path forward involves: (i) seeking advance rulings from local regulators via the CVM sandbox; (ii) restricting token transfers to verified cooperative members only (already implemented via transfer checks in the contract); and (iii) issuing non-transferable membership shares that represent economic rights only, which may avoid security classification entirely.
5.6.2. User Adoption Barriers for Low-Digital-Literacy Farmers
The system assumes that members can use cryptocurrency wallets, manage private keys, and interact with a blockchain. For smallholder farmers in rural Brazil, this is often unrealistic. According to rural digital transformation research (Cao et al., 2025; da Silva et al., 2025), smartphone penetration in regions like Caconde is growing, but familiarity with DeFi wallets remains near zero.
Mitigations already implemented in the contract include: fiat on-ramps via mintWithFiat (cooperative staff handle blockchain interaction on behalf of members), and recoverWallet to prevent permanent key loss. A 1:1 parity with the Brazilian real ensures members think in familiar monetary terms rather than token units.
Members still need a wallet to claim dividends. A custodial wallet managed by the cooperative under multi-signature controls would reduce this barrier, though at the cost of some decentralization. Alternatively, dividends could be disbursed in fiat to bank accounts via an off-chain oracle, sacrificing atomic settlement. Future work could test a mobile-first interface with biometric recovery and SMS-based transaction signing adapted to rural connectivity constraints.
5.6.3. Security Considerations
Smart contract risks include reentrancy (mitigated by OpenZeppelin’s ReentrancyGuard on all value-transferring functions), integer overflow (Solidity 0.8.x has built-in checks), and governance attacks (proposals require owner approval rather than token-weighted voting). The use of magnifiedDividendPerShare with avoids rounding errors in fixed-point arithmetic.
The cooperative owner role holds significant authority (e.g., distributeDividends, recoverWallet). In production, a multi-signature wallet requiring 3 of 5 signatures from elected board members is recommended for the owner account. Stablecoin dependency introduces depeg risk; cooperatives should prefer stablecoins with published reserve audits. Finally, an independent smart-contract security audit is recommended before any mainnet deployment handling real member capital.
6. Conclusions
This paper has proposed a tokenization system using a smart contract for small and medium-sized agricultural cooperatives. The model addresses specific operational challenges not previously covered in the tokenization literature, such as fragmented share management, manual dividend distribution, and the lack of publicly verifiable records.
The main contribution is a mathematical framework with complexity for dividend distribution and claims that scales from cooperatives with 100 to 10,000 members. Further, the model ensures temporal fairness through correction factors that preserve entitlement during token transfers, guaranteeing that dividends are allocated proportionally to the holding period, not just at the time of withdrawal.
The implementation of the CooperativeToken contract on Sepolia consumes approximately 144,000 gas for annual distribution, regardless of membership size, with negligible operational costs on Polygon mainnet. The dual architecture, combining stable cryptocurrency and off-chain fiat integration, eliminates technological barriers, enabling participation without prior blockchain experience. The system preserves cooperative democratic governance through proposal-approval workflows for annual distribution decisions.
Economic projections based on the Caconde scenario illustrate the framework’s applicability to coffee cooperatives.
Several directions are intentionally scoped for future work. Deployment with real cooperative members across multiple pilots will provide empirical data on onboarding, fiat-to-crypto conversion flows, and long-term operational behavior. Formal legal clearance in specific jurisdictions, including sandbox participation where necessary, is a prerequisite for production use. Field trials with low-digital-literacy farmers will quantify adoption barriers and inform interface design. Formal verification of the dividend accumulator, validated through simulation, represents a natural extension toward certification-grade assurance. Extensions such as multi-signature governance or integration with agricultural price oracles are technically feasible but remain secondary until sustained the adoption of the core model is demonstrated.
Author Contributions
Conceptualization, J.M., A.P. and I.B.; methodology, J.M. and S.M.; software, J.M.; validation, J.M., A.P. and A.L.; formal analysis, J.M.; investigation, J.M. and A.P.; resources, A.L. and S.M.; data curation, J.M.; writing—original draft preparation, J.M.; writing—review and editing, J.M., A.P., S.M. and A.L.; visualization, J.M.; supervision, A.P., A.L. and I.B.; project administration, A.L.; funding acquisition, A.L. and S.M. All authors have read and agreed to the published version of the manuscript.
Funding
This research was funded by the São Paulo Research Foundation (FAPESP), grant numbers 22/09319-9 and 24/18399-1.
Data Availability Statement
No new data were created or analyzed in this study. All results are derived from publicly available blockchain transaction data and smart contract interactions recorded on the Ethereum Sepolia testnet and Polygon mainnet.
Acknowledgments
The authors would like to thank Embrapa and the Semear Digital project for their support during the development of this work.
Conflicts of Interest
The authors declare no conflict of interest. The funders had no role in the design of the study; in the collection, analyses, or interpretation of data; in the writing of the manuscript; or in the decision to publish the results.
Appendix A. Proof of Theorem 1
Proof.
We prove that at any time, t, the sum of all unclaimed dividend entitlements and already-claimed dividends equals the total dividends distributed up to that point:
From Equation (10), the total unclaimed entitlement is:
Two system invariants hold at all times:
- The adjustment terms sum to zero . This follows from the transfer logic (Equations (13) and (14)), where every increase in one is matched by an equal decrease in another, and all start at zero.
- Token holdings sum to circulating supply , by definition.
Applying these to (A2) gives:
Critically, the accumulator is updated at the moment each dividend is distributed:
This ensures that the entire amount is immediately and fully allocated to the current set of token holders (via the accumulator), and preserved over time through the adjustments.
Therefore, the system never loses or creates dividend value. At any time, t, the total distributed dividends must equal the sum of what has already been claimed, , and what remains claimable, . Hence:
which rearranges to:
This completes the proof. □
Appendix B. Sensitivity Analysis for Economic Projections
Base parameters: , , , , , years. Base-case ROI: (from Equation (7)).
Table A1.
Sensitivity of 10-year ROI to key model parameters.
ROI is computed by substituting each parameter value into Equation (7) while holding all others at their base values. The distribution ratio has the largest proportional impact: a 29% reduction (0.70 → 0.50) reduces ROI by 29% (138.2% → 98.7%). Profit growth g has a nonlinear effect due to the geometric term; the difference between and spans a 49-percentage-point range (109.9–159.2%), confirming that the base case of 5% is a conservative mid-range estimate.
Notes
| 1 | Embrapa’s (Brazil’s national agricultural research corporation, linked to the Ministry of Agriculture) Semear Digital project was born out of the need for digitization, modernization, and the provision of technological tools for small and medium-sized rural producers, as well as their cooperatives (da Silva et al., 2025). |
| 2 | The 2024 production value (10,000 tons) reflects the biennial low cycle typical of Arabica coffee, where yields alternate between high and low years due to physiological resource allocation in the plant. |
| 3 | BRL (Brazilian real, symbol R$) is the official currency of Brazil. |
| 4 | ERC-20 (Ethereum Request for Comments 20) is the standard interface for fungible tokens on Ethereum and EVM-compatible blockchains. |
| 5 | Stable cryptocurrency (stablecoins) maintain a 1:1 peg with traditional fiat currencies, eliminating price volatility. For Brazilian cooperatives, using BRL-pegged versions avoids foreign exchange risk. |
| 6 | An Ethereum development framework: https://hardhat.org (accessed on 15 December 2025). |
| 7 | POL price reference: https://www.coingecko.com/en/coins/polygon-ecosystem-token (accessed on 18 December 2025). |
| 8 | Verified contracts: CooperativeToken—https://sepolia.etherscan.io/address/0x369B05c3a7cB6b78609c136156C9322D78c03a39 (accessed on 10 February 2026), MockBRL—https://sepolia.etherscan.io/address/0xf8E93045Ea81a54d5142115F58F3E055BB6Ab28b (accessed on 10 February 2026). |
| 9 | https://sepolia.etherscan.io/address/0x369B05c3a7cB6b78609c136156C9322D78c03a39#code (accessed on 5 January 2026). |
References
- Agrolink. (2024). Estatísticas da cultura do café—Caconde, São Paulo. Available online: https://www.agrolink.com.br/culturas/cafe/estatistica/sp/caconde (accessed on 9 October 2025).
- Barakbayeva, T., Farokhnia, S., Goharshady, A. K., Li, P., & Lin, Z. (2025). Improved gas optimization of smart contracts. In H. Hojjat, & G. Caltais (Eds.), Fundamentals of software engineering (pp. 1–10). Springer Nature. [Google Scholar] [CrossRef] [Scilit]
- Bergier, I., Barbedo, J. G. A., Bolfe, E. L., Drucker, D., & Soares, F. M. (2026). The AgriTrust framework: Federated semantic governance for trusted and interoperable agricultural data sharing. Automation, 7(2), 57. [Google Scholar] [CrossRef] [Scilit]
- BNDES. (2025). Pronaf agroindústria: Financiamento a agricultores e produtores rurais familiares. Banco Nacional de Desenvolvimento Econômico e Social (BNDES). Available online: https://www.bndes.gov.br/wps/portal/site/home/financiamento/produto/pronaf-agroindustria (accessed on 10 December 2025).
- Bordin, B. C. M., Reis, G. M., Ribeiro, A. J., & Ronchi, C. P. (2017). Efeito de diferentes épocas de colheita sob a produtividade do cafeeiro, no cerrado mineiro. In Anais do 43° congresso Brasileiro de pesquisas cafeeiras. SBICafé—Consórcio Brasileiro de Pesquisa e Desenvolvimento do Café. Available online: https://sbicafe.ufv.br/server/api/core/bitstreams/da190449-002f-4fcb-8221-81d6a24e8380/content (accessed on 20 November 2025).
- Borém, F. M., Coradi, P. C., Saath, R., & Oliveira, J. A. (2008). Qualidade do café natural e despolpado após secagem em terreiro e com altas temperaturas. Ciência e Agrotecnologia, 32(5), 1609–1615. [Google Scholar] [CrossRef] [Scilit]
- Brazil. (1971). Lei n° 5.764, de 16 de dezembro de 1971: Define a política nacional de cooperativismo. Diário Oficial da União. Available online: https://www.planalto.gov.br/ccivil_03/leis/l5764.htm (accessed on 10 January 2026).
- Brazil. (2022). Lei n° 14.478, de 21 de dezembro de 2022: Diretrizes para a prestação de serviços de ativos virtuais. Diário Oficial da União. Available online: https://www.planalto.gov.br/ccivil_03/_ato2019-2022/2022/lei/l14478.htm (accessed on 10 January 2026).
- Cantor, A. (2023). Historic coffee prices percolated after a bitter global supply crisis. Beyond the Numbers: Prices & Spending, 12(13). Available online: https://www.bls.gov/opub/btn/volume-12/historic-coffee-prices-percolated-after-a-bitter-global-supply-crisis.htm (accessed on 2 November 2025).
- Cao, A., Guo, L., & Li, H. (2025). Understanding farmer cooperatives’ intention to adopt digital technology: Mediating effect of perceived ease of use and moderating effects of internet usage and training. International Journal of Agricultural Sustainability, 23(1), 2464523. [Google Scholar] [CrossRef] [Scilit]
- Carvalho, A. R. V. C. P. (2022). Processos de controle de qualidade e segurança alimentar na indústria do café [Master’s thesis, Universidade do Porto]. Available online: https://repositorio-aberto.up.pt/bitstream/10216/145880/2/593815.pdf (accessed on 30 October 2025).
- Chaddad, F. R., & Cook, M. L. (2004). Understanding new cooperative models: An ownership-control rights typology. Review of Agricultural Economics, 26(3), 348–360. [Google Scholar] [CrossRef] [Scilit]
- Christo, B. F., Dalvi, C. M. D., Jr., Silva, T. B. S., & Colodetti, T. V. (2021). Cafés especiais como oportunidade de competitividade para pequenos e médios produtores brasileiros. Brazilian Journal of Development, 7(8), 83617–83633. [Google Scholar] [CrossRef] [Scilit]
- Climate Policy Initiative (CPI/PUC-Rio). (2023, September). Brazilian agricultural mitigation and adaptation policies: Towards just transition. Available online: https://www.climatepolicyinitiative.org/publication/brazilian-agricultural-mitigation-and-adaptation-policies-towards-just-transition/ (accessed on 25 October 2025).
- Climate Policy Initiative/Pontifical Catholic University of Rio de Janeiro (CPI/PUC-Rio). (2023). Family farming in Brazil: Inequalities in credit access. Available online: https://www.climatepolicyinitiative.org/publication/family-farming-in-brazil-inequalities-in-credit-access/ (accessed on 8 December 2025).
- Comissão de Valores Mobiliários (CVM). (2022). Resolução cvm n° 88, de 27 de abril de 2022: Disposições sobre registro e oferta de valores mobiliários. Comissão de Valores Mobiliários. Available online: https://conteudo.cvm.gov.br/legislacao/resolucoes/resol088.html (accessed on 10 January 2026).
- Companhia Nacional de Abastecimento (Conab). (2025, May). Acompanhamento da safra brasileira de café—2° levantamento safra 2025. Available online: https://www.gov.br/conab/pt-br/atuacao/informacoes-agropecuarias/safras/safra-de-cafe/2o-levantamento-de-cafe-safra-2025/boletim-cafe-maio-2025 (accessed on 5 December 2025).
- Cong, L. W., Landsman, W. R., Rabetti, D., Zhang, C., Zhao, W., & Zhao, W. (2025, December). Tokenized stocks. Available online: https://ssrn.com/abstract=5937314 (accessed on 15 December 2025).
- da Silva, T. L., Romani, L. A. S., Evangelista, S. R. M., Datcu, M., & Massruhá, S. M. F. S. (2025). Drought monitoring in the agrotechnological districts of the semear digital center. Atmosphere, 16(4), 465. [Google Scholar] [CrossRef] [Scilit]
- Dubey, R., Gupta, M., Mikalef, P., & Akter, S. (2023). Incorporating blockchain technology in information systems research. International Journal of Information Management, 68, 102573. [Google Scholar] [CrossRef] [Scilit]
- Embrapa. (2004). Manual de segurança e qualidade para a cultura do café (Qualidade e Segurança dos Alimentos). Empresa Brasileira de Pesquisa Agropecuária. Available online: https://www.embrapa.br/busca-de-publicacoes/-/publicacao/74185/manual-de-seguranca-e-qualidade-para-a-cultura-do-cafe (accessed on 20 October 2025).
- Embrapa. (2022). Sistemas de produção: Café (Tech. Rep. No. N° 1). Infoteca-e. Série Sistemas de Produção. Embrapa. Available online: https://www.infoteca.cnptia.embrapa.br/infoteca/bitstream/doc/1148365/1/Sistemas-de-Producao-1-Cafe.pdf (accessed on 29 November 2025).
- EMBRAPA Agricultura Digital. (2024, November). Semear digital: Embrapa e sindicato rural de caconde celebram parceria para ações de pd&i. Available online: https://www.embrapa.br/en/busca-de-noticias/-/noticia/95149275/semear-digital-embrapa-e-sindicato-rural-de-caconde-celebram-parceria-para-acoes-de-pdi (accessed on 2 November 2025).
- Empresa Brasileira de Pesquisa Agropecuária (Embrapa). (2024). Balanço social 2024. Available online: https://www.embrapa.br/en/balanco-social-2024 (accessed on 15 October 2025).
- European Parliament and Council of the European Union. (2023). Regulation (EU) 2023/1114 of the European parliament and of the council on markets in crypto-assets (MiCA). Official Journal of the European Union, 150, 40–205. [Google Scholar]
- Faria de Abreu Campos, R., Paulo Domingues, É., Souza Magalhães, A., & Marques do Prado Tanure, T. (2024). The economic impacts of the rural credit: An analysis of the Brazilian national family farming strengthening program by biome. Regional Science Policy & Practice, 16(10), 100115. [Google Scholar] [CrossRef] [Scilit]
- Gurusamy, U., Vijayarajan, S., Gunasekaran, P. K., & Anantharaman, M. (2025). Impact of blockchain technology in agriculture supply chain: A comprehensive review of applications, challenges, and future directions. Journal of Sustainable Competitive Intelligence, 15, e0519. [Google Scholar] [CrossRef] [Scilit]
- Han, J., Lee, J., & Li, T. (2025). A review of DAO governance: Recent literature and emerging trends. Journal of Corporate Finance, 91, 102734. [Google Scholar] [CrossRef] [Scilit]
- Hendrikse, G., & Bijman, J. (2002). Ownership structure in agrifood chains: The marketing cooperative. American Journal of Agricultural Economics, 84(1), 104–119. [Google Scholar] [CrossRef] [Scilit]
- Johnson, N. (2018, January). Dividend-bearing tokens on ethereum. Available online: https://weka.medium.com/dividend-bearing-tokens-on-ethereum-42d01c710657 (accessed on 22 December 2025).
- Kumarathunga, M., Calheiros, R. N., & Ginige, A. (2022). Smart agricultural futures market: Blockchain technology as a trust enabler between smallholder farmers and buyers. Sustainability, 14(5), 2916. [Google Scholar] [CrossRef] [Scilit]
- Li, R., Hu, X., Wang, Q., Duan, S., & Wang, Q. (2026). Transaction fairness in blockchains, revisited. IEEE Transactions on Dependable and Secure Computing, 23(1), 752–765. [Google Scholar] [CrossRef] [Scilit]
- Mafrur, R. (2025, July). Tokenize everything, but can you sell it? RWA liquidity challenges and the road ahead (Working Paper). Available online: https://ssrn.com/abstract=5377590 (accessed on 25 November 2025).
- Matiello, J. B., Santinato, R., Almeida, S. A. R. D., & Garcia, A. W. R. (2024). Cultura do café no Brasil (11th ed.). Fundação Procáfe. [Google Scholar]
- Moreira-Dantas, I., Martínez-Zarzoso, I., Henning, C., & Souza dos Santos, M. (2023). Rural credit acquisition for family farming in Brazil: Evidence from the Legal Amazon. Journal of Rural Studies, 101, 103041. [Google Scholar] [CrossRef] [Scilit]
- OECD. (2022). Insights into the measurement of agricultural total factor productivity and the environment. Available online: https://www.oecd.org/content/dam/oecd/en/networks/network-on-agricultural-total-factor-productivity-and-the-environment/Insights-Into-The-Measurement-Of-Agricultural-Total-Factor-Productivity-And-The-Environment%20_220511_1617.pdf (accessed on 28 October 2025).
- Organisation for Economic Co-Operation and Development (OECD). (2023). Agricultural policy monitoring and evaluation 2023. OECD Publishing. [Google Scholar] [CrossRef] [Scilit]
- Organização das Cooperativas Brasileiras (OCB). (2024). Anuário do cooperativismo brasileiro 2024. Available online: https://somoscooperativismo.coop.br/anuario (accessed on 30 September 2025).
- Rainato, C. H. R., Borém, F. M., Cirillo, M. A., & Oliveira, E. C. (2012). Qualidade do café secado em terreiros com diferentes pavimentações e espessuras de camada. Coffee Science, 7(3), 223–237. [Google Scholar]
- Ronquim, C. C., & Chies, V. (2023). Pequenas propriedades predominam em caconde, maior produtor de café de sp (Based on spatial mapping study). Embrapa Territorial. Available online: https://www.embrapa.br/busca-de-noticias/-/noticia/83223396/pequenas-propriedades-predominam-em-caconde-maior-produtor-de-cafe-de-sp (accessed on 28 October 2025).
- Ronquim, C. C., Rodrigues, C. A. G., Franzin, J. P., Scarazatti, B., Alvarez, I. A., & Garçon, E. A. M. (2023). Caracterização e distribuição espacial das áreas cafeeiras e florestais nativas de Caconde–SP. In Anais do xx simpósio brasileiro de sensoriamento remoto (pp. 700–703). Instituto Nacional de Pesquisas Espaciais (INPE). Available online: http://www.alice.cnptia.embrapa.br/alice/handle/doc/1153156 (accessed on 9 December 2025).
- Santinato, F., Ruas, R. A. A., Silva, R. P. D., Duarte, A. P., & Santinato, R. (2015). Análise econômica da colheita mecanizada do café utilizando repetidas operações da colhedora. Coffee Science, 10(3), 402–411. [Google Scholar]
- Sebrae. (2023). Como montar uma unidade de beneficiamento de café (Tech. Rep.). Sebrae MG. Available online: https://bibliotecas.sebrae.com.br/chronus/ARQUIVOS_CHRONUS/bds/bds.nsf/B1AA061C76EEEF1A832574DC0045D5DE/$File/NT00039062.pdf (accessed on 1 November 2025).
- Souza Machado, B., Lelis, L., De Figueiredo Silva, F., & De Carvalho Reis Neves, M. (2024). Credit and off-farm income: An analysis of the PRONAF on family-owned farms in Brazil. In 2024 annual meeting, agricultural and applied economics association (AAEA). AgEcon Search. [Google Scholar] [CrossRef]
- Walsh, C., O’Reilly, P., Gleasure, R., McAvoy, J., & O’Leary, K. (2021). Understanding manager resistance to blockchain systems. European Management Journal, 39(3), 353–365. [Google Scholar] [CrossRef] [Scilit]
- Wang, X., Weng, Z., Liu, L., & Liu, J. (2024). Factors that facilitated the development of blockchain technology in the AEC industry: Study based on system dynamics. Journal of Management in Engineering, 40(6), 04024049. [Google Scholar] [CrossRef] [Scilit]
- Yanovich, Y., Shuklin, M., & Madhwal, Y. (2025). Gas consumption minimization for dividend payout smart contract. In Proceedings of the 2024 7th international conference on blockchain technology and applications (pp. 1–10). Association for Computing Machinery. [Google Scholar] [CrossRef] [Scilit]
- Zetzsche, D. A., Annunziata, F., Arner, D. W., & Buckley, R. P. (2020). The markets in crypto-assets regulation (mica) and the eu digital finance strategy (Working Paper No. EBI Working Paper No. 2020/77; Luxembourg Law WP No. 2020-018; HKU Law Research Paper No. 2020/059). European Banking Institute; University of Luxembourg Law Department; The University of Hong Kong Faculty of Law. [Google Scholar] [CrossRef] [Scilit]
- Zheng, Y., Liao, F., & Tian, M. (2025). Examining the factors influencing the digital transformation of new agricultural operating entities: Insights from Zhejiang, China. Humanities and Social Sciences Communications, 12, 608. [Google Scholar] [CrossRef] [Scilit]

Disclaimer/Publisher’s Note: The statements, opinions and data contained in all publications are solely those of the individual author(s) and contributor(s) and not of MDPI and/or the editor(s). MDPI and/or the editor(s) disclaim responsibility for any injury to people or property resulting from any ideas, methods, instructions or products referred to in the content. |
© 2026 by the authors. Licensee MDPI, Basel, Switzerland. This article is an open access article distributed under the terms and conditions of the Creative Commons Attribution (CC BY) license.