


Abstract
Post-socialist economies in Central and Eastern Europe, the Western Balkans, the Eastern Partnership, and Central Asia inherited energy-intensive industrial structures and now diverge widely in digital adoption and decarbonisation, which makes them a revealing setting for the twin transition. This study examines how the digital and green transitions relate to real GDP per capita growth in 24 transition economies over 1996–2023 and whether industrial competitiveness conditions these relationships. Composite indices are constructed through principal component analysis. Following first- and second-generation diagnostic tests, the analysis employs fixed effects with Driscoll–Kraay standard errors, panel-corrected standard errors, system GMM, common correlated effects, and cross-sectionally augmented ARDL estimators, together with panel Granger non-causality tests robust to cross-sectional dependence. The digital transition, the green transition, and industrial competitiveness are each positively associated with growth. The central finding is an asymmetric moderation pattern. Industrial competitiveness strengthens the growth association of digitalisation but weakens that of greening, so that the green growth association appears concentrated in less industrialised economies. Granger predictive relationships run in both directions between each transition and growth and from industrial competitiveness to the green transition. The pattern is robust across subregions, EU and non-EU groups, the 2005–2023 period, alternative index constructions, and alternative treatments of missing data, although the green coefficient and its interaction with industrial competitiveness are not statistically significant in the 1997–2004 subsample. The system GMM and CS-ARDL estimates are treated as supplementary evidence. The evidence, which consists of conditional associations rather than causal effects, suggests that twin transition support may be more effective when it takes the industrial conditions of each economy into account rather than being applied as a uniform package.
1. Introduction
The simultaneous pursuit of digitalisation and decarbonisation, commonly labelled the twin transition, has moved from a policy slogan to the organising principle of economic strategy in Europe and its neighbourhood. The European Commission frames digital and green transformation as mutually reinforcing processes that should jointly raise productivity, secure competitiveness, and deliver climate neutrality. Academic scrutiny of this proposition has intensified, yet the evidence remains fragmented and frequently optimistic about synergies that are rarely tested directly (Diodato et al., 2023; Kovacic et al., 2024). Recent regional studies show that digital and green capabilities do not automatically co-evolve and that their joint effect on economic and environmental outcomes depends on local productive structures (Bianchini et al., 2023; Fazio et al., 2025). A central unresolved question therefore concerns the conditions under which the twin transition translates into faster growth rather than into adjustment costs.
The question carries particular weight for the post-socialist economies of Central and Eastern Europe, the Western Balkans, the Eastern Partnership, and Central Asia. These economies inherited energy-intensive industrial structures, obsolete telecommunication networks, and weak market institutions from central planning. Over three decades, their trajectories diverged sharply. Several Central European economies integrated into European manufacturing value chains and joined the European Union, whereas others remained dependent on natural resources, remittances, or low-value manufacturing (Hamilton & de Vries, 2025; Lu & Staehr, 2025). Digital diffusion accelerated across the entire region after the mid-2000s, while the green transition proceeded unevenly because of carbon-intensive power systems, subsidised energy prices, and heavy industry legacies (Fedajev et al., 2023; Rodríguez-Pose & Bartalucci, 2024). The region thus offers a natural laboratory for examining how the growth associations of digital and green transformations depend on the industrial base.
The policy environment of the region reinforces the relevance of this question. The Central and Eastern European members of the European Union are bound by the European Green Deal, the Fit for 55 package, and the Digital Decade targets, and they receive substantial cohesion and recovery funding earmarked for climate and digital objectives. The Western Balkan economies have committed to the Green Agenda for the Western Balkans and align their energy regulation with European rules through the Energy Community. The Eastern Partnership economies pursue approximation with European standards under association agreements, although the war in Ukraine has reshaped their priorities. The Central Asian economies, including Kazakhstan and Uzbekistan, have adopted national digital strategies and carbon neutrality targets while remaining heavily dependent on fossil fuels and energy-intensive industries. Despite these differences, all 24 economies face the same strategic dilemma of how to combine digital modernisation, decarbonisation, and industrial upgrading with rapid income convergence. Evidence on which combination of policies delivers growth is therefore of direct relevance to policymakers across the region.
The four subgroups also differ markedly in their structural starting points, which shapes the heterogeneity examined later in the analysis. The Central and Eastern European economies are deeply integrated into European manufacturing value chains, particularly in automotive, machinery, and electronics production, and they combine comparatively high industrial competitiveness with advanced digital diffusion. The Western Balkan economies feature weaker industrial bases, a larger weight of services, remittances, and low-value manufacturing, and power systems that still rely heavily on lignite or ageing hydropower. The Eastern Partnership economies are highly heterogeneous, ranging from the hydrocarbon-based economy of Azerbaijan and the heavy-industry legacy of Ukraine to the more services-oriented and agricultural economies of Georgia, Armenia, and Moldova. The Central Asian economies rely heavily on fossil fuels, extractive industries, and energy-intensive processing, with the exception of the hydropower-based electricity systems of Kyrgyzstan and Tajikistan, although digital adoption across the subregion has accelerated rapidly since the late 2010s. These contrasts imply that the same digital or green policy impulse meets very different industrial conditions across the sample.
The existing literature leaves three gaps. First, a large body of research documents the growth and productivity effects of information and communication technologies (Kurniawati, 2022; Olczyk & Kuc-Czarnecka, 2022; Pan et al., 2022; Verma et al., 2023) and of renewable energy (Simionescu et al., 2023; Q. Wang et al., 2022) separately, and the broader relationship between digitalisation, greening, and economic performance has also been examined jointly in several recent studies. These studies assess digital transformation, sustainability, and economic performance in European Union countries (Bocean & Vărzaru, 2023; Meidute-Kavaliauskiene et al., 2026), trace the historical co-evolution of energy and information transitions (Fouquet & Hippe, 2022), and document the twin innovation profiles and environmental effects of digital and green capabilities in European regions (Bianchini et al., 2023; Fazio et al., 2025). They either concentrate on environmental and innovation outcomes or treat the effects of the two transitions as homogeneous across productive structures. Second, the role of industrial competitiveness as a conditioning factor has received limited attention. The new economics of industrial policy emphasises that manufacturing capabilities shape the returns to technology adoption and the costs of structural change (Juhász et al., 2024; Kruse et al., 2023), yet empirical growth models rarely allow the effects of digitalisation and greening to vary with industrial strength, and none, to the best of available knowledge, examines whether this conditioning differs in sign between the two transitions. Third, evidence on post-socialist economies beyond the European Union, including the Western Balkans, the Caucasus, and Central Asia, is thin. Existing studies focus either on European Union members (Bocean & Vărzaru, 2023; Mura & Donath, 2023) or on individual subregions (Halilbegović et al., 2023; Sobirov et al., 2025), which obscures heterogeneity across the post-socialist region.
This study addresses these gaps by examining the growth associations of the digital and green transitions in 24 transition economies over the period 1996–2023, with explicit attention to the moderating role of industrial competitiveness. Composite indices of digital transition, green transition, industrial competitiveness, and institutional quality are constructed through principal component analysis. The empirical strategy follows a sequence of diagnostic and estimation steps suited to macro panels with a moderate time dimension. Cross-sectional dependence, heteroskedasticity, and serial correlation tests guide the choice of estimators. First- and second-generation panel unit root tests and cointegration tests establish the time-series properties of the data. Baseline effects are estimated with pooled, fixed effects, random effects, Driscoll–Kraay, and panel-corrected standard error estimators. Moderation effects are estimated with mean-centred interaction terms using fixed effects with Driscoll–Kraay errors, the two-step system generalised method of moments, and panel-corrected standard errors. Common correlated effects and cross-sectionally augmented autoregressive distributed lag estimators address unobserved common factors and the mixed integration orders of the variables. Dumitrescu–Hurlin tests with bootstrap inference, half-panel jackknife Granger non-causality tests, and a set of subsample and sensitivity estimations complete the analysis.
Three research questions guide the analysis. The first asks whether the digital and green transitions are associated with higher real GDP per capita growth in post-socialist economies once institutional quality, trade openness, and capital accumulation are controlled for. The second asks whether industrial competitiveness conditions these associations, and whether it does so symmetrically for the two transitions. The third asks whether the relationships display predictive ordering from the transitions to growth, from growth to the transitions, or feedback in both directions, in the Granger sense rather than in a structural causal sense. Answering these questions requires an empirical design that accommodates the strong interdependence of economies in the region, the persistence of growth, and the possibility that transition indicators respond to income levels. The study makes one central contribution and two supporting ones. The central contribution is the identification of an asymmetric moderating role of industrial competitiveness. Industrial competitiveness strengthens the growth association of digitalisation but weakens that of greening, a pattern that has not been documented for transition economies and that offers a structural explanation for the mixed evidence on digital and green growth effects (Fazio et al., 2025; Gao, 2025). The design compares the conditional growth associations of the two transitions within a single specification and does not directly test whether digitalisation and greening reinforce or offset each other, so a supplementary digital and green interaction is reported only as an auxiliary check. The first supporting contribution is empirical coverage, since the analysis extends growth-focused twin transition evidence beyond European regions and Chinese cities (Lyu et al., 2023) to a broad sample of post-socialist economies that includes the Western Balkans, the Eastern Partnership, and Central Asia. The second supporting contribution is methodological, since the conditional associations are assessed with estimators that account for cross-sectional dependence, unobserved common factors, mixed integration orders, and alternative index constructions.
The remainder of the article proceeds as follows: Section 2 reviews the literature and develops the hypotheses. Section 3 describes the data, the construction of composite indices, and the econometric strategy. Section 4 presents the empirical results. Section 5 discusses the findings in light of previous studies, and Section 6 concludes with policy implications, limitations, and directions for future research. Appendix A documents data coverage, imputation, and the system GMM specifications.
2. Literature Review and Hypothesis Development
2.1. Digital Transition and Economic Growth
Endogenous growth theory treats information and communication technologies as general-purpose technologies that raise productivity through lower transaction costs, faster diffusion of knowledge, and complementary organisational innovation. Empirical evidence broadly supports a positive relationship between digital diffusion and growth, although the magnitude varies with income level, complementary skills, and the stage of adoption. Across Asian economies, Kurniawati (2022) finds that internet, mobile, and fixed broadband penetration raise economic growth, with stronger effects in lower-income countries where the marginal benefit of connectivity is larger. Verma et al. (2023) report that ICT diffusion and financial development jointly promote growth in developing economies, which points to the enabling role of digital infrastructure for financial intermediation and market access. In a similar vein, Imomkulov et al. (2026) show that internet connectivity and financial development each raise growth in the BRICS economies and that their combined effect exceeds the sum of the individual effects, a result that holds across the conditional growth distribution.
Evidence from Europe confirms these patterns while revealing strong heterogeneity. Olczyk and Kuc-Czarnecka (2022) show that improvements in the Digital Economy and Society Index are associated with higher growth in European Union member states, with the strongest gains arising from human capital and the integration of digital technologies into business. Mura and Donath (2023) confirm a positive association between digitalisation and growth in the European Union, and Bocean and Vărzaru (2023) find that digital transformation improves both economic performance and sustainability outcomes. At the regional level, Rehman and Nunziante (2023) document that the digital economy raises total factor productivity in European regions, while Pan et al. (2022) identify innovation as the main channel through which the digital economy lifts productivity. Firm-level studies add nuance. Gaglio et al. (2022) show that digital transformation enhances innovation and productivity among small manufacturing enterprises, and Cirillo et al. (2023) demonstrate that the returns to digital adoption depend on investment, skills, and work organisation. Evidence for the non-European post-socialist economies is more limited but consistent. Sobirov et al. (2025) find that ICT acts as an engine of sustainable growth in Central Asia, and Smailov et al. (2026) show that digital infrastructure and structural transformation improve welfare outcomes in the same region. For the Central and Eastern European economies, Yusubov and Csonka (2026) report that societal digital usage and digital public services support the export performance of small and medium enterprises. Collectively, this literature suggests that digital diffusion supports growth in transition economies through market integration, productivity gains, and improved public service delivery. Nevertheless, this literature is not free of disagreement. Cross-country studies tend to report larger returns in lower-income economies with greater scope for catch-up (Kurniawati, 2022), whereas firm-level evidence suggests that returns are largest where complementary skills and organisational capabilities are already present (Cirillo et al., 2023). Most studies also infer growth effects from penetration measures that do not distinguish access from productive use, and the direction of causality remains contested because higher incomes finance digital investment. Taking these disagreements into account, the weight of evidence still points to a positive average relationship, and the first hypothesis follows.
Hypothesis 1 (H1).
The digital transition is positively associated with real GDP per capita growth in transition economies.
2.2. Green Transition and Economic Growth
The growth effects of the green transition are theoretically ambiguous. On the one hand, lower energy intensity reduces production costs and exposure to fossil fuel price shocks, renewable energy investment stimulates demand and innovation, and cleaner production can improve competitiveness in markets that increasingly price carbon. On the other hand, decarbonisation imposes adjustment costs, strands carbon-intensive capital, and raises energy prices during the transition. Recent macroeconomic evidence suggests that the net effect is not negative. Metcalf and Stock (2023) find no adverse effect of European carbon taxes on GDP or employment growth, and Q. Wang et al. (2022) report that renewable energy promotes growth, particularly in countries with low country risk.
Studies focusing on Europe and the post-socialist space present a more mixed picture. Simionescu et al. (2023) show that the renewable energy and growth nexus in the European Union differs by sector, with transport-sector renewables supporting growth while industrial renewable use responds to rather than drives growth. Fedajev et al. (2023) find that electricity infrastructure and renewable energy support industrial and economic growth in Central and Eastern Europe, and Halilbegović et al. (2023) confirm positive growth effects of renewable energy in Southeastern Europe. Zou et al. (2026), by contrast, find that renewable energy adoption accompanies rather than independently drives income convergence in Central and Eastern Europe. Beyond Europe, Ahmed et al. (2022) show that renewable energy consumption supports growth while reducing the ecological footprint when environmental regulations and democratic institutions are strong, and C. Chen et al. (2022) document threshold effects of renewable energy on emissions, which implies that the benefits of greening depend on the scale of adoption. Q. Wang et al. (2023) further emphasise that trade openness, human capital, and renewable energy jointly shape the growth and environment relationship across countries. Evidence for European Union economies adds that green innovation significantly reduces CO2 emissions, whereas environmental taxation is positively associated with emissions, which suggests that fiscal instruments alone may not deliver decarbonisation (Babakhonov et al., 2026).
A growing body of research also highlights the distributional and territorial costs of decarbonisation. Rodríguez-Pose and Bartalucci (2024) show that less developed regions in Southern and Eastern Europe are the most exposed to the socio-economic disruption associated with climate policy. Such costs are concentrated in regions dominated by carbon-intensive manufacturing and mining, which is directly relevant to transition economies with heavy industry legacies. Existing literature has therefore not reached consensus on the growth effects of the green transition. Some studies argue that adjustment costs triggered by decarbonisation, stranded assets, and higher energy prices dampen growth, at least temporarily (Rodríguez-Pose & Bartalucci, 2024), while others hold that efficiency gains, lower exposure to fuel price shocks, and new renewable industries raise growth (Fedajev et al., 2023; Q. Wang et al., 2022). The disagreement partly reflects differences in measurement, since some studies capture the state of the energy system and others capture the speed of change, and partly reflects differences in sectoral composition across samples. On balance, the evidence suggests that efficiency gains and cleaner energy mixes support growth once the initial adjustment is absorbed. The second hypothesis follows.
Hypothesis 2 (H2).
The green transition is positively associated with real GDP per capita growth in transition economies.
2.3. Industrial Competitiveness as a Growth Driver and a Conditioning Factor
Manufacturing has long been regarded as an engine of growth because of its scope for productivity growth, economies of scale, and technological spillovers. Recent evidence challenges the view that deindustrialisation is inevitable in developing and emerging economies. Kruse et al. (2023) document a manufacturing renaissance in parts of the developing world, and Nguimkeu and Zeufack (2024) show that manufacturing remains a viable path to structural transformation. Evidence for the Next-11 economies similarly identifies industrial output, energy consumption, human capital, and institutional quality as significant growth determinants (Mamadiyarov et al., 2026). Fan et al. (2023) demonstrate that service-led growth can raise aggregate productivity but tends to distribute gains unevenly, which reinforces the role of tradable manufacturing in broad-based development. For transition economies specifically, Hamilton and de Vries (2025) show that the reallocation of labour and capital away from socialist-era industries shaped subsequent productivity trajectories, with more successful economies rebuilding competitive manufacturing capacity integrated into European value chains.
Industrial competitiveness may also condition the growth effects of digital and green transitions. The new economics of industrial policy argues that the returns to technology depend on complementary capabilities, coordination, and absorptive capacity (Juhász et al., 2024). Economies with competitive manufacturing sectors possess the engineering skills, supplier networks, and management practices required to convert digital technologies into productivity gains. Benassi et al. (2022) show that patenting in fourth industrial revolution technologies raises firm performance, and Ghobakhloo et al. (2022) argue that advanced manufacturing systems translate digitalisation into sustainable value creation. Similarly, Wan et al. (2025) show that the digitalisation of services promotes green technological progress in manufacturing sectors, which illustrates how industrial structure mediates the diffusion of digital benefits. These arguments imply that digitalisation should produce larger growth dividends where industrial competitiveness is higher.
The relationship between industrial competitiveness and the green transition may run in the opposite direction. Highly industrialised economies face larger decarbonisation costs because manufacturing is energy-intensive and relies on long-lived capital. Rodríguez-Pose and Bartalucci (2024) and Fouquet and Hippe (2022) emphasise that energy transitions historically imposed significant adjustment costs on industrial regions before yielding productivity gains. In less industrialised transition economies, by contrast, the green transition often takes the form of efficiency improvements from a very low base, the replacement of obsolete capacity, and the development of new renewable energy sectors, all of which can generate growth with limited stranding of existing assets. This reasoning suggests that industrial competitiveness attenuates the marginal growth association of greening.
A competing argument deserves acknowledgement. The Industrial Competitiveness Index measures manufacturing value added, technological sophistication, and manufactured exports rather than dependence on carbon-intensive industry, and the engineering skills and managerial capabilities that support digital adoption could equally help competitive manufacturers adopt cleaner processes and enter green product markets. Under this view, industrial competitiveness would amplify rather than attenuate the growth returns to greening. Two features of the sampled economies suggest that adjustment costs are nonetheless likely to dominate over the sample period. First, competitive manufacturing in the region is concentrated in automotive, metals, chemicals, and other energy-intensive supplier activities embedded in European value chains and relies on power systems with large coal and gas shares, so that higher industrial competitiveness coincides in practice with greater exposure to decarbonisation costs, even though the index does not measure carbon intensity directly. Second, much of this capacity operates as assembly and intermediate production for foreign parent firms, which limits the local capture of the innovation rents of green technologies while leaving local plants to bear the costs of process conversion and higher energy prices. The negative moderation hypothesis is therefore interpreted as a statement about the net balance between adjustment costs and capability gains in these economies, not as a claim that industrial competitiveness is inherently incompatible with greening. Because the literature on industrial capabilities remains divided on this balance, its empirical sign is an open question. The third and fourth hypotheses follow.
Hypothesis 3 (H3).
Industrial competitiveness is positively associated with real GDP per capita growth in transition economies.
Hypothesis 4a (H4a).
Industrial competitiveness positively moderates the association between the digital transition and growth.
Hypothesis 4b (H4b).
Industrial competitiveness negatively moderates the association between the green transition and growth.
2.4. The Twin Transition and the Post-Socialist Context
The twin transition literature stresses that digital and green processes interact. Digital technologies can support decarbonisation through smart grids, process optimisation, and dematerialisation, but they also increase electricity demand and may generate rebound effects (Mäkitie et al., 2023; Santarius et al., 2023). Evidence on these interactions is mixed. Bianchini et al. (2023) show that the environmental benefits of digital technologies in European regions are conditional on green capabilities, and Cicerone et al. (2023) find that regional artificial intelligence knowledge supports specialisation in environmental technologies. Fazio et al. (2025) document that European regions rarely combine strong digital and green innovation profiles, which suggests limited spontaneous synergy. Chatzistamoulou (2023) finds that digital transformation supports the sustainability transition of European small and medium enterprises, whereas Kovacic et al. (2024) and Gao (2025) question the coherence of European twin transition policy, noting tensions between digital leadership and sustainability objectives. Bănică et al. (2024) add that institutional quality conditions the ability of regions to use recovery funds for the twin transition.
Evidence from outside Europe reinforces the importance of context. Studies of the digital economy in China document positive effects on carbon performance, green productivity, and green development efficiency (Luo et al., 2022; J. Wang et al., 2022; Zhang et al., 2022), often through industrial upgrading channels. Shahbaz et al. (2022) find that the digital economy accelerates the energy transition globally and that government governance mediates this effect. Z. Chen and Xing (2025) show that the digital economy supports high-quality economic development through green innovation. Q. Wang et al. (2024) report that the emissions effect of ICT depends on trade openness and financial development, while Ha et al. (2022) show that digitalisation improves environmental performance in European countries. Meidute-Kavaliauskiene et al. (2026) find that ICT employment and environmental protection investment are positively associated with income across European Union economies. For transition economies, institutional quality and macroeconomic shocks add further layers of complexity. Institutions shape both the growth process and the effectiveness of structural reforms. Lu and Staehr (2025) show that growth and real convergence in post-communist economies depend strongly on institutional and structural conditions, and Mihajlović (2025) finds that institutional quality mediates debt threshold effects on growth in post-communist European Union members. Trade openness and capital formation remain core growth determinants (Seti et al., 2025). Shocks such as the COVID-19 pandemic and the Russia–Ukraine war disproportionately affected the region through trade, energy, and financial channels (Liadze et al., 2023). The analysis therefore controls for trade openness, gross fixed capital formation, and institutional quality, and it tests robustness to the exclusion of major shock years. Figure 1 summarises the conceptual framework and the hypothesised relationships.
Figure 1.
Conceptual framework. Solid arrows denote hypothesised direct associations with real GDP per capita growth (H1 to H3). Dashed arrows denote the hypothesised moderating role of industrial competitiveness in the growth associations of the digital (H4a) and green (H4b) transitions.
2.5. Synthesis and Research Gap
The reviewed literature supports three broad conclusions. First, digital diffusion and green transformation each have the potential to raise growth, but their effects vary with income level, sectoral composition, and institutional capacity. Second, the interaction between digital and green processes is neither automatically synergistic nor uniformly conflicting. It depends on the productive structure that absorbs new technologies and bears the cost of decarbonisation. Third, industrial capabilities play a central role in shaping the returns to technological change, yet they are usually treated as a separate growth determinant or as a channel rather than as a condition that alters the marginal effects of the twin transition. These conclusions reveal a specific research gap. Existing studies of the twin transition focus predominantly on environmental outcomes, on European regions, or on Chinese provinces and cities (Bianchini et al., 2023; Luo et al., 2022; Lyu et al., 2023). Studies of growth in transition economies focus on institutions, convergence, and finance but rarely incorporate digital and green dimensions jointly (Lu & Staehr, 2025; Mihajlović, 2025). No study, to the best of available knowledge, has examined whether industrial competitiveness amplifies or attenuates the growth effects of the digital and green transitions across a broad sample of post-socialist economies, including the Western Balkans, the Eastern Partnership, and Central Asia. The present study fills this gap by combining composite measurement, moderation analysis, and panel causality testing within a unified empirical framework.
2.6. Industrial Competitiveness as a Moderator
Mediating and moderating variables play distinct theoretical roles (Baron & Kenny, 1986). A mediating variable transmits the effect of an explanatory variable to the outcome. It explains how or why an effect occurs and requires that the explanatory variable first changes the mediator, which in turn changes the outcome. A moderating variable, by contrast, alters the strength or direction of the relationship between an explanatory variable and the outcome. It explains when or for whom an effect occurs and need not be caused by the explanatory variable. Mediation is tested by decomposing a total effect into direct and indirect components, whereas moderation is tested through interaction terms that allow the marginal effect of the explanatory variable to vary with the level of the moderator. Industrial competitiveness is specified as a moderator for three reasons. First, the theoretical arguments reviewed above emphasise that manufacturing capabilities change the returns to digital and green investments rather than simply transmitting them, since the same digital or green impulse yields different growth payoffs depending on absorptive capacity and the installed industrial base. Second, industrial competitiveness reflects slow-moving structural characteristics built up over decades of industrialisation and value chain integration, which makes it more plausible as a condition shaping the returns to the twin transition than as an outcome that responds quickly to it within a given year. Third, a mediation design would require credible identification of the effect of each transition on industrial competitiveness and of industrial competitiveness on growth, which is difficult to achieve with 24 cross-sections. The empirical design therefore treats industrial competitiveness as a moderator and tests its role through interaction terms, which provides a direct test of the conditional associations implied by the theory. Because the design is observational, all hypotheses are formulated in terms of associations and conditional associations rather than causal effects.
3. Materials and Methods
3.1. Sample and Data
The sample comprises 24 transition economies observed annually from 1996 to 2023, which yields a balanced panel of 672 economy-year observations. Three criteria guided sample selection. First, each economy operated a centrally planned socialist system before 1990 and subsequently undertook a transition to a market economy. Second, each economy provides observed data for most of the sample period for every constituent indicator, which supports the use of panel time-series tests. Leading gaps of up to six years remain only for Montenegro and Kosovo, whose statistical systems were established after later state separations, and these gaps are documented in Table A1. Third, economies with prolonged gaps in core national accounts or energy series, or with structural breaks that prevent consistent measurement over the period, are excluded. The economies are grouped into four subregions. The Central and Eastern European group includes Poland, Czechia, Slovakia, Hungary, Slovenia, Croatia, Estonia, Latvia, and Lithuania. The Western Balkan group includes Serbia, Albania, North Macedonia, Bosnia and Herzegovina, Montenegro, and Kosovo. The Eastern Partnership group includes Ukraine, Moldova, Georgia, Armenia, and Azerbaijan. The Central Asian group includes Kazakhstan, Kyrgyzstan, Tajikistan, and Uzbekistan. The starting year reflects the first release of the Worldwide Governance Indicators in 1996 and the end of the most acute phase of post-socialist output collapse, while the final year is the most recent with complete coverage across all series.
Table 1 describes the variables, their roles, and their sources. The dependent variable is the annual growth rate of real GDP per capita (RGDPG). The two focal explanatory variables are the Digital Transition Index (DIG) and the Green Transition Index (GRN). The Industrial Competitiveness Index (IND) serves as the moderator. Trade openness (OPEN), gross fixed capital formation (GFCF), and the Institutional Quality Index (INST) serve as controls. Data are drawn from the World Bank World Development Indicators and the World Bank Worldwide Governance Indicators. Because the governance indicators were published biennially until 2002, values for 1997, 1999, and 2001 are obtained by linear interpolation. Short interior gaps between observed values in the early years of newly established statistical systems are also completed by linear interpolation to preserve the balanced structure of the panel. Missing observations at the beginning or end of a series require a different treatment, since interpolation is not possible without an observed endpoint. These leading and trailing gaps are filled by carrying forward or backward the nearest observed value and are flagged separately from interpolated values. Table A1 in Appendix A reports, for each economy and variable, the number of interpolated interior observations, the number of filled leading or trailing observations, and the years affected. Two counting units are distinguished. The 18 constituent indicators listed in Table 1, namely the growth series, the three indicators of each of the digital, green, and industrial indices, the two single-series controls, and the six governance indicators, yield 12,096 underlying indicator observations over the 672 economy-years. The counts in Table A1 are recorded for the seven model variables, so that each cell counts the economy-years in which at least one constituent of the variable is imputed, out of 4704 variable-level observations. On this basis, 286 variable-level observations, or 6.1 percent, contain interior interpolated values and 124, or 2.6 percent, contain values filled at the series endpoints. The governance interpolation for 1997, 1999, and 2001 accounts for 72 of the interpolated variable-level observations and for 432 underlying indicator observations, since all six governance indicators are interpolated jointly in these years. The remaining imputations are concentrated in Kosovo, Montenegro, and Tajikistan, particularly in the late 1990s and early 2000s. Section 4.8 examines the sensitivity of the results to the removal of the endpoint-filled values, to the exclusion of the most heavily imputed economy-years, and to multiple imputation. Because the governance indicators are unavailable for 1997, 1999, and 2001 in every economy, removing the interpolated governance values would eliminate three complete years from the panel and interrupt the annual lag structure required by the dynamic estimators. The interpolated governance values are therefore retained in all sensitivity specifications.
Table 1.
Variables, descriptions, and data sources.
3.2. Construction of Composite Indices
Digital transition, green transition, industrial competitiveness, and institutional quality are multidimensional concepts that no single indicator captures adequately. Each is therefore measured by a composite index obtained through principal component analysis. The constituent variables are first standardised to zero mean and unit variance. Indicators for which higher values denote a weaker transition, namely carbon dioxide emissions per unit of GDP and energy intensity, are inverted so that higher index values consistently represent a more advanced transition. The first principal component of each block is retained, and the resulting score is standardised again to zero mean and unit variance over the pooled sample. The index for economy in year is computed as follows:
where is the composite index, denotes the standardised value of constituent indicator , is the number of constituent indicators, and is the loading of indicator k on the first principal component. The digital index combines internet users, mobile cellular subscriptions, and fixed telephone lines. The green index combines inverted carbon intensity, the renewable share of final energy consumption, and inverted energy intensity. The industrial competitiveness index combines manufacturing value added as a share of GDP, the medium and high technology share of manufacturing value added, and manufactured exports as a share of merchandise exports. The institutional quality index combines the six Worldwide Governance Indicators. Principal component weights are preferred to equal weights because the constituent indicators differ in their variance and in the strength of their co-movement, and data-driven weights avoid arbitrary judgements about relative importance. Standardising the pooled scores preserves both cross-economy and over-time variation, which is essential for within-country estimation, and yields coefficients that can be interpreted as the effect of a one standard deviation change in each index. The adequacy of this procedure is assessed with the Kaiser–Meyer–Olkin measure and Bartlett’s test of sphericity.
Two components warrant specific justification. Fixed telephone lines are retained in the digital index because, over the 1996–2023 period, they capture the legacy network infrastructure on which early dial-up and digital subscriber line internet access was built, and they remain correlated with fixed broadband availability in later years. Their meaning nevertheless changes over time as mobile and fibre technologies substitute for copper lines, so a sensitivity analysis excludes this component and replaces it with fixed broadband subscriptions where available. The green index, in turn, measures the environmental and energy conditions of an economy, namely its carbon and energy efficiency and the renewable share of its energy mix, rather than the speed of an ongoing transition. Because carbon intensity and energy intensity are expressed per unit of GDP, they can improve through faster output growth as well as through lower emissions or energy use, which raises the possibility of a mechanical association with contemporaneous growth. Two features mitigate this concern. The index is constructed from levels of intensity, so a single year of fast growth changes it only marginally relative to its cross-economy and long-run variation, and it includes the renewable share of final energy consumption, which does not contain GDP in its denominator. Section 4.8 further reports estimates in which carbon intensity is replaced by carbon dioxide emissions per capita and in which carbon intensity and energy intensity are excluded in turn. Because one GDP-based intensity measure remains in the index in each of these variants, they reduce the dependence of the results on any single intensity component without removing the shared denominator entirely. Reductions in carbon and energy intensity may also reflect structural change, since a shift of output from heavy industry toward services lowers both intensities even when production technologies within sectors remain unchanged. The green index therefore captures the combined outcome of technological improvement within sectors, changes in the energy mix, and changes in the sectoral composition of output, and it is interpreted as a measure of the environmental and energy performance of an economy rather than as a pure measure of clean technology adoption. The empirical design limits the extent to which compositional change alone can drive the results. The industrial competitiveness index, which includes the manufacturing share of GDP, enters every specification, so the green coefficient is estimated conditional on the weight of manufacturing in the economy, while the economy fixed effects absorb persistent differences in economic structure. The renewable share of final energy consumption, in addition, reflects the composition of the energy mix rather than the sectoral composition of output, and the estimates that exclude carbon intensity and energy intensity in turn show whether the results depend on either intensity measure.
3.3. Model Specification
The baseline specification relates real GDP per capita growth to the digital, green, and industrial indices and to the control variables within a two-way fixed effects framework.
where captures time-invariant economy heterogeneity, captures common shocks, and is the idiosyncratic error. The coefficients , , and test hypotheses H1, H2, and H3.
To test the moderating role of industrial competitiveness, the baseline model is augmented with two interaction terms. The digital, green, and industrial indices are mean-centred before the interactions are constructed. Mean-centring serves two purposes. First, when the constituent variables are not centred, each product term is highly correlated with its components because a large part of its variation simply reflects the levels of DIG, GRN, and IND. Subtracting the sample mean removes this nonessential collinearity, which lowers the variance inflation factors of the constituent and interaction terms and stabilises their estimated standard errors (Iacobucci et al., 2016). Centring does not change the interaction coefficient, its standard error, or the fit of the model, since the centred and uncentred specifications are linear reparameterisations of each other. Second, centring changes the interpretation of the constituent coefficients. Without centring, the coefficient on DIG would measure its effect when IND equals zero on its original scale, whereas with centring it measures the effect at the sample mean of industrial competitiveness, which is a meaningful and well-populated reference point. Because the indices are standardised over the pooled sample, their pooled means equal zero, and the centred indices coincide with the standardised scores in the full sample.
where the superscript denotes mean-centred variables and collects the controls. Hypothesis H4a predicts and hypothesis H4b predicts . The conditional marginal effects of the two transitions are obtained by differentiating Equation (3).
Growth processes display persistence, and the transition indices may respond to growth itself. A dynamic version of Equation (3) is therefore estimated with the lagged dependent variable as an additional regressor.
where measures growth persistence and is the unobserved economy effect.
3.4. Estimation Strategy
The estimation strategy proceeds in five steps. The first step tests for cross-sectional dependence, groupwise heteroskedasticity, and serial correlation. Cross-sectional dependence is expected in a region linked by trade, energy networks, migration, and common exposure to European and Russian business cycles. It is assessed with the Pesaran CD test, whose statistic is defined as follows:
where is the pairwise correlation coefficient of the series or residuals for economies and , , and . Under the null hypothesis of cross-sectional independence, the statistic is asymptotically standard normal. The recent literature cautions that CD tests applied to residuals from models with incidental parameters may be over-sized (Juodis & Reese, 2022), which is one reason why the analysis applies the test to the raw series and relies on estimators that remain valid under general forms of dependence. Groupwise heteroskedasticity is tested with the modified Wald test, and first-order serial correlation with the Wooldridge test.
The second step examines the integration properties of the variables. The first-generation Levin–Lin–Chu, Im–Pesaran–Shin, and Fisher-type augmented Dickey–Fuller tests, each including an intercept and a trend, are reported for comparability with earlier studies. Because these tests assume cross-sectional independence and may be unreliable when dependence is strong, the analysis also applies the second-generation cross-sectionally augmented Dickey–Fuller (CADF) and cross-sectionally augmented Im–Pesaran–Shin (CIPS) tests of Pesaran (2007). These tests filter out an unobserved common factor by augmenting each economy-specific regression with cross-sectional averages of the lagged level and first differences of the series. They are applied to all variables and to the interaction terms DIG×IND and GRN×IND, and they serve as the reference for classifying integration orders. The third step tests for long-run relationships using the Pedroni and Kao residual-based tests and the Westerlund error-correction tests. The Westerlund statistics are computed with bootstrapped critical values based on 800 replications, which makes them robust to cross-sectional dependence. The tests are applied to two relationships. The first is the full levels relationship in Equation (2), whose residuals must be stationary for a regression of the stationary growth rate on the regressors to be balanced. The second is the system of integrated indices alone, since a balanced specification requires that the integrated regressors share a common stochastic trend whose linear combination is stationary, so that the right-hand side of Equation (2) has the same integration order as the dependent variable. Because estimation in levels rests on these cointegration properties, the analysis also estimates a cross-sectionally augmented autoregressive distributed lag model, which remains valid for a mixture of stationary and integrated regressors without pre-testing.
The fourth step estimates the baseline and moderation models. Pooled ordinary least squares, fixed effects, and random effects estimates provide benchmarks, and the Hausman test discriminates between fixed and random effects. Given cross-sectional dependence, heteroskedasticity, and autocorrelation, inference relies on two estimators designed for macro panels. The fixed effects estimator with Driscoll–Kraay standard errors yields a covariance matrix that is consistent under general spatial and temporal dependence when the time dimension is moderately large (Driscoll & Kraay, 1998). The Prais–Winsten estimator with panel-corrected standard errors accounts for contemporaneous correlation and panel-specific heteroskedasticity and performs well when is comparable to (Hsiao, 2022). The dynamic Equation (5) is estimated with the two-step system generalised method of moments with Windmeijer-corrected standard errors. The lagged dependent variable, the three focal indices, and the two interaction terms are treated as endogenous, with the interaction terms instrumented by their own lags rather than by products of instruments for the constituent variables. Trade openness, capital formation, and institutional quality are treated as predetermined, while year dummies are strictly exogenous. In the differenced equation, endogenous variables are instrumented with levels dated and , and predetermined variables with levels dated and . In the levels equation, the corresponding instruments are first differences dated and , respectively. The latter moment conditions rely on first differences being uncorrelated with economy-specific effects, consistent with the predetermined status of these variables. Following Roodman (2009), the instrument matrix is collapsed to limit instrument proliferation, without further reduction through principal component extraction. The GMM-style, standard, and total instrument counts for each specification are reported in Appendix A. Collapsing keeps the GMM-style instrument count stable across the main and subsample estimations, whereas year dummies increase the total count with the number of estimation years. Consequently, total instruments exceed the number of cross-sections in all specifications, and GMM-style instruments alone exceed this dimension in the 15-economy Central and Eastern European and Western Balkan subsample. Table A2 in Appendix A documents the classification and lag structure, and Table A3 reports the instrument counts and diagnostics for the main specification, the subsamples, and two restricted instrument sets. Instrument validity is assessed with the Arellano–Bond tests for first-order and second-order serial correlation and the Hansen test of overidentifying restrictions. Because the Hansen test loses power when instruments are numerous relative to N, and because moment-based estimators of dynamic panels can suffer finite-sample bias (Breitung et al., 2022), the system estimator is treated as supplementary evidence rather than as the headline specification. Its role is to examine whether the moderation pattern remains compatible with growth persistence and internally instrumented regressors, not to provide independent confirmation of the static estimates.
Two further estimators address features of the data that the baseline estimators handle only through the error covariance. The common correlated effects mean group estimator of Pesaran (2006) augments each economy-specific regression with cross-sectional averages of the dependent and explanatory variables, which proxy for unobserved common factors such as regional business cycles, energy price shocks, and European regulatory changes, and it allows slope coefficients to differ across economies. The cross-sectionally augmented autoregressive distributed lag estimator of Chudik and Pesaran (2015) extends this approach to a dynamic setting with weakly exogenous regressors. It yields long-run coefficients that remain consistent when the regressors are a mixture of stationary and integrated series, whether or not the variables are cointegrated, which provides a direct check on the balanced specification in levels. Both estimators are reported as supplementary evidence rather than as decisive robustness checks, because their mean group nature requires estimating many parameters per economy with T = 28.
Several features of this design deserve comment. The use of mean-centred interaction terms implies that the coefficients on the constituent indices measure their effects at the average level of industrial competitiveness, which facilitates comparison with the baseline estimates. The joint significance of the two interaction terms is tested with a Wald test, and the conditional marginal effects are evaluated at the mean of the moderator and at one standard deviation below and above it. The value of the moderator at which the point estimate of a marginal effect changes sign is obtained as the ratio of the relevant constituent coefficient to the interaction coefficient with the opposite sign. Because this crossing point is a ratio of estimated coefficients with its own sampling uncertainty, the analysis also reports 95 percent confidence intervals for the conditional marginal effects, computed from the full covariance matrix of the coefficients, and identifies the range of the moderator over which each marginal effect is statistically distinguishable from zero (Brambor et al., 2006). The marginal effects are evaluated only over the observed range of the moderator, so that no inference is drawn for values without empirical support (Hainmueller et al., 2019). Because interaction models are sensitive to functional form, the linear interaction is complemented by a split-sample analysis at the median of industrial competitiveness, which allows all coefficients to differ between high and low competitiveness groups without imposing linearity.
The fifth step examines predictive ordering with the Dumitrescu–Hurlin panel Granger non-causality test, which allows heterogeneous coefficients across economies. The test averages individual Wald statistics and standardises the average as follows:
where is the Wald statistic for economy and is the lag order. With and , is asymptotically standard normal under the null hypothesis of homogeneous non-causality. Because the asymptotic distribution of the Dumitrescu–Hurlin statistic assumes cross-sectional independence, inference is also based on bootstrap critical values with 1000 replications that account for cross-sectional dependence. Integrated variables enter the causality tests in first differences, so that every variable in each test is stationary according to the second-generation unit root tests. As a further check, the half-panel jackknife test of Juodis et al. (2021), implemented as described by Xiao et al. (2023), corrects the Nickell bias in panels with moderate T and, combined with cross-sectional demeaning, remains valid under cross-sectional dependence. All results are interpreted as evidence of Granger predictive causality, meaning that past values of one variable improve the prediction of another, rather than as evidence of structural causal effects. Finally, robustness is assessed across subregional samples, European Union and non-member groups, periods, the exclusion of shock years, a median split by industrial competitiveness, alternative index constructions, and alternative treatments of missing data.
3.5. Sources of Endogeneity and Identification
Three sources of endogeneity may affect the estimates. The first is omitted variable bias. Unobserved economy characteristics such as geography, historical legacies, proximity to Western European markets, and the timing of market reforms may influence both the twin transition indices and growth. The two-way fixed effects estimator absorbs all such time-invariant economy-specific factors and all common year-specific shocks, while the common correlated effects estimators additionally absorb unobserved common factors with economy-specific loadings. Time-varying economy-specific omitted variables, such as changes in human capital or foreign direct investment, cannot be fully excluded and are only partly captured by the institutional quality, capital formation, and trade controls. The second source is bidirectional causality. Faster growth may finance investment in digital infrastructure and renewable capacity, so the transition indices may respond to growth rather than only shape it. The system GMM estimator addresses this concern by instrumenting the endogenous regressors with their own lagged values, under the assumption that sufficiently lagged levels and differences are uncorrelated with current shocks to growth. The third source is measurement error in the composite indices, which would tend to attenuate the estimated coefficients toward zero.
Given the limited cross-sectional dimension of N = 24, the system GMM estimator is treated as supplementary evidence rather than as the baseline specification or an independent confirmation of it. Its instruments may be weak, the total number of instruments exceeds the number of economies in every specification, including the restricted instrument sets, and its overidentification tests lose power in small samples. None of these strategies provides experimental or quasi-experimental identification. The estimated coefficients are therefore interpreted as conditional associations that are robust to several important sources of bias rather than as definitive causal effects.
4. Results
4.1. Principal Component Analysis
Table 2 reports the principal component analysis for the four composite indices. In every block, the first principal component has an eigenvalue well above unity and explains the dominant share of the common variance. The first component explains 73.83 percent of the variance of the digital indicators, 69.47 percent of the green indicators, 72.73 percent of the industrial indicators, and 78.03 percent of the six governance indicators. Each eigenvalue divided by the number of constituent indicators reproduces the reported share of variance, which confirms the internal consistency of the decomposition. The Kaiser–Meyer–Olkin measures range from 0.715 to 0.891 and exceed the conventional adequacy threshold of 0.70. Bartlett’s test rejects the null hypothesis that the correlation matrix is an identity matrix at the 1 percent level for every block.
Table 2.
Principal component analysis results for composite indices (N = 24, T = 28).
The loadings are balanced across constituent indicators, so that no single indicator dominates any index. Within the digital index, internet use carries the largest loading, followed by mobile subscriptions and fixed lines. Within the green index, inverted carbon intensity and the renewable share carry slightly larger weights than inverted energy intensity. Within the industrial index, the medium and high technology share of manufacturing value added carries the largest loading, which indicates that the index captures technological sophistication in addition to industrial scale. The governance loadings are nearly uniform, ranging from 0.382 to 0.426, which is typical of the strong collinearity among the Worldwide Governance Indicators. The squared loadings in each block sum to unity, as required for normalised eigenvectors.
4.2. Descriptive Statistics and Correlation Analysis
Table 3 presents descriptive statistics. Real GDP per capita growth averages 3.842 percent with a standard deviation of 4.615 percentage points, which reflects the rapid but volatile catch-up of the region. The range from −14.820 to 18.250 percent captures episodes such as the 1998 Russian crisis, the 2009 global financial crisis, the 2020 pandemic, and the 2022 war-related contraction, as well as rapid recoveries. The standardised indices have zero mean and unit standard deviation by construction, and their skewness and kurtosis values are moderate. Trade openness averages 104.215 percent of GDP, which confirms the high degree of external integration of the region, while gross fixed capital formation averages 23.418 percent of GDP. The growth series displays mild negative skewness and excess kurtosis, which is consistent with occasional deep recessions and motivates the use of estimators that are robust to heteroskedasticity.
Table 3.
Descriptive statistics (1996–2023, N = 24, T = 28).
Table 4 reports pairwise correlations and variance inflation factors. Real GDP per capita growth is positively and significantly correlated with all explanatory variables, with the largest correlations observed for the digital index, gross fixed capital formation, and the industrial index. The strongest correlations among regressors involve institutional quality and the digital index, institutional quality and industrial competitiveness, and the digital and industrial indices. These associations are economically meaningful because better-governed economies tend to be more digitalised and more industrially competitive. Nevertheless, the variance inflation factors range from 1.28 to 2.31, with a mean of 1.76, far below the conventional threshold of 5. Multicollinearity therefore does not severely bias the estimates or inflate their standard errors. The high pairwise correlations of institutional quality with the digital and industrial indices nevertheless imply that the coefficients on these variables are identified from partly overlapping variation. The institutional quality coefficient may therefore partially absorb effects that operate through digitalisation and industrial competitiveness, and vice versa, so the separate contributions of governance, digital diffusion, and industrial capabilities should be read as conditional on one another rather than as fully independent effects.
Table 4.
Pairwise correlation matrix and variance inflation factors.
4.3. Cross-Sectional Dependence, Heteroskedasticity, and Serial Correlation
Table 5 reports the diagnostic tests. The Pesaran CD statistics for real GDP per capita growth, the digital index, the green index, and the industrial index reject the null hypothesis of cross-sectional independence at the 1 percent level. The particularly large statistic for the digital index reflects the synchronised diffusion of mobile and internet technologies across the region. The modified Wald statistic of 748.92 rejects groupwise homoskedasticity, and the Wooldridge statistic of 38.12 rejects the absence of first-order serial correlation. These results imply that conventional fixed effects standard errors are unreliable and justify the use of Driscoll–Kraay and panel-corrected standard errors in the main specifications.
Table 5.
Panel diagnostic tests.
4.4. Unit Root and Cointegration Tests
Table 6 reports the panel unit root tests. Real GDP per capita growth, trade openness, and gross fixed capital formation are stationary in levels according to all three tests. The digital, green, industrial, and institutional indices are non-stationary in levels but stationary in first differences, so that they are integrated of order one. The Levin–Lin–Chu statistic for the industrial index is marginally significant at the 10 percent level in levels, but the Im–Pesaran–Shin and Fisher tests do not reject the unit root null hypothesis, and the index is therefore treated as integrated of order one. Because these first-generation tests assume cross-sectional independence, which Table 5 rejects, their classification is verified with second-generation tests.
Table 6.
Panel unit root tests (N = 24, T = 28).
Table 7 reports the second-generation CADF and CIPS tests, which allow for cross-sectional dependence through an unobserved common factor. The results confirm the first-generation classification. Real GDP per capita growth, trade openness, and gross fixed capital formation reject the unit root null hypothesis in levels at the 1 percent level, whereas the digital, green, industrial, and institutional indices do not reject it in levels but reject it in first differences. The interaction terms DIG × IND and GRN × IND behave like their constituent indices and are non-stationary in levels but stationary in first differences. Their integration order therefore matches that of the integrated indices, and the moderation specifications are balanced under the same cointegration conditions as the baseline specification. The mixture of stationary and integrated variables nevertheless rules out a regression of a stationary growth rate on unrelated trending regressors and makes the cointegration evidence essential.
Table 7.
Second-generation panel unit root tests robust to cross-sectional dependence (N = 24, T = 28).
Table 8 reports the cointegration tests. The Pedroni panel ADF statistic and the Kao ADF statistic reject the null hypothesis of no cointegration at the 1 percent level. The Westerlund group-mean statistic and panel statistic, computed with bootstrapped critical values that account for cross-sectional dependence, also reject the null hypothesis at the 1 percent level. The first four rows test the full levels relationship in Equation (2), and the rejection of the null hypothesis implies that the residuals of the growth equation are stationary. The last two rows apply the Westerlund tests to the four integrated indices alone and also reject the null hypothesis of no cointegration at the 1 percent level. The integrated regressors therefore share a common stochastic trend whose stationary linear combination enters the growth equation, which yields a balanced relationship with the stationary growth rate. This evidence supports estimation in levels of the indices, and the cross-sectionally augmented autoregressive distributed lag estimates reported in Section 4.8 provide a check that does not depend on this pre-testing.
Table 8.
Panel cointegration tests.
Cointegration tests support the growth regressions by indicating that the integrated indices contain stationary long-run combinations and that the residuals from the full linear growth specification are stationary. This evidence suggests that the estimated coefficients capture associations between growth and stationary combinations of index levels rather than spurious relationships between unrelated trends. However, cointegration among the indices does not necessarily imply that the growth equation shares the same cointegrating vector, making residual-based tests on the full specification more directly relevant. Moreover, interaction terms involving integrated variables do not have a well-defined integration order under standard linear integration theory. Thus, unit root tests for DIG × IND and GRN × IND describe their empirical behaviour, while the cointegration tests in Table 8 apply only to the linear specification. For the moderation models, cross-sectionally augmented ARDL estimates provide complementary evidence without requiring prior classification of integration orders or cointegration, although their precision is constrained by the short time dimension.
4.5. Baseline Estimates
Table 9 presents the baseline estimates of Equation (2). The Hausman statistic of 31.42 rejects the random effects specification in favour of fixed effects, and the discussion therefore focuses on the fixed effects estimates with Driscoll–Kraay standard errors in column (4), with panel-corrected standard errors in column (5) as a cross-check. The within R-squared of 0.445 indicates that the model explains a substantial share of the within-country variation in growth.
Table 9.
Baseline estimates (dependent variable is RGDPG).
The digital transition is positively and significantly associated with growth across all specifications. In column (4), a one standard deviation increase in the digital index is associated with an increase in real GDP per capita growth of 0.654 percentage points, which corresponds to about 17 percent of mean growth and 14 percent of its standard deviation. The pooled estimate is larger than the within estimates, which suggests that part of the cross-economy correlation between digitalisation and growth reflects unobserved country characteristics. The coefficient on the digital index in the conventional fixed effects model of column (2) is significant at the 1 percent level, with a t-statistic of about 2.95, and the Driscoll–Kraay correction further reduces the standard error. Hypothesis H1 is supported.
The green transition is also positively associated with growth. In column (4), a one standard deviation increase in the green index is associated with an increase in growth of 0.382 percentage points, significant at the 5 percent level. The effect is smaller and less precisely estimated than the digital effect, which is consistent with the heterogeneous growth effects of renewable energy documented for Europe (Simionescu et al., 2023; Zou et al., 2026). The coefficient is significant only at the 10 percent level with conventional fixed effects standard errors, but it becomes significant at the 5 percent level once the dependence structure is taken into account. Hypothesis H2 is supported.
Industrial competitiveness is positively and significantly associated with growth. A one standard deviation increase in the industrial index is associated with an increase in growth of 0.412 percentage points in column (4) and 0.425 percentage points in column (5), both significant at the 1 percent level. This finding is consistent with the view that manufacturing capabilities remain an engine of growth in emerging economies (Hamilton & de Vries, 2025; Kruse et al., 2023). Hypothesis H3 is supported.
The comparison across columns is informative about the sources of bias in simpler estimators. The pooled estimates are uniformly larger than the fixed effects estimates for the three focal indices, which indicates that economies with persistently higher digital, green, and industrial development also have persistently higher growth for reasons captured by economy effects, such as geography, historical legacies, or the timing of reforms. The random effects estimates lie between the pooled and fixed effects estimates, as expected when economy effects are correlated with the regressors, and the Hausman test confirms that this correlation is statistically significant. The Driscoll–Kraay and panel-corrected estimates leave the point estimates essentially unchanged but reduce the standard errors, because they exploit the covariance structure of the errors more efficiently than the conventional approach.
The control variables carry the expected signs. Among the four composite indices, which share a common standardised scale, institutional quality has the largest coefficient, with a value of 0.894 in column (4), which is consistent with the importance of governance for post-socialist growth (Lu & Staehr, 2025). Gross fixed capital formation has a coefficient of 0.214, so that a one standard deviation increase of 5.82 percentage points of GDP is associated with growth that is higher by about 1.25 percentage points. Trade openness has a coefficient of 0.028, which implies that a one standard deviation increase of 38.6 percentage points of GDP is associated with growth that is higher by about 1.08 percentage points. Measured by the growth change associated with a one standard deviation increase, capital formation and trade openness therefore display larger associations with growth than institutional quality, so the ranking of institutional quality applies to the composite indices only. The estimates in column (5) are nearly identical, which demonstrates that the results do not depend on the specific correction for cross-sectional dependence.
4.6. Moderating Role of Industrial Competitiveness
Table 10 presents the estimates of the moderation models. The joint Wald tests reject the null hypothesis that both interaction coefficients equal zero in all three specifications, with statistics of 16.85, 14.82, and 17.21, each significant at the 1 percent level. Industrial competitiveness therefore conditions the growth associations of the twin transition.
Table 10.
Moderation models with industrial competitiveness interactions (dependent variable is RGDPG).
The interaction between the digital and industrial indices is positive and significant at the 1 percent level in all three columns, with coefficients of 0.248 under fixed effects with Driscoll–Kraay errors, 0.215 under system GMM, and 0.252 under panel-corrected standard errors. At the mean of industrial competitiveness, a one standard deviation increase in the digital index is associated with higher growth of 0.618 percentage points in column (1). The same increase is associated with higher growth of 0.370 percentage points in an economy one standard deviation below the mean of industrial competitiveness and of 0.866 percentage points in an economy one standard deviation above it. The growth dividend of digitalisation thus more than doubles across this range. Hypothesis H4a is supported.
The interaction between the green and industrial indices is negative and significant at the 5 percent level in all three columns, with coefficients of −0.182, −0.154, and −0.191. At the mean of industrial competitiveness, a one standard deviation increase in the green index is associated with higher growth of 0.354 percentage points in column (1). The effect rises to 0.536 percentage points one standard deviation below the mean and falls to 0.172 percentage points one standard deviation above it. The point estimate of the marginal effect reaches zero at an industrial index value of about 1.95 standard deviations above the mean under fixed effects, 2.06 under system GMM, and 1.90 under panel-corrected standard errors. These crossing points are ratios of estimated coefficients and should not be interpreted as precisely identified policy thresholds. The more informative quantity is the range over which the marginal effect is statistically distinguishable from zero. Under fixed effects with Driscoll–Kraay errors, the 95 percent confidence interval of the green marginal effect excludes zero only for industrial index values below about 0.24 standard deviations above the mean, a range that includes the sample mean and the entire lower half of the distribution, while the digital marginal effect is significantly positive for industrial index values above about −1.11 standard deviations. Beyond these ranges the green effect is imprecisely estimated rather than demonstrably zero, and few observations lie near the upper end of the industrial distribution. The conditional green effect at high levels of industrial competitiveness therefore remains uncertain, and the evidence does not establish whether it becomes zero or negative in the most industrialised economies. The green growth association is nonetheless concentrated in less industrialised economies. Hypothesis H4b is supported for the lower and middle parts of the industrial distribution. Figure 2 plots the conditional marginal effects implied by the three estimators over the observed range of industrial competitiveness, together with 95 percent confidence intervals for the fixed effects specification.
Figure 2.
Conditional marginal effects of (a) the Digital Transition Index and (b) the Green Transition Index on real GDP per capita growth across the observed range of the Industrial Competitiveness Index. Lines show point estimates from Equation (4) using the coefficients in Table 10. The shaded area shows the 95 percent confidence interval for the fixed effects specification with Driscoll–Kraay standard errors. Vertical reference lines mark the mean of IND and one standard deviation below and above it, and the horizontal axis spans the observed range of IND. Source: Calculations based on the estimates in Table 10.
The system GMM estimates indicate moderate growth persistence, with a coefficient of 0.201 on lagged growth. The implied long-run effect of the digital index at the mean of the moderator is 0.542 divided by 0.799, or about 0.68 percentage points, which is close to the static estimates. The Arellano–Bond test rejects the absence of first-order serial correlation in the differenced residuals but does not reject the absence of second-order correlation, and the Hansen test does not reject instrument validity. These diagnostics do not reveal misspecification, but they provide limited assurance. The total number of instruments exceeds the number of economies, which weakens the ability of the Hansen test to detect invalid instruments and can pull the estimates toward those of the uninstrumented estimators (Roodman, 2009). The restricted instrument sets in Table A3 reduce but do not remove this problem, since their total counts also exceed the cross-sectional dimension, and the green interaction is significant only at the 10 percent level under both restricted sets. The agreement between the dynamic and static estimates therefore indicates that growth persistence does not account for the moderation pattern, but the system GMM column is not presented as independent confirmation of the main findings, and it does not demonstrate that endogeneity leaves the estimates unaffected.
The magnitudes of the interaction effects are economically meaningful. Moving an economy from one standard deviation below to one standard deviation above the mean of industrial competitiveness raises the growth effect of a one standard deviation improvement in the digital index by about 0.50 percentage points and lowers the growth effect of a one standard deviation improvement in the green index by about 0.36 percentage points. For an economy at the upper end of the industrial distribution, the marginal effect of digitalisation exceeds one percentage point of growth, whereas the point estimate of the marginal effect of greening approaches zero with a wide confidence interval. For an economy one standard deviation below the mean, the marginal effects of the two transitions are of similar size, and toward the lower end of the distribution the green effect clearly exceeds the digital effect. The mean-centred constituent coefficients in Table 10 are also close to the corresponding baseline coefficients in Table 9, which indicates that the addition of the interaction terms does not distort the average effects.
4.7. Panel Causality Analysis
Table 11 reports the Dumitrescu–Hurlin test results with two lags. The standardised statistics are computed from the reported average Wald statistics using Equation (7). The null hypothesis that the digital index does not Granger-cause growth is rejected at the 1 percent level, and the reverse null hypothesis is rejected at the 5 percent level, which indicates a bidirectional Granger-causal relationship. Past digital diffusion thus improves the prediction of growth, and past growth improves the prediction of further digital diffusion, which is consistent with digital investment supporting growth and higher incomes financing further digital investment. The green index Granger-causes growth at the 1 percent level, and growth Granger-causes the green index at the 10 percent level, which indicates a bidirectional but asymmetric predictive relationship in which the direction from greening to growth is the more robust.
Table 11.
Dumitrescu–Hurlin panel Granger non-causality tests.
Between the moderator and the transitions, the digital and industrial indices display bidirectional Granger causality at the 1 percent level, which is consistent with the complementarity between digital technologies and manufacturing capabilities underlying hypothesis H4a. The industrial index Granger-causes the green index at the 1 percent level, whereas the null hypothesis that the green index does not Granger-cause the industrial index cannot be rejected. Failure to reject this null hypothesis does not establish that greening has no effect on industrial competitiveness, but the asymmetric predictive pattern is consistent with the interpretation of industrial competitiveness as a structural condition that shapes the pace and form of the green transition.
Because the Dumitrescu–Hurlin asymptotic distribution assumes cross-sectional independence and some of the indices are integrated, Table 12 reports two further sets of results. The first uses bootstrap critical values that account for cross-sectional dependence, with the integrated indices entering in first differences so that every variable in each test is stationary. The second applies the half-panel jackknife test of Juodis et al. (2021), which corrects the Nickell bias and remains valid under cross-sectional dependence after cross-sectional demeaning. Both procedures confirm the bidirectional relationships between each transition and growth and between the digital and industrial indices, as well as the unidirectional relationship from the industrial index to the green index. The relationship from growth to the green index, which is significant only at the 10 percent level in Table 11, remains only weakly significant under both procedures, so this direction should be interpreted with caution.
Table 12.
Panel Granger non-causality tests robust to cross-sectional dependence.
4.8. Robustness Analysis
Table 13 reports six robustness specifications. Column (1) restricts the sample to the 15 Central and Eastern European and Western Balkan economies, which share a European Union accession perspective. The results closely mirror the full-sample estimates, with the digital and green effects and both interaction terms retaining their signs and statistical significance. Nevertheless, the system GMM estimates require caution because the instrument count exceeds the 15 cross-sections, potentially overfitting endogenous regressors and weakening the Hansen test’s ability to detect instrument invalidity (Roodman, 2009). The same concern applies, in a milder form, to the full-sample and period-specific GMM estimates, whose total instrument counts exceed the 24 economies. Although the Windmeijer correction adjusts two-step standard errors, it does not eliminate finite-sample coefficient bias. Accordingly, column (1) is interpreted alongside estimators that do not rely on internal instruments. Its interaction coefficients are close to the full-sample fixed effects and panel-corrected estimates in Table 10, while the fixed effects estimates for the nine EU member states reported later in this section confirm the same interaction signs. Thus, column (1) provides supporting evidence on the direction of moderation in the European subsample rather than an independent estimate of its magnitude. Column (2) excludes the pandemic year 2020 and 2022, the year in which the Russia–Ukraine war began. The estimates change only marginally, which shows that the results are not driven by extreme shock years.
Table 13.
Robustness specifications (dependent variable is RGDPG).
Columns (3) and (4) split the system GMM sample around the 2004 European Union enlargement, which marked a structural break in trade, investment, and regulatory integration for the region. In the 1997–2004 subsample, the digital effect is large, but the green effect is insignificant, the digital and industrial interaction is significant only at the 10 percent level, and the green and industrial interaction is insignificant. In the 2005–2023 subsample, the green effect becomes significant and both interactions become larger and more precisely estimated. After 2004, deepening European integration, the coverage of the new member states by the EU Emissions Trading System, and tighter climate and energy regulation raised the costs of decarbonisation for energy-intensive manufacturers while expanding the scope for digitally enabled participation in European value chains. These developments are consistent with the stronger moderating role of industrial competitiveness in the later period. The weaker results for 1997–2004 also reflect the shorter time dimension and the early stage of both transitions, when digital diffusion was concentrated in basic mobile telephony and green indicators were dominated by the recovery of output after the transformation recession. The findings therefore do not hold uniformly across all periods, since the green effect and its interaction with industrial competitiveness are not statistically significant in the earlier subsample. The Arellano–Bond and Hansen diagnostics for the system GMM subsamples, reported in Table 13, do not indicate second-order serial correlation or invalid instruments, although the Hansen test has limited power when the instrument count is large relative to the number of cross-sections, as documented in Table A3. Because both period-specific estimates rely on instrument sets larger than the number of economies, the contrast between the two periods is informative about the direction of change rather than about precise magnitudes, and the evidence for the green transition and its moderation rests mainly on the period after 2004.
Columns (5) and (6) split the sample at the median of the industrial competitiveness index. In the high-competitiveness group, the digital effect is large and highly significant, while the green effect is small and insignificant. In the low-competitiveness group, the digital effect is smaller, while the green effect is large and significant at the 1 percent level. The insignificant green coefficient in the high-competitiveness subsample corroborates the negative moderating effect uncovered in the baseline estimates, since greening yields little additional growth where energy-intensive manufacturing capacity is large. The larger green coefficient in the low-competitiveness subsample is consistent with efficiency gains from a very inefficient base and the expansion of new renewable capacity. The subsample comparison reproduces the asymmetric moderation pattern without imposing a linear interaction, which indicates that the interaction results are not an artefact of functional form.
Table 14 reports further checks that address unobserved common factors, mixed integration orders, data imputation, and digital and green complementarity. Column (1) applies the common correlated effects mean group estimator, and column (2) reports the long-run coefficients of the cross-sectionally augmented autoregressive distributed lag model. Both estimators retain the positive digital and green coefficients and the opposite signs of the two interaction terms, although the mean group estimates are less precise because they rely on economy-specific regressions with a short time dimension, and the green interaction in column (1) is significant only at the 10 percent level. The CD test does not reject cross-sectional independence of the residuals in column (1), which indicates that the cross-sectional averages absorb the common factors in the mean group specification, whereas the corresponding statistic in column (2) is uninformative for the reasons discussed below. The error-correction coefficient in column (2) is negative and significant at the 1 percent level, which is consistent with adjustment toward the long-run relationship, although the small residual degrees of freedom limit the weight this result can bear. Column (3) re-estimates the moderation model after excluding economy-years with endpoint-filled values, while retaining interior interpolations, including governance values for 1997, 1999, and 2001. Excluding these interpolations would remove three complete years across all economies, reducing the sample to at most 600 observations with interrupted annual sequences. Thus, column (3) tests sensitivity to endpoint filling rather than eliminating all imputation. Column (4) excludes economy-years with the highest imputation shares in indicators outside the governance block, as identified in Table A1. Column (5) replaces linear interpolation with multiple imputation that exploits the time-series and cross-sectional structure of the panel (Honaker & King, 2010). The coefficients in columns (3) to (5) remain close to the baseline estimates in Table 10, which indicates that the findings are not driven by the treatment of missing data. Column (6) adds the interaction between the digital and green indices. Its coefficient is small and statistically insignificant, and the two industrial interactions remain essentially unchanged. The data therefore provide no evidence that digitalisation and greening directly reinforce or offset each other in growth terms, which supports positioning the asymmetric role of industrial competitiveness, rather than digital and green synergy, as the central result.
Table 14.
Common factors, mixed integration, missing data, and digital and green complementarity (dependent variable is RGDPG).
The CS-ARDL lag structure reflects the short time dimension. Although the Chudik and Pesaran (2015) rule implies three lags of cross-sectional averages for T = 28, the model uses one lag of growth and each regressor, with cross-sectional averages of growth and the three focal indices entering contemporaneously and with one lag. This parsimonious specification preserves observations and limits parameter growth. The effective sample covers 1997–2023, with 27 annual observations per economy and no variables dropped because of collinearity or insufficient observations. Nevertheless, each economy-specific regression contains 26 parameters, leaving only one residual degree of freedom. The resulting estimates are therefore close to exact fits, limiting the information in individual coefficients and making inference dependent on cross-economy dispersion. Given this limitation, the CS-ARDL results are treated as supplementary evidence rather than as a decisive robustness check. Their long-run coefficients do not require prior classification of integration orders or cointegration testing, and their signs agree with those of the fixed effects estimates, but the near-exact economy-specific fits make this agreement informative mainly about direction. The negative error-correction coefficient is consistent with adjustment toward a long-run relationship, although the residual cross-sectional dependence statistic is uninformative given the near-exact economy-specific fits. Accordingly, the CS-ARDL results are consistent with the direction of the principal estimates but do not constitute independent or more precise evidence, and none of the conclusions of the study rests on them.
Table 15 moves beyond subsample robustness to a comparative structural analysis of European Union member states and non-member economies. The nine Central and Eastern European economies, all of which are current European Union members, are compared with the 15 non-member economies of the Western Balkans, the Eastern Partnership, and Central Asia. The digital coefficient and the positive digital interaction are larger in the member states, which is consistent with their deeper integration into European manufacturing value chains and the stronger complementarity between digital technologies and export-oriented industry. The green coefficient is larger in the non-member economies, where energy intensity remains high and greening more often takes the form of efficiency gains and new renewable capacity, while the negative green interaction is larger in absolute value among the member states, where competitive manufacturing faces the carbon price of the EU Emissions Trading System. Wald tests reject the equality of the digital and green coefficients across the two groups at the 5 percent level, whereas the difference in the digital interaction is significant only at the 10 percent level and the difference in the green interaction is not significant. These differences cannot be attributed to EU membership alone, as the groups also differ in proximity to Western European markets, income levels, energy-system structures, the timing and depth of market reforms, and exposure to Russian trade and energy linkages. Moreover, the non-member group encompasses three structurally distinct subregions. The comparison therefore indicates that the magnitude of transition-related associations varies across groups characterised by EU membership and broader regional and structural differences, while the direction of asymmetric moderation remains consistent across both groups.
Table 15.
Comparative estimates for European Union members and non-member economies (dependent variable is RGDPG).
Table 16 examines whether the principal findings depend on the construction of the composite indices. Column (1) excludes fixed telephone lines from the digital index, and column (2) replaces them with fixed broadband subscriptions for 2000–2023, the period in which they are available. Columns (3) and (4) exclude inverted carbon intensity and inverted energy intensity from the green index in turn, which addresses their partial overlap, and column (5) replaces carbon intensity with carbon dioxide emissions per capita, which removes GDP from the denominator of the emissions component. Column (6) uses equally weighted indices instead of principal component weights. The digital and green coefficients and the opposite signs of the two interactions persist in all six columns and remain significant at least at the 10 percent level, with magnitudes that remain within 15 percent of the baseline estimates in Table 10. The results are not driven solely by an indicator whose meaning may vary over time or by overlap between carbon and energy intensity. Evidence concerning the shared GDP denominator is more limited, since columns (3)–(5) remove or replace one GDP-based intensity measure at a time, while retaining the other. These specifications therefore assess sensitivity to each component individually rather than fully eliminating denominator concerns. The stability of the estimates suggests, but does not establish, that mechanical denominator effects are not the primary driver of the green coefficient.
Table 16.
Alternative constructions of the composite indices (dependent variable is RGDPG).
Taken together, the robustness checks show that the direction of the main findings is consistent across subregions, membership groups, estimators, index constructions, and data treatments, with three qualifications. First, the green effect and its interaction with industrial competitiveness are not statistically significant in the 1997–2004 subsample, so the evidence for the green transition and its moderation is weaker for the early transition period. Second, the system GMM and CS-ARDL estimates are supplementary rather than independent evidence, because the former rely on instrument sets larger than the number of economies and the latter on economy-specific regressions with very few residual degrees of freedom. Third, the alternative index constructions reduce, without fully removing, the concern that the GDP-based intensity components of the green index create a mechanical association with growth.
5. Discussion
The results are consistent with the five hypotheses, with weaker support for the green hypotheses in the early transition period, and reveal a nuanced picture of the twin transition in post-socialist economies. The first finding, a positive and robust growth association of the digital transition, aligns with evidence for the European Union (Mura & Donath, 2023; Olczyk & Kuc-Czarnecka, 2022), for Asian economies (Kurniawati, 2022), for the BRICS economies (Imomkulov et al., 2026), and for Central Asia (Sobirov et al., 2025). The magnitude of the effect, about 0.65 percentage points of growth per standard deviation of the digital index, is economically large. It is also plausible given the extraordinary speed of digital diffusion in the region, where mobile subscriptions rose from negligible levels in the late 1990s to more than one per inhabitant within a decade. The bidirectional Granger-causal relationship between digitalisation and growth is consistent with the virtuous circle identified in studies of digital productivity effects, in which technology adoption raises income and higher income finances further adoption (Pan et al., 2022; Rehman & Nunziante, 2023). The second finding, a positive but smaller growth association of the green transition, contributes to a debate in which evidence remains mixed. The result is consistent with macroeconomic studies that find no growth penalty from carbon pricing (Metcalf & Stock, 2023) and with evidence that renewable energy supports growth under favourable institutional conditions (Ahmed et al., 2022; Q. Wang et al., 2022), as well as with the finding that green innovation lowers emissions in the European Union while environmental taxation alone shows limited effectiveness (Babakhonov et al., 2026). The comparatively modest magnitude and weaker precision echo the sector-specific and conditional effects reported for the European Union (Simionescu et al., 2023) and the accompanying rather than driving role of renewable energy in Central and Eastern European convergence (Zou et al., 2026). A plausible explanation is that the green index captures both efficiency improvements, which generate immediate cost savings, and structural changes in the energy mix, whose benefits materialise with a lag and whose costs fall on incumbent industries. The third finding is consistent with industrial competitiveness remaining a source of growth in transition economies. This result resonates with the manufacturing renaissance documented by Kruse et al. (2023) and the viability of manufacturing-led transformation shown by Nguimkeu and Zeufack (2024). It is also in line with the strong positive contribution of industrial output to growth in the Next-11 economies (Mamadiyarov et al., 2026). The result further accords with the structural transformation analysis of Hamilton and de Vries (2025), which attributes the divergent performance of transition economies to the capacity to rebuild competitive manufacturing. The large loading of the medium and high technology share in the industrial index suggests that technological upgrading within manufacturing, rather than manufacturing scale alone, underlies this association. The fourth and most novel finding is the asymmetric moderation pattern. Industrial competitiveness strengthens the growth association of digitalisation. This result is consistent with the complementarity between digital technologies and manufacturing capabilities emphasised in the literature on the fourth industrial revolution (Benassi et al., 2022; Ghobakhloo et al., 2022) and with firm-level evidence that the returns to digital adoption depend on organisational and skill complementarities (Cirillo et al., 2023; Gaglio et al., 2022). Competitive manufacturing sectors provide the absorptive capacity needed to embed digital technologies in production, logistics, and export activities. The bidirectional Granger-causal relationship between the digital and industrial indices is further consistent with a mutually reinforcing process in which digitalisation strengthens industry and industrial capabilities accelerate digital adoption.
In contrast, industrial competitiveness weakens the growth association of greening. This finding qualifies the presumption of uniform growth gains from both transitions that underpins much of the twin transition discourse (Gao, 2025; Kovacic et al., 2024). The result is consistent with the concentration of transition costs in industrial regions documented by Rodríguez-Pose and Bartalucci (2024) and with the historical perspective of Fouquet and Hippe (2022), who show that energy transitions imposed adjustment costs on industrial economies before productivity gains emerged. In the more industrialised economies of the sample, particularly in Central Europe, decarbonisation requires the transformation of energy-intensive manufacturing and coal-based power generation, which involves stranded assets, higher energy prices, and costly process changes. In less industrialised economies, such as those in the Western Balkans, the Caucasus, and Central Asia, the green transition more often involves efficiency gains from a very inefficient base and the development of new renewable capacity, which can support growth with fewer stranded costs. The unidirectional Granger-causal relationship from industrial competitiveness to the green index is consistent with this interpretation, although it does not by itself identify the underlying mechanism.
The combination of the two moderation effects has implications for the twin transition narrative. Because the design compares the conditional growth associations of the two transitions rather than testing their interaction directly, the main results do not show whether digitalisation and greening reinforce or offset each other, and the supplementary digital and green interaction in Table 14 is statistically insignificant. What the results do show is that the relative growth payoffs of the two transitions depend on the industrial base, so that the balance between them shifts as economies industrialise. This pattern is consistent with evidence that digital and green capabilities rarely coincide in European regions (Fazio et al., 2025) and that the environmental effects of digitalisation depend on green capabilities (Bianchini et al., 2023). It also complements evidence from China that digital economy effects on green development operate through industrial upgrading (Luo et al., 2022; J. Wang et al., 2022; Zhang et al., 2022). The subsample estimates indicate that both moderation effects were larger and more precisely estimated after the 2004 enlargement, while the green effect and its interaction were not statistically significant in 1997–2004. Because these period-specific estimates rely on system GMM with instrument counts above the number of economies, the contrast suggests, rather than establishes, that deeper integration into European value chains and the tightening of climate policy made industrial structure more decisive for the returns to both transitions.
The results also shed light on heterogeneity within the post-socialist space. The Central European economies that joined the European Union in 2004 combine high industrial competitiveness with advanced digital diffusion, and the results indicate that further digitalisation of manufacturing is associated with larger growth gains in these economies than additional greening, whose costs fall heavily on their automotive, chemical, and metal industries. This comparison concerns the growth associations of standardised changes and does not account for the costs of achieving those changes or for environmental benefits outside GDP. The Western Balkan and Eastern Partnership economies generally display lower industrial competitiveness and very high energy intensity inherited from the socialist period. For these economies, the estimates indicate larger growth associations of the green transition, which is consistent with, although not a test of, gains from energy efficiency and renewable deployment. The Central Asian economies occupy an intermediate position. Kazakhstan and Uzbekistan have expanded manufacturing but remain dependent on hydrocarbons and energy-intensive processing, while Kyrgyzstan and Tajikistan possess abundant hydropower but limited industrial depth. The subregional estimates in Table 13 show that the moderation pattern holds within the European subsample, and the comparison of European Union members and non-members in Table 15 shows that the direction of both interactions is shared across the two groups, which suggests that the pattern reflects a general regularity rather than a contrast between European and Central Asian economies. Because the two groups also differ in geography, income, energy systems, and the timing of reforms, this comparison does not isolate the role of membership itself.
The role of institutions deserves emphasis. Among the composite indices, institutional quality has the largest standardised coefficient in all specifications. This result is consistent with the finding of Bănică et al. (2024) that institutional quality conditions the effectiveness of green and digital investment in European regions and with the evidence of Shahbaz et al. (2022) that governance mediates the energy transition effects of the digital economy. Institutions thus provide the enabling environment within which industrial capabilities and the twin transition interact, and the results suggest that governance reforms remain a precondition for reaping the benefits of both transitions in the less advanced economies of the sample. Institutional quality can be viewed as a foundational condition that shapes the marginal returns to the digital transition, the green transition, and industrial competitiveness alike. Effective regulation and governance determine whether digital infrastructure is matched by competitive telecommunications markets and digital public services, whether green investment is supported by credible carbon pricing and transparent renewable auctions, and whether industrial upgrading is accompanied by the contract enforcement that attracts value chain investment. The high correlations of institutional quality with the digital and industrial indices in Table 4 are consistent with these linkages. The present specification treats institutional quality as a control, and the possibility of a triple interaction in which governance conditions the moderating role of industrial competitiveness is left for future research.
The mechanisms discussed in this section are theoretically inferred rather than formally tested. Constrained by the limited cross-sectional dimension and by the absence of long and comparable series on channels such as firm-level technology adoption, energy prices paid by manufacturers, and stranded capital, the analysis does not implement formal mediation tests. The pathways described above are supported indirectly by the heterogeneity regressions, the subsample comparisons, and the Granger predictive relationships, which are consistent with them but do not isolate them. Empirical mediation analysis with richer sectoral or firm-level data is therefore a promising avenue for future research. From a theoretical perspective, the findings suggest that the twin transition should be analysed as a process conditioned by structural capabilities rather than as a pair of independent shocks to productivity. Endogenous growth models that treat digital technologies as general-purpose technologies predict larger returns where complementary capabilities are abundant, with which the positive digital interaction is consistent. Models of directed technical change and energy transitions predict that the costs of switching away from carbon-intensive technologies rise with the size of the installed base, with which the negative green interaction is consistent. Combining these perspectives suggests that the growth returns to the two transitions, and hence the appropriate mix of complementary support, may differ across economies at different stages of industrial development, a proposition consistent with the stronger moderation effects observed after European integration deepened.
6. Conclusions
This study examined the growth associations of the digital and green transitions in 24 post-socialist transition economies over the period 1996–2023, with a focus on the moderating role of industrial competitiveness. Using composite indices constructed through principal component analysis and a sequence of estimators that account for cross-sectional dependence, heteroskedasticity, serial correlation, unobserved common factors, mixed integration orders, growth persistence, and potential endogeneity, the analysis produced four main findings. The digital transition, the green transition, and industrial competitiveness are each positively associated with real GDP per capita growth. Industrial competitiveness strengthens the growth association of digitalisation. Industrial competitiveness weakens the growth association of greening, which is largest in less industrialised economies. Granger predictive relationships run in both directions between each transition and growth and from industrial competitiveness to the green transition. These findings are robust to subregional samples, the comparison of European Union members and non-members, the exclusion of shock years, alternative treatments of missing data, and a median split by industrial competitiveness, although the green effect and its interaction are not statistically significant in the 1997–2004 subsample, so the evidence for the green transition and its moderation is concentrated in the period after the 2004 enlargement. The marginal effect of greening is also imprecisely estimated at high levels of industrial competitiveness, where few observations are available, and the evidence does not establish whether it becomes zero or negative in the most industrialised economies. The system GMM and CS-ARDL estimates agree in direction with the static estimates, but they are treated as supplementary evidence because of instrument proliferation and limited residual degrees of freedom. The alternative index constructions show reduced sensitivity of the results to particular components of the indices, but they do not fully remove the concern that the GDP-based intensity components of the green index share a denominator with the growth rate. The central contribution of the study is the evidence that industrial competitiveness conditions the growth associations of the two transitions in opposite directions. The study also shifts the focus from environmental outcomes to economic growth and extends the evidence base to a broad sample of post-socialist economies beyond the European Union. This asymmetric moderation offers a possible structural explanation for the mixed evidence on digital and green synergies and suggests that industrial capabilities shape who gains from the twin transition.
The findings carry several policy implications, which are presented as illustrations consistent with the evidence rather than as interventions identified by the estimates. Because the estimates are conditional associations rather than causal effects, and because the green evidence is weaker in the early transition period and imprecise at high levels of industrial competitiveness, these implications are conditional on the qualifications stated above. Because the analysis compares the growth associations of standardised changes in the indices and does not compare the costs of achieving those changes, the results do not establish a ranking of the two transitions under a fixed budget. An attenuated green growth association also does not imply that greening is undesirable, given its environmental benefits outside GDP. The main implication is that complementary support for the twin transition may be more effective when it takes the industrial conditions of each economy into account than when it is designed as a uniform package. The subregional illustrations that follow apply this general implication to the structural characteristics described in Section 1, and the instruments mentioned are examples from the policy debate whose effects are not estimated in this study. In the Central and Eastern European member states, where manufacturing is competitive and embedded in European value chains, the estimates are consistent with comparatively large growth associations of industrial digitalisation, and, although the green association at high levels of industrial competitiveness is imprecisely estimated, green policies could give particular attention to the transition costs of energy-intensive industries, for example through support for low-carbon process technologies or the retraining of affected workers. In the Western Balkans, where industrial bases are weaker and power systems depend on lignite and ageing hydropower, the larger green growth association observed in less industrialised economies is consistent with the possibility that energy efficiency and renewable deployment under the Green Agenda need not conflict with growth, while the digital growth association is larger where industrial capabilities are stronger. In the Eastern Partnership and Central Asia, the heterogeneity of industrial structures implies that the relevant balance between digital and green support is likely to differ from one economy to another, and the estimates do not identify a preferred combination for any individual economy. Across all subregions, institutional quality has the largest association with growth among the composite indices, which suggests that governance reforms are a plausible complement to both transitions. For European Union funding instruments that target the twin transition, the results indicate that allocation criteria could consider the industrial structure of recipient economies, subject to further evidence on causal effects and costs.
The study has several limitations that suggest directions for future research. First, the composite indices are bounded by the constraints of the raw source data. Long-run comparability requires legacy indicators, which excludes newer measures such as internet connection quality, artificial intelligence adoption, and green patents that are not available for the full period and sample, and future work could construct indices for shorter recent periods that incorporate these measures. Second, although the sensitivity analysis indicates that the results are generally robust to alternative treatments of missing data, the early post-socialist years and the biennial governance series still rely partly on imputed values whose accuracy cannot be directly verified. The interpolated governance values for 1997, 1999, and 2001 are retained across all specifications. In addition, each alternative green index retains one GDP-based intensity measure, meaning that the analysis reduces but does not entirely eliminate potential mechanical associations with contemporaneous growth. Third, the relatively small cross-sectional dimension and limited time-series coverage impose some constraints on the empirical analysis. These data characteristics may affect the precision of the estimates and the informativeness of certain diagnostic tests, particularly for the system GMM and mean group estimators. In every system GMM specification, including the restricted instrument sets, the total number of instruments exceeds the number of economies, which weakens the Hansen test and may pull the coefficients toward those of uninstrumented estimators, so the GMM estimates do not provide independent confirmation of the main findings. The CS-ARDL specification leaves only one residual degree of freedom in each economy-specific regression, so its estimates are supplementary rather than decisive. Consequently, uncertainty remains regarding potential endogeneity and unobserved common factors, and the evidence for the green transition is weaker for the early transition period than for the period after 2004. Fourth, the main specification imposes linear moderation. The median split and the comparison of membership groups point to the same asymmetric pattern, but threshold, smooth transition, or semiparametric models could characterise the shape of the moderation more precisely. Fifth, the economy-level analysis masks within-economy regional and sectoral heterogeneity, which subnational, sectoral, or firm-level data could reveal. Sixth, the mechanisms behind the asymmetric moderation are inferred from theory rather than tested through formal mediation analysis, and the possible triple interaction between institutional quality, industrial competitiveness, and the twin transition remains to be examined. Despite these limitations, the evidence indicates that the growth associations of the twin transition in post-socialist economies depend on the industrial foundations on which it is built.
Author Contributions
Conceptualization, O.K. and Z.M.; methodology, S.Y. and Z.M.; software, B.K.; validation, S.Y. and S.E.; formal analysis, Z.M.; investigation, O.K. and S.A.; resources, N.Y.; data curation, B.K. and N.Y.; writing—original draft preparation, O.K. and S.A.; writing—review and editing, S.A. and S.E.; visualization, B.K.; supervision, S.Y. and S.E.; project administration, N.Y.; funding acquisition, O.K., S.Y., Z.M., S.A., B.K., N.Y. and S.E. All authors have read and agreed to the published version of the manuscript.
Funding
This research received no external funding.
Institutional Review Board Statement
Not applicable.
Informed Consent Statement
Not applicable.
Data Availability Statement
The data were obtained from publicly available sources, namely the World Bank World Development Indicators (https://databank.worldbank.org/source/world-development-indicators, accessed on 4 August 2026) and the Worldwide Governance Indicators (https://www.worldbank.org/en/publication/worldwide-governance-indicators, accessed on 7 August 2026) databases. The processed dataset is available from the corresponding author upon reasonable request.
Conflicts of Interest
The author declares no conflicts of interest.
Abbreviations
The following abbreviations are used in this manuscript.
| ADF | Augmented Dickey–Fuller |
| CADF | Cross-sectionally augmented Dickey–Fuller |
| CCEMG | Common correlated effects mean group |
| CD | Cross-sectional dependence (Pesaran test) |
| CEE | Central and Eastern Europe |
| CIPS | Cross-sectionally augmented Im–Pesaran–Shin |
| CS-ARDL | Cross-sectionally augmented autoregressive distributed lag |
| DH | Dumitrescu–Hurlin |
| DIG | Digital Transition Index |
| EU | European Union |
| FE | Fixed effects |
| GFCF | Gross fixed capital formation |
| GMM | Generalised method of moments |
| GRN | Green Transition Index |
| HPJ | Half-panel jackknife |
| ICT | Information and communication technology |
| IND | Industrial Competitiveness Index |
| INST | Institutional Quality Index |
| IPS | Im–Pesaran–Shin |
| KMO | Kaiser–Meyer–Olkin |
| LLC | Levin–Lin–Chu |
| OPEN | Trade openness |
| PCA | Principal component analysis |
| PCSE | Panel-corrected standard errors |
| RGDPG | Real GDP per capita growth |
| VIF | Variance inflation factor |
| WGI | Worldwide Governance Indicators |
Appendix A
This appendix provides supplementary documentation. Table A1 reports data coverage and imputation by economy and variable. Table A2 reports the classification of variables and the instrument lag structure in the system GMM estimations, and Table A3 reports instrument counts and diagnostics for the main, subsample, and restricted instrument specifications.
Table A1.
Imputed variable-level economy-year observations by economy and variable, 1996–2023.
Table A2.
System GMM specification, variable classification, and instrument lag structure.
Table A3.
Instrument counts, diagnostics, and restricted instrument sets for the system GMM estimations.
References
- Ahmed, Z., Ahmad, M., Rjoub, H., Kalugina, O. A., & Hussain, N. (2022). Economic growth, renewable energy consumption, and ecological footprint: Exploring the role of environmental regulations and democracy in sustainable development. Sustainable Development, 30(4), 595–605. [Google Scholar] [CrossRef] [Scilit]
- Babakhonov, J., Qosimova, H., Makhmudov, S., Sobirov, Y., Murodkhujayeva, F., Kurbanov, D., & Ruzmetov, B. (2026). Green transition in Europe: The effectiveness of environmental taxes and green innovation in reducing CO2 emissions. Economies, 14(6), 231. [Google Scholar] [CrossRef] [Scilit]
- Baron, R. M., & Kenny, D. A. (1986). The moderator–mediator variable distinction in social psychological research: Conceptual, strategic, and statistical considerations. Journal of Personality and Social Psychology, 51(6), 1173–1182. [Google Scholar] [CrossRef]
- Bănică, A., Țigănașu, R., Nijkamp, P., & Kourtit, K. (2024). Institutional quality in green and digital transition of EU regions: A recovery and resilience analysis. Global Challenges, 8(9), 2400031. [Google Scholar] [CrossRef] [Scilit]
- Benassi, M., Grinza, E., Rentocchini, F., & Rondi, L. (2022). Patenting in 4IR technologies and firm performance. Industrial and Corporate Change, 31(1), 112–136. [Google Scholar] [CrossRef] [Scilit]
- Bianchini, S., Damioli, G., & Ghisetti, C. (2023). The environmental effects of the “twin” green and digital transition in European regions. Environmental and Resource Economics, 84(4), 877–918. [Google Scholar] [CrossRef] [Scilit]
- Bocean, C. G., & Vărzaru, A. A. (2023). EU countries’ digital transformation, economic performance, and sustainability analysis. Humanities and Social Sciences Communications, 10, 875. [Google Scholar] [CrossRef] [Scilit]
- Brambor, T., Clark, W. R., & Golder, M. (2006). Understanding interaction models: Improving empirical analyses. Political Analysis, 14(1), 63–82. [Google Scholar] [CrossRef] [Scilit]
- Breitung, J., Kripfganz, S., & Hayakawa, K. (2022). Bias-corrected method of moments estimators for dynamic panel data models. Econometrics and Statistics, 24, 116–132. [Google Scholar] [CrossRef] [Scilit]
- Chatzistamoulou, N. (2023). Is digital transformation the Deus ex Machina towards sustainability transition of the European SMEs? Ecological Economics, 206, 107739. [Google Scholar] [CrossRef] [Scilit]
- Chen, C., Pinar, M., & Stengos, T. (2022). Renewable energy and CO2 emissions: New evidence with the panel threshold model. Renewable Energy, 194, 117–128. [Google Scholar] [CrossRef] [Scilit]
- Chen, Z., & Xing, R. (2025). Digital economy, green innovation and high-quality economic development. International Review of Economics & Finance, 99, 104029. [Google Scholar] [CrossRef] [Scilit]
- Chudik, A., & Pesaran, M. H. (2015). Common correlated effects estimation of heterogeneous dynamic panel data models with weakly exogenous regressors. Journal of Econometrics, 188(2), 393–420. [Google Scholar] [CrossRef] [Scilit]
- Cicerone, G., Faggian, A., Montresor, S., & Rentocchini, F. (2023). Regional artificial intelligence and the geography of environmental technologies: Does local AI knowledge help regional green-tech specialization? Regional Studies, 57(2), 330–343. [Google Scholar] [CrossRef] [Scilit]
- Cirillo, V., Fanti, L., Mina, A., & Ricci, A. (2023). The adoption of digital technologies: Investment, skills, work organisation. Structural Change and Economic Dynamics, 66, 89–105. [Google Scholar] [CrossRef] [Scilit]
- Diodato, D., Huergo, E., Moncada-Paternò-Castello, P., Rentocchini, F., & Timmermans, B. (2023). Introduction to the special issue on “the twin (digital and green) transition: Handling the economic and social challenges”. Industry and Innovation, 30(7), 755–765. [Google Scholar] [CrossRef] [Scilit]
- Driscoll, J. C., & Kraay, A. C. (1998). Consistent covariance matrix estimation with spatially dependent panel data. The Review of Economics and Statistics, 80(4), 549–560. [Google Scholar] [CrossRef] [Scilit]
- Fan, T., Peters, M., & Zilibotti, F. (2023). Growing like India: The unequal effects of service-led growth. Econometrica, 91(4), 1457–1494. [Google Scholar] [CrossRef] [Scilit]
- Fazio, G., Maioli, S., & Rujimora, N. (2025). The twin innovation transitions of European regions. Regional Studies, 59(1), 2309176. [Google Scholar] [CrossRef] [Scilit]
- Fedajev, A., Mitić, P., Kojić, M., & Radulescu, M. (2023). Driving industrial and economic growth in Central and Eastern Europe: The role of electricity infrastructure and renewable energy. Utilities Policy, 85, 101683. [Google Scholar] [CrossRef] [Scilit]
- Fouquet, R., & Hippe, R. (2022). Twin transitions of decarbonisation and digitalisation: A historical perspective on energy and information in European economies. Energy Research & Social Science, 91, 102736. [Google Scholar] [CrossRef] [Scilit]
- Gaglio, C., Kraemer-Mbula, E., & Lorenz, E. (2022). The effects of digital transformation on innovation and productivity: Firm-level evidence of South African manufacturing micro and small enterprises. Technological Forecasting and Social Change, 182, 121785. [Google Scholar] [CrossRef] [Scilit]
- Gao, X. (2025). The EU’s twin transitions towards sustainability and digital leadership: A coherent or fragmented policy field? Regional Studies, 59(1), 2360053. [Google Scholar] [CrossRef] [Scilit]
- Ghobakhloo, M., Iranmanesh, M., Mubarak, M. F., Mubarik, M., Rejeb, A., & Nilashi, M. (2022). Identifying industry 5.0 contributions to sustainable development: A strategy roadmap for delivering sustainability values. Sustainable Production and Consumption, 33, 716–737. [Google Scholar] [CrossRef] [Scilit]
- Ha, L. T., Huong, T. T. L., & Thanh, T. T. (2022). Is digitalization a driver to enhance environmental performance? An empirical investigation of European countries. Sustainable Production and Consumption, 32, 230–247. [Google Scholar] [CrossRef] [Scilit]
- Hainmueller, J., Mummolo, J., & Xu, Y. (2019). How much should we trust estimates from multiplicative interaction models? Simple tools to improve empirical practice. Political Analysis, 27(2), 163–192, (Correction in 2019, Political Analysis, 28, 146). [Google Scholar] [CrossRef] [Scilit]
- Halilbegović, S., Pekmez, Z., & Rehman, A. (2023). Modeling the nexus of renewable and non-renewable energy consumption and economic progress in Southeastern Europe: A panel data analysis. Sustainability, 15(12), 9413. [Google Scholar] [CrossRef] [Scilit]
- Hamilton, C., & de Vries, G. J. (2025). The structural transformation of transition economies. World Development, 191, 106977. [Google Scholar] [CrossRef] [Scilit]
- Honaker, J., & King, G. (2010). What to do about missing values in time-series cross-section data. American Journal of Political Science, 54(2), 561–581. [Google Scholar] [CrossRef] [Scilit]
- Hsiao, C. (2022). Analysis of panel data (4th ed.). Cambridge University Press. [Google Scholar] [CrossRef] [Scilit]
- Iacobucci, D., Schneider, M. J., Popovich, D. L., & Bakamitsos, G. A. (2016). Mean centering helps alleviate “micro” but not “macro” multicollinearity. Behavior Research Methods, 48(4), 1308–1317. [Google Scholar] [CrossRef] [Scilit]
- Imomkulov, T., Samiyev, S., Shanyazov, N., Mamadiyarov, Z., Kurbonbekova, M., Kuralbaev, J., & Odamboyev, O. (2026). Digital connectivity, financial development, and economic performance in BRICS economies: Evidence from robust panel estimators and distributional dynamics. Economies, 14(4), 138. [Google Scholar] [CrossRef] [Scilit]
- Juhász, R., Lane, N., & Rodrik, D. (2024). The new economics of industrial policy. Annual Review of Economics, 16, 213–242. [Google Scholar] [CrossRef] [Scilit]
- Juodis, A., Karavias, Y., & Sarafidis, V. (2021). A homogeneous approach to testing for Granger non-causality in heterogeneous panels. Empirical Economics, 60(1), 93–112. [Google Scholar] [CrossRef] [Scilit]
- Juodis, A., & Reese, S. (2022). The incidental parameters problem in testing for remaining cross-section correlation. Journal of Business & Economic Statistics, 40(3), 1191–1203. [Google Scholar] [CrossRef] [Scilit]
- Kovacic, Z., García Casañas, C., Argüelles, L., Yáñez Serrano, P., Ribera-Fumaz, R., Prause, L., & March, H. (2024). The twin green and digital transition: High-level policy or science fiction? Environment and Planning E: Nature and Space, 7(6), 2251–2278. [Google Scholar] [CrossRef] [Scilit]
- Kruse, H., Mensah, E., Sen, K., & de Vries, G. (2023). A manufacturing (re)naissance? Industrialization in the developing world. IMF Economic Review, 71(2), 439–473. [Google Scholar] [CrossRef] [Scilit]
- Kurniawati, M. A. (2022). Analysis of the impact of information communication technology on economic growth: Empirical evidence from Asian countries. Journal of Asian Business and Economic Studies, 29(1), 2–18. [Google Scholar] [CrossRef] [Scilit]
- Liadze, I., Macchiarelli, C., Mortimer-Lee, P., & Sanchez Juanino, P. (2023). Economic costs of the Russia–Ukraine war. The World Economy, 46(4), 874–886. [Google Scholar] [CrossRef] [Scilit]
- Lu, M., & Staehr, K. (2025). Revisiting economic growth and real convergence in the post-communist countries. Eurasian Economic Review, 15(1), 89–123. [Google Scholar] [CrossRef] [Scilit]
- Luo, K., Liu, Y., Chen, P.-F., & Zeng, M. (2022). Assessing the impact of digital economy on green development efficiency in the Yangtze River Economic Belt. Energy Economics, 112, 106127. [Google Scholar] [CrossRef] [Scilit]
- Lyu, Y., Wang, W., Wu, Y., & Zhang, J. (2023). How does digital economy affect green total factor productivity? Evidence from China. Science of the Total Environment, 857, 159428. [Google Scholar] [CrossRef] [Scilit]
- Mamadiyarov, Z., Kholmatov, S., Sobirov, Y., Narzullayeva, G., Matyoqubov, A., Beruniy, A., & Mirzaev, F. (2026). Economic growth in the Next-11 economies: The roles of structural, institutional, and human capital factors with evidence on FDI effects. Economies, 14(5), 183. [Google Scholar] [CrossRef] [Scilit]
- Mäkitie, T., Hanson, J., Damman, S., & Wardeberg, M. (2023). Digital innovation’s contribution to sustainability transitions. Technology in Society, 73, 102255. [Google Scholar] [CrossRef] [Scilit]
- Meidute-Kavaliauskiene, I., Iurasova, O., & Mačiulytė-Šniukienė, A. (2026). Between sustainability and economic growth: Links between environmental protection, energy consumption, and digitalisation, and macroeconomic indicators in EU countries. Frontiers in Sustainability, 7, 1891619. [Google Scholar] [CrossRef] [Scilit]
- Metcalf, G. E., & Stock, J. H. (2023). The macroeconomic impact of Europe’s carbon taxes. American Economic Journal: Macroeconomics, 15(3), 265–286. [Google Scholar] [CrossRef] [Scilit]
- Mihajlović, V. (2025). Debt-threshold effects on growth in post-communist EU economies: Does institutional quality matter? Post-Communist Economies, 37(7), 770–788. [Google Scholar] [CrossRef] [Scilit]
- Mura, P. O., & Donath, L. E. (2023). Digitalisation and economic growth in the European Union. Electronics, 12(7), 1718. [Google Scholar] [CrossRef] [Scilit]
- Nguimkeu, P., & Zeufack, A. (2024). Manufacturing in structural change in Africa. World Development, 177, 106542. [Google Scholar] [CrossRef] [Scilit]
- Olczyk, M., & Kuc-Czarnecka, M. (2022). Digital transformation and economic growth: DESI improvement and implementation. Technological and Economic Development of Economy, 28(3), 775–803. [Google Scholar] [CrossRef] [Scilit]
- Pan, W., Xie, T., Wang, Z., & Ma, L. (2022). Digital economy: An innovation driver for total factor productivity. Journal of Business Research, 139, 303–311. [Google Scholar] [CrossRef] [Scilit]
- Pesaran, M. H. (2006). Estimation and inference in large heterogeneous panels with a multifactor error structure. Econometrica, 74(4), 967–1012. [Google Scholar] [CrossRef] [Scilit]
- Pesaran, M. H. (2007). A simple panel unit root test in the presence of cross-section dependence. Journal of Applied Econometrics, 22(2), 265–312. [Google Scholar] [CrossRef] [Scilit]
- Rehman, N. U., & Nunziante, G. (2023). The effect of the digital economy on total factor productivity in European regions. Telecommunications Policy, 47(10), 102650. [Google Scholar] [CrossRef] [Scilit]
- Rodríguez-Pose, A., & Bartalucci, F. (2024). The green transition and its potential territorial discontents. Cambridge Journal of Regions, Economy and Society, 17(2), 339–358. [Google Scholar] [CrossRef]
- Roodman, D. (2009). A note on the theme of too many instruments. Oxford Bulletin of Economics and Statistics, 71(1), 135–158. [Google Scholar] [CrossRef] [Scilit]
- Santarius, T., Dencik, L., Diez, T., Ferreboeuf, H., Jankowski, P., Hankey, S., Hilbeck, A., Hilty, L. M., Höjer, M., Kleine, D., Lange, S., Pohl, J., Reisch, L., Ryghaug, M., Schwanen, T., & Staab, P. (2023). Digitalization and sustainability: A call for a digital green deal. Environmental Science & Policy, 147, 11–14. [Google Scholar] [CrossRef] [Scilit]
- Seti, T. M., Mazwane, S., & Christian, M. (2025). Financial openness, trade openness, and economic growth nexus: A dynamic panel analysis for emerging and developing economies. Journal of Risk and Financial Management, 18(2), 78. [Google Scholar] [CrossRef] [Scilit]
- Shahbaz, M., Wang, J., Dong, K., & Zhao, J. (2022). The impact of digital economy on energy transition across the globe: The mediating role of government governance. Renewable and Sustainable Energy Reviews, 166, 112620. [Google Scholar] [CrossRef] [Scilit]
- Simionescu, M., Rădulescu, M., & Cifuentes-Faura, J. (2023). Renewable energy consumption-growth nexus in European countries: A sectoral approach. Evaluation Review, 47(2), 287–319. [Google Scholar] [CrossRef] [Scilit]
- Smailov, M., Mamadiyarov, Z., Isakov, J., Sherjonov, S., Kurbonov, B., Kilicheva, K., & Hudayberganov, D. (2026). Socio-economic inequality, social infrastructure, and quality of life in Central Asia: The roles of digital infrastructure and structural transformation. Economies, 14(8), 309. [Google Scholar] [CrossRef] [Scilit]
- Sobirov, Y., Artikov, B., Saburov, J., Khodjaniyazov, E., Karimov, M., Saidmamatov, O., & Marty, P. (2025). Exploring ICT as an engine for sustainable economic growth in Central Asia. Economies, 13(12), 365. [Google Scholar] [CrossRef] [Scilit]
- Verma, A., Dandgawhal, P. S., & Giri, A. K. (2023). Impact of ICT diffusion and financial development on economic growth in developing countries. Journal of Economics, Finance and Administrative Science, 28(55), 27–43. [Google Scholar] [CrossRef] [Scilit]
- Wan, L., Wan, X., Fang, Y., & Huang, G. (2025). From digitalization to green transformation: Empirical evidence from RCEP’s industrial sectors. Humanities and Social Sciences Communications, 12, 127. [Google Scholar] [CrossRef] [Scilit]
- Wang, J., Dong, K., Dong, X., & Taghizadeh-Hesary, F. (2022). Assessing the digital economy and its carbon-mitigation effects: The case of China. Energy Economics, 113, 106198. [Google Scholar] [CrossRef] [Scilit]
- Wang, Q., Dong, Z., Li, R., & Wang, L. (2022). Renewable energy and economic growth: New insight from country risks. Energy, 238, 122018. [Google Scholar] [CrossRef] [Scilit]
- Wang, Q., Hu, S., & Li, R. (2024). Could information and communication technology (ICT) reduce carbon emissions? The role of trade openness and financial development. Telecommunications Policy, 48(3), 102699. [Google Scholar] [CrossRef] [Scilit]
- Wang, Q., Zhang, F., & Li, R. (2023). Revisiting the environmental Kuznets curve hypothesis in 208 counties: The roles of trade openness, human capital, renewable energy and natural resource rent. Environmental Research, 216, 114637. [Google Scholar] [CrossRef] [Scilit]
- Xiao, J., Karavias, Y., Juodis, A., Sarafidis, V., & Ditzen, J. (2023). Improved tests for Granger noncausality in panel data. The Stata Journal, 23(1), 230–242. [Google Scholar] [CrossRef] [Scilit]
- Yusubov, I., & Csonka, A. (2026). Dimensions of digitalization and SME intra-EU export performance: Panel evidence from the CEE-8 economies. Economies, 14(5), 147. [Google Scholar] [CrossRef] [Scilit]
- Zhang, W., Liu, X., Wang, D., & Zhou, J. (2022). Digital economy and carbon emission performance: Evidence at China’s city level. Energy Policy, 165, 112927. [Google Scholar] [CrossRef] [Scilit]
- Zou, Z., Zhou, H., & Yu, K. (2026). Renewable energy adoption and conditional income convergence: Evidence from Central and Eastern Europe. Economies, 14(9), 364. [Google Scholar] [CrossRef] [Scilit]
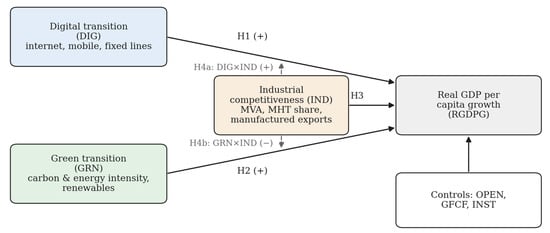
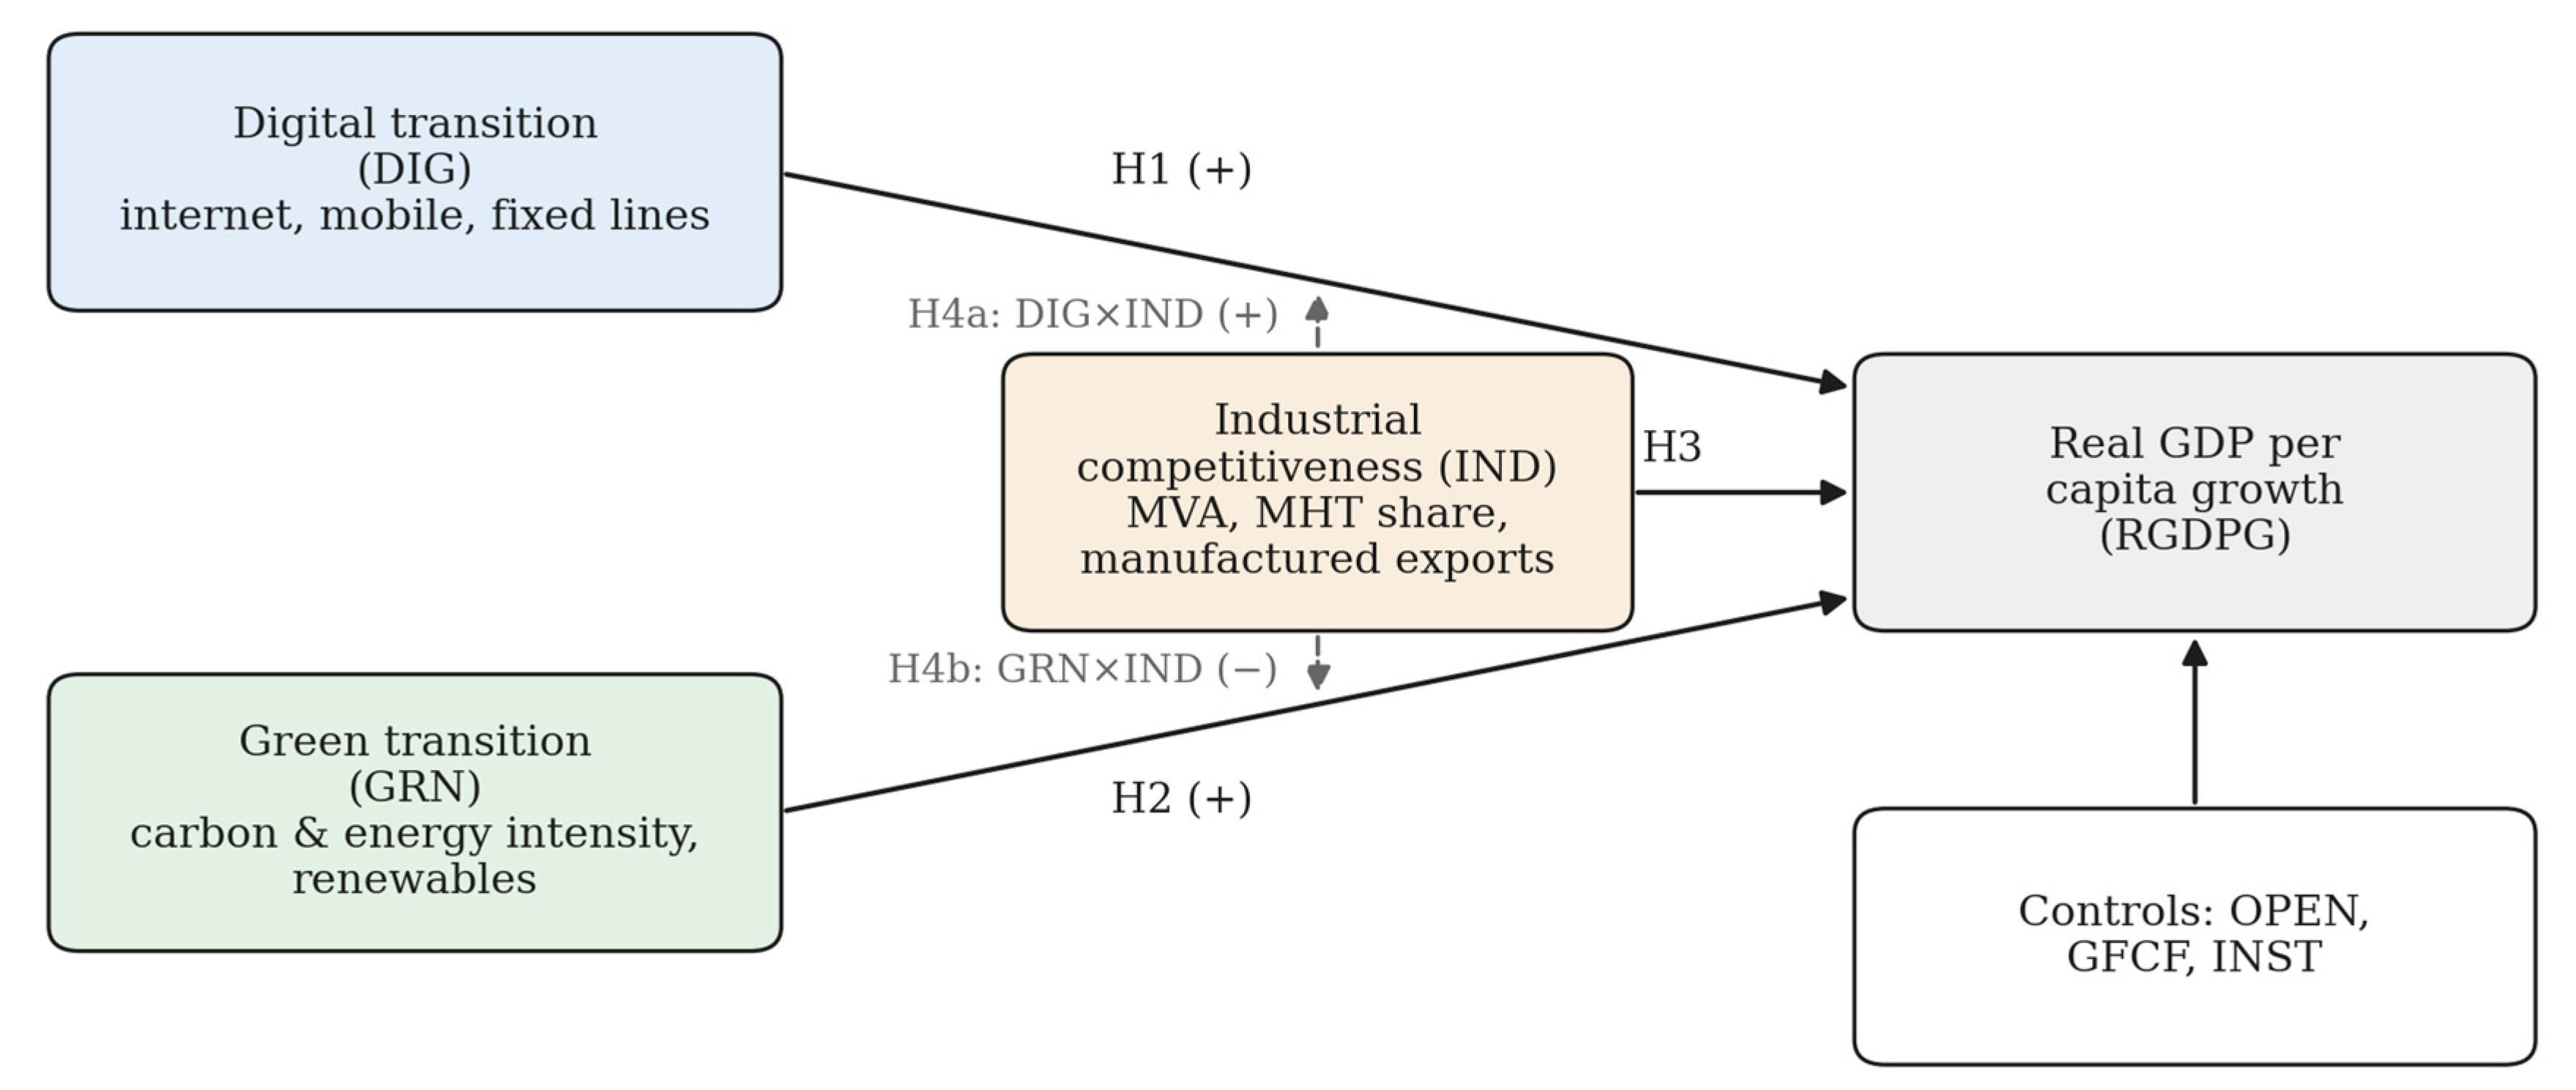
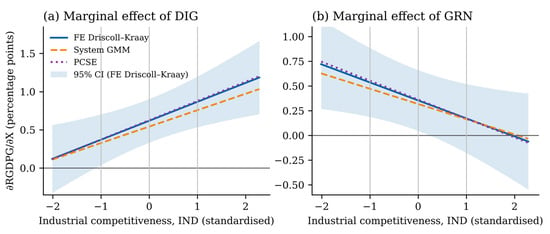
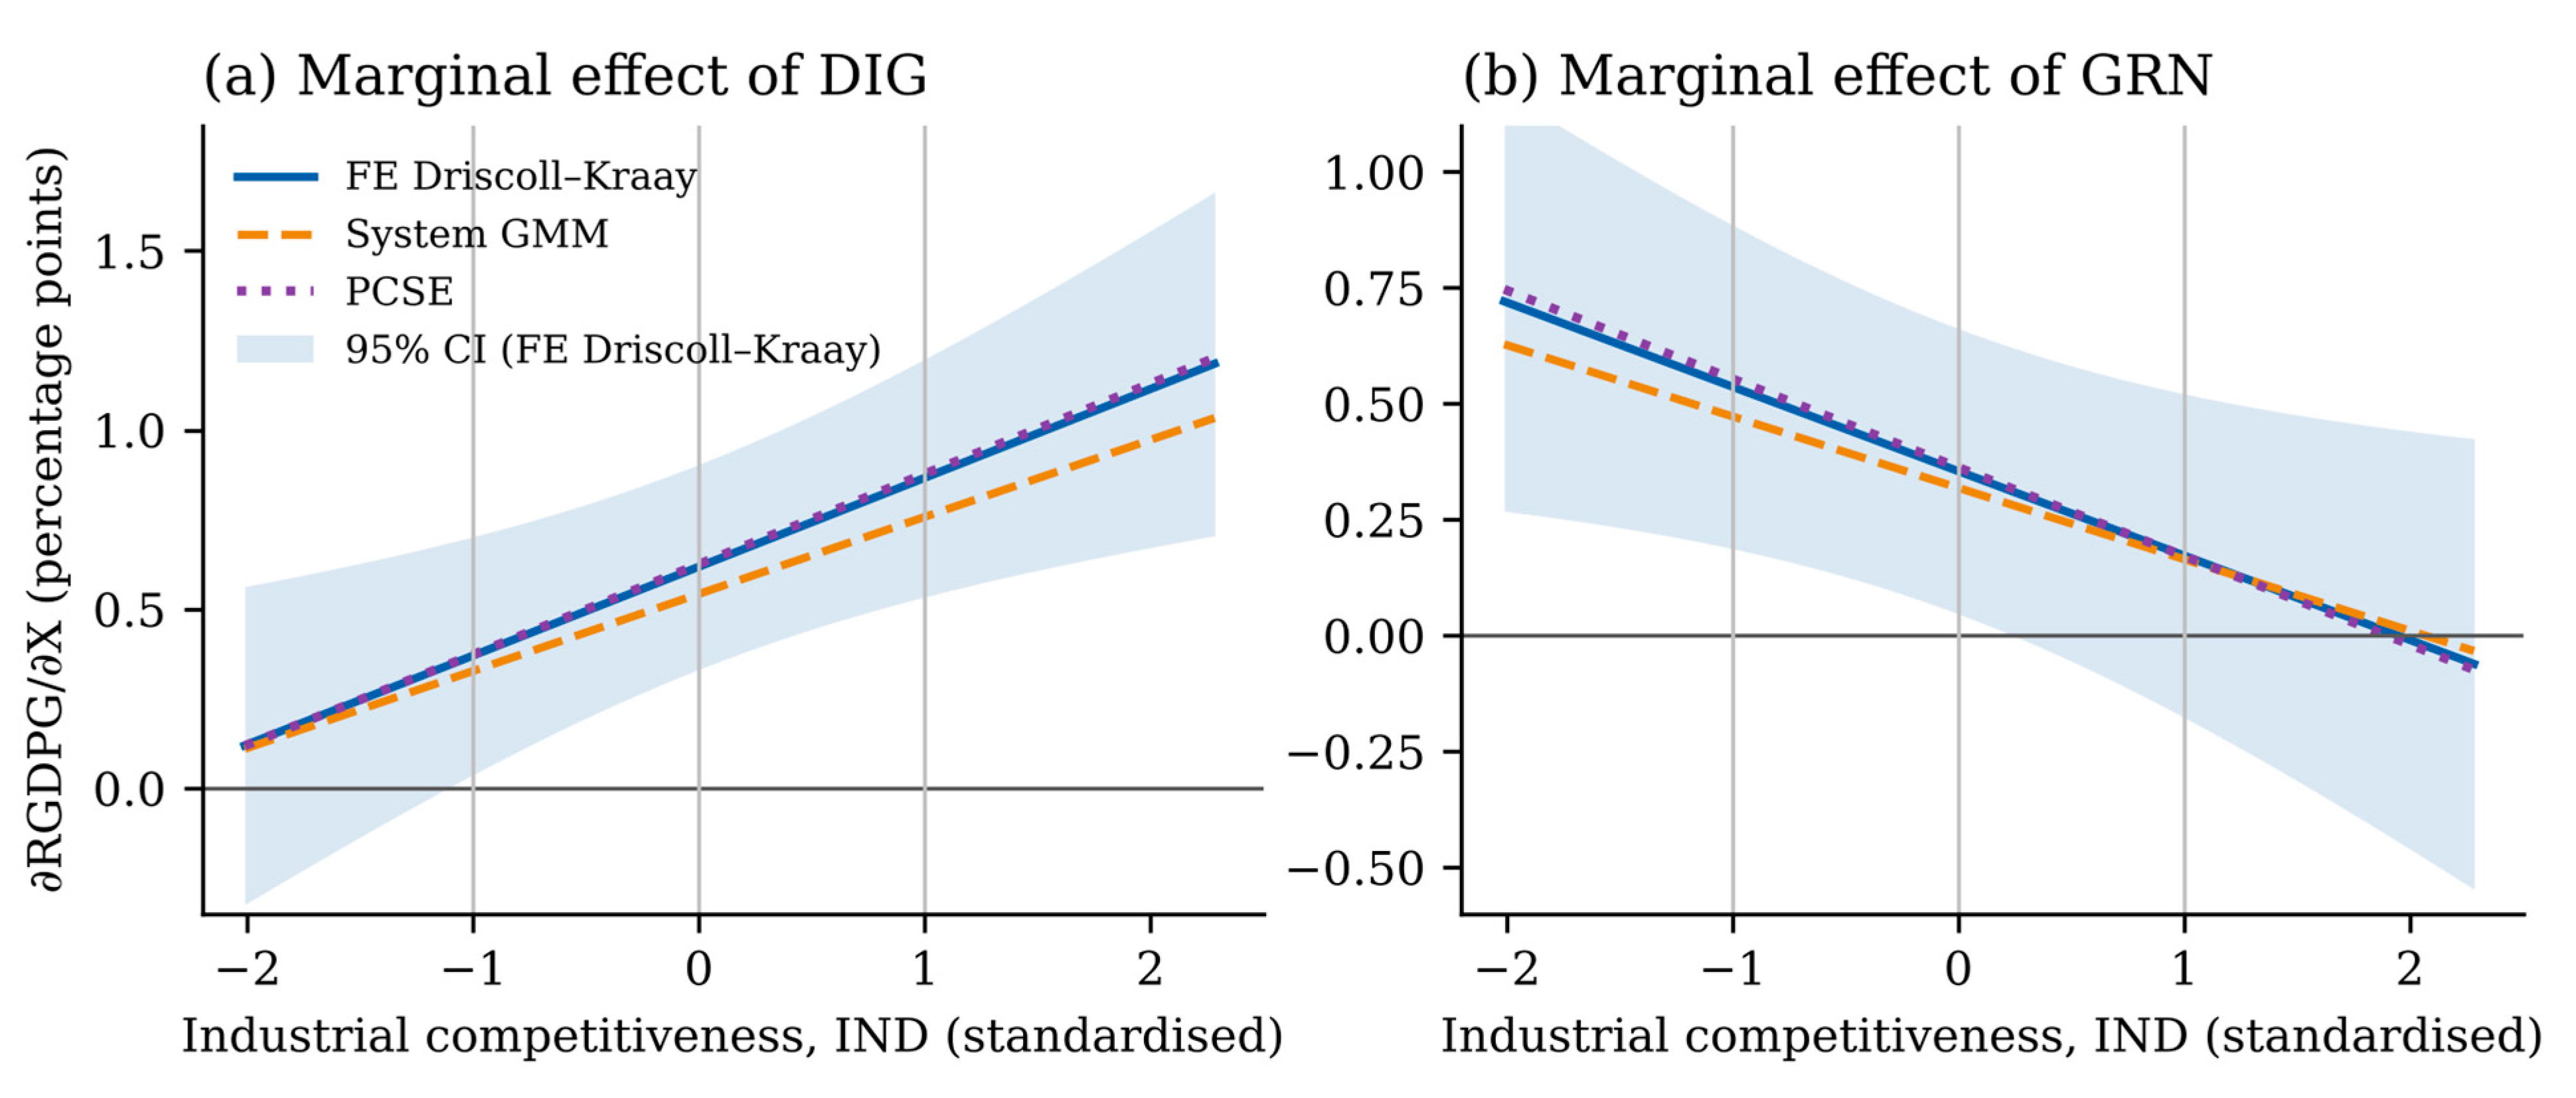

Disclaimer/Publisher’s Note: The statements, opinions and data contained in all publications are solely those of the individual author(s) and contributor(s) and not of MDPI and/or the editor(s). MDPI and/or the editor(s) disclaim responsibility for any injury to people or property resulting from any ideas, methods, instructions or products referred to in the content. |
© 2026 by the authors. Licensee MDPI, Basel, Switzerland. This article is an open access article distributed under the terms and conditions of the Creative Commons Attribution (CC BY) license.