


Abstract
This study examines whether the relationship between banks’ environmental, social, and governance (ESG) performance and loan growth varies with monetary-policy conditions. Using an annual panel of listed U.S. and European banks over 2016–2025, we combine bank-level ESG and financial data with central-bank policy-rate data. Bank and year fixed-effects models relate one-year-lagged ESG performance to subsequent loan growth and interact ESG with changes in policy rates. Higher ESG performance is positively associated with subsequent loan growth, but this association weakens as policy-rate changes increase. Consistently, the positive ESG–loan-growth association observed during non-tightening periods becomes economically small and statistically insignificant during monetary tightening. The negative ESG–policy interaction extends across the environmental, social, and governance pillars and remains significant under alternative monetary-policy measures and timing, dynamic specifications, and several treatments of monetary-area-time dependence. However, the interaction becomes substantially smaller and statistically insignificant when monetary-area-by-year fixed effects are absorbed. Overall, the findings identify monetary-policy conditions as an important boundary condition in the ESG–bank-lending relationship while supporting a conditional rather than causal interpretation.
1. Introduction
Banks play a central role in the transmission of monetary policy because changes in monetary conditions can affect their funding costs, balance-sheet constraints, risk assessments, and lending decisions. A substantial body of literature shows that this transmission is heterogeneous across financial intermediaries. Bank size, capitalization, liquidity, funding structure, and business models influence the extent to which lending varies with monetary-policy conditions (Bernanke & Gertler, 1995; Kashyap & Stein, 2000; Kishan & Opiela, 2000; Gambacorta & Marqués-Ibáñez, 2011; Jiménez et al., 2012; Naqvi & Pungaliya, 2023). Identifying additional bank characteristics associated with heterogeneous lending behavior is therefore important for understanding monetary-policy transmission through the banking system.
Environmental, social, and governance (ESG) performance has become an increasingly relevant characteristic of financial institutions. Banks not only allocate capital across borrowers with different sustainability profiles but also possess their own ESG characteristics, which may be associated with stakeholder relationships, reputation, governance quality, risk management, liquidity creation, and funding conditions. Houston and Shan (2022), for example, show that banks are more likely to establish lending relationships with borrowers whose ESG profiles resemble their own, suggesting that ESG characteristics can enter the credit-intermediation process itself.
Existing evidence identifies several channels through which banks’ own ESG performance may be associated with lending. Stronger ESG performance has been linked to lower funding and deposit costs (Andrieș & Sprincean, 2023), as well as more favorable bond-funding conditions among European banks (Agnese & Giacomini, 2023). Sustainability characteristics have also been associated with bank risk and liquidity creation (Gangi et al., 2019; Zheng et al., 2023; Lee et al., 2024). More directly, stronger ESG performance has been associated with less procyclical lending (Abdelsalam et al., 2023) and smaller lending contractions during financial crises (Danisman & Tarazi, 2024), while international evidence indicates that the ESG–lending relationship varies across economic and institutional settings (Doan et al., 2026). Together, these findings suggest that the relevance of ESG for lending may depend on the conditions under which banks operate.
Monetary policy provides an important setting in which to examine this conditionality. The bank lending-channel literature shows that monetary-policy transmission varies with bank liquidity, capitalization, size, funding structure, and business models (Kashyap & Stein, 2000; Kishan & Opiela, 2000; Gambacorta & Marqués-Ibáñez, 2011; Jiménez et al., 2012). Evidence that bank size is associated with different monetary-policy sensitivities across tight and loose regimes further demonstrates that the relevance of bank characteristics can be state-dependent (Naqvi & Pungaliya, 2023). Monetary tightening may therefore alter the relative importance of ESG-related characteristics as funding costs, borrower conditions, risk repricing, and balance-sheet constraints change.
Sustainability has increasingly entered this monetary-transmission literature. Most directly, Cantero-Saiz et al. (2023) show that sustainability can condition the relationship between monetary-policy decisions and bank lending among listed OECD banks during 2016–2019. Evidence from the more recent rising-rate period also indicates that ESG characteristics remain relevant to banking outcomes under restrictive monetary conditions (Sun et al., 2024). The remaining question addressed here is therefore how banks’ own ESG performance relates to loan growth across a broader range of monetary conditions, including explicit tightening regimes, and whether this conditionality extends across the environmental, social, and governance dimensions.
Two competing mechanisms motivate this question. A resilience mechanism suggests that ESG-related advantages in funding, liquidity, risk management, reputation, or stakeholder relationships may help higher-ESG banks sustain lending under restrictive monetary conditions, consistent with evidence of less procyclical lending and smaller crisis-period lending contractions (Abdelsalam et al., 2023; Danisman & Tarazi, 2024). An attenuation mechanism, by contrast, suggests that tighter monetary conditions may reduce the incremental relevance of ESG-related differences as conventional financial constraints become more binding. Because these mechanisms imply different responses to monetary tightening, the direction of the moderating relationship remains an empirical question.
Against this background, this study examines how bank ESG performance is associated with loan growth conditional on monetary-policy conditions. We use an annual panel of listed banks in the United States and Europe over 2016–2025, combining bank-level ESG and financial data with central-bank policy-rate information. The empirical design relates one-year-lagged ESG performance to subsequent loan growth and interacts ESG with changes in policy rates. We additionally distinguish monetary-tightening from non-tightening observations and examine the environmental, social, and governance pillars separately. The sample period spans substantially different monetary environments, including the pre-pandemic period, the exceptional conditions surrounding COVID-19, and the subsequent sharp tightening cycle.
The results reveal a pronounced state-dependent relationship. Higher lagged ESG performance is positively associated with subsequent loan growth, but the interaction between ESG and policy-rate changes is negative and statistically significant. Marginal-effects estimates show that the positive association between ESG performance and subsequent loan growth weakens progressively as policy-rate changes increase and becomes statistically indistinguishable from zero under sufficiently large rate increases. The monetary-regime analysis provides a complementary result: ESG is positively associated with loan growth during non-tightening periods, whereas this association becomes economically small and statistically insignificant during tightening. Importantly, this evidence does not imply that higher-ESG banks significantly reduce lending when policy rates rise; rather, the positive lending differential associated with ESG is substantially attenuated under tighter monetary conditions. The negative moderating pattern is also present across the environmental, social, and governance pillars. The interaction remains significant across several alternative specifications, including alternative policy measures and timing, but becomes small and statistically insignificant when monetary-area-by-year fixed effects are absorbed, indicating that the baseline moderation pattern is sensitive to stringent controls for common monetary-area-time shocks.
This study contributes to the literature in three related ways. First, it extends research on ESG and bank lending by showing that the association between banks’ own ESG performance and subsequent loan growth is state-dependent, varying systematically with monetary-policy conditions rather than remaining constant across policy environments. Second, building directly on Cantero-Saiz et al. (2023), this study examines this conditionality over a substantially broader and more heterogeneous monetary-policy environment. Whereas their analysis covers listed OECD banks during 2016–2019, our 2016–2025 sample spans the pre-pandemic period, the COVID-19 disruption, and, importantly, the sharp post-pandemic tightening cycle. This variation allows us to examine explicitly whether the ESG–lending association differs between tightening and non-tightening regimes and to assess the result using alternative measures and timing of monetary-policy changes. Third, this study disaggregates aggregate ESG performance into its environmental, social, and governance pillars and shows that the negative ESG–policy-rate interaction is present across all three dimensions. Taken together, these contributions identify monetary-policy conditions as an important boundary condition in the ESG–bank-lending relationship and highlight the importance of evaluating ESG-related lending patterns jointly with the prevailing monetary environment.
The remainder of this paper is organized as follows. Section 2 reviews the related literature and develops the hypotheses. Section 3 describes the data, variables, and empirical methodology. Section 4 presents the empirical results and robustness analyses. Section 5 and Section 6 discuss the findings, implications, limitations, and conclusions.
2. Literature Review and Hypothesis Development
2.1. ESG Performance and Bank Lending
The growing integration of environmental, social, and governance (ESG) considerations into financial intermediation has extended the banking literature beyond profitability, valuation, and risk toward banks’ core intermediation functions. ESG performance may influence lending through stakeholder relationships, funding conditions, liquidity, and risk management. Stronger ESG engagement may enhance relationships with depositors, borrowers, investors, and other stakeholders, generating reputational and trust-related benefits that can support financial resilience (Lins et al., 2017). Consistent with these mechanisms, Nizam et al. (2019) identify loan growth as a channel connecting sustainability with bank performance, while Azmi et al. (2021) document a nonlinear relationship between ESG activities and bank performance.
More direct evidence links banks’ ESG characteristics to lending behavior. Abdelsalam et al. (2023) find that stronger ESG performance is associated with less procyclical bank lending, whereas Danisman and Tarazi (2024) show that higher-ESG European banks experience smaller lending contractions during financial crises, with credit risk, profitability, market funding, and deposit pricing among the potential channels. Doan et al. (2026) further demonstrate that the ESG–lending relationship varies across institutional and bank characteristics. Francisco and Couto (2026) similarly show that ESG performance is associated with the composition of loan portfolios among European listed banks, with the relationship varying across loan categories and ESG dimensions. AlHamrani et al. (2025) document heterogeneity in the relationship between ESG disclosure and credit growth. These findings indicate that ESG is relevant to lending, but its association with credit provision may vary across banks and economic environments. Importantly, the evidence is not uniformly supportive of greater lending resilience: Choi and Jeong (2025) find that U.S. banks with higher pre-crisis CSR scores reduced small-business lending more sharply during the Great Recession. ESG-related lending differences should therefore not be assumed to operate uniformly across adverse conditions.
Sustainability considerations also enter credit intermediation through borrower selection, pricing, and contracting. Banks tend to form relationships with borrowers displaying similar ESG profiles (Houston & Shan, 2022), while bank ESG disclosure requirements can generate effects through lending networks (Wang, 2023), and sustainability considerations can be incorporated explicitly into loan contracts (Kim et al., 2025). Borrower-level evidence similarly associates stronger ESG performance with more favorable loan pricing and collateral terms (Liu & Tsui, 2026; Sohel et al., 2026). Although these studies do not directly examine banks’ own ESG performance and aggregate loan growth, they confirm that ESG information enters credit decisions. Evidence of ESG washing, however, cautions against treating observable ESG ratings as frictionless measures of underlying sustainability behavior (K.-J. Huang et al., 2024).
Funding, liquidity, and risk provide additional mechanisms connecting ESG with lending. Stronger ESG performance has been associated with lower bank funding and deposit costs (Andrieș & Sprincean, 2023) and with bank debt-funding conditions (Agnese & Giacomini, 2023). ESG and CSR have also been linked to greater liquidity creation (Zheng et al., 2023; Lee et al., 2024), while recent studies indicate that ESG can modify the relationships between liquidity creation, bank stability, cost efficiency, and funding costs (Gupta & Kashiramka, 2024; Verma & Kashiramka, 2025; Kowibeen et al., 2026). Risk-related evidence is broadly consistent with this mechanism: ESG and environmental engagement have been associated with lower bank risk (Gangi et al., 2019; Di Tommaso & Thornton, 2020; Neitzert & Petras, 2022), while ESG controversies and reputational considerations further highlight the importance of the quality and credibility of sustainability behavior (Galletta & Mazzù, 2023; Murè et al., 2021).
Aggregate ESG scores may nevertheless conceal important differences across environmental, social, and governance dimensions. Prior banking research documents heterogeneous pillar-level relationships with financial performance, funding costs, and lending (Bătae et al., 2021; Nizam et al., 2019; Andrieș & Sprincean, 2023). More directly, Abdelsalam et al. (2023) identify a particularly important environmental component in lending cyclicality, while Danisman and Tarazi (2024) find that the environmental pillar substantially drives their crisis-lending results. Examining the individual pillars alongside aggregate ESG is therefore important for determining whether ESG-related lending patterns reflect a broad sustainability characteristic or particular dimensions of bank behavior.
Overall, the literature establishes plausible links between ESG and bank lending through stakeholder, funding, liquidity, and risk-related channels, while also showing substantial heterogeneity across ESG dimensions and economic environments. Because several of these channels are themselves sensitive to monetary and financial conditions, the ESG–lending relationship may vary with the monetary-policy environment. This possibility connects the ESG literature directly to the bank lending channel of monetary policy.
2.2. Monetary Policy and the Bank Lending Channel
The second foundation of this study is the bank lending channel of monetary-policy transmission. Within the broader credit-channel framework, monetary policy can influence real activity through its effects on financial intermediaries and credit-market conditions (Bernanke & Gertler, 1995). A central implication of the bank lending channel is heterogeneous transmission: changes in monetary conditions need not generate identical lending responses when banks differ in their funding capacity, liquidity, capitalization, or ability to absorb financial shocks.
Seminal evidence supports this heterogeneity. Kashyap and Stein (2000) show that monetary-policy transmission through lending is particularly pronounced among less liquid banks, especially smaller institutions, while Kishan and Opiela (2000) emphasize the roles of size and capitalization. Subsequent research extends this argument to securitization, market funding, and bank business models (Altunbas et al., 2009; Gambacorta & Marqués-Ibáñez, 2011). Using individual loan applications, Jiménez et al. (2012) further show that tighter monetary conditions reduce loan granting more strongly among banks with weaker capital and liquidity positions. Consistent with this evidence, Disyatat (2011) emphasizes balance-sheet strength, risk perceptions, and funding conditions, rather than mechanical reserve constraints, as central components of modern monetary transmission.
The lending channel can also vary across macro-financial and policy regimes. Sovereign risk can modify monetary-policy transmission through banks (Cantero-Saiz et al., 2022), while both conventional and unconventional policies exhibit heterogeneous transmission according to bank characteristics and policy conditions (Albertazzi et al., 2021). Naqvi and Pungaliya (2023) provide particularly relevant evidence of state dependence, showing that the relationship between bank size and monetary-policy sensitivity differs between tight and loose monetary regimes. Thus, the relevance of a particular bank characteristic for lending need not remain constant across monetary states.
Taken together, the abovementioned literature establishes that monetary-policy transmission through bank lending is heterogeneous and depends on characteristics related to funding, liquidity, capitalization, risk, and balance-sheet resilience. Because ESG performance has been associated with several of these same dimensions, sustainability may represent an additional source of heterogeneity in the relationship between monetary conditions and bank lending. This intersection motivates the competing mechanisms developed in the following section.
2.3. ESG and Monetary-Policy Transmission: Competing Mechanisms
Research directly connecting sustainability with monetary-policy transmission remains more limited than the broader ESG-banking and bank lending-channel literature. Most directly, Cantero-Saiz et al. (2023) examine 79 listed OECD banks over 2016–2019 and show that sustainability ratings condition the relationship between monetary-policy changes and bank lending. Related evidence reinforces the relevance of sustainability characteristics under changing monetary conditions. Sun et al. (2024) examine ESG characteristics during the European rising-rate period beginning in 2022, while F. Huang et al. (2025) show that monetary conditions alter the relationship between green credit and bank risk-taking. Wu and Zhang (2025) further link green credit to bank risk through the deposit–loan ratio, and Altavilla et al. (2024) show that monetary tightening affects lending and loan pricing differently according to borrowers’ emissions characteristics and banks’ decarbonization orientation. Although these studies differ in their sustainability measures and outcomes, they collectively motivate examining whether banks’ own ESG performance is associated with lending differently across monetary-policy conditions.
Integrating this evidence with the ESG-lending literature yields two competing mechanisms. Under a resilience mechanism, stronger ESG performance may be associated with more favorable funding conditions, greater liquidity creation, lower risk, and stronger stakeholder relationships, improving banks’ capacity to absorb restrictive monetary conditions. Evidence of ESG-related funding advantages (Andrieș & Sprincean, 2023; Agnese & Giacomini, 2023), greater liquidity creation (Zheng et al., 2023; Lee et al., 2024), smaller crisis-period lending contractions (Danisman & Tarazi, 2024), and lower dependence on monetary-policy decisions (Cantero-Saiz et al., 2023) is broadly consistent with this mechanism. Under this interpretation, the positive ESG–lending association could persist or strengthen as monetary conditions become more restrictive.
An alternative attenuation mechanism predicts that tighter monetary conditions reduce the incremental relevance of ESG-related differences for lending. Higher funding costs, repricing of credit risk, weaker borrower repayment capacity and credit demand, and tighter balance-sheet constraints may increasingly dominate lending decisions, causing ESG to become less differentiating under restrictive conditions. Recent evidence is consistent with this possibility: Islam et al. (2025) show that banks’ environmental engagement is generally associated with lower funding costs, but that periods of rising real interest rates shift investor priorities toward financial returns, suggesting that sustainability-related funding advantages may become less salient under tighter financial conditions. Evidence that higher sustainability-related scores do not invariably protect lending under stress supports this possibility. In particular, Choi and Jeong (2025) find that U.S. banks with higher pre-crisis CSR scores reduced small-business lending more sharply during the Great Recession.
The two mechanisms therefore imply competing predictions: resilience suggests that the ESG-related lending differential should persist or strengthen as monetary conditions tighten, whereas attenuation predicts that this differential should narrow. The competing predictions motivate a non-directional test of monetary-policy moderation.
Against this background, the present study examines banks’ own aggregate ESG performance and subsequent loan growth across observed policy-rate changes over 2016–2025. It further distinguishes tightening from non-tightening conditions and examines the environmental, social, and governance pillars separately. In doing so, the analysis evaluates whether the ESG–loan-growth relationship remains stable across monetary environments or exhibits systematic state dependence.
2.4. Hypothesis Development
The preceding evidence links banks’ ESG performance to lending behavior while also indicating that this relationship can vary across economic environments (Abdelsalam et al., 2023; Danisman & Tarazi, 2024; Doan et al., 2026). Accordingly, we present the following hypothesis:
H1.
Bank ESG performance is positively associated with subsequent bank loan growth.
The bank lending-channel literature further establishes that monetary-policy transmission varies across bank characteristics, while the evidence reviewed above indicates that sustainability may constitute an additional source of this heterogeneity. Because the resilience and attenuation mechanisms imply competing directional predictions, the sign of this moderation is not specified ex ante. Accordingly, we present the following hypothesis:
H2.
Monetary-policy conditions moderate the relationship between bank ESG performance and subsequent bank loan growth.
Finally, aggregate ESG may conceal heterogeneous environmental, social, and governance channels. If monetary-policy moderation reflects a broader ESG-related bank characteristic rather than a mechanism confined to a single sustainability dimension, the conditional relationship should extend across the individual pillars. Accordingly, we present the following hypothesis:
H3.
The moderating role of monetary-policy conditions in the ESG–loan-growth relationship extends across the environmental, social, and governance dimensions of ESG.
These hypotheses guide the empirical analysis, which examines aggregate ESG; its interaction with monetary-policy conditions; tightening versus non-tightening environments; and the environmental, social, and governance pillars.
3. Data and Methodology
3.1. Sample and Data Sources
This study examines the relationship between bank ESG performance, monetary-policy conditions, and loan growth using an annual panel of listed banks in the United States and Europe over 2016–2025. The period spans substantially different monetary and macro-financial conditions, including the pre-pandemic period, the COVID-19 shock, the subsequent low-interest-rate environment, and the sharp post-pandemic monetary tightening. This variation provides a useful setting for examining whether the ESG–loan-growth relationship differs across monetary conditions.
Bank-level financial data; aggregate ESG scores; and environmental, social, and governance pillar scores are obtained from Refinitiv/LSEG. Monetary-policy data are drawn from the central bank policy-rate database of the Bank for International Settlements (BIS). Each bank is matched to the policy rate applicable to its country or monetary area.
The initial balanced panel contains 7400 bank-year observations for 740 listed banks across the sample countries. Table 1 documents the construction of the baseline estimation sample. Requiring current loan-growth data, which in turn requires loan information for consecutive years, reduces the available sample to 2798 bank-year observations for 387 banks; matching monetary-policy data causes no additional loss at this stage. Requiring one-year-lagged ESG information further reduces the sample to 2271 observations for 320 banks. Requiring complete one-year-lagged bank-level controls leaves 2164 observations for 300 banks. Finally, the fixed-effects estimator drops nine singleton observations, yielding the baseline estimation sample of 2155 bank-year observations for 291 banks. The resulting panel is therefore unbalanced.
Table 1.
Sample construction and attrition.
ESG coverage is not random with respect to bank size. In the initial panel, ESG information is available for 2998 of the 7400 bank-year observations. Among bank-year observations for which total assets are observed, the median total assets are approximately USD 11.74 billion when ESG data are available, compared with USD 1.17 billion when ESG data are unavailable; the corresponding mean log total assets (SIZE) are 23.53 and 21.23, respectively. Thus, ESG coverage in the source data is materially greater among larger banks. This pattern should be considered when interpreting the external validity of the results, because the final estimation sample is more representative of banks with available ESG coverage than of the full population of listed banks in the initial panel. The available data do not provide a direct measure of bank visibility, so no separate inference is made regarding visibility beyond the observed size difference.
The dynamic System GMM estimation sample contains 1991 observations for 295 banks. Although the dynamic specification requires additional lagged information and therefore contains fewer bank-year observations than the baseline fixed-effects model, it includes four more banks. This difference reflects estimator-specific sample handling rather than an expansion of the underlying data. Before singleton removal, the complete-case baseline sample contains 2164 observations for 300 banks. The fixed-effects estimator drops nine banks represented by only one usable observation, reducing the baseline sample to 291 banks. Four of these nine banks satisfy the data requirements of the dynamic GMM specification and are retained by the System GMM estimator, resulting in 295 banks. Thus, the difference in the number of banks across estimators is attributable to singleton treatment and the distinct sample requirements of the two estimators.
Table 2 summarizes the definitions, measurement, timing, and data sources of the variables used in the empirical analysis.
Table 2.
Variable definitions and data sources.
3.2. Variable Construction
3.2.1. Bank Loan Growth
The dependent variable is annual bank loan growth (LoanGrowth), calculated as follows:
where Loansi,t denotes the total loans of bank i in year t. The variable measures the proportional annual change in a bank’s total loan portfolio. Because extreme annual changes in bank lending may exert substantial influence on panel estimates, the baseline dependent variable is winsorized at the 1st and 99th percentiles and is denoted LoanGrowth_w. The original non-winsorized LoanGrowth measure is retained as an alternative dependent variable in the robustness analysis.
3.2.2. ESG Performance
The main explanatory variable is the bank’s aggregate ESG score obtained from Refinitiv/LSEG. ESG performance enters the baseline regressions with a one-year lag, such that loan growth in year t is related to ESG performance observed in year t − 1. This timing establishes temporal ordering and reduces concerns about contemporaneous feedback between current lending and current ESG performance. However, lagging ESG does not by itself establish causal identification; accordingly, the baseline estimates are interpreted as conditional associations. The one-year lag is intended to capture the near-term association between ESG performance and subsequent lending while preserving adequate panel coverage. Longer ESG lags may capture slower-moving strategic effects, as changes in sustainability policies, governance practices, stakeholder relationships, and related balance-sheet adjustments may take more than one year to influence lending decisions. At the same time, longer lag structures require additional historical observations and would further reduce the effective estimation sample, particularly given the availability constraints of ESG data. Accordingly, the present analysis focuses on the one-year-lag specification, while longer-horizon ESG effects remain an important extension for future research.
To examine whether the aggregate ESG relationship is concentrated in a particular sustainability dimension, the analysis separately replaces aggregate ESG with the environmental (ENV), social (SOC), and governance (GOV) pillar scores. Each pillar enters the corresponding specification with a one-year lag.
3.2.3. Monetary-Policy Conditions
The baseline monetary-policy measure is the annual change in the relevant central bank policy rate (DeltaPolicyRate), defined as follows:
where c denotes the relevant country or monetary area. DeltaPolicyRate is expressed in percentage points. Positive values indicate increases in the policy rate, whereas negative values indicate reductions.
Two alternative monetary-policy measures are used in the robustness analysis. First, DeltaAvgPolicyRate is defined as follows:
where AvgPolicyRate_c,t denotes the annual average policy rate for country or monetary area c in year t. This alternative measure assesses whether the findings depend on the December-to-December construction of the baseline monetary-policy variable.
Second, a monetary-tightening indicator (Tightening_PR) is defined as follows:
This specification distinguishes observations characterized by rising policy rates from non-tightening observations and permits the ESG–loan-growth relationship to differ across these monetary-policy regimes.
3.2.4. Bank-Level Control Variables
The baseline specifications include bank-level controls capturing size, profitability, capitalization, deposit funding, and liquidity. These characteristics are included to ac-count for differences in banks’ financial condition and balance-sheet structure that may be associated with lending behavior and monetary-policy transmission (Kashyap & Stein, 2000; Kishan & Opiela, 2000; Gambacorta & Marqués-Ibáñez, 2011; Jiménez et al., 2012). SIZE is measured as the natural logarithm of total bank assets. ROA measures return on assets. CapitalRatio is calculated as total capital divided by total assets, while DepositRa-tio is calculated as total deposits divided by total assets. LiquidityBuffer is measured as cash and short-term deposits due from banks divided by total assets.
To reduce the influence of extreme observations, ROA, CapitalRatio, and DepositRa-tio are winsorized at the 1st and 99th percentiles, yielding ROA_w, CapitalRatio_w, and DepositRatio_w, respectively. LiquidityBuffer is not winsorized. All bank-level control variables enter the regressions with a one-year lag, ensuring that the included bank char-acteristics precede the current-year lending outcome.
3.3. Empirical Specification
The empirical analysis begins with fixed-effects models examining the association between lagged ESG performance and subsequent bank loan growth. The principal inter-action specification is as follows:
where LoanGrowth_i,c,t denotes winsorized annual loan growth for bank i in country or monetary area c and year t; ESG_i,t−1 denotes the one-year-lagged ESG score; ΔPolicyRate_c,t is the annual change in the relevant monetary-policy rate; X_i,t−1 is a vector of lagged bank-level controls; αi represents bank fixed effects; λt represents year fixed effects; and ε_i,c,t is the error term.
Bank fixed effects control for time-invariant heterogeneity across banks, while year fixed effects absorb common time-specific shocks. In the baseline specification, standard errors are clustered at the bank level, allowing for heteroskedasticity and within-bank serial correlation.
In the interacted specification, β1 captures the conditional association between lagged ESG performance and subsequent loan growth when DeltaPolicyRate equals zero. The coefficient β2 captures the conditional association between the policy-rate change and loan growth when ESG equals zero. Because an ESG score of zero has limited economic relevance for most observations in the sample, the standalone economic interpretation of β2 is correspondingly limited.
The principal coefficient of interest is β3, which indicates whether the ESG–loan-growth association varies with monetary-policy conditions. Equivalently, the interaction captures whether the relationship between policy-rate changes and loan growth differs according to banks’ prior ESG performance. Because the interaction coefficient alone does not fully characterize the economic relationship, the regression analysis is complemented by marginal-effects analysis. The marginal association between ESG performance and loan growth at a given policy-rate change is as follows:
These marginal effects are evaluated across policy-rate changes to assess how the estimated ESG–loan-growth relationship varies with monetary-policy conditions.
3.4. ESG Pillar Analysis
To determine whether the aggregate ESG pattern extends across different sustainability dimensions, the baseline interaction specification is re-estimated separately using the environmental, social, and governance pillar scores.
For P ∈ {ENV, SOC, GOV}, the corresponding specification is as follows:
Estimating the three pillars separately avoids imposing the assumption that environmental, social, and governance performance have identical relationships with bank lending. The analysis therefore examines whether the moderating pattern is present across the three ESG dimensions. Differences in coefficient magnitudes across the pillar specifications are not interpreted as evidence that one pillar is statistically stronger than another in the absence of formal coefficient-equality tests.
3.5. Robustness, Dynamic Specifications, and Monetary-Area-Time Dependence
Several additional specifications assess whether the baseline findings are sensitive to alternative variable construction, monetary-policy measurement, lending dynamics, estimator choice, and monetary-policy regimes.
First, the baseline interaction model is re-estimated using the original non-winsorized LoanGrowth measure. This test examines whether the results are driven by the treatment of extreme loan-growth observations.
Second, DeltaPolicyRate is replaced by DeltaAvgPolicyRate, based on changes in annual average policy rates. This specification examines whether the estimated interaction is sensitive to the December-to-December construction of the baseline monetary-policy variable.
Third, a dynamic fixed-effects specification introduces lagged loan growth:
The lagged dependent variable captures persistence and adjustment dynamics in bank lending. Because including a lagged dependent variable in a fixed-effects panel can introduce dynamic-panel bias, this specification is treated as a robustness exercise rather than as the primary estimator.
Fourth, the analysis estimates a dynamic specification using two-step System GMM. The model includes the first lag of loan growth and uses collapsed GMM-style instruments for lagged loan growth, lagged ESG, and the ESG–monetary-policy interaction, with lags 2–3. The contemporaneous monetary-policy variable, lagged bank-level controls, and year indicators enter as standard instruments. Robust finite-sample-corrected standard errors are reported. Instrument proliferation is limited by collapsing the instrument matrix, resulting in 23 instruments for 295 banks.
The validity of the System GMM specification is assessed using the Arellano–Bond tests for first- and second-order serial correlation and the Hansen test of overidentifying restrictions. In particular, the absence of statistically significant second-order serial correlation is relevant to the validity of the lag-based instruments. System GMM is employed as a robustness procedure and is not interpreted as eliminating all potential sources of endogeneity. Accordingly, the empirical evidence throughout this study is framed primarily in terms of conditional associations rather than causal effects.
Fifth, the continuous policy-rate specification is complemented by the Tightening_PR indicator:
In this specification, β1 captures the ESG–loan-growth association during non-tightening observations, whereas the corresponding association during monetary-tightening observations is as follows:
Marginal effects are therefore evaluated separately for tightening and non-tightening observations.
Sixth, an additional sensitivity test replaces the contemporaneous policy-rate change with its one-year lag and interacts the lagged policy-rate change with lagged ESG performance. This specification examines whether the moderating pattern persists when monetary-policy changes are allowed additional time to be reflected in bank lending.
Finally, given the cross-country structure of the sample and the fact that several sample countries share a common monetary authority, additional specifications address potential dependence and unobserved heterogeneity at the monetary-area-year level. First, standard errors are two-way clustered by bank and monetary-area-year. Second, monetary-area-specific linear time trends are included to account for differential trends across monetary-policy areas. Third, a more stringent specification absorbs monetary-area-by-year fixed effects, thereby controlling for observed and unobserved shocks common to banks operating under the same monetary-policy regime in a given year. In this specification, the main effect of the policy-rate change is absorbed because monetary policy varies at the monetary-area-year level.
In this specification, monetary-area-by-year fixed effects absorb all observed and unobserved factors common to banks within a given monetary area and year, including the monetary-area-year policy-rate change itself. Consequently, the main effect of the policy-rate change cannot be separately estimated, while the ESG–policy-rate interaction remains identifiable through cross-bank variation in ESG within monetary-area-years. Given the substantially more demanding source of variation imposed by this specification, it is treated as a stringent sensitivity test rather than as the baseline model.
Taken together, these analyses assess the sensitivity of the baseline findings to the treatment of extreme observations, alternative definitions, and timing of monetary-policy conditions, lending dynamics, alternative estimators, clustering structures, heterogeneous monetary-area trends, and more demanding controls for monetary-area-specific time-varying shocks.
4. Empirical Results
This section presents the empirical findings on the relationship between ESG performance, monetary-policy conditions, and bank loan growth. The analysis proceeds in several stages. It first examines the descriptive characteristics and pairwise correlations of the variables used in the main estimation sample. It then reports the baseline fixed-effects estimates and uses marginal effects to provide a more direct interpretation of whether the relationship between ESG performance and bank lending varies with changes in monetary policy. The analysis subsequently examines the individual environmental, social, and governance pillars and assesses the robustness of the main findings using alternative variable definitions, estimation approaches, and treatments of monetary-area-time dependence.
4.1. Descriptive Statistics
Table 3 reports descriptive statistics for the variables included in the main estimation sample. To ensure comparability with the baseline analysis, the statistics are calculated using the same 2155 bank-year observations employed in the baseline regressions. Bank-level explanatory variables are measured with a one-year lag.
Table 3.
Descriptive statistics results.
Winsorized bank loan growth averages 0.0767, with a standard deviation of 0.1602 and values ranging from −0.5956 to 0.8236, indicating substantial variation in lending dynamics across bank-year observations. ESG performance also exhibits considerable heterogeneity: the average ESG score is 41.92, with a standard deviation of 17.31 and values ranging from 2.97 to 91.71.
Monetary-policy conditions likewise vary considerably over the sample period. The annual policy-rate change averages 0.3225 percentage points, with values ranging from −5.00 to 10.60 percentage points. The presence of both negative and positive policy-rate changes provides variation in monetary conditions that is relevant for examining whether the ESG–loan-growth relationship differs across policy environments. The remaining bank-level characteristics size, profitability, capitalization, deposit funding, and liquidity also display substantial cross-sectional and time-series variation within the estimation sample.
Overall, the descriptive statistics document meaningful variation in the variables used in the subsequent panel regressions.
4.2. Correlation Analysis
To provide an initial assessment of the relationships among the variables and to examine potential multicollinearity concerns, Table 4 reports pairwise Pearson correlation coefficients for the variables included in the main estimation sample.
Table 4.
Correlation matrix.
The pairwise correlations are generally moderate. Loan growth is negatively correlated with ESG (−0.062) and bank size (−0.131), while it is positively correlated with policy-rate changes (0.073) and profitability (0.133). These unconditional correlations provide only preliminary evidence and should not be interpreted as reflecting the conditional relationships obtained after controlling for bank-specific heterogeneity and other covariates in the multivariate regressions.
Among the explanatory variables, ESG is positively correlated with bank size (0.627) and negatively correlated with the deposit ratio (−0.333). Bank size is also negatively correlated with the deposit ratio (−0.602). The largest absolute pairwise correlation is observed between the capital ratio and the deposit ratio (−0.785), indicating a relatively strong inverse association between these two balance-sheet characteristics. Pairwise correlations alone, however, are insufficient to establish problematic multicollinearity.
Variance inflation factor diagnostics provide additional evidence on this issue. The maximum VIF is 4.68, and the mean VIF is 2.26. Taken together, the correlation matrix and VIF diagnostics do not indicate severe multicollinearity among the explanatory variables used in the baseline analysis.
4.3. ESG, Monetary Policy, and Bank Loan Growth
Table 5 reports the baseline fixed-effects estimates of the relationship between ESG performance and bank loan growth and examines whether this relationship varies with monetary-policy conditions. All specifications include bank and year fixed effects, and standard errors are clustered at the bank level. The models are estimated sequentially to assess the stability of the ESG coefficient as bank-level controls and the ESG–monetary-policy interaction are introduced.
Table 5.
Fixed-effects estimates of ESG and bank loan growth.
The results show a positive and statistically significant conditional association between lagged ESG performance and subsequent bank loan growth. In Column (1), the coefficient on lagged ESG is 0.0014 and statistically significant at the 1% level. The coefficient increases to 0.0017 after bank size and profitability are introduced in Column (2) and remains approximately 0.0017 after capitalization, deposit funding, and liquidity are added in Column (3). The within R-squared increases from 0.010 in Column (1) to 0.082 in Column (3), indicating that the additional bank-level covariates improve the explanatory power of the within-bank specification.
Column (4) introduces the interaction between lagged ESG and the annual change in the policy rate. The interaction coefficient is negative and statistically significant at the 1% level (β = −0.0006, p < 0.001), indicating that the ESG–loan-growth association varies systematically with monetary-policy conditions. Specifically, the marginal association between ESG and loan growth is as follows:
Given the estimated coefficients in Column (4), this relationship can be written as:
Thus, the positive conditional association between ESG and loan growth becomes weaker as the policy-rate change increases. Conversely, lower or negative policy-rate changes are associated with a stronger positive ESG–loan-growth relationship.
In economic terms, the estimates are also meaningful. When the policy-rate change is zero, a 10-point increase in the ESG score is associated with approximately a 2.06-percentage-point increase in annual loan growth. A one-percentage-point increase in the policy rate reduces this ESG-related loan-growth differential by approximately 0.62 percentage points. Thus, the estimated interaction is economically relevant in addition to being statistically significant.
Importantly, once the interaction is included, the constituent coefficients should not be interpreted as unconditional average effects. The ESG coefficient of 0.0021 represents its estimated association with loan growth when the policy-rate change equals zero. Similarly, the policy-rate coefficient of 0.0448 represents the estimated association between policy-rate changes and loan growth when ESG equals zero. Because an ESG score of zero has limited economic relevance for most observations in the sample, the standalone interpretation of the policy-rate coefficient is limited. The interaction term and the corresponding marginal effects therefore provide the more informative interpretation of the conditional relationship between ESG, monetary policy, and bank lending.
Regarding the bank-level controls, bank size is negative and statistically significant at the 1% level throughout the specifications in which it is included. Profitability is positively and statistically significantly associated with loan growth in Columns (2) and (3), but it becomes statistically insignificant in the fully interacted specification in Column (4). Capitalization, deposit funding, and liquidity are statistically insignificant in Columns (3) and (4).
Overall, Table 5 provides evidence of a positive conditional association between lagged ESG performance and subsequent bank loan growth, together with a negative ESG–monetary-policy interaction. The results indicate that the ESG–loan-growth relationship is weaker when policy-rate changes are higher.
4.4. Marginal Effects of ESG Across Monetary-Policy Conditions
To facilitate the economic interpretation of the interaction term, Figure 1 reports the estimated marginal association between ESG performance and bank loan growth across different annual policy-rate changes, together with 95% confidence intervals. The marginal effects are derived from the fully specified fixed-effects model reported in Column (4) of Table 5.
Figure 1.
Marginal effect of ESG on bank loan growth across policy-rate changes. Notes: The figure reports the marginal effect of ESG performance on bank loan growth across annual policy-rate changes, derived from Column (4) of Table 5. The shaded area represents 95% confidence intervals. The lower panel shows the distribution of policy-rate changes in the estimation sample and indicates that observations are concentrated within a substantially narrower range than the full observed minimum and maximum. The underlying specification includes bank and year fixed effects, lagged bank-level controls, and standard errors clustered at the bank level.
Although the policy-rate change ranges from −5.0 to 10.6 percentage points in the estimation sample, observations are highly concentrated within a narrower interval. Specifically, 2125 of the 2155 observations (98.61%) lie between −1.5 and 4.25 percentage points, corresponding to the 1st and 99th percentiles of the policy-rate-change distribution. Only 30 observations (1.39%) lie outside this interval. The distribution markers in Figure 1 therefore provide an indication of the empirical support underlying the marginal-effect estimates across different monetary-policy conditions.
The results show that the positive association between ESG performance and subsequent loan growth weakens progressively as policy-rate changes increase. When the policy rate is unchanged, the marginal effect of ESG is 0.0021 and is statistically significant (p < 0.001). The estimated effect remains positive and statistically significant for a one-percentage-point increase in the policy rate (0.0014, p = 0.003), but it declines further and becomes statistically insignificant at an increase of approximately two percentage points (0.0008, p = 0.115). At larger policy-rate increases, the point estimate approaches zero and eventually becomes negative; however, these estimates are not statistically significant. Overall, Figure 1 provides a direct interpretation of the negative interaction reported in Table 5: the positive ESG–loan-growth association is strongest under relatively accommodative or stable monetary-policy conditions and becomes progressively weaker as monetary policy tightens.
4.5. ESG Pillars and Monetary Policy
Table 6 examines whether the baseline results differ across the environmental, social, and governance pillars of ESG performance. Each pillar is entered separately and lagged by one year, while retaining the same bank-level controls, bank fixed effects, year fixed effects, and bank-clustered standard errors used in the baseline specification.
Table 6.
ESG pillars, monetary policy, and bank loan growth.
The results show that, when the policy-rate change equals zero, all three ESG pillars have positive conditional associations with bank loan growth. The coefficient on the environmental pillar is positive and statistically significant at the 5% level (0.0007, p = 0.046), while the coefficients on the social (0.0014, p = 0.001) and governance (0.0009, p = 0.006) pillars are positive and statistically significant at the 1% level. These estimates indicate that the positive conditional ESG–loan-growth association at a zero policy-rate change is not attributable to a single ESG dimension.
More importantly, the interaction between each ESG pillar and the annual policy-rate change is negative and statistically significant. The interaction coefficient is −0.0004 for the environmental pillar (p < 0.001), −0.0005 for the social pillar (p < 0.001), and −0.0002 for the governance pillar (p = 0.020). Thus, across all three dimensions, the positive association between ESG performance and loan growth becomes weaker as policy rates increase. Conversely, the estimated association is stronger when policy-rate changes are lower or more negative.
Taken together, the pillar-level results reinforce the baseline interaction finding across the environmental, social, and governance dimensions of ESG performance. At the same time, differences in the magnitudes of the pillar coefficients should be interpreted cautiously, as the separate specifications do not constitute formal tests of whether the coefficients differ statistically across ESG pillars.
4.6. Robustness Checks
Table 7 reports a series of robustness tests designed to assess whether the baseline findings are sensitive to alternative variable definitions and estimation approaches. Across the specifications, the negative ESG–monetary-policy interaction remains statistically significant, although its magnitude and statistical strength vary across models.
Table 7.
Robustness checks results.
First, Column (1) replaces the winsorized dependent variable with raw loan growth. The coefficient on lagged ESG remains positive and statistically significant (0.0031, p < 0.001), while the interaction between ESG and the policy-rate change remains negative and significant (−0.0011, p = 0.026). Column (2) replaces the December-to-December policy-rate change with the change in the annual average policy rate. The ESG coefficient remains positive (0.0022, p < 0.001), and the interaction remains negative and highly significant (−0.0007, p < 0.001). These results indicate that the baseline interaction is not driven by the winsorization of loan growth or by the specific measurement of monetary-policy changes.
An additional consideration in interpreting the alternative monetary-policy specification is the growing importance of geopolitical shocks during the sample period. Geopolitical risk can affect economic activity, risk perceptions, funding conditions, and bank lending, while recent evidence also indicates that geopolitical tensions can interact with the transmission of monetary policy through bank credit (Caldara & Iacoviello, 2022; Pradhan et al., 2025). The year fixed effects included throughout the analysis absorb common time-specific shocks, and the monetary-area-by-year specification reported in Section 4.8 provides a more stringent control for shocks shared by banks operating within the same monetary-policy environment. These controls reduce the risk that broad common disturbances are attributed to monetary-policy variation, but they do not separately identify banks’ heterogeneous exposure to geopolitical events. The robustness results should therefore be interpreted as accounting for common time and monetary-area-time conditions rather than as isolating an independent geopolitical-risk channel.
Column (3) replaces the contemporaneous policy-rate change with its one-year lag. Lagged ESG remains positive and statistically significant (0.0020, p < 0.001), while the lagged policy-rate change is positive but only marginally significant (0.0166, p = 0.059). Importantly, the interaction between lagged ESG and the lagged policy-rate change remains negative and statistically significant (−0.0004, p < 0.001). This result indicates that the moderating pattern persists when monetary-policy changes are allowed additional time to be reflected in bank lending.
Column (4) introduces lagged loan growth to account for persistence in bank lending. The lagged dependent variable is negative and statistically significant (−0.2571, p < 0.001). More importantly, lagged ESG remains positively associated with loan growth (0.0020, p < 0.001), while its interaction with the policy-rate change remains negative and significant (−0.0006, p < 0.001).
Column (5) estimates the dynamic specification using two-step System GMM. The ESG coefficient remains positive and significant (0.0046, p = 0.008), whereas the ESG–policy-rate interaction remains negative and significant (−0.0014, p = 0.031). The specification uses 23 instruments for 295 banks. The Arellano–Bond test indicates first-order serial correlation (AR(1), p = 0.009), while the null of no second-order serial correlation is not rejected (AR(2), p = 0.427), which is consistent with a key requirement for the validity of the lag-based moment conditions. The Hansen test of overidentifying restrictions yields p = 0.094, while the Difference-in-Hansen test yields p = 0.057. Although neither test rejects its respective null at the conventional 5% level, the Difference-in-Hansen result is close to that threshold and therefore provides only limited reassurance regarding the additional instrument conditions. Moreover, the two-step estimation produces a singular covariance matrix of moments, which further limits the reliability of the specification tests. For these reasons, the System GMM estimates are interpreted cautiously and are used only as a supplementary robustness check; they are not taken as establishing causal identification.
Finally, Column (6) distinguishes between tightening and non-tightening monetary-policy environments. The interaction between lagged ESG and the tightening indicator is negative and statistically significant (−0.0025, p < 0.001). The corresponding marginal-effect estimates show that the association between ESG and loan growth is positive and significant during non-tightening periods (0.0028, p < 0.001), but becomes small and statistically insignificant during tightening periods (0.0003, p = 0.576). Thus, the results do not indicate that ESG is associated with lower loan growth during tightening episodes; rather, the positive ESG–loan-growth association observed outside tightening periods largely disappears when monetary policy tightens.
As an additional robustness check, the baseline fixed-effects specification is re-estimated after excluding observations below the 1st percentile or above the 99th percentile of the policy-rate-change distribution (−1.5 and 4.25 percentage points, respectively). This restriction removes only 30 observations (1.39% of the baseline sample), leaving 2125 observations for 290 banks. The ESG–policy-rate interaction remains negative and statistically significant (β = −0.0005, p = 0.002). Thus, the baseline moderating relationship is not driven by the small number of observations associated with unusually large annual policy-rate changes.
Overall, the robustness tests support the finding that the estimated ESG–loan-growth relationship is sensitive to monetary-policy conditions across several alternative specifications. At the same time, these estimates should continue to be interpreted as conditional associations rather than causal effects.
4.7. Regional Heterogeneity
To examine whether the moderating role of monetary policy differs across regions, the baseline fixed-effects specification is re-estimated separately for U.S. and European banks and, within the European subsample, for euro-area and non-euro-area banks. The U.S. subsample contains 1579 bank-year observations for 215 banks, whereas the European subsample contains 576 observations for 76 banks. Within Europe, the euro-area and non-euro-area subsamples contain 268 observations for 33 banks and 308 observations for 43 banks, respectively. Table 8 reports the regional subgroup estimates and the corresponding coefficient-difference tests.
Table 8.
Regional heterogeneity in the ESG–monetary-policy interaction.
The subgroup estimates indicate that the ESG–policy-rate interaction is negative across all regional subsamples; however, its magnitude and statistical significance vary. The interaction is −0.000057 (p = 0.741) for U.S. banks and −0.000743 (p = 0.056) for European banks. Within Europe, the corresponding estimates are −0.000629 (p = 0.436) for euro-area banks and −0.000621 (p = 0.096) for non-euro-area banks. Differences in statistical significance across separate subgroup regressions, however, do not by themselves establish statistically significant regional heterogeneity. Formal pooled tests confirm that the difference in the ESG–policy-rate interaction between U.S. and European banks is not statistically significant (p = 0.184). Similarly, the interaction does not differ significantly between euro-area and non-euro-area European banks (p = 0.957).
Overall, the regional analysis does not provide sufficient statistical evidence that the moderating effect of monetary policy on the ESG–loan-growth relationship differs systematically across these regional groupings. These findings should nevertheless be interpreted cautiously because the estimation sample is concentrated in U.S. banks, while the European subsamples particularly the euro-area subsample are considerably smaller. Consequently, the absence of statistically significant cross-region differences should not be interpreted as evidence of regional equivalence. Future research using larger and more balanced regional samples could provide a more powerful assessment of geographic heterogeneity.
4.8. Additional Robustness to Monetary-Area-Time Dependence
Table 9 examines whether the baseline results are robust to alternative treatments of dependence and unobserved heterogeneity at the monetary-area-year level. This distinction is important because several countries in the sample share a common monetary authority and therefore face the same policy-rate path. The specifications progressively account for common monetary-area-year shocks through two-way clustering, monetary-area-specific linear trends, and monetary-area-by-year fixed effects.
Table 9.
Robustness to monetary-area-time dependence.
Column (1) retains bank and year fixed effects while allowing standard errors to be two-way clustered by bank and monetary-area-year. The ESG coefficient remains positive and statistically significant (0.0021, p < 0.001), while the interaction between ESG and the policy-rate change remains negative and statistically significant (−0.0006, p = 0.011). Thus, the baseline moderating pattern remains statistically significant when inference accounts for common shocks within monetary-area-years.
Column (2) additionally includes monetary-area-specific linear time trends to account for differential trends across monetary-policy areas. The ESG coefficient remains positive and statistically significant (0.0020, p < 0.001), while the ESG–policy-rate interaction remains negative and statistically significant (−0.0006, p = 0.012). The moderating pattern therefore remains robust after allowing monetary-policy areas to follow distinct linear trends over time.
Column (3) provides the most stringent specification by absorbing monetary-area-by-year fixed effects. Under this specification, the main effect of the policy-rate change is absorbed, while the ESG coefficient remains positive and statistically significant (0.0019, p < 0.001). However, the ESG–policy-rate interaction becomes substantially smaller and statistically insignificant (−0.0001, p = 0.417). Thus, although the interaction is robust to alternative clustering and monetary-area-specific trends, it does not survive the more demanding monetary-area-by-year fixed-effects specification. This result indicates that the baseline moderating relationship is sensitive to the absorption of common time-varying shocks at the monetary-area level and should therefore be interpreted cautiously.
Overall, Table 9 provides qualified support for the baseline findings. The negative ESG–policy-rate interaction remains statistically significant under two-way clustering and monetary-area-specific linear trends, but it becomes substantially smaller and statistically insignificant when monetary-area-by-year fixed effects are absorbed. Because this stringent specification absorbs common observed and unobserved shocks within each monetary area and year, including the policy-rate variation itself, the result indicates that the baseline interaction is sensitive to comprehensive controls for monetary-area-time conditions. Accordingly, the findings are interpreted as evidence of a conditional association between ESG performance and bank lending across monetary-policy environments rather than as identifying a causal effect of monetary policy.
5. Discussion
The empirical findings reveal a systematic but conditional relationship between ESG performance, monetary-policy conditions, and bank lending. The central result is not simply that ESG performance is positively associated with subsequent loan growth. Rather, the strength of this association varies with the monetary-policy environment. The baseline estimates indicate that the positive ESG–loan-growth relationship becomes progressively weaker as policy-rate changes increase.
This finding is relevant to competing interpretations of ESG in banking. One possible mechanism is that stronger ESG performance may be associated with characteristics such as stronger stakeholder relationships, reputation, governance practices, or more stable funding conditions, which could support lending when financial conditions deteriorate. If these characteristics translated into greater resilience to monetary tightening, the positive ESG–lending association might be expected to persist or strengthen as policy becomes more restrictive. The baseline evidence does not support such a pattern. Instead, the negative interaction indicates that the estimated lending differential associated with ESG diminishes as policy rates increase.
A plausible interpretation is that tighter monetary conditions alter the constraints and incentives governing bank lending. Higher interest rates can affect funding costs, credit demand, borrower repayment capacity, and perceptions of credit risk. Under these conditions, lending decisions may become increasingly shaped by conventional balance-sheet constraints and credit-risk considerations, reducing the extent to which ESG-related differences across banks are reflected in lending growth. The marginal-effects analysis is consistent with this interpretation: the positive association between ESG performance and loan growth becomes progressively weaker as policy-rate changes increase and is no longer statistically distinguishable from zero under sufficiently large rate increases.
The tightening-regime analysis provides complementary evidence. The association between ESG and loan growth is positive and statistically significant during non-tightening periods but becomes small and statistically insignificant during tightening episodes. Importantly, this result does not imply that higher ESG performance is associated with lower lending during monetary tightening. Rather, it indicates that the positive lending differential associated with ESG outside tightening periods largely disappears when monetary policy tightens. The evidence therefore points to a state-dependent ESG–lending relationship rather than a uniformly positive or negative effect across monetary regimes.
The pillar-level analysis further shows that this conditional relationship is not confined to a single dimension of ESG performance. Environmental, social, and governance scores each have positive conditional associations with loan growth when the policy-rate change equals zero, while their interactions with policy-rate changes are negative and statistically significant. Although the estimated magnitudes differ across pillars, these differences should not be interpreted as evidence that one pillar is statistically more important than another because formal cross-equation equality tests are not conducted. The common direction of the interaction coefficients nevertheless indicates that the baseline moderation pattern extends across the three ESG dimensions.
The robustness analysis provides further, but qualified, support for the main finding. The negative ESG–policy interaction remains statistically significant when raw rather than winsorized loan growth is used, when monetary policy is measured using changes in the annual average policy rate, and when the policy-rate change is lagged by one year. The interaction also remains significant in the dynamic fixed-effects and System GMM specifications. In addition, the result survives two-way clustering by bank and monetary-area-year and the inclusion of monetary-area-specific linear trends. However, the interaction becomes small and statistically insignificant once monetary-area-by-year fixed effects are absorbed. Because this stringent specification controls for observed and unobserved shocks common to banks operating under the same monetary-policy regime in a given year, the loss of significance places an important qualification on the robustness of the baseline moderation result. The evidence should therefore be interpreted as a conditional association rather than as a causal effect.
Taken together, the findings do not support an unconditional interpretation of ESG as a source of lending resilience during monetary tightening. Instead, they suggest that higher ESG performance is positively associated with bank loan growth, while the strength of this association varies with monetary-policy conditions. The estimated interaction is economically meaningful in the baseline specification, but its sensitivity to monetary-area-by-year fixed effects cautions against interpreting the relationship as structurally invariant or causal. The central implication is therefore one of conditionality: understanding the relationship between ESG performance and bank lending requires explicit consideration of the monetary environment and common time-varying shocks within monetary-policy areas.
6. Conclusions
This study examines whether the relationship between bank ESG performance and loan growth depends on monetary-policy conditions. Using an annual panel of listed U.S. and European banks over 2016–2025, the analysis shows that higher ESG performance is positively associated with subsequent loan growth, but that this association weakens as policy-rate changes increase. Consistently, the positive ESG–loan-growth association observed during non-tightening periods becomes economically small and statistically insignificant during monetary tightening. The negative moderating pattern also extends across the environmental, social, and governance pillars.
The main finding remains significant across several robustness checks, including alternative monetary-policy measures and timing, dynamic specifications, two-way clustering by bank and monetary-area-year, and monetary-area-specific linear trends. However, the ESG–policy interaction becomes substantially smaller and statistically insignificant when monetary-area-by-year fixed effects are absorbed. The evidence should therefore be interpreted as a conditional association rather than a causal effect. Overall, this study identifies monetary-policy conditions as an important boundary condition in the ESG–bank-lending relationship and cautions against assuming that the positive lending differential associated with ESG remains constant across monetary environments.
The findings have practical implications for distinct stakeholder groups. For regulators and bank supervisors, ESG indicators may be most informative when assessed jointly with conventional measures of capitalization, liquidity, funding conditions, and credit risk rather than treated as stand-alone indicators of lending resilience. Supervisory assessments and stress-testing frameworks could therefore consider how ESG-related characteristics interact with changing monetary conditions, while the sensitivity of the estimates to monetary-area-time controls cautions against assigning ESG scores a causal or mechanically predictive role in prudential assessment.
For banks, the findings support a scenario-based approach in which ESG information is evaluated jointly with conventional indicators of lending capacity. Under non-tightening conditions, banks may consider aggregate ESG performance and its environmental, social, and governance dimensions alongside capital, liquidity, funding capacity, borrower conditions, and credit demand when evaluating planned lending. As monetary conditions tighten, planned loan growth may be reassessed against higher funding costs, changing borrower creditworthiness, and available liquidity and capital buffers. Under tightening conditions, when the positive ESG-related lending differential becomes economically small and statistically insignificant, lending plans may be stress-tested against more restrictive funding and balance-sheet conditions rather than relying on ESG performance alone. Comparing projected lending needs with available internal funding, liquidity, and capital capacity may also inform whether additional funding or capital resources warrant consideration. This framework is intended as a decision-support approach rather than a mechanical rule, because the estimates do not establish causal thresholds for lending or funding decisions.
For potential investors and creditors, banks’ ESG performance should similarly be interpreted jointly with prevailing monetary and balance-sheet conditions. A relatively strong ESG profile may be associated with higher loan growth in some monetary environments, but this relationship is not invariant across policy regimes. ESG information may therefore be considered alongside capitalization, liquidity, funding structure, profitability, and exposure to monetary tightening when assessing banks’ lending prospects and financial resilience. The evidence across the environmental, social, and governance pillars further suggests that such an assessment should not be confined to a single ESG dimension.
Several limitations define directions for future research. Although bank fixed effects, alternative specifications, and System GMM address several empirical concerns, the analysis does not establish causal effects. Future studies could exploit exogenous monetary-policy shocks or alternative identification strategies; examine longer ESG lags to capture potentially slower-moving strategic effects; consider more granular ESG measures and loan categories; and incorporate country- or bank-specific measures of geopolitical exposure to assess whether geopolitical shocks further condition the ESG–monetary-policy–lending relationship. Overall, the findings suggest that the relationship between ESG performance and bank lending should be evaluated jointly with the monetary and monetary-area-time environment rather than interpreted as uniformly strengthening or weakening bank lending.
Author Contributions
Conceptualization, M.A.-D.; data curation, M.A.-D.; formal analysis, M.A.-D. and W.A.; investigation, M.A.-D. and W.A.; methodology, M.A.-D. and W.A.; project administration, M.A.-D.; resources, M.A.-D. and W.A.; software, M.A.-D. and W.A.; supervision, M.A.-D.; validation, M.A.-D. and W.A.; visualization, M.A.-D. and W.A.; writing—original draft, M.A.-D. and W.A.; writing—review and editing, M.A.-D. and W.A. All authors have read and agreed to the published version of the manuscript.
Funding
This research received no external funding.
Institutional Review Board Statement
Not applicable.
Informed Consent Statement
Not applicable.
Data Availability Statement
Restrictions apply to the availability of these data. Financial data were obtained from Refinitiv Eikon under a commercial license and are subject to licensing restrictions. Macroeconomic data were obtained from the Bank for International Settlements (BIS) database, which is publicly available. The processed data supporting the findings of this study are available from the corresponding author upon reasonable request, subject to the licensing terms of the data provider.
Acknowledgments
The authors thank the editor and the anonymous reviewers for their valuable comments and constructive suggestions, which helped improve the quality of the manuscript.
Conflicts of Interest
The authors declare no conflicts of interest.
References
- Abdelsalam, O., Azmi, W., Disli, M., & Kowsalya, V. (2023). Bank lending cyclicality and ESG activities: Global evidence. Finance Research Letters, 58, 104541. [Google Scholar] [CrossRef] [Scilit]
- Agnese, P., & Giacomini, E. (2023). Bank’s funding costs: Do ESG factors really matter? Finance Research Letters, 51, 103437. [Google Scholar] [CrossRef] [Scilit]
- Albertazzi, U., Nobili, A., & Signoretti, F. M. (2021). The bank lending channel of conventional and unconventional monetary policy. Journal of Money, Credit and Banking, 53(2–3), 261–299. [Google Scholar] [CrossRef] [Scilit]
- AlHamrani, A. R., Awad, A., & Albaity, M. (2025). Unveiling the impact of ESG disclosure on bank credit growth: A new perspective. Economic Research-Ekonomska Istraživanja, 38(1), 269–309. [Google Scholar] [CrossRef] [Scilit]
- Altavilla, C., Boucinha, M., Pagano, M., & Polo, A. (2024). Climate risk, bank lending and monetary policy (ECB Working Paper No. 2969). European Central Bank. [Google Scholar]
- Altunbas, Y., Gambacorta, L., & Marqués-Ibáñez, D. (2009). Securitisation and the bank lending channel. European Economic Review, 53(8), 996–1009. [Google Scholar] [CrossRef] [Scilit]
- Andrieș, A. M., & Sprincean, N. (2023). ESG performance and banks’ funding costs. Finance Research Letters, 54, 103811. [Google Scholar] [CrossRef] [Scilit]
- Azmi, W., Hassan, M. K., Houston, R., & Karim, M. S. (2021). ESG activities and banking performance: International evidence from emerging economies. Journal of International Financial Markets, Institutions and Money, 70, 101277. [Google Scholar] [CrossRef] [Scilit]
- Bătae, O. M., Dragomir, V. D., & Feleagă, L. (2021). The relationship between environmental, social, and financial performance in the banking sector: A European study. Journal of Cleaner Production, 290, 125791. [Google Scholar] [CrossRef] [Scilit]
- Bernanke, B. S., & Gertler, M. (1995). Inside the black box: The credit channel of monetary policy transmission. Journal of Economic Perspectives, 9(4), 27–48. [Google Scholar] [CrossRef] [Scilit]
- Caldara, D., & Iacoviello, M. (2022). Measuring geopolitical risk. American Economic Review, 112(4), 1194–1225. [Google Scholar] [CrossRef] [Scilit]
- Cantero-Saiz, M., Sanfilippo-Azofra, S., & Torre-Olmo, B. (2022). Sovereign risk and the bank lending channel: Differences across countries and the effects of the financial crisis. Journal of Money, Credit and Banking, 54(1), 285–312. [Google Scholar] [CrossRef] [Scilit]
- Cantero-Saiz, M., Torre-Olmo, B., & Sanfilippo-Azofra, S. (2023). Sustainable banking, financial strength and the bank lending channel of monetary policy. E&M Economics and Management, 26(1), 165–185. [Google Scholar] [CrossRef] [Scilit]
- Choi, D. B., & Jeong, S. (2025). CSR scores versus actual impacts: Banks’ main street lending during the Great Recession. Journal of Banking & Finance, 172, 107380. [Google Scholar] [CrossRef] [Scilit]
- Danisman, G. O., & Tarazi, A. (2024). ESG activity and bank lending during financial crises. Journal of Financial Stability, 70, 101206. [Google Scholar] [CrossRef] [Scilit]
- Disyatat, P. (2011). The bank lending channel revisited. Journal of Money, Credit and Banking, 43(4), 711–734. [Google Scholar] [CrossRef] [Scilit]
- Di Tommaso, C., & Thornton, J. (2020). Do ESG scores effect bank risk taking and value? Evidence from European banks. Corporate Social Responsibility and Environmental Management, 27(5), 2286–2298. [Google Scholar] [CrossRef] [Scilit]
- Doan, A.-T., Le, A.-T., & Nguyen, H. (2026). ESG performance, bank lending, and the COVID-19 pandemic: International evidence. China Finance Review International, 16(1), 284–326. [Google Scholar] [CrossRef] [Scilit]
- Francisco, P. M., & Couto, E. (2026). ESG variations across banking loan types: Evidence from European listed banks. Economic Notes, 55, e70024. [Google Scholar] [CrossRef] [Scilit]
- Galletta, S., & Mazzù, S. (2023). ESG controversies and bank risk taking. Business Strategy and the Environment, 32(1), 274–288. [Google Scholar] [CrossRef] [Scilit]
- Gambacorta, L., & Marqués-Ibáñez, D. (2011). The bank lending channel: Lessons from the crisis. Economic Policy, 26(66), 135–182. [Google Scholar] [CrossRef] [Scilit]
- Gangi, F., Meles, A., D’Angelo, E., & Daniele, L. M. (2019). Sustainable development and corporate governance in the financial system: Are environmentally friendly banks less risky? Corporate Social Responsibility and Environmental Management, 26(3), 529–547. [Google Scholar] [CrossRef] [Scilit]
- Gupta, J., & Kashiramka, S. (2024). Examining the impact of liquidity creation on bank stability in the Asia Pacific region: Do ESG disclosures play a moderating role? Journal of International Financial Markets, Institutions and Money, 91, 101955. [Google Scholar] [CrossRef] [Scilit]
- Houston, J. F., & Shan, H. (2022). Corporate ESG profiles and banking relationships. The Review of Financial Studies, 35(7), 3373–3417. [Google Scholar] [CrossRef] [Scilit]
- Huang, F., Zhu, H., & Wu, S. (2025). Green credit, monetary policy, and bank risk-taking. Finance Research Letters, 79, 107289. [Google Scholar] [CrossRef] [Scilit]
- Huang, K.-J., Bui, D. G., Hsu, Y.-T., & Lin, C.-Y. (2024). The ESG washing in banks: Evidence from the syndicated loan market. Journal of International Money and Finance, 142, 103043. [Google Scholar] [CrossRef] [Scilit]
- Islam, M. J. A., Moreira, F., & Douch, M. (2025). Does banks’ environmental engagement impact funding costs? Journal of International Financial Markets, Institutions and Money, 103, 102184. [Google Scholar] [CrossRef] [Scilit]
- Jiménez, G., Ongena, S., Peydró, J.-L., & Saurina, J. (2012). Credit supply and monetary policy: Identifying the bank balance-sheet channel with loan applications. American Economic Review, 102(5), 2301–2326. [Google Scholar] [CrossRef] [Scilit]
- Kashyap, A. K., & Stein, J. C. (2000). What do a million observations on banks say about the transmission of monetary policy? American Economic Review, 90(3), 407–428. [Google Scholar] [CrossRef] [Scilit]
- Kim, S., Kumar, N., Lee, J., & Oh, J. (2025). ESG lending. Journal of Financial Economics, 173, 104150. [Google Scholar] [CrossRef] [Scilit]
- Kishan, R. P., & Opiela, T. P. (2000). Bank size, bank capital, and the bank lending channel. Journal of Money, Credit and Banking, 32(1), 121–141. [Google Scholar] [CrossRef] [Scilit]
- Kowibeen, S. P., Khan, A., & Hassan, M. K. (2026). Funding costs and liquidity creation: Does ESG play any role? Business Strategy and the Environment. Advance online publication. [Google Scholar] [CrossRef] [Scilit]
- Lee, C.-C., Lu, M., Wang, C.-W., & Cheng, C.-Y. (2024). ESG engagement, country-level political risk and bank liquidity creation. Pacific-Basin Finance Journal, 83, 102260. [Google Scholar] [CrossRef] [Scilit]
- Lins, K. V., Servaes, H., & Tamayo, A. (2017). Social capital, trust, and firm performance: The value of corporate social responsibility during the financial crisis. The Journal of Finance, 72(4), 1785–1824. [Google Scholar] [CrossRef] [Scilit]
- Liu, C.-L., & Tsui, C.-K. (2026). ESG and bank loan cost. Finance Research Letters, 91, 109395. [Google Scholar] [CrossRef] [Scilit]
- Murè, P., Spallone, M., Mango, F., Marzioni, S., & Bittucci, L. (2021). ESG and reputation: The case of sanctioned Italian banks. Corporate Social Responsibility and Environmental Management, 28(1), 265–277. [Google Scholar] [CrossRef] [Scilit]
- Naqvi, H., & Pungaliya, R. (2023). Bank size and the transmission of monetary policy: Revisiting the lending channel. Journal of Banking & Finance, 146, 106688. [Google Scholar] [CrossRef] [Scilit]
- Neitzert, F., & Petras, M. (2022). Corporate social responsibility and bank risk. Journal of Business Economics, 92(3), 397–428. [Google Scholar] [CrossRef] [Scilit]
- Nizam, E., Ng, A., Dewandaru, G., Nagayev, R., & Nkoba, M. A. (2019). The impact of social and environmental sustainability on financial performance: A global analysis of the banking sector. Journal of Multinational Financial Management, 49, 35–53. [Google Scholar] [CrossRef] [Scilit]
- Pradhan, S.-K., Stebunovs, V., Takáts, E., & Temesvary, J. (2025). Geopolitics meets monetary policy: Decoding their impact on cross-border bank lending (BIS Working Papers, No. 1247). Bank for International Settlements. [Google Scholar]
- Sohel, M. N. I., Iqbal, A., Ahmed, R., & Pappas, V. (2026). Do banks price ESG performance? Regional evidence from Europe and the United States. European Financial Management. Advance online publication. [Google Scholar] [CrossRef] [Scilit]
- Sun, T., Mirza, N., Umar, M., & Ktaish, F. (2024). When interest rates rise, ESG is still relevant—The case of banking firms. Finance Research Letters, 69, 106128. [Google Scholar] [CrossRef] [Scilit]
- Verma, G., & Kashiramka, S. (2025). Balancing ESG disclosures and cost efficiency: Implications for bank liquidity. Finance Research Letters, 85, 108141. [Google Scholar] [CrossRef] [Scilit]
- Wang, L. L. (2023). Transmission effects of ESG disclosure regulations through bank lending networks. Journal of Accounting Research, 61(3), 935–978. [Google Scholar] [CrossRef] [Scilit]
- Wu, M., & Zhang, L. (2025). Green credit, deposit-loan ratio, and risk taking of commercial banks. Finance Research Letters, 81, 107470. [Google Scholar] [CrossRef] [Scilit]
- Zheng, C., Cheung, A. W. K., Zhang, J., & Haider, I. (2023). Corporate social responsibility and bank liquidity creation. Journal of Financial Research, 46(2), 343–382. [Google Scholar] [CrossRef] [Scilit]
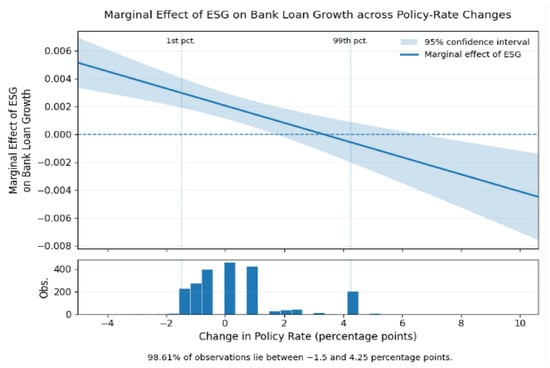
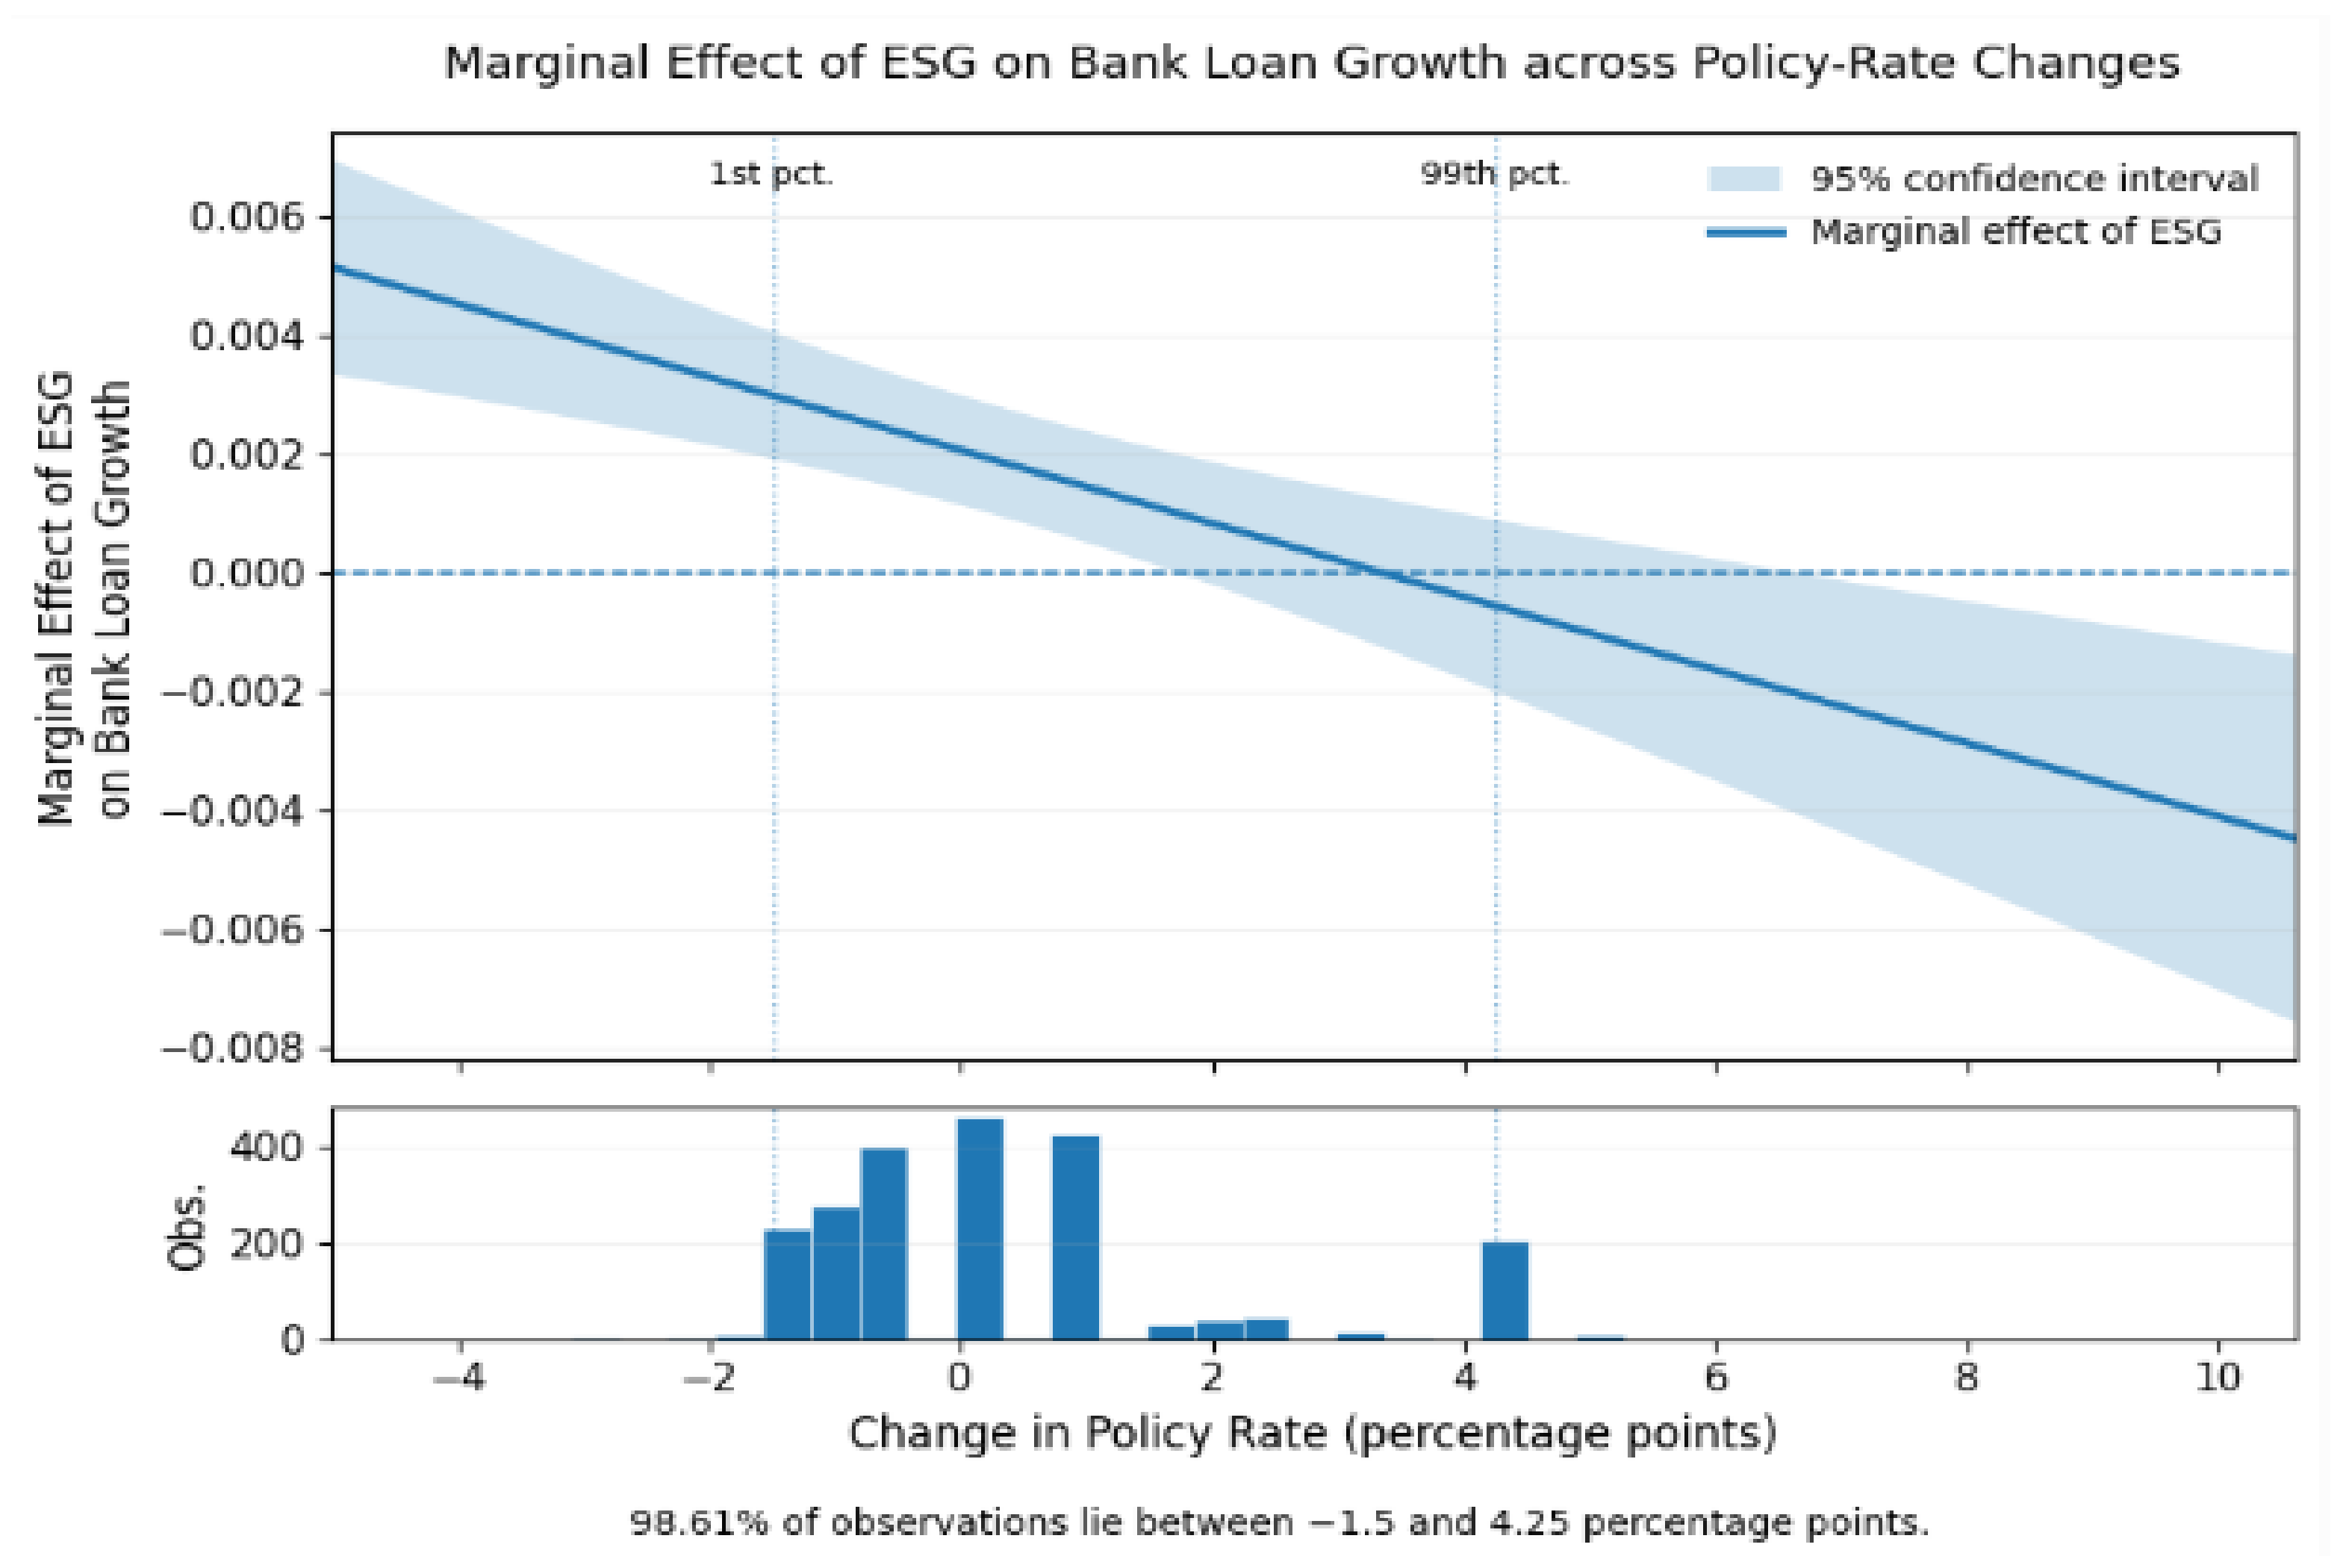

Disclaimer/Publisher’s Note: The statements, opinions and data contained in all publications are solely those of the individual author(s) and contributor(s) and not of MDPI and/or the editor(s). MDPI and/or the editor(s) disclaim responsibility for any injury to people or property resulting from any ideas, methods, instructions or products referred to in the content. |
© 2026 by the authors. Licensee MDPI, Basel, Switzerland. This article is an open access article distributed under the terms and conditions of the Creative Commons Attribution (CC BY) license.