


Abstract
This study investigates the optimization of airflow distribution and pressure drops in H14 HEPA minipleat filters through the introduction of the hot-melt cell as the fundamental hydraulic unit governing local flow behavior. A coupled analytical framework integrating Falkner–Skan boundary-layer theory, Darcy–Weisbach channel friction, and Darcy porous-medium flow was developed and experimentally tested using velocity measurements obtained in a 600 m3/h test bench operating at a frontal velocity of 0.45 m/s under laminar-flow conditions. Ten primary geometric configurations and 21 hot-melt distribution scenarios (totaling 31 cases plus an optimized design case) were systematically evaluated by varying cell width (W), inlet height (Hi), and pleat length (L). Experimental and analytical results reveal significant velocity heterogeneity in the vicinity of the filter surface, which progressively decreases with distance from the filter, while localized velocity amplification is observed near the hot-melt separators. The analysis demonstrates that hydraulic diameter, pleat angle, and hot-melt spacing are the dominant parameters governing pressure drop generation and flow redistribution. Among the configurations investigated, a model-predicted optimized design (W = 46.25 mm, L = 55.00 mm, 230 pleats) yields a theoretical pressure drop reduction of up to 29.23% without significantly compromising the effective filtration area. These results provide an analytical framework for pre-prototyping optimization, although experimental verification of physical prototype validation for mechanical integrity and the preservation of initial efficiency, among other governing physical quantities, remains essential. The results demonstrate that the proposed hot-melt cell concept provides a practical engineering framework for the aerodynamic optimization of minipleat HEPA filters, enabling improved flow uniformity and reduced energy consumption in cleanroom applications.
1. Introduction
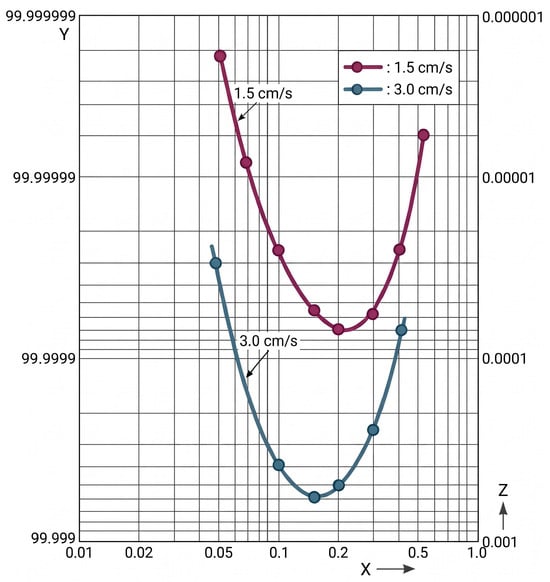
Clean air is essential for health and longevity, as widely demonstrated in medical research [1,2,3]. With pandemics and airborne pollutants such as viruses, bacteria, and nanoscale particles becoming increasingly common, optimizing air quality has become critical. Filtration is central for preventing contamination in industrial processes and limiting the release of harmful agents. Despite sector growth, technological progress has been modest, mostly focused on improving filter media and achieving slightly better energy classifications. This work seeks to optimize the manufacturing of H14-efficiency HEPA (high-efficiency particulate air) filters by balancing pressure drop reduction, preservation of filtration efficiency, and the uniformity of velocity distribution. These interdependent factors strongly depend on pleat geometry, whose aerodynamic profile can significantly reduce pressure drop. However, common two-dimensional analyses based on Falkner–Skan equations [4] overlook important effects from the transverse channel, motivating a more accurate quasi-three-dimensional engineering approach. This study focuses on filters with H14 efficiency or higher [5], which is essential in environments such as pharmaceutical laboratories and microchip manufacturing, where strict laminar flow is required. In injectable pharmaceutical production, even minor disturbances to laminar flow can compromise the entire batch. Evidence shows that very low velocities ensure laminarity [6,7], with a frontal velocity of 0.45 m/s typically used. However, velocity alone is insufficient; pressure drop (ΔP) determines the pressure required for air to pass through the filter. A flat media layer cannot reach H14 efficiency without generating excessive ΔP, risking particle re-entrainment and insufficient rigidity [8,9]. For this reason, the filtration surface is increased through pleating, while simultaneously protecting HEPA filters with prefiltration stages [10,11,12,13], allowing them to achieve a long service life exceeding five years in cleanrooms [14]. Structural stability is ensured through hot-melt lines, thermoplastic polymers applied perpendicularly to the pleat that solidify rapidly during the manufacturing process. Pleat depth and uniformity are essential to maintain outlet velocity within ± 20% of the nominal value, as required by several pharmaceutical regulations [15,16,17,18], thus reducing pressure drop and keeping most penetrating particle size (MPPS) [8,9] at an optimal value, as shown in Figure 1.
Figure 1.
Particle diameter (µm, x-axis) versus fractional efficiency (%, y-axis) and penetration (%, z-axis) for ULPA filter media at two airflow velocities [19].
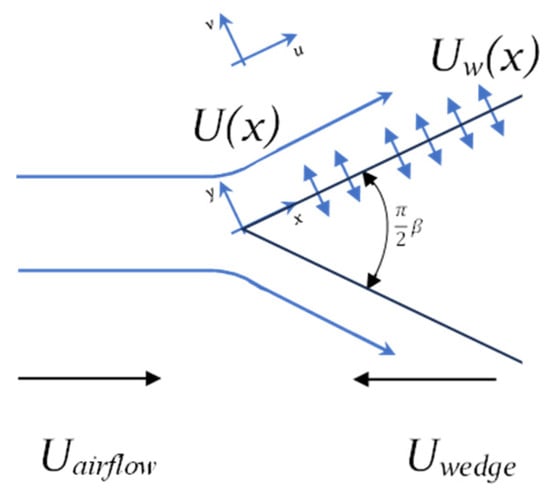
Given that absolute filters (EPA, HEPA, and ULPA) defined by EN1822 [5] depend critically on their behavior with respect to the MPPS, variations in velocity between pleats must be minimized. In Figure 1, the velocity effect can be observed, by doubling it, MPPS penetration is increased by more than a factor of twelve and reduced in size from approximately 230 nm to 160 nm [8]. We propose a solution to improve flow rate distribution in minipleat filters by optimizing their geometry without compromising mechanical rigidity. Although the triangular pleat model (V-shape) is the most widely used [20], the manufacturing process tends to round its vertices due to the inherent geometry of the pleating machinery. The state of the art comprises three primary research domains: novel pleating configurations (such as U-shaped and sine-wave designs), which form the cornerstone of this work; high-efficiency, low-resistance filter media (including nanofibers, ePTFE, and glass–nanofiber composites); and aerodynamic plenum enhancements utilizing flow diffusers [19,21,22,23,24,25]. However, the implementation of new pleat geometries has been limited by the high associated costs, with research focusing more on reducing pressure drop than on improving velocity distribution. Although previous studies have investigated pleat geometry, filter media, and pressure drop reduction strategies, most available approaches focus either on experimental characterization or on numerical simulations of the complete filter structure. Furthermore, the influence of hot-melt segmentation on local airflow distribution has received limited attention, despite its widespread use in modern minipleat HEPA filters. As a result, a practical analytical framework capable of linking pleat geometry, hydraulic behavior, and pressure drop generation at the cell level is still lacking. The novelty of this work lies in the introduction of the hot-melt cell concept as the fundamental hydraulic unit governing airflow distribution within a minipleat filter. Based on this concept, a coupled analytical framework integrating Falkner–Skan wedge-flow theory, Darcy–Weisbach channel friction, and Darcy porous-medium flow is developed and tested experimentally. Unlike previous studies that primarily focus on global filter behavior, the proposed methodology enables the analysis of local flow mechanisms, pressure drop generation, and velocity redistribution at the cell level. This approach provides a computationally efficient engineering tool for filter geometry optimization and the development of lower-energy HEPA filtration systems. Figure 2 illustrates the model employed to describe the interaction between airflow and porous materials, whose behavior has been rigorously analyzed using the Falkner–Skan equations [4].
Figure 2.
Conceptual scheme of Falkner–Skan equations.
Where:
- Uairflow: airflow velocity (positive as indicated by the arrow, viscous, and incompressible);
- Uwedge: wedge velocity (positive as indicated by the arrow), zero in our case;
- U(x): boundary-layer velocity profile;
- Uw(x): flow velocity across the porous wedge (suction, Uw(x) < 0, injection, Uw(x) > 0);
- β: parameter referring to the inscribed angle of the wedge;
- λ: velocity ratio Uwedge/Uairflow, zero in our case.
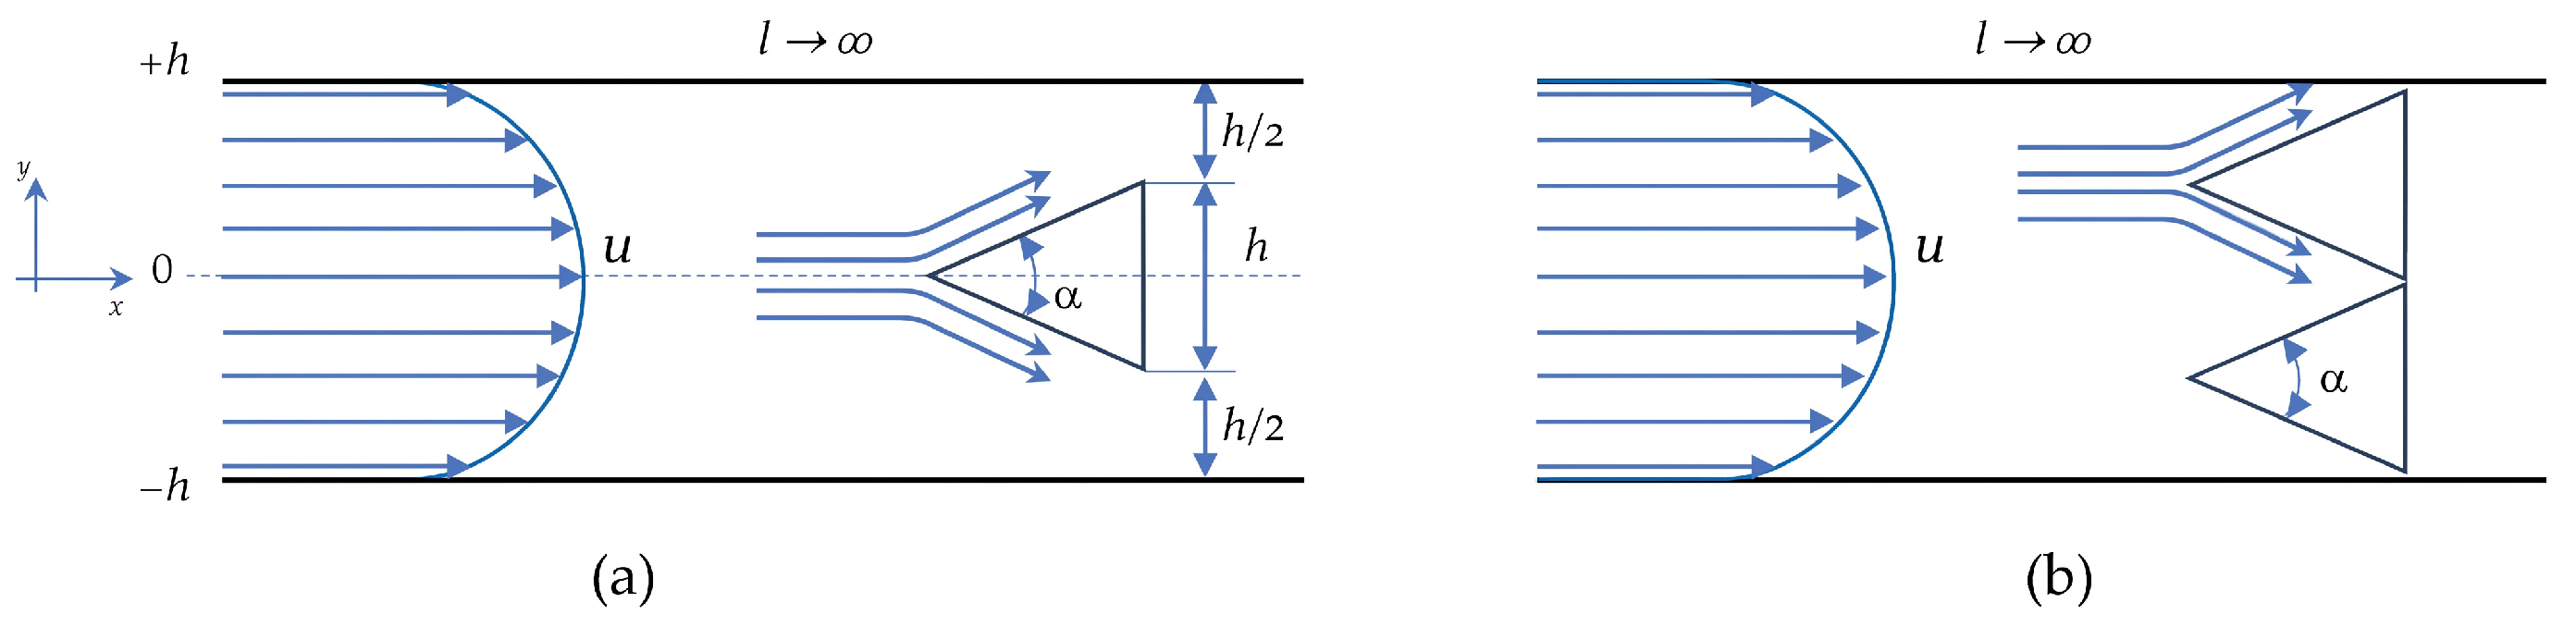
None incorporate the effect of hot-melt lines, a determining element analyzed in this study. This motivates the analysis of wedge-shaped objects in a two-dimensional square channel according to the Poiseuille model, which is a variation of the Couette–Poiseuille model [6,7] when both plates are fixed, which is the case we are dealing with, as shown in Figure 3a, and with two or more wedges (Figure 3b).
Figure 3.
Simple model with one wedge (a); two wedges (b) in a square channel.
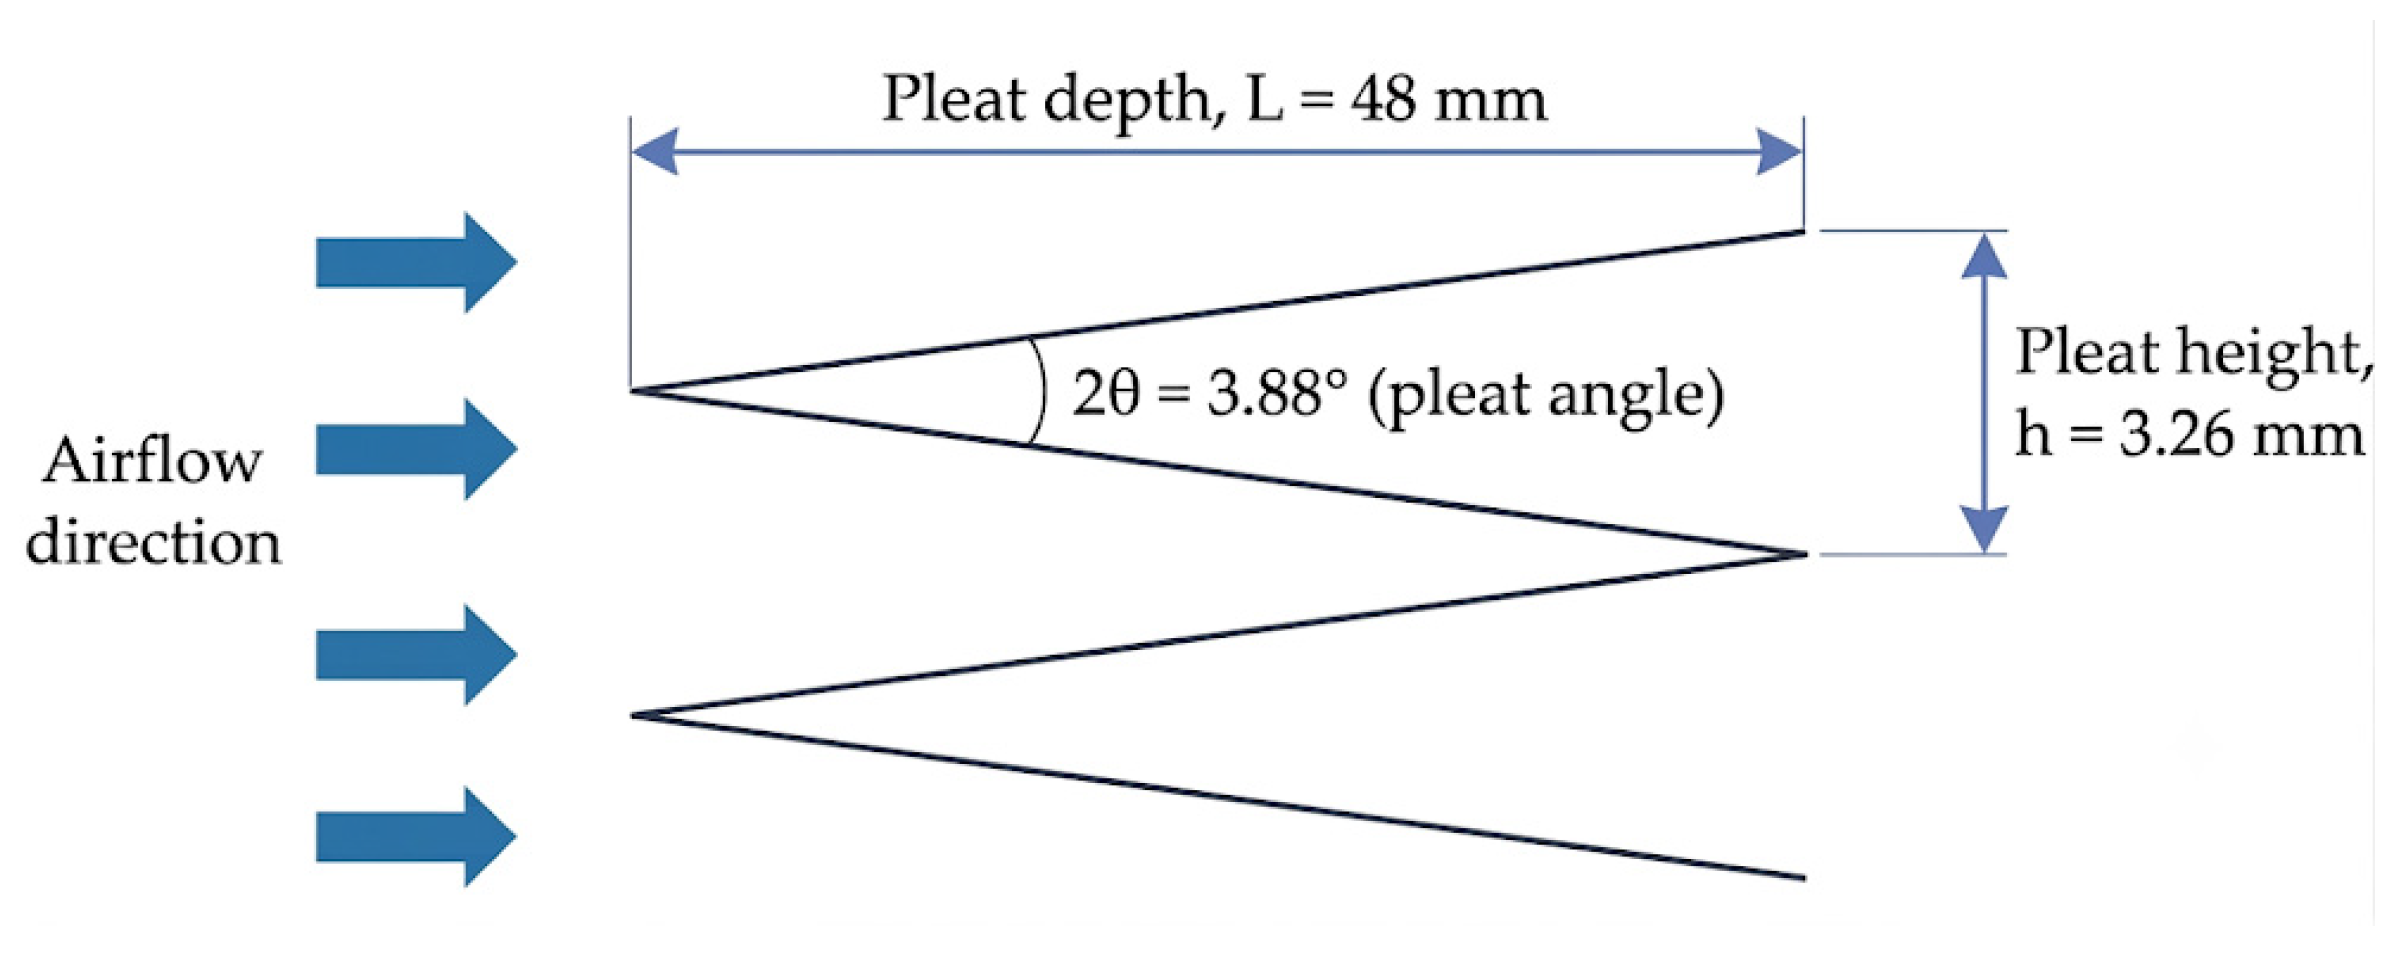
This corresponds to a parabola with zero velocities at the walls and maximum velocities at the central axis of the channel, u = umax (1 − y2/h2). Poiseuille flows are laminar if the Reynolds number remains far below the critical limit of 2500–3000; the channel operates in a deeply laminar regime (Re < 200), moving it away from any transition threshold. Further analysis of the hot-melt lines is closely linked to the hydraulic diameter Dh [6,7], which is the key to our study. A standard filter includes a high number of pleats based on the flow rate we wish to handle: 150, 188, 220, or even more. A real H14 filter with 188 pleats will define a geometry like the one shown in Figure 4, with a very narrow angle that will define the dimensions of the hot-melt channel that we will analyze shortly.
Figure 4.
Actual H14 minipleat geometry values.
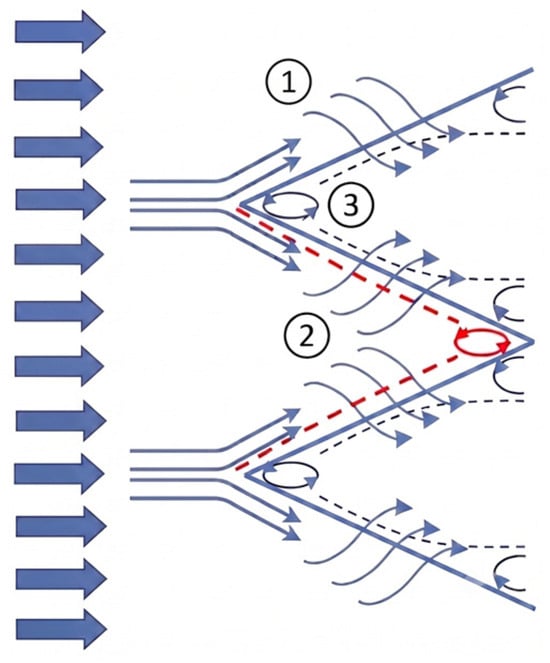
Thus, the airflow at the inlet can only reach the opposite end, the outlet, by passing through the walls of the porous medium. Therefore, several distinct effects are generated at both the inlet and outlet of the structure shown in Figure 5.
Figure 5.
Effects generated by the airflow path versus the physical shape of the wedge-shaped fold. Solid blue line: airflow, dashed blue line: outlet boundary layer and its potential separation, solid red line: potential vortex, dashed red line: inlet boundary layer.
- (1)
- The effects of airflow over a wedge-shaped, rigid, and impervious body, for which the Falkner–Skan equations [4,20,25] are fundamental.
- (2)
- The effects of airflow over multiple wedge-shaped porous bodies, corresponding to the Darcy effect [26,27]. This effect, number (2), in turn, introduces two distinct fluid dynamic phenomena due to its physical configuration:
- (1)
- The effect of airflow impinging on a porous wedge with a very small β > 0 (inlet vertex);
- (2)
- The effect of airflow impinging on a porous wedge with a very small β < 0 (internal vertex, sink).
The pleat geometry limits flow penetration at both the inlet and outlet wedges, generating a potential vertex due to local fiber deformation and breakage, which substantially reduces the effective porosity and makes these regions nearly impermeable. As a result, the portion of the incoming flow that cannot pass through the filter medium is redirected into the converging and diverging equal channels, which means that the actual length of the channel will be reduced. These vortices have been analyzed via CFD, showing a small influence on total pleat pressure drop; even so, it must be considered as an additional field of interest from a new media development point of view.
- (3)
- Effects of fluid in a diverging channel at the outlet.
In our case, the value of β is 0.0431 (a calculated angle of 3.88°), making injection (flow from the outlet towards the inlet) impossible, as only suction is present (Uw(x) < 0, corresponding to flow from the inlet towards the outlet).
2. Materials and Methods
All the mechanisms discussed above contribute to the overall pressure drop across the filter, which the present work aims to minimize through geometric optimization while preserving both the intrinsic properties of the filter media and the external dimensions of the filter assembly. Accordingly, the proposed approach focuses on improving the airflow pathway within the pleat cavity, thereby increasing the effective filtration area and enhancing the aerodynamic performance of the system. Special emphasis is placed on reducing the number of hot-melt separators, which decreases the total number of cells while simultaneously increasing the effective filtration area associated with each individual cell. Such modifications require a comprehensive assessment of airflow behavior throughout the filter, including the characterization of inlet and outlet flow distributions as well as the associated hydraulic, aerodynamic, and flow uniformity parameters. To this end, this section presents the two complementary components underpinning this study: an experimental investigation based on velocity measurements downstream of a commercial H14 filter and a mathematical framework developed to determine the parameters analyzed in this work. First, the filter geometry is defined, and the hot-melt cell concept is formalized as an elementary hydraulic unit governing local flow behavior. Subsequently, a coupled theoretical framework is introduced, integrating viscous friction within converging channels, porous-media flow, and wedge-related aerodynamic effects. This is followed by a description of the experimental setup and velocity measurement methodology adopted for model validation. Finally, ten geometric configurations are systematically evaluated to quantify the influence of the principal hot-melt cell parameters width (W), inlet height (Hi), and pleat length (L) on airflow distribution, flow uniformity, and total pressure drop.
2.1. Hot-Melt Cell
Before proceeding with the analysis, it is necessary to explain the hot-melt cell concept, which is fundamental for understanding the bounded space it defines and the geometry it imposes. Cells are present in all filters manufactured using minipleat technology, as well as in all those with efficiencies above Coarse 70% [10], except for bag-type filters, which have a different geometry. In HEPA filters, these cells are the result of the application of hot-melt adhesive lines, as previously described, which physically and functionally segment filter pleats’ media, dividing them partially or completely into discrete units. Consequently, airflow does not pass continuously through a single pleat but is instead distributed across a large number of small cells.
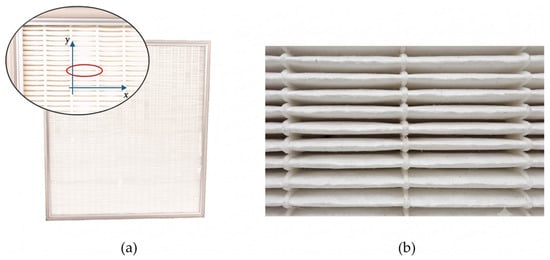
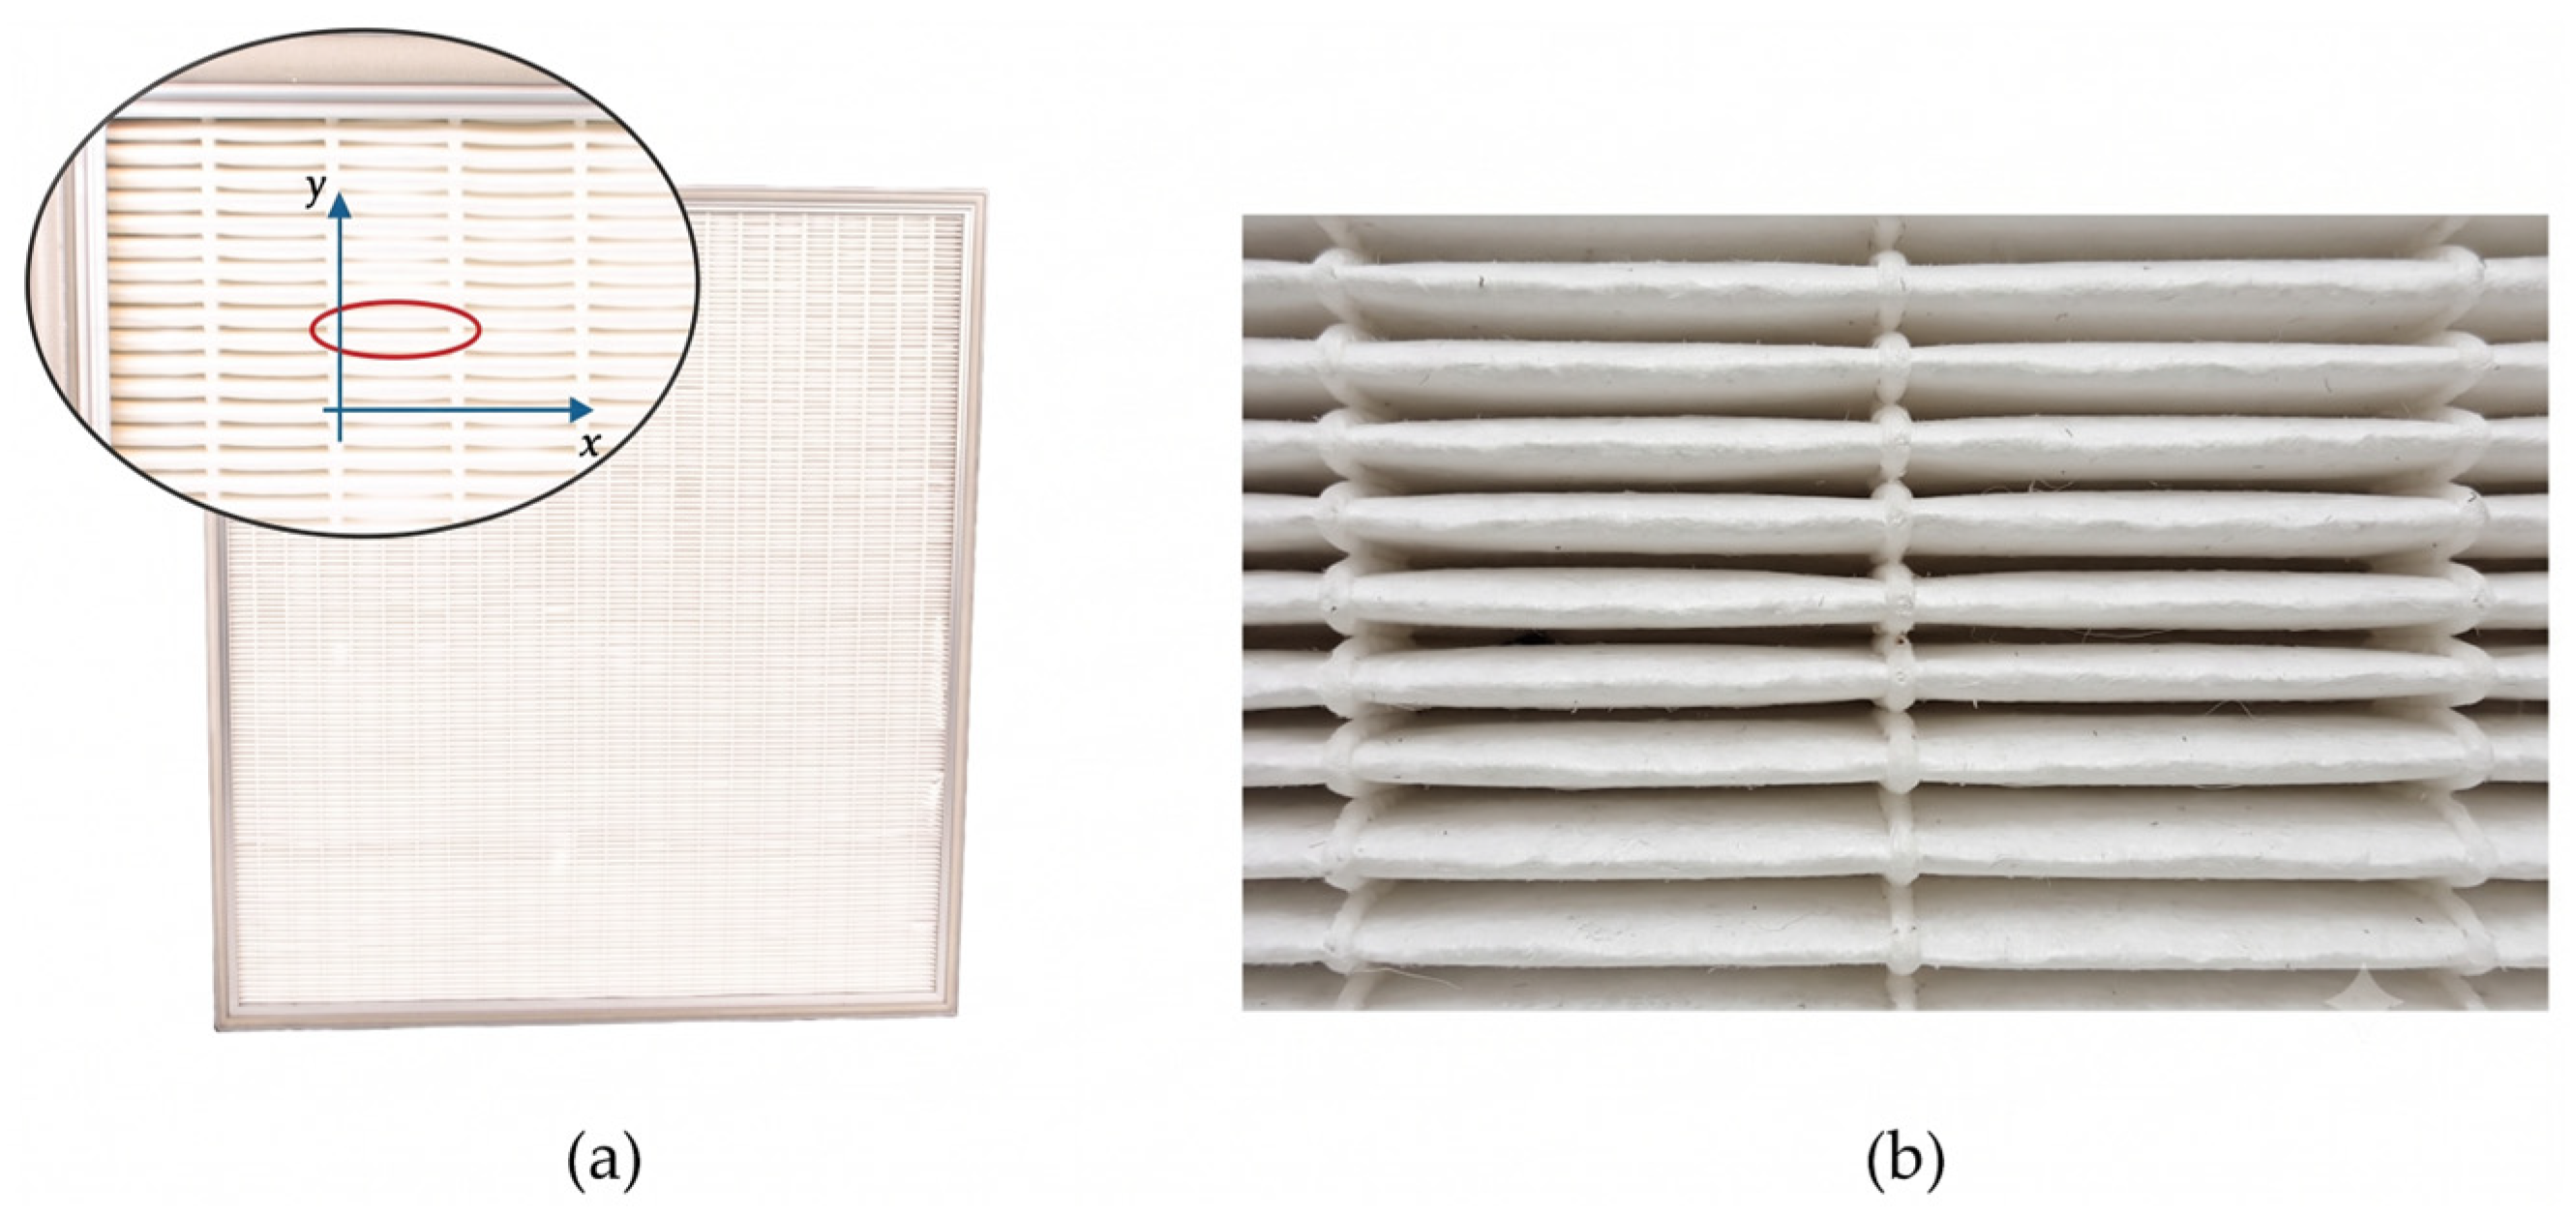
This fragmentation significantly reduces the characteristic dimension along the x-axis (Figure 6a), generating airflow behaviors that are quite different from those that might be expected intuitively. The proposed hypothesis assumes that the overall airflow distribution is obtained from the superposition of each hot-melt cell’s airflow contribution. However, several small correction coefficients will be introduced to account for non-ideal effects resulting from the geometric and constructive differences between the elementary cell model and the complete filter structure. This coefficient incorporates the influence of cell–cell interactions, edge effects, manufacturing tolerances, and other secondary aerodynamic phenomena that are not explicitly represented in the cell-based formulation. Analyzing each cell individually allows these phenomena to be better understood, after which their contributions can be scaled to the entire filter as the sum of the effects observed in each cell.
Figure 6.
(a) Actual filter and magnified cell zone, (b) hot-melt cell 10×.
To compare the theoretical model with experimental data, a fully characterized reference filter sample was utilized that has been manufactured and marketed for more than twenty years. Its nominal flow rate is 600 m3/h, with a frontal velocity of 0.45 m/s and external dimensions of 610 × 610 × 69 mm, which are slightly larger than the effective section, 588 × 588 × 48 mm, due to the peripheral adhesive and aluminum frame thickness. Thanks to pleating, the total theoretical filtration surface reaches 10.62 m2. After subtracting the area occupied by the 21 hot-melt lines (1.14 m2), the usable surface is reduced to 9.48 m2 (the effective surface). This area is distributed in a matrix formed by 188 pleats and 21 adhesive lines, giving rise to 4136 cells, whose dynamics will be studied in detail. Functioning as miniature nozzles, the pleat channels exhibit dual hydraulic effects: a localized acceleration at the convergent inlet boundary, accompanied by an overall deceleration downstream as the effective cross-sectional area increases [19]. There are two velocities we must distinguish: velocity across media Uw and inlet velocity Ui. The increase in media cross-section multiplies the airflow passage area by more than 25, thus reducing the mean velocity by the same proportion, from 0.45 m/s to 0.0175805 m/s, corresponding to Uw. The effective geometry of the hot-melt cell increases the inlet velocity (Ui) from 0.45 m/s to 0.5398985 m/s. We will see later on how the nozzle acceleration effect, in contrast, increases this velocity.
Applicability and Limitations of the Hot-Melt Cell Model
The hot-melt cell concept represents a simplified hydraulic unit intended to describe the dominant flow mechanisms occurring between two adjacent hot-melt lines. The model assumes: (i) a steady, incompressible flow, (ii) laminar flow conditions throughout the pleat, (iii) homogeneous permeability of the filter medium, (iv) negligible lateral mass transfer between neighboring cells due to the confinement imposed by the hot-melt lines, and (v) geometrically regular pleats with a constant width. Under these assumptions, the complete filter can be represented as the sum of a large number of equivalent cells, allowing pressure drop, velocities, and airflow distribution phenomena to be analyzed with reduced computational effort. The model is therefore particularly suitable for cleanroom HEPA and ULPA filters operating at low Reynolds numbers, such as those considered in the present study, where Reynolds numbers remain well within the laminar regime. The model is not intended to describe effects associated with severe media deformation, dust loading, non-uniform permeability, manufacturing imperfections, turbulence, or detailed three-dimensional flow interactions extending over multiple neighboring cells. These phenomena require more advanced numerical approaches and are considered outside the scope of the present work. Although the global airflow field is intrinsically three-dimensional, the hot-melt cell approach assumes that the dominant airflow distribution mechanism can be represented locally at the cell level and subsequently extended to the complete filter through superposition of all cells.
2.2. Experimental Configuration and Measurement Protocol
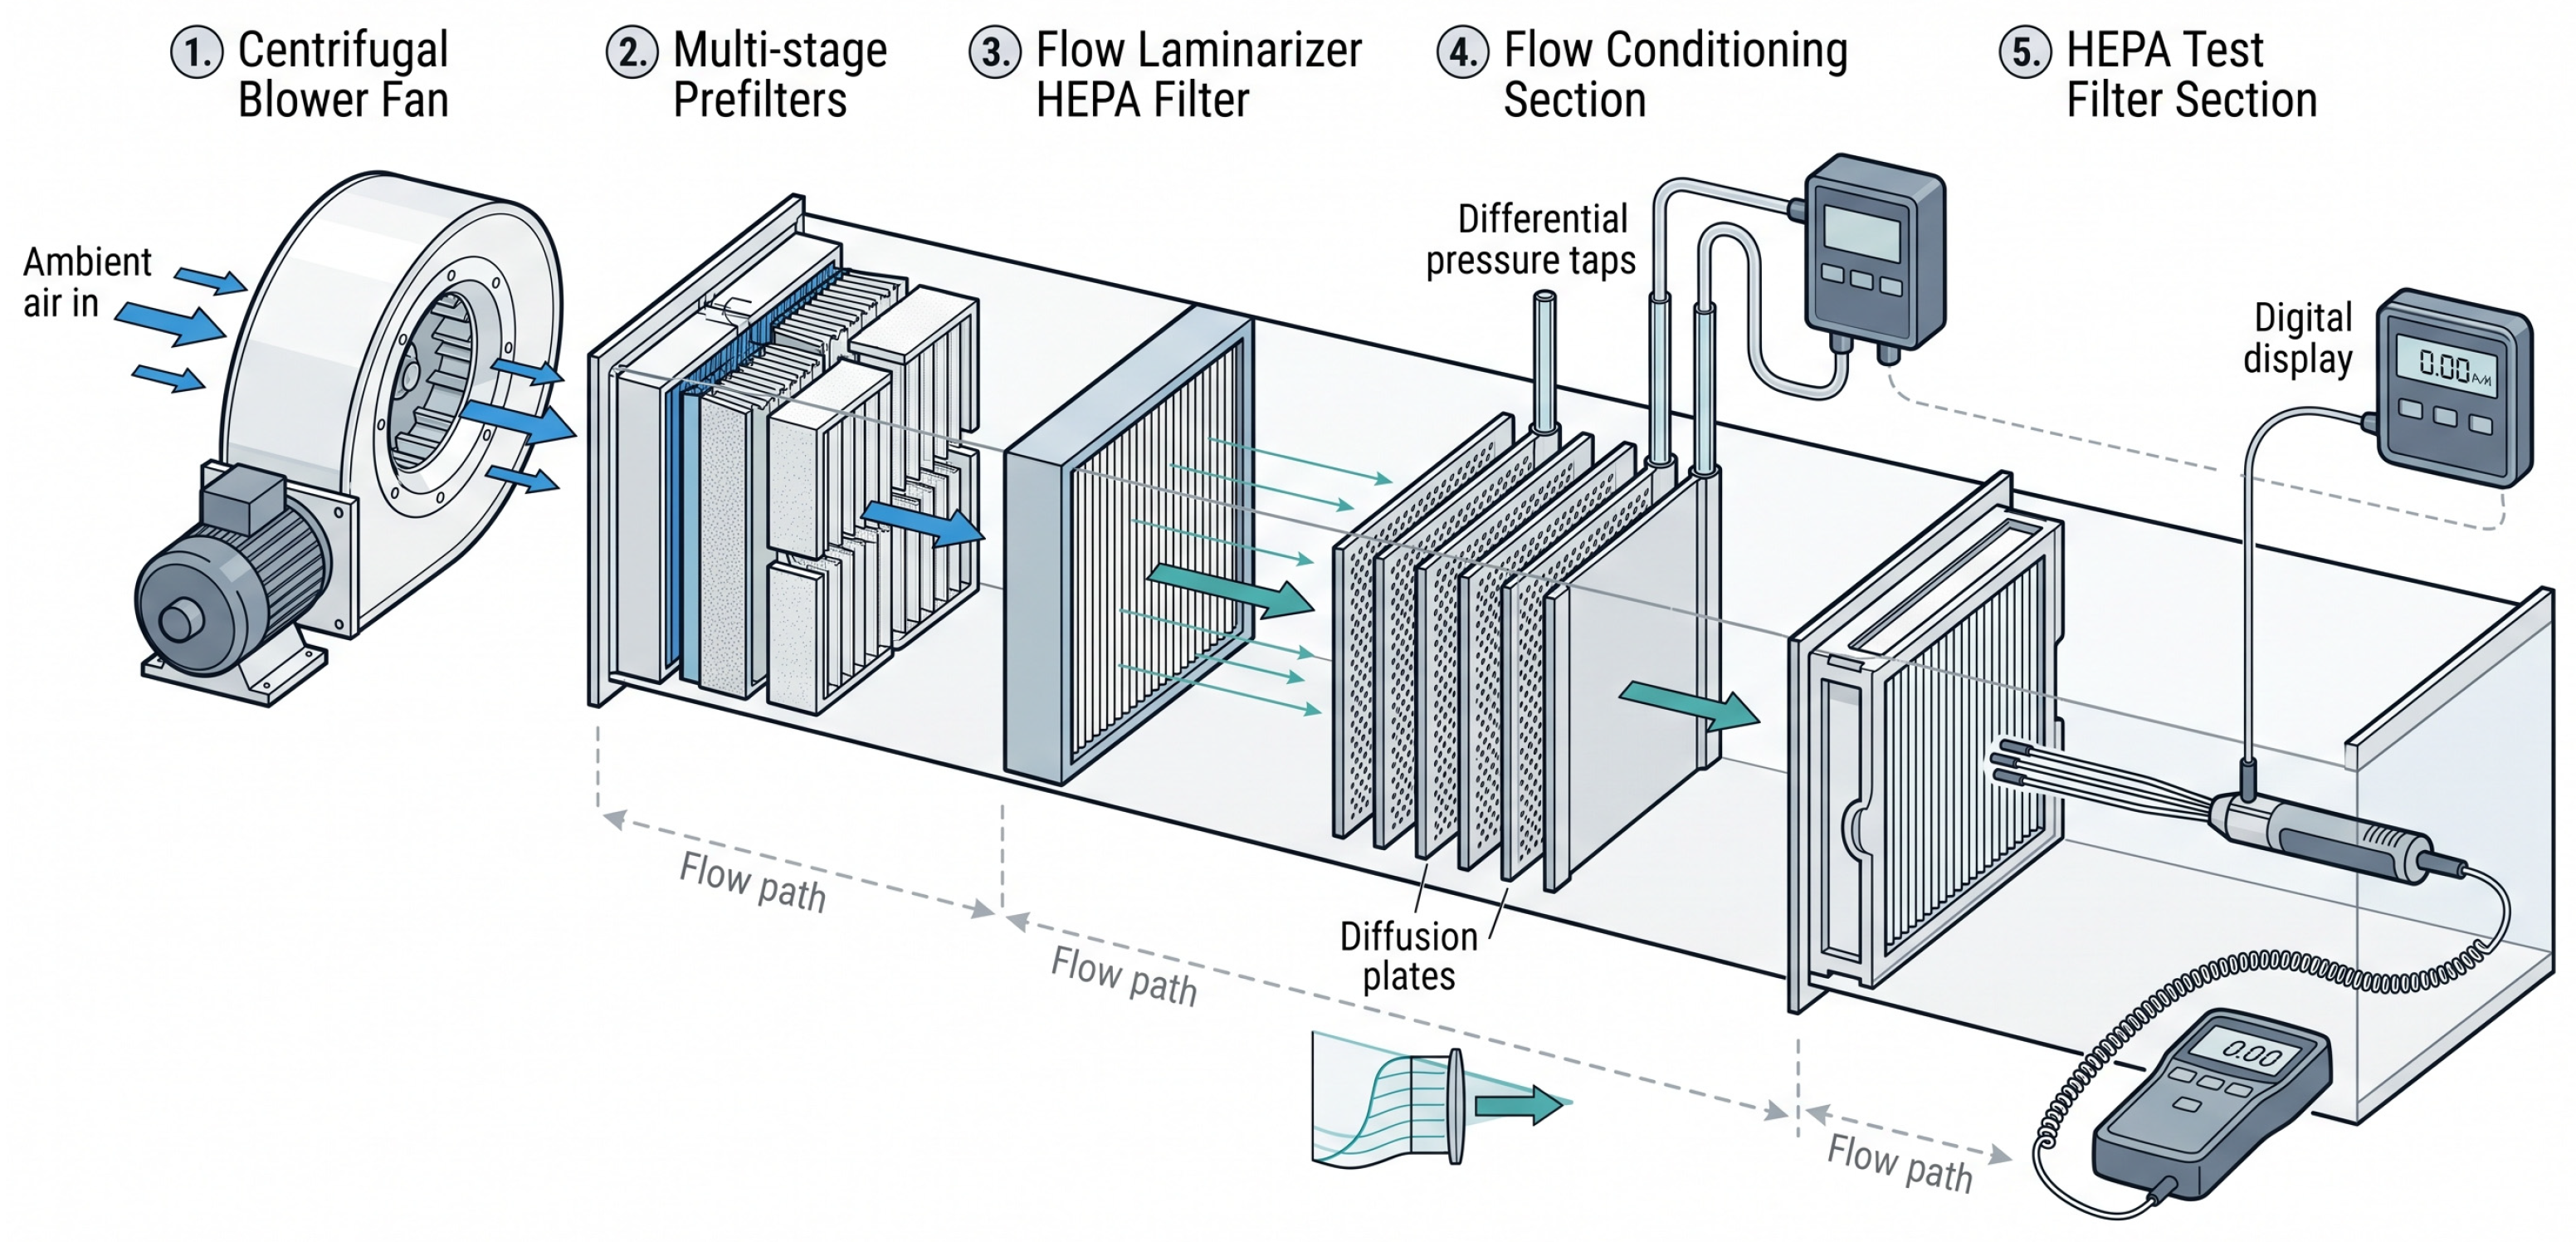
The objective of the experimental evaluation presented in Figure 7 is to characterize the outlet velocity profile and thereby determine the extent to which the hot-melt lines act as airflow-confining boundaries. This approach makes it possible to quantitatively assess their influence on the resulting velocity distribution and the associated airflow redistribution mechanisms.
Figure 7.
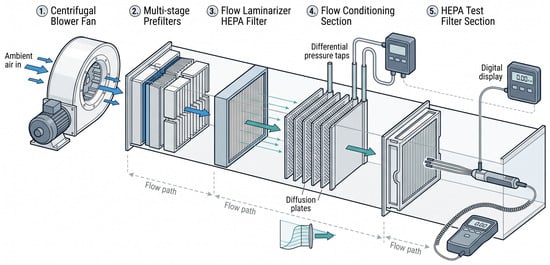
Isometric schematic of the airflow test duct bench used.
To map the airflow dynamics through the porous structure, outlet velocity measurements were collected at systematic increments along the x and z axes, across varying y-axis positions. The flow rate was supplied by a fan with speed control at 600 m3/h, passing through a set of prefilters, medium-efficiency filters, and a final HEPA filter, followed by diffusion plates to ensure laminar flow.
2.2.1. Instrumentation
The experimental design, measurement procedure, and instrumentation layout are adapted from the methodology previously validated by the authors in previous studies [19]. Experimental characterization of the flow field relied on a calibrated hot-wire thermo-anemometer (range: 0–20 m/s; accuracy: ±3% + 0.03 m/s; resolution: 0.01 m/s), an instrument ideally suited for measuring low-velocity laminar fields. Transmural pressure drop across the filter element was measured using a digital differential manometer (range: 0–1000 Pa; accuracy: ±1% FS; resolution: 1 Pa) configured with upstream/downstream pressure taps following established cleanroom evaluation protocols [5]. Ambient stability was continuously confirmed using a calibrated thermo-hygrometer (uncertainties: ±0.5 °C and ±3% RH). All sensors were calibrated and validated against primary reference standards ahead of data collection.
2.2.2. Measurement Locations
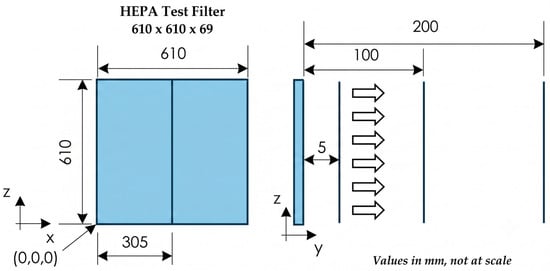
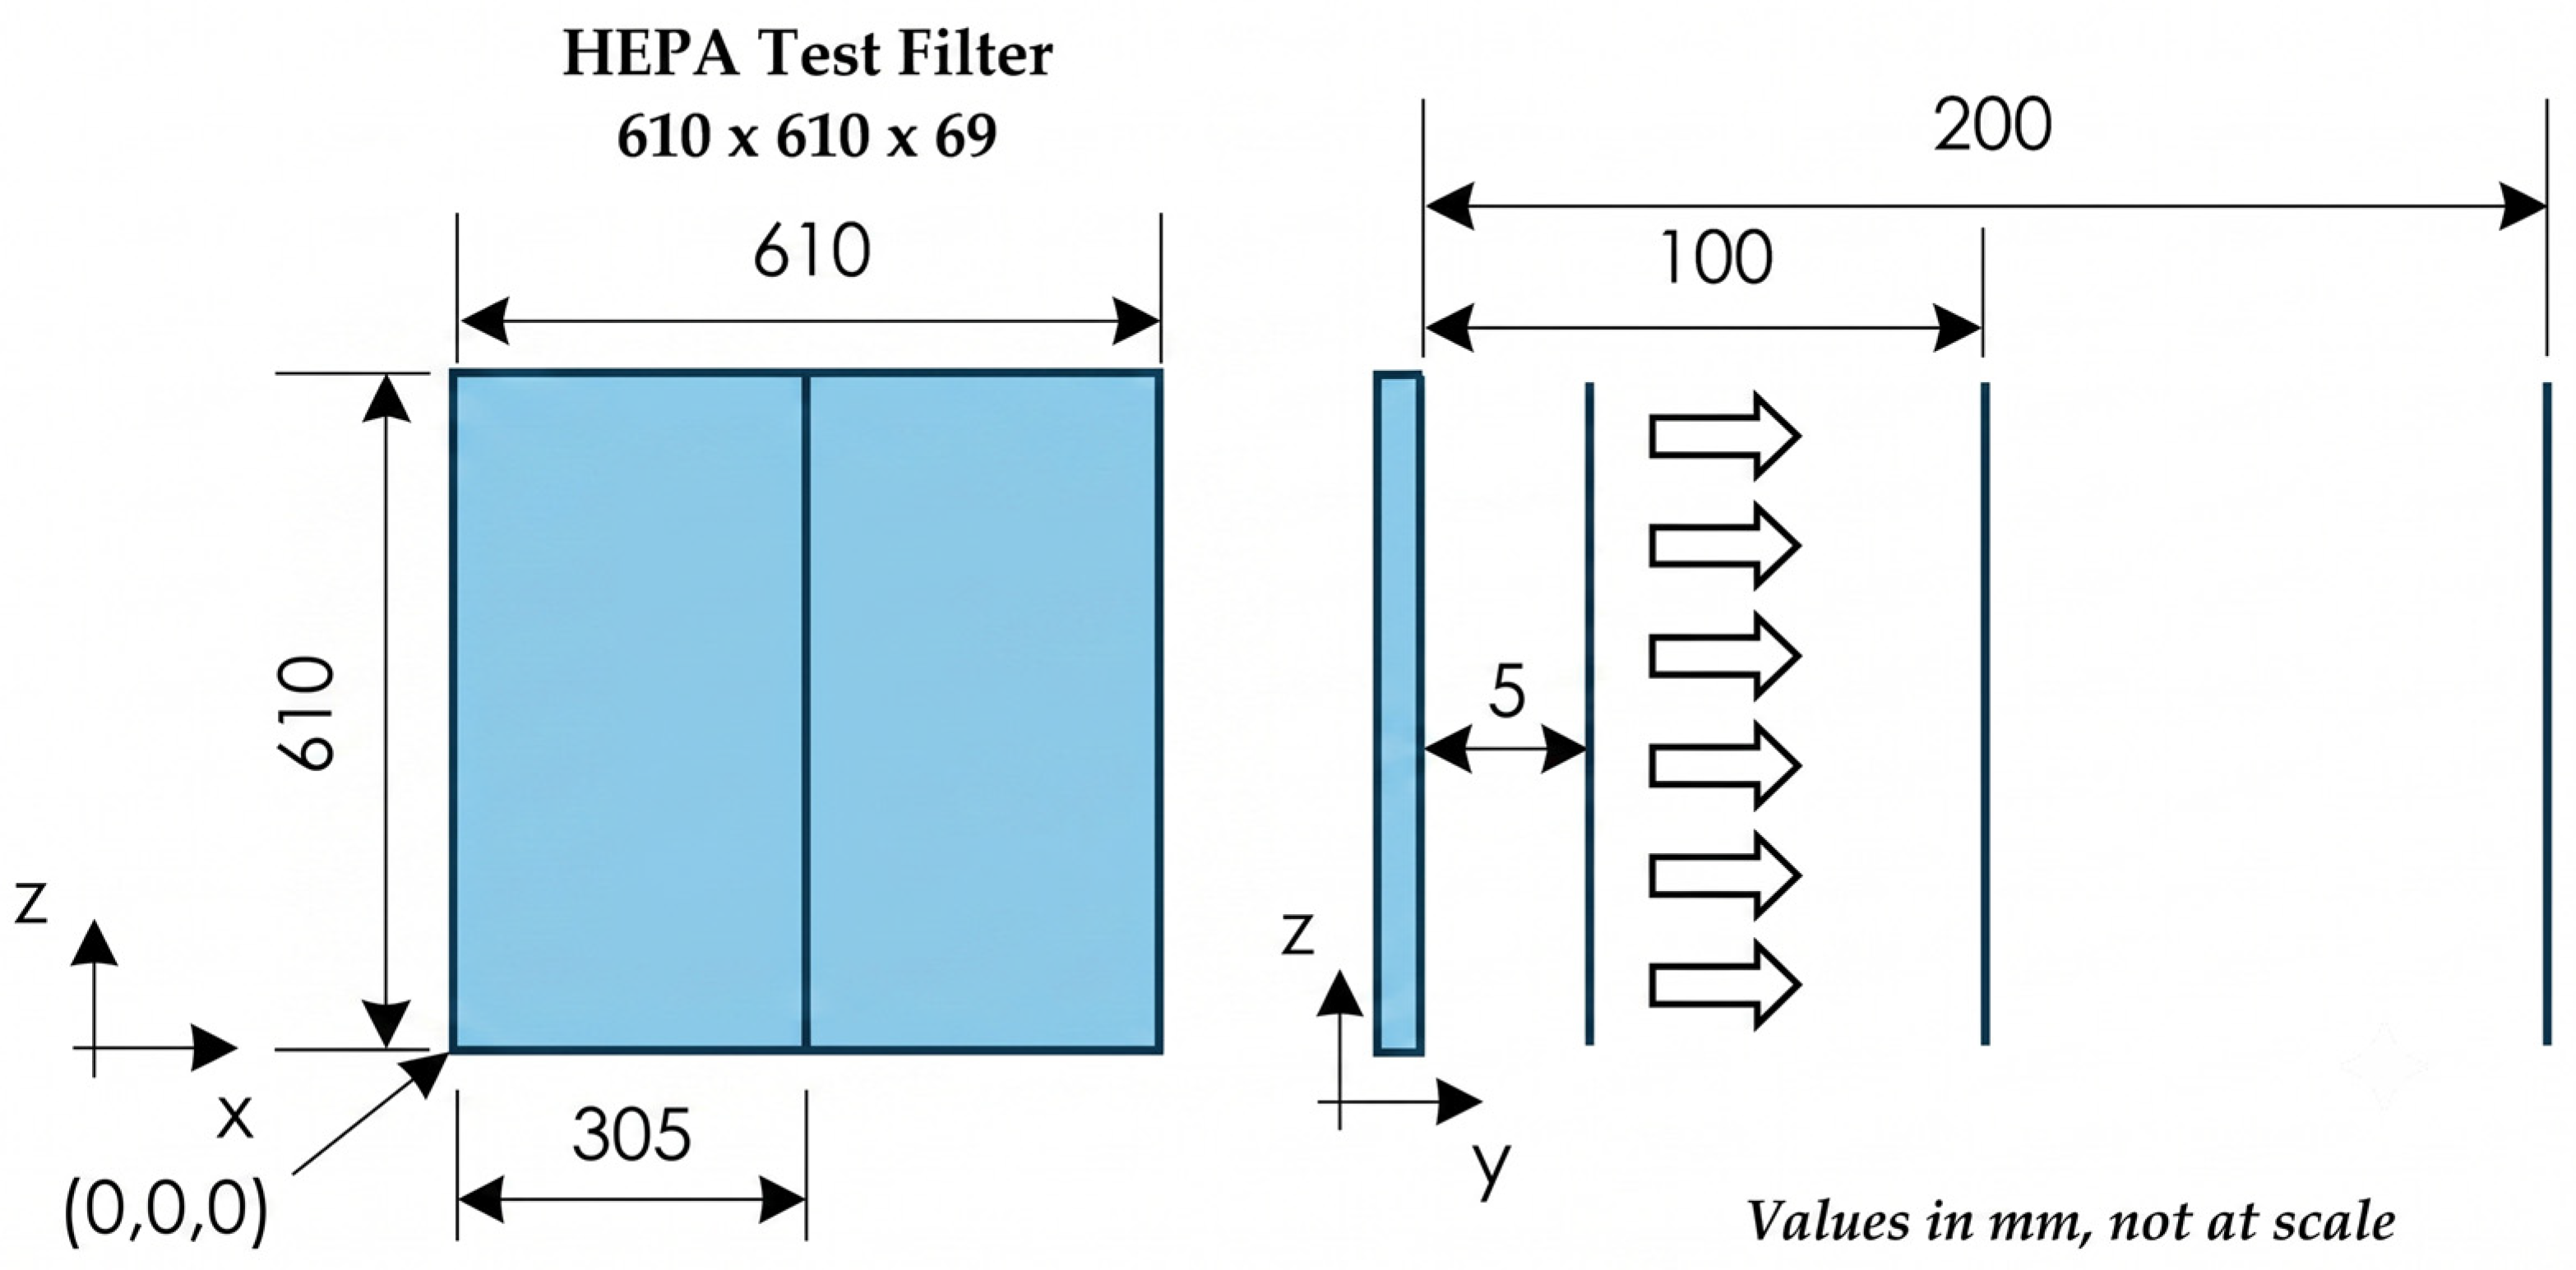
The spatial domain and coordinate origin (0, 0, 0) of the experimental model are illustrated in Figure 8. Outlet velocity profiles were acquired across multiple z coordinates at the central cross-section of the filter x = 305 mm, evaluated across three discrete offset positions along the y-axis (5 mm, 100 mm, and 200 mm), and z values were taken at 10 mm intervals, plus before and after the hot-melt, perpendicular to the filter outlet face, as detailed in the subsequent section. We used a 20 s sampling duration and a 1 Hz frequency setup, resulting in 61–70 spatial measurements, depending on whether or not the hot-melt matches the 10 mm interval. A differential manometer and an anemometer were used to prevent intrusive probe interference and flow field disruption in the near-wall region (especially at y = 2 mm and y = 5 mm), and the anemometer probe stem was oriented parallel to the hot-melt lines, keeping the sensor element minimally intrusive relative to the local boundary layer.
Figure 8.
Measurement grid, where the coefficient of variation, CV (%), equals STD/Uave × 100, with STD being the standard deviation and Uave the average velocity.
2.2.3. Experimental Procedure
Following a methodology previously benchmarked by the authors [19], the experimental sequence was carried out as follows:
- The filter element was properly positioned within the test housing and inspected for frame leakage. Installation integrity was formally verified via a localized leak test in accordance with EN 1822-1 [5];
- The variable speed fan was adjusted until achieving the nominal volumetric airflow rate of 600 m3/h (0.167 m3/s, corresponding to a frontal velocity of 0.45 m/s);
- The system was operated for 15 min prior to recording to reach thermal and fluid-dynamic equilibrium;
- Differential pressure (ΔP) and velocity profiles (U) were logged across n = 4 independent measurement series. To ensure objective data treatment, no observations were manually excluded. All recorded series (n = 4) were subjected to Grubbs’ test at a significance level of α = 0.05 to detect potential statistical outliers. No data points exceeded the critical threshold (Gcrit = 1.481 for n = 4, α = 0.05); therefore, all four repetitions were retained for statistical processing. For each location and parameter, the arithmetic mean (), sample standard deviation (S), and 95% confidence intervals (95% CI) were computed as follows:where t0.025,3 = 3.182 is the Student’s t-factor for three degrees of freedom. The individual measurements across the n = 4 independent experimental series, along with their corresponding mean values, standard deviations (S), and 95% confidence intervals (95% CI), are summarized in Table 1. To ensure data integrity and avoid arbitrary trimming, no raw observations were manually removed. Applying Grubbs’ test at a significance level of α = 0.05 [28] confirmed that no statistical outliers were present (Gcalculated < Gcritical = 1.463); therefore, 100% of the recorded data were retained for statistical processing.
Table 1.
Measurement instrumentation, statistical metrics (n = 4 independent series), and uncertainty evaluation for the reference H14 filter under nominal operating conditions (ΔP = 120.00 Pa).
2.2.4. Uncertainty Analysis
Measurement uncertainties were evaluated in accordance with the ISO/IEC Guide to the Expression of Uncertainty in Measurement (GUM) [29], accounting for both systematic instrument limitations (Type B) and experimental repeatability across the n = 4 independent measurement series (Type A). For differential pressure, the digital manometer features a nominal accuracy of ±1% FS (range 0–1000 Pa, 1 Pa resolution). To eliminate potential off-scale systematic bias in the lower operating regime (0–200 Pa), zero-point calibration and span verification were performed prior to each test run using a reference micromanometer, reducing the calibrated Type B standard uncertainty to . Type A random uncertainty was derived from time-averaged logging across all n = 4 unadjusted series, yielding a standard error of the mean . Combining both components yields a combined standard uncertainty . Applying a coverage factor k = 2 provides an expanded uncertainty U95 = ±2.02 Pa. Relative to the baseline filter pressure drop (ΔP = 120.00 Pa), this corresponds to an expanded uncertainty of ±1.68%, fully verifying the claimed sub-2% threshold. Scenario 1’s actual input values are those shown in Table 2 rather than the significantly modifie5d theoretical initial values.
Table 2.
Actual parameters of the selected filter model.
All elements bonded to the filter media provide rigidity, tightness, and other functions, such as the defining cells in hot-melt lines and the adhesive along the filter frame’s perimeter. Given the direct coupling between the hydraulic diameter (Dh), friction factor (f), and pressure loss (ΔP), nine complementary operational scenarios were analyzed to assess how scaling Dh influences system hydraulics. This parametric study aims to establish the optimal geometry that minimizes total ΔP, formulated as the combined contribution of pressure drops across the filter medium and along the flow channel.
This variation in Dh is achieved by modifying the input variables W, Hi, and L through a reduction in the number of hot-melt lines and pleat depth, without altering the external filter thickness (69 mm aluminum profile), meaning that a pleat height of 55 mm is not exceeded, so as to not modify the external filter’s structure/dimensions. Input variable values selected for ten scenarios are shown in Table 3. Scenario 1 is the characteristic starting point for the chosen filter. The Ui values result from changes in the effective surface area of the cell, determined by W and Hi.
Table 3.
Inlet conditions. Scenario 1 corresponds to initial conditions.
2.3. Mathematical Calculation of the Pressure Drop per Hot-Melt Cell
The formulation presented herein is employed to determine the various parameters characterizing each of the predefined scenarios analyzed in this study: velocity values through the channel and across the media, the differential flow rate balance, friction factors, pressure drops caused by frictional components (porous filter media), filtration related parameters (viscous friction within the channel), and the total pressure drop (obtained from the combined contribution of filtration and channel friction effects) based on the selected input parameters. This process is repeated for each scenario.
2.3.1. Entry Conditions for Scenario 1 [19]
- Across the media ;
- Inlet velocity ;
- Media thickness ;
- Permeability ;
- Air at 20 °C , ;
- Environmental pressure pexterior = 0;
- The side walls of the channels were completely sealed with hot-melt adhesive. Consequently, the airflow was restricted to a single discharge route through the permeable upper and lower walls along the wedge-shaped passage, with zero outflow occurring through the downstream apex.
2.3.2. Geometry and Boundary Conditions
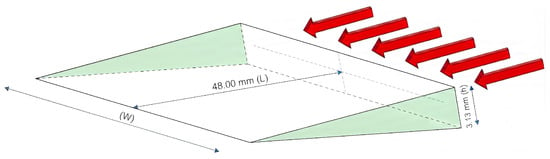
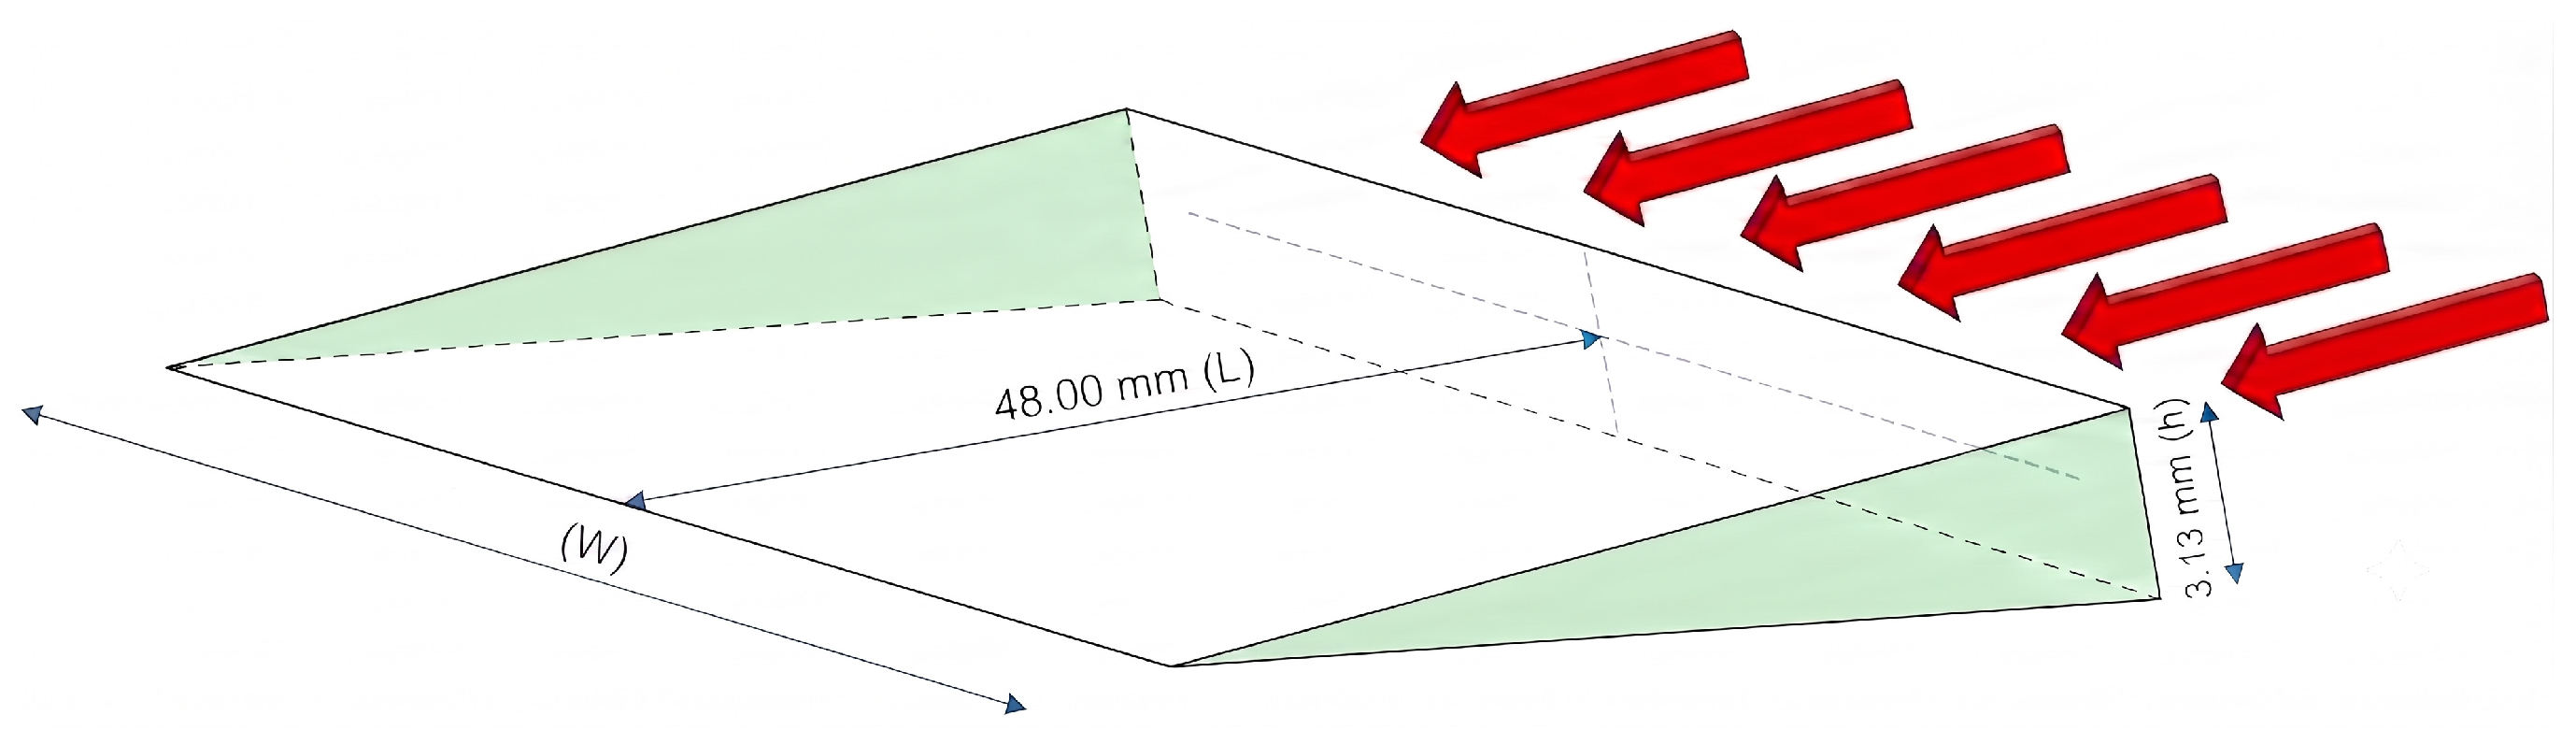
Below, Figure 9 shows a simplified schematic of a hot-melt cell alongside its initial values and boundary conditions. The analysis will demonstrate how variations in (W) govern the fluctuations in ΔPtotal.
Figure 9.
Three-dimensional schematic of an individual hot-melt cell.
where:
- x: axial coordinate along the wedge (m), x ∈ [0,L];
- W: wedge’s local width (m);
- H(x): wedge’s local height (m);
- Hi: wedge’s initial height (0.00313 m).
Decreasing geometry (decreasing height):
Entry Area:
Entry Airflow (at average velocity):
Boundary conditions:
Residual axial flow rate:
Average axial velocity:
2.3.3. Pressure Drop Across the Media
Differential flow balance (two porous walls):
Filtration (Darcy’s law) through the media (normal to the wall):
2.3.4. Pressure Drop Due to Internal Friction Through the Channel
Darcy–Weisbach [30,31] (differential form, developed flow):
Reynolds:
Friction factor (Fanning–Darcy) [31]):
For a channel where (high aspect ratio, ), can be approximated as . For this type of flat cross-section, the laminar constant is . Substituting y :
Fluid acceleration through the convergent inlet and deceleration through the divergent outlet remain minimal due to continuous airflow permeation across the porous medium (mass conservation). Incorporating this mass conservation along the permeable channel, the local flow depletion and geometric convergence yield the axial velocity profile . Here, equals until reaches its maximum value, at which point the volumetric flow rate drops to zero () and the axial velocity consequently vanishes (). Because air suction through the media counterbalances the cross-sectional reduction, the axial velocity remains nearly uniform () along , justifying the integration of channel friction losses. Consequently, the inlet velocity is assumed constant to simplify the governing model, leading to the integration of the governing equation:
- Integration limit values
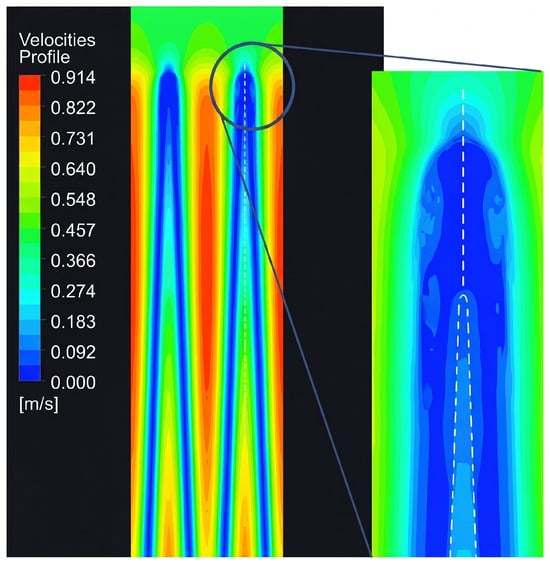
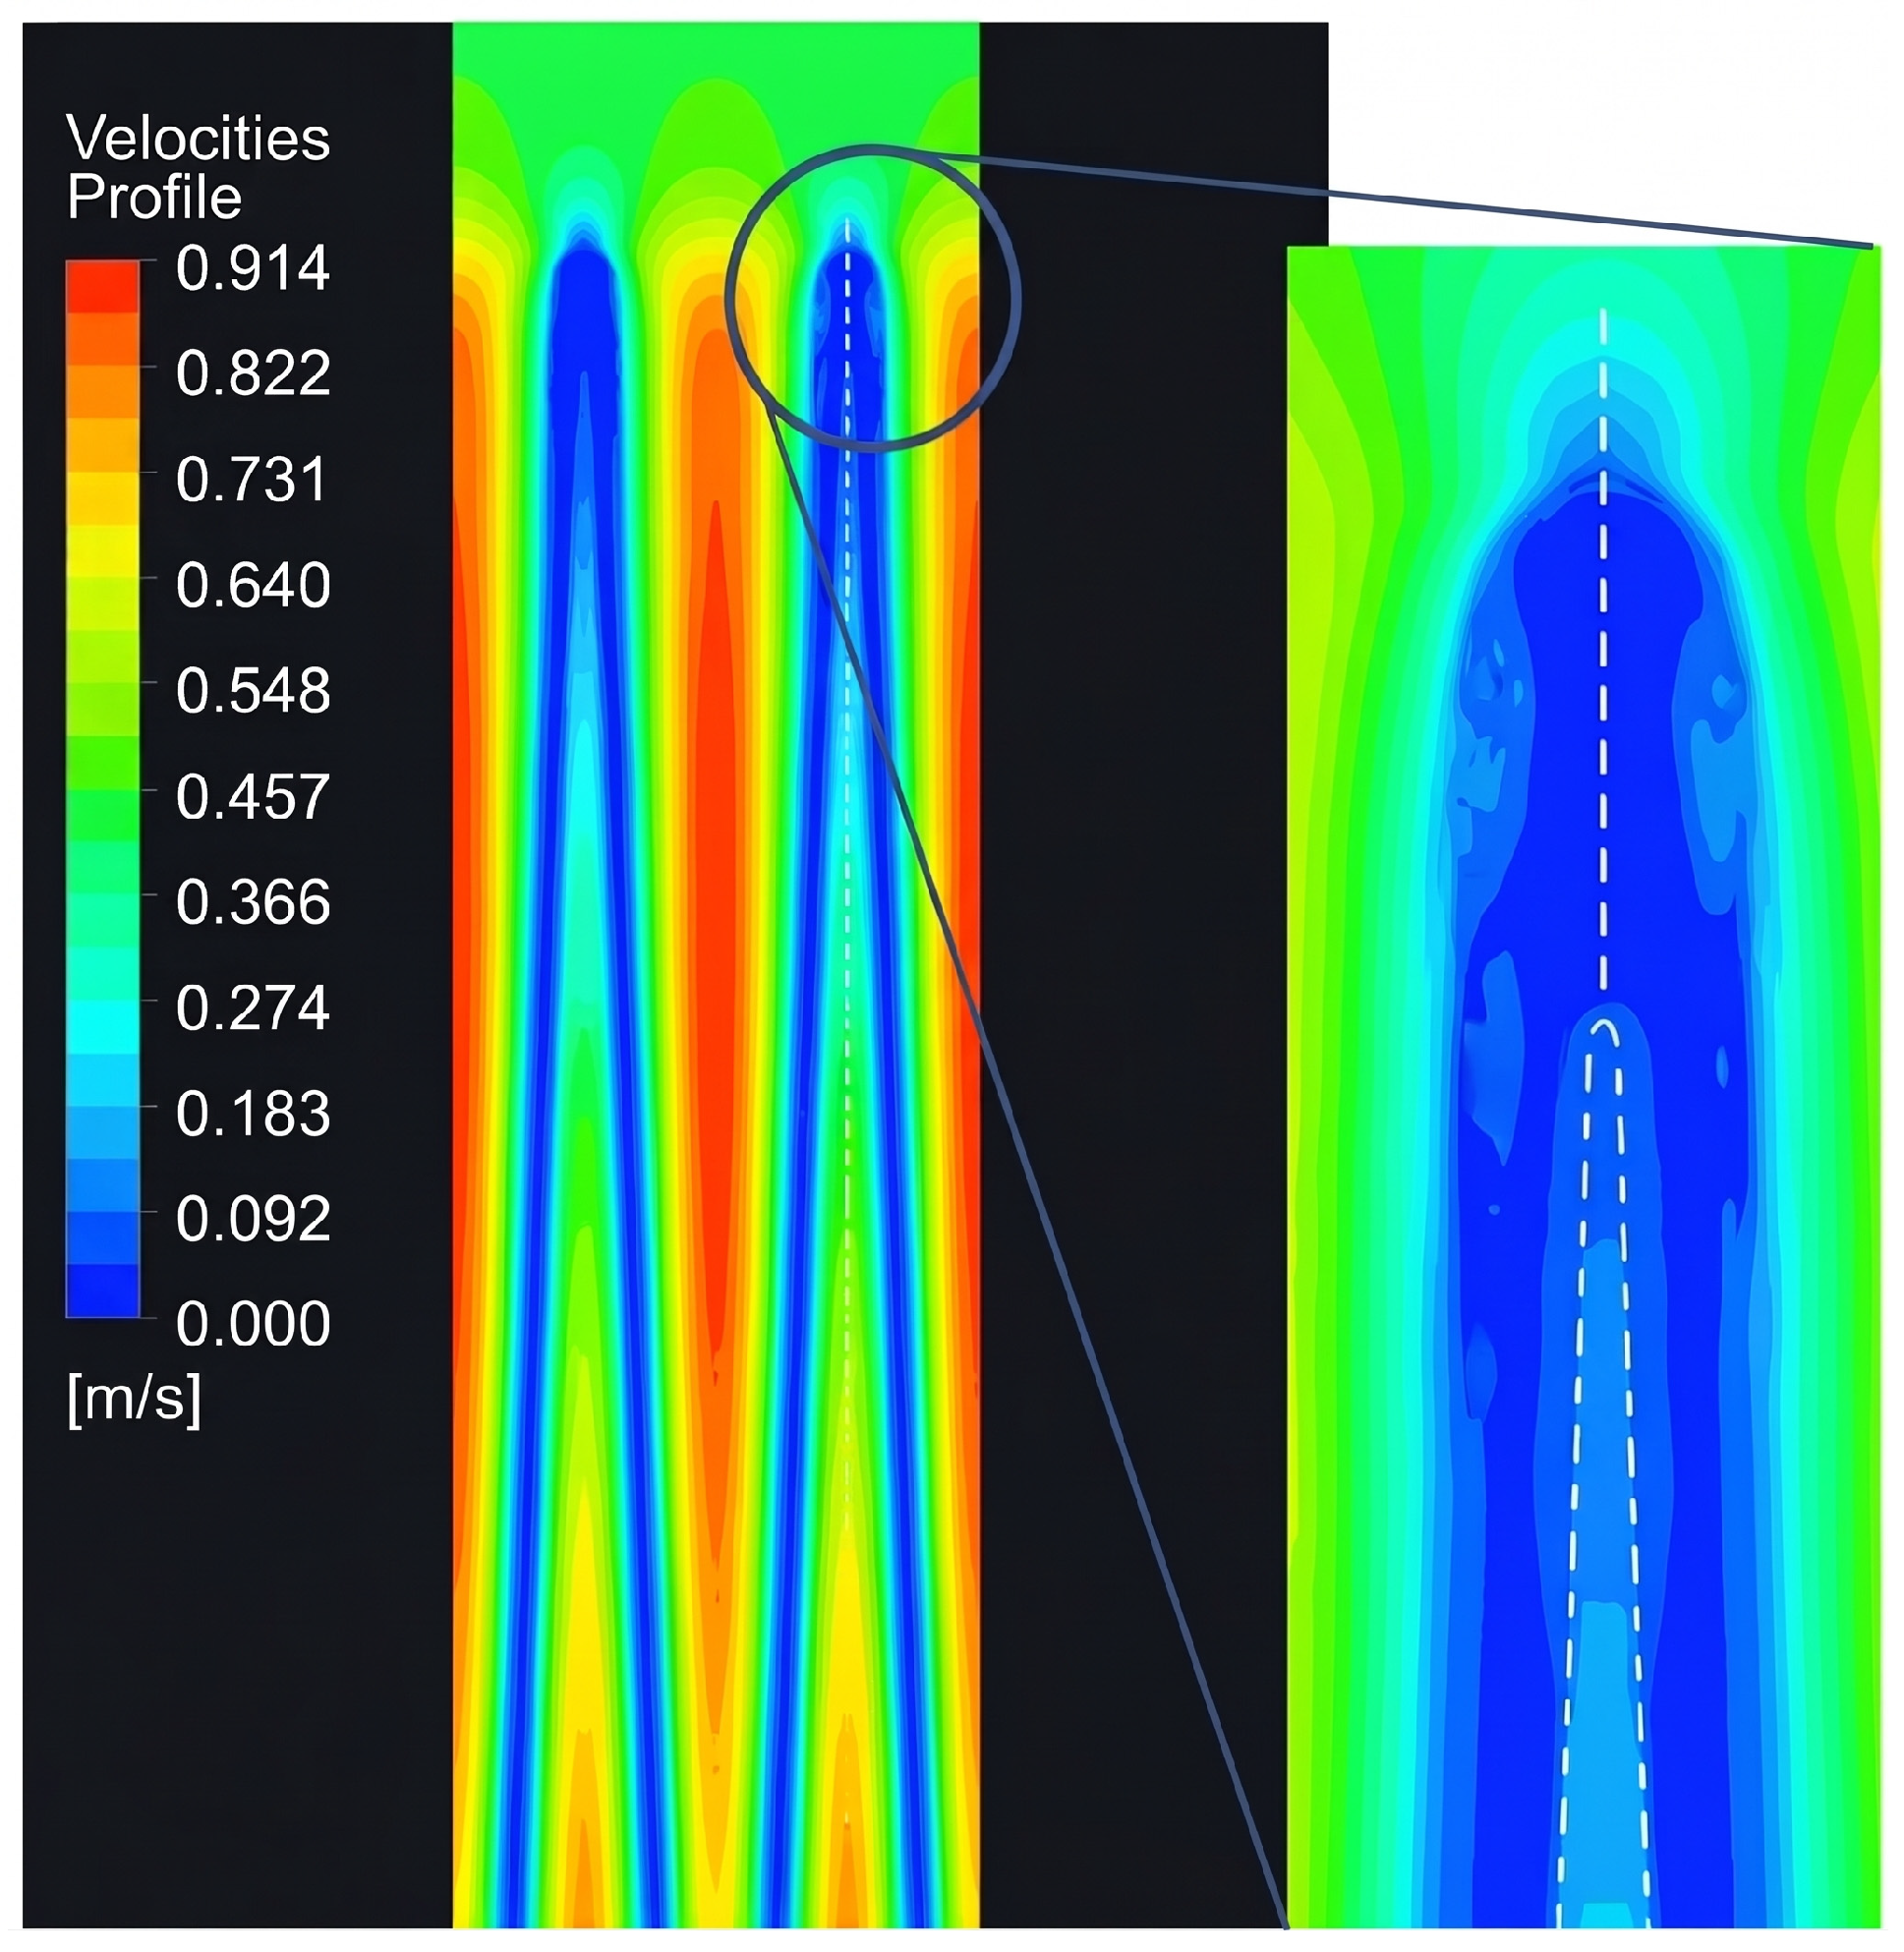
To evaluate the effective pleat length, three-dimensional laminar CFD simulations were performed using ANSYS Fluent 2023 R2. The fluid domain was discretized into 1.35 × 10⁶ hexahedral cells with near-wall boundary layer refinement (). Boundary conditions comprised a velocity inlet (0.5398 m/s), pressure outlet (0 Pa), and a porous zone defined by Darcy permeability (k = 1.247 × 10⁻¹² m2). The computed flow field revealed a low-velocity, localized stagnation region directly beneath the internal pleat vertex. As illustrated in Figure 10, this zone extends over 0.0048 m, corresponding to of the total pleat length (L = 0.048 m) due to local fiber compaction and breakage without triggering vortex formation or recirculation dynamics. Consequently, this non-functional region becomes effectively impermeable. Identifying this 0.10L stagnant zone was crucial for establishing the proper integration limits. If the pressure integral were calculated over the entire pleat length, the mathematical pressure would approach infinity near the vertex due to the lack of an outlet.
Figure 10.
CFD image to identify velocity evolution with no existing vortex.
This effect extends through the pleat for several millimeters, reducing the effective pleat length (Leff) to only 0.04320 m. Consequently, the limits of integration are established between 0 and 0.04320 m.
2.3.5. Total Average Pressure Drop
Therefore, pressure drops for initial values (Scenario 1) are shown in Table 4.
Table 4.
Scenario 1 pressure drops.
3. Results
This section evaluates the observed airflow behavior within the channel and benchmarks the experimental findings against established theoretical models. The physical significance of these results is interpreted by contrasting empirical data with the published literature, thereby validating the proposed methodology and delineating the boundary conditions of the adopted approximations. Discrepancies relative to idealized models are examined and attributed to channel geometry, cross-sectional variations, and incomplete flow development. Furthermore, the analysis assesses how these phenomena influence frictional pressure drop and evaluates the applicability of conventional friction factor correlations.
3.1. Velocity Measurements, Values, and Profiles
Airflow velocity exhibits strong heterogeneity near the filter surface, which diminishes rapidly with distance. Cell geometry, particularly W, Hi, and the hydraulic diameter, determines most of the pressure drop. Among the scenarios evaluated, the optimized configuration achieves an important reduction in total ΔP, improving filter efficiency from an energy saving perspective.
- Measurement with a fixed x value (305 mm)
The following effects on air velocity were measured as a function of distance on the filter surface, as indicated above.
- Nominal velocity: 0.45 m/s;
- Measuring distance: x = 305 mm.
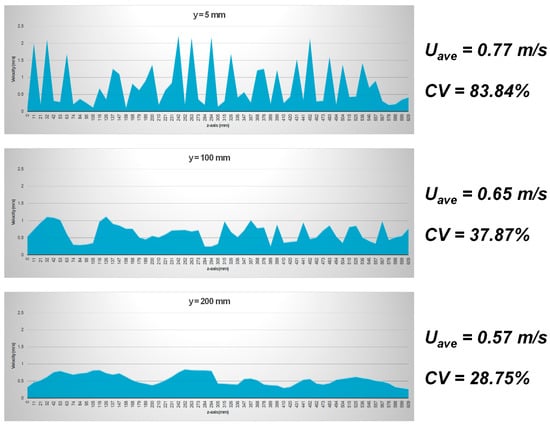
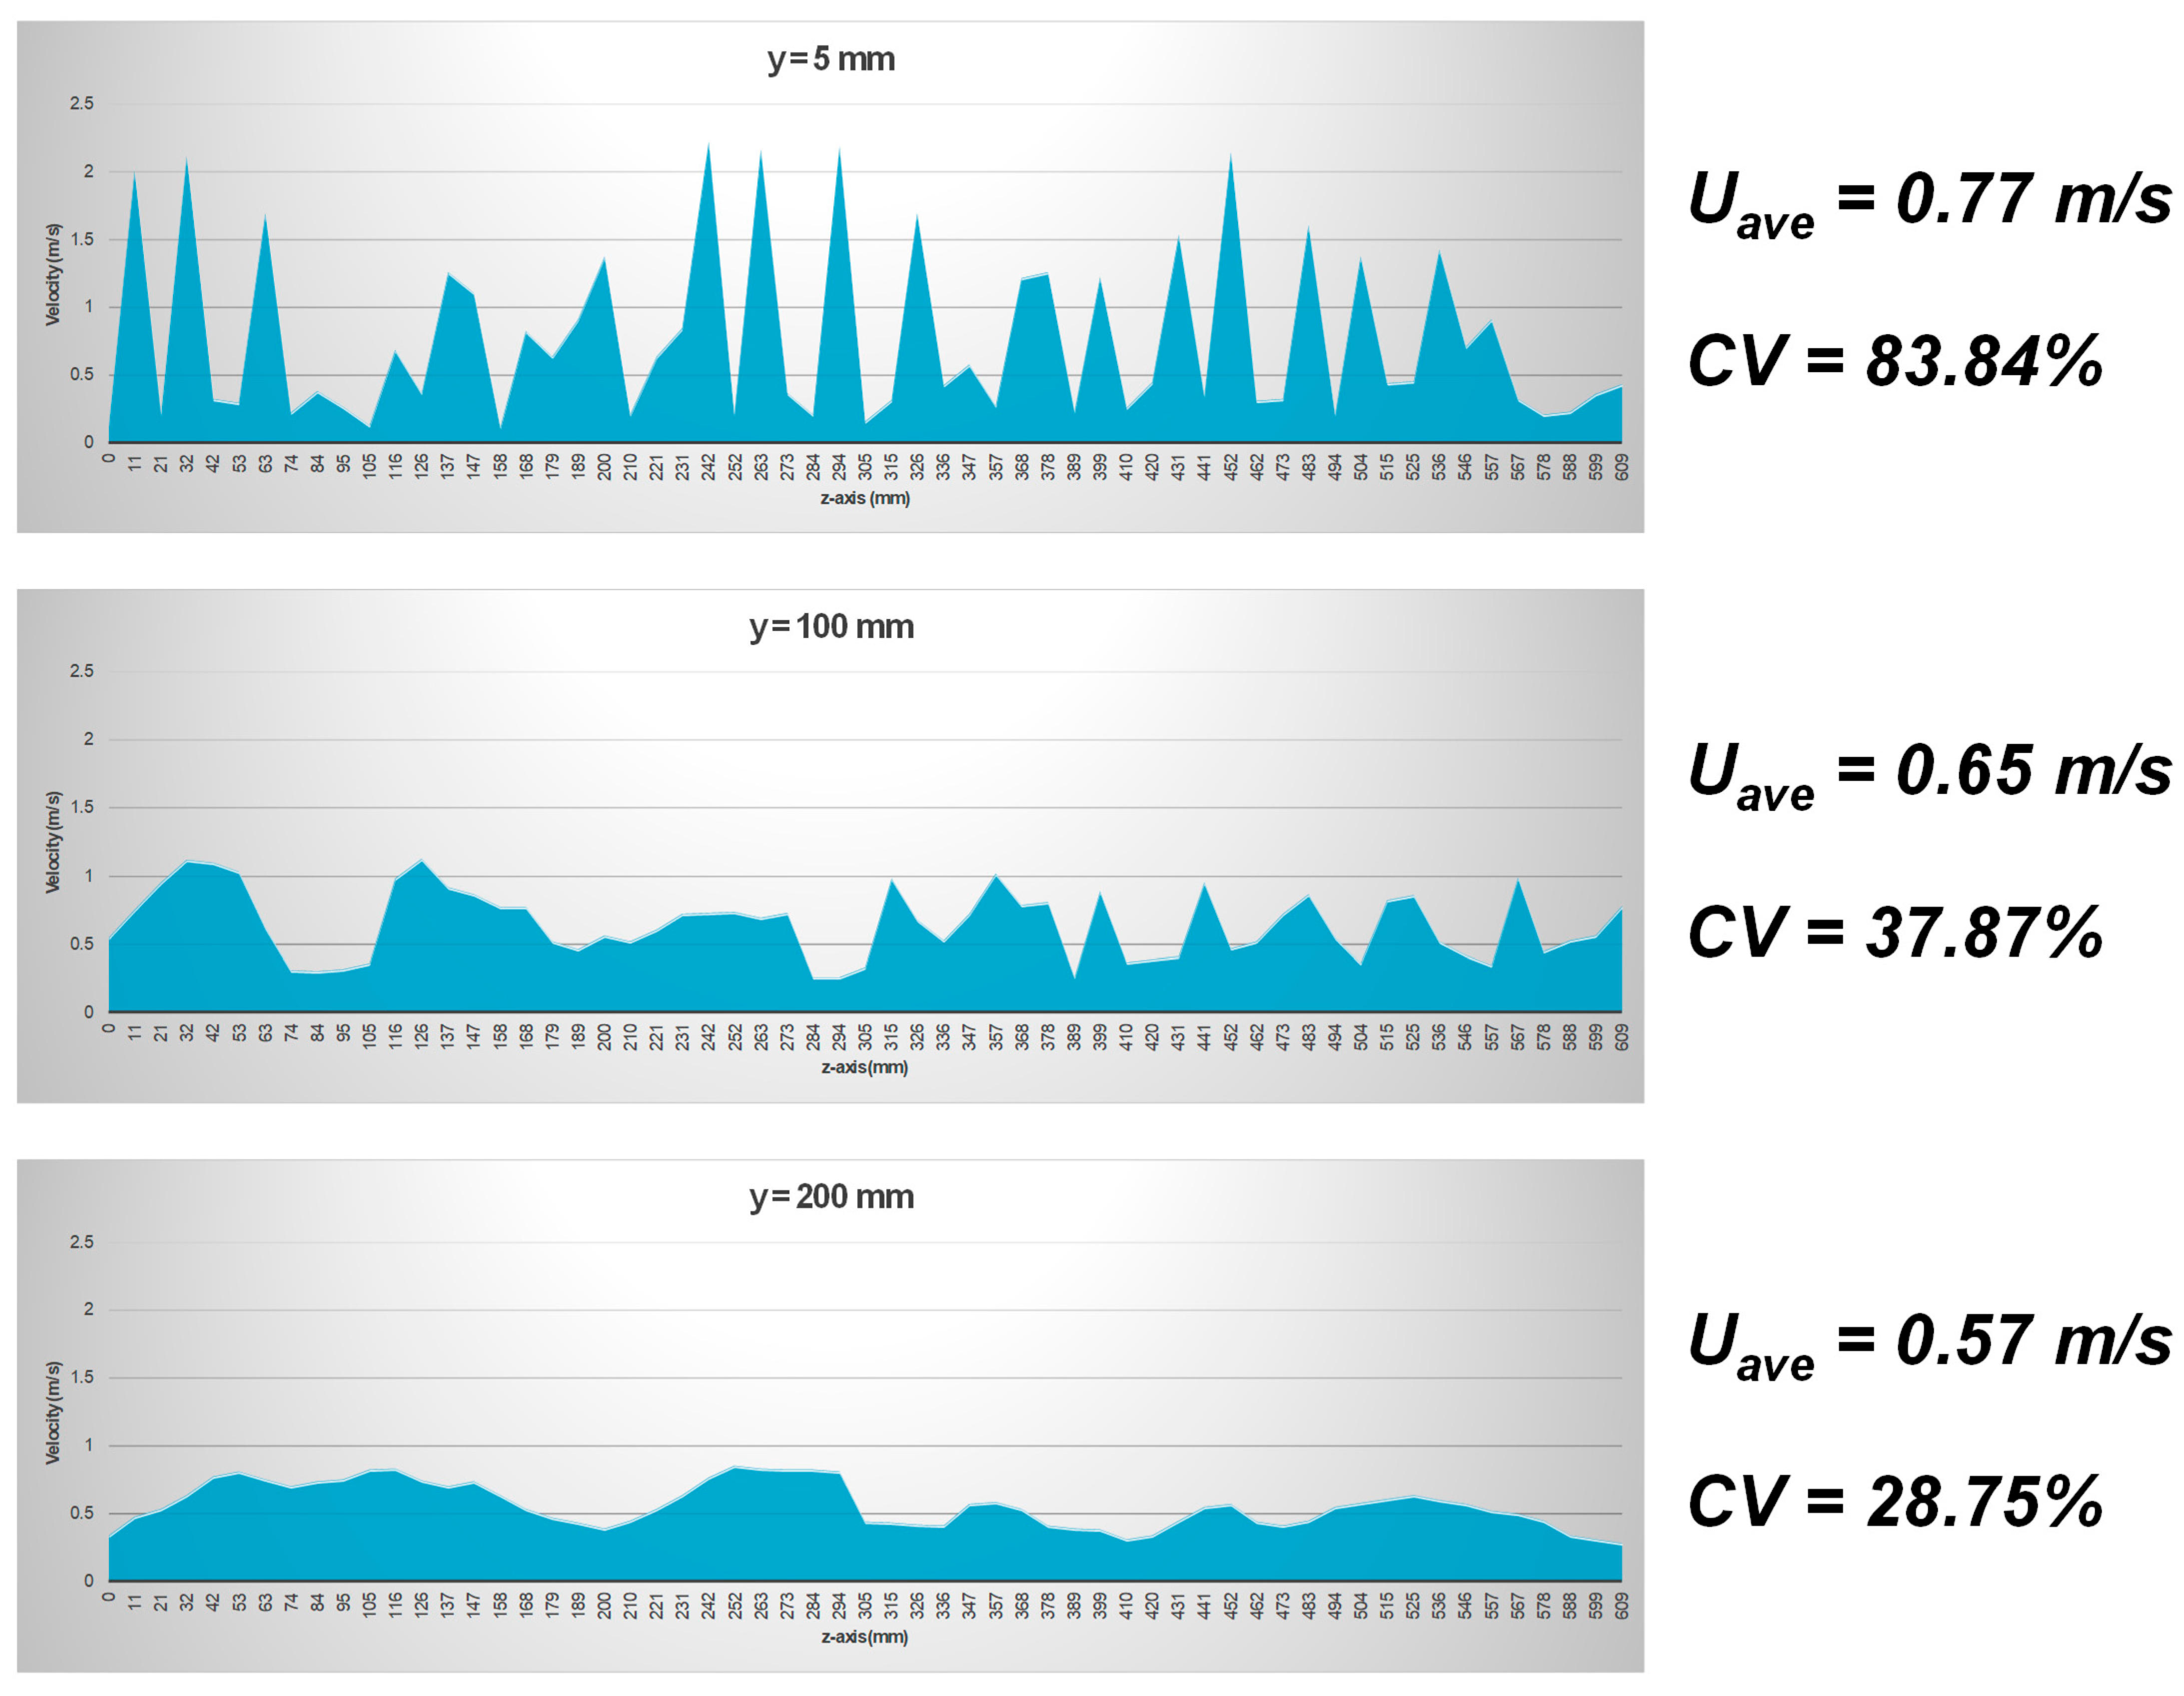
These measurements show that, at a short distance from the filtering surface (5 mm), the flow rate distribution displays very high dispersion; the coefficient of variation exceeds 80% (CV = 83.84%). However, as the distance from the surface increases, dispersion decreases markedly, reaching a CV of 28.75%, as observed in Figure 11. This indicates that velocity variation along the z-axis is significantly reduced, becoming much more homogeneous. Given the high dispersion observed at a short distance of 5 mm, this was specifically investigated more closely (y = 2 mm). Figure 12 presents a more detailed analysis.
Figure 11.
Velocity along the filter’s Z-axis.
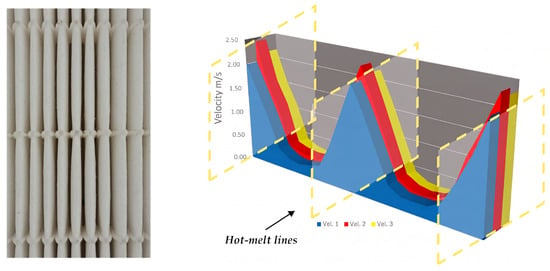
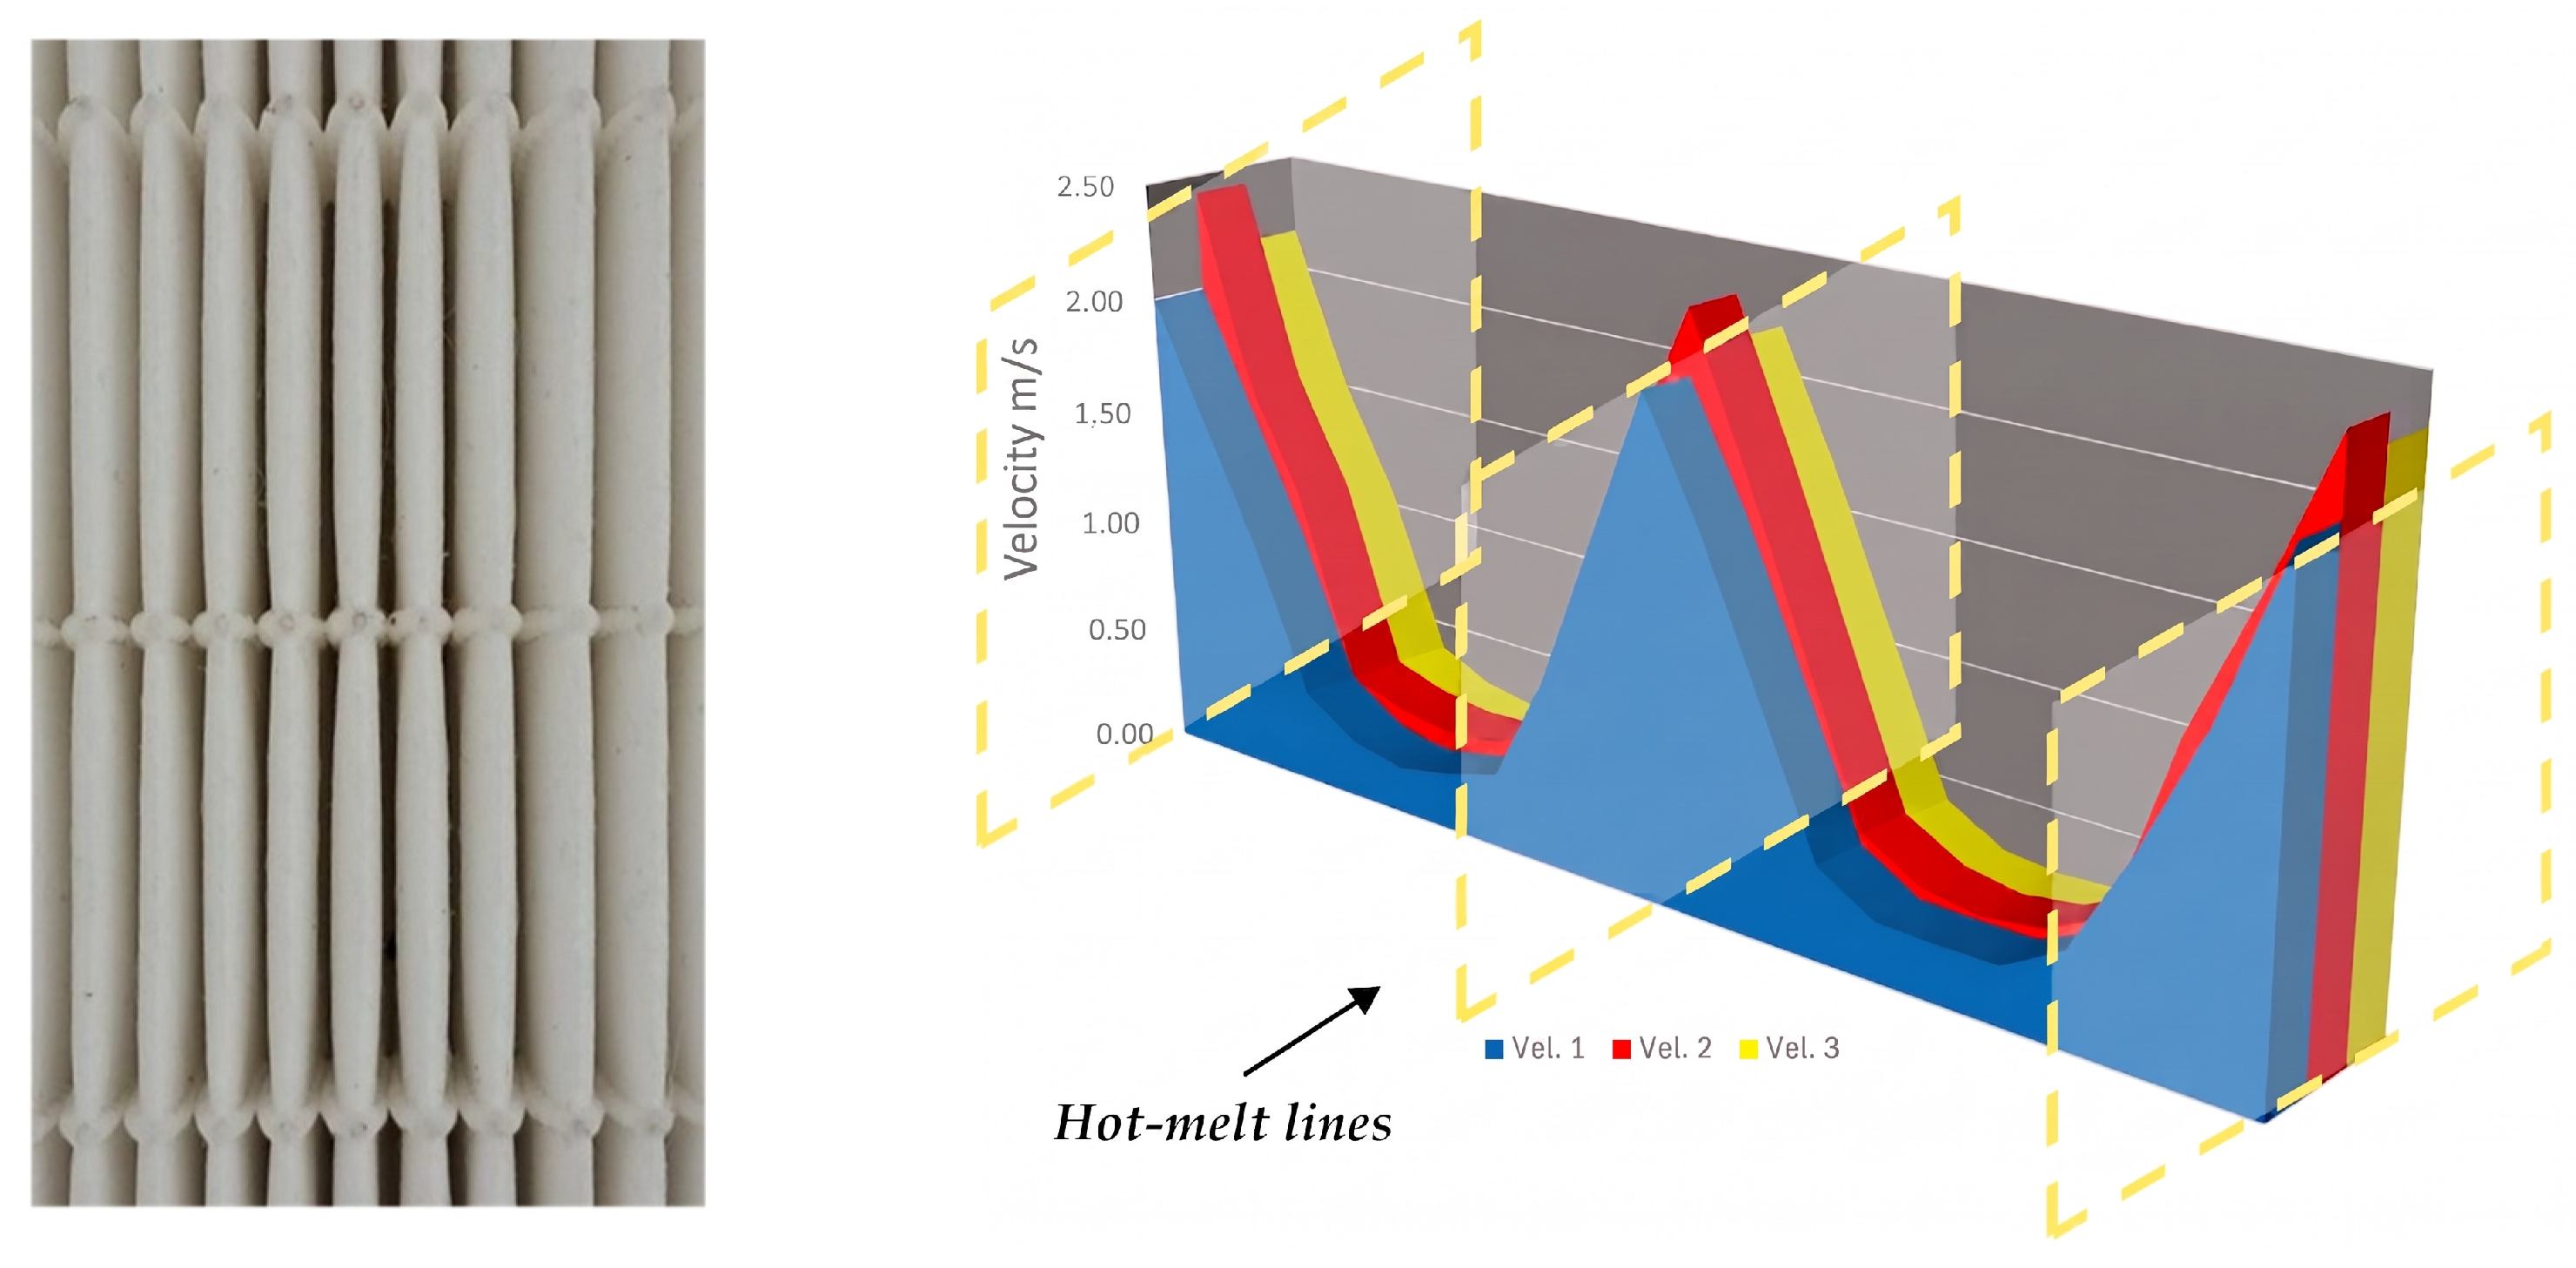
Figure 12.
Output velocity profile at Y = 2 mm, 3 measurements.
Figure 12 presents a 3D velocity profile representation at a distance of y = 2 mm, with z varying between 0 and 610 mm, while maintaining a constant inlet velocity and measurement points. It reveals the airflow behavior in this critical region more clearly. The velocity profile reflects a behavior that is difficult to predict using mathematical modeling, as it results from the three phenomena generated by the geometry and nature of the pleated filter medium: the convergent, nozzle-like effect at the pleat entrance; the divergent outlet effect (geometry); and the Darcy effect [26,27] through the porous medium (nature). The convergent and divergent effects are strongly influenced by the angle, which is identical at the inlet and outlet (initially 3.73°) and varies across the scenarios assessed. Returning to our definition of the cell, whose initial useful dimensions are known (3.13 mm in height along the y-axis and 23.8636 mm in width along the x-axis), a third dimension must be incorporated along the z-axis, where the least-understood aspect of the flow behavior appears. This dimension, perpendicular to the plane and towards its interior, is the airflow direction, named pleat length or depth. Figure 12 also shows the cross-section between two hot-melt beads, which allows the airflow to be described within a channel whose width is completely confined laterally, thereby eliminating any hydraulic interaction between adjacent cells. In laminar flow, wall roughness scarcely affects airflow development [7], even when combining materials of quite different textures, such as the fiberglass filter media (a porous textile) and hot-melt, a hardened polymer with irregular roughness. The inlet velocity profile is a typical short-developed parabolic distribution, consistent with the near absence of boundary-layer effects under extremely low velocity conditions (0.5398985 m/s in this case). Along the pleat, the profile progressively deforms in the axial direction, adopting a wedge-like shape; however, this growth is constrained by the increase in the effective filtration area, an aspect examined in greater detail later on. The channel geometry behaves as a micro-nozzle, which makes the calculation of the cell hydraulic diameter (Dh), defined by the hot-melt, highly significant. Given that the width (W = 0.0238636 m) exceeds the inlet height (Hi = 0.0031277 m) by a factor of 8, the quasi-flat rectangular channel approximation Dh ≈ 2Hi [6] could be applied. Nevertheless, this simplification will be compared with the formal calculation based on the channel’s actual geometry to determine its validity for this type of pleat. Finally, the pressure gradient cannot be considered constant along the channel owing to the nozzle effect, which locally accelerates the flow and induces an associated pressure drop. However, the extremely small velocities involved introduce significant uncertainty in its quantification, requiring specific treatment. As mentioned above, the outlet generates a different profile due to the compensation between pressure and velocity at the inlet and outlet, considering that the outlet pressure is, in principle, atmospheric. If the air flows inside the wedge, as is indeed the case, the wall’s normal velocity Uw(x) depends on the internal pressure gradient and on the design of the holes or pores (the latter are considered fixed and non-modifiable, as they are defined by the permeability of the medium). The flow inside the wedge experiences a pressure drop as it progresses, meaning that the internal pressure decreases downstream, according to Darcy. This implies that velocity through pores also tends to decrease, such that the velocity Uw(x) at each pore is approximately proportional to the pressure difference between the interior and the exterior (ambient pressure) [7]:
Since p(x) decreases with distance, Uw naturally decreases downstream in the same manner. The resulting composite figure, combining inlet and outlet behavior and based on the discussion thus far and on the laboratory measurements, is obtained by superimposing inlet and outlet profiles, as shown in Figure 13.
Figure 13.
Input/output velocity profile simulation.
This inverted paraboloid shape at the outlet exhibits a profile that will eventually return to the initial (inlet) velocity of 0.45 m/s but requires a “considerable” distance to do so, given that the regions closest to the hot-melt, above and below the outlet in the upper image, reach velocities that are four to five times greater. The image shows both profiles, inlet and outlet, to facilitate a clearer understanding of the airflow effects. This effect shows that an undesired increase in velocity occurs between and close to the hot-melt lines. Therefore, this result suggests that increasing the spacing between these lines will reduce their number and, consequently, the frequency with which this phenomenon is repeated. In turn, this reduction will help to minimize the friction factor, which is inversely proportional to the hydraulic diameter, according to the following:
However, the resulting values are non-uniform across the channels, giving rise to additional pressure losses attributed to several phenomena previously reported by the authors in related work on air filter geometry optimization [19]:
- In/Out effect
These phenomena play a particularly significant role in modifying the total pressure drop, which can be formulated as follows:
- Non-homogeneous flow field
Flow allocation across individual channels is inherently non-uniform, leading to inter-channel variations in volumetric flow rate and local velocity. Owing to the strong non-linear dependence of pressure drops on velocity, this spatial maldistribution impairs the overall flow utilization relative to theoretical predictions.
- Channel convergence and associated wedge behavior
Although minor in magnitude, this effect is practically unavoidable, as it stems from convective acceleration driven by the progressive reduction of the channel cross-section along the pleat length.
- Three-dimensional hydraulic losses attributable to geometric irregularities
Finally, structural deviations stemming from non-uniform pleat volumes introduce complex secondary flows, resulting in additional three-dimensional pressure losses.
These individual contributions were quantified experimentally using a reference filter operating at a baseline pressure drop of 120 Pa, yielding the empirical adjustment factor (fcp) [19], which is applicable to both the filter medium and the channels. Experimental trials involving distinct pleat geometry angles with uniform media properties yielded consistent results. Calibration against the benchmark H14 filter produced a consolidated empirical correction factor of fcp = 1.038. This parameter encapsulates the combined effect of the four unmodeled physical mechanisms, and its formulation is expressed as:
where:
- = 1.011;
- = 1.011;
- = 1.009;
- = 1.007.
Leading to
This model operates on the principle that these four corrective phenomena systematically impact air permeability through the filter substrate, leaving channel friction largely unaffected. The uncorrected media pressure-drop formulation hinges upon three idealized parameters:
- The net active filtration surface;
- Airflow distribution uniformity;
- Uw (airflow velocity across media).
Since each mechanism directly invalidates these simplified premises, the overall adjustment coefficient () is incorporated into the media contribution equation:
On the other hand, the primary hydrodynamic phenomena inside the channel are explicitly resolved by incorporating:
- Dh variations;
- Re dependence;
- Darcy–Weisbach friction factor formulations;
- Channel profiles (converging–diverging).
As a result, only a minor fraction of the global adjustment factor is attributed to the channel pressure loss. Experimental tuning indicated that assigning approximately 0.9755% of the overall correction to the channel term yields optimal agreement:
This weighting reflects the physical fact that inlet/outlet effects, flow maldistribution, effective area reduction, and three-dimensional deviations primarily affect the porous media, whereas the channel pressure drop model already captures most of the relevant flow physics and therefore requires only a modest residual correction.
Consequently, the maximum deviation we could expect is 0.87% of the total pressure drop, which is quite a small value and will not modify the values achieved.
3.2. Mathematical Results for Scenario 1
A comprehensive comparison between raw analytical predictions, calibrated model predictions (fcp = 1.038), and experimental measurements for the reference H14 filter under nominal conditions of 600 m3/h and frontal velocity = 0.45 m/s has been elaborated upon for much easier analysis, as shown in Table 5.
Table 5.
Comprehensive comparison.
From the formulation and calculations section, the following results are derived, which we present in Table 6 below.
Table 6.
Results for Scenario 1, actual data from the selected filters.
3.3. Results of the Different Studied Scenarios
The variation of W and Hi modifies the number of pleats, hot-melt lines, and cells; thus, the airflow per cell is recalculated in each case by dividing the total airflow rate by the number of cells [19]. The wedge converges in height, meaning that the axial pressure gradient (due to friction) increases as the height decreases; simultaneously, the internal pressure diminishes towards the vertex, and the axial flow is depleted through filtration across the walls (with no outlet at the vertex). Darcy’s law [26] explains how the airflow through the filter is proportional to the internal pressure and is higher near the inlet, where p(x) is greater, and lower towards the vertex, where p(x) → 0. All results are shown in Table 7 and Table 8.
Table 7.
Input parameters for Scenarios 1 to 10. Scenario 1 corresponds to initial conditions.
Table 8.
Pressure drop results for Scenarios 1 to 10. Scenario 1 corresponds to initial conditions.
The decomposition of pressure drops into “channel” and “filter” components clarifies the energy balance; as it advances from the inlet to the vertex, each airflow portion leaving the channel loses part of its pressure due to axial friction, p(0) − p(x), and another part due to resistance within the porous medium, p(x); the sum of both contributions recovers the total loss, p(0).
Once these 10 (1–10) scenarios have been observed, it is time to analyze an additional 22 scenarios (1, 11–31) with no pleat variation (just modifying the number of hot-melt lines), thereby establishing a direct baseline comparison. To do so, the results are presented below in Table 9. Here, the number of pleats (188) is kept constant, along with Hi (pleat height, 0.00313 m) and L (pleat depth, 0.048 m), while only the number of hot-melt lines is varied, as this is the primary objective of the current study.
Table 9.
Constant number of pleats (188), Hi (pleat height, 0.00313 m), and L (pleat depth, 0.048 m).
4. Discussion
The unintended effect produced in each hot-melt cell is cumulative, as it arises in every existing cell and across the entire surface of the filter. This phenomenon results in a marked increase in the lateral regions of the velocity profile. It is also evident that the filtration velocity decreases as the depth of the pleat increases.
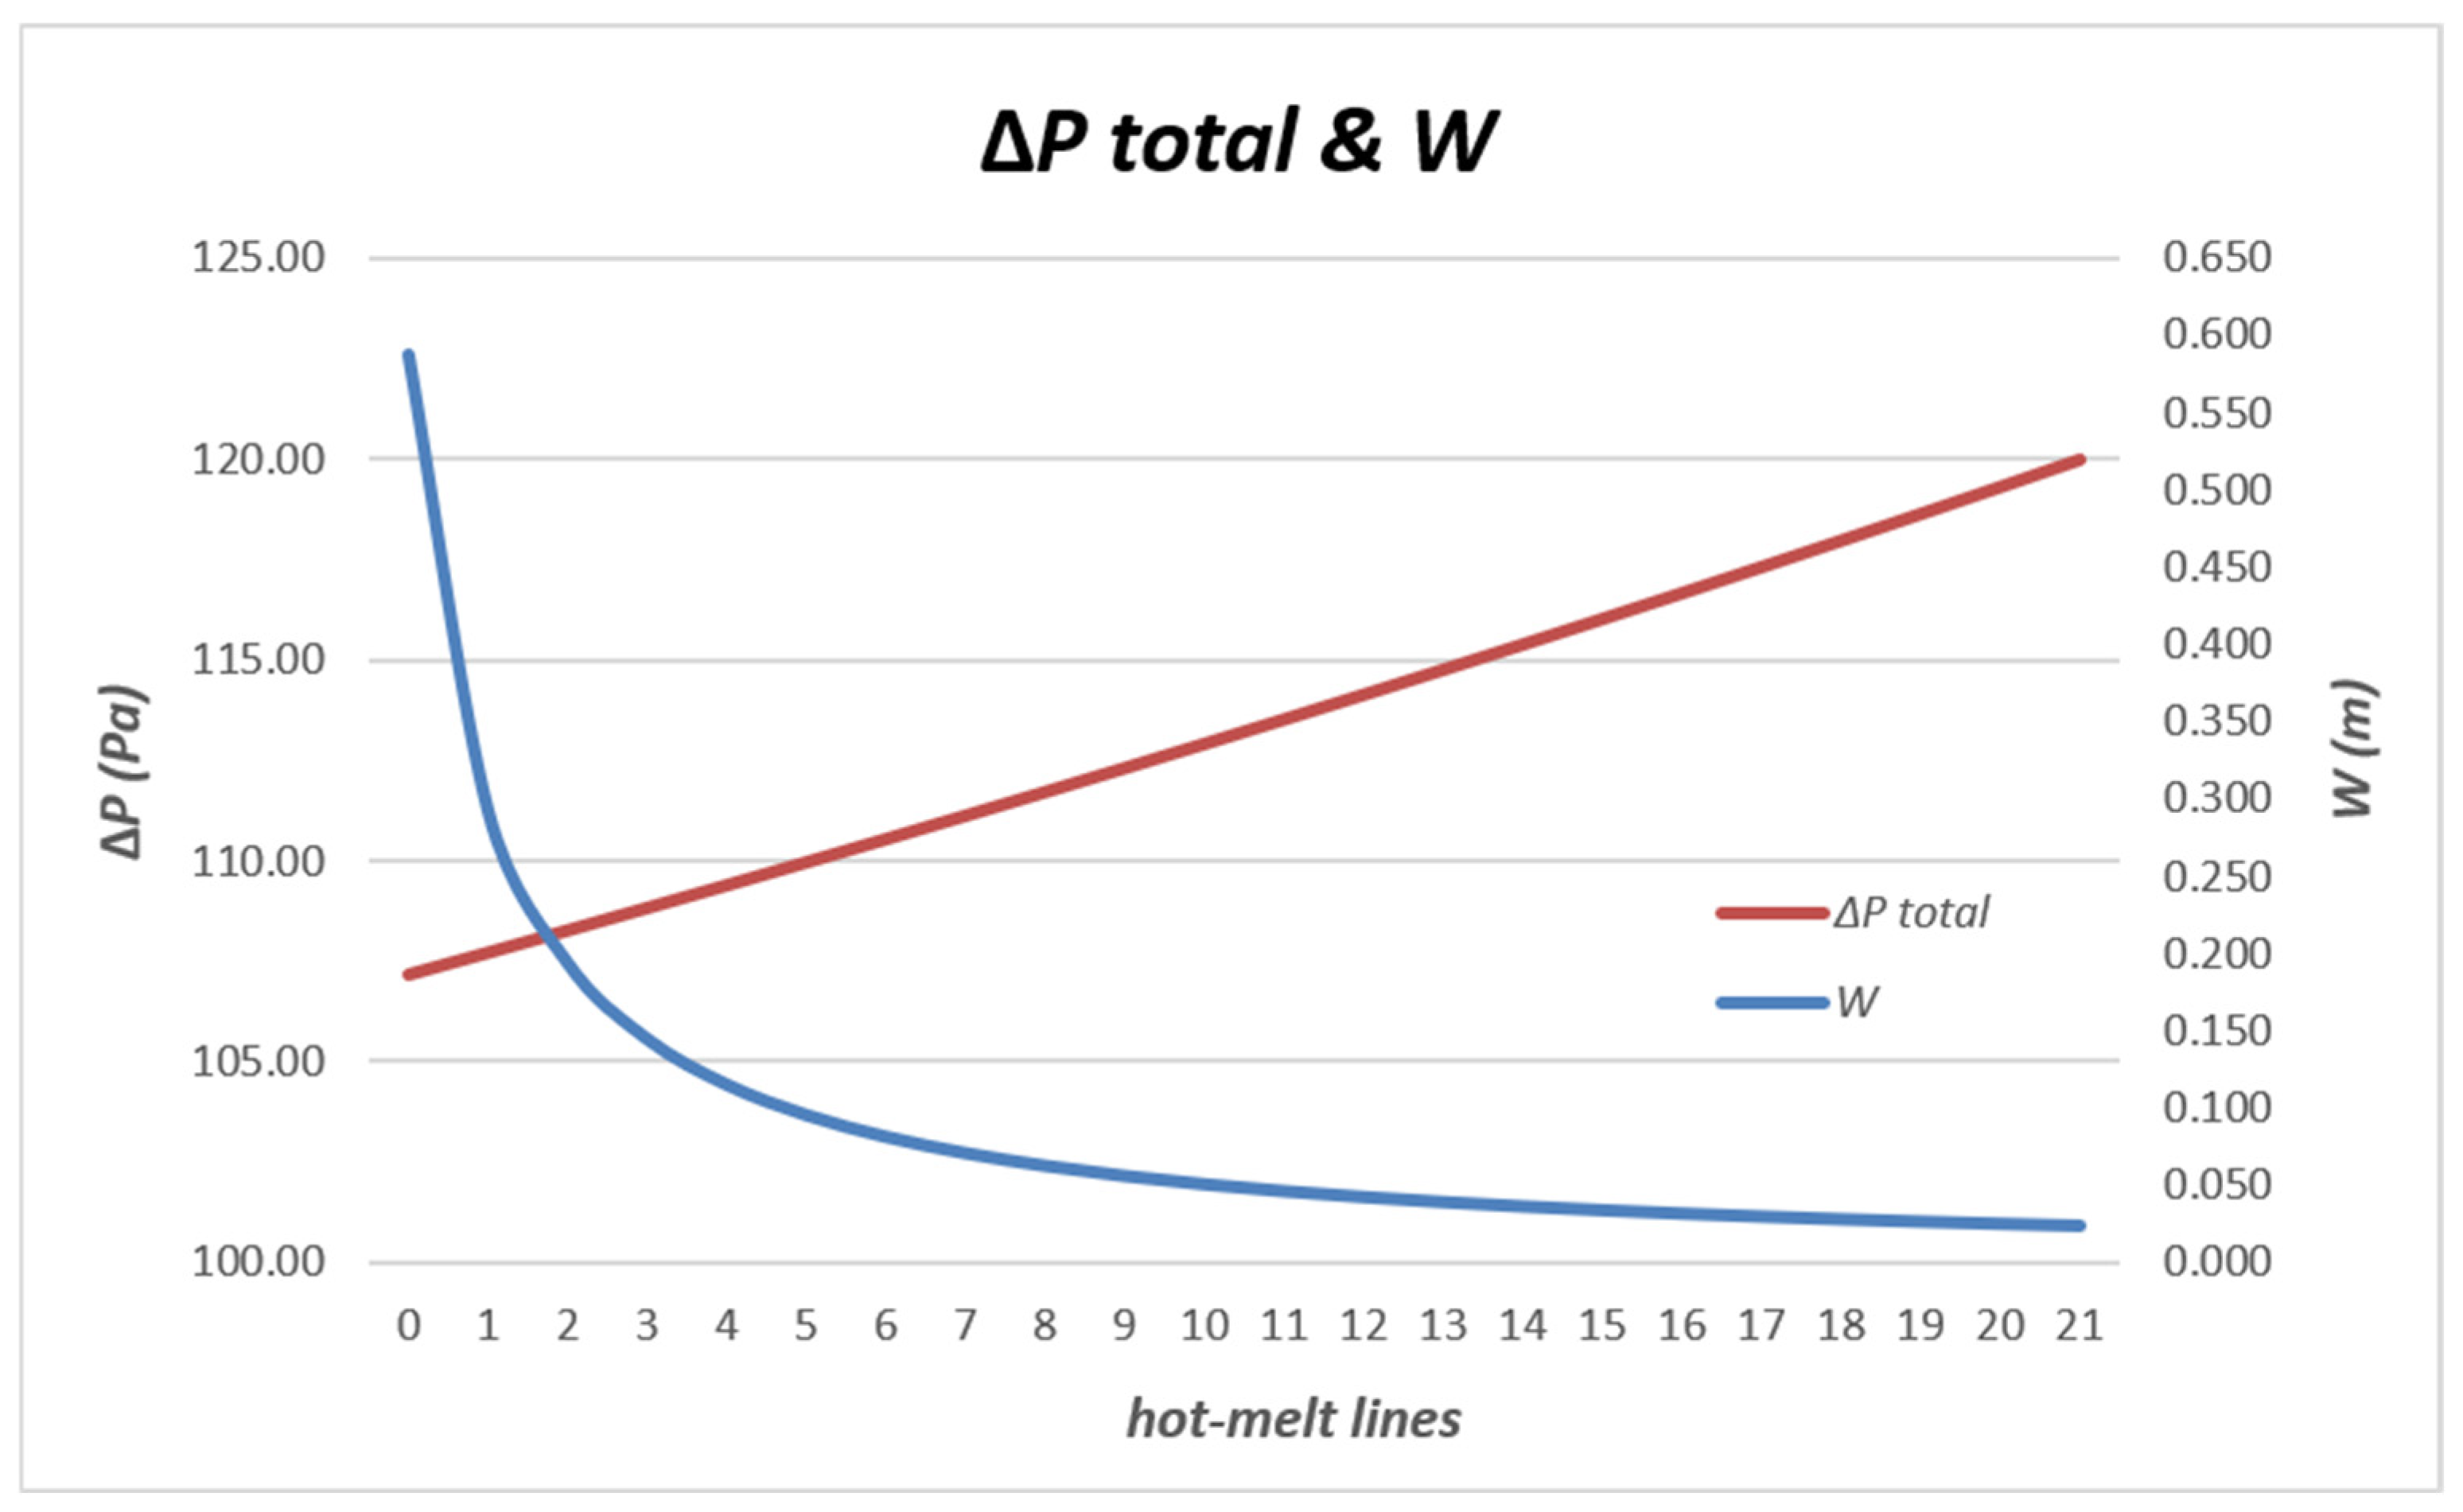
Thus, for a deeper pleat, the pressure required to force the airflow through a greater volume of media is lower. We would also like to highlight that the variation in pressure drop is linear, whereas the variation in cell width is non-linear with each reduction of a hot-melt line, as shown in Figure 14 below.
Figure 14.
ΔPtotal and pleat width variation vs. reduction in hot-melt lines.
Table 10.
Equal Uw, Ui, and ΔPtotal variation (Scenarios 1, 11–31).
4.1. Optimal Behavior Scenario of the Model
There are two comparison rounds. The first compares Scenarios 1 to 10, and the second compares Scenarios 1 and 11–31. Comparisons between cases are based on three fundamental criteria:
- Energy/required pressure (lowest pressure drop)
This is the average system pressure drop (ΔPtotal = ΔPmedia + ΔPchannel) weighted by the flow rate that actually passes through the filter media’s porous walls along the wedge. This parameter represents the fan demand and is the basis for filters’ energy calculation and therefore their classification.
- 2.
- Hot-melt lines/Structural Rigidity and Deflection factor (greater number of hot-melt lines)
The highest number of hot-melt lines will improve rigidity, increasing filter burst pressure.
- 3.
- Coverage/Area
Dh (larger filtration coverage area).
4.1.1. Comparison of Scenarios 1 to 10
To identify the most favourable configurations, all scenarios were assessed using both aerodynamic and geometric criteria. A low total pressure drop (ΔPtotal) was considered essential for reducing energy consumption, while useful Dh was used to compare hydraulic performance independently of geometry. Since pressure drop alone is not sufficient for selection, preference was given to configurations combining low resistance, wider cell spacing, and more hot-melt lines. Reducing the number of hot-melt lines from 21 to 11 increases the channel width from 0.0238 m to 0.04625 m, resulting in a 5.41% reduction in total pressure drop. Based on the above criteria, Scenarios 10 and 4 were identified as the most balanced solutions and are discussed below.
Although Scenario 10 appears optimal purely from a pressure perspective, critical structural constraints, namely rigidity and flexural deflection, must also be evaluated. Reducing the number of hot-melt lines too aggressively (e.g., dropping from 21 or 11 lines down to just 2) significantly compromises the mechanical integrity of the filter pack. Under an airflow rate of 0.16667 m3/s, the aerodynamic drag will cause the pleats to deform, group together (pleat pinching), or suffer from severe flexural deflection. This physical distortion disrupts uniform airflow, invalidates theoretical pressure drop gains, and risks structural collapse. Balancing a low total pressure drop (ΔPtotal) with adequate mechanical stability is important.
- Scenario 4 is the safest and best overall choice:
- ΔPtotal: 96.13 (a 19.89% improvement over baseline);
- Pleat geometry: Hi = 0.00256 m, 230 pleats;
- Hot-melt lines: 11.
This configuration achieves nearly the same pressure performance as Scenario 10 while retaining 11 hot-melt lines. This provides the necessary structural rigidity to withstand aerodynamic forces without risking excessive deflection or pleat collapse.
- Scenario 3 is the most structurally stable option:
- ΔPtotal: 101.62 (a 15.32% improvement over baseline);
- Pleat geometry: Hi = 0.00256 m, 230 pleats;
- Hot-melt lines: 21.
This option offers the maximum structural rigidity within the optimized 230 pleat configuration (maintaining the baseline’s 21 glue beads). Although the channel pressure drop increases slightly vs. Scenario 4 due to physical airflow blockage from the additional adhesive, it guarantees minimal deflection and consistent pleat spacing under load pressure. Why must Scenario 10 be ruled out? While Scenario 10 yields the lowest theoretical ΔPtotal (91.67) on paper, relying on only two hot-melt lines across a wide channel (W = 0.19400 m) is structurally unviable. The unsupported span between glue beads will lead to severe deflection, negating the calculated 23.61% improvement in real-world operation.
4.1.2. Comparison of Scenarios 1 and 11–31
- Channel width (W) increases drastically: expanding from 0.02386 m up to 0.588 m;
- Hot-melt support lines decrease, dropping from 20 lines down to 0;
- Deflection and collapse risks skyrocket: spanning channels over 10–50 cm wide with only 0–3 glue beads creates an excessively wide, unsupported span.
Under operational airflow, aerodynamic forces will cause severe flexural deflection and pleat pinching (pleats bunching together). This physical distortion obstructs airflow paths, completely invalidating the minor theoretical pressure gains.
- Scenario 20, the optimal sweet spot:
- Total pressure drop (ΔPtotal): 113.51 Pa (5.41% improvement over baseline);
- Channel width (W): 0.04625 m;
- Hot-melt lines: 11.
This scenario is preferred because it maintains 11 solid support lines across a manageable 4.6 cm channel span. This provides excellent structural stiffness against the airflow, ensuring negligible deflection so that the calculated 5.41% pressure drop reduction actually holds true in real-world operation.
- Scenario 17, the maximum mechanical safety choice:
- Total pressure drop (ΔPtotal): 115.38 Pa (3.85% improvement over baseline);
- Channel width (W): 0.0364 m;
- Hot-melt lines: 14.
This option delivers an even higher support density (14 lines) within a narrow channel. If your application experiences turbulent flow or pressure pulses, Scenario 17 guarantees virtually zero flexural deflection while sacrificing less than 1.6% in theoretical pressure performance compared to far riskier setups.
- Scenarios 27 to 31 should be rejected
While Scenarios 29–31 show the highest mathematical “improvements” on paper (up to 10.71% in Scenario 31):
- Scenario 31 (zero lines, W = 58.8 cm): Entirely unviable. Without adhesive beads, a 58.8 cm wide pack will collapse completely under differential pressure (assuming there is no mesh to prevent it);
- Scenario 29 (two lines, W = 19.4 cm): using only two glue lines across a span of nearly results in severe bowing and sagging in the central pleat area.
From an engineering point of view, a total theoretical gain between 11 lines (5.41%) and 0 lines (10.71%) is a mere ≈ 6 Pa. It is never worth risking mechanical failure, pleat collapse, or severe deflection for such a marginal reduction in pressure drop. Scenario 20 represents the most appropriate engineering decision.
4.2. Proposed Design Improvements
- Best combination (model predicted)
However, an even better solution can be achieved by increasing the pleat length from 0.048 m to 0.055 m. The final parameters are shown in Table 11.
Table 11.
Best input combinations and outcomes.
The increased length does not require any changes to the filter’s external structure, aluminum frame, or protective mesh, thus simplifying this solution’s implementation.
4.3. Model Calibration and Limitations
The proposed model combines Falkner–Skan similarity concepts, Darcy filtration, and Darcy–Weisbach friction analysis to describe airflow behavior inside an individual hot-melt cell. Owing to the analytical nature of this formulation, several physical effects present in the real filter are necessarily simplified. When applied to the reference H14 filter, the model predicts a pressure drop slightly higher than all experimental values. An extremely small calibration factor of 1.038 was therefore obtained from comparisons against the experimentally characterized filter. This calibration coefficient should not be interpreted as a correction of the governing equations but rather as a quantitative measure of the aggregate contribution of phenomena not explicitly represented in the model, including three-dimensional effects, local losses, geometric imperfections, and spatial variations in media properties already mentioned in Section 3.1 and Table 5. Since all geometric scenarios were evaluated under the same assumptions, the calibration factor does not alter the relative comparison of designs. Consequently, the model should primarily be regarded as a comparative engineering tool for geometry optimization rather than as an exact predictor of the absolute pressure drop of a complete commercial filter. This work introduces a novel analytical concept capable of determining optimal HEPA filter airflow distribution and geometries by explicitly interconnecting the pleat opening angle, hydraulic diameter, active filter media area, and overall pressure drop. The key advantage of this analytical model is its ability to predict optimal structural parameters without relying on fluid dynamics simulations (CFD) or elaborate iterative algorithms using hot-melt cells as key factors. The optimized geometries identified in this study are derived from the proposed analytical model and have not yet been manufactured or experimentally validated as physical prototypes. Consequently, the predicted reductions in pressure drop should be interpreted as model-based design estimates. Although the methodology has been developed and calibrated using measurements obtained from a commercial H14 minipleat filter, the performance of the optimized configurations regarding pressure drops, velocity uniformity, filtration efficiency, MPPS behavior, and leakage characteristics remains to be verified experimentally. Such validation will require the manufacture of dedicated prototypes and full testing according to the relevant standards and is considered a subject for future research.
5. Conclusions
This study concludes that minipleat internal geometry is the main and dominant parameter governing both flow redistribution and total pressure drop in an H14-efficiency HEPA filter. In particular, the channel width, inlet height, hydraulic diameter, and effective pleat angle constitute key control factors determining the system’s internal aerodynamic response. Modeling the hot-melt cell as an elemental hydraulic unit makes it possible to faithfully represent the coupled effects of geometric convergence, viscous dissipation in laminar flow, and filtration through the porous medium, capturing transport mechanisms that remain insufficiently described in conventional two-dimensional formulations and highlighting the intrinsically three-dimensional nature of airflow within the pleat. The experimental results reveal pronounced spatial heterogeneity in the velocity field near the filtering surface, where the coefficient of variation reaches 83.84% at 5 mm before decreasing to 28.75% at 200 mm upstream. This attenuation confirms the coupled interaction between the nozzle-like effect generated by the pleat geometry, the anisotropic permeability of fibrous media, and the hydraulic segmentation imposed by the hot-melt bonding lines. Together, these constitute direct evidence supporting the need for fully coupled three-dimensional descriptions. The results also demonstrate that geometric optimization is an effective strategy for improving the internal aerodynamics of the filtering system. The combined configuration derived from Scenario 4 reduces the overall pressure drop by 29.23% (dropping from 120.00 to 84.92 Pa) without sacrificing the active filtration area; however, its mechanical integrity and preservation of initial efficiency have not yet been experimentally validated. This study establishes quantitative design criteria applicable to next-generation HEPA, EPA, and ULPA filtration systems, aimed at enhancing energy efficiency, improving flow uniformity, and strengthening aerodynamic control in high-demand technological environments [19]. The results also highlight several avenues for future research aimed at increasing the structural rigidity of the assembly to mitigate the so-called “accordion effect”, which increases susceptibility to failure due to progressive deformation of the filter medium. This phenomenon becomes more pronounced at the intermediate points corresponding to increased distances between hot-melt lines, meaning that future improvements should focus on raising the burst pressure and reinforcing the overall mechanical stability of the system. It must be emphasized that the optimized filter geometries identified in this work represent model-based analytical projections. While the underlying mathematical formulation was calibrated using baseline experimental measurements from a commercial H14 filter, physical manufacturing of prototype units and full empirical testing under EN1822 standards are required to validate the actual pressure drop, velocity uniformity, mechanical stability against pleat deflection, and fractional filtration efficiency (MPPS) under real-world cleanroom operational conditions.
Author Contributions
Writing—original draft, methodology, investigation, formal analysis, data curation, conceptualization, visualization, software, R.C.; review and editing, supervision, conceptualization, M.S.; review and editing, supervision, conceptualization, J.O.M.; review and editing, supervision, conceptualization, A.C.-N. All authors have read and agreed to the published version of the manuscript.
Funding
This research received no external funding.
Institutional Review Board Statement
Not applicable.
Informed Consent Statement
Not applicable.
Data Availability Statement
All information is available upon request.
Acknowledgments
R.C. thanks AAF International, Nippon Muki, and DAIKIN group for the full support provided to generate this report.
Conflicts of Interest
Authors R. Castillo and M. Schmidt were employed by the company AAF International. The remaining authors declare that the research was conducted in the absence of any commercial or financial relationships that could be construed as a potential conflict of interest.
Abbreviations
The following abbreviations are used in this manuscript:
| FS | Full scale |
| ePTFE | Polytetrafluoroethylene membrane |
| EPA | Efficiency Particulate Air filter |
| HEPA | High-Efficiency Particulate Air filter |
| ULPA | Ultra-Low Particulate Air filter |
| MPPS | Most Penetrating Particle Size |
References
- Nie, T.; Zhang, G.; Sun, Y.; Wang, W.; Wang, T.; Duan, H. Effects of Indoor Air Quality on Human Physiological Impact: A Review. Buildings 2025, 15, 1296. [Google Scholar] [CrossRef] [Scilit]
- Amini, H.; Yousefian, F.; Faridi, S.; Andersen, Z.J.; Calas, E.; Castro, A.; Cervantes-Martínez, K.; Cole-Hunter, T.; Corso, M.; Dragic, N.; et al. Two Decades of Air Pollution Health Risk Assessment: Insights From the Use of WHO’s AirQ and AirQ+ Tools. Public Health Rev. 2024, 45, 1606969. [Google Scholar] [CrossRef] [Scilit]
- Su, J.G.; Aslebagh, S.; Shahriary, E.; Barrett, M.; Balmes, J.R. Impacts from air pollution on respiratory disease outcomes: A meta-analysis. Front. Public Health 2024, 12, 1417450. [Google Scholar] [CrossRef] [Scilit]
- Ishak, A.; Nazar, R.; Pop, I. Falkner-Skan equation for flow past a moving wedge with suction or injection. J. Appl. Math. Comput. 2007, 25, 67–83. [Google Scholar] [CrossRef] [Scilit]
- UNE-EN 1822-1; Filtros Absolutos (EPA, HEPA y ULPA)—Parte 1: Clasificación, Principios Generales del Ensayo Y Marcado. Asociación Española de Normalización (AENOR): Madrid, España, 2010.
- White, F.M. Fluid Mechanics, 7th ed.; McGraw-Hill: New York, NY, USA, 2011. [Google Scholar]
- Schlichting, H.; Gersten, K. Boundary-Layer Theory, 9th ed.; Springer: Berlin/Heidelberg, Germany, 2017; p. 105. Available online: https://link.springer.com/book/10.1007/978-3-662-52919-5 (accessed on 12 November 2025).
- UNE-EN1822-3; Filtros Absolutos (EPA, HEPA y ULPA)—Parte 3: Ensayo de Medio Filtrante Plano, Junio. Asociación Española de Normalización (AENOR): Madrid, España, 2010.
- UNE-EN1822-2; Filtros Absolutos (EPA, HEPA y ULPA)—Parte 2: Producción de Aerosol, Aparatos de Medición, Estadística de Contaje de Partículas, Junio. Asociación Española de Normalización (AENOR): Madrid, España, 2010.
- UNE-EN16890-1; Filtros de Aire Utilizados en Ventilación General—Parte 1: Especificaciones Técnicas, Requisitos y Clasificación Según Eficiencia Basado en la Materia Particulada (PM), Junio. Asociación Española de Normalización (AENOR): Madrid, España, 2017.
- UNE-EN16890-2; Filtros de Aire Utilizados en Ventilación general—Parte 2: Medición de la Eficiencia Fraccional y de la Resistencia al Flujo de Aire, Junio. Asociación Española de Normalización (AENOR): Madrid, España, 2017.
- UNE-EN16890-3; Filtros de Aire Utilizados en Ventilación General—Parte 3: Determinación del Rendimiento Gravimétrico y la Resistencia al Flujo de Aire en Relación con la Masa del Polvo de Ensayo Capturada, Junio. Asociación Española de Normalización (AENOR): Madrid, España, 2017.
- UNE-EN16890-4; Filtros de Aire Utilizados en Ventilación General—Parte 4: Método de Acondicionamiento Para Determinar la Eficiencia Fraccional Mínima de Ensayo, Junio. Asociación Española de Normalización (AENOR): Madrid, España, 2017.
- Schrank, K.R.; Barnett, J.M.; Bliss, M.; Cooley, S.K. HEPA Filter Age Evaluation Report; Pacific Northwest National Laboratory: Richland, WA, USA, 2021. Available online: https://www.pnnl.gov/main/publications/external/technical_reports/PNNL-31030.pdf (accessed on 4 December 2025).
- European Commission. EudraLex—Volume 4: EU Guidelines for Good Manufacturing Practice for Medicinal Products for Human and Veterinary Use. Annex 1: Manufacture of Sterile Medicinal Products. Off. J. Eur. Union 2022. Available online: https://health.ec.europa.eu/medicinal-products/eudralex/eudralex-volume-4_en (accessed on 12 February 2026).
- U.S. Food and Drug Administration. Sterile Drug Products Produced by Aseptic Processing—Current Good Manufacturing Practice. In Guidance for Industry; FDA, CDER/CBER.: Silver Spring, MA, USA, 2004. Available online: https://www.fda.gov/media/71026/download (accessed on 10 December 2025).
- World Health Organization. WHO Good Manufacturing Practices for Sterile Pharmaceutical Products. In WHO Technical Report Series; WHO: Geneva, Switzerland, 2022; Annex 2; Available online: https://www.who.int/publications/m/item/trs1044-annex2 (accessed on 10 March 2026).
- Whitfield, W.J. Laminar Flow Clean Room Design; Sandia National Laboratories: Albuquerque, NM, USA, 1963; Available online: https://osf.io/preprints/osf/download/591dbecab83f210214a1a679 (accessed on 28 March 2026).
- Castillo, R.; Schmidt, M.; Cerpa-Naranjo, A.; Martínez, J.O. Effect of Pleat Angle on Pressure Drop in H14 HEPA Filters: A Mathematical Analysis with Corrections for Real Filter Behaviour. Computation 2026, 14, 179. [Google Scholar] [CrossRef] [Scilit]
- Schmalz, E.; Opiolka, S.; Bankodad, A.; Haep, S. Optimierung Der Faltengeometrie Von Minipleat-Faltenfilterelementen Und Ableitung Eines Praxisorientierten Berechnungstools; IUTA—Institut für Umwelt & Energie, Technik & Analytik e.V.: Duisburg, Germany, 2019. [Google Scholar]
- Shukla, A.K.; Kumar, A.; Kumar, R.; Ranjan, P. Investigation of pleated air filters: Effects of various shapes and design parameters on flow patterns and pressure drop. Int. J. Interact. Des. Manuf. 2024, 18, 5057–5075. [Google Scholar] [CrossRef] [Scilit]
- Teng, G.; Shi, G.; Zhu, J.; Qi, J. A numerical simulation method for pressure drop and normal air velocity of pleated filters during dust loading. PLoS ONE 2023, 18, e0282026. [Google Scholar] [CrossRef] [Scilit]
- Teng, G.; Shi, G.; Zhu, J. Influence of pleated geometry on the pressure drop of filters during dust loading process: Experimental and modelling study. Sci. Rep. 2022, 12, 20331. [Google Scholar] [CrossRef] [Scilit]
- Bourrous, S.; Bouilloux, L.; Nerisson, P.; Thomas, D.; Appert-Collin, J.C. Influence of Pleat Deformation on Pressure Drop for a High-Efficiency Particulate Air Filter: A Small-Scale Experimental Approach. ASME J. Nucl. Eng. Radiat. Sci. 2017, 3, 011012. [Google Scholar] [CrossRef] [Scilit]
- Guo, C.; Kang, J.; Wang, D.; Liang, Y.; Wang, L.; Xu, G.; Wang, H.; Tang, M. Experimental and Simulation Study of Particle Deposition Characteristics and Pressure Drop Evolution in Pleated Filter Media. Processes 2025, 13, 975. [Google Scholar] [CrossRef] [Scilit]
- Darcy, H. Recherches Expérimentales Relatives au Mouvement de l’eau dans Les Tuyaux; Mallet-Bachelier: Paris, France, 1857; Available online: https://archive.org/details/bub_gb_a4rcE52LFF0C (accessed on 20 November 2025).
- Van Lopik, J.H.; Snoeijers, R.; van Dooren, T.C.G.W.; Raoof, A.; Schotting, R.J. The Effect of Grain Size Distribution on Nonlinear Flow Behavior in Sandy Porous Media. Transp. Porous. Med. 2017, 120, 37–66. [Google Scholar] [CrossRef] [Scilit]
- ISO 5725-2; Accuracy (Trueness and Precision) of Measurement Methods and Results-Part 2: Basic Method for the Determination of Repeatability and Reproducibility of a Standard Measurement Method. ISO: Geneva, Switzerland, 1994.
- ISO/IEC Guide 98-3:2008; Uncertainty of Measurement-Part 3: Guide to the Expression of Uncertainty in Measurement (GUM:1995). International Organization for Standardization: Geneva, Switzerland, 2008. Available online: https://webstore.iec.ch/en/publication/11961 (accessed on 20 April 2026).
- Weisbach, J. Anfangsgründe der Baukonstruktionen. In Baukunde und Mechanik; Vieweg: Braunschweig, Germany, 1845. [Google Scholar]
- Geankoplis, C.J. Transport Processes and Separation Process Principles, 4th ed.; Prentice Hall: Upper Saddle River, NJ, USA, 2003; Available online: https://archive.org/details/transportprocess0000gean_h2c2 (accessed on 12 March 2026).

Disclaimer/Publisher’s Note: The statements, opinions and data contained in all publications are solely those of the individual author(s) and contributor(s) and not of MDPI and/or the editor(s). MDPI and/or the editor(s) disclaim responsibility for any injury to people or property resulting from any ideas, methods, instructions or products referred to in the content. |
© 2026 by the authors. Licensee MDPI, Basel, Switzerland. This article is an open access article distributed under the terms and conditions of the Creative Commons Attribution (CC BY) license.