


Abstract
Fingerprint presentation attack detection (PAD) remains an open problem owing to continually developing spoofing schemes and large variations in sensors and acquisition conditions. In this paper, we propose SFAD-Net, a lightweight dual-stream spatial–frequency attention network for fingerprint presentation attack detection. The framework integrates complementary spatial and wavelet-based frequency representations with a lightweight attention-guided fusion mechanism to improve discriminative feature learning while maintaining computational efficiency. We evaluate SFAD-Net on the LivDet 2011, 2013, and 2015 datasets using the standard intra-sensor evaluation protocol, together with an additional cross-sensor evaluation on the LivDet 2015 dataset to investigate the impact of sensor-induced domain shifts. The results demonstrate that the proposed method achieves an accuracy of 99.51% on the LivDet 2011 Sagem sensor while maintaining strong intra-sensor presentation attack detection performance across the independently evaluated LivDet benchmark datasets. At the dataset level, SFAD-Net achieves mean ACER values of 1.56%, 1.17%, and 2.60% for LivDet 2011, 2013, and 2015, respectively, together with low APCER and BPCER across the evaluated sensors. The cross-sensor evaluation further highlights the challenges posed by sensor-induced distribution shifts and provides additional insight into the behavior of the proposed framework under unseen sensor conditions. Extensive ablation studies systematically evaluate the contribution of the dual-stream design, wavelet-based frequency representation, and attention-guided feature fusion. In addition to its detection performance, SFAD-Net contains 0.41 M parameters, requires 2.56 GFLOPs, and has a model size of 4.86 MB, achieving 12.31 FPS in the local computational benchmarking setup. Direct deployment on a 4 GB Raspberry Pi 5 further provides evidence of its practical feasibility. Among the evaluated reduced-precision representations, FP16 substantially reduces model size while preserving PAD performance close to FP32, whereas INT8 achieves 35.99 ms latency and 27.79 FPS but introduces a noticeable degradation in PAD performance under the evaluated LivDet 2015 Crossmatch condition.
1. Introduction
Biometric authentication systems are an essential part of current security infrastructure, where fingerprint recognition has become one of the most widely used biometric modalities, such as facial recognition and iris recognition, due to its distinctiveness, permanence, and ease of capture. Consequently, the demand for fingerprint-based systems has increased. At the same time, this widespread adoption has increased the importance of addressing presentation attacks (PAs) in which an attacker uses fake fingers made from spoofing materials (silicone, gelatin, or printed patterns) to bypass the biometric system. Presentation attacks threaten the reliability of fingerprint recognition systems, leading researchers to actively work on detecting fingerprint presentation attacks (PADs). It has already been found that factors such as fabrication material, sensor characteristics, and variability in the interaction of a user with the sensor affect the performance of the PAD system [1,2,3,4,5].
Fingerprint liveness detection has advanced from handcrafted feature-based methods to deep learning-based approaches. The earlier methods employed engineered features to discriminate between live and fake fingerprints based on the texture and structure properties of fingerprints. For example, Dubey et al. [6] applied a low-level feature and shape analysis-based liveness detection method, whereas Xia et al. [7] used the Weber local binary descriptor, which captures local texture variations, whereas Yuan and Sun [8] used Histogram of Oriented Gradient (HOG) features to describe fingerprint texture. These methods provided good results, but their applicability relies on handcrafted feature extraction methods, whose performance is often affected by varying acquisition conditions and sensor-specific characteristics [9].
These limitations have motivated the development of deep learning approaches, particularly convolutional neural networks (CNNs), which can automatically learn discriminative representations from fingerprint images. Chugh et al. [10] introduced a minutiae-based local patch approach in which a CNN learns distinctive features from local fingerprint regions. Subsequently, several CNN-based methods have been developed, including densely connected CNNs trained using a genetic algorithm [11], residual CNN architectures [12], improved CNNs with image-scale equalization [13], and patch-based deep learning frameworks for local feature extraction [14]. While these approaches effectively exploit spatial-domain information, they may not fully capture high-frequency characteristics associated with spoof artifacts. This limitation motivates the incorporation of complementary frequency-domain representations for fingerprint PAD.
More recently, researchers have explored alternative deep learning strategies for fingerprint PAD, including anomaly detection approaches based on convolutional autoencoders [15], generative adversarial networks (GANs) for generating diverse spoof samples and improving robustness [16,17], and transformer-based approaches that model both local and global fingerprint characteristics [18,19]. Although these methods provide additional capabilities for representation learning and robustness, their computational requirements can be higher, and their performance may still be affected by variations in sensors and acquisition conditions [20].
Moreover, different sensors and operating conditions introduce significant variations in fingerprint images, posing challenges for reliable fingerprint presentation attack detection under diverse acquisition conditions [21,22]. High-frequency artifacts from spoof materials are typically embedded in finer details, which can be detected in the frequency domain [23]. However, frequency-domain features alone may not provide sufficient discriminative information for robust PAD. This motivates approaches that jointly exploit complementary fine-grained information from the spatial and frequency domains.
To address these issues, we propose SFAD-Net, a lightweight dual-stream spatial–frequency framework for fingerprint PAD. The contribution therefore lies primarily in the specific integration, lightweight architectural design, and systematic empirical validation of these established components for fingerprint PAD. The design is intended to exploit complementary spatial and frequency information while maintaining a low computational and parameter footprint. The contribution therefore lies primarily in the specific integration, lightweight architectural design, and systematic empirical validation of these established components for fingerprint PAD.
We conducted extensive experiments on widely used fingerprint PAD benchmark datasets, namely LivDet 2011, LivDet 2013, and LivDet 2015. Experimental results show that SFAD-Net achieves strong intra-sensor PAD performance across the independently evaluated LivDet benchmark datasets and attack types while maintaining a computationally efficient architecture for practical applications.
The main contributions of this work are as follows:
- We develop a lightweight dual-stream spatial–frequency architecture that integrates spatial and wavelet-based frequency representations within a compact design for fingerprint PAD.
- We employ attention-guided feature fusion to combine complementary spatial and frequency representations and systematically evaluate the contribution of the integrated components through ablation studies.
- We provide comprehensive evaluation on the LivDet 2011, 2013, and 2015 datasets, including wavelet sub-band and decomposition-level analyses, hyperparameter sensitivity, cross-sensor evaluation, and quantitative interpretability analysis.
- We assess computational efficiency through controlled local benchmarking and direct Raspberry Pi 5 deployment using FP32, FP16, and INT8 TensorFlow Lite models, including an evaluation of the resulting accuracy–efficiency trade-off.
2. Related Work
Research on fingerprint presentation attack detection (PAD) has grown substantially over the past decade, shifting from hardware-assisted techniques to handcrafted feature-based techniques, and recently, to deep learning-based techniques. While each approach offers its advantages, they remain limited by concerns related to scalability, generalization across different acquisition conditions and sensors, and sensitivity to variations in image quality and sensing characteristics.
Hardware-assisted PAD techniques aim to improve performance under varying acquisition conditions by fusing additional sensory information with traditional grayscale fingerprint images. Methods from this category try to extract additional non-visible light-based properties, such as the physiological features of the finger, using multispectral images or short-wave infrared images, which attempt to penetrate the skin layer of the finger [24]. This type of system is highly discriminative due to the richness of the information obtained, but it involves highly expensive sensors and hence is unsuitable for large-scale deployment. The sensitivity to environmental conditions or sensor parameters remains a problem.
Software-based systems are preferred for large-scale deployment because they do not require special hardware. In this case, hand-crafted features are generally employed to distinguish live from spoof fingerprints, like a combination of low-level features with shape features [6], Weber local binary descriptors to characterize texture information [7], or a gradient of oriented gradient features to characterize texture [8]. Hybrid feature-based methods have been explored in order to exploit the discriminative power of different types of features. For example, a system that uses a combination of local image features with an adaptive image feature extraction method for PAD has been presented [25]. However, while these methods may perform well under certain scenarios, they typically lack robustness, and their performance degrades for unseen attack types or with different sensor characteristics [1,2], as hand-engineered features may not fully capture all potential spoof patterns.
Besides handcrafted spatial-domain features, some of the recent studies have considered the frequency domain descriptors for improving fingerprint presentation attack detection. The frequency domain analysis helps in the extraction of discriminative texture features and spoofing-specific artifacts that are complementary to the spatial domain features and are usually harder to detect in the original fingerprint image. For example, Zhang et al. [23] designed a frequency-domain learning method that extracts discriminative features directly from the transformed fingerprints for presentation attack detection purposes. Later on, Liu et al. [26] introduced a wavelet-based memory autoencoder approach that uses multiscale frequency-domain information for non-contact fingerprint PAD and demonstrates the potential of wavelet-based features in presentation attack detection. In addition, Tahir et al. [27] combined wavelet scattering transformations with CNNs to effectively integrate spatial and frequency-domain information for fingerprint anti-spoofing. Recently, a review by Li and Ramachandra [28] also highlighted that frequency-domain analysis and wavelet-based feature learning have become a promising direction for fingerprint PAD, although the requirement of lightweight and efficient architecture remains a challenge. In line with these studies, the proposed framework employs a lightweight single-level Haar wavelet transformation to obtain complementary frequency-domain representations, which are combined with spatial features through the proposed attention-guided fusion mechanism.
Deep learning methods have thus become a very promising choice as they can learn relevant features directly from the data. Convolutional neural networks (CNNs) are the most used learning framework in this domain. Early work used CNNs to extract local patch features, giving finer details of the fingerprint [10]. Since then, many other models based on CNNs have been presented. Different network architectures have been explored, such as residual networks [12] or networks that optimize CNN features using genetic algorithms [11]. Recent studies have also explored lightweight attention-enhanced architectures for fingerprint PAD, demonstrating that integrating channel attention mechanisms and transfer learning strategies can improve performance under multi-sensor spoof attack scenarios while maintaining computational efficiency [29]. Some works also focus on enhancing preprocessing steps, such as scale equalization [13], or the application of CNNs on local patches to improve tolerance to variations [14]. However, the current models mostly extract spatial features from the images and are often unable to utilize the high-frequency artifacts typical of spoofing images.
Recently, various learning frameworks have been explored, such as anomaly detection with autoencoders, in which the system learns the normalities of live fingerprint images and detects spoof images as anomalies [15], or the use of GANs to generate spoof images with greater variability to improve the diversity of training samples and enhance the model’s generalization capability [16]. Other studies explore more advanced networks like Transformers [18,19] to capture long-range dependencies. More recently, dual-branch reconstruction-based methods using OCT fingerprint imaging [30] and fixed-prototype contrastive learning combined with anomaly detection [31] have further explored reconstruction and representation-learning strategies for fingerprint PAD. Other studies in CNN-based forensic analysis have further highlighted how model performance can vary significantly depending on dataset characteristics and distribution shifts, emphasizing the challenges posed by such variations [32]. However, maintaining consistent performance under varying acquisition conditions remains a challenge, and these architectures are often computationally intensive. One common challenge for these systems is their sensitivity to changes in sensor parameters and environmental conditions. It has been shown that the performance of fingerprint PAD systems is often affected by sensor-related factors such as different sensing technologies, image resolutions, and signal-to-noise ratios [21,22]. Moreover, fine-grained information such as unevenness and fabrication artifacts can appear due to the spoof fabrication process and user interaction. Such details might be better characterized in the frequency domain. Frequency-domain methods have been explored, but using solely frequency-domain methods fails to achieve comparable performance to other domain-based methods [23].
Considering the limitations in the existing literature, including the limited use of complementary frequency information, sensitivity to sensor and material variations, computational requirements of some advanced architectures, and the challenge of effectively combining spatial and frequency representations, we introduce SFAD-Net, a lightweight dual-stream spatial–frequency architecture for fingerprint PAD. The two streams independently extract spatial and wavelet-based frequency representations, allowing complementary information from both domains to be retained. These representations are subsequently combined through an attention-guided fusion mechanism that adaptively reweights the concatenated features according to their learned importance. The resulting architecture is designed to improve feature representation for fingerprint PAD while maintaining a compact computational footprint under the evaluated experimental and deployment settings.
3. Proposed Methodology
3.1. Overview
The proposed framework, termed SFAD-Net, employs a dual-stream architecture to jointly exploit spatial and frequency-domain information for fingerprint presentation attack detection (PAD). Unlike conventional approaches that rely solely on spatial cues, the proposed model captures both textural and frequency-based spoof artifacts.
The spatial branch acquires representations of ridge shapes and surface characteristics at various levels of abstraction from the image. The frequency branch employs wavelet decomposition to extract distinguishing high-frequency elements for classification purposes. These two very different types of features are combined using an attention mechanism. Finally, the two types of features are classified in order to separate authentic images from counterfeit ones by using a classification module. The overall architecture of the proposed dual-stream spatial–frequency fingerprint PAD framework is illustrated in Figure 1. The overall processing pipeline of the proposed dual-stream fingerprint PAD framework, including spatial feature extraction, Haar wavelet-based frequency representation, attention-guided feature fusion, and final classification, is summarized in Algorithm 1.
Figure 1.
Overall architecture of the proposed dual-stream spatial–frequency fingerprint PAD framework. The model consists of spatial and frequency branches followed by attention-based fusion and classification.
3.2. Problem Formulation
The goal of fingerprint spoofing detection is to determine whether or not a given image contains a true fingerprint or a fake one. The purpose of this system is thus to distinguish between legitimate and illegitimate examples of fingerprints.
More specifically, this research attempts to develop a classifier that will predict an accurate label for each image it receives based on the two-dimensional pixel values contained in that image, as well as other relevant features obtained from processing those pixels.
Let the input fingerprint image be represented as:
The prediction objective can be expressed as:
where corresponds to a bona fide fingerprint and corresponds to a spoof fingerprint.
The framework for creating this classifier will include multiple stages:
Two separate feature extraction branches (spatial and frequency), which can be represented as:
An attention-based fusion mechanism to combine the outputs from both of the feature extraction branches into a single representation:
A classifier that will map the single representation to an estimated label:
3.3. Representation Learning of Spatial Features
3.3.1. Convolution of Feature Extraction
The objective of the spatial branch is to generate hierarchical representations from the input biometric image, which can be used to describe local texture, edge configurations, and high-level patterns of location. The process for obtaining features from input image begins with:
then, each resulting layer of features can be computed by performing a convolution operation, followed by batch normalization, followed by an activation function:
This allows the network to progressively build deeper and more abstract representations of the input by capturing different types of discriminative features, such as fingerprint ridge and valley structures.
We are using the Mish activation function. Mish is defined as:
Unlike typical activation functions, eg, ReLU, Mish is both smooth and non-monotonic in nature and thus improves the flow of gradients and representation of features. This is especially important for PAD cases because subtle differences between the two categories must be detected.
3.3.2. Downsampling Spatially and Abstracting Features
Max pooling has been used to perform downsampling of the spatial dimensions of local texture representations while at the same time creating a larger receptive field. Downsampling is accomplished by selecting the local maximum value for each map of the previous layer:
Fine-grained features are merged together in a series of processes to create multi-level representations, allowing the neural networks to track structural and global information, including pattern flow along a fracture line or ridge, which in turn enhances the resiliency of the model against noise and spatial variation and allows it to better capture both local and global structural information.
3.3.3. Channel-Wise Attention via Squeeze-and-Excitation
To improve the discriminative power of the learned features, we implement a Squeeze-and-Excitation (SE) attention mechanism that recalibrates the feature responses across channels. Given an intermediate feature map:
The first step in recalibrating the channels is to calculate a global descriptor for each of the three dimensions (C) by taking the average of all channels’ values over all spatial locations. That is, we compute:
Next, we model the inter-channel relationships of features using a two-layer fully connected neural network with a nonlinear activation function between the two layers. The transformation can be expressed as:
where denotes the ReLU activation function and represents the sigmoid function.
In the final stage, we use the channel weights produced in the previous stage to recalculate the feature values of the intermediate feature map. Additionally, we multiply each feature value from each channel c by its respective channel weight:
By emphasizing relevant features with high weights and de-emphasizing irrelevant features with low weights, the SE attention mechanism allows us to better capture pattern defects (e.g., irregular texture) and differences in behavior due to spoofing in the PAD.
The entire SE process is viewed as a mapping:
This means that the spatial network extracts features at multiple levels of hierarchy and enhances those extracted features through attention methods.
3.4. Frequency-Domain Representation
3.4.1. Motivation
Spoof artifacts often manifest as high-frequency distortions such as printing noise, ridge discontinuities, and aliasing effects. These artifacts are not always prominent in the spatial domain, especially under varying illumination and sensor conditions. In contrast, the frequency domain provides a more explicit representation of such inconsistencies, making it highly effective for distinguishing bona fide and spoof fingerprints. The architecture of the proposed frequency branch is illustrated in Figure 2.
Figure 2.
Architecture of the proposed frequency branch, illustrating the wavelet-based decomposition and feature extraction pipeline.
3.4.2. Wavelet Decomposition
The input image is first converted to grayscale:
A Haar Discrete Wavelet Transform (DWT) is then applied to decompose the image into four frequency sub-bands:
where represents the low-frequency approximation, while , , and capture horizontal, vertical, and diagonal high-frequency details, respectively.
3.4.3. Representation of Sub-Bands
After an image has been decomposed into four sub-bands (LL, LH, HL, and HH), these will be combined along the channel dimension to form the unified representation of frequency:
The representation preserves both the global structural information and the detailed spatial variations so that the model can learn to identify specific-frequency anomalies created by materials used for spoofing or to capture artifacts caused by how the image is acquired.
3.4.4. Learning of Frequency Features
The feature map will then enter through the convolutional encoder and result in frequency features:
where denotes the encoder function parameterized by learnable weights .
The encoder captures discriminative frequency features by learning the relationships among the wavelet sub-bands and enhances subtle differences that are not easily captured in the spatial domain. More specifically, it captures artifacts resulting from ridge distortion, material-induced noise, and sensor-specific inconsistencies. Therefore, incorporating frequency-domain learning enhances the discriminative capability of the proposed framework for detecting a range of fingerprint presentation attacks under the evaluated intra-sensor settings.
3.5. Cross-Domain Attention-Based Fusion of Features in Different Domains
3.5.1. Feature Concatenation
Let us denote the spatial and frequency feature representations as (representing texture and structural information) and (representing frequency-domain characteristics associated with presentation attack artifacts). The combined representation is obtained by concatenating these two feature vectors:
The concatenation preserves the complementary information contained in the spatial and frequency representations. However, it treats all feature dimensions equally and does not explicitly model their relative importance. To address this limitation, an attention-guided fusion mechanism is applied to the concatenated representation. Specifically, is processed by two transformation functions separated by a nonlinear activation function, followed by a sigmoid function to generate an attention weight for each feature dimension:
The attention weights are then applied to the corresponding feature dimensions through element-wise multiplication to obtain the attention-weighted feature representation:
This operation can be expressed as a feature-fusion function:
The attention mechanism adaptively adjusts the contribution of individual feature dimensions according to their learned importance. Consequently, spatial and frequency features can receive different weights depending on the input characteristics, allowing the fused representation to emphasize features that are more informative for presentation attack detection while retaining complementary information from both domains.
3.5.2. Interpretation of Adaptive Feature Reweighting
All features contributing to the final representation are adaptively reweighted according to their learned relative importance. The attention mechanism therefore performs soft feature selection, in which each dimension of the concatenated representation is scaled by its corresponding attention weight. The resulting representation retains all feature dimensions, while the contributions of individual spatial and frequency features are adaptively adjusted according to their relevance.
The spatial attributes include structural characteristics, ridge flow, and texture consistency, whereas the frequency attributes capture complementary characteristics such as noise, distortion, and spoof-related artifacts.
From a representation-learning perspective, adaptive feature reweighting allows more informative features to contribute more strongly to the final representation while retaining complementary information from both domains. This adaptive mechanism is particularly useful when the relative informativeness of spatial and frequency characteristics varies across acquisition conditions, sensor types, spoof materials, and presentation attack scenarios.
3.6. Learning Strategy and Optimization Objective
The proposed framework is trained using a combination of regularized loss functions, a method for handling class imbalance, and adaptive learning rate scheduling to guarantee stable convergence and solid generalization of the model during training while increasing its ability to discriminate among the classes and reducing the likelihood of overfitting.
3.6.1. Label-Smoothing Cross-Entropy
The optimization goal is to minimize a categorical cross-entropy-based loss function with label smoothing. In this instance, the predicted probabilities obtained from the model’s output are used in conjunction with the smoothed target labels when determining the model’s loss:
| Algorithm 1 Proposed Dual-Stream Fingerprint PAD Framework |
| Require: Input fingerprint image I |
| Ensure: Predicted label |
|
The smoothed label for each of the classes is generated by blending both the initial true label and a uniform distribution governed by the smoothing factor:
allowing the model to avoid becoming too confident in its prediction and thus providing the necessary generalization required for the PAD tasks.
3.6.2. Regularized Risk Minimization
In an effort to help to further reduce the likelihood of overfitting, a regularization term in the form of an penalty is added to the loss function:
When using this technique to calculate the loss incurred by the model, the model parameters that have large values will create a higher penalty on the loss incurred, leading to models that are simpler and generalize better than those without this form of regularization.
Thus, the final loss incurred is equal to both the original loss and the regularization term multiplied by the regularization coefficient.
3.6.3. Class Imbalance Handling
Class imbalance in PAD datasets is addressed using a weighted loss formulation defined for each class with an associated weight to the individual contributions to loss from each sample being scaled based upon the weights assigned to each class:
This allows for minority classes to have enough impact when being trained so as not to be outperformed by majority classes.
3.6.4. Cosine Learning Rate Scheduling
Cosine learning rate scheduling is used to update the learning rate, with the learning rate starting from an initial value and being gradually decreased in accordance with a cosine curve over the course of training:
This type of scheduling results in more rapid learning at the beginning of the training than it does at the end of training, allowing for improved convergence and improved performance overall.
3.7. Strong Inference Method
For improving the reliability of deployment, we are using test time augmentation, temperature scaling, and Equal Error Rate (EER)-based thresholds as methods of improving prediction stability and reliability for different operating conditions.
3.7.1. Test Time Augmentation
The original input image is transformed in several ways, then each transformation has a separate prediction created, which is averaged together to create a single predicted output for the original input image:
This method reduces the system’s sensitivity to slight variations due to rotation or noise.
3.7.2. Temperature Scaling
We apply temperature scaling at the output of the model to give us calibrated confidence levels when the model is overly confident in its predictions. This is achieved through the manipulation of a temperature parameter, which controls how smooth each of the predicted probabilities will be when predicting from the model:
increasing the accuracy of calibration without changing the predicted outputs from the model itself.
3.7.3. EER-Based Decision Rule
When selecting a decision threshold for the model, we choose one based on the EER. The EER is the point at which there is a balance between false acceptance, or security, and false rejection, or usability. Therefore, the decision threshold provides an acceptable compromise between security and usability:
Augmenting predictions made at the time of testing add to our prediction stability. Calibrating predictions and providing thresholds that adapt based on operating conditions enhances decision reliability in a practical use case scenario.
The trained SFAD-Net was subsequently converted into TensorFlow Lite FP32, FP16, and fully quantized INT8 representations for evaluation on a 4 GB Raspberry Pi 5.
4. Results and Discussion
4.1. Experimental Setup
The proposed dual-stream spatial–frequency attention network was evaluated using the standard LivDet 2011, LivDet 2013, and LivDet 2015 benchmark datasets for fingerprint presentation attack detection (PAD). These datasets include multiple sensors, namely Biometrika, Italdata, Digital Persona, Sagem, CrossMatch, GreenBit, HiScan, Swipe, and Time-Series, representing different acquisition conditions, image resolutions, and spoof materials. In addition to the standard intra-sensor evaluation, a cross-sensor evaluation was performed by training on one sensor and testing on a different unseen sensor without domain adaptation or target-domain fine-tuning.
Detailed information about the datasets, including sensor types, image resolutions, and the numbers of bona fide and presentation attack samples used for training and testing, is provided in Table 1. All experiments followed the predefined training and testing partitions established by the original LivDet protocols. No test samples were used in the training or calibration procedures, thereby maintaining a standardized evaluation setting.
Table 1.
Summary of LivDet 2011, 2013, and 2015 datasets including sensors, image sizes, sample distribution, and spoof materials.
All fingerprint images were resized to pixels and normalized before being provided to the network. For each dataset, the predefined training partition was used for model development, while a validation subset was used for early stopping and calibration-related parameter estimation. The model was trained using the Adam optimizer with a cosine learning rate schedule. Early stopping was performed based on validation performance, while label smoothing and class-weighted loss were employed to mitigate class imbalance and improve training stability.
Calibration and Threshold Selection: The predefined test partition was kept strictly isolated from model training, validation, calibration, and threshold-selection procedures. The training partition was further divided into training and validation subsets, with the validation subset used for temperature scaling and EER-based decision-threshold estimation. Specifically, the temperature parameter was estimated from the validation predictions, after which the EER-based decision threshold was determined using the calibrated validation scores. The resulting calibration parameter and decision threshold were fixed before evaluation on the corresponding held-out test partition. The test partition was used exclusively for final performance evaluation and was not used for temperature estimation, threshold selection, model selection, or any other parameter estimation. Therefore, no test set information was used during calibration or threshold determination.
For final inference, test-time augmentation (TTA) using horizontal flipping was applied where specified in the experimental configuration. Probability calibration was performed using the validation-derived temperature parameter, and the resulting calibrated scores were evaluated using the fixed EER-based decision threshold. This procedure ensures that the reported test performance is obtained without test set optimization or leakage.
Various performance measures, including accuracy, AUC, and F1-score, together with ISO-compliant PAD metrics such as APCER, BPCER, and ACER, were used to evaluate detection performance. Computational and deployment characteristics were additionally assessed using inference latency, throughput (FPS), model size, and memory usage. For cross-sensor experiments, the source-sensor training data were used for model development and calibration, while the target-sensor partition remained unseen until final evaluation.
4.2. Implementation Details
Training of SFAD-Net was carried out using the TensorFlow/Keras framework on a NVIDIA RTX 4090 GPU. Training was performed up to 50 epochs with batch size of 32 while employing the Adam optimizer along with the cosine decay learning rate schedule. Early stopping was implemented based on the validation loss, with a patience of 5 epochs. Automatic restoration of the weight values from the epoch with the highest validation score was performed. The frequency branch uses custom single-level Haar DWT which generates LL, LH, HL, and HH sub-bands.
4.3. Fingerprint PAD Results Under Intra-Sensor Setting (LivDet 2011/13/15)
Under the intra-sensor setting, where training and testing are performed on data acquired from the same sensor, we evaluate the ability of the proposed framework to learn discriminative features specific to each sensor while effectively distinguishing bona fide fingerprints from presentation attacks. Experiments are conducted on the LivDet 2011, LivDet 2013, and LivDet 2015 datasets, each consisting of multiple sensors with different acquisition characteristics and spoof materials.
We evaluate the proposed method under intra-sensor settings across the LivDet 2011, 2013, and 2015 datasets. The results are summarized in Table 2.
Table 2.
Intra-sensor performance on the LivDet 2011, 2013, and 2015 datasets.
4.3.1. LivDet 2011 Intra-Sensor Evaluation
The proposed framework achieves superior accuracy on all sensors in the LivDet 2011 dataset when using standard intra-sensor classification results. The Sagem sensor has an Average Classification Error Rate (ACER) of less than 0.50%, meaning it can distinguish between real and fake fingerprints with very few false negative and false positive classifications. The intra-sensor evaluation results on the LivDet 2011 dataset are presented in Figure 3.
Figure 3.
Intra-sensor evaluation results on the LivDet 2011 dataset. Rows correspond to Sagem, Digital Persona, Biometrika, and Italdata sensors. Columns show ROC curves, confusion matrices, and DET curves, respectively.
Both the Digital Persona and Biometrika sensors have similar performance, and their associated average classification error rates are similarly low compared to the Sagem sensor. However, the error rate for the Italdata sensor is higher than for each of the other three sensors, which could be because the amount of intra-class variability is significantly larger than for the other three sensors and because the error patterns are specific to the Italdata device. The results do indicate that the framework used to develop the model effectively captures the spatial and frequency information needed to be successful when using a single sensor to determine whether a fingerprint is potentially fake or not.
4.3.2. LivDet 2013 Intra-Sensor Evaluation
Performance of the framework for LivDet 2013 is good when tested on both Biometrika and Italdata sensors (ACER values of approximately 0.50%). This is likely due to the similar methods of acquiring biometric data used with different optical sensors. The intra-sensor evaluation results on the LivDet 2013 dataset are presented in Figure 4.
Figure 4.
Intra-sensor evaluation results on the LivDet 2013 dataset. Rows correspond to Swipe, Biometrika, and Italdata sensors. For each sensor, ROC curve, confusion matrix, and DET curve are shown from left to right.
The Swipe sensor shows decreased performance with increased ACER values (approximately 2.50%). This lower performance is a direct result of the difficulties associated with acquiring swipe data compared to an optical method, including motion artifacts, incomplete fingerprint image, and the high level of variability in ridge patterns.
4.3.3. LivDet 2015 Intra-Sensor Evaluation
LivDet 2015 exhibits lower performance when compared to previous data sets. This is likely due to more sophisticated spoof materials and intricate acquisition conditions. The intra-sensor evaluation results on the LivDet 2015 dataset are presented in Figure 5.
Figure 5.
Intra-sensor evaluation results on the LivDet 2015 dataset. Rows correspond to CrossMatch, GreenBit, HiScan, and Time-Series sensors. For each sensor, ROC curve, confusion matrix, and DET curve are shown from left to right.
The HiScan sensor has the highest performance level when compared to the other sensors, while the Time-Series sensor has a relatively high ACER score. However, the framework exhibits consistent performance across the various sensor types (optical sensors—HiScan, GreenBit, CrossMatch, and Time-Series) and therefore does not demonstrate much variance in performance, regardless of the type of sensor used to acquire the spoof.
4.3.4. Discussion for Intra-Sensor Results
It is clear from the experiment results that the proposed two-stream architecture successfully utilizes the combination of complementary information from spatial and frequency domains for detecting the presentation attacks on fingerprints. In spite of the more complicated nature of LivDet 2015 databases because of increased variability in materials and conditions of fingerprint acquisition, the proposed architecture retains its stability in terms of joint learning of the structure of ridges and frequency-domain-based features of presentation attacks. The small value of APCER and BPCER for a variety of sensors implies that the obtained representations reliably differentiate genuine fingerprints from presentation attacks using the standard intra-sensor protocol.
4.4. SOTA Comparison
The comparisons in Table 3, Table 4 and Table 5 are provided as literature-based benchmark comparisons. The results reported for the competing methods are taken from their respective publications and may have been obtained using different preprocessing procedures, training configurations, data splits, decision thresholds, and evaluation implementations. Therefore, these comparisons should not be interpreted as controlled reimplementations under an identical experimental pipeline. The purpose of this analysis is to provide a contextual comparison of the reported performance of SFAD-Net with previously published fingerprint PAD methods on the corresponding LivDet benchmarks.
Table 3.
Literature-based comparison of reported ACER (%) results on LivDet 2011.
Table 4.
Literature-based comparison of reported ACER (%) results on LivDet 2013.
Table 5.
Literature-based comparison of reported ACER (%) results on LivDet 2015.
4.4.1. LivDet 2011 SOTA Analysis
Table 3 summarizes the reported mean ACER values for LivDet 2011. The proposed SFAD-Net obtains a mean ACER of 1.56% across the four evaluated sensors. The published methods show varying performance across Sagem, Digital Persona, Italdata, and Biometrika, with mean ACER values ranging from 2.59% for Minutiae-Patch CNN [10] to 6.45% for ISE-CNN [13]. Hybrid and handcrafted approaches also exhibit different levels of sensor-wise variation. SFAD-Net reports low ACER values across all four sensors in the present evaluation, with values ranging from 0.49% to 2.50%. These results indicate favorable performance relative to the reported literature values; however, because the competing methods were not reimplemented under the same experimental conditions, the comparison is intended as a contextual benchmark rather than a controlled claim of superiority.
4.4.2. LivDet 2013 SOTA Analysis
Table 4 presents the reported ACER values for LivDet 2013. SFAD-Net obtains a mean ACER of 1.17% across the Biometrika, Italdata, and Swipe sensors in the present evaluation. The reported literature results show considerable variation between sensors, with mean ACER values ranging from 1.42% for Minutiae-Patch CNN [10] to 3.41% for Gabor-based methods [6]. SFAD-Net achieves ACER values of 0.50%, 0.50%, and 2.52% for Biometrika, Italdata, and Swipe, respectively. These results provide a favorable literature-based comparison, particularly in terms of the relatively consistent sensor-wise performance. Nevertheless, differences in experimental protocols and implementation details prevent this comparison from being considered a strictly controlled head-to-head evaluation.
4.4.3. LivDet 2015 SOTA Analysis
Table 5 summarizes the reported literature results on LivDet 2015. SFAD-Net obtains a mean ACER of 2.60% across the four evaluated sensors in the present study. The reported methods exhibit substantial variation in performance and sensor coverage. For example, OPG-PAD [17] and Slim-ResCNN [12] report mean ACER values of 2.86% and 2.59%, respectively, while several other methods report higher error rates on the sensors for which results are available. SFAD-Net achieves ACER values between 2.00% and 3.13% across HiScan, CrossMatch, GreenBit, and Time-Series in the present evaluation. The results therefore indicate competitive performance relative to the published literature while also demonstrating coverage across all four evaluated sensors. Because the published competing results may use different training procedures, preprocessing strategies, thresholds, and sensor subsets, the values should be interpreted as literature-based reference points rather than evidence of strict superiority under identical conditions.
4.4.4. Statistical Stability Analysis Across Multiple Random Seeds
To assess the stability and reproducibility of the proposed SFAD-Net, five independent training runs were conducted on the LivDet 2011 Digital Persona sensor using different random seeds. The predefined LivDet training and testing partitions were retained for all runs, while the random seed was varied to capture the effects of stochastic factors such as weight initialization, data shuffling, and mini-batch sampling. Temperature scaling and EER-based threshold estimation were performed using only the training/validation data in each run, while the corresponding test partition was used exclusively for final evaluation.
As shown in Table 6, SFAD-Net achieves an average accuracy of 97.21% with a standard deviation of 1.75% across the five independent runs. The AUC remains high at 99.57 ± 0.43%, indicating stable discriminative performance across different random initializations. The F1-score, precision, and recall exhibit standard deviations of 1.74%, 1.93%, and 1.57%, respectively.
Table 6.
Statistical stability of SFAD-Net across five independent runs on the LivDet 2011 Digital Persona sensor.
For the PAD-specific error measures, the mean APCER and BPCER are 2.89 ± 1.94% and 2.70 ± 1.57%, respectively, resulting in an average ACER of 2.79 ± 1.75%. These results indicate that the observed performance is not dependent on a single training run and remains reasonably stable under different random seed initializations.
The measured inference throughput is 13.03 ± 0.77 FPS, showing limited runtime variation across the repeated evaluations. Overall, the five-run analysis on the LivDet 2011 Digital Persona sensor provides an explicit assessment of stochastic training variability and reproducibility under a clearly defined benchmark configuration.
4.5. Ablation Study
We conduct an ablation study to understand the role of each module in fingerprint PAD. The proposed method is performed on the fingerprint PAD task, and the experiment is set up on standard LivDet datasets to fairly examine the effect of spatial features, frequency-domain features, attention mechanism, and inference method.
4.5.1. Contribution of Dual-Stream Architecture
To examine the contribution of integrating spatial and frequency information, an ablation study was conducted on the LivDet 2015 HiScan sensor using the same training, testing, preprocessing, and inference protocol applied to the corresponding baseline evaluation. The following configurations were compared, and the results are presented in Table 7.
Table 7.
Effect of spatial and frequency branches on the LivDet 2015 HiScan sensor.
- Spatial-only model ();
- Frequency-only model ();
- Proposed dual-stream model ().
The dual-stream configuration achieves higher accuracy and lower ACER than either individual branch. The spatial stream captures structural characteristics such as ridge patterns, while the frequency stream provides complementary information related to frequency variations and presentation attack artifacts. The improvement obtained by combining both branches supports the use of complementary spatial and frequency representations within the proposed lightweight architecture.
4.5.2. Effect of Attention-Based Fusion
To examine the contribution of the attention-guided fusion mechanism, the proposed fusion strategy was compared with direct feature concatenation. This ablation was conducted on the LivDet 2015 HiScan sensor using the same experimental and inference protocol as the other ablation experiments. The results are presented in Table 8.
Table 8.
Effect of attention-based fusion on the LivDet 2015 HiScan sensor.
The attention-guided fusion configuration achieves higher accuracy and lower ACER than direct feature concatenation. This result indicates that adaptive weighting of the spatial and frequency representations can provide more effective feature integration than treating the two representations with equal importance. The result supports the contribution of the attention-guided fusion component under the evaluated LivDet 2015 HiScan setting.
4.5.3. Contribution of Frequency Decomposition (DWT Layer)
To investigate the contribution of the wavelet-based frequency representation, the DWT layer was removed and replaced with the corresponding conventional input representation. This ablation was conducted on the LivDet 2015 HiScan sensor using the same training, testing, preprocessing, and inference protocol as the other ablation experiments. The comparative results are presented in Table 9.
Table 9.
Influence of DWT-based frequency representation on the LivDet 2015 HiScan sensor.
The DWT-based configuration improves accuracy from 93.90% to 98.00% and reduces ACER from 6.10% to 2.00%. This result indicates that the wavelet-based frequency representation contributes useful complementary information for distinguishing bona fide fingerprints from presentation attacks. In particular, the decomposition provides both low-frequency structural information and higher-frequency components that can capture fine-grained variations associated with fingerprint presentation attacks. The observed improvement supports the inclusion of the DWT layer in the proposed architecture under the evaluated intra-sensor setting.
4.5.4. Impact of Frequency Representation at Frequency Branch
To justify the selection of the Haar wavelet for the proposed frequency branch, additional experiments were conducted on the LivDet 2011 Biometrika sensor by replacing the single-level Haar transform with alternative frequency representations, including the Daubechies wavelet (db2) and the Fourier transform (FFT). All models were trained and evaluated using the same predefined training and testing partitions while preserving the same dual-stream architecture, CNN encoder, optimizer, learning schedule, and other experimental settings to ensure consistent comparison. The comparative results are presented in Table 10.
Table 10.
Impact of frequency representation on PAD performance on the LivDet 2011 Biometrika Sensor.
The single-level Haar transform provides the best performance among the evaluated frequency representations, achieving 98.25% accuracy and the lowest ACER of 1.75%. The db2 wavelet achieves 94.51% accuracy with an ACER of 5.49%, indicating that the choice of wavelet representation affects the effectiveness of the frequency branch.
For the FFT-based configuration, the input image was first transformed using a two-dimensional FFT, followed by frequency centering and computation of the magnitude spectrum. The resulting magnitude spectrum was resized to match the input resolution of the frequency branch and replicated across four channels to maintain the same input dimensionality as the Haar-based representation. The FFT configuration used the same dual-stream architecture, CNN encoder, optimizer, learning schedule, and other hyperparameters as the Haar-based configuration.
Despite maintaining the same network and training configuration, the FFT-based representation achieved 50.06% accuracy and 50.00% ACER. This substantially lower performance may be attributed to the global nature of the Fourier magnitude representation, which does not preserve the spatial localization of frequency components in the same manner as the wavelet transform. In contrast, the single-level Haar transform jointly provides localized spatial and frequency information, which is more suitable for representing localized ridge and texture variations relevant to fingerprint presentation attacks. These results support the selection of the single-level Haar transform for the frequency branch under the evaluated LivDet 2011 Biometrika setting.
4.5.5. Analysis of Wavelet Sub-Bands and Decomposition Levels
To further investigate the contribution of individual wavelet components and quantitatively justify the selected decomposition configuration, an additional ablation study was conducted on the LivDet 2013 Italdata sensor using the proposed dual-stream architecture. The frequency branch was evaluated using individual wavelet sub-bands, different sub-band combinations, and different Haar decomposition levels. All experiments used the same predefined training and testing partitions, network architecture, training configuration, and inference protocol to ensure a consistent comparison. The results are presented in Table 11 and Table 12.
Table 11.
Contribution of individual wavelet sub-bands and their combinations on the LivDet 2013 Italdata sensor.
Table 12.
Effect of Haar wavelet decomposition level on PAD performance on the LivDet 2013 Italdata sensor.
The individual sub-band results show that the LL component provides the strongest standalone performance, achieving 98.25% accuracy and an ACER of 1.75%. However, combining all four sub-bands produces the best performance, reaching 99.50% accuracy, an F1-score of 0.9941, and an ACER of 0.50%. This improvement indicates that the wavelet components provide complementary information when jointly represented. For example, the LL+LH configuration improves the accuracy to 98.50% and reduces the ACER to 1.50% compared with the individual LL representation. The complete four-sub-band configuration provides the strongest result, suggesting that jointly modeling low-frequency structural information and localized directional and textural variations is beneficial for presentation attack detection.
To further investigate the effect of decomposition depth, the complete four-sub-band representation was evaluated using different levels of Haar decomposition. The results are presented in Table 12.
The decomposition-level analysis provides quantitative justification for selecting a single-level Haar transform in the proposed frequency branch. The single-level configuration achieves the highest accuracy and F1-score and the lowest ACER among the evaluated configurations. Although Haar Level 2 produces a marginally higher AUC of 0.9993 than Level 1 (0.9990), the difference is small, while Level 1 provides better classification and PAD-specific error-rate performance. Increasing the decomposition depth to Level 3 further reduces the AUC to 0.9959 and increases the ACER to 2.00%.
These results indicate that deeper decomposition does not necessarily improve PAD performance. The single-level Haar representation provides a favorable balance between localized frequency analysis and preservation of discriminative fingerprint structure. Accordingly, the complete single-level representation comprising the LL, LH, HL, and HH sub-bands was retained in the proposed frequency branch.
4.5.6. Cross-Sensor Evaluation
While the proposed architecture demonstrates good performance under intra-sensor evaluation, fingerprint presentation attack detection becomes more challenging when the training and testing samples are acquired using different sensors. Differences in sensing characteristics, image formation, ridge appearance, image quality, noise, and acquisition conditions can introduce a domain shift between the source and target distributions. To investigate this effect, an additional cross-sensor evaluation was performed using the LivDet 2015 dataset.
In this experiment, the model was trained using samples acquired from one sensor and evaluated directly on a different unseen sensor without target-domain adaptation or fine-tuning. Thus, each off-diagonal entry in Table 13 represents a source-to-target transfer in which the target sensor was not observed during training. This protocol provides a direct assessment of how well the learned spatial–frequency representations transfer across sensor domains.
Table 13.
Cross-sensor ACER (%) results on the LivDet 2015 dataset.
The diagonal entries in Table 13, corresponding to intra-sensor evaluation, remain low, with ACER values between 2.00% and 3.13%. In contrast, all off-diagonal transfers produce substantially higher ACER values, ranging from 17.38% to 22.41%. This consistent increase confirms that the learned representations are affected by sensor-dependent distribution shifts when the target sensor is unseen during training.
A pairwise examination of the results shows that the magnitude of degradation is dependent on the particular source–target combination. When Green Bit is used for training, the ACER increases from 2.25% under Green Bit testing to 17.40% for Time-Series, 18.27% for HiScan, and 20.54% for CrossMatch testing. The relatively progressive increase across these target sensors indicates that the representation learned from Green Bit does not transfer equally well to all target domains. The largest degradation in this row occurs for CrossMatch, suggesting a comparatively larger distribution difference between the Green Bit source domain and the CrossMatch target domain.
For Time-Series training, the corresponding off-diagonal ACER values are 19.89% for Green Bit, 20.92% for HiScan, and 22.18% for CrossMatch, compared with 3.13% for the matched sensor. The relatively high errors across all three target sensors indicate that the features learned from Time-Series are particularly sensitive to the change of acquisition domain in this evaluation. Among these transfers, CrossMatch produces the highest ACER of 22.18%, while Green Bit produces the lowest at 19.89%. This difference suggests that the degree of feature mismatch depends not only on the presence of a sensor change but also on the specific source–target pair.
The HiScan-trained model provides another clear example of asymmetric cross-sensor behavior. Its ACER increases from 2.00% for matched HiScan testing to 20.53% for Green Bit, 17.38% for Time-Series, and 22.41% for CrossMatch. The HiScan-to-Time-Series transfer gives the lowest off-diagonal ACER in the complete matrix, at 17.38%, whereas HiScan-to-CrossMatch gives the highest value, at 22.41%. Thus, changing the target sensor does not produce a uniform degradation. The substantially different results for Time-Series and CrossMatch indicate that the learned representation has different levels of compatibility with the corresponding target-domain feature distributions.
Similarly, when CrossMatch is used as the training domain, the ACER values increase from 3.03% for matched testing to 18.60% for Green Bit, 19.45% for Time-Series, and 20.83% for HiScan. The CrossMatch-to-Green Bit transfer gives the lowest degradation in this row, whereas CrossMatch-to-HiScan gives a higher degradation. These results further demonstrate that cross-sensor transfer is asymmetric: training on sensor A and testing on sensor B does not necessarily produce the same performance as training on sensor B and testing on sensor A.
The pairwise differences can be interpreted in terms of the distribution mismatch between the corresponding source and target domains. Sensor-dependent changes in image formation can affect ridge contrast, local ridge continuity, texture appearance, noise patterns, and other low-level characteristics that are available to the network during training. Differences in the interaction between the fingerprint surface, presentation attack material, and sensing surface can also alter the appearance of spoof-related structures. Consequently, a feature representation that is highly discriminative within one sensor domain may not remain equally discriminative after the appearance and statistical characteristics of the input images change. Importantly, the present experiments do not independently measure these individual sensor characteristics; therefore, these factors are considered plausible explanations for the observed pairwise differences rather than directly established causal factors.
The asymmetric behavior of the source–target pairs is also relevant to the proposed spatial–frequency representation. The spatial branch primarily captures local structural and appearance information, including ridge-related patterns that can be affected by sensor-dependent image characteristics. The frequency branch provides complementary information by representing variations in local spatial–frequency content through wavelet-based decomposition. This complementary representation can preserve discriminative information that may not be equally visible in the spatial representation alone. However, the off-diagonal ACER values demonstrate that the frequency representation does not make the learned features completely sensor invariant. Sensor-dependent changes can affect both spatial structures and frequency distributions, allowing source-domain characteristics to remain embedded in the learned representation.
The results therefore indicate that the proposed dual-stream architecture provides complementary spatial and frequency information but does not explicitly solve the cross-sensor domain-shift problem. In particular, the lowest off-diagonal ACER of 17.38% remains substantially higher than the intra-sensor ACER values of 2.00–3.13%, while the highest off-diagonal ACER reaches 22.41%. Hence, the cross-sensor experiment should not be interpreted as evidence of complete sensor robustness. Instead, it identifies the extent to which sensor-dependent distributions influence the current model and provides a basis for future domain-invariant learning strategies.
A possible approach to reducing this performance gap is domain adaptation, in which information from the target sensor is used to align source and target feature distributions. For example, feature-distribution alignment or adversarial domain adaptation could be incorporated to reduce sensor-specific discrepancies while preserving PAD-discriminative information. Domain generalization provides another direction when target-sensor data are unavailable during training. Training with multiple sensor domains, domain-randomization strategies, domain-invariant objectives, or sensor-diverse feature learning could encourage the network to focus on presentation-attack characteristics that are less dependent on a particular acquisition device. These approaches are particularly relevant to the present results because the observed degradation varies across source–target pairs rather than following a single uniform pattern.
Overall, the cross-sensor evaluation demonstrates that sensor-induced domain shift is a major limitation of the current framework. The results provide a more detailed view of this limitation by showing that the magnitude of degradation depends on the specific source and target sensors. While the spatial–frequency design provides complementary representations and supports strong intra-sensor PAD performance, explicit domain adaptation or domain generalization mechanisms are required to further reduce sensor dependence. These approaches will be investigated in future work to improve transferability across heterogeneous fingerprint sensors.
4.5.7. Effect of Inference Strategies
The contribution of the inference-stage strategies was evaluated incrementally on the LivDet 2015 HiScan sensor using the same experimental protocol. The baseline configuration uses the standard inference procedure, followed by test-time augmentation (TTA) and probability calibration through temperature scaling. For each experiment, the temperature parameter was estimated exclusively using the training/validation data. After calibration, the EER-based decision threshold was determined using the calibrated validation scores. The resulting temperature parameter and decision threshold were then fixed and applied to the corresponding held-out test partition. Thus, the test partition was not used for temperature estimation, threshold selection, model selection, or parameter estimation. The results of the incremental inference-strategy evaluation are presented in Table 14.
Table 14.
Effect of inference enhancements on the LivDet 2015 HiScan sensor.
The results show a gradual improvement from the baseline inference configuration to TTA and then to the combined TTA and calibration configuration. TTA aggregates predictions from the original and horizontally flipped inputs, providing additional prediction evidence at inference time. Temperature scaling itself preserves the ordering of the model scores and therefore does not independently change the class ranking under a fixed decision threshold. In the proposed pipeline, its effect is realized through the subsequent EER-based threshold estimation: the calibrated validation scores are used to determine the operating threshold, and this threshold is then fixed before evaluating the held-out test partition. Therefore, the improvement from 97.80% to 98.00% in accuracy and from 2.20% to 2.00% in ACER is attributed to the combined inference procedure, including score calibration and validation-derived threshold selection, rather than to test set optimization.
4.5.8. Discussion
Overall, the ablation studies demonstrate that the spatial and frequency branches provide complementary discriminative information for fingerprint presentation attack detection. The attention-guided fusion effectively combines these representations, while the single-level Haar wavelet decomposition provides a favorable balance between detection performance and computational efficiency.
4.6. Deployment Analysis
In addition to detection performance, we evaluate the deployment efficiency of the proposed framework in terms of inference latency, throughput, model size, computational complexity, and memory footprint.
4.6.1. Inference Efficiency
The inference efficiency of the proposed model was evaluated using batch experiments on the local computational system. The model achieves an average inference latency of 81.21 ms per sample, corresponding to approximately 12.31 frames per second (FPS). This performance enables near real-time operation in the local computational benchmarking setup while maintaining an effective balance between computational cost and presentation attack detection performance.
4.6.2. Model Size and Memory Footprint
The original trained SFAD-Net model occupies 4.86 MB of storage in the model representation used for the workstation-based computational benchmarking. This compact model size is achieved through an efficient architectural design and optimized parameter utilization. For clarity, this value differs from the model sizes reported for Raspberry Pi deployment because the latter correspond to converted TensorFlow Lite representations of the trained model. Specifically, the Raspberry Pi experiments use separate FP32, FP16, and INT8 TensorFlow Lite representations, whose sizes are reported in Section 6. Therefore, the 4.86 MB value and the TensorFlow Lite model sizes should not be interpreted as measurements of the same file representation.
4.6.3. Computational Complexity
The computational complexity of the proposed model was evaluated in terms of floating-point operations (FLOPs) and the number of learnable parameters. The model requires approximately 2.56 GFLOPs per inference and contains only 0.41 million parameters, which is considerably lower than many conventional CNN-based fingerprint PAD models. This lightweight design reduces computational overhead while improving deployment efficiency on resource-constrained platforms.
Overall, the proposed framework achieves an effective balance between detection performance and computational efficiency. The actual hardware deployment performance of the proposed framework is further evaluated directly on a 4 GB Raspberry Pi 5 in Section 6.
4.6.4. Hardware Feasibility
The computational efficiency of the proposed SFAD-Net was evaluated against representative deep learning architectures using a controlled workstation-based benchmarking protocol. Deep CNN, ResNet50, MobileNetV1, and EfficientNetB0 were implemented and evaluated under the same workstation environment as SFAD-Net, using the same input resolution, batch size, and inference measurement procedure. Thus, unlike the literature-based SOTA comparisons presented in Table 3, Table 4 and Table 5, the results in Table 15 represent a controlled computational comparison performed by the authors rather than values collected from different publications.
Table 15.
Controlled computational comparison of SFAD-Net with representative CNN architectures under the same workstation-based benchmarking setup.
As shown in Table 15, SFAD-Net provides the most favorable computational profile among the evaluated architectures. It contains 0.41 million parameters and requires 2.56 GFLOPs while achieving the highest measured throughput of 12.31 FPS. Its model size of 4.86 MB is also substantially smaller than those of the comparison architectures. In particular, SFAD-Net has approximately 91.5% fewer parameters than ResNet50 and approximately 90.6% lower model storage requirements. Although MobileNetV1 provides relatively low computational complexity, SFAD-Net achieves higher measured throughput with fewer parameters and a smaller model footprint.
Because all comparison models were evaluated using the same workstation-based benchmarking procedure, these results provide a controlled assessment of their relative computational characteristics. Nevertheless, the reported FPS values remain dependent on the hardware, software implementation, and inference configuration and should not be interpreted as universal inference speeds across different platforms. Direct edge-device feasibility of SFAD-Net is evaluated separately on a 4 GB Raspberry Pi 5 in Section 6.
4.7. Hyperparameter Sensitivity Analysis
To optimize the proposed dual-stream network, a detailed hyperparameter sensitivity analysis is performed. As opposed to incremental learning-based methods like SFincBuster, deep feature learning is central to the proposed method; thus, crucial training and architectural hyperparameters are carefully tuned.
We conduct experiments to determine the effects of varying batch size, learning rate, dropout rate, label smoothing factor, and attention reduction ratio. We measure model performance based on classification accuracy on the validation set, as summarized in Table 16.
Table 16.
Hyperparameter sensitivity analysis of the proposed model.
The model attains an accuracy of 98.25% on the validation set, which also corresponds to optimal values for AUC (0.9977), F1-score (0.9825), precision (0.9849), and recall (0.9800). The values for APCER (1.49%), BPCER (2.00%), and ACER (1.75%) indicate that the classifier achieves a well-balanced decision boundary between the bona fide and spoof classes.
From the hyperparameter analysis, it is observed that a moderate batch size (32) yields stable gradient estimates, and a learning rate of together with cosine decay provides better convergence. With dropout (0.3) and label smoothing (), the model shows improved generalization during training by alleviating overfitting and reducing prediction overconfidence, resulting in better performance under the evaluated intra-sensor setting.
Moreover, an attention reduction ratio of 16 provides a good compromise between model capacity and computation cost, enabling effective channel-wise feature recalibration without an increase in the number of parameters.
5. Interpretability Analysis
To provide additional insight into the decision-making process of the proposed SFAD-Net, feature visualization was performed using Grad-CAM together with the intermediate feature maps generated by the spatial attention and wavelet-based frequency branches. Representative Live and Spoof fingerprint samples are illustrated in Figure 6. The Grad-CAM visualizations indicate the image regions that contribute most to the network predictions. The SE-reweighted feature maps emphasize informative fingerprint regions while suppressing less relevant responses, illustrating the effect of the channel attention mechanism. The DWT feature activation maps exhibit complementary activation patterns to those observed in the spatial branch, indicating that the wavelet-based frequency representation captures additional discriminative information.
Figure 6.
Interpretability analysis of the proposed SFAD-Net using representative Live and Spoof fingerprint samples. Grad-CAM visualizations indicate the image regions contributing to the network predictions, the SE-reweighted feature maps illustrate the effect of the channel attention mechanism, and the DWT feature activation maps show the complementary frequency representations learned by the wavelet-based branch.
Qualitatively, the Live and Spoof samples exhibit different activation patterns across the spatial and frequency representations, suggesting that the proposed dual-stream architecture utilizes complementary information from both domains during fingerprint presentation attack detection. These visualizations provide qualitative insight into the learned feature representations and the regions receiving stronger model responses.
Quantitative Grad-CAM Activation Analysis
To complement the qualitative Grad-CAM visualizations, a quantitative activation-concentration analysis was performed on 200 correctly classified test samples, comprising 100 Live and 100 Spoof samples. Three measures were used to characterize the spatial distribution of the Grad-CAM responses: the activation concentration ratio within the top 20% most-activated pixels (ACR@20), normalized activation entropy (AEnorm), and mean activation intensity (MAI). These measures quantify the spatial concentration and distribution of the Grad-CAM activation maps without requiring expert annotations or ground-truth localization masks.
As shown in Table 17, the Live samples achieved an ACR@20 of , whereas the Spoof samples achieved . Thus, within the evaluated test set, the Grad-CAM responses for Spoof samples were more concentrated within the most highly activated regions. The corresponding normalized activation entropy values were for Live samples and for Spoof samples, which is consistent with the higher concentration observed for the Spoof responses. The MAI values were and for Live and Spoof samples, respectively.
Table 17.
Quantitative Grad-CAM activation analysis on correctly classified test samples.
Overall, these quantitative measurements provide an objective characterization of the spatial distribution of the learned Grad-CAM responses and complement the visual analysis in Figure 6. The results indicate that the network produces measurably different activation concentration patterns for Live and Spoof samples within the evaluated test set.
It should be noted that ACR@20, AE_norm, and MAI characterize the geometric distribution and concentration of the Grad-CAM activation maps rather than localization accuracy. Expert validation, bounding-box annotations, or segmentation masks identifying the actual spoof artifacts were not available for the evaluated samples. Therefore, these results are not interpreted as evidence of ground-truth artifact localization. Instead, the quantitative analysis provides measurable evidence regarding the spatial concentration of the model responses and strengthens the qualitative interpretability analysis without introducing unsupported localization claims.
6. Raspberry Pi 5 Hardware Deployment
To further evaluate the practical deployment feasibility of SFAD-Net, the proposed framework was evaluated directly on a Raspberry Pi 5 with 4 GB of RAM, as illustrated in Figure 7. Three TensorFlow Lite representations of the trained model were considered: FP32, FP16, and fully quantized INT8. All models received the same preprocessed fingerprint images with an input resolution of . For each configuration, 10 warm-up inferences were first performed to reduce initialization effects, followed by 100 inference runs for performance measurement. Average inference latency, latency standard deviation, throughput, model size, system-level RAM usage, and CPU temperature were recorded, and the resulting deployment performance is summarized in Table 18.
Figure 7.
SFAD-Net deployment and inference evaluation on the Raspberry Pi 5.
Table 18.
SFAD-Net deployment performance measured directly on a 4 GB Raspberry Pi 5.
The FP32 model achieves an average inference latency of 103.03 ms, corresponding to 9.71 FPS, with a model size of 1.58 MB. The FP16 representation reduces the model size to 0.80 MB, approximately half that of FP32, while providing a similar average latency of 103.11 ms and throughput of 9.70 FPS. Thus, under the tested Raspberry Pi 5 configuration, FP16 substantially reduces storage requirements but does not provide a measurable latency improvement compared with FP32.
The fully quantized INT8 representation provides the highest computational efficiency among the evaluated configurations. Its model size is reduced to 0.45 MB, while the average inference latency decreases to 35.99 ms, corresponding to 27.79 FPS. Compared with FP32, this represents approximately a 65.1% reduction in average latency and a 2.86× increase in throughput. The latency standard deviation is 0.05 ms, indicating low variation across the 100 measured inference runs.
The system-level RAM measurements were 27.61 MB for FP32 and 8.02 MB for FP16. For INT8, the measured change in system-level RAM usage was 0.00 MB. This value does not indicate zero actual memory consumption by the INT8 model; rather, the additional memory usage was below the measurement resolution of the system-level monitoring method and was therefore recorded as 0.00 MB. The observed CPU temperatures were 58.7 °C, 62.0 °C, and 60.4 °C for FP32, FP16, and INT8, respectively.
To determine whether reduced-precision representations affect PAD detection performance, the FP32, FP16, and INT8 models were additionally evaluated on the LivDet 2015 CrossMatch test partition using the same evaluation protocol. For each representation, calibration and EER-based threshold estimation were performed exclusively using the corresponding training/validation data, while the CrossMatch test partition was reserved for final evaluation. Thus, no test-set samples were used for calibration or threshold selection. The resulting detection performance is reported in Table 19.
Table 19.
PAD detection performance of FP32, FP16, and INT8 TensorFlow Lite models on the LivDet 2015 CrossMatch test partition.
The FP16 representation maintains PAD performance close to FP32. FP16 achieves 96.30% accuracy and 3.70% ACER, compared with 96.25% accuracy and 3.75% ACER for FP32. The corresponding AUC, F1-score, APCER, BPCER, and EER values also remain close to those of FP32. These results indicate that FP16 substantially reduces the deployment model size while preserving detection performance under the evaluated CrossMatch condition.
In contrast, INT8 quantization results in a noticeable reduction in PAD detection performance. Accuracy decreases from 96.25% for FP32 to 87.00%, while ACER increases from 3.75% to 13.00%. The largest change is observed in BPCER, which increases from 3.10% to 21.00%. The AUC also decreases from 99.426% to 98.366%, while EER increases from 3.55% to 6.50%. These results demonstrate that, although INT8 provides substantial computational and storage benefits, fully quantized inference can introduce a measurable degradation in PAD performance under the evaluated CrossMatch condition.
Overall, the Raspberry Pi 5 experiments demonstrate an efficiency–accuracy trade-off among the evaluated TensorFlow Lite representations. FP16 reduces the deployment model size while maintaining PAD performance close to FP32, whereas INT8 provides substantially higher throughput and lower latency at the cost of reduced PAD detection performance in the evaluated CrossMatch condition. Therefore, the results indicate that reduced-precision deployment should be selected by jointly considering computational efficiency and PAD detection reliability.
It should also be noted that the 4.86 MB model size reported in Section 4.6 and the 1.58 MB FP32 model size reported here refer to different model representations. The former corresponds to the trained model used for the workstation-based computational analysis, whereas the latter corresponds to its converted TensorFlow Lite FP32 deployment representation. Consequently, the two values are not directly inconsistent and reflect the storage characteristics of different model formats.
The Raspberry Pi 5 results provide direct hardware-based evidence of the deployment characteristics of SFAD-Net on a resource-constrained edge platform and complement the model-level computational analysis presented earlier.
7. Limitations and Future Work
Although SFAD-Net achieves strong intra-sensor performance and demonstrates direct deployment feasibility on a Raspberry Pi 5, several limitations remain concerning cross-sensor generalization, interpretability, external dataset validation, and broader hardware evaluation.
7.1. Cross-Sensor Domain Shift
The cross-sensor evaluation demonstrates that sensor-induced domain shifts remain a significant challenge when SFAD-Net is evaluated on previously unseen sensors. The observed degradation can be attributed to differences in sensing technology, image quality, ridge representation, noise characteristics, and acquisition conditions, which can alter both spatial and frequency characteristics. The degradation also varies across sensor pairs; for example, the HiScan-to-CrossMatch configuration produces an ACER of 22.41%, whereas HiScan-to-Time-Series produces 17.38%. This indicates that domain shift depends on the specific source–target sensor relationship rather than being uniform across sensors. Although the proposed spatial–frequency design provides complementary representations, it does not explicitly enforce sensor-invariant feature learning. Future work will therefore investigate domain adaptation and domain generalization techniques to reduce sensor-dependent performance degradation.
7.2. Quantitative Interpretability and Localization
The Grad-CAM analysis is complemented by quantitative activation-distribution measures, including ACR@20, normalized activation entropy, and MAI. These measures quantify the concentration and spatial distribution of model activations but do not evaluate localization accuracy. Expert annotations, bounding boxes, or pixel-level ground-truth masks were not available for the evaluated datasets; therefore, localization accuracy could not be directly assessed without introducing unsupported annotations. This limitation is explicitly acknowledged, and future work will incorporate expert-defined regions or localization masks to enable objective localization-based interpretability evaluation.
7.3. Generalization Beyond the LivDet Benchmark
SFAD-Net has been extensively evaluated on the LivDet 2011, 2013, and 2015 benchmark datasets; however, generalization beyond the LivDet benchmark has not been demonstrated in the present study. Additional independent fingerprint PAD datasets may contain different sensors, acquisition conditions, fingerprint populations, and presentation attack materials. Future work will therefore evaluate SFAD-Net on independent public fingerprint PAD datasets to further assess its generalizability beyond the LivDet benchmark.
7.4. Broader Edge-Device Validation
The proposed framework was directly evaluated on a 4 GB Raspberry Pi 5 using FP32, FP16, and INT8 TensorFlow Lite models, providing direct hardware-based evidence of edge deployment feasibility. However, these measurements represent the characteristics of the selected Raspberry Pi 5 hardware and software environment and should not be assumed to represent all embedded or mobile platforms. Future work will evaluate SFAD-Net on additional embedded and mobile devices with different CPU, GPU, NPU, memory, and acceleration characteristics to investigate deployment portability, scalability, and energy efficiency.
8. Conclusions
This work presented SFAD-Net, a lightweight dual-stream spatial–frequency architecture for fingerprint presentation attack detection. The framework integrates spatial and wavelet-based frequency representations with an attention-guided fusion mechanism to learn complementary features while maintaining a compact computational profile. Experiments on the LivDet 2011, LivDet 2013, and LivDet 2015 datasets achieved low APCER, BPCER, and ACER values under the standard intra-sensor evaluation protocol. The ablation studies further provided empirical evidence for the contribution of the spatial–frequency integration, wavelet representation, and attention-guided fusion within the proposed architecture.
The cross-sensor evaluation on LivDet 2015 showed reduced performance on an unseen sensor, highlighting the effect of sensor-dependent differences in image characteristics, sensing conditions, and spoof material interactions. Thus, the proposed spatial–frequency design does not eliminate sensor dependence. The quantitative Grad-CAM analysis provided complementary quantitative analysis of activation concentration using ACR@20, normalized activation entropy, and mean activation intensity. Since ground-truth localization annotations were unavailable, these measures characterize activation distributions and should not be interpreted as direct localization accuracy.
SFAD-Net contains 0.41 million parameters, requires 2.56 GFLOPs, and has a model size of 4.86 MB, achieving 12.31 FPS in the controlled workstation-based benchmark. Direct evaluation on a 4 GB Raspberry Pi 5 provided direct evidence of execution on a resource-constrained edge platform. Under the evaluated LivDet 2015 Crossmatch condition, FP16 substantially reduced model size while maintaining PAD performance close to FP32. INT8 provided higher computational efficiency, achieving 35.99 ms latency, 27.79 FPS, and a model size of 0.45 MB, but it introduced a noticeable degradation in PAD performance. These results highlight the need to jointly consider computational efficiency and detection reliability when selecting model precision for edge deployment.
Future work will focus on improving cross-sensor robustness through domain adaptation and domain generalization, evaluating the framework on additional independent fingerprint PAD datasets, and conducting stronger interpretability validation using expert-annotated localization data. Further investigation of model compression and deployment across diverse embedded and mobile hardware platforms will also be considered, together with evaluation under more diverse and sophisticated presentation attack scenarios.
Author Contributions
Conceptualization: C.R., E.K.; Data Curation: A.P., R.D.A.R.; Investigation: C.R., E.K., R.D.A.R.; Methodology: C.R., J.S.; Project Administration: C.R.; Resources: A.P., R.D.A.R.; Software: A.P., R.D.A.R.; Supervision: C.R., J.S.; Writing—Original Draft: E.K. All authors have read and agreed to the published version of the manuscript.
Funding
This research received no external funding.
Institutional Review Board Statement
No participants were involved in this study. Hence, ethical approval, informed consent, and adherence to institutional or licensing regulations are not applicable.
Data Availability Statement
The fingerprint datasets analyzed during this study are available from the official LivDet competition website: http://livdet.org/. Access to the datasets is subject to the registration and usage policies established by the LivDet organizers and the corresponding dataset providers (accessed on 27 February 2026).
Conflicts of Interest
The authors declare no conflicts of interest.
References
- Orrù, G.; Tuveri, P.; Ghiani, L.; Marcialis, G.L. Analysis of ‘user-specific effect’ and impact of operator skills on fingerprint pad systems. In Proceedings of the International Conference on Image Analysis and Processing (ICIAP 2019), Trento, Italy, 9–13 September 2019; pp. 48–56. [Google Scholar]
- González-Soler, L.J.; Gomez-Barrero, M.; Chang, L.; Perez-Suarez, A.; Busch, C. On the impact of different fabrication materials on fingerprint presentation attack detection. In Proceedings of the International Conference on Biometrics (ICB 2019), Crete, Greece, 4–7 June 2019; pp. 1–6. [Google Scholar]
- Micheletto, M.; Marcialis, G.L.; Orrù, G.; Roli, F. Fingerprint recognition with embedded presentation attack detection: Are we ready? IEEE Trans. Inf. Forensics Secur. 2021, 16, 5338–5351. [Google Scholar] [CrossRef] [Scilit]
- Speir, J.A.; Hietpas, J. Frequency filtering to suppress background noise in fingerprint evidence: Quantifying the fidelity of digitally enhanced fingerprint images. Forensic Sci. Int. 2014, 242, 94–102. [Google Scholar] [CrossRef] [Scilit] [PubMed]
- Chimata, G.P.; Schwartz, C.J. Investigation of friction mechanisms in finger pad sliding against surfaces of varying roughness. Biotribology 2015, 3, 11–19. [Google Scholar] [CrossRef] [Scilit]
- Dubey, R.K.; Goh, J.; Thing, V.L.L. Fingerprint liveness detection from single image using low-level features and shape analysis. IEEE Trans. Inf. Forensics Secur. 2016, 11, 1461–1475. [Google Scholar] [CrossRef] [Scilit]
- Xia, Z.; Yuan, C.; Lv, R.; Sun, X.; Xiong, N.N.; Shi, Y.-Q. A novel Weber local binary descriptor for fingerprint liveness detection. IEEE Trans. Syst. Man Cybern. Syst. 2018, 50, 1526–1536. [Google Scholar] [CrossRef] [Scilit]
- Yuan, C.; Sun, X. Fingerprint liveness detection using histogram of oriented gradient-based texture features. J. Internet Technol. 2018, 19, 1499–1507. [Google Scholar]
- Sharma, R.P.; Anshul, A.; Jha, A.; Dey, S. Investigating fingerprint quality features for liveness detection. In Mining Intelligence and Knowledge Exploration; Purushothama, B.R., Thenkanidiyoor, V., Prasath, R., Vanga, O., Eds.; Springer: Cham, Switzerland, 2020; pp. 296–307. [Google Scholar]
- Chugh, T.; Cao, K.; Jain, A.K. Fingerprint spoof detection using minutiae-based local patches. In Proceedings of the 2017 IEEE International Joint Conference on Biometrics (IJCB), Denver, CO, USA, 1–4 October 2017; pp. 581–589. [Google Scholar]
- Jian, W.; Zhou, Y.; Liu, H. Densely connected convolutional network optimized by genetic algorithm for fingerprint liveness detection. IEEE Access 2020, 9, 2229–2243. [Google Scholar] [CrossRef] [Scilit]
- Zhang, Y.; Shi, D.; Zhan, X.; Cao, D.; Zhu, K.; Li, Z. Slim-ResCNN: A deep residual convolutional neural network for fingerprint liveness detection. IEEE Access 2019, 7, 91476–91487. [Google Scholar] [CrossRef] [Scilit]
- Yuan, C.; Xia, Z.; Jiang, L.; Cao, Y.; Wu, Q.M.J.; Sun, X. Fingerprint liveness detection using an improved CNN with image scale equalization. IEEE Access 2019, 7, 26953–26966. [Google Scholar] [CrossRef] [Scilit]
- Uliyan, D.M.; Sadeghi, S.; Jalab, H.A. Anti-spoofing method for fingerprint recognition using patch-based deep learning machine. Eng. Sci. Technol. Int. J. 2020, 23, 264–273. [Google Scholar] [CrossRef] [Scilit]
- Kolberg, J.; Grimmer, M.; Gomez-Barrero, M.; Busch, C. Anomaly detection with convolutional autoencoders for fingerprint presentation attack detection. IEEE Trans. Biom. Behav. Identity Sci. 2021, 3, 190–202. [Google Scholar] [CrossRef] [Scilit]
- Anshul, A.; Jha, A.; Jain, P.; Sharma, R.P.; Dey, S. An enhanced generative adversarial network model for fingerprint presentation attack detection. SN Comput. Sci. 2023, 4, 444. [Google Scholar] [CrossRef] [Scilit]
- Rai, A.; Anshul, A.; Jha, A.; Jain, P.; Sharma, R.P.; Dey, S. An open patch generator based fingerprint presentation attack detection using generative adversarial network. Multimed. Tools Appl. 2024, 83, 27723–27746. [Google Scholar] [CrossRef] [Scilit]
- Raja, K.; Ramachandra, R.; Venkatesh, S.; Gomez-Barrero, M.; Rathgeb, C.; Busch, C. Vision transformers for fingerprint presentation attack detection. In Handbook of Biometric Anti-Spoofing; Springer: Singapore, 2023; pp. 17–56. [Google Scholar]
- Zhang, K.; Huang, S.; Liu, E.; Zhao, H. LFLDNet: Lightweight fingerprint liveness detection based on ResNet and transformer. Sensors 2023, 23, 6854. [Google Scholar] [CrossRef] [Scilit] [PubMed]
- Micheletto, M.; Orrù, G.; Ghiani, L.; Marcialis, G.L. Improving fingerprint presentation attack detection by an approach integrated into the personal verification stage. IEEE Trans. Biom. Behav. Identity Sci. 2025, 7, 654–667. [Google Scholar] [CrossRef] [Scilit]
- Grosz, S.A.; Chugh, T.; Jain, A.K. Fingerprint presentation attack detection: A sensor and material agnostic approach. In Proceedings of the 2020 IEEE International Joint Conference on Biometrics (IJCB), Houston, TX, USA, 28 September 2020–1 October 2020; pp. 1–10. [Google Scholar]
- Liu, H.; Zhang, W.; Liu, F.; Wu, H.; Shen, L. Fingerprint presentation attack detector using global-local model. IEEE Trans. Cybern. 2021, 52, 12315–12328. [Google Scholar] [CrossRef] [Scilit] [PubMed]
- Zhang, W.; Liu, H.; Liu, F. Fingerprint presentation attack detection by learning in frequency domain. In Proceedings of the IEEE International Conference on Pattern Recognition and Machine Learning (PRML 2021), Chengdu, China, 16–18 July 2021; pp. 183–189. [Google Scholar]
- Tolosana, R.; Gomez-Barrero, M.; Kolberg, J.; Morales, A.; Busch, C.; Ortega-Garcia, J. Towards fingerprint presentation attack detection based on convolutional neural networks and short wave infrared imaging. In Proceedings of the 2018 International Conference of the Biometrics Special Interest Group (BIOSIG), Darmstadt, Germany, 26–28 September 2018; pp. 1–5. [Google Scholar]
- Sharma, D.; Selwal, A. HyFiPAD: A hybrid approach for fingerprint presentation attack detection using local and adaptive image features. Vis. Comput. 2022, 38, 2999–3025. [Google Scholar] [CrossRef] [Scilit]
- Liu, Y.-P.; Yu, H.; Fang, H.; Li, Z.; Chen, P.; Liang, R. A Wavelet-Based Memory Autoencoder for Noncontact Fingerprint Presentation Attack Detection. IEEE Trans. Inf. Forensics Secur. 2024, 19, 8717–8730. [Google Scholar] [CrossRef] [Scilit]
- Tahir, Y.S.; Jarno, A.D.; Aruwa, M.M.M.; Yusri, W.A.F.W.M.; Rosdi, B.A. Robust Fingerprint Anti-Spoofing: Integrating Wavelet Scattering and Convolutional Neural Network. In Proceedings of the 2025 IEEE 8th International Conference on Electrical, Control and Computer Engineering (InECCE 2025), Kuantan, Malaysia, 27–28 August 2025; pp. 269–274. [Google Scholar]
- Li, H.; Ramachandra, R. A Survey on Deep Learning Techniques for Fingerprint Presentation Attack Detection. Sensors 2026, 26, 1283. [Google Scholar] [CrossRef] [Scilit] [PubMed]
- Pallakonda, A.; Raj, R.D.A.; Yanamala, R.M.R.; Napoli, C.; Randieri, C. TL-Efficient-SE: A Transfer Learning-Based Attention-Enhanced Model for Fingerprint Liveness Detection Across Multi-Sensor Spoof Attacks. Mach. Learn. Knowl. Extr. 2025, 7, 113. [Google Scholar] [CrossRef] [Scilit]
- Wang, H.; Xiao, K.; Zhu, C.; Liu, Y.; Yan, R. OCT fingerprint presentation attack detection based on dual-branch reconstruction differences. IEEE Trans. Instrum. Meas. 2025, 74, 5030514. [Google Scholar] [CrossRef] [Scilit]
- Huang, C.; Fei, H.; Luo, P.; Li, J.; Feng, J. Fingerprint presentation attack detection with fixed prototype contrastive learning and anomaly detection. IEEE Signal Process. Lett. 2026, 33, 1831–1835. [Google Scholar] [CrossRef] [Scilit]
- Dell’Olmo, P.V.; Kuznetsov, O.; Frontoni, E.; Arnesano, M.; Napoli, C.; Randieri, C. Dataset Dependency in CNN-Based Copy-Move Forgery Detection: A Multi-Dataset Comparative Analysis. Mach. Learn. Knowl. Extr. 2025, 7, 54. [Google Scholar] [CrossRef] [Scilit]
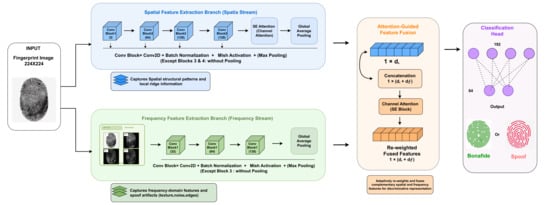
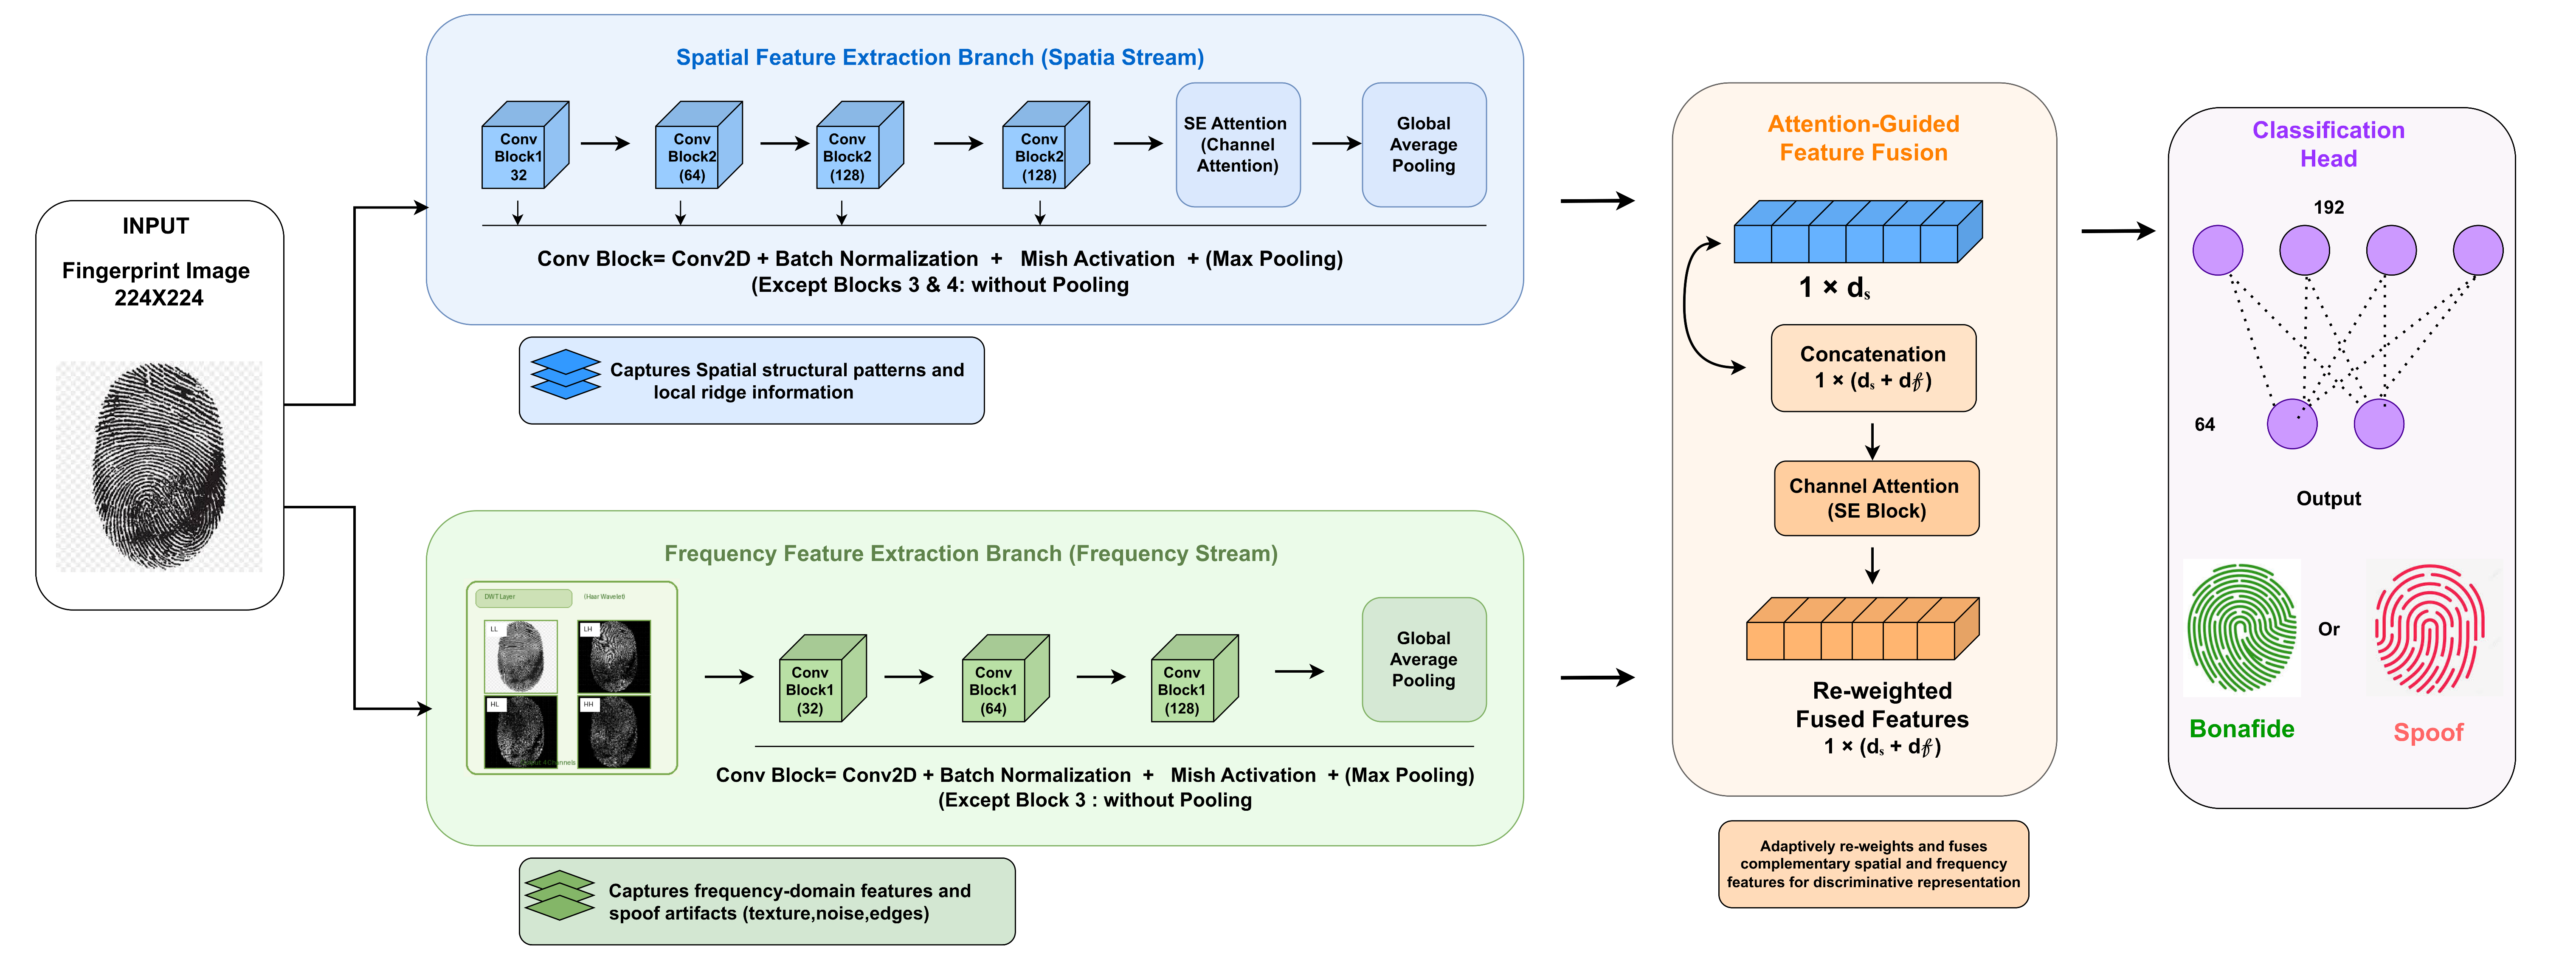
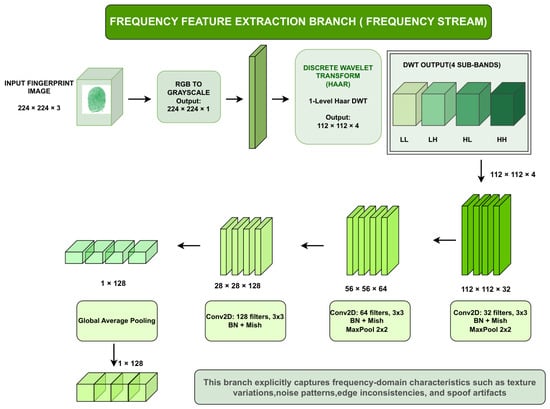
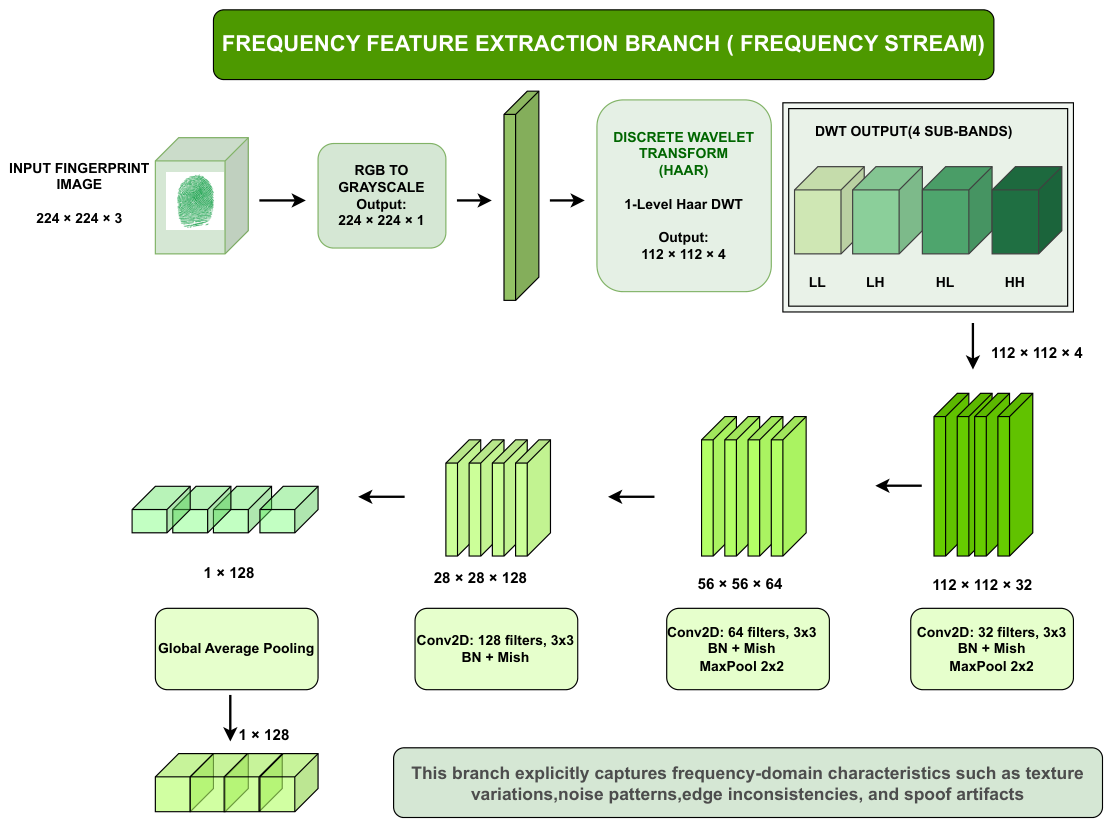
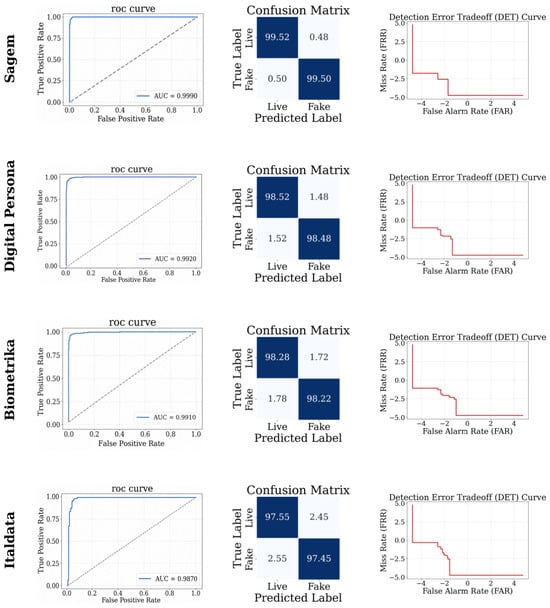
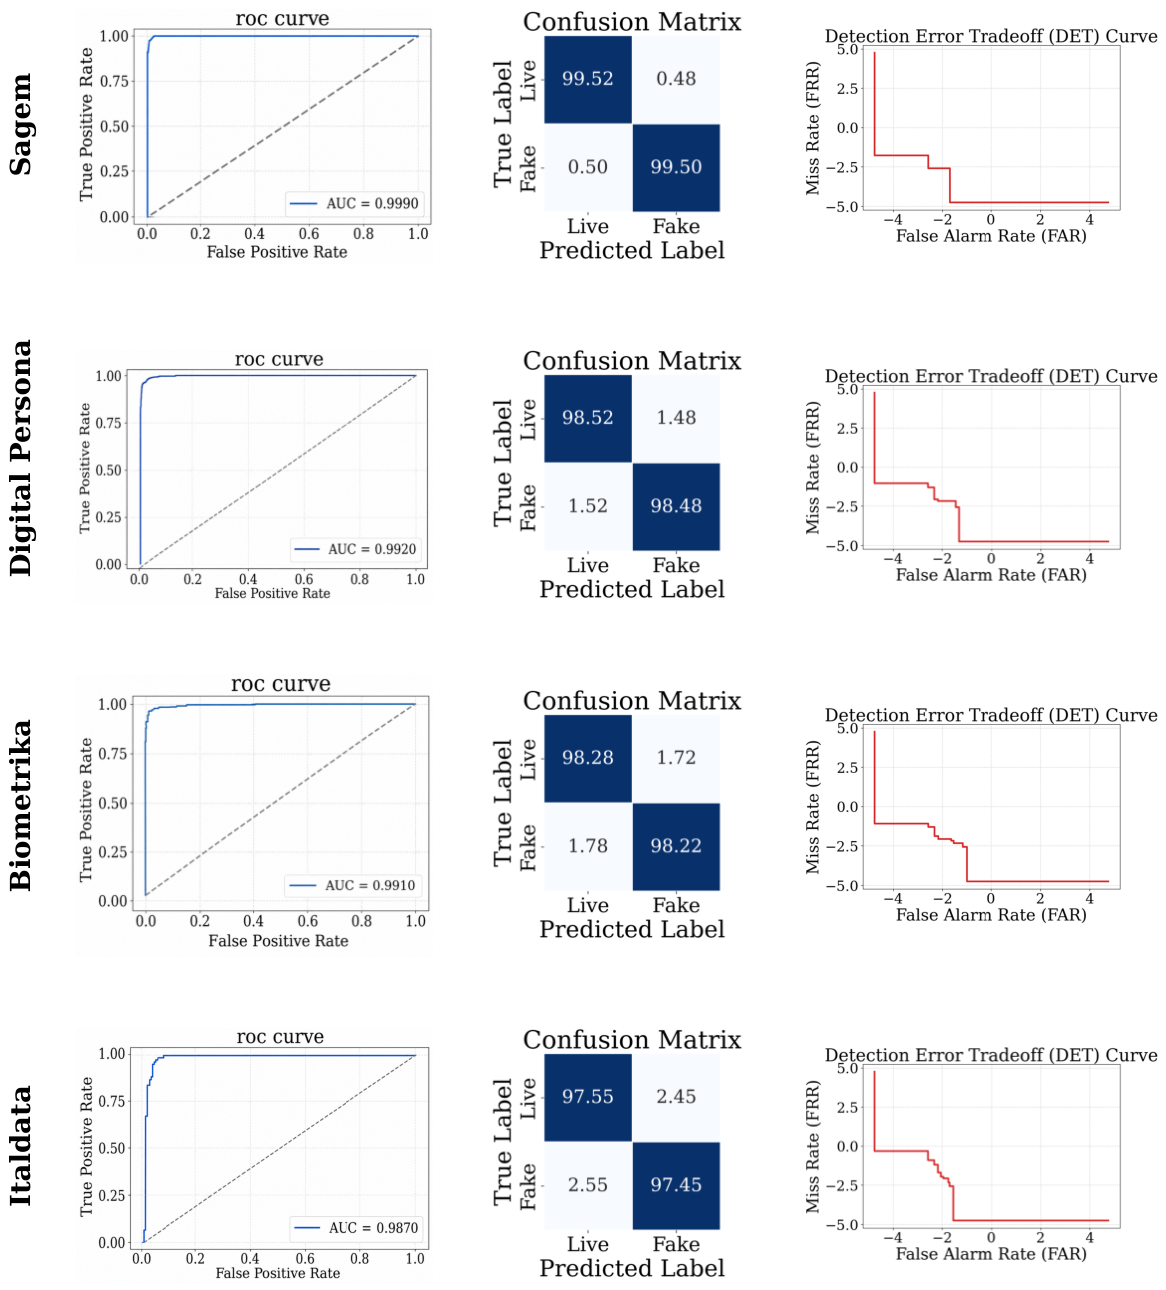
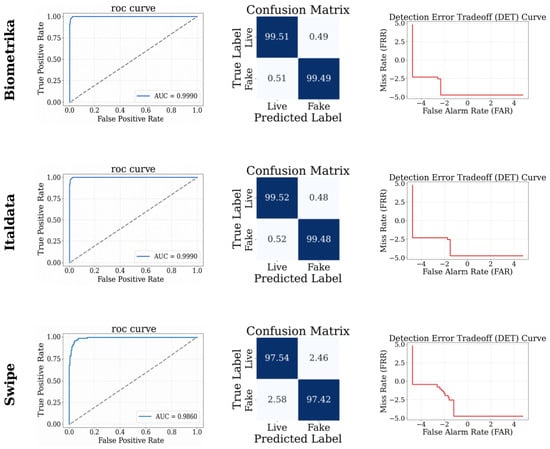
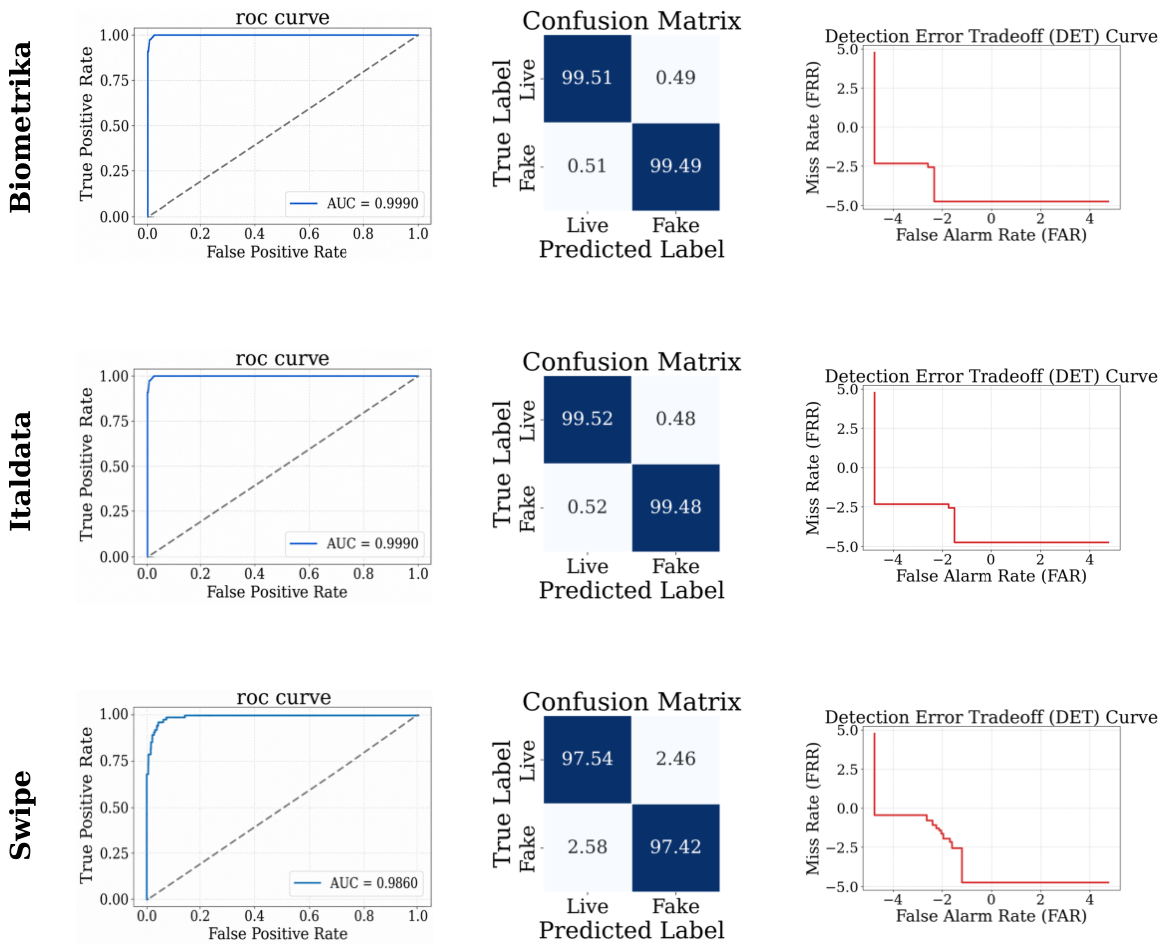
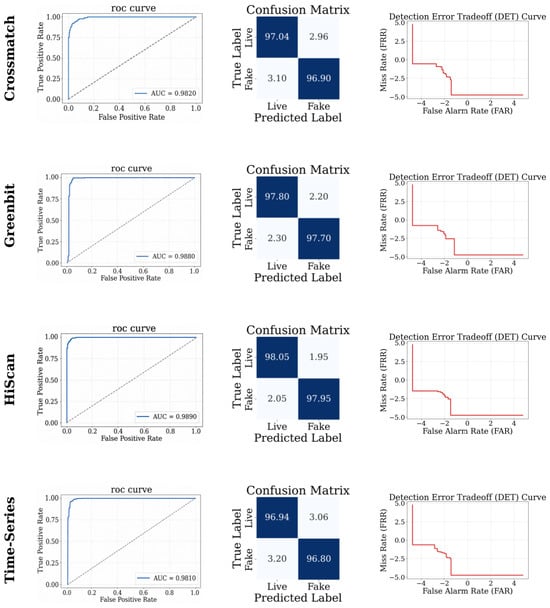
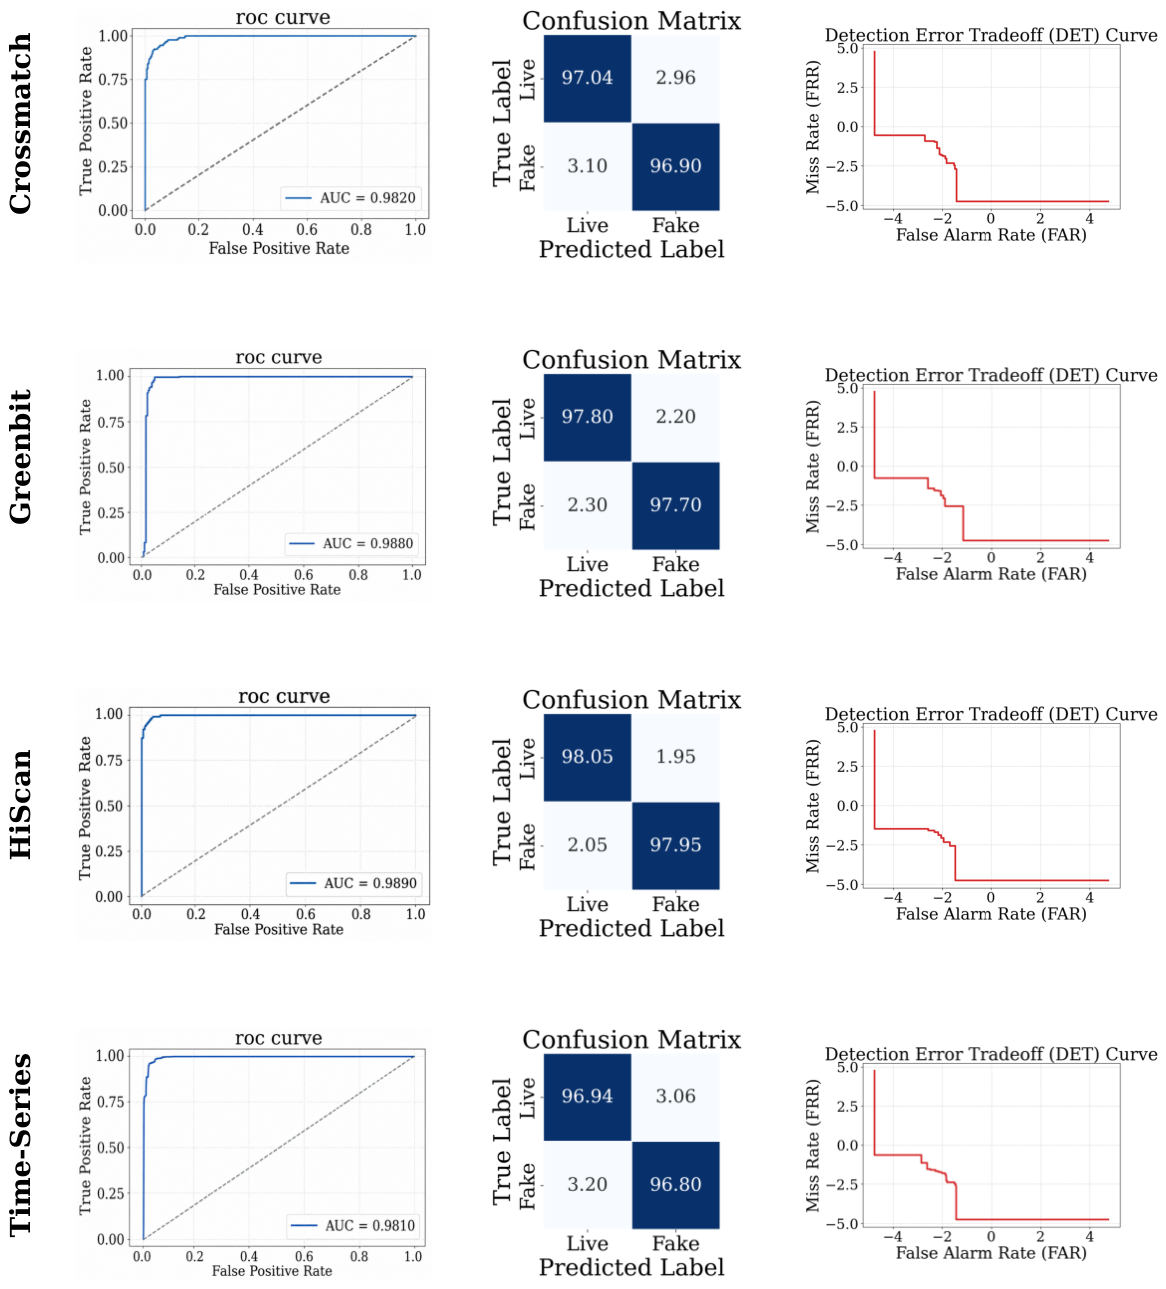
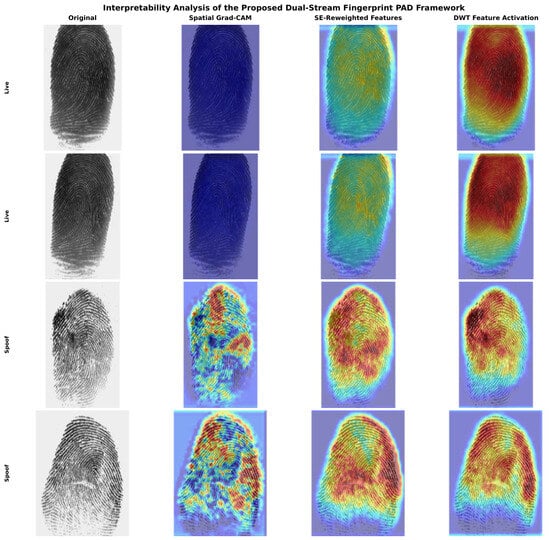
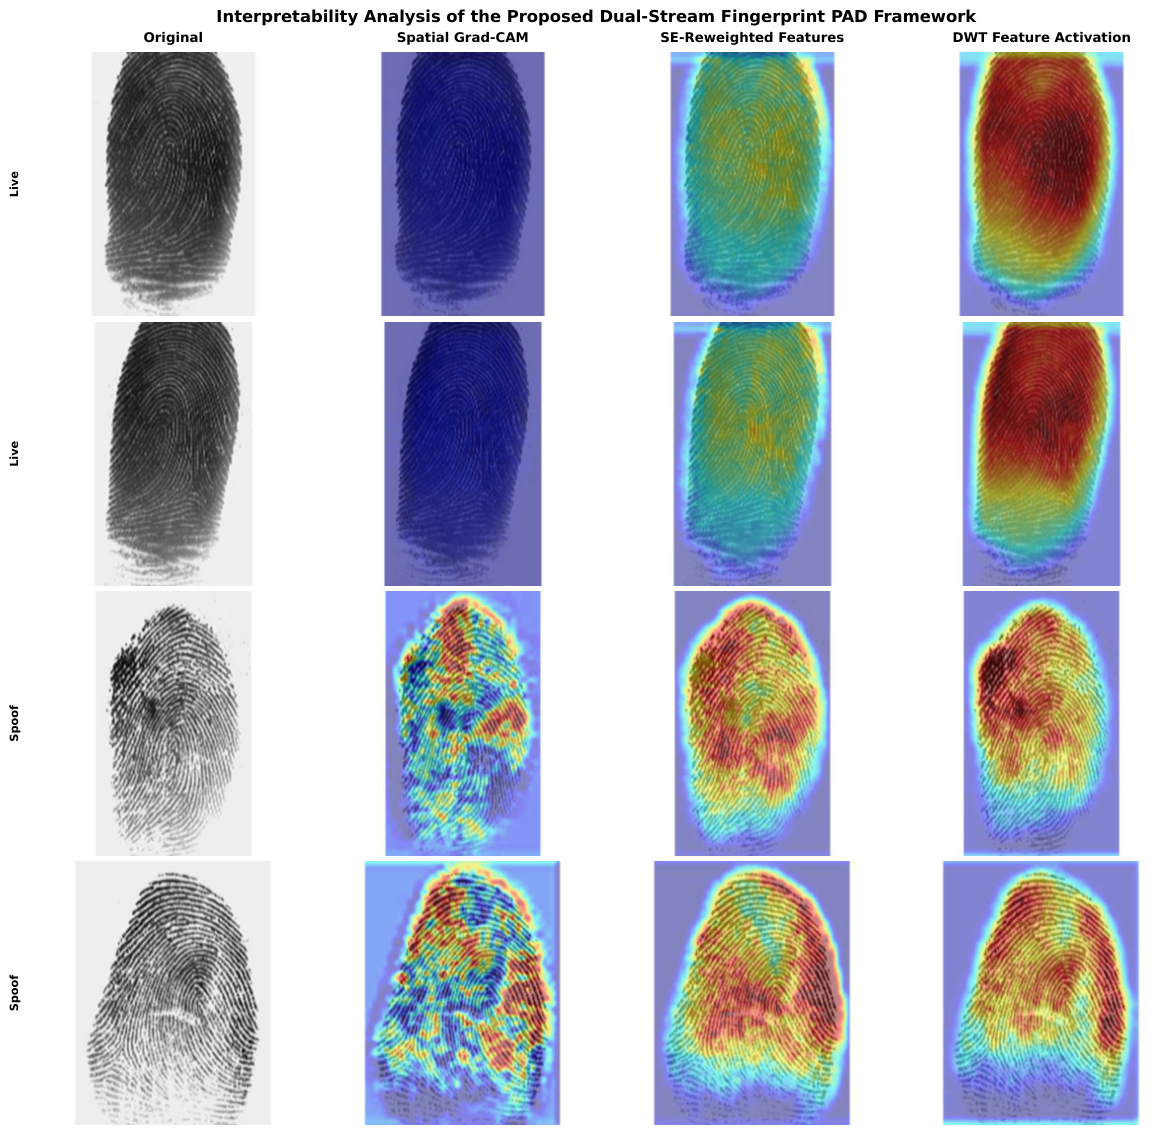
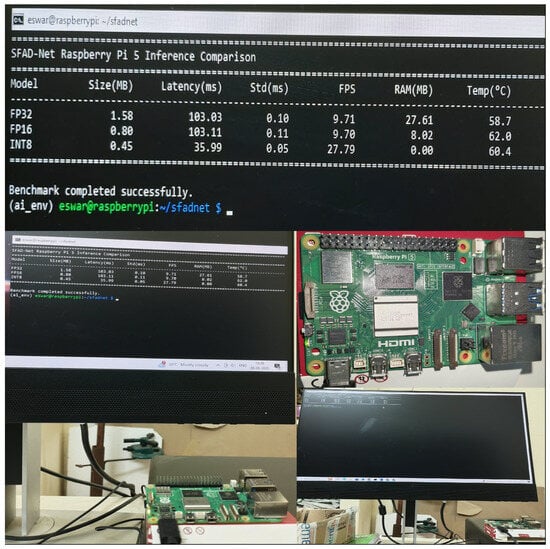
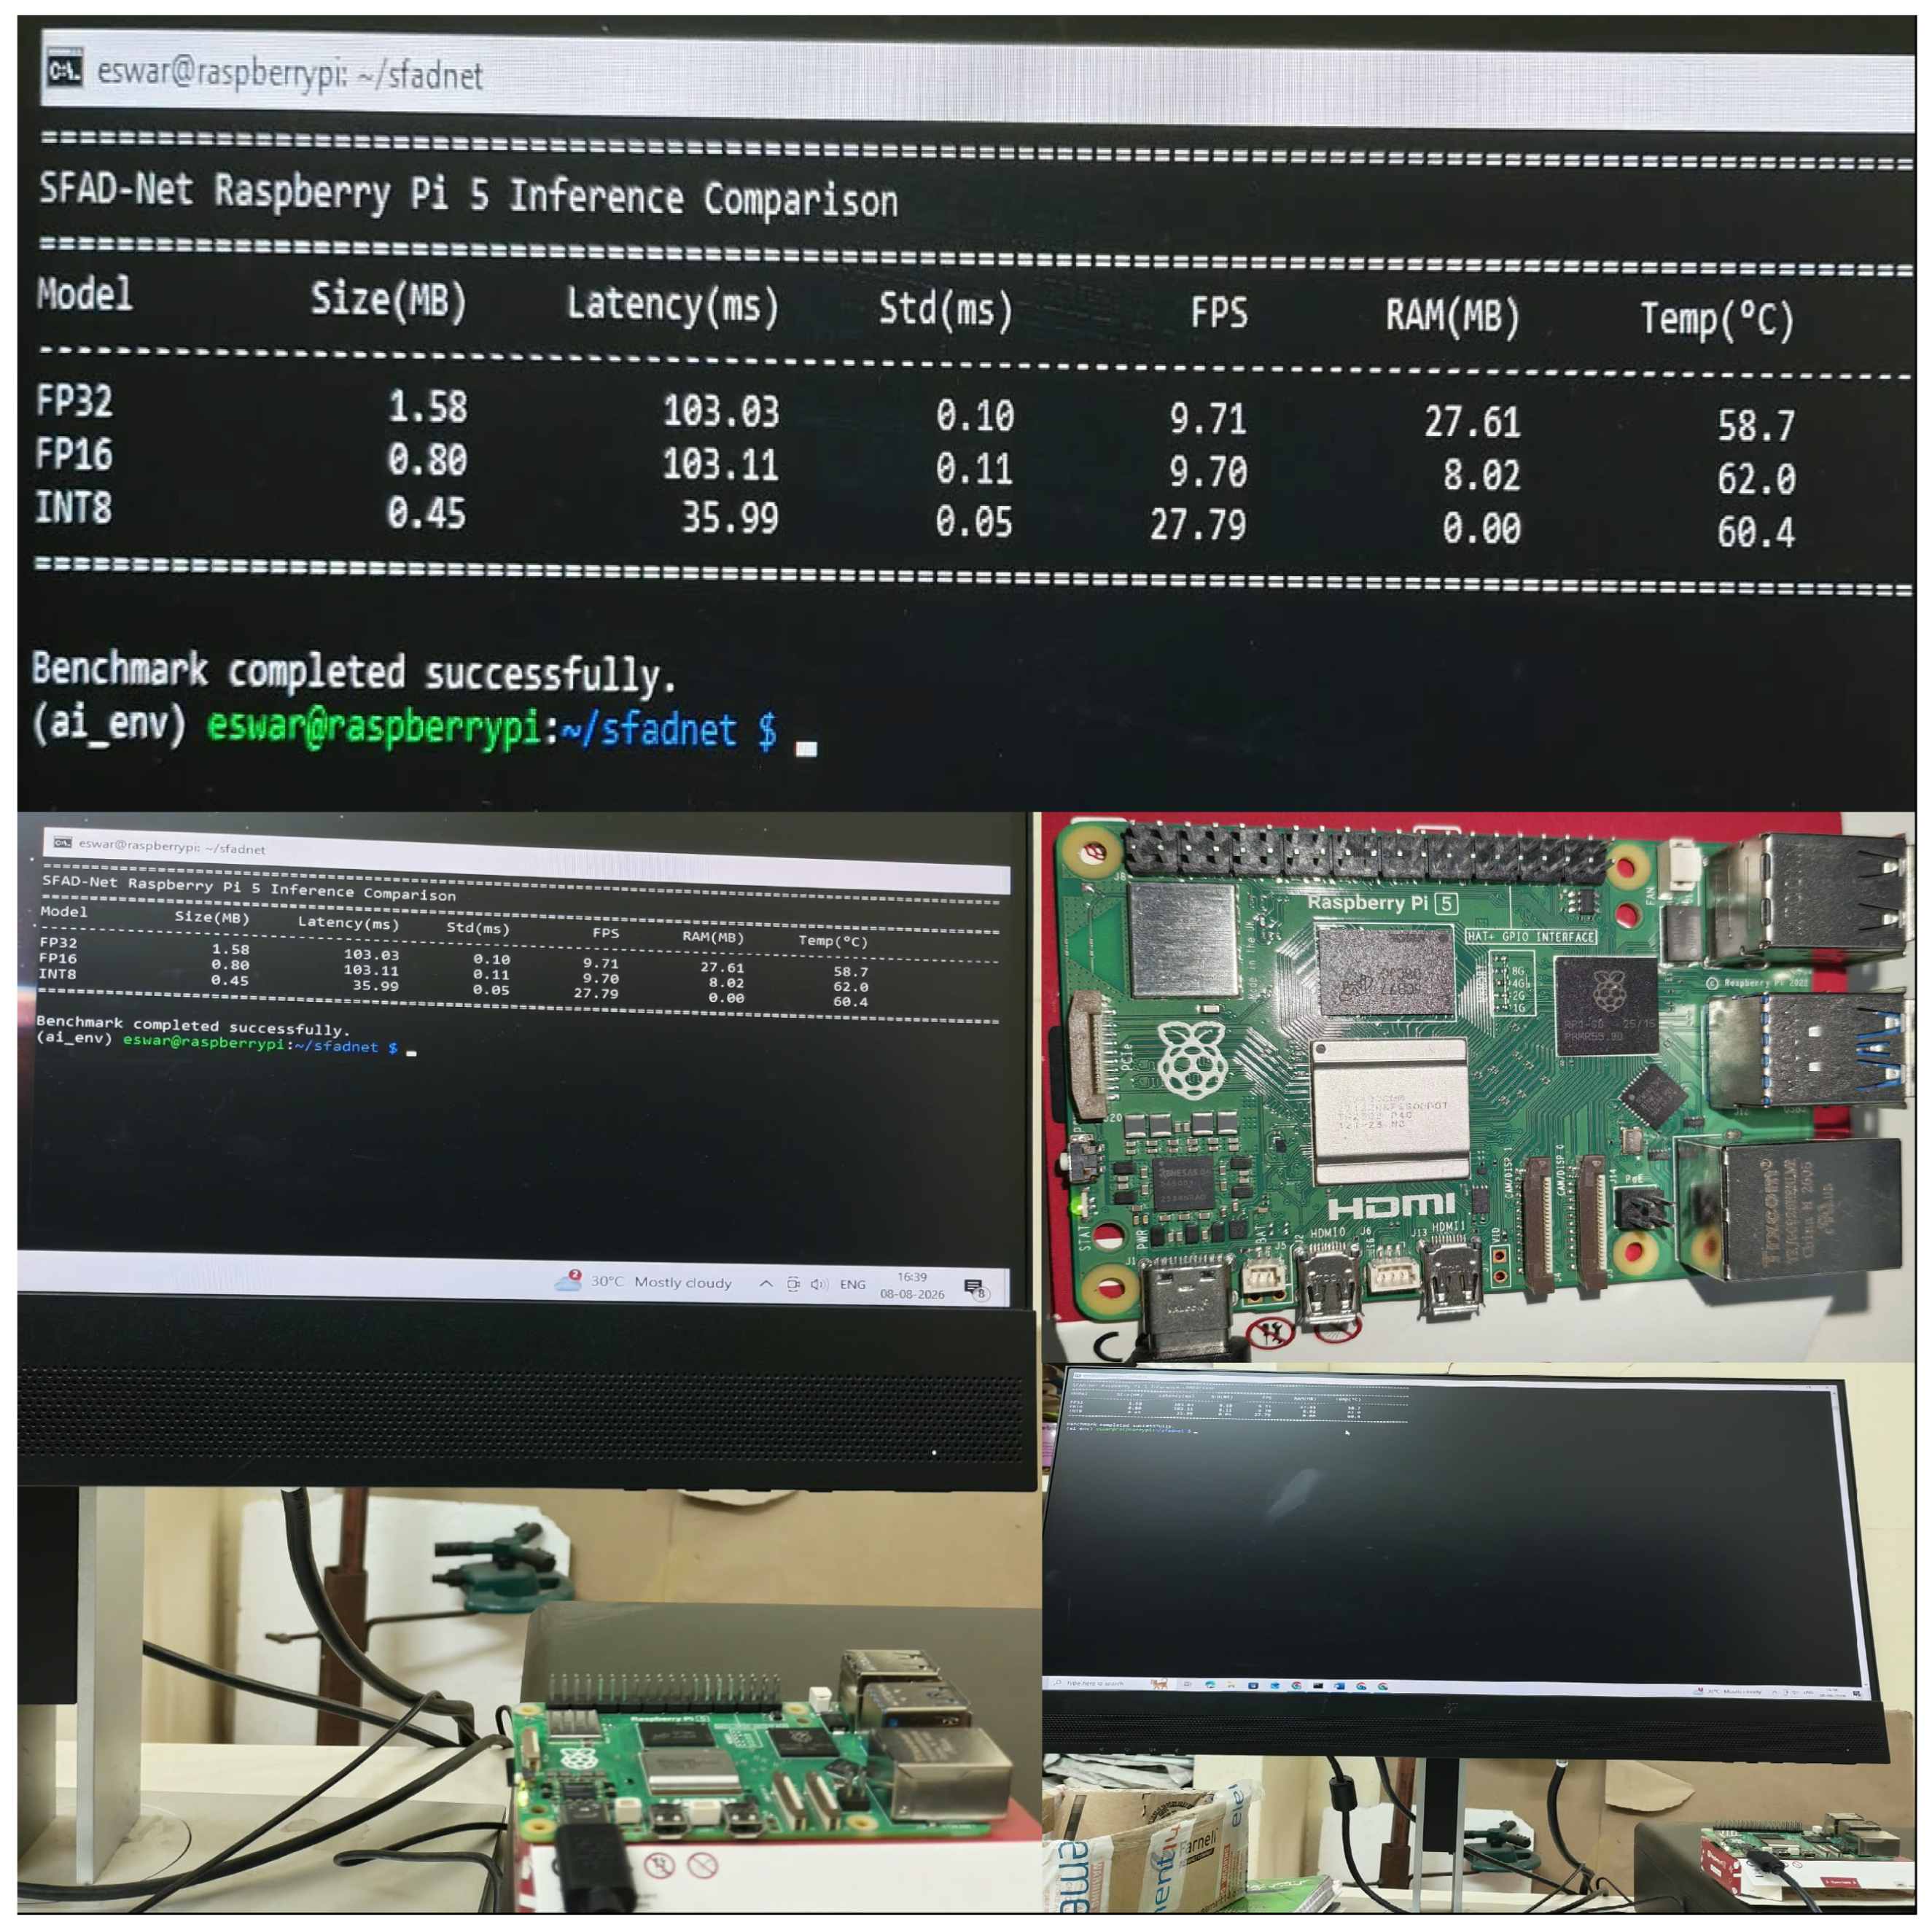

Disclaimer/Publisher’s Note: The statements, opinions and data contained in all publications are solely those of the individual author(s) and contributor(s) and not of MDPI and/or the editor(s). MDPI and/or the editor(s) disclaim responsibility for any injury to people or property resulting from any ideas, methods, instructions or products referred to in the content. |
© 2026 by the authors. Licensee MDPI, Basel, Switzerland. This article is an open access article distributed under the terms and conditions of the Creative Commons Attribution (CC BY) license.