


Abstract
Diaphragm-type hydrogen compressors serve as core equipment in hydrogen refueling stations, yet their early-stage deployment faces critical challenges, including insufficient fault mode data accumulation and unclear health evaluation criteria. Conventional manual operation and maintenance monitoring methods suffer from low efficiency and poor reliability, failing to meet the demand for safe and stable operation. To address these limitations, this study proposes a novel abnormal state detection methodology applicable under no-fault sample conditions. The approach leverages data symmetry enhancement techniques to expand the training dataset using only normal operation records, and integrates multi-source sensor data for comprehensive equipment health analysis. Experimental results show that the proposed method achieves 96% detection accuracy, an approximately 8% missed detection rate, and millisecond computational latency, significantly outperforming traditional detection algorithms. This work provides a practical solution for early-stage equipment monitoring without fault samples, enhancing both technical robustness and operational efficiency for diaphragm hydrogen compressor maintenance.
1. Introduction
Hydrogen refueling stations are critical infrastructure for enabling hydrogen energy applications and play a vital role [1]. Diaphragm hydrogen compressors, known for advantages such as zero contamination, excellent sealing performance, and high compression ratio, serve as core equipment in hydrogen refueling stations. Their safe and reliable operation is crucial for ensuring long-term stable station performance [2]. Between 2020 and 2022, a Sinopec hydrogen refueling station experienced multiple failures in its diaphragm hydrogen compressors, including seal ring malfunctions and diaphragm ruptures, significantly disrupting prolonged stable operation. Research indicates that due to extreme working conditions—such as high pressure, intense vibration, and frequent start–stop cycles—key components of diaphragm hydrogen compressors are highly prone to leaks, cracks, and other faults [3]. Statistics show that compressor-related failures account for 21% of total maintenance incidents [4] and 13% of total maintenance hours [5] in hydrogen refueling stations. Thus, the reliable operation of hydrogen compressors is fundamental to the long-term stability of hydrogen refueling stations [6].
Currently, the operation and maintenance of diaphragm hydrogen compressors primarily rely on manual monitoring and individual analysis of key data points [7]. Given the lack of accumulated fault data and ambiguous health assessment standards, expert experience is often used to improve reliability. However, this approach has three drawbacks: Low efficiency—Manual recording and analysis of data points are time-consuming and labor-intensive, making it difficult to process large datasets quickly. Subjectivity—Judgments vary among personnel, leading to inconsistent and potentially inaccurate assessments. High labor costs—Dedicated personnel must continuously monitor and analyze data, increasing operational expenses.
For single-source diagnosis, Kumar et al. [8], Zhang et al. [9], and Rossi et al. [10] proposed air/rotary compressor fault diagnosis methods based on signal decomposition–discriminant analysis, Bayesian dual-graph attention networks, and explainable deep learning, achieving 88.88–98.5% accuracy and up to 72 h early warning. For diaphragm-type machinery, Meng et al. [11] combined signal demodulation with PCA-ResNet for 96.2% diaphragm pump fault diagnosis; Wang et al. [12] integrated fault knowledge graphs with PCA-SPE-CNN for 100% classification of two compressor faults; Li et al. [13] developed a dynamic oil pressure-based method with 94.7% accuracy for diaphragm rupture early warning in actual stations.
Multi-source fusion overcomes single-source limitations: Xie et al. [14] achieved 99.2% accuracy via multi-signal-to-RGB image fusion; Li et al. [15] developed a heterogeneous graph convolutional network with 88.87% accuracy under small samples; Bo et al. [16] fused vibration and current signals for 99.0% induction motor diagnosis. Advanced fusion methods include causal dynamic reasoning [17], multimodal spatiotemporal Transformer [18], noise-robust multi-pooling attention Transformer [19], and multi-scale feature fusion networks [20], offering novel approaches for condition monitoring of complex equipment.
To address industrial fault sample scarcity, unsupervised and zero-shot methods have emerged: Yu et al. [21] proposed a reconstruction-based contribution method validated using a simulated process and a real industrial process; Liu et al. [22] developed an autoencoder-based unknown fault detector with 94.2% average F1-score; Chen et al. [23] presented a simulation-driven zero-shot framework achieving 91.7% accuracy via pseudo-fault sample synthesis.
Despite these advances, three critical limitations remain: most methods target general equipment, with insufficient research on the extreme conditions of diaphragm hydrogen compressors and a focus on single fault modes; multi-source fusion ignores sensor interference and asynchrony under high pressure and strong vibration; fault-free sample methods are mostly laboratory-validated and poorly adapt to the strong nonlinearity and coupling of hydrogen compressors. Thus, current methods cannot be directly applied to complex, fault-free sample diaphragm hydrogen compressor operation and maintenance.
To address these challenges, this paper proposes an anomaly detection method for diaphragm hydrogen compressors based on symmetry-enhanced data fusion, without requiring fault samples. Key innovations include: data sharpening techniques to enhance training data diversity using only normal operation data, improving model generalization; symmetry-based long-term data augmentation to incorporate temporal dependencies, reducing false alarms from non-fault anomalies. The method was validated using long-term monitoring data from a diaphragm hydrogen compressor, demonstrating its effectiveness.
2. Materials and Methods
2.1. Related Study
(1) Anomaly detection. Anomaly detection is often equated with binary classification for fault diagnosis. However, the author argues that these concepts are not equivalent. Fundamentally, “anomaly” represents the superset of all potential faults rather than constituting a single class. Treating it as a binary classification problem by directly applying existing classification algorithms may lead to non-convergence in fault data identification.
From an application perspective, fault diagnosis typically targets specific components (e.g., bearing inner race wear, connecting rod fractures, or shaft misalignment), whereas anomaly detection focuses on equipment or systems as a whole, manifested as deviations from designed performance metrics (e.g., excessive operational noise or reduced output power). Consequently, anomaly detection methodologies should emphasize characterizing the holistic operational state of equipment/systems. When employing existing classification algorithms, modifications to the optimization function are necessary to accommodate this paradigm.
(2) Data augmentation. Data augmentation serves as a critical technique in machine and deep learning, enhancing data diversity and volume through dataset transformations [8]. By exposing models to more varied data during training, it promotes broader feature learning and improves generalization to unseen data [9].
In industrial contexts, the “safety-first” principle creates unique challenges: fault data collection is inherently difficult, and the non-reproducible nature of industrial failures exacerbates training data scarcity. While existing research has explored data augmentation methods for industrial applications, current studies primarily address small-sample expansion rather than effectively handling unknown-class detection under class imbalance conditions.
2.2. Data Symmetric Fusion Augmentation Method
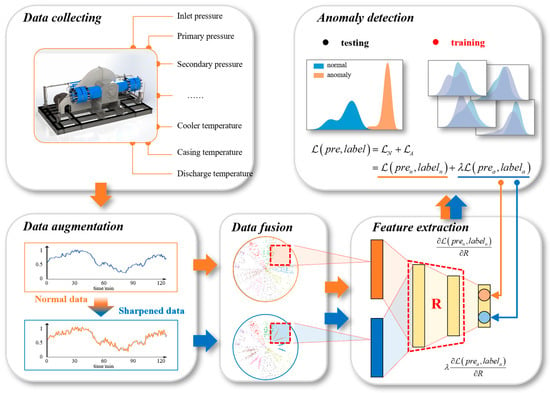
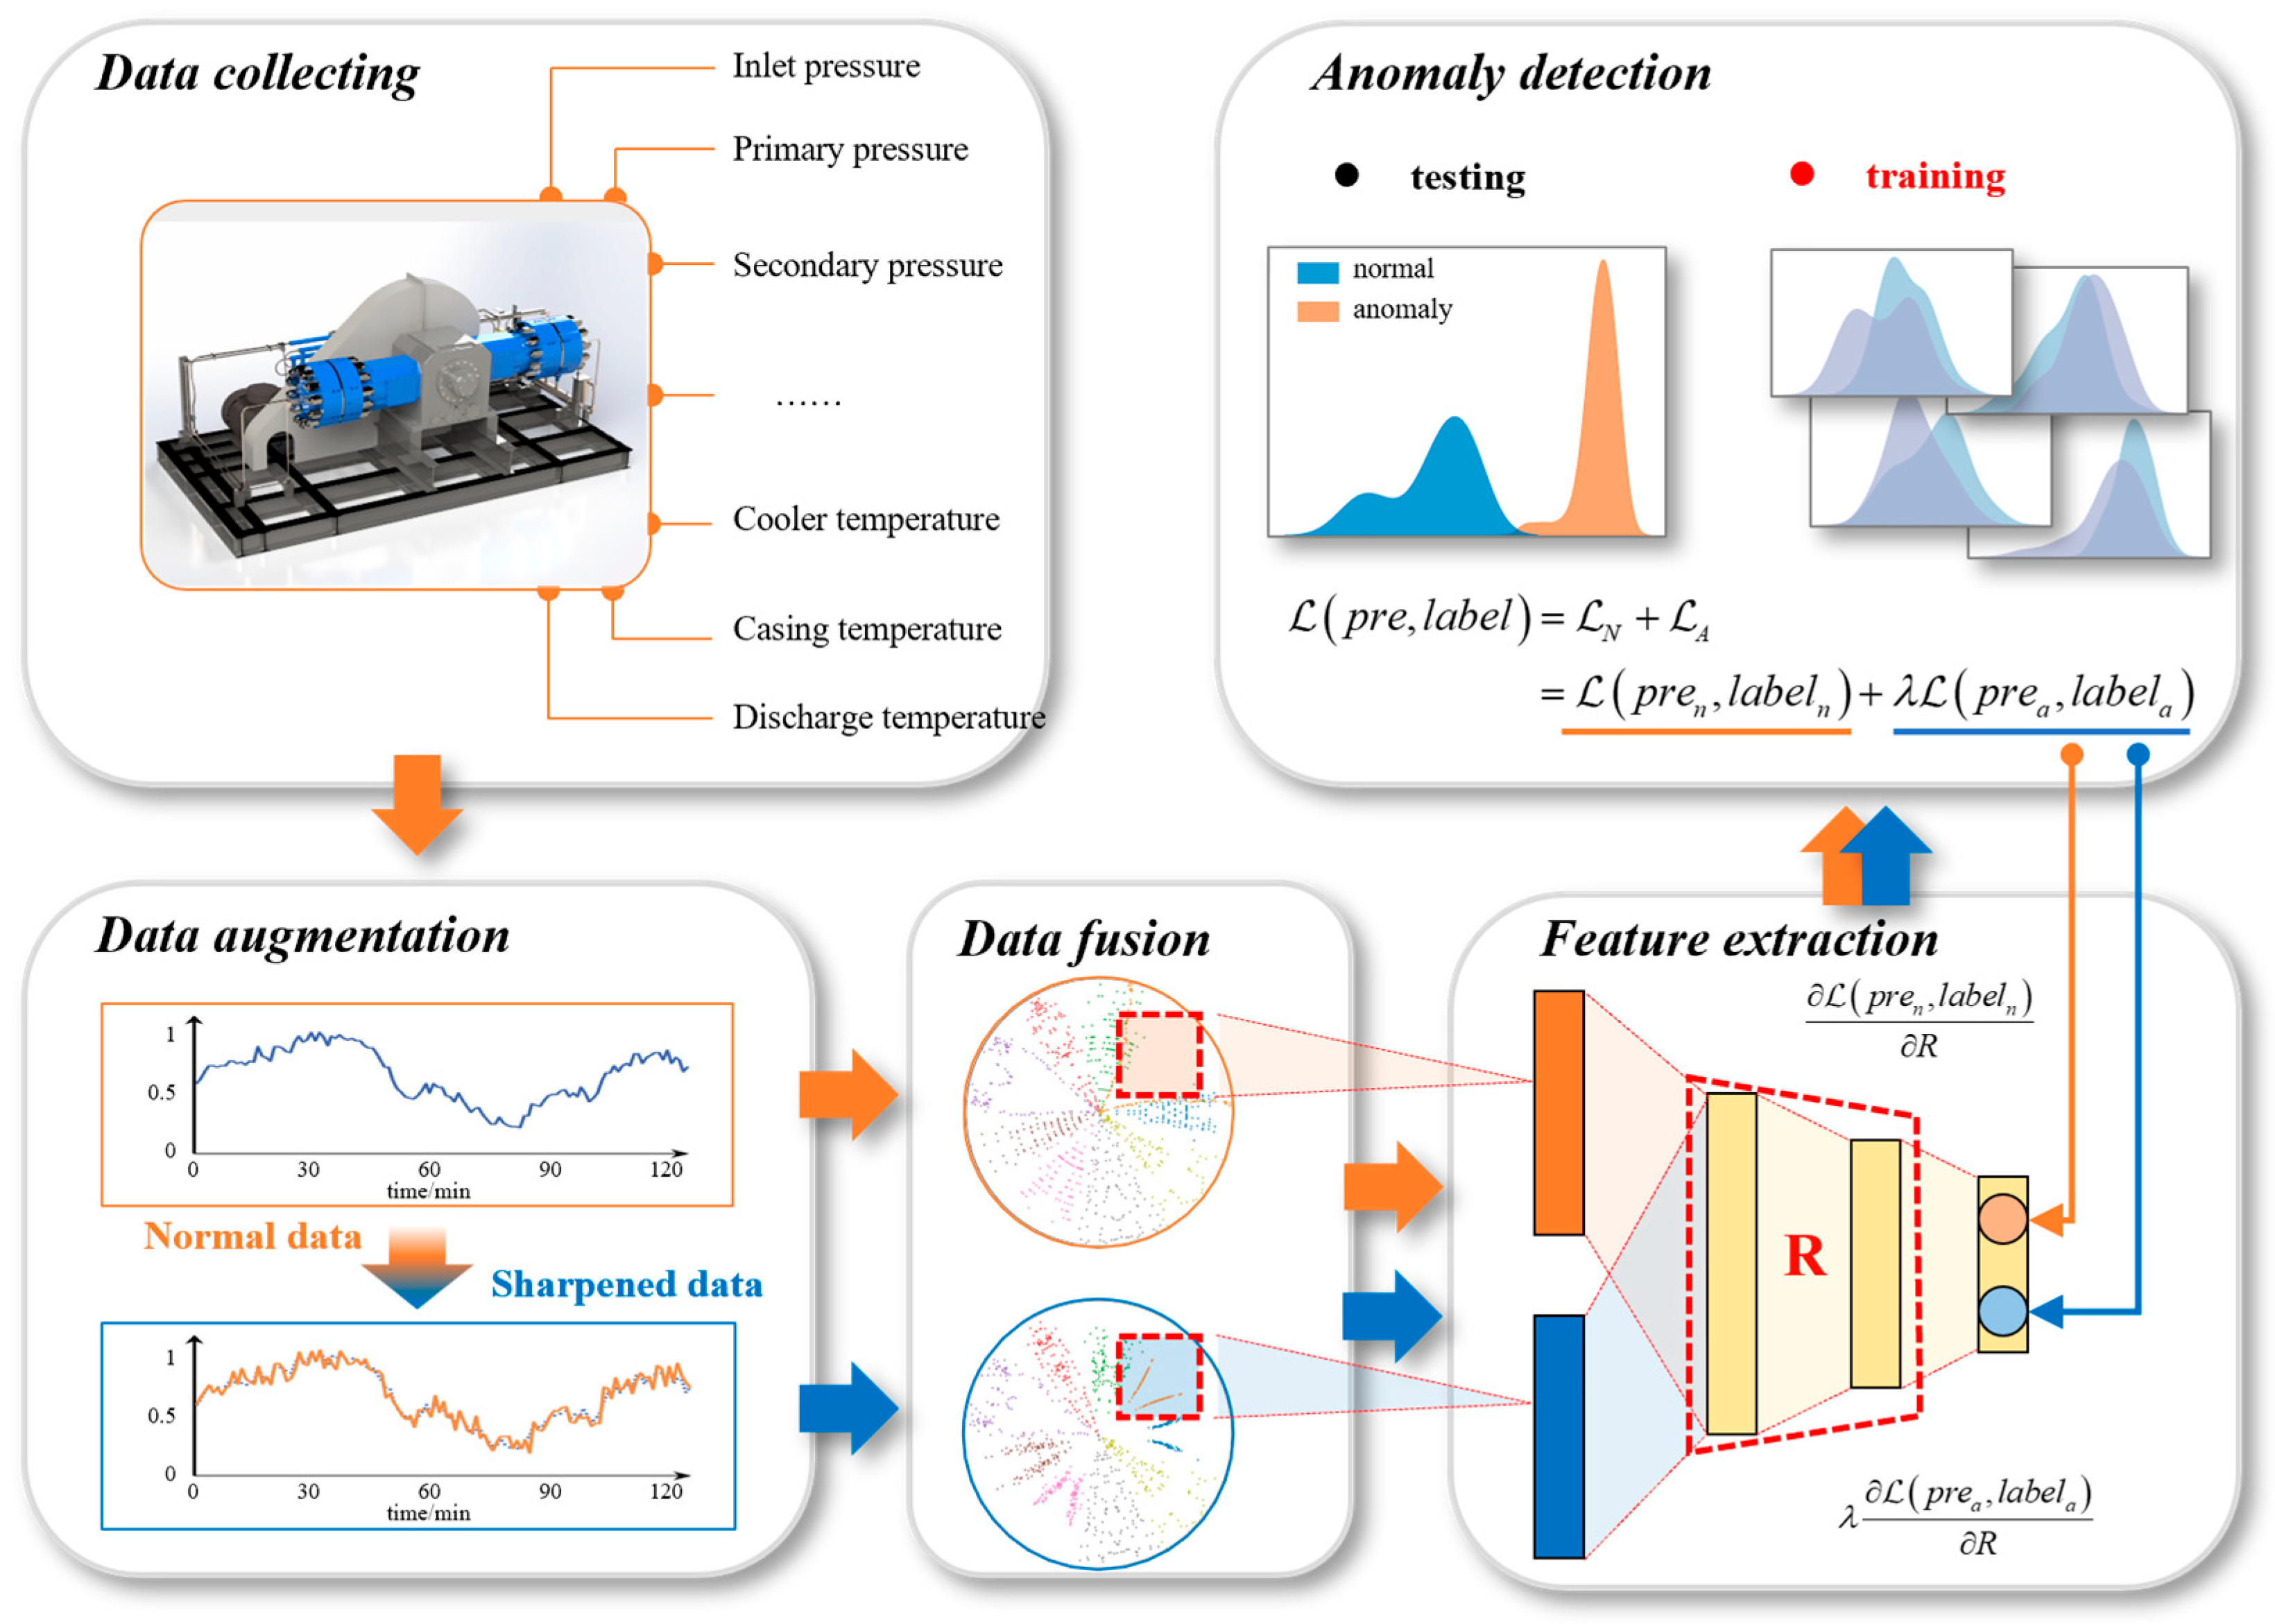
The proposed Symmetric Fusion Data Augmentation Network (SFANet) follows the workflow in Figure 1. After obtaining multi-source monitoring data representing equipment health status, the method first applies data sharpening to expand training data, then performs temporal-aware symmetric fusion of multi-source data for enhanced feature representation, and finally constructs a multi-layer convolutional feature extraction model with SC-BCE Loss (a modified semi-confidence version of binary cross-entropy loss) for anomaly detection evaluation.
Figure 1.
Overall flowchart of the proposed method.
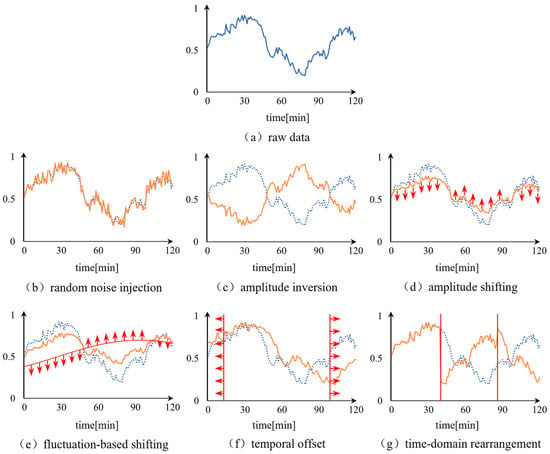
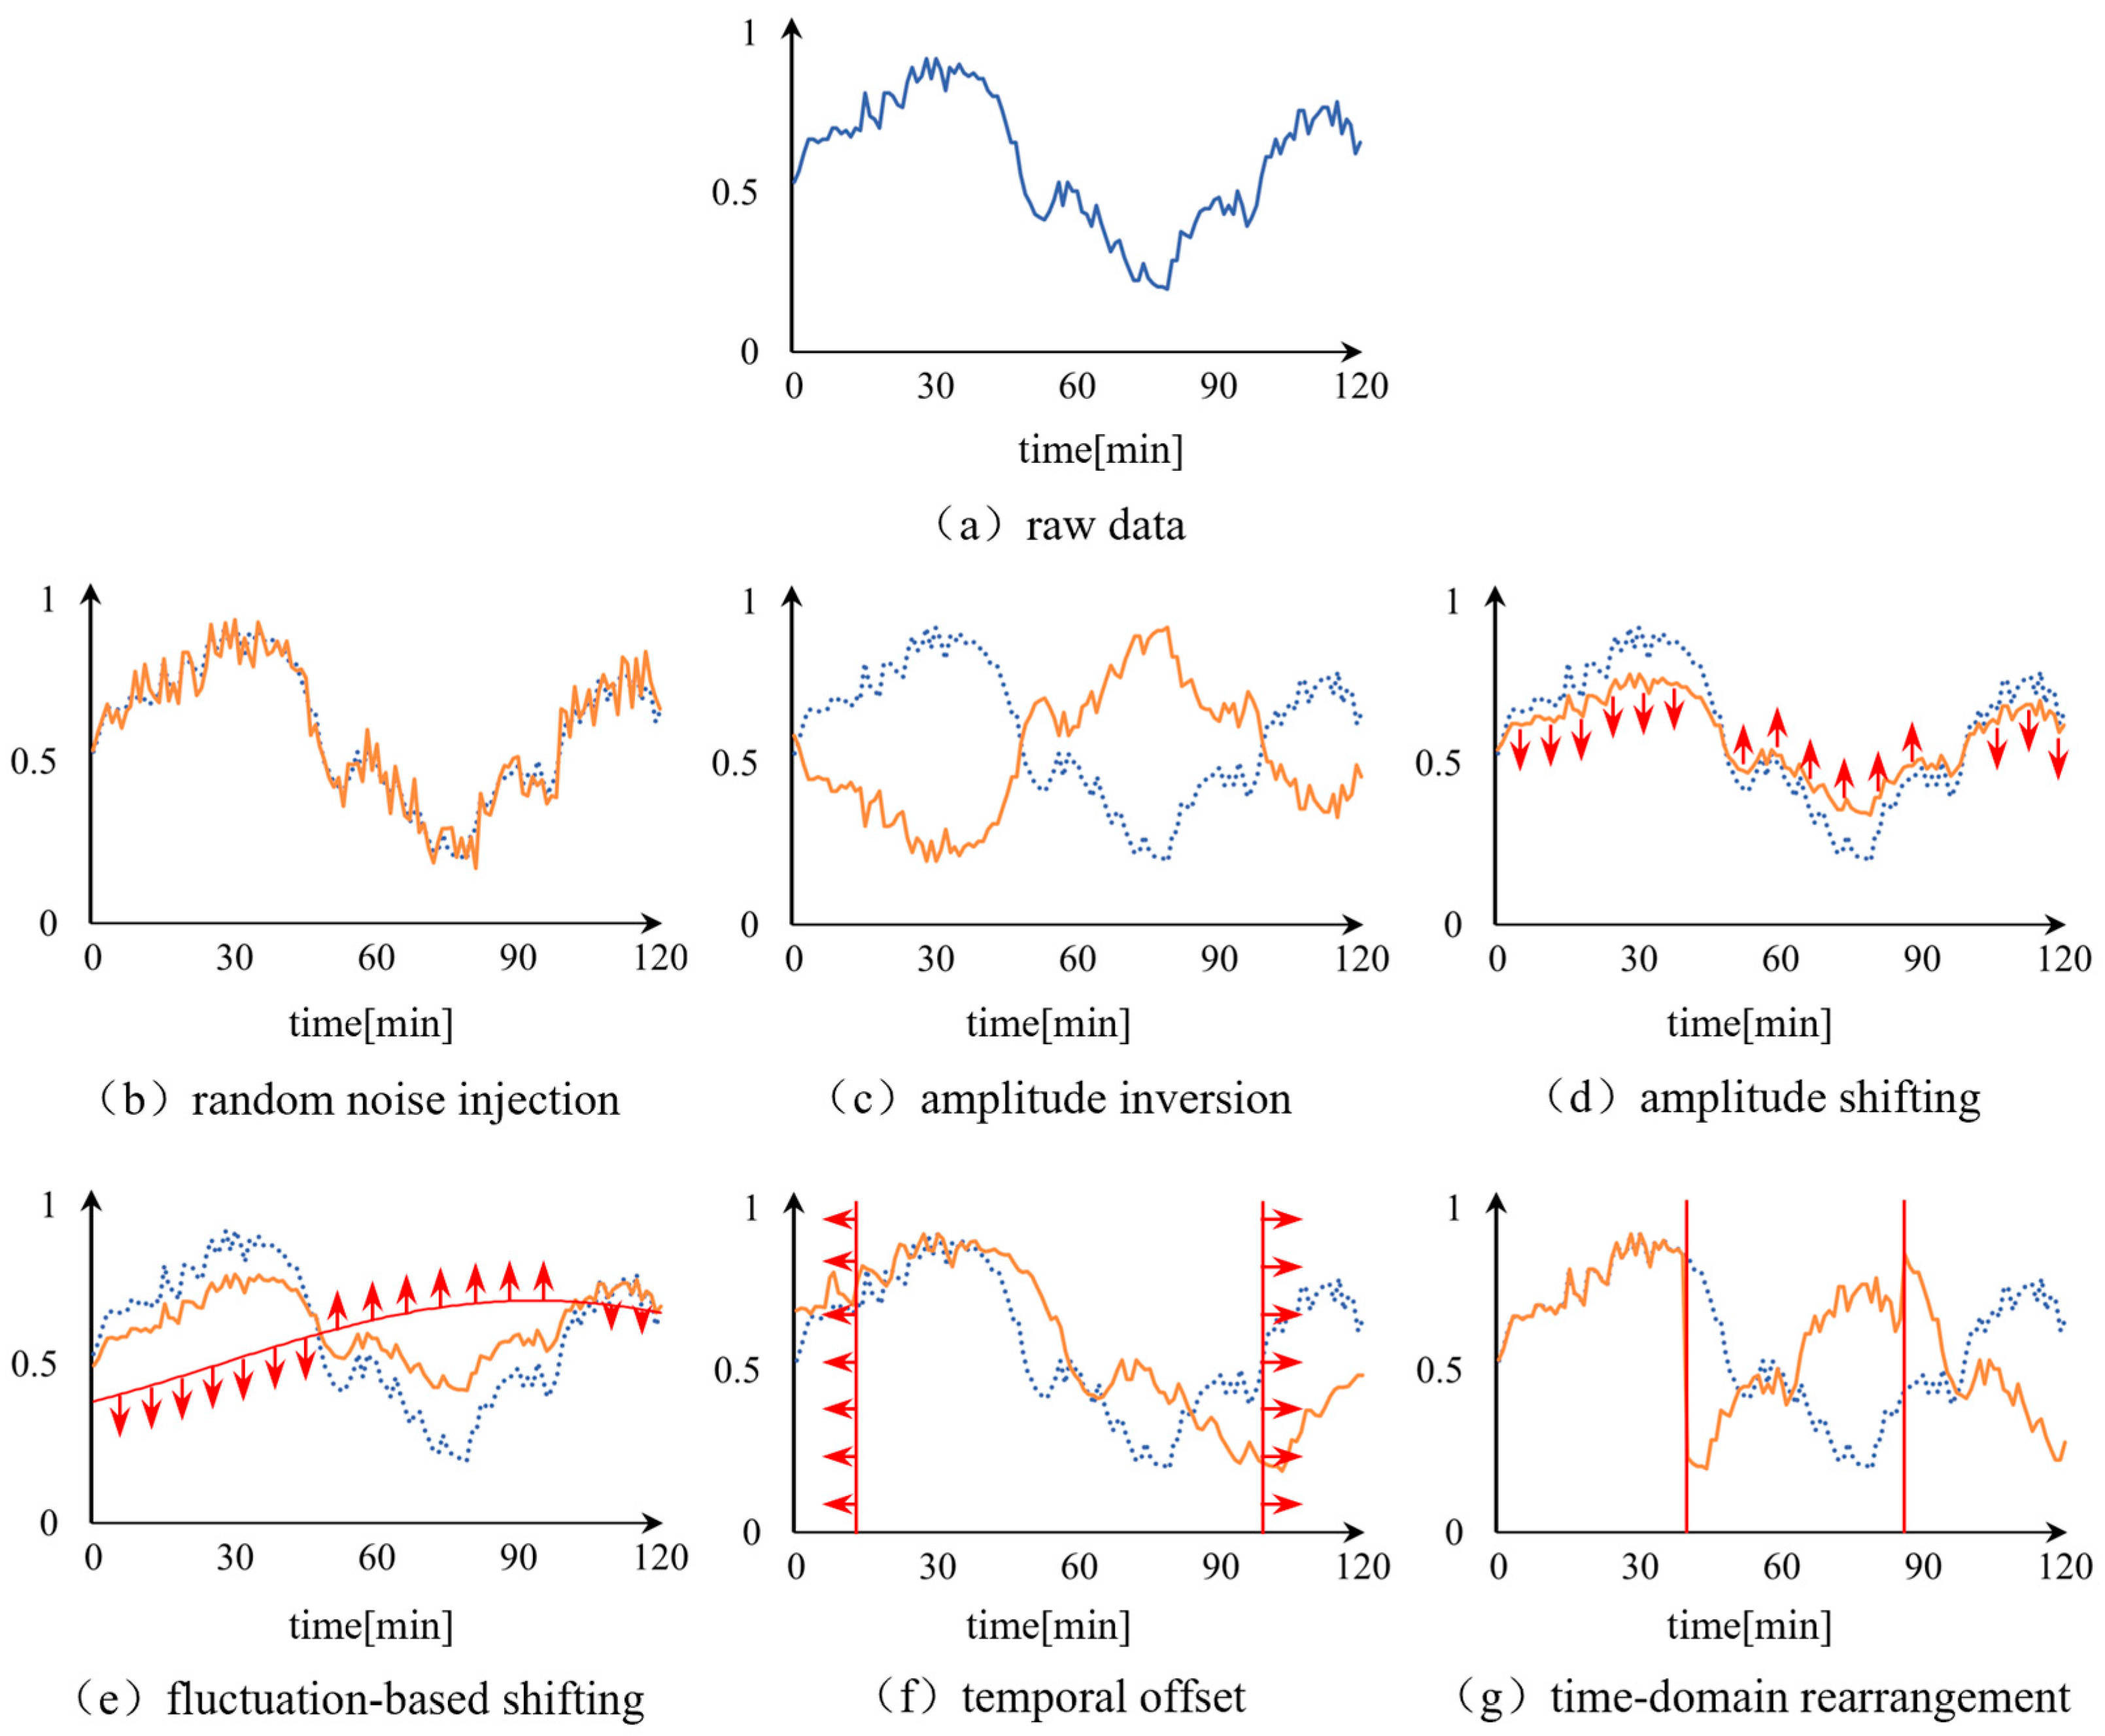
Data augmentation module. The extreme class imbalance in diaphragm hydrogen compressor data (minimal fault samples) presents two challenges: (1) overfitting to scarce fault samples hinders detection of other anomaly types; (2) using only normal samples makes decision boundary calibration unreliable (broad boundaries increase missed detections, narrow ones raise false alarms). Our solution exclusively uses normalized normal samples while generating synthetic anomalies via six data sharpening techniques (Figure 2): random noise injection, amplitude inversion, amplitude shifting, fluctuation-based shifting, temporal offset, and time-domain rearrangement. Each sharpening strategy corresponds to a common interference scenario in industrial field: random noise injection simulates electromagnetic interference of sensors; amplitude inversion and shifting reproduce abnormal fluctuations caused by operating condition transitions; fluctuation-based shifting mimics slow drift of parameters due to environmental temperature changes; temporal offset and time-domain rearrangement increase the diversity of temporal features, reducing the model’s overfitting to fixed timing patterns.
Figure 2.
Data augmentation example diagram.
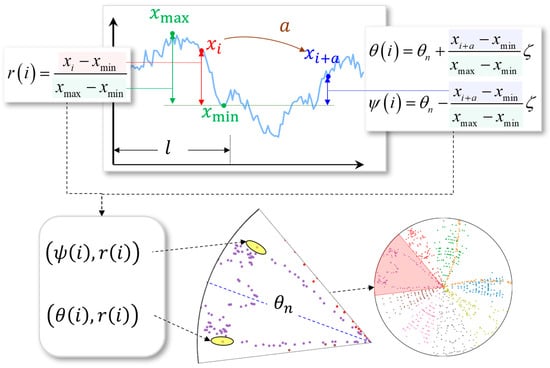
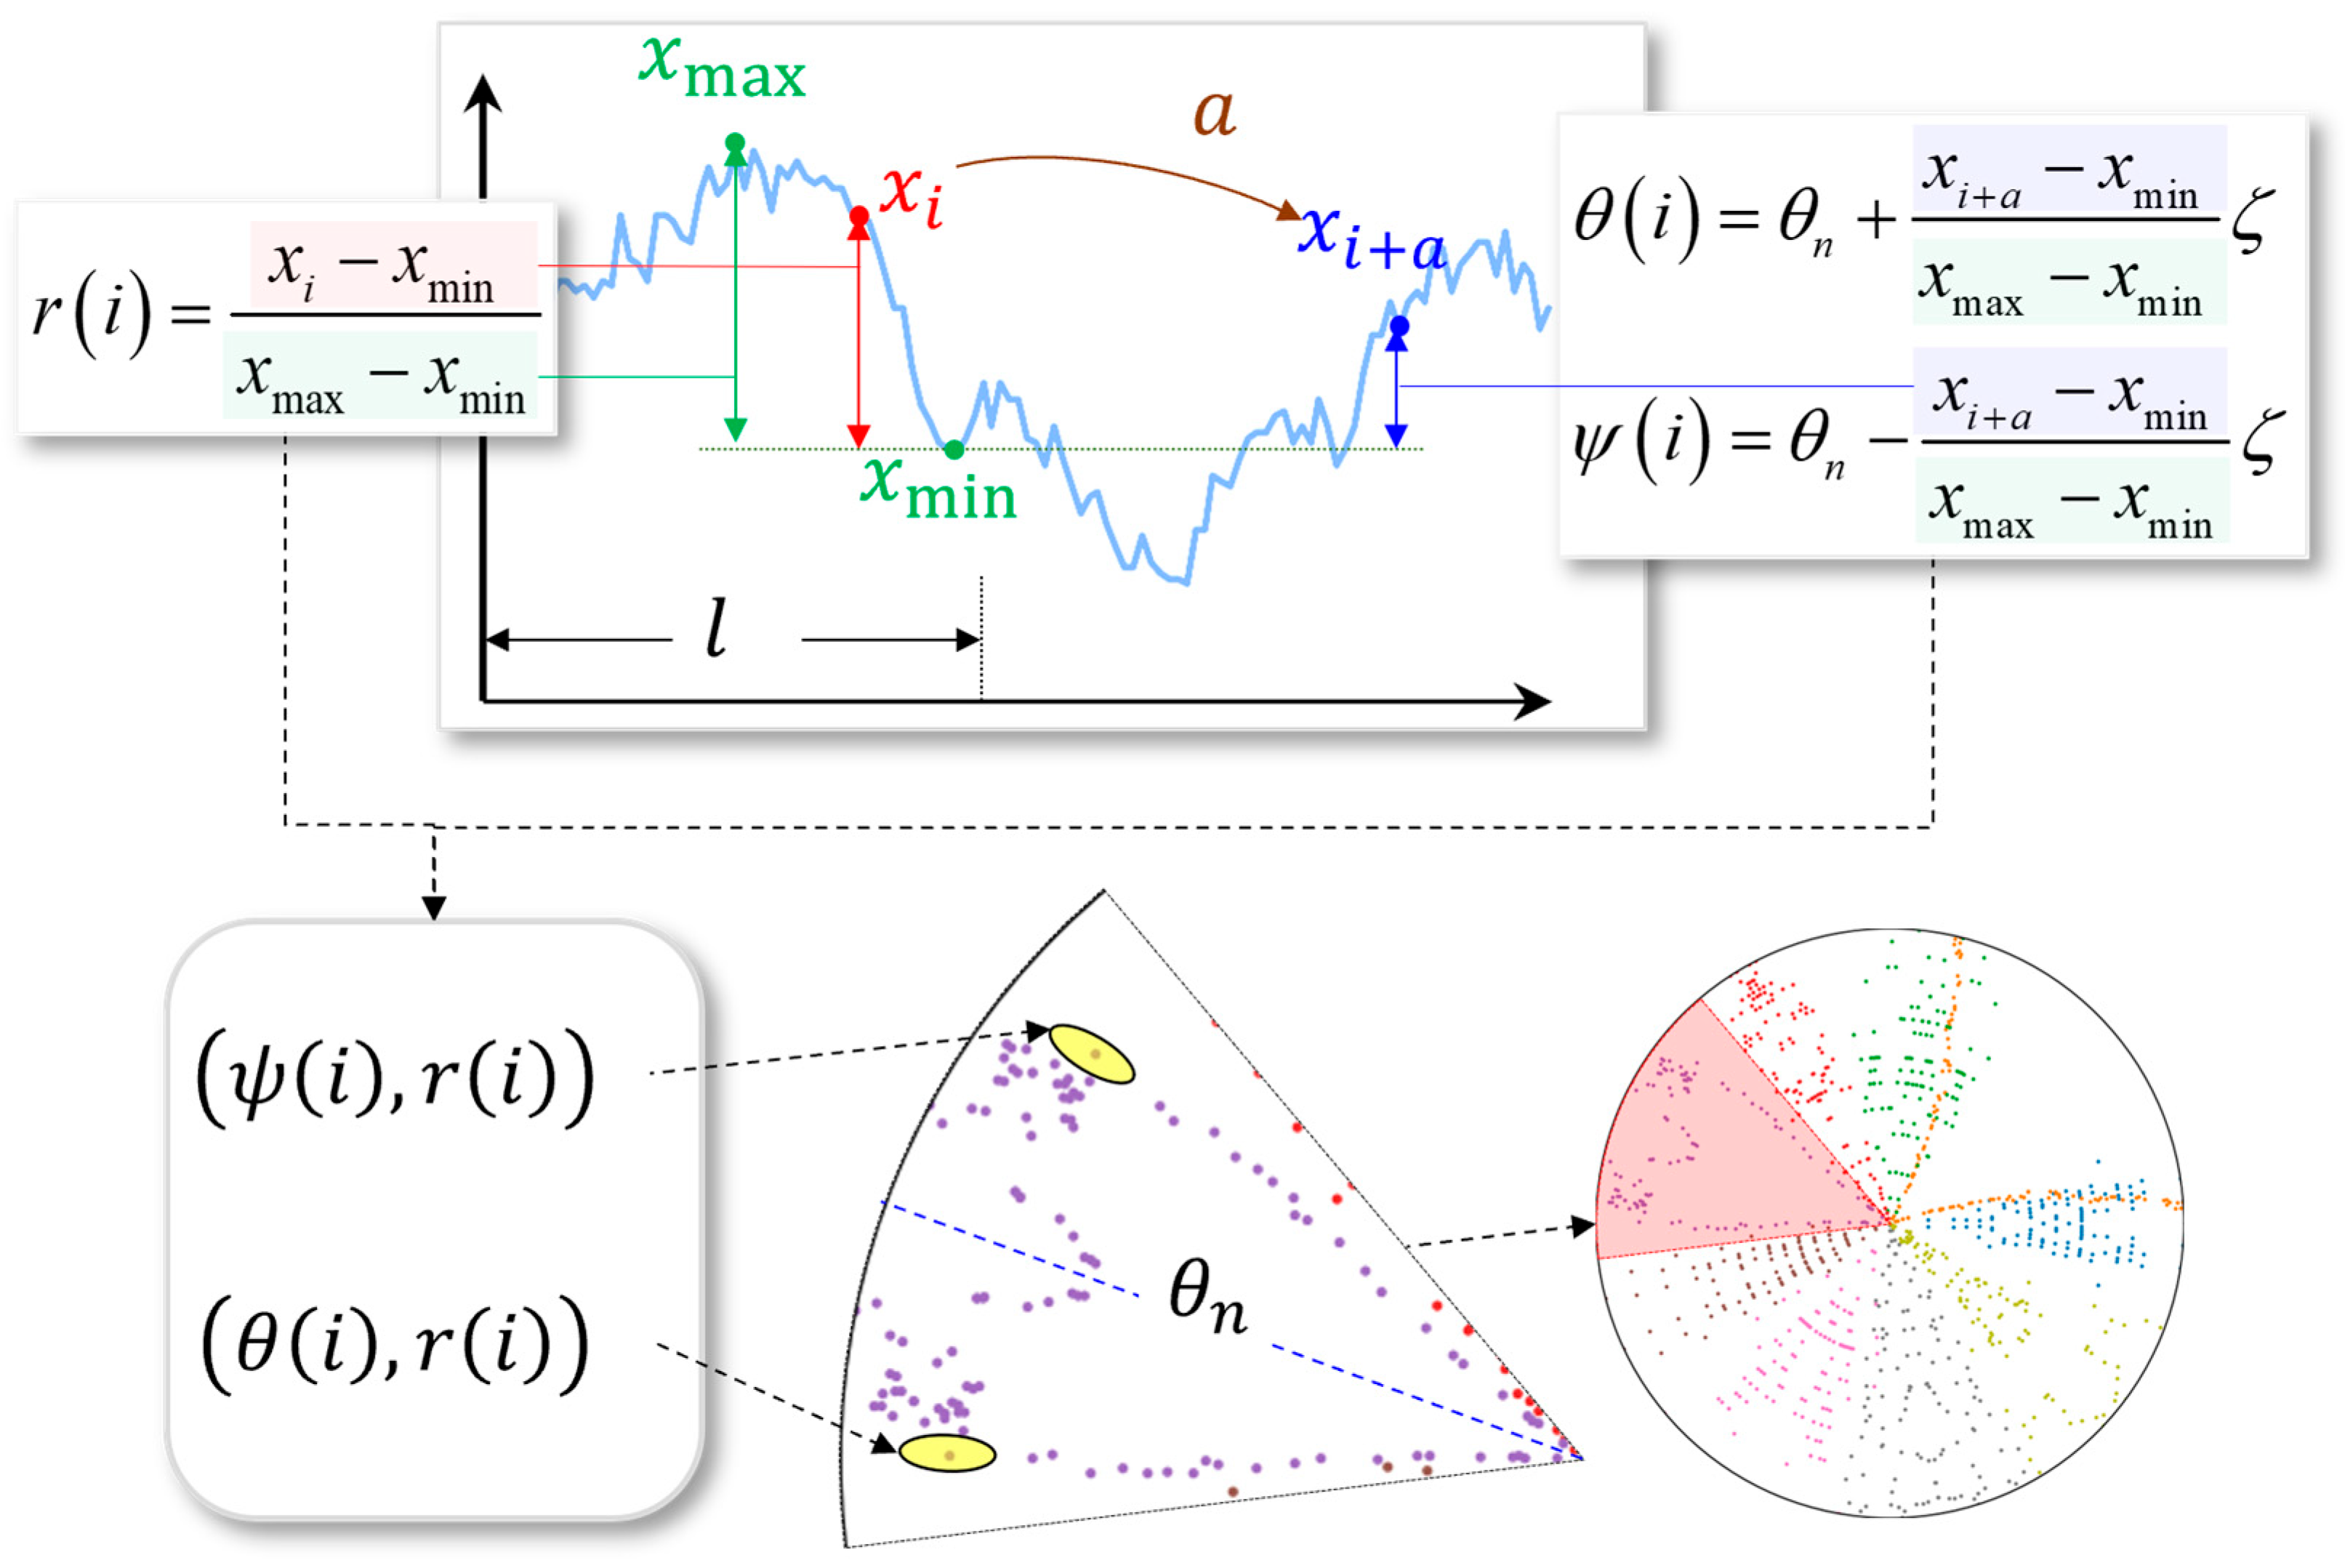
Data Fusion Module. The symmetric dot pattern (SDP) is a classical polar-coordinate signal imaging method originally proposed for mechanical vibration signal analysis, which has been widely adopted in fault diagnosis of rotating components such as bearings and gearboxes [24]. This paper introduces the SDP technique into the multi-source data fusion scenario of diaphragm hydrogen compressors to convert multi-channel time-series signals into fused two-dimensional feature images. This approach offers three key advantages: (1) implementation simplicity, (2) low computational overhead, and (3) inherent noise robustness. The technique’s diagnostic capability stems from its direct correlation between pattern characteristics and signal amplitude/frequency variations, enabling precise representation of dynamic changes in industrial equipment.
For a hydrogen compressor with N monitoring points, the transformation process of the n-th channel containing temporal samples proceeds as follows:
where is the polar radius of the transformed data point ; and represent the first and second polar angles of point , respectively; is the angular displacement parameter. The schematic diagram of this transformation process is illustrated in Figure 3.
Figure 3.
Schematic diagram of SDP.
Feature extraction module. The proposed framework employs a 2D convolutional neural network (CNN) for feature mining and extraction. As detailed in Table 1, the network architecture comprises: convolutional layers (Conv2D), max-pooling layers (MaxPool2D) and fully connected layers (Linear).
Table 1.
Structure of the 2D convolutional neural network.
The convolutional operation for an input sample and kernel is formulated as:
where denotes the convolutional layer output; is the bias term.
The max-pooling operation preserves critical features while reducing dimensionality:
where is the pooling layer output; denotes the i-th pooled output; indicates the pooling window size.
For fully connected layers, when the preceding layer is conv-pooling, flatten multi-depth features into 1D vectors; when the preceding layer is Linear, perform inner product with ReLU activation:
where represents the fully connected layer output; denotes the fully connected layer input; is the weight matrix of the fully connected layer; indicates the neuronal activation threshold.
For the network’s final output, we employ a reweighted cross-entropy loss function as the optimization objective:
where represents the total cross-entropy loss value; denotes the cross-entropy loss for normal samples; indicates the cross-entropy loss for anomalous samples; is the ground truth label; represents the predicted probability distribution.
For parameter λ in Equation (12), its introduction is motivated by the fact that the anomalous samples used in training data are not real anomaly data but rather sharpened data generated from normal samples. The informational value of such data is not equivalent to that of normal data. Therefore, parameter λ with a value range of (0,1) is introduced to help adjust the optimization direction of the network. Its numerical value is determined by the distributional difference between anomalous and normal data, adapting automatically based on the model’s input data rather than being manually specified.
where denotes normal samples; denotes anomalous samples. For the training dataset used in this study, the standard deviation of the anomaly score distribution of normal samples is approximately 0.087, and that of pseudo-anomaly samples is approximately 0.112. Substituting the two values into Equations (13) and (14) yields an adaptive λ value of 0.42.
Anomaly Score Calculation and Adaptive Thresholding. After the SFANet model is trained with normal samples and sharpened pseudo-anomaly samples, a dedicated decision-making module is required for online anomaly detection. Unlike supervised fault diagnosis tasks that can directly use 0.5 as the classification boundary, the pseudo-anomaly samples in this work are generated from normal operating data rather than real fault samples. A fixed 0.5 threshold would either overestimate anomaly boundaries and cause excessive false alarms, or underestimate them and lead to frequent missed detections. Therefore, this study designs a statistics-driven adaptive thresholding strategy that relies solely on normal operation data, maintaining full consistency with the no-fault-sample application premise.
For any input monitoring sample, the model outputs a two-dimensional probability vector via the final fully connected layer, where pnorm and pano represent the predicted probabilities of belonging to the normal class and the anomalous class, respectively. The anomaly score s of the sample is defined as:
A higher score indicates a larger deviation from the normal operation pattern and a higher risk of potential failure. Since the model is optimized with SC-BCE loss that assigns lower confidence weights to pseudo-anomaly samples, the anomaly score distribution of normal samples is concentrated in the low-value interval, rather than being strictly bounded at 0.5.
To determine a reasonable decision threshold, we use the pure normal subset in the validation set for statistical calibration. Specifically, we calculate the anomaly scores of all normal validation samples and fit them to a Gaussian distribution , where is the mean value and is the standard deviation. The initial threshold is determined by the upper quantile of the distribution:
where is the quantile coefficient. In this work, is adopted, corresponding to the 98th percentile of the normal distribution, which ensures that over 98% of normal operation samples are correctly identified, thus controlling the false detection rate at a low level.
Considering the slow drift of equipment operating parameters caused by environmental temperature changes, component wear, and inlet pressure fluctuation during long-term operation, a sliding-window dynamic update mechanism is introduced for the threshold. Specifically, the system retains the anomaly scores of normally operating samples within the latest 72 h window, and recalculates the mean and standard deviation every 24 h to update the threshold. This mechanism adapts to gradual changes in operating conditions, avoids cumulative false alarms caused by fixed thresholds, and still does not require any fault sample participation in the update process.
2.3. Case Study of Hydrogen Diaphragm Compressor in Hydrogen Refueling Station
This section validates the effectiveness of the proposed method through concrete case studies and demonstrates its superiority via comparative analysis with conventional algorithms.
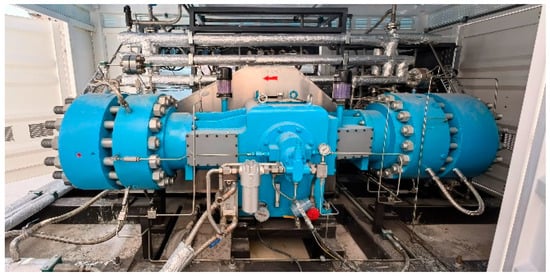
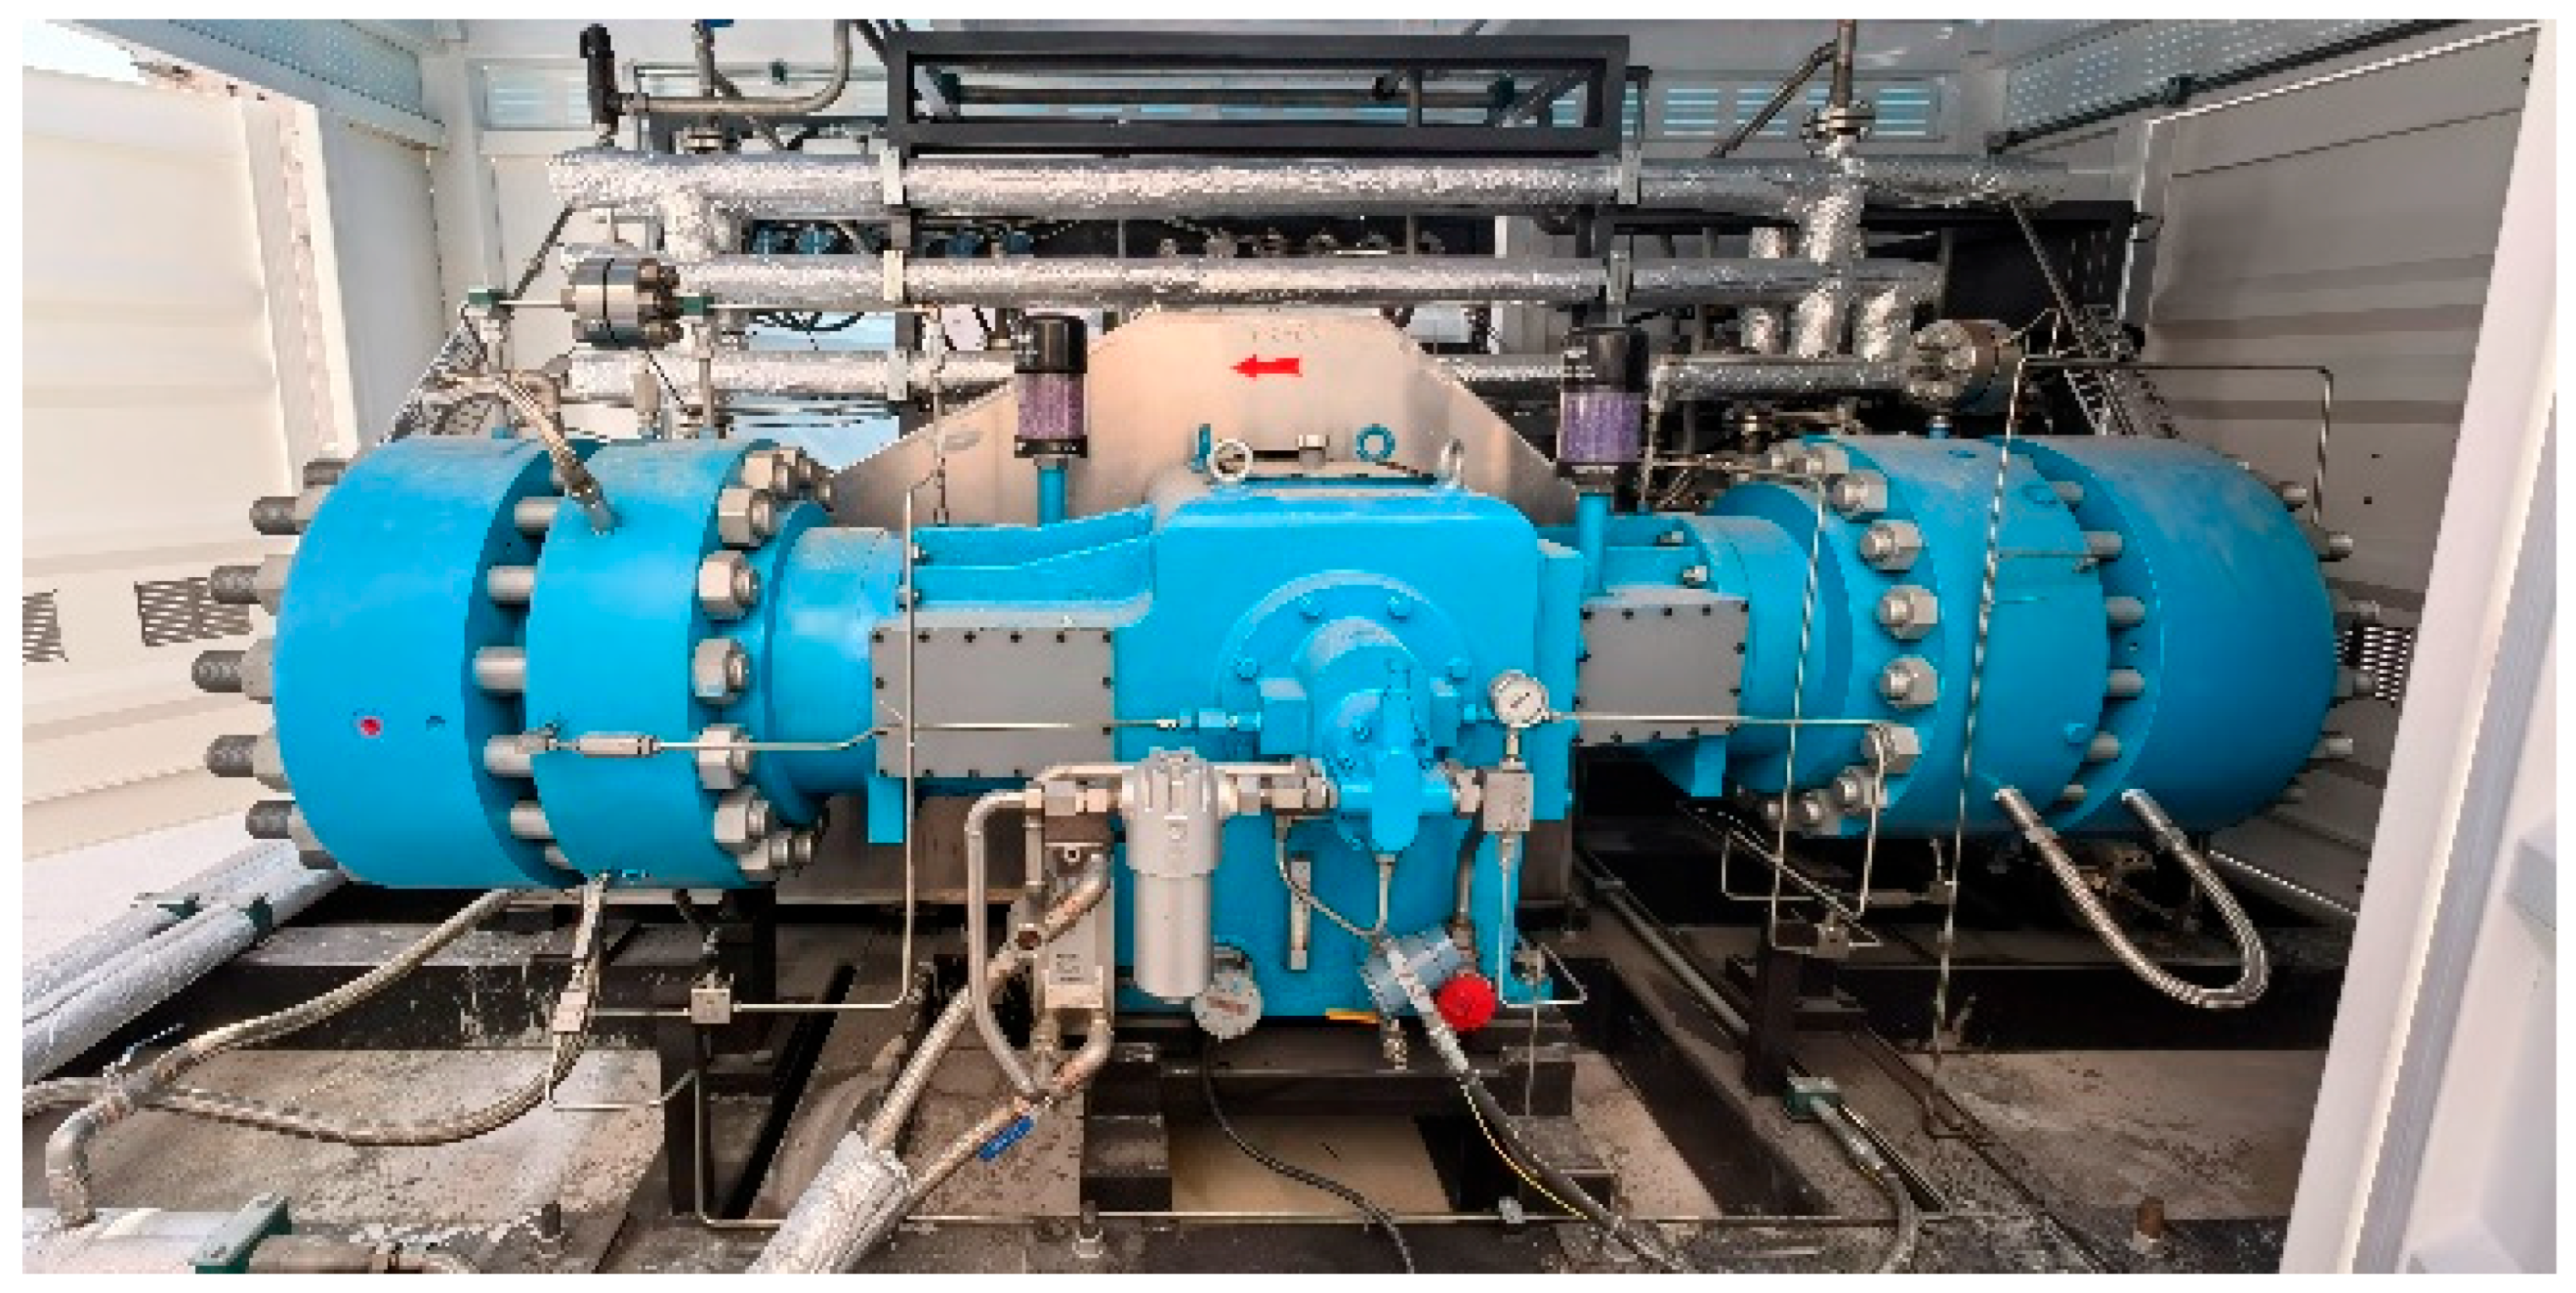
Data acquisition. To validate the proposed method, we conducted experiments on a 90 MPa two-stage hydrogen diaphragm compressor at a Sinopec refueling station in Yancheng, Jiangsu Province. The compressor’s nameplate parameters are detailed in Table 2. Field sensors were deployed to monitor and record operational data, with the test setup shown in Figure 4.
Table 2.
Design parameters for diaphragm hydrogen compressors.
Figure 4.
Site view of 90 MPa diaphragm hydrogen compressor for hydrogen refueling station.
For the SDP symmetric fusion module adopted in this case, two key parameters are set according to the data characteristics: the angular mapping parameter a is set to half of the sample length, i.e., a = 60 for the 120-point time-series sample, to ensure the full time sequence is mapped to the complete 0–360° polar angle range. The inter-channel angular offset ζ has a theoretical value of 20° calculated by 360°/2/9 for 9 monitoring channels; to avoid excessive blank areas in the SDP image and ensure uniform feature distribution, this value is manually adjusted to 30° in the experiment.
3. Results
3.1. Dataset and Evaluation Metrics
To quantitatively evaluate the performance of the proposed anomaly detection method, three widely used metrics are adopted in this work: accuracy, false detection rate, and missed detection rate. The definitions are as follows:
where TP represents the number of correctly detected anomalous samples; TN represents the number of correctly identified normal samples; FP represents the number of normal samples misjudged as anomalies (false positives); FN represents the number of anomalous samples misjudged as normal (false negatives).
Among them, accuracy reflects the overall detection performance of the model, false detection rate directly affects the daily operation and maintenance burden, and missed detection rate determines the safety guarantee capability for equipment operation.
It should be emphasized that the training set strictly abides by the no-fault-sample premise and contains only normal operation data. The anomalous samples in the validation and test sets are independently labeled according to on-site maintenance records and post-inspection results, and are exclusively used for model performance evaluation without participating in training or threshold calibration.
3.2. Comparative Experimental Results
Based on the operation and maintenance monitoring requirements of diaphragm hydrogen compressors in hydrogen refueling stations and field sensor installation conditions, this study selected 9-dimensional monitoring data for compressor operation analysis. The specific parameters include: intake pressure, exhaust pressure, intake temperature, cooling water inlet temperature, lubricating oil pressure, lubricating oil temperature, primary cylinder oil pressure, secondary cylinder oil pressure, and cooler temperature. During operation, data was recorded at 1 min intervals, with every 120 consecutive data points forming one sample.
Field monitoring data of diaphragm hydrogen compressors inevitably suffer from missing values, impulse noise and multi-sensor asynchrony under high-pressure, strong-vibration operating environments. Directly feeding raw data into the model will reduce detection reliability and even cause model deviation. Therefore, a standardized preprocessing workflow is constructed before model training to ensure data quality and consistency.
First, missing value processing is performed. For short-term data loss (less than 5 consecutive minutes) caused by transient sensor communication interruption, linear interpolation is adopted to fill the gap according to the data trend before and after the missing segment, so as to maintain the continuity of time series. For data segments with continuous missing values exceeding 5 min, they are directly excluded from the dataset to avoid introducing artificial deviation.
Second, outliers are eliminated via the 3σ criterion. Due to the electromagnetic interference and mechanical impact on site, individual sampling points often show abnormal spike values that do not conform to the operating law. For each monitoring channel, the mean value μ and standard deviation σ of the data in the steady-state operating interval are calculated, and the sampling points beyond the range of [μ − 3σ, μ + 3σ] are identified as impulse noise and replaced by adjacent steady-state values, so as to eliminate the interference of extreme values on model training.
Third, multi-source temporal alignment is implemented. Taking the unified system timestamp as the benchmark, second-level alignment is performed on the data of 18 monitoring channels to ensure that the data points of each dimension at the same sampling time correspond to the same operating state of the compressor, eliminating the feature misalignment caused by inconsistent sampling frequency of different sensors.
Finally, sliding window technology is used to construct experimental samples. Each sample contains 120 consecutive sampling points with an interval of 1 min, corresponding to a 2 h operating cycle, which can fully cover the pressure and temperature fluctuation characteristics under normal operating conditions. The sliding step is set to 30 min to improve data utilization while ensuring sample diversity. It should be emphasized that the training set, validation set and test set are strictly divided in chronological order without any hybrid sampling, so as to avoid data leakage and ensure that the experimental results can truly reflect the generalization performance of the model in practical application. The final dataset contains 839 valid samples, and the specific division is consistent with Table 3.
Table 3.
Sample composition and dataset partitioning for diaphragm hydrogen compressors.
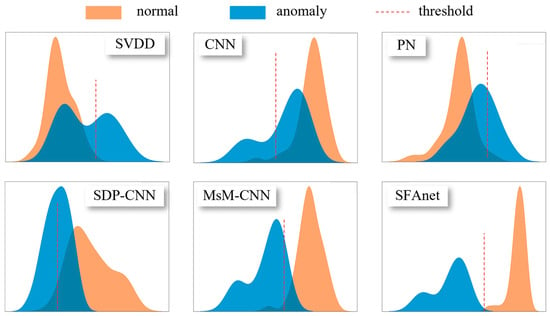
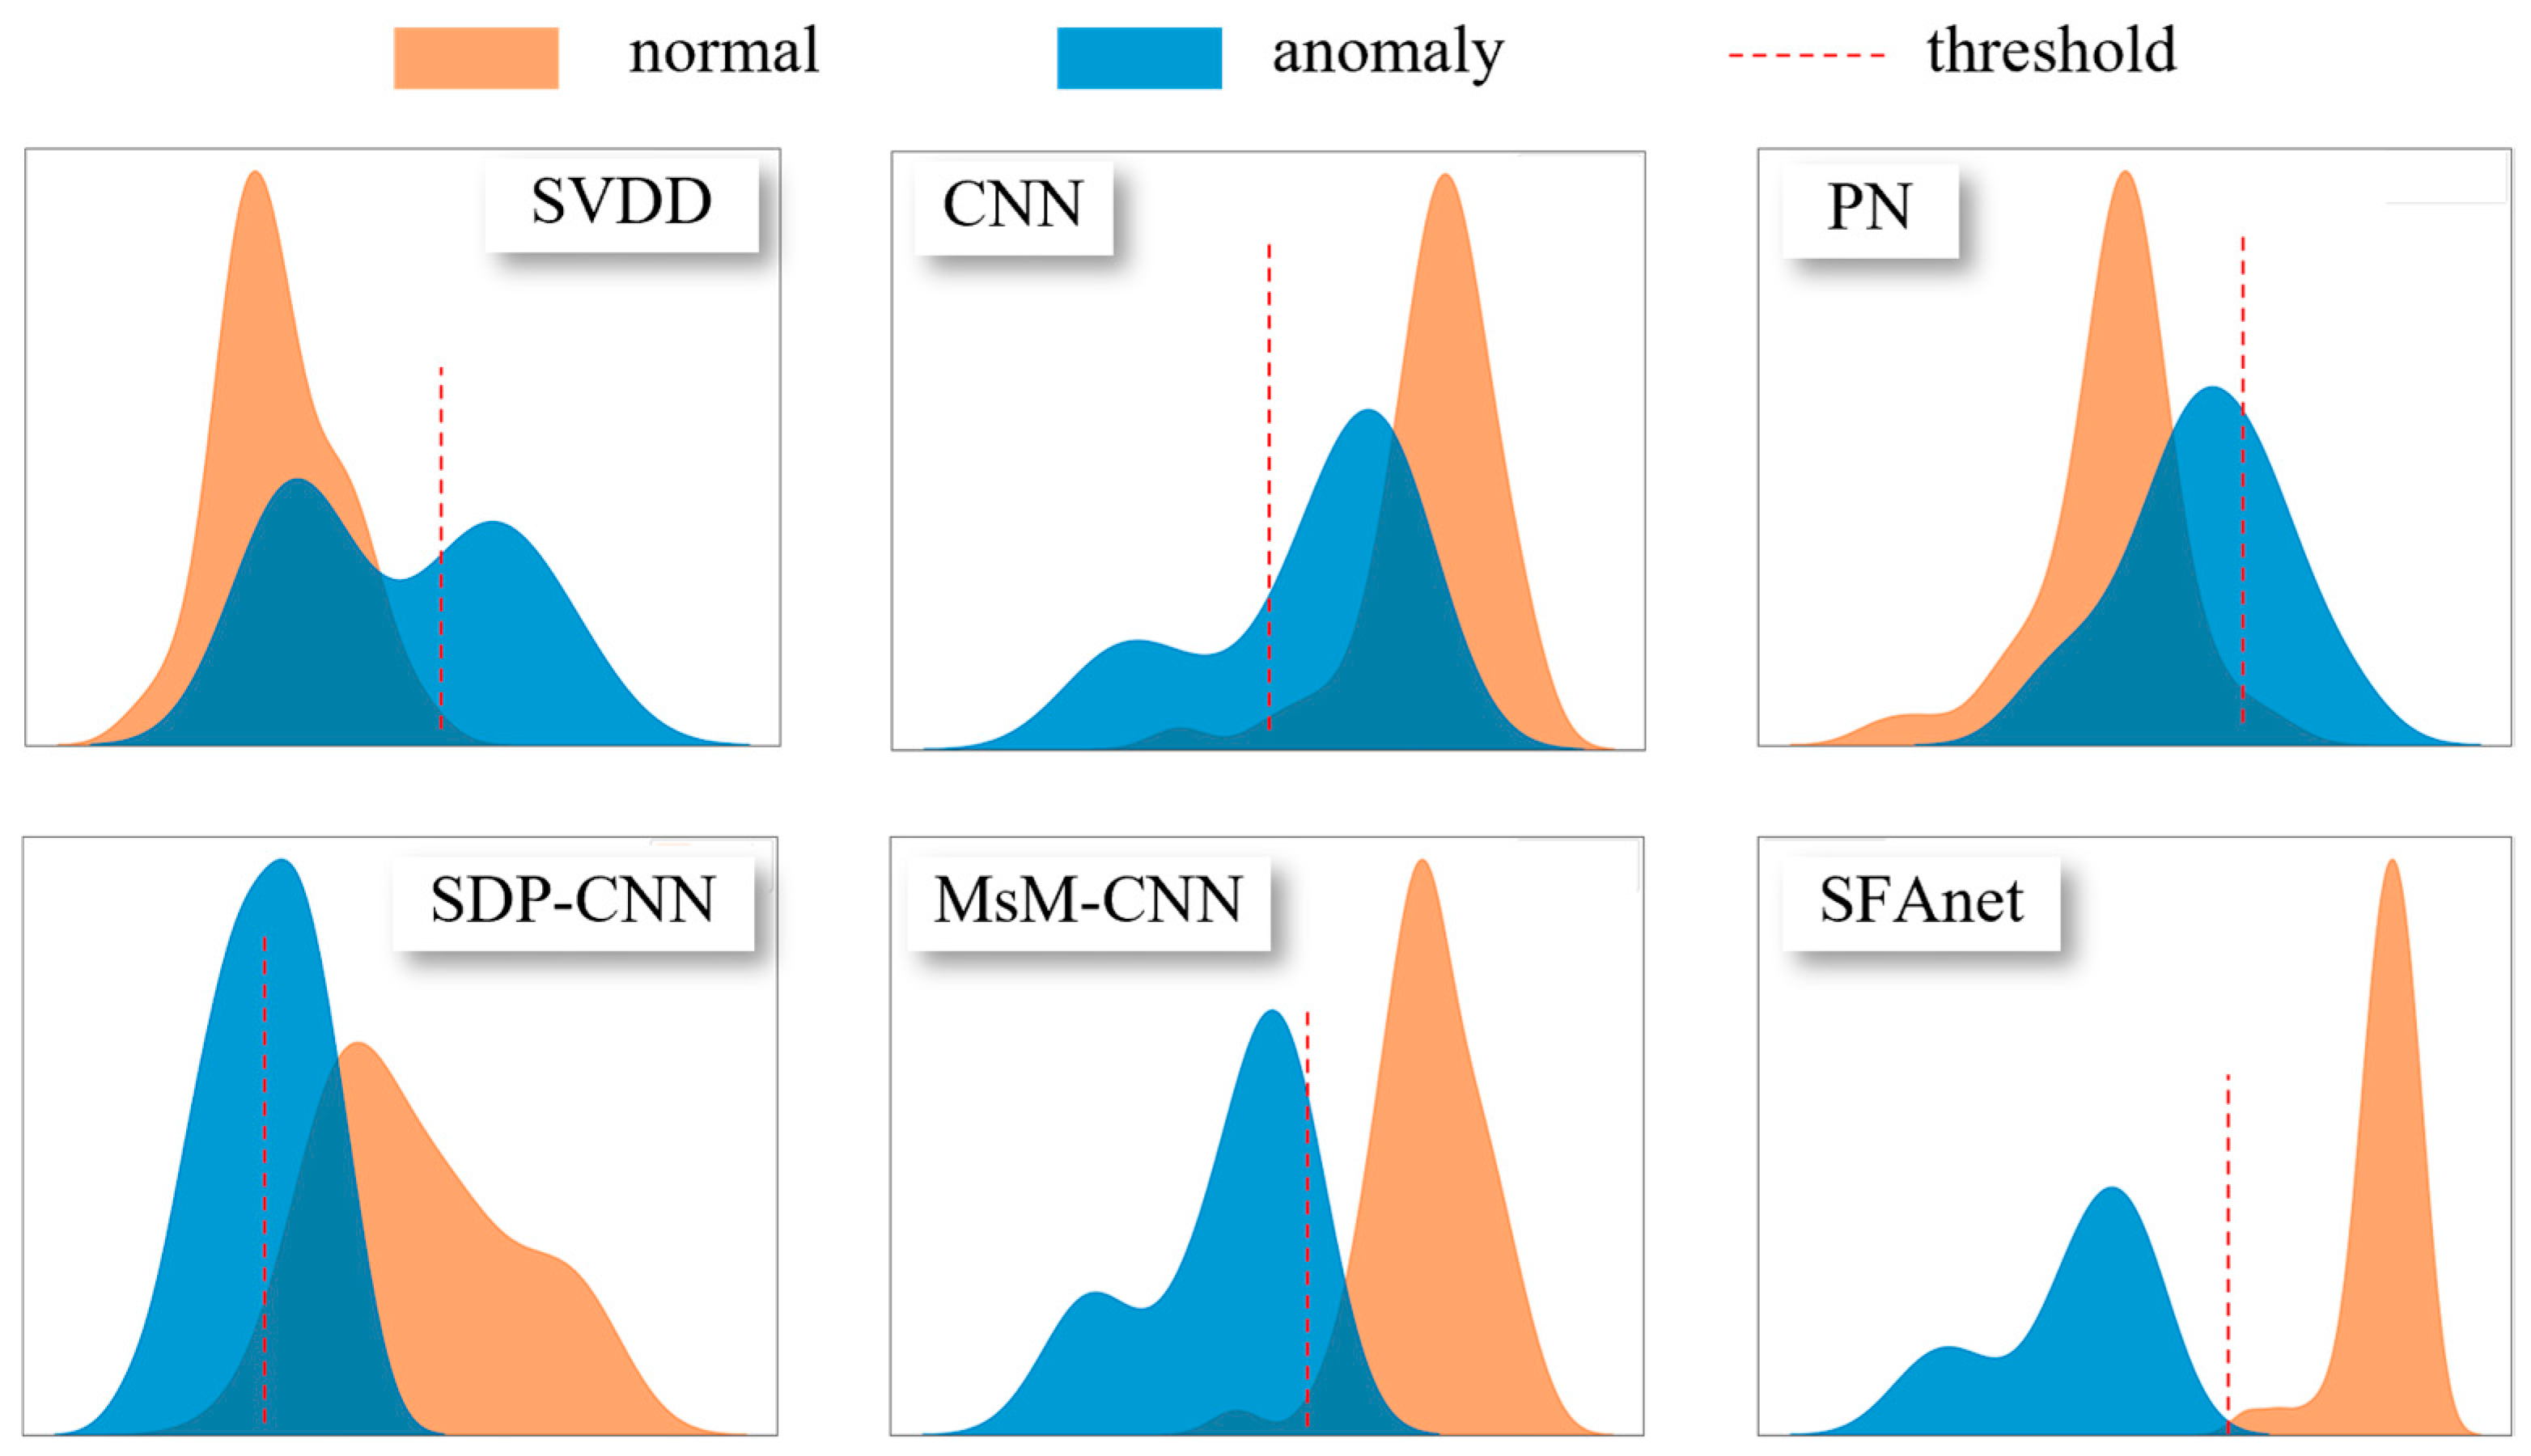
Comparative experimental results. In addition to the proposed method, our team selected the following conventional anomaly detection algorithms for comparison: Support Vector Domain Description (SVDD); convolutional neural network (CNN); Prototype Networks (PN); Symmetric Dot Pattern-based CNN (SDP-CNN); Multi-sharpening Mode CNN (MsM-CNN). The experimental results are presented in Table 4, evaluated using three key metrics: accuracy, false detection rate and missed detection rate. All comparative experiments are repeated 5 times independently with different random initialization seeds to avoid experimental contingency. The reported results are presented as mean ± standard deviation, where the standard deviation characterizes the fluctuation of model performance under different initial conditions. Visualizations of anomaly detection for each experimental group are shown in Figure 5.
Table 4.
Experimental results of anomaly detection algorithm.
Figure 5.
Anomaly detection visualization results.
The experimental results demonstrate that when trained solely on normal samples, all methods maintained low false detection rates (approximately 0.02) for normal operational data, but exhibited significant performance differences in anomaly detection: conventional SVDD and CNN methods showed limited decision boundary reliability due to their exclusive optimization for normal sample clustering; the PN approach improved generalization through distance metrics but remained constrained by the lack of inter-class distance evaluation criteria; as ablation studies, SDP-CNN and MsM-CNN, respectively, validated the effectiveness of symmetric pattern transformation and data sharpening techniques. Ultimately, the proposed method achieved a notably superior missed detection rate of 0.083. These results confirm that the innovative integration of symmetric pattern transformation with multi-sharpening data enhancement significantly improves anomaly detection reliability under fault-sample-free conditions.
Specifically, SVDD achieves the lowest false detection rate but the highest missed detection rate, as it only constructs a closed boundary for normal samples and is insensitive to weak deviations outside the cluster. PN improves generalization via metric learning, but lacks real negative samples to calibrate the inter-class distance, resulting in still limited anomaly recognition capability. As ablation variants, SDP-CNN and MsM-CNN, respectively, verify that symmetric imaging enhances feature distinguishability and data sharpening alleviates small-sample overfitting, laying the foundation for the performance improvement of the full framework.
3.3. Ablation Study of Key Modules
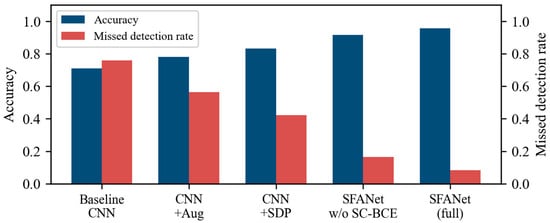
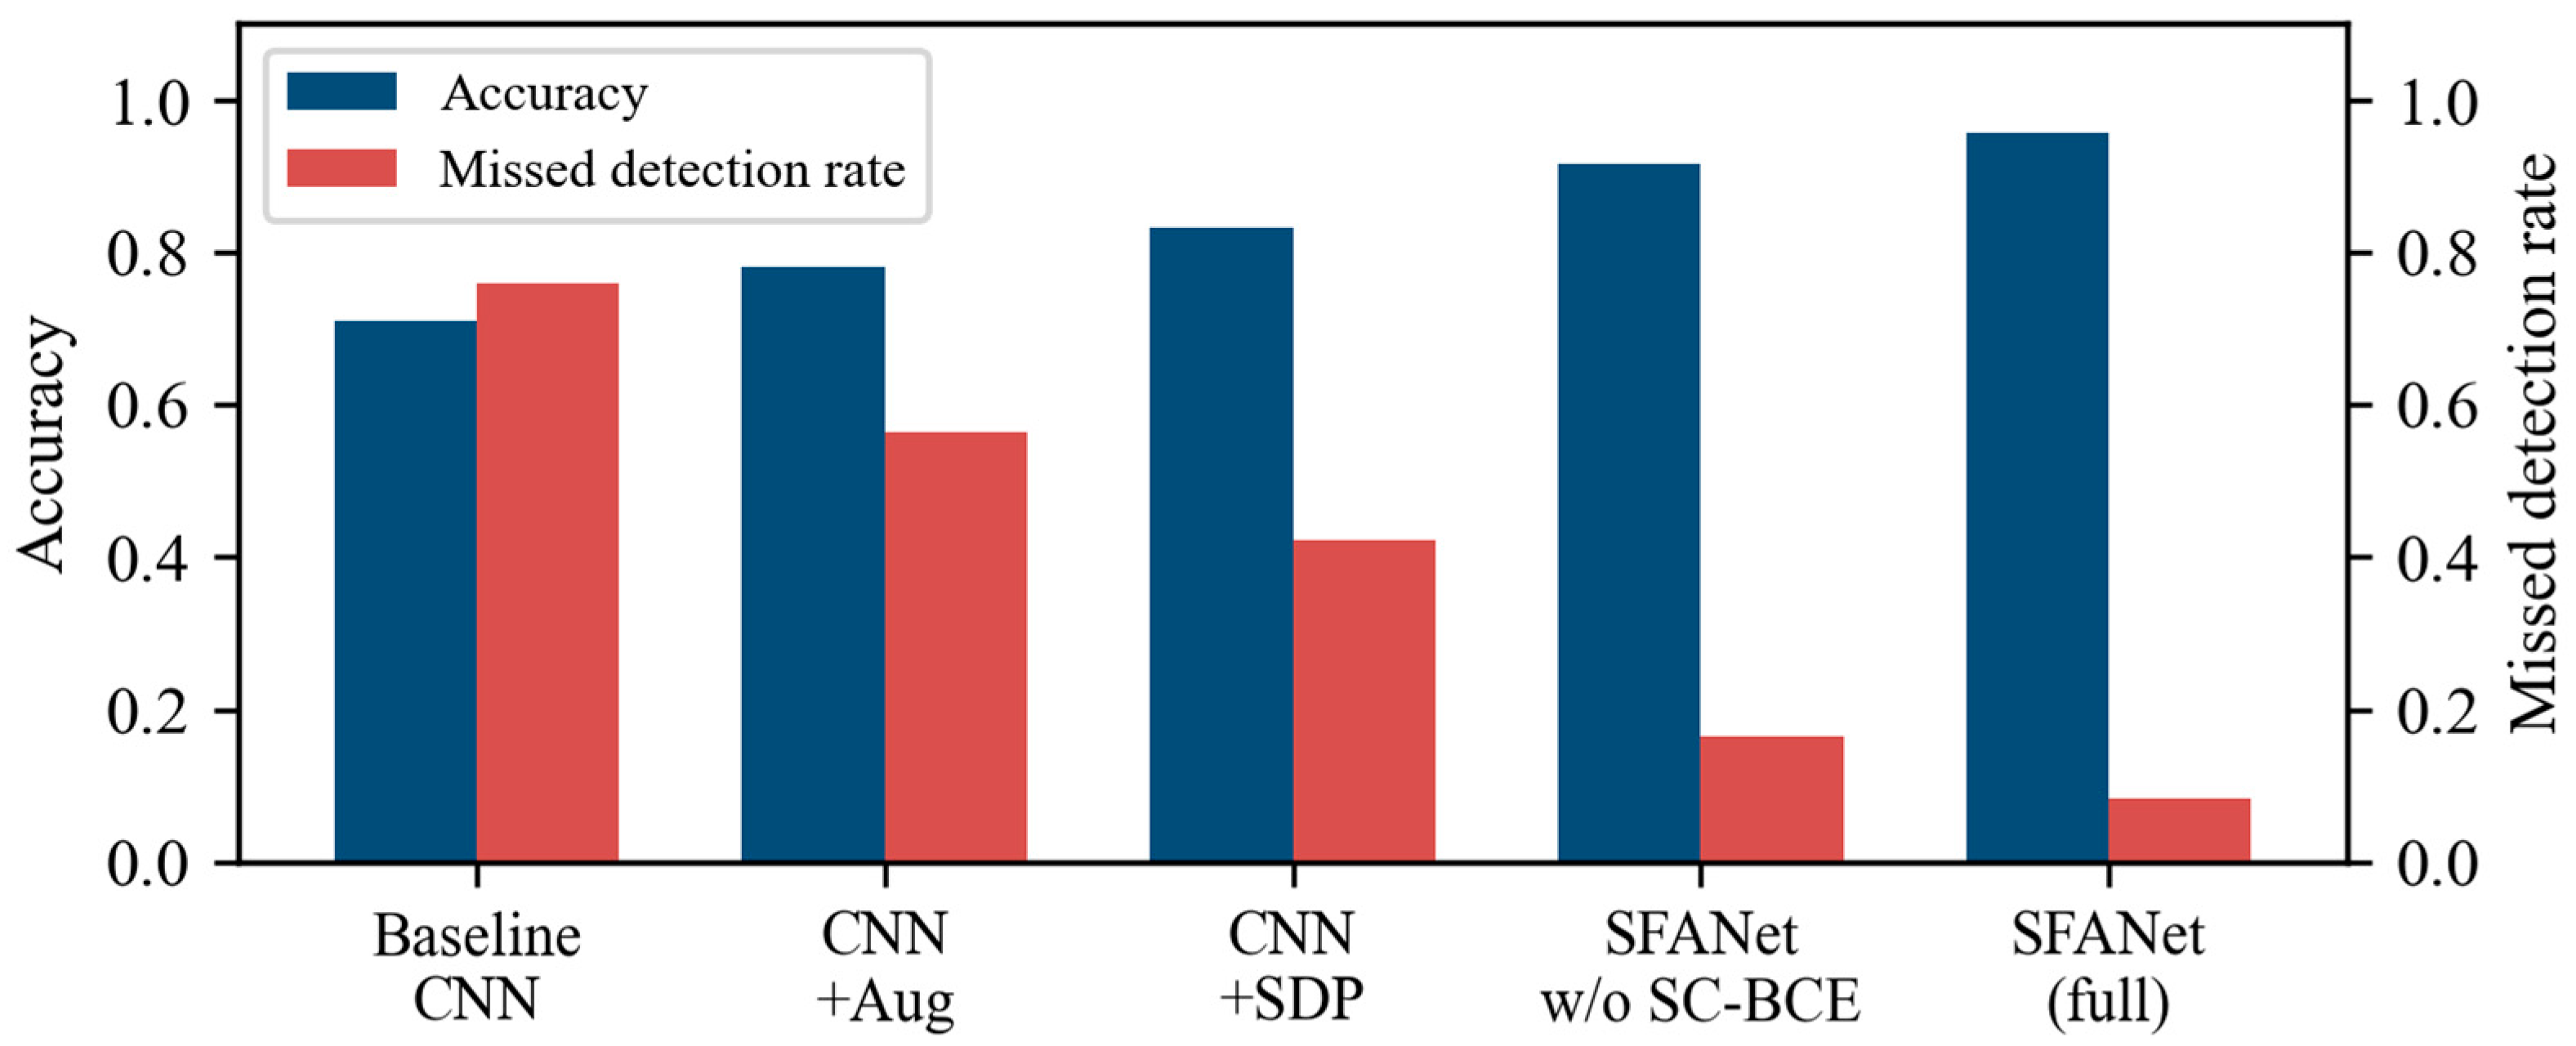
To verify the individual contribution of each core module in the SFANet framework, ablation experiments are conducted based on the same dataset and experimental settings. Five variant models are constructed for comparison: the baseline CNN model, the CNN with only data augmentation, the CNN with only SDP symmetric fusion, the full SFANet without SC-BCE loss, and the complete SFANet framework.
The experimental results are shown in Figure 6. Compared with the baseline CNN, the introduction of data augmentation improves the detection accuracy by 7.2% and reduces the missed detection rate by 19.4%, which proves that data sharpening effectively alleviates the overfitting problem caused by insufficient samples. The SDP symmetric fusion module further improves the accuracy by 5.1% by enhancing the feature representation of multi-source data. After adding the SC-BCE loss function, the missed detection rate is further reduced by 8.2%, as the reweighting strategy corrects the optimization bias caused by pseudo-anomaly samples. The performance improvement of each module is stable and cumulative, which verifies the rationality of the framework design.
Figure 6.
Experimental results of ablation study.
3.4. Sensitivity Analysis of Hyperparameter λ
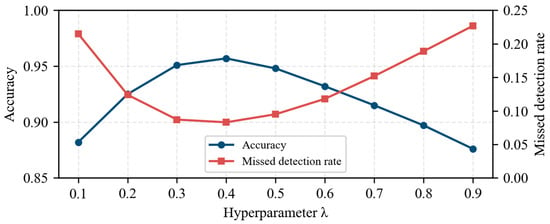
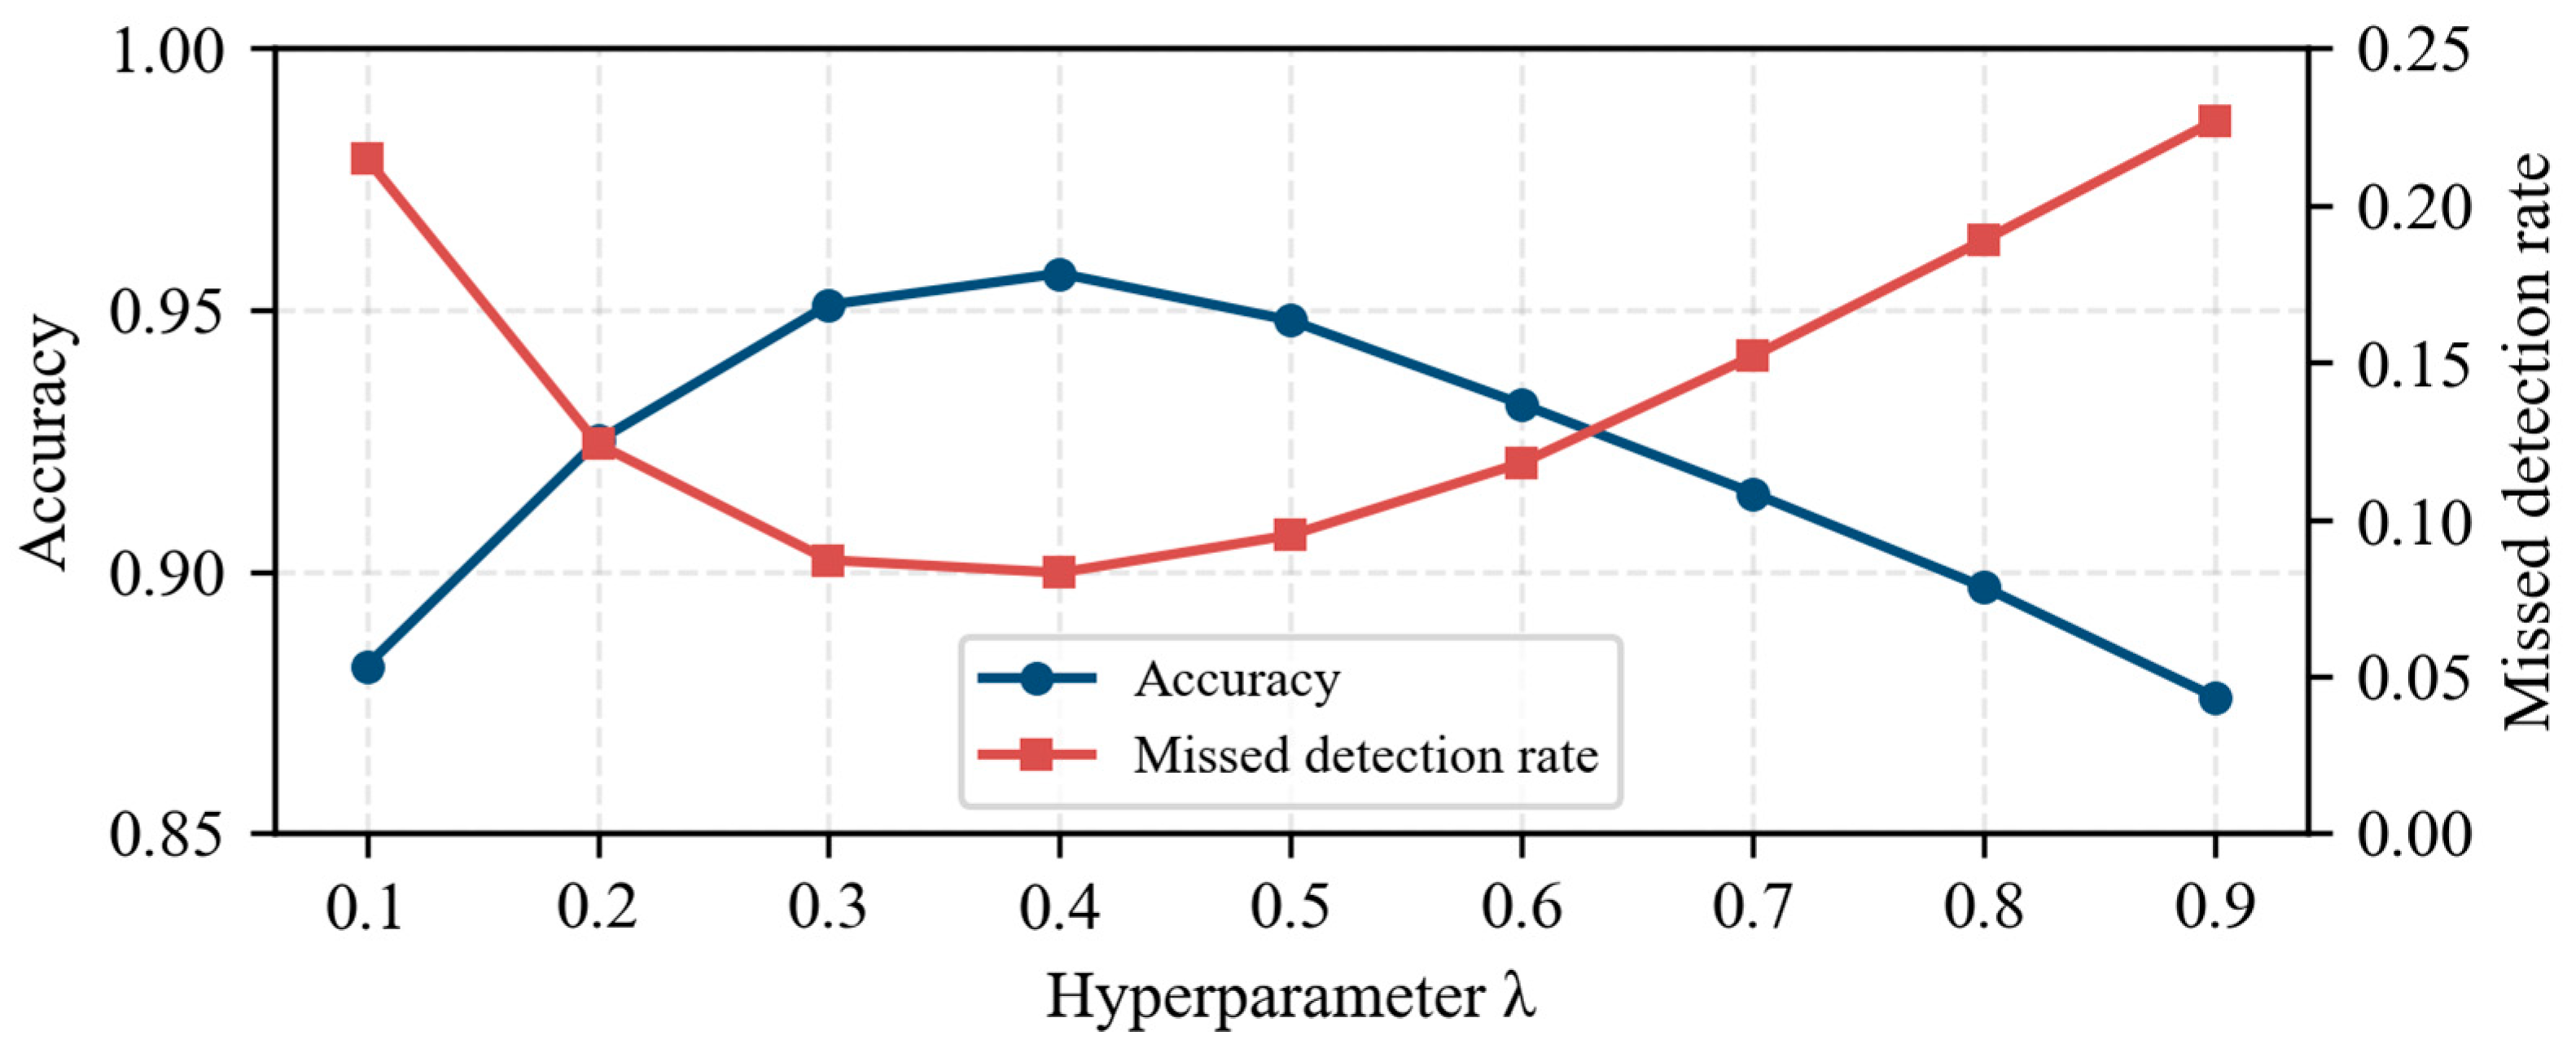
The weight parameter λ in the SC-BCE loss function is a key hyperparameter, which adjusts the contribution of pseudo-anomaly samples to the gradient update during model training. To explore its influence on detection performance, we test the performance of the model under different λ values ranging from 0.1 to 0.9, and the results are shown in Figure 7. For the experimental dataset in this work, the adaptive λ calculated from the training set is 0.42, which is located in the optimal performance interval.
Figure 7.
Experimental results of λ sensitivity.
When λ is in the range of 0.3 to 0.5, the model achieves the best comprehensive performance, with accuracy above 95% and missed detection rate below 9%. When λ is too small, the information of pseudo-anomaly samples is insufficiently utilized, and the decision boundary cannot be effectively calibrated, resulting in a high missed detection rate. When λ is too large, the model overestimates the importance of pseudo-anomaly samples, leading to a decrease in overall accuracy. The adaptive λ calculation strategy adopted in this paper can automatically adjust the parameter value according to the data distribution, stably falling within the optimal interval, which ensures the robustness of the method.
3.5. ROC Curve and Computational Efficiency Verification
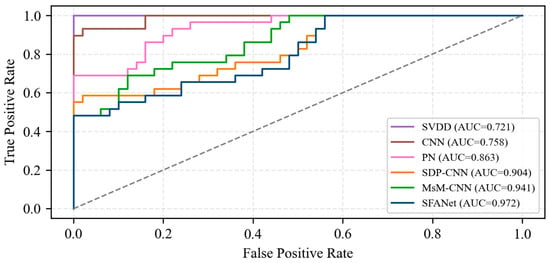
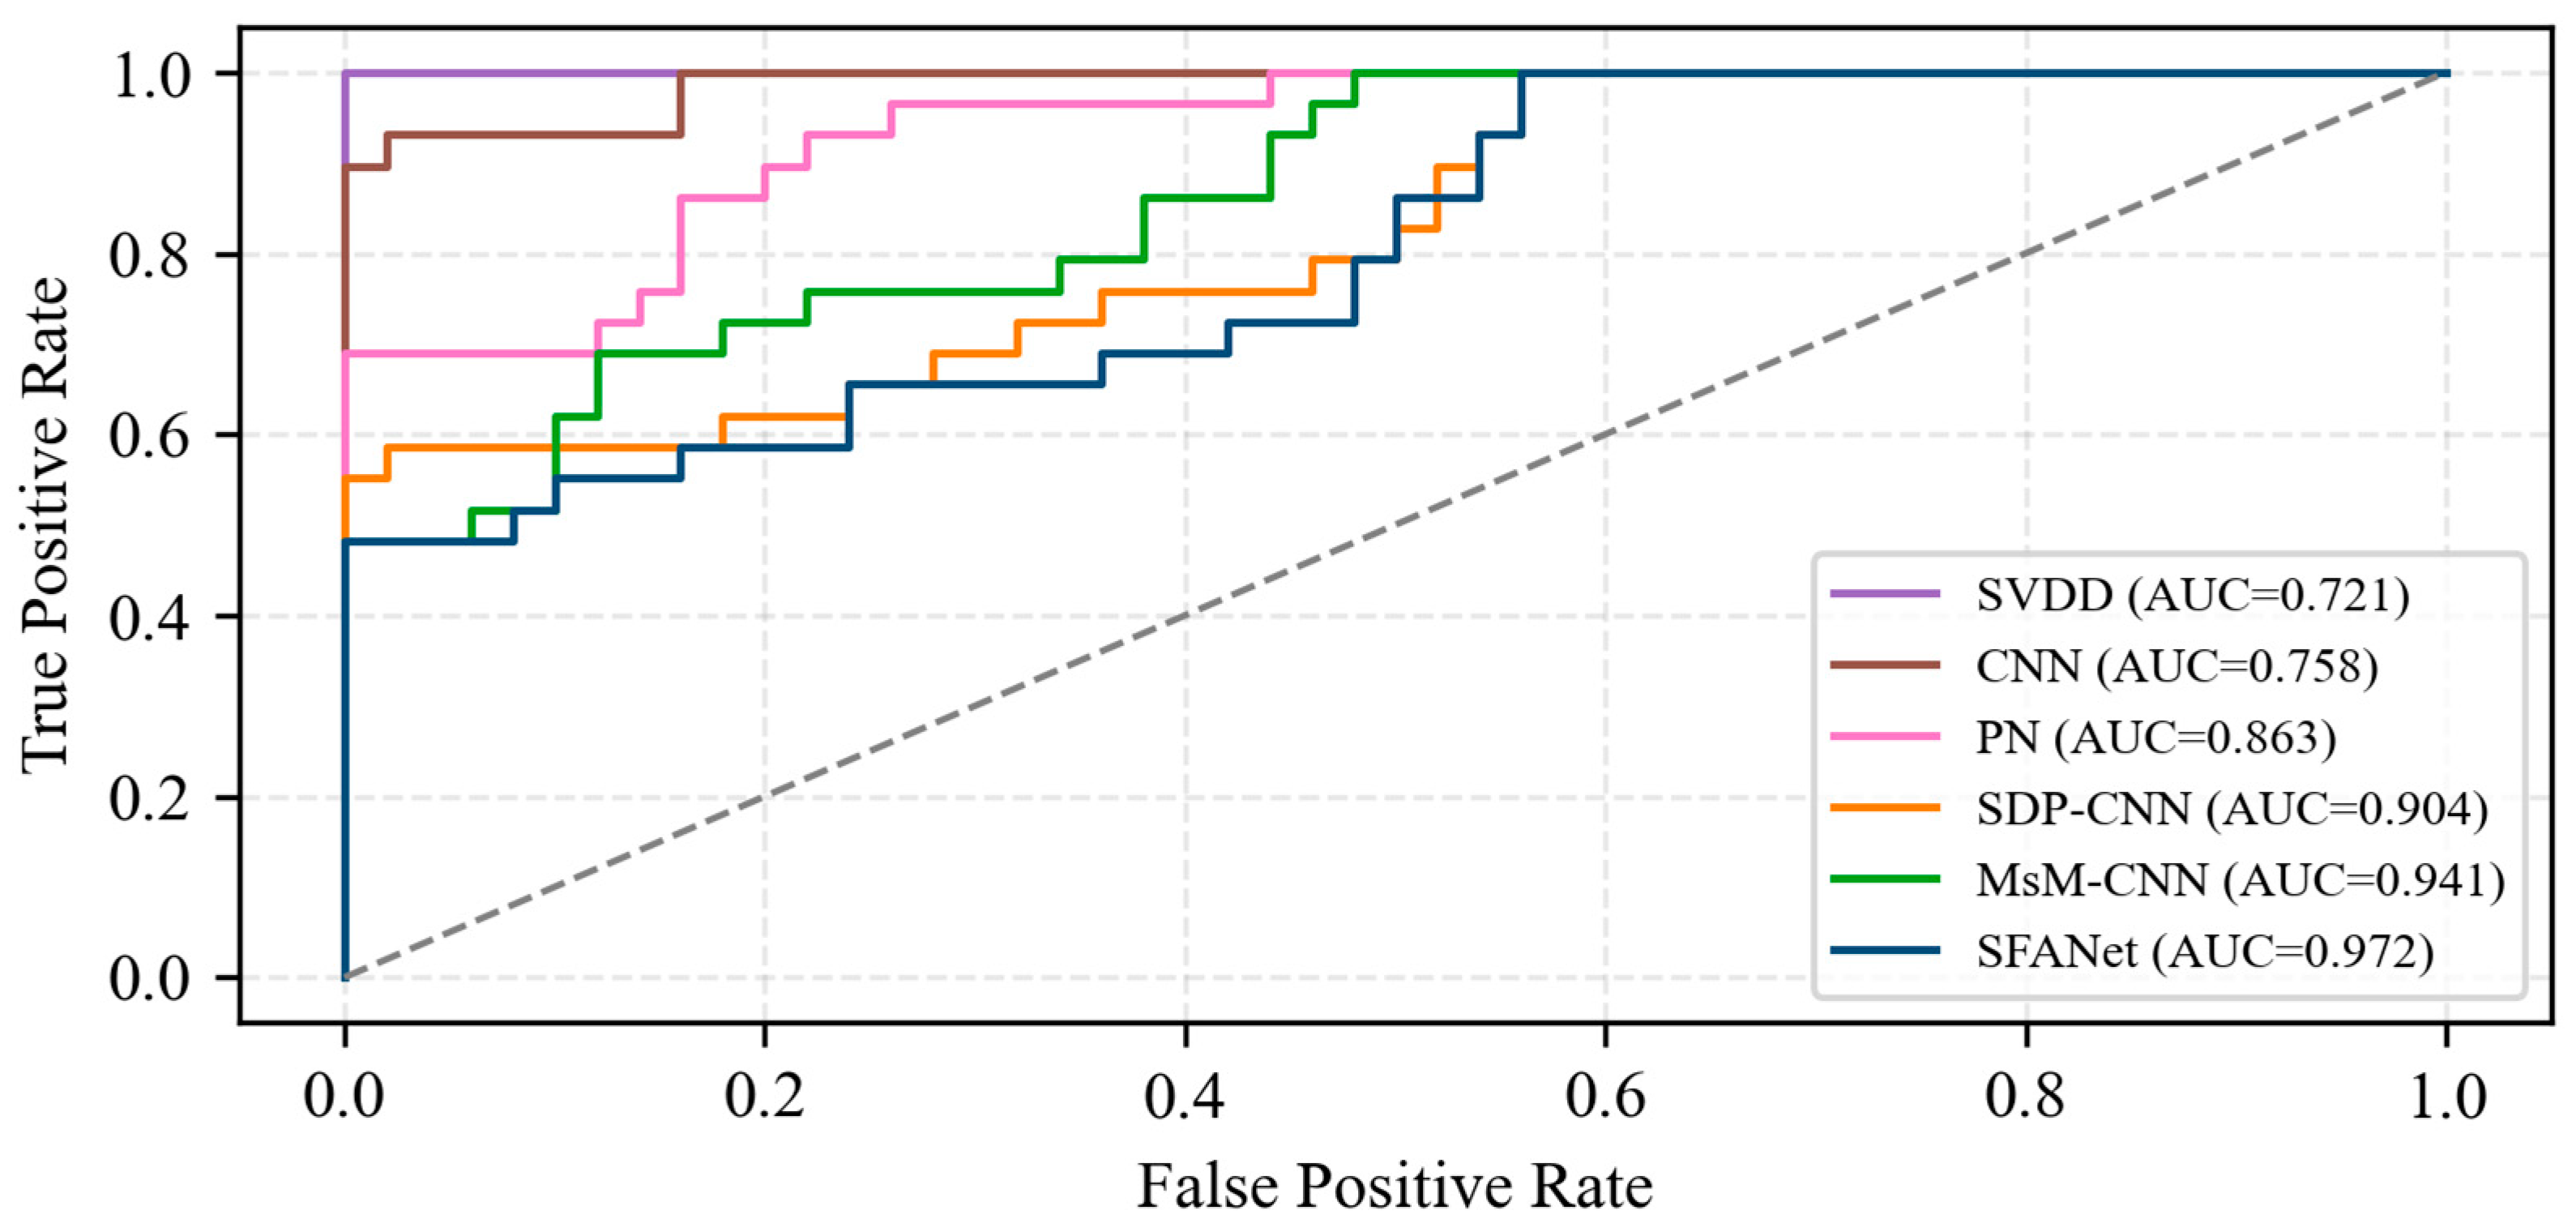
To further comprehensively evaluate the detection performance of each algorithm, the Receiver Operating Characteristic (ROC) curve and the Area Under Curve (AUC) are introduced as supplementary evaluation indicators. The ROC curves of six comparison algorithms on the test set are shown in Figure 8.
Figure 8.
ROC curves of different anomaly detection algorithms.
It can be seen from the figure that the proposed SFANet has the largest area under the curve, with an AUC value of 0.972, which is significantly better than other comparison algorithms, indicating that the method has more stable and reliable detection performance under different decision thresholds. In terms of computational efficiency, the average inference time of a single sample of SFANet is 0.72 ms, which is less than 1 ms, as shown in Table 5. It can meet the real-time monitoring requirements of industrial field equipment.
Table 5.
Comparison of single-sample inference time of different algorithms.
The single-sample inference time of SFANet is 0.72 ms, which is tested on an Intel Core i7-10700 desktop CPU platform. The latency consists of ~0.21 ms SDP preprocessing and ~0.51 ms CNN forward inference. For common ARM-based edge gateways in industrial sites, the single-sample inference time is about 2.4 ms, which still far meets the real-time requirement of the 1 min sampling interval.
4. Discussion
4.1. Long-Term Performance Evaluation
Long-term performance evaluation. Diaphragm hydrogen compressors in refueling stations face significant noise interference during data acquisition, making it challenging to accurately assess model performance with limited existing data. While metrics like accuracy, false detection rate, and missed detection rate evaluate offline performance, real-world applications additionally require rapid model response. This section therefore examines the method’s practical value through long-term testing of noise immunity and response time.
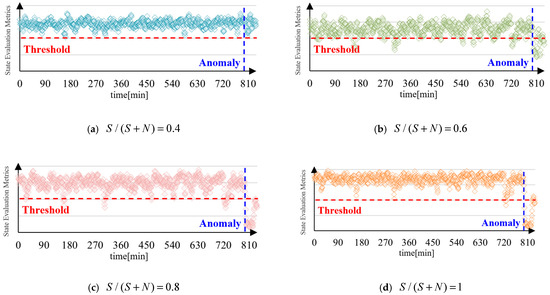
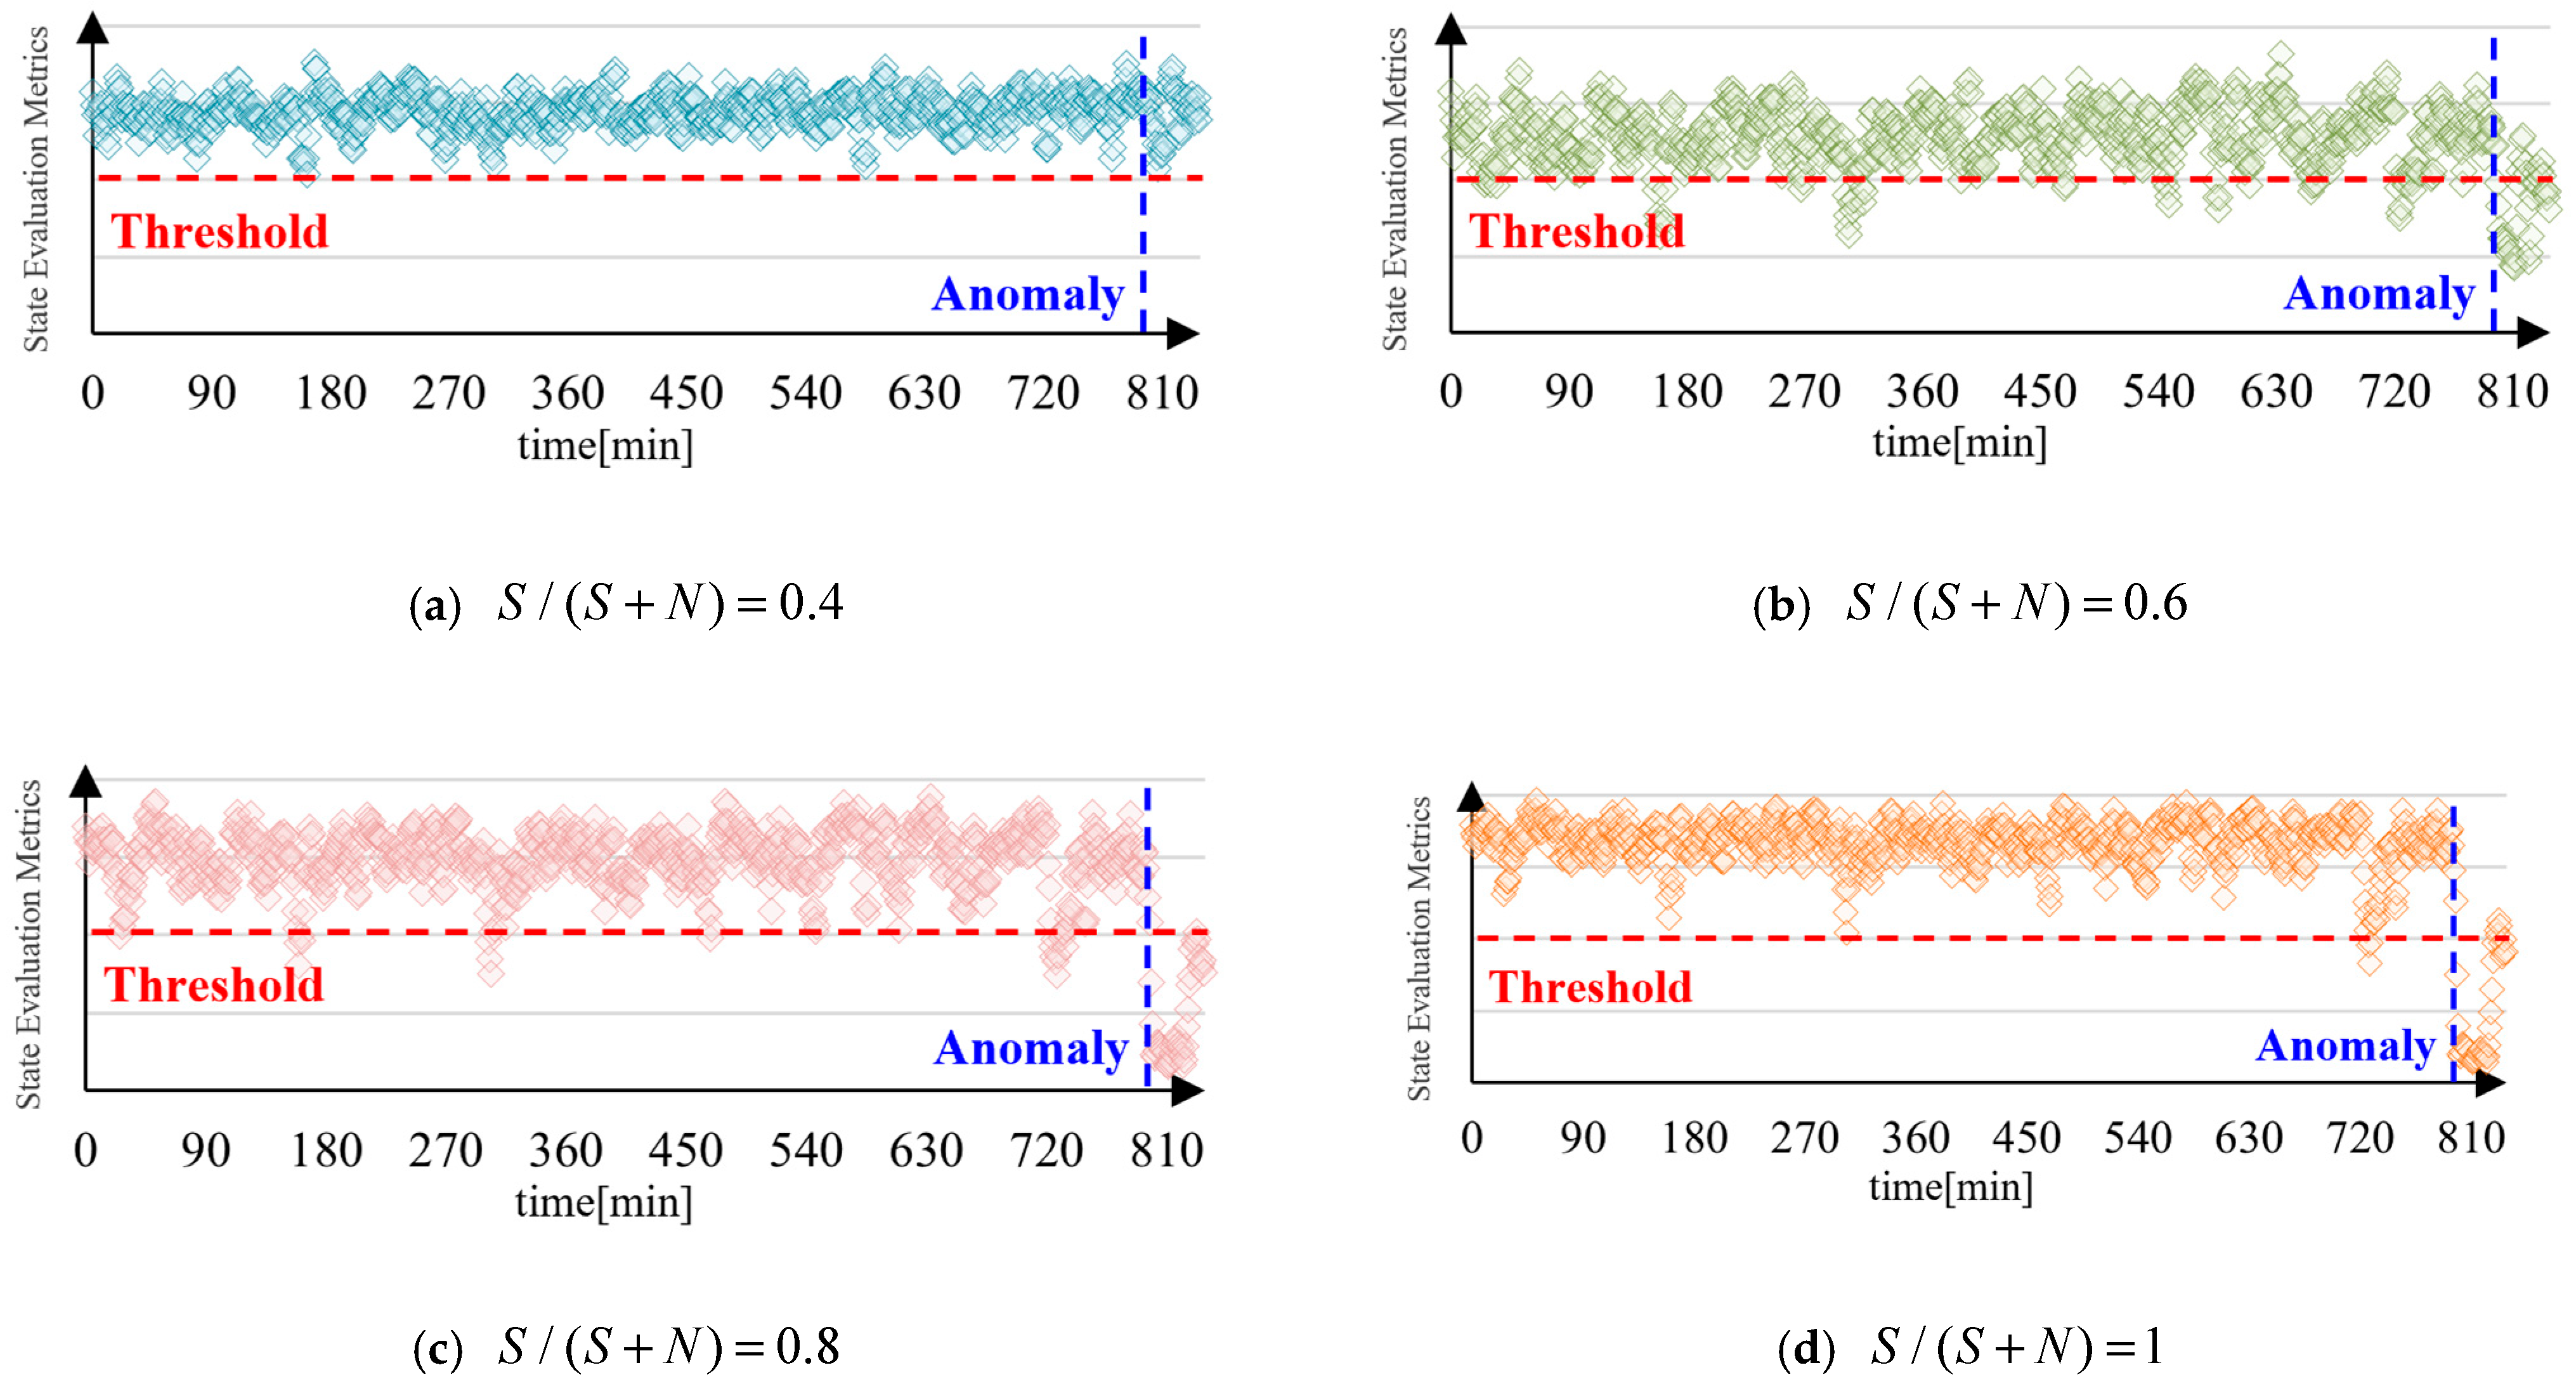
The validation incorporates monitoring data with varying noise levels. For original data , we add random noise , using the signal-to-total-average-power ratio to quantify interference intensity. The test set covers complete operational cycles, with results shown in Figure 9.
Figure 9.
Long-period anomaly detection results under noise interference.
The experimental results demonstrate that the proposed method maintains effective anomaly detection capability even at = 0.6, with processing time per sample not exceeding 1 ms, confirming its practical applicability. However, when decreases to 0.4, the model fails to distinguish between normal and anomalous samples, revealing its noise immunity limit.
Furthermore, analysis of full-cycle data distribution reveals regular anomaly spikes occurring at approximately 120 min intervals during normal operation. The frequency of these spikes increases significantly prior to actual failure events. Subsequent research on this pattern may provide valuable information for early warning systems in diaphragm hydrogen compressors.
4.2. Misclassification Attribution and Feature Contribution Analysis
Although the proposed SFANet method achieves a detection accuracy of 95.7% on the test set, it still yields a false detection rate of 2.1% and a missed detection rate of 8.3%. Attribution analysis of misclassified samples helps clarify the application boundaries of the method and directions for subsequent optimization.
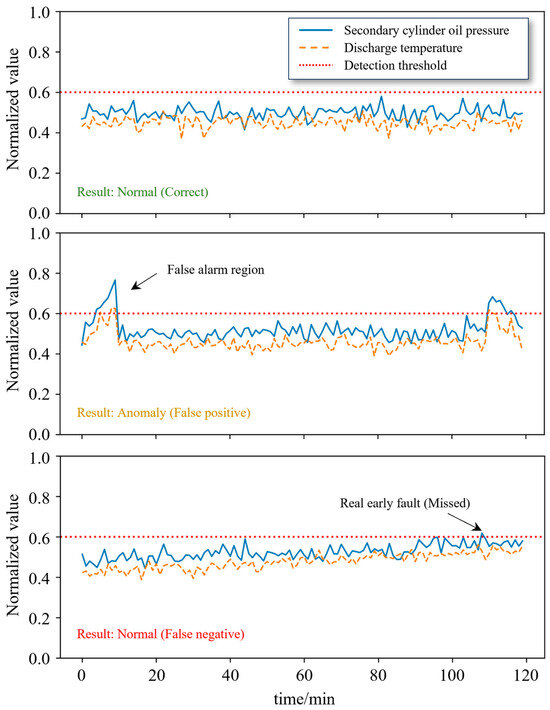
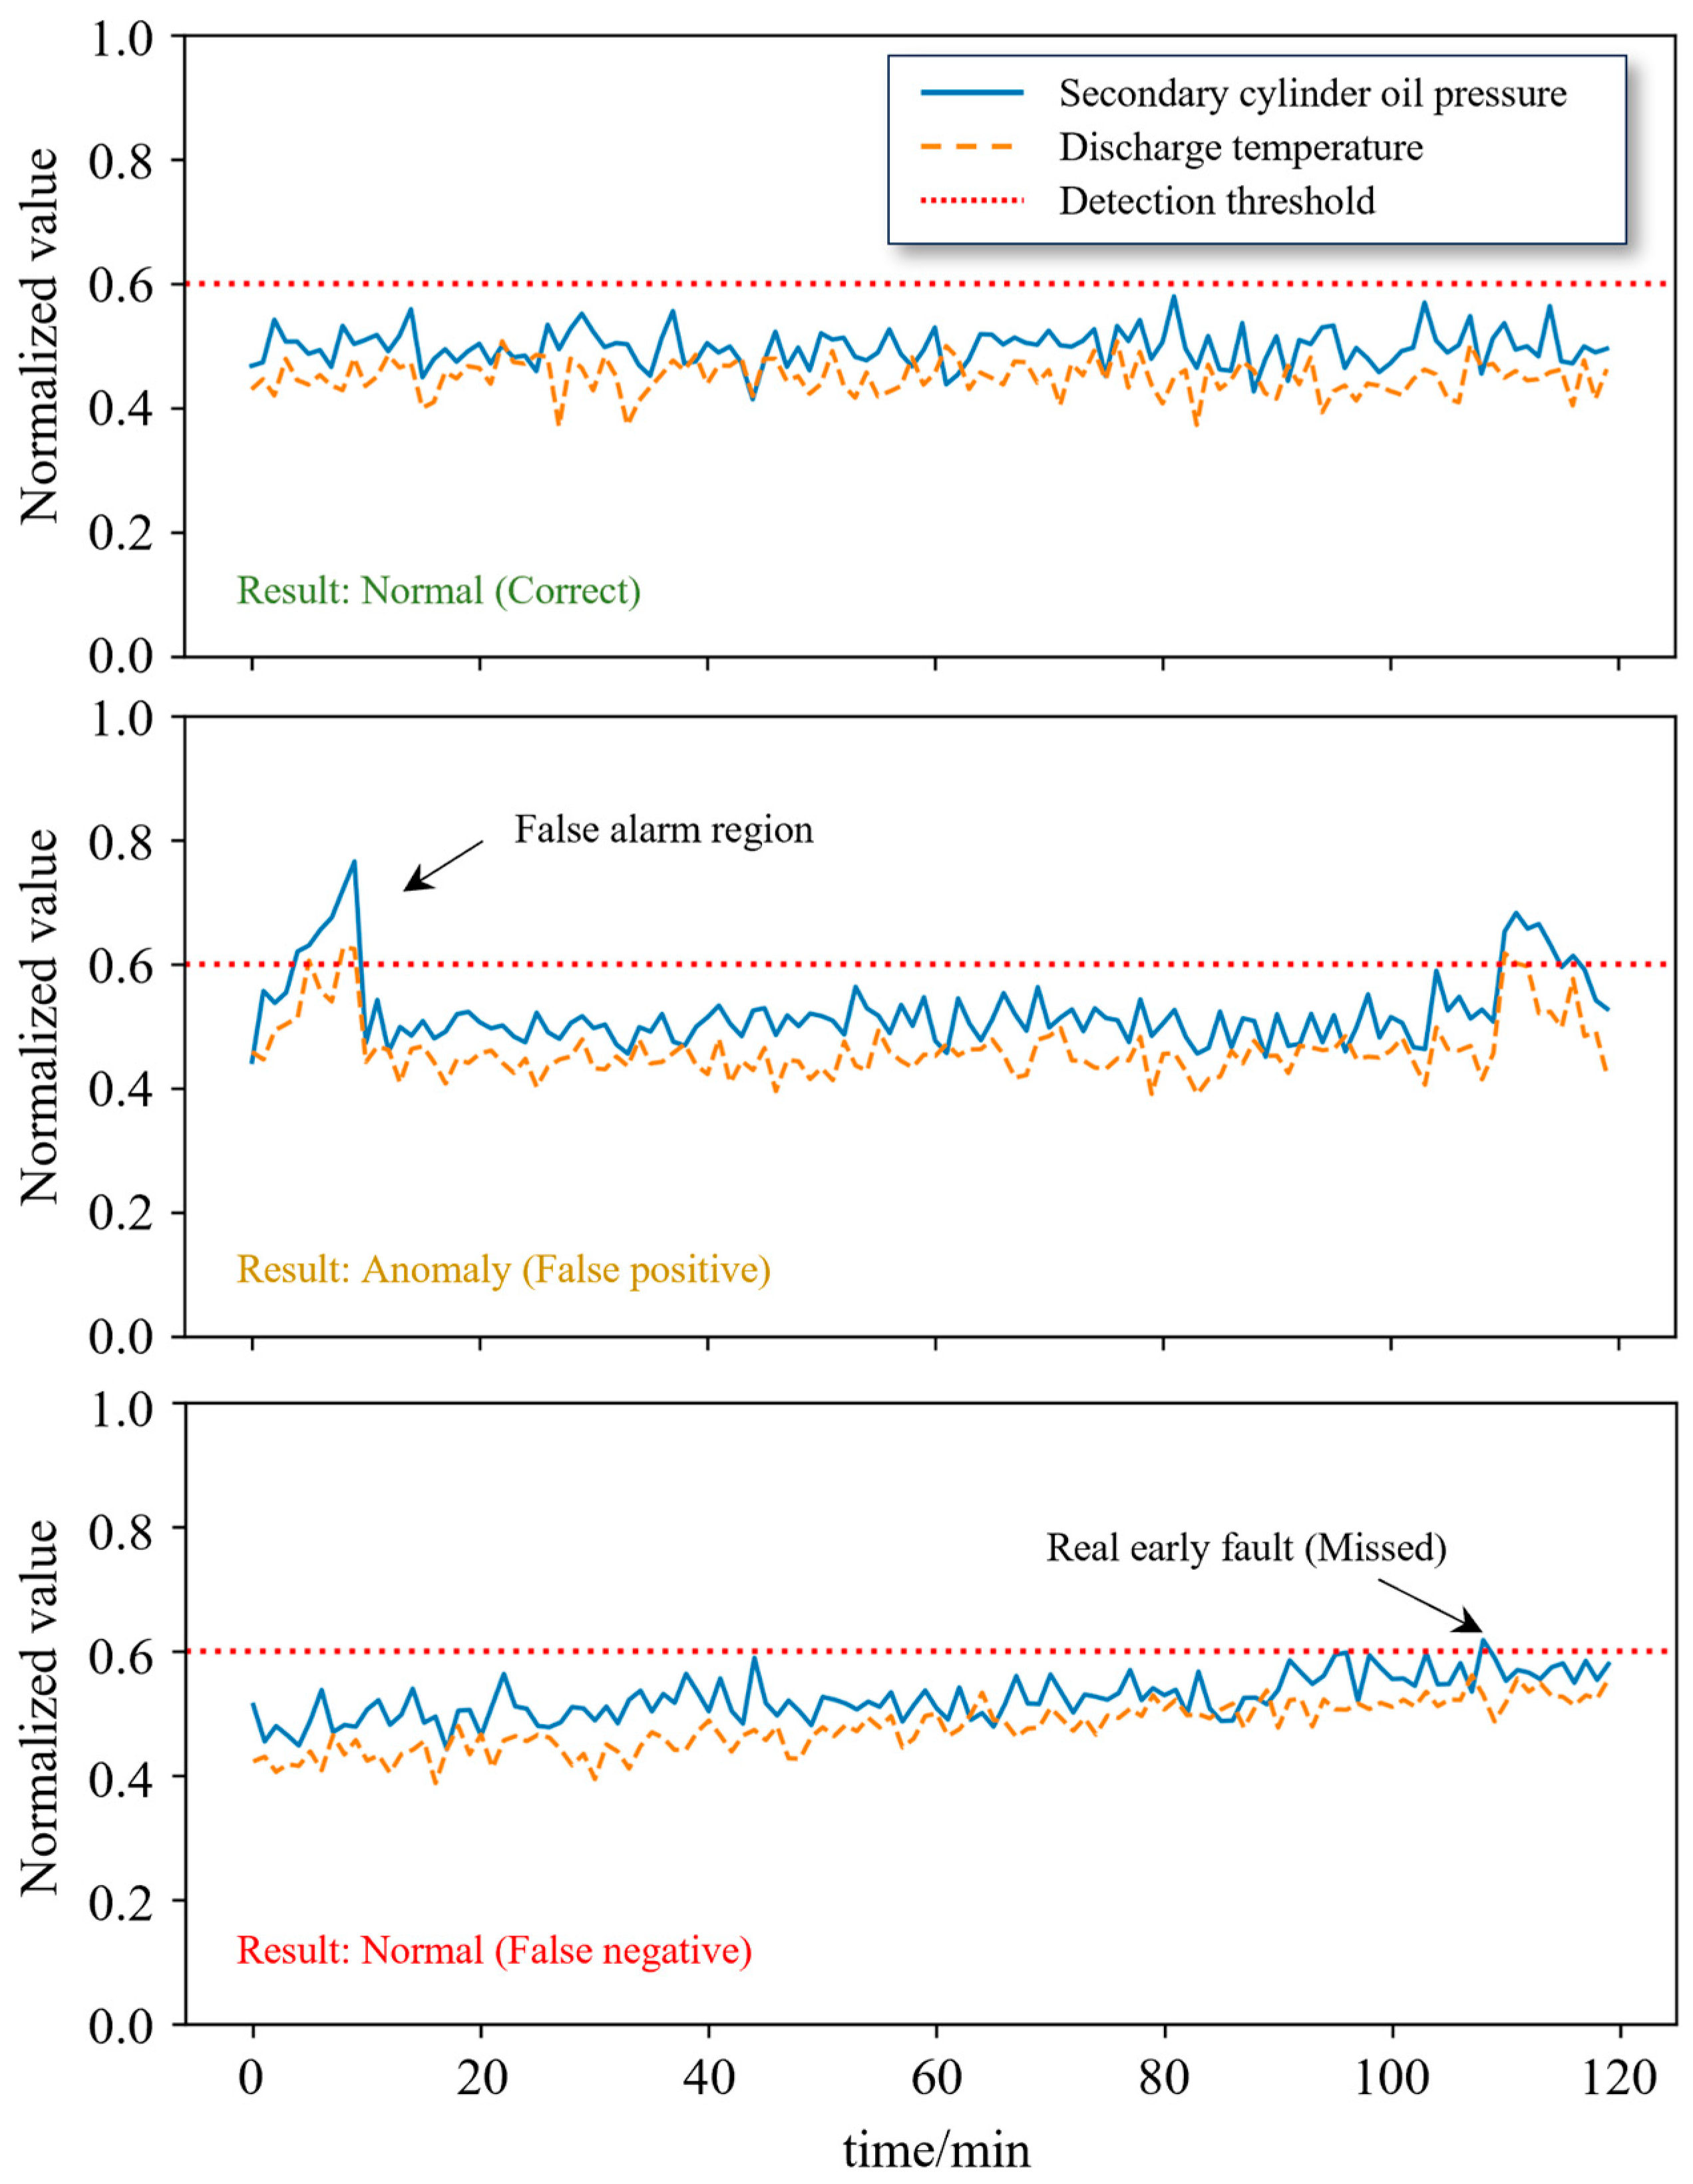
In terms of false detection samples, misjudgments mainly occur during the start–stop transient conditions of the compressor and periods with large fluctuations in suction pressure. As shown in Figure 10, equipment parameters exhibit large transient variations in a short time during the start–stop phase. Their waveform characteristics are highly similar to those of the sharpened pseudo-anomaly samples, leading the model to misclassify them as anomalies. Such fluctuations are inherent characteristics of normal equipment operation, rather than faults or performance degradation, which is a common limitation of semi-supervised anomaly detection methods trained solely on normal data. In follow-up research, an operating condition recognition module can be introduced to establish separate models for the start–stop phase, so as to further reduce the false detection rate.
Figure 10.
Time-series curves of normal, false positive and false negative samples.
For missed detection samples, all unrecognized anomalies correspond to early-stage mild seal wear faults. The characteristic signals of such faults are extremely weak and are often masked by random fluctuations under normal operating conditions. Even after enhancement via symmetric fusion, their feature differences still fail to exceed the decision threshold. This indicates that data augmentation-based methods still have room for improvement in identifying early-stage weak faults, and can be further optimized by combining weak signal decoupling and enhancement technologies in the future.
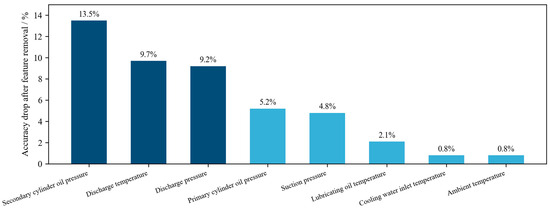
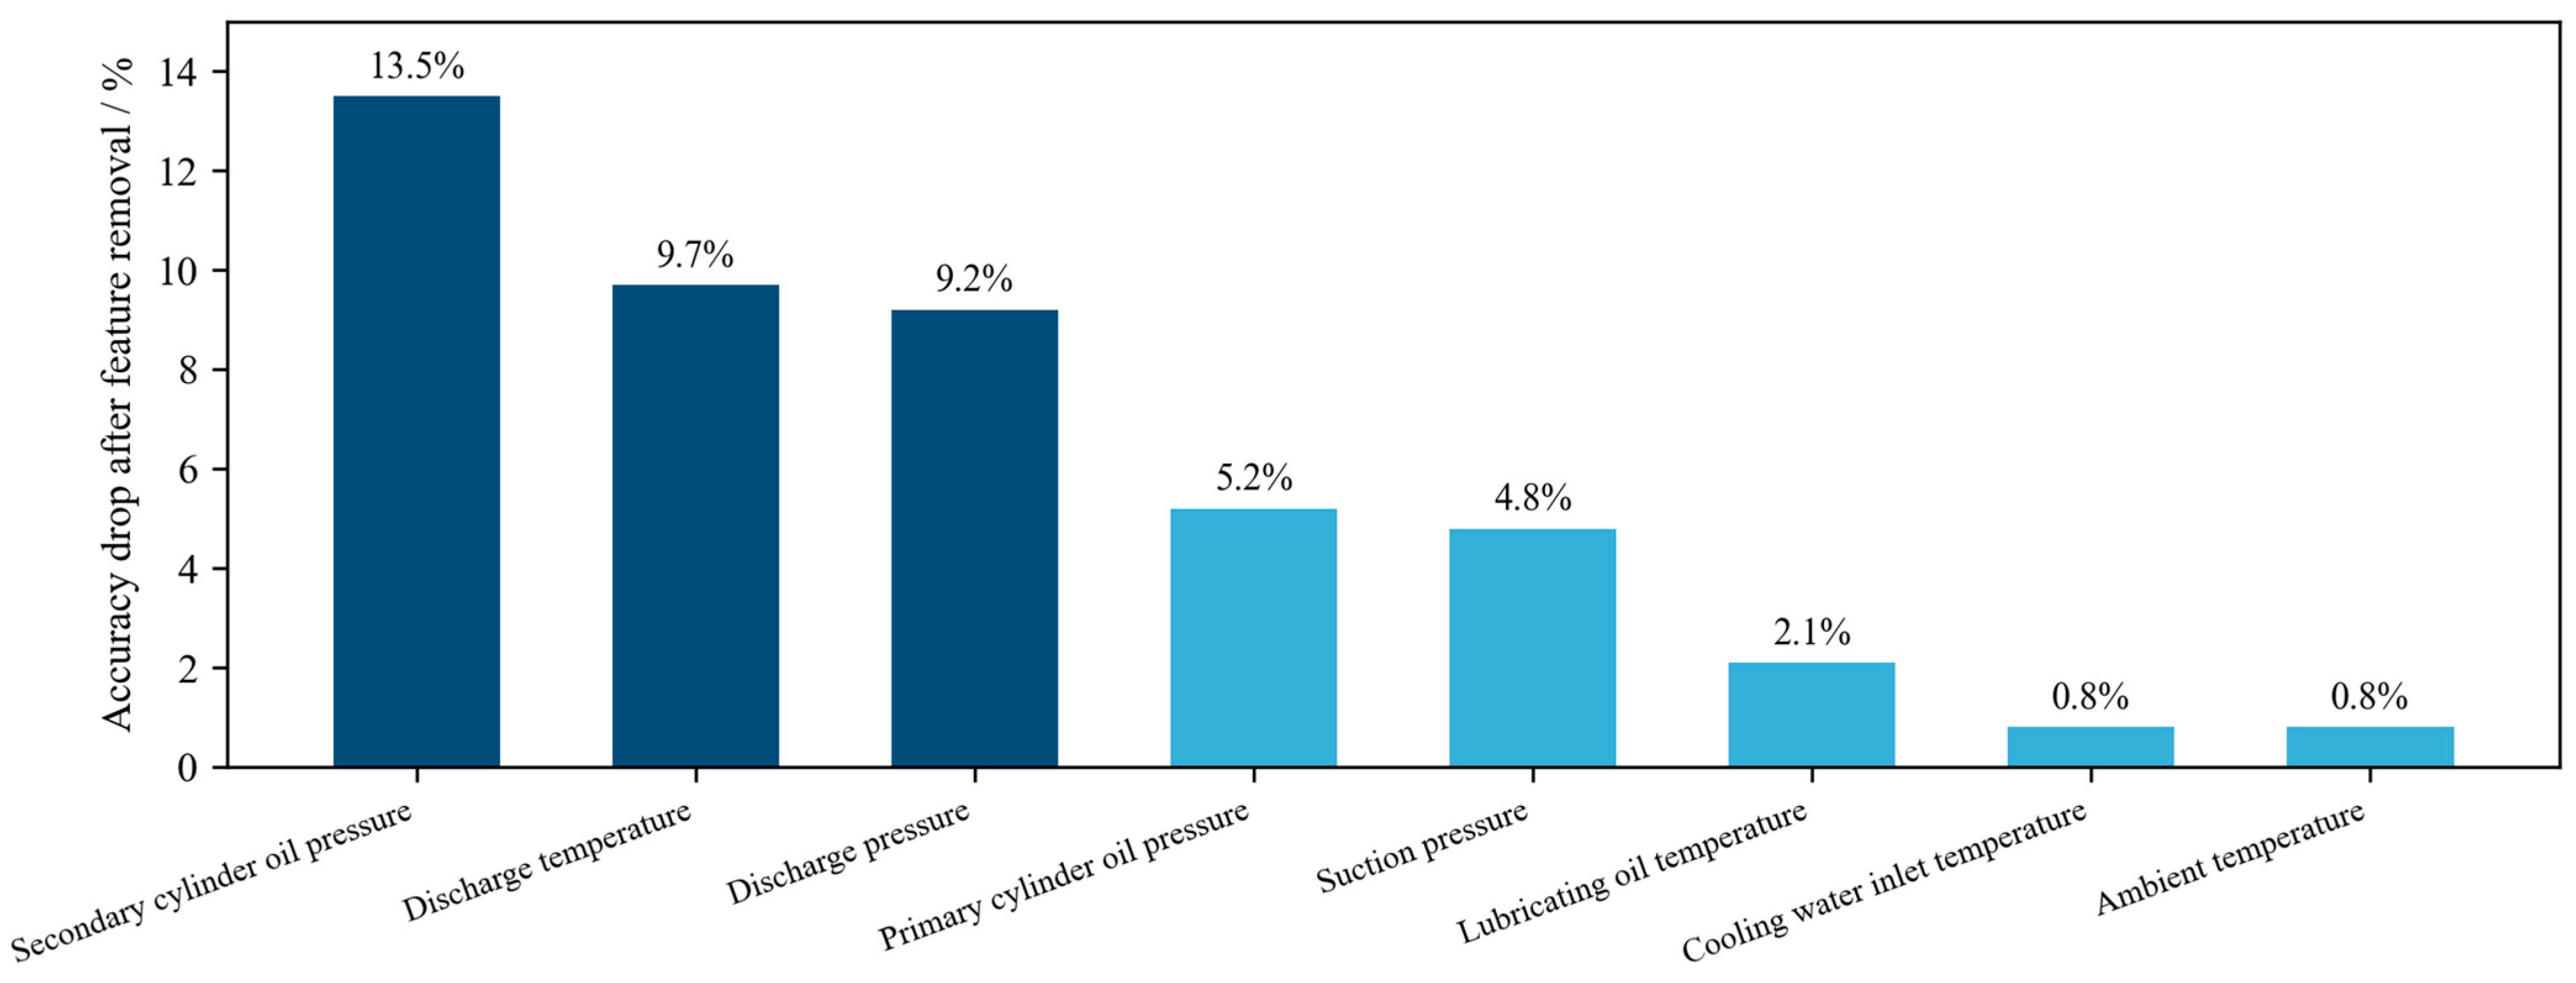
To verify the effectiveness of multi-source data fusion, this paper adopts a feature ablation approach to quantify the diagnostic contribution of each monitoring parameter: each single-dimensional parameter is removed one by one, and the model accuracy is retested. The magnitude of accuracy reduction is used to represent the importance of the corresponding parameter, and the results are shown in Figure 11. Among them, secondary cylinder oil pressure, discharge temperature, and discharge pressure rank top three in terms of contribution, which is highly consistent with the failure mechanism of diaphragm hydrogen compressors—typical faults such as diaphragm rupture and seal failure are first reflected by abnormalities in oil pressure and discharge parameters. Auxiliary parameters such as cooling water inlet temperature and ambient temperature have low individual contributions, but their inclusion in fusion can still improve the model’s robustness against environmental interference.
Figure 11.
Feature contribution ranking of monitoring parameters.
4.3. Engineering Deployment and Practical Application Value
The above experimental results have verified the detection performance of the proposed method from the algorithm level. For industrial application scenarios of hydrogen refueling stations, the deployability, operation cost and maintenance matching degree of the method are also key indicators affecting its promotion value. The SFANet method proposed in this paper can be adapted to the existing operation and maintenance system of hydrogen refueling stations through a two-tier deployment architecture, without large-scale hardware transformation.
The overall deployment adopts the architecture of “edge-side real-time inference + cloud-side iterative optimization”. On the edge side, the lightweight trained model is embedded in the on-site industrial gateway of the hydrogen refueling station. Relying on the sub-millisecond inference speed of the model, it can complete real-time data acquisition, feature fusion and anomaly judgment locally. Once an abnormal state is detected, the on-site acousto-optic alarm device is triggered immediately, and the alarm information is synchronously uploaded to the cloud platform. Benefiting from the low computational overhead of SDP transformation and lightweight CNN structure, the model can run stably on ARM architecture edge gateways without additional high-performance computing hardware, which effectively controls the deployment cost. On the cloud side, the long-term accumulated operation data are used to retrain and update the model periodically with the accumulation of equipment operation data, so as to continuously adapt to the slow performance degradation during the service life of the compressor. Benefiting from the lightweight CNN structure and low-complexity SDP transformation, the total parameter size of the model is only about 32.6 kB, and the memory occupation during inference is less than 2 MB. It can run stably on conventional ARM-based industrial edge gateways, and can achieve millisecond inference speed when equipped with industrial x86 control computers.
In terms of operation and maintenance matching, a three-level early warning mechanism is designed in combination with the safety management specifications of hydrogen refueling stations: the attention level corresponds to slight deviation of parameters, and operation and maintenance personnel are arranged for routine inspection; the warning level corresponds to obvious abnormal characteristics, and targeted troubleshooting is required within 24 h; the alarm level corresponds to severe abnormal state, and emergency shutdown and inspection procedures need to be started immediately. This mechanism matches the existing safety management process of hydrogen refueling stations, and can be seamlessly connected with the on-site SCADA monitoring system by reusing the originally installed pressure, temperature and oil pressure sensors, which avoids secondary transformation of the equipment and has strong engineering popularization value.
5. Conclusions
(1) Addressing the high-safety and high-reliability requirements of diaphragm hydrogen compressors, this study proposes a fault-sample-free anomaly detection method based on symmetric data augmentation. Utilizing only normal operation data, the method expands the dataset through symmetric pattern augmentation, resolving the challenge of constructing decision boundaries with limited historical data while enabling comprehensive health assessment of compressors.
(2) Long-term monitoring data analysis on a specific compressor model demonstrates the method’s superior performance: high accuracy (96%), low false detection (2%), and low missed detection rates (8%), significantly outperforming existing approaches. With computational latency below 1 ms, it supports real-time monitoring.
(3) The method maintains robust anomaly detection when the signal-to-interference ratio is 0.6, but exhibits obvious performance degradation when the ratio decreases to 0.4.
(4) Feature ablation experiments verify the leading diagnostic contribution of oil pressure and temperature parameters, and confirm that multi-source symmetric fusion significantly outperforms single-parameter detection, pointing out clear optimization directions for the method. In future work, we will further verify the generalization performance of the method on diaphragm hydrogen compressors with different pressure levels and from different manufacturers, and continue to optimize the noise robustness and early weak fault identification capability of the model.
Author Contributions
Conceptualization, F.L. and T.Z.; methodology, F.L.; software, F.L.; validation, F.L., Y.S. and B.T.; formal analysis, F.L.; investigation, Y.S. and B.T.; resources, T.Z.; data curation, Y.S.; writing—original draft preparation, F.L.; writing—review and editing, T.Z.; visualization, F.L.; supervision, T.Z.; project administration, T.Z.; funding acquisition, T.Z. All authors have read and agreed to the published version of the manuscript.
Funding
This research was funded by SINOMACH Youth Science and Technology Key Fund (Grant No. QNJJ-ZD-2024-01), and Natural Science Foundation of Hunan Province (Grant No. 2025JJ60284).
Data Availability Statement
The experiment data used in this study is internal to the research team and is not publicly available. For more detailed data descriptions, the corresponding author of this paper can be contacted. Depending on the type of request, some of the important data will be provided appropriately.
Conflicts of Interest
Authors Fudong Li, Yue Shu, and Bo Tao are employed by Hefei General Machinery Research Institute Co., Ltd. The remaining authors declare that the research was conducted in the absence of any commercial or financial relationships that could be construed as a potential conflict of interest. The authors declare that this study received funding from Natural Science Foundation of Hunan Province (Grant No. 2025JJ60284) and SINOMACH Youth Science and Technology Key Fund (Grant No. QNJJ-ZD-2024-01). The funder was not involved in the study design, collection, analysis, interpretation of data, the writing of this article or the decision to submit it for publication.
Abbreviations
The following abbreviations are used in this manuscript:
| SC-BCE Loss | Semi-confidence version of binary cross-entropy loss |
| SDP | Symmetric dot pattern |
| SFANet | Symmetric fusion data augmentation network |
| CNN | Convolutional neural network |
| Conv2D | 2D convolutional layer |
| MaxPool2D | 2D max-pooling layer |
| SVDD | Support vector domain description |
| PN | Prototype networks |
| MsM-CNN | Multi-sharpening mode CNN |
References
- Li, F.; Liu, X.; Liu, Z.; Yu, Y. Study on the influence of oil-gas pressure difference on diaphragm in diaphragm compressor. J. Phys. Conf. Ser. 2025, 2963, 012035. [Google Scholar] [CrossRef] [Scilit]
- Zhao, Z.; Wang, G.; He, J.; Tian, Y. Thermodynamics and dynamic investigation of ultra-high-pressure diaphragm compressor. Front. Energy Res. 2024, 12, 1365558. [Google Scholar] [CrossRef] [Scilit]
- Li, T.; Li, M.; Zhou, L.; Wang, H.; Hu, W.; Zhang, X. Mechanical property and sealing performance analysis of the diaphragm compressor cylinder head for the hydrogen refueling station under the mutation impact load. Int. J. Numer. Methods Calc. Des. Eng. 2023, 39, 46. [Google Scholar] [CrossRef] [Scilit]
- Sdanghi, G.; Maranzana, G.; Celzard, A.; Fierro, V. Review of the current technologies and performances of hydrogen compression for stationary and automotive applications. Renew. Sustain. Energy Rev. 2019, 102, 150–170. [Google Scholar] [CrossRef] [Scilit]
- Kurtz, J.; Sprik, S.; Peters, M.; Bradley, T.H. Retail Hydrogen Station Reliability Status and Advances. Reliab. Eng. Syst. Saf. 2020, 196, 106823. [Google Scholar] [CrossRef] [Scilit]
- Li, X.; Chen, J.; Wang, Z.; Jia, X.; Peng, X. A non-destructive fault diagnosis method for a diaphragm compressor in the hydrogen refueling station. Int. J. Hydrogen Energy 2019, 44, 24406–24416. [Google Scholar] [CrossRef] [Scilit]
- Ren, S.; Zhao, B.; Diao, A.; Jia, X.; Peng, X. Parametric analysis of the oil pressure limiter built on the influence on the diaphragm compressors for hydrogen refueling stations. Proc. Inst. Mech. Eng. Part C J. Mech. Eng. Sci. 2024, 238, 3890–3905. [Google Scholar] [CrossRef] [Scilit]
- Dhakar, A.; Singh, B.; Gupta, P. Fault diagnosis in air compressor system using advanced signal processing (LMD and EMD) and discriminant analysis-based (LDA and QDA) machine learning techniques. Noise Vib. Worldw. 2026, 59, 412–425. [Google Scholar] [CrossRef] [Scilit]
- Lee, S.; Kim, Y.; Choi, H.-J.; Ji, B. Uncertainty-aware fault diagnosis of rotating compressors using dual-graph attention networks. Machines 2025, 13, 673. [Google Scholar] [CrossRef] [Scilit]
- Ciobotaru, A.; Corches, C.; Gota, D.; Miclea, L. An explainable deep learning-based predictive maintenance solution for air compressor condition monitoring. Sensors 2025, 25, 5797. [Google Scholar] [CrossRef] [Scilit] [PubMed]
- Meng, F.; Shi, Z.; Song, Y. A novel fault diagnosis strategy for diaphragm pumps based on signal demodulation and PCA-ResNet. Sensors 2024, 24, 1578. [Google Scholar] [CrossRef] [Scilit] [PubMed]
- Wang, Y.; Hu, S. Design and realization of compressor data abnormality safety monitoring and inducement traceability expert system. PLoS ONE 2025, 20, e0315917. [Google Scholar] [CrossRef] [Scilit] [PubMed]
- Ren, S.; Jia, X.; Zhang, J.; Li, X.; Zhang, S.; Peng, X. Diagnosis method to identify diaphragm state of diaphragm compressors for hydrogen refueling stations based on dynamic oil pressure. Int. J. Hydrogen Energy 2024, 49, 1043–1055. [Google Scholar] [CrossRef] [Scilit]
- Xie, T.; Huang, X.; Choi, S.K. Intelligent mechanical fault diagnosis using multi-sensor fusion and convolution neural network. IEEE Trans. Ind. Inform. 2021, 18, 3213–3223. [Google Scholar] [CrossRef] [Scilit]
- Gao, S.; Noman, K.; Mao, G.; Deng, Z.; Li, Y.; Ge, W. Multisource heterogeneous information fusion based on graph convolutional network for gearbox fault diagnosis. IEEE Trans. Instrum. Meas. 2025, 74, 3547515. [Google Scholar] [CrossRef] [Scilit]
- Bo, L.; Li, M.; Tan, H. Enhanced CNN for induction motor fault diagnosis via multi-source data fusion. PLoS ONE 2025, 20, e0330761. [Google Scholar] [CrossRef] [Scilit] [PubMed]
- Ran, R.; Wang, L.; Yuan, L. CDFMD: Causal dynamic fusion reasoning-based multimodal intelligent fault diagnosis model for power transformers. Electronics 2026, 15, 1910. [Google Scholar] [CrossRef] [Scilit]
- Deng, Z.; Xu, D. Dynamic Anomaly Detection: A Multimodal Spatiotemporal Cross-Fusion Transformer Approach. Energies 2026, 19, 2605. [Google Scholar] [CrossRef] [Scilit]
- Xie, S.; Xie, P.; Wang, J.; Yang, L. A fault diagnosis method for critical rotating components in trains based on multi-pooling attention convolution and an improved vision transformer. Struct. Health Monit. 2025. OnlineFirst. [Google Scholar] [CrossRef] [Scilit]
- Zhong, Q.; Li, Q.; Ren, J.; Chen, X.; Liu, D.; Yang, Q. A cross-domain multi-scale feature fusion network based on graph convolution for intelligent fault diagnosis. Eng. Appl. Artif. Intell. 2025, 160, 111900. [Google Scholar] [CrossRef] [Scilit]
- Yu, W.; Zhao, C.; Huang, B.; Xie, M. An Unsupervised Fault Detection and Diagnosis With Distribution Dissimilarity and Lasso Penalty. IEEE Trans. Control Syst. Technol. 2024, 32, 767–779. [Google Scholar] [CrossRef] [Scilit]
- Zhao, C. A deep learning-based method for mechanical equipment unknown fault detection in the industrial internet of things. Sensors 2025, 25, 5984. [Google Scholar] [CrossRef] [Scilit] [PubMed]
- Zhou, Q.; Xian, X.; Yan, L.; Fan, Y.; Yin, K. Simulation-driven bearing fault diagnosis under fault-free conditions with hierarchical convolutional attention networks. Machines 2026, 14, 602. [Google Scholar] [CrossRef] [Scilit]
- Cui, W.; Meng, G.; Gou, T.; Wang, A.; Xiao, R.; Zhang, X. Intelligent Rolling Bearing Fault Diagnosis Method Using Symmetrized Dot Pattern Images and CBAM-DRN. Sensors 2022, 22, 9954. [Google Scholar] [CrossRef] [Scilit] [PubMed]

Disclaimer/Publisher’s Note: The statements, opinions and data contained in all publications are solely those of the individual author(s) and contributor(s) and not of MDPI and/or the editor(s). MDPI and/or the editor(s) disclaim responsibility for any injury to people or property resulting from any ideas, methods, instructions or products referred to in the content. |
© 2026 by the authors. Licensee MDPI, Basel, Switzerland. This article is an open access article distributed under the terms and conditions of the Creative Commons Attribution (CC BY) license.