


Abstract
This paper presents a reproducible system innovation for processing Digital Imaging and Communications in Medicine (DICOM) mammography images based on pixel-monotonic dynamic range management and engineering-verifiable intensity transformations. Standard DICOM conversion schemes to 8-bit representation often result in irreversible luminance-range compression, locality-dependent contrast distortions, and reduced robustness of deep learning models. The proposed framework preserves the physical consistency of the Modality LUT and photometric polarity, performs breast-aware robust Winsor normalization, and applies strictly monotonic global tone mapping while preserving the 16-bit depth of the training data. System validation was performed using architecture-independent metrics. Compared to standard processing, the median value of normalized mutual information increased from 0.878 to 0.892, the effective number of bits increased from 7.88 to 10.11 (+2.25), the representation entropy increased by 1.42 bits, and the clipping rate was reduced to almost zero. Experiments with the Faster R-CNN detector showed stable or improved calcification localization at Intersection over Union (IoU) ≥ 0.5 under controlled augmentation conditions. The results confirm that pixel-monotonic dynamic range control provides a reproducible, engineering-verifiable basis for AI-based mammography analysis within the evaluated dataset and experimental setting.
1. Introduction
Digital mammography remains one of the most significant methods for early breast cancer detection, and the implementation of artificial intelligence systems is actively transforming screening and diagnostic processes [1,2]. Modern deep learning algorithms demonstrate high diagnostic efficiency and potential for clinical integration [3,4]. In recent years, special attention has been paid to the development of multi-view and transformer architectures, as well as object detectors for mammogram analysis [5,6]. Despite significant advances in architectural solutions, the stability and portability of such systems depend directly on the proper formation of input images. Most full-format mammograms are stored in the Digital Imaging and Communications in Medicine (DICOM) standard, which includes high-bit-intensity information and metadata that define the physical interpretation of pixels. However, practical artificial intelligence (AI) pipelines often use simplified conversion to 8-bit representation without strict control of look-up table (LUT) parameters and dynamic range [7,8]. It has been shown that unsupervised normalization and quantization can significantly affect feature statistics and the reproducibility of results [9,10]. Research in radiomics and medical machine learning confirms that preprocessing variability introduces a hidden domain shift across datasets [11,12]. Local contrast enhancement methods, including Contrast-Limited Adaptive Histogram Equalization (CLAHE) and its modifications [13,14], are widely used to improve the visibility of small structures. Despite their effectiveness for visual perception, aggressive local equalization can amplify noise and form pseudotexture patterns [15,16]. In mammography, this is particularly critical, since microcalcifications are small, low-contrast objects that are sensitive to uncontrolled intensity changes [17,18]. In parallel, detection and classification architectures are actively developing, including Faster R-CNN, YOLO-like, and hybrid solutions [19,20]. However, most publications focus on improving neural network models, while the system organization of the DICOM pipeline and engineering control of intensity transformations remain insufficiently formalized [21,22]. Some studies emphasize the need for correct LUT processing and physically consistent intensity control to ensure the generalizability of AI systems [23].
Thus, a methodological gap remains between clinical standards for DICOM interpretation and existing methods for preparing mammographic data for artificial intelligence. Although many preprocessing operations have been described previously, a reproducible system architecture that preserves intensity rank order, provides controllable dynamic range management, and quantitatively verifies information preservation remains lacking [24]. To address this issue, this study proposes and validates a pixel-monotonic preprocessing framework for DICOM mammography images. In contrast to existing studies that mainly focus on innovations in model design and classification performance [25], this work considers preprocessing as an independent target of system innovation. The proposed framework integrates modality-consistent correction, photometric polarity alignment, robust breast-aware normalization, and globally monotonic tone mapping within a single reproducible architecture while maintaining a 16-bit analytical representation of the image. The novelty lies in formalizing pixel monotonicity as a core architectural principle for mammography image preprocessing, thereby guaranteeing improved image quality without local intensity inversions, display-dependent distortions, or premature information loss. Furthermore, the proposed framework decouples the analytical training representation from the 8-bit output image and verifies the preprocessing quality using explicit monotonicity control and architecture-independent structural metrics. Thus, the study elevates preprocessing from a secondary image correction step to a carefully designed system component for robust artificial intelligence in mammography.
The remainder of the paper is organized as follows. Section 2 describes the dataset, the proposed preprocessing framework based on monotonic pixel analysis, and the implementation details of the processing pipeline. Section 3 presents the results of the preprocessing validation and subsequent detection experiments. Section 4 discusses the main results, the study’s practical implications, and its limitations. Finally, Section 5 concludes the work and outlines directions for future research.
2. Materials and Methods
In clinical practice, mammography is interpreted using DICOM-compliant images, where each intensity conversion step determines which low-contrast structures will be visible and how they will be represented. When transferring this data to deep learning tasks, simplified conversion and contrast enhancement are often used, prioritizing a “pretty picture” over preserving correct intensity relationships. This creates a methodological problem: the model begins to rely on transformations that depend on local context and display settings, reducing the reproducibility of experiments and the robustness of detection when switching data sources or augmentation modes. Therefore, in this work, the initial formulation is built around a verifiable engineering principle: preprocessing should enhance the information content of the image without creating new local structures or disrupting the intensity order, so that any improvements in detection quality are due to the image content rather than transformation artifacts. On this basis, the goal of the study is formulated: to develop and verify a transformation that remains strictly controlled in its properties, ensures an expansion of the dynamic range and consistency of visualization, and also provides a measurable gain in objective diagnostic metrics of data quality and in the stability of the detector in various training modes.
2.1. Dataset Description
The VinDr Mammo dataset, version 1.0.0, is a large-scale, open resource for full-field digital mammography, hosted on PhysioNet at https://www.physionet.org/content/vindr-mammo/1.0.0/, accessed on 2 February 2026 and designed for the development and comparison of algorithms for computer-aided diagnosis and pathology detection in mammograms. The data are organized at the examination level and include 5000 mammography examinations, each containing 4 standard projections, for a total of 20,000 images. Images are provided in DICOM format and structured in the images directory, where a separate folder is created for each examination, containing four DICOM files corresponding to two standard projections for each breast. The file path is constructed as follows: images/examination ID/image ID.dicom.
The dataset includes three main tabular markup files. The first file, breast-level annotations, contains a row for each image and describes the breast-level assessment and basic image metadata. This annotation includes the study and series identifiers, left or right breast laterality, CC or MLO projection type, image height and width dimensions, BI RADS assessment at the breast level, breast tissue density category, and the official “train” or “test” split flag. The second file, finding annotations, contains a line-by-line annotation of lesions, with each line corresponding to a separate marked area of pathology in a specific image. For each such area, the image ID, study ID, series ID, laterality, projection, image dimensions, breast BI RADS, breast density, and split flag are specified, as well as the annotation parameters themselves, including the finding category, BI RADS assessment, and the coordinates of the bounding box (xmin, ymin, xmax, ymax). The third metadata file contains information from DICOM tags that may be useful for research, including the patient’s age and the equipment manufacturer and model. An important feature of the VinDr Mammo annotation is that bounding boxes are provided only for findings that require further investigation, i.e., those with BI-RADS scores 3, 4, or 5. Benign findings (BI RADS 2) are not annotated with boxes. Finding categories include mass, calcification, asymmetries, architectural distortion, and associated features such as suspicious lymph node, skin thickening, skin retraction, and nipple retraction. Thus, the dataset simultaneously supports breast-level CADx tasks via breast BI RADS and breast density and CAD tasks via coordinate annotation of clinically significant findings.
This study used a portion of the available dataset as source DICOM images for a full, reproducible comparison of the two preprocessing pipelines. A total of 1622 DICOM images were selected, and all STANDARD and PROPOSED comparison experiments were conducted strictly on the same image ID list to eliminate biases due to different subsamples. This collection was split into training and test sets at the image level, with 1293 images for training and 329 for testing. For the detection task, calcification was chosen as the target finding type, since calcifications are a clinically significant feature, often manifesting as small, low-contrast structures that are sensitive to incorrect contrast transformations and quantization. Rectangles from finding annotations were used to train the detector, where the finding category includes calcification and the finding assessment belongs to a class requiring further examination, corresponding to BI-RADS 3, 4, or 5. This choice allows focusing on clinically significant calcifications and aligns with the principle of dataset labeling, which states that obviously benign areas are not labeled.
As a result, our data configuration included source DICOM images from the image catalog, breast-level annotation tables for metadata control, split assignment, and contextual information on BI-RADS and density, as well as annotation tables for generating target detection rectangles. This combination ensures a reproducible problem statement and enables rigorous evaluation of the impact of DICOM preprocessing on calcification detection quality, without confounding effects from different annotations, formats, or image sets.
2.2. Formal Definition of the Detection Problem and Input Representation
In this study, mammography images in DICOM format and corresponding coordinate annotations of findings were used to formulate the problem of detecting clinically significant calcifications. Calcification-type areas, delineated by bounding rectangles, were considered target objects, as this type of finding is characterized by small size and low local contrast and, therefore, is most sensitive to brightness transformations and quantization errors. Let the original image be defined as a two-dimensional intensity matrix (1):
—image height and width, —pixel value at position , —image after modality (reduction to physically consistent values), —image after range conversion and tone mapping, —binary mask of the breast area, for breast pixels and for the background, —a set of pixel values within a mask.
1. BASIC PIPELINE (STANDARD). Figure 1 illustrates a structured diagram of the basic pipeline for converting mammographic DICOM data into a standardized 8-bit representation. The architecture reflects a consistent, reproducible processing pipeline, starting with reading the original pixel data and metadata and ending with the formation of a unified PNG image suitable for subsequent analytical tasks. The diagram demonstrates the key functional blocks of processing: modal-intensity transformation, visually oriented windowing, consideration of photometric interpretation, formation of a mask for the valid breast area, and subsequent normalization with quantization. Particular attention is paid to the correct processing of the Photometric Interpretation parameter (MONOCHROME1/MONOCHROME2), since matching the luminance polarity is a prerequisite for the comparability of images obtained from different sources. A separate stage is dedicated to excluding background and padding areas from the calculation of normalization statistics, thereby preventing distortion of the dynamic range and improving the accuracy of intensity scaling. The final 8-bit output is quantized into 256 discrete intensity levels, represented by integer values from 0 to 255.
Figure 1.
Flowchart of a standard pipeline for preprocessing mammographic DICOM images.
From a scientific perspective, this flowchart reflects a basic, reproducible preprocessing protocol that ensures: (1) image polarity matching, (2) elimination of background influence on normalization, and (3) conversion of different DICOM sources to a unified representation format. At the same time, the flowchart also demonstrates a key feature of the standard approach: reliance on visually oriented windowing and subsequent 8-bit quantization, which improves compatibility but can lead to dynamic range compression and partial loss of fine, low-contrast structures when compared to more informative high-bit preprocessing methods. Next, we will consider the main stages of this protocol sequentially, starting with the basic intensity conversion determined by DICOM parameters.
Step S1. Modality LUT/Rescale Transformation. If a linear transformation is specified in DICOM via the Rescale Slope and Rescale Intercept parameters, then (2) is performed for each pixel:
—Rescale Slope, —Rescale Intercept, —A pixel after modality transformation. If a Modality LUT is used, a table mapping (3) is applied:
Step S2. VOI LUT/Windowing for Presentation. To obtain values suitable for rendering, a windowing transformation (luminance window) is applied. In simple terms, this is a linear conversion to the [0, 1] range across the window boundaries (4):
—lower border of the window, —upper border of the window, .
Step S3. Photometric polarity correction. If the image is specified in inverted polarity, inversion is performed (5):
Else, .
Step S4. Global min–max normalization (6):
where is a small number to avoid division by zero.
Step S5. The normalized image is quantized to 256 discrete intensity levels, represented by integer values in the closed range [0, 255] (7):
—rounding to the nearest integer.
2. Proposed pixel-monotone pipeline. The goal of the proposed method is to increase the information content while using a 16-bit representation, without introducing locally dependent pseudo-textures, and ensure a strictly monotonic display of luminance. The pipeline input receives DICOM data and metadata (pixel matrix pixel_array, Photometric Interpretation, Modality LUT/Rescale parameters, and auxiliary DICOM fields) (Figure 2). In step 1, DICOM is loaded, and the original raw pixel_array is read; in step 2, a modal intensity transformation (via Modality LUT or RescaleSlope/Intercept) is performed, ensuring a transition to a physically/technically consistent representation of intensities. Next, in step 3, the photometric interpretation is verified: for MONOCHROME1 (step 4a), intensity inversion is applied to correct polarity, and for MONOCHROME2 (step 4b), the image is transferred without inversion. After polarity alignment, the key step is to generate a valid anatomical mask of the breast region (step 5), excluding background and padding from further calculations. In step 6, robust intensity statistics are calculated only within the valid anatomical region, reducing the influence of outliers and non-informative pixels on the transformation parameters. The central element of the scheme is step 7 (Proposed Core), which involves a monotonic, order-preserving intensity transformation. This approach is fundamentally important for scientific analysis, as it allows for changes in the contrast scale without disrupting the relative ranks of intensities, thereby maintaining the structural consistency of textural and local patterns. In step 8, clipping control and range stabilization are implemented to minimize losses at low and high brightness levels (reducing saturation/range clipping).
Figure 2.
Flowchart of the proposed pipeline for preprocessing mammographic DICOM images.
Unlike the standard 8-bit pipeline, step 9 generates the primary high-bit output (uint16), preserving extended tonal resolution and intended for subsequent analysis/ML. Then, step 10 constructs a derived 8-bit representation (u8 view) as a visualization-compatible version obtained from the high-bit result, and step 11 stores the output data along with the transformation parameters. Thus, the pipeline output includes three components: (1) the primary high-bit preprocessed image, (2) the derived 8-bit representation, (3) the transformation parameters/auxiliary metadata. From a scientific point of view, this architecture ensures reproducibility of transformations, control over the dynamic range, and greater suitability of the data for detection and quantitative analysis, since it separates the tasks of visualization and analytical processing without reducing the entire process to early 8-bit quantization. Next, we consider the sequence of stages of the proposed extended protocol, starting with basic modal correction that preserves the physical meaning of intensities.
Step P1. Correct modality (as in S1) (8):
This step is equivalent to the baseline in terms of meaning and maintains the physical consistency of the values.
Step P2. Polarity adjustment. To ensure that light structures correspond to higher values (a common convention for training), (9) is performed:
Equivalently, a transformation of the form can be used when working in a fixed range; the key requirement is unambiguity and reproducibility.
Step P3. Breast-aware mask. A binary mask B is formed, separating the mammary gland region from the background. The mask is constructed using threshold segmentation and morphological operations, and the largest connected component is then selected. All normalization statistics are then calculated only for pixels within the mask.
Step P4. Robust outlier restriction (Winsor normalization). The lower and upper robust thresholds are defined as quantiles of the distribution inside the mask (10):
—quantile level , —lower percentile (e.g., 0.5% or 1%), —the upper percentile (e.g., 99% or 99.5%). Winsor pruning is then performed (11):
The idea is that rare extreme values do not “compress” the dynamic range of the rest of the image.
Step P5. Normalization to the range [0, 1] using robust thresholds (12):
Step P6. Global monotone tone mapping. A function is introduced, which is determined solely by the value of the pixel and does not depend on the local window or neighboring image elements. It is also strictly monotone, i.e., for any two intensity values and , if , then the condition is satisfied, which guarantees the preservation of the rank order of intensities and the absence of brightness inversions as a result of the transformation. A power transformation (gamma) (13) is used as a simple and interpretable form.
—a parameter that controls the enhancement of dark/light areas; when , dark values are enhanced (important for low-contrast details) and when , dark values are suppressed. If a soft enhancement of the “tail” (very small values) is required, a monotonic mixture of two monotonic functions (14) is used:
—proportion of admixture, —logistic function (monotonic), —steepness, —transition point. Since the sum and composition of monotone functions remain monotone for non-negative weights, such a mapping preserves the order of intensities.
Step P7. Export to 16-bit for training (15):
An 8-bit version can be generated separately for viewing only (16):
Step P8. Monotonicity control (engineering validation). The absence of order inversions during transformation is checked. Practical criterion: for a set of pixel pairs , condition (17) is checked:
The number of violations must be zero (or strictly controlled), which guarantees the absence of “pseudo-texture” arising from locally dependent transformations.
The proposed pipeline offers several systemic advantages over typical 8-bit conversion and local contrast enhancement, making it better suited for reproducible AI analysis of mammography images in the present study setting. First, it ensures guaranteed pixel-by-pixel monotonicity, since brightness mapping depends solely on the value of an individual pixel and does not use local windows or neighboring regions. This preserves the relative order of intensities and eliminates the appearance of artificial local structures that can create training artifacts. Second, robust normalization within the breast region is applied using a mask and Winsor thresholds, which stabilizes the dynamic range relative to the background and rare outliers, ensuring a more stable distribution of input data and the correct extraction of low-contrast details. Third, information preservation is achieved by using a 16-bit representation, which reduces quantization losses, increases the effective data bit depth, and is especially important for small and low-contrast objects such as calcifications, promoting more stable training behavior under the evaluated augmentation protocol.
3. Results
A comprehensive experimental validation of the proposed pixel-monotonic preprocessing pipeline is presented, comparing it with a standard DICOM transformation scheme. The analysis is performed at three complementary levels: visual-structural comparison of image formation stages and final representations; quantitative structural-metric assessment without training using global and local (ROI) metrics of information content and consistency; and downstream validation through training calcification detectors under a fixed experimental protocol. This multi-level approach allows us to consistently demonstrate that the identified differences are due to controlled redistribution of the dynamic range and changes in signal information content, rather than artifacts of locally dependent transformations or instability of the training procedure. The study used a subset of 1622 DICOM images generated for a reproducible comparison of two preprocessing options. This subset was divided into 1293 images for training and 329 images for testing. All STANDARD and PROPOSED experiments were performed strictly on the same list of image_ids. In the current experimental protocol, a separate, independent validation set was not allocated. Optimization was configured using a predefined scheduler, and model behavior was monitored based on the training loss dynamics. This protocol feature is explicitly stated in the manuscript as a limitation that must be taken into account when interpreting the results.
3.1. Visual and Structural Comparison of STANDARD and PROPOSED Pipelines
A visual and structural comparison of the standard and proposed preprocessing methods allows us to assess the nature of dynamic-range redistribution and its impact on the representation of anatomically informative regions. The comparison is performed at successive stages of image formation and final representations, enabling us to identify differences in tissue contrast organization, the expression of low-contrast details, and the preservation of spatial geometry when transitioning from the standard scheme to a monotonically controlled transformation. Figure 3 presents the final visual result of the standard transformation of a mammogram from the DICOM format to an 8-bit image for typical analysis tasks and DL pipelines and illustrates the key intermediate stages in forming the final representation using the R-MLO projection as an example. The processing sequence begins with S0, the initial pixel_array, which contains raw numerical values without applying mapping rules and serves as the starting point for further transformations. Step S1 applies a Modality LUT or a linear rescale, which converts intensities to a consistent physical scale defined by the imaging parameters. Step S2 corresponds to a VOI LUT (windowing), which redistributes the dynamic range to the region of clinical interest in breast tissue imaging. Step S3 performs photometric polarity correction, ensuring a uniform luminance direction and preventing inversions of anatomical structures. Next, S4 generates a valid region mask that excludes background and padding, ensuring that statistical operations rely exclusively on the real image data. Step S5 applies global min-max normalization to the 0–1 range, which creates a uniform scale before quantization but can be sensitive to extreme values. Finally, S6 shows the final representation in uint8 PNG format, which ensures compatibility and compactness of storage by compressing the dynamic range to 256 levels, highlighting the fundamental trade-off of the standard approach between data unification and the possible loss of subtle low-contrast details.
Figure 3.
Stages of the STANDARD pipeline for converting DICOM images of mammography.
Figure 4 shows the proposed mammogram preprocessing pipeline for the R-MLO projection and demonstrates how a training-ready representation with controlled dynamic range expansion is generated from a source DICOM image while maintaining monotonic intensity ordering. The process begins with P0, the original pixel matrix read directly from the DICOM file. In step P1, pixel values are transformed to a consistent intensity scale using a modality lookup table (MLU) or linear scaling. In step P2, a region-of-interest LUT (VOI LUT) or windowing operation defines a baseline range of clinical interest, followed by photometric polarity correction in step P3 to ensure uniform intensity direction. Step P4 provides pre-rendered minimum and maximum values for the valid region for control purposes only and is not used for training. Step P5 generates a binary breast mask to exclude background and non-breast regions from statistical calculations. In step P6, Winsor stabilization is applied within the mask to reduce the influence of extreme intensity values. In step P7, a global monotonic tone-mapping step (gamma, tail, and stretch) enhances low-contrast structures while preserving intensity order. P8 verifies the absence of intensity inversions (inv = 0), confirming that monotonicity is preserved. Finally, P9 creates a 16-bit training representation with preserved information content.
Figure 4.
Stages of the proposed pipeline (PROPOSED) for generating the final presentation.
Figure 5 presents the final comparison of the output images obtained from the standard and proposed preprocessing of the same mammographic image in the R-MLO projection, along with a visualization of the spatial distribution of the differences between them. Figure 3 shows the STANDARD final (uint8), an 8-bit image generated by the standard method after windowing, polarity correction, global normalization, and quantization to 256 levels, in which the breast tissue is displayed over a limited brightness range, and fine gradations within the parenchyma are partially compressed. Figure 4 shows the PROPOSED final view (u8), a visual 8-bit preview of the result of the proposed method, obtained from a more informative 16-bit representation; in this case, increased distinguishability of low-contrast structures is achieved through a global, statistically stable, and monotonic transformation without locally dependent contrast rearrangements or distortion of the geometry of anatomical structures. Figure 5 displays the absolute difference map abs (PROPOSED − STANDARD), which allows for a quantitative interpretation of discrepancy zones: changes are virtually absent in a homogeneous background. They are concentrated primarily in the anatomically informative region, especially along areas with sharp brightness transitions and high structural complexity, where redistribution of the dynamic range and an increase in the effective bit depth most significantly affect the representation of low-contrast details. The nature of the differences confirms that the proposed approach is aimed at improving the information content within the useful region, without introducing locally dependent artifacts or altering the image background.
Figure 5.
Comparison of the final outputs of STANDARD and PROPOSED and a map of absolute differences.
3.2. Structural-Metric Validation and ROI Analysis Without Training
Structural verification of processed mammography images is performed using unsupervised analysis methods. This allows for quantitative confirmation of the transformations’ accuracy and assessment of their impact on the information content and intensity distribution. This is accomplished by pairwise comparison of the results of standard and proposed preprocessing on the same set of source DICOM images, with the assessment based on two complementary approaches. The first approach includes global metrics of consistency with the source DICOM and dynamic range utilization, which verify the preservation of overall structural information and the absence of undesirable degradation during intensity transformation. The second approach focuses on local analysis in clinically significant areas. It is performed on labeled ROIs of suspicious calcifications to assess how preprocessing affects the visibility of low-contrast details, specifically within the target object. Additionally, metric distributions across the entire image set and pairwise graphical comparisons are considered, allowing the identification of systematic biases between methods, the assessment of transformation stability, and the identification of trade-offs associated with changes in bit depth and storage parameters. This analysis scheme provides a transparent check that the differences between the methods are due to controlled redistribution of intensities and improvements in information content, rather than to random effects or locally dependent distortions of the image structure.
Table 1 summarizes the results of validating the structure of processed images using unsupervised analysis methods, where pairwise comparisons are performed on identical source DICOM images. The NMI vs. DICOM and Spearman’s rho metrics reflect the degree of preservation of information relationships and the rank consistency of intensities with the source DICOM representation. NMI evaluates the extent to which the processed image preserves statistically significant information relative to the reference image; therefore, an increase in the PROPOSED median indicates greater informational consistency between the transformation and the source data while preserving the overall structure. Spearman’s rho is used as an indicator of preservation of the monotonic order of intensities: approaching 1 indicates that the brightness mapping does not disrupt the ordering of values, that is, it does not introduce inversions that could change the meaning of light and dark levels within the tissue. The Clipping 0 + max metric characterizes the degree of pixel saturation at the extreme values of the range; lower clipping indicates a more effective use of the dynamic range without artificially “cutting off” information. Entropy (context) and Effective bits are indicators of the information content of the final representation: entropy reflects the diversity and richness of the luminance distribution, while the effective number of bits describes how many gradation levels are actually used after transformation. Increasing these values in PROPOSED is interpreted as an increase in useful bit depth and improved visibility of low-contrast details against the background of fabric without the need for location-dependent enhancement methods.
Table 1.
Summary of untrained validation metrics relative to baseline DICOM and in the clinically relevant calcification ROI (paired median).
The CNR metric in the ROI of suspicious calcifications evaluates the local discriminability of the target object relative to its surroundings within the marked region of interest; it was introduced to ensure that improvements in global information content do not come at the expense of contrast degradation, specifically within the target pathology zone. Finally, File size KB captures an engineering tradeoff: the transition to a more informative representation increases file size, which is important to consider during storage and training. The Delta median, 95% CI delta, Win-rate NEW, and p-value fields serve as a formalized assessment of the stability of the effect across the sample: the median difference indicates the magnitude of the shift, the confidence interval reflects the uncertainty of the estimate, the win-rate indicates the proportion of images where the new method is superior according to the given criterion, and the p-value confirms the statistical significance of the observed effect in the direction of the advantage of the new method. Table 2 details the structural changes in the brightness distribution and textural characteristics that account for the difference between the approaches, if we consider not the final values of each method separately, but rather the paired shift of PROPOSED relative to STANDARD in identical images.
Table 2.
Paired changes in additional global structural metrics (PROPOSED − STANDARD).
The eff_bits and entropy_u8 metrics confirm that in 8-bit previews (and in corresponding derived representations), the new method provides a richer use of luminance levels and increases the distribution’s information diversity, a direct indicator of improved “intensity resolution” after processing. The clip_low and clip_high metrics characterize clipping at the low and high ends of the range; a negative shift in clip_low indicates reduced saturation at zero, i.e., reduced shadow loss and a more accurate distribution of levels in weak signals, while a zero shift in clip_high indicates the absence of systematic degradation in the upper saturation region. The lap_var_u8 (Laplacian variance) and hf_std_u8 (high-frequency standard deviation) metrics reflect changes in the expression of fine structures and boundaries. An increase in these values indicates greater detail and local brightness variations, which are important for visualization and the detection of small objects. However, it also requires monitoring for artificial textures. Therefore, these metrics are considered alongside DICOM consistency metrics and monotonicity measures. The cnr_tail metric complements the analysis by showing changes in contrast in the distribution “tails,” areas where weak signals and rare structures may be lost during coarse scaling. Finally, mask_area_frac reflects changes in the mask fraction of the valid area and serves as an indicator of the stability of breast region segmentation and preprocessing; a small negative shift indicates a more stringent systematic exclusion of background/border zones, which may improve the robustness of normalization statistics. All metrics are provided with 95% confidence intervals and Wilcoxon signed-rank test p-values, confirming that the observed pairwise shifts are systematic across the sample and not due to individual images. A combined interpretation of Table 1 and Table 2 substantiates that the proposed processing does not simply alter visual contrast but structurally redistributes the dynamic range toward greater information content and detail while maintaining consistency with the original DICOM and controlled engineering trade-offs.
To quantitatively assess the differences between the standard and proposed preprocessing schemes, we analyzed the distributions of global metrics on a dataset of resized images. Figure 6 shows the distribution densities for the effective bit depth (eff_bits), 8-bit entropy (entropy_u8), the proportion of low and high clipping (clip_low, clip_high), the Laplacian variance (lap_var_u8), and the contrast-noise tail (cnr_tail). As shown in the eff_bits distribution, the standard processing is concentrated in the range of approximately 7–8 bits, corresponding to the near exhaustion of the 8-bit range, while the proposed method shows a shift toward approximately 14–16 bits. This indicates an increase in effective information content by 6–8 bits over standard quantization, corresponding to a dynamic resolution increase of approximately times. A similar trend is observed for entropy_u8: the median entropy increases from ~7.0–7.2 to 7.6–7.8 bits, indicating a more uniform utilization of luminance levels. The clip_low distribution shows that the standard scheme exhibits a more pronounced concentration of values in the zero-level region, with a tail extending to ~0.15–0.20, while the proposed method virtually eliminates excessive low-end clipping, stabilizing the dynamic range. For clip_high, the differences are minimal, confirming the absence of aggressive high-end saturation in both approaches. The lap_var_u8 metric demonstrates a significant rightward shift of the distribution for the proposed method: The Laplacian variance increases by approximately 2–3 times at the median, indicating the preservation and enhancement of fine-grained details without locality-dependent artifacts. The cnr_tail metric also shows a shift toward higher values (on the order of 10–20 units in the distribution mode), reflecting increased visibility of low-contrast structures. Taken together, they obtained distributions confirming that the proposed pipeline redistributes the dynamic range predominantly within the anatomically informative region, thereby increasing the effective bit depth, entropy, and structural variability without increasing clipping or introducing locally dependent distortions. This is consistent with the hypothesis that global monotonic control of intensities provides a more informative and robust data representation for subsequent training of detection models.
Figure 6.
Normalized error matrix of the baseline Random Forest model for the full agro-seasonal sample.
To assess the structural consistency between the results of the standard and proposed preprocessing, paired similarity metrics were calculated on the same set of images. Figure 7 shows the distributions of the Spearman rank correlation coefficient (spearman_rho), Pearson linear correlation coefficient (pearson_r), normalized mutual information (NMI), peak signal-to-noise ratio (PSNR), and structural similarity index (SSIM) between the STANDARD and PROPOSED representations. The spearman_rho and pearson_r distributions are almost entirely concentrated around 1.0, indicating a nearly perfect rank and linear relationship between the images. This quantitatively confirms the preservation of the global intensity order and the absence of brightness inversions, consistent with the formally specified monotonicity constraint of the transformation. Similarly, the NMI distribution shows a concentration of values in the range of 0.98–1.00, indicating a high degree of mutual information between the images and no structural information loss. The PSNR metric shows values predominantly in the 30–45 dB range, indicating moderate amplitude differences while preserving the overall image structure. It is important to note that these differences are systemic and reflect the redistribution of the dynamic range, rather than locally dependent distortions. The SSIM distribution is concentrated in the 0.93–0.99 range with a median of approximately 0.97–0.98, confirming the high structural consistency between the standard and proposed results. Taken together, these metrics demonstrate that the proposed method significantly redistributes intensities within the informative domain, increasing the effective bit depth and contrast distinguishability (see Figure 6), while almost completely preserving the structural geometry and global order of luminance levels. Thus, a key balance is achieved between informative expansion of the dynamic range and strict structural reproducibility of the transformation, which is critical for the stable training of detection models.
Figure 7.
Distributions of pairwise similarity metrics (STANDARD vs. PROPOSED on identical images).
To further assess the systematic nature of the differences between the STANDARD and PROPOSED processing, paired scatterplots with an identity line were constructed to reflect the relationship between the values of global metrics within the same images. Figure 8 shows a comparison of the effective bit depth (eff_bits), 8-bit representation entropy (entropy_u8), and contrast-noise tail (cnr_tail). For the eff_bits metric, a clear shift of points above the identity line is observed across the entire image set: PROPOSED values systematically exceed STANDARD by approximately 6–8 bits, quantitatively confirming an increase in effective dynamic information content. The absence of scatter around the line with a slope of 1 indicates a stable, rather than random, increase. A similar pattern is observed for entropy_u8: the dots are predominantly above the diagonal, indicating an average increase of ~0.4–0.6 bits in entropy, reflecting a more uniform use of brightness levels. For cnr_tail, the dot distribution shows a positive systematic shift relative to the identity line, especially in the mid- and high-value ranges, indicating greater distinguishability of low-contrast structures. At the same time, the linear relationship between STANDARD and PROPOSED is preserved, indicating a consistent redistribution of the dynamic range without disrupting the relative structure of the images. Taken together, the scatterplots confirm that the improvement in information characteristics is deterministic and global: the proposed method consistently increases effective bit depth, entropy, and contrast sensitivity without compromising inter-image consistency. This is consistent with the previously demonstrated high correlation and structural similarity (see Figure 7) and confirms that the increase in information content is achieved through a controlled monotonic redistribution of intensities, rather than local nonlinear distortions.
Figure 8.
Paired scatterplots (line of identity) for comparison of STANDARD and PROPOSED.
To assess the impact of preprocessing on locally informative regions, metrics within the ROIs of suspicious calcifications were calculated. Figure 9 shows the distributions of two metrics: the difference in median intensities between the ROI and the surrounding ring (median(ROI) − median(ring)) and the robust contrast-to-noise ratio (robust CNR). For the Δintensity metric (median(ROI) − median(ring)), the distribution shows a systematic rightward shift when using the proposed method. The median value increases from approximately 0.07–0.08 (STANDARD) to 0.10–0.12 (PROPOSED), corresponding to a relative increase of approximately 30–50%. The upper quartile also shifts upward, reaching values of ~0.16–0.18, compared with ~0.12–0.13 in the standard scheme. This indicates a more pronounced separation of calcifications from the surrounding tissue while maintaining a normalized intensity scale. A similar trend is observed for robust CNR: the median increases from approximately 0.5–0.6 to 0.6–0.7, and the upper range reaches approximately 2.0. However, the lower quartiles do not show degradation, indicating that weak cases are not deteriorating. The widening of the interquartile range reflects increased sensitivity to local intensity variations within an anatomically significant region. It is important to emphasize that the increase in ROI metrics is achieved without aggressive local contrast enhancement or breaking global monotonicity, as confirmed by high correlation and structural metrics. Thus, Figure 9 quantitatively demonstrates that the proposed method not only increases global information content (see Figure 4) but also directly enhances the local distinguishability of calcifications, which is critical for detecting small, low-contrast objects.
Figure 9.
ROI metrics for suspicious calcifications: local contrast and robust CNR (STANDARD vs. PROPOSED).
Figure 10 presents the distributions of local ROI metric increments between the proposed and standard processing schemes, calculated as NEW − STANDARD for median ROI contrast and robust CNR. This analysis allows a direct assessment of the direction and magnitude of changes at the level of suspicious calcifications, independent of global scaling differences. A pronounced positive asymmetry is observed in the distribution of the median ROI contrast increment. The majority of values are concentrated in the range from approximately 0.02 to 0.10, with a median of approximately ~0.04–0.06, indicating a systematic increase in the local contrast of calcifications relative to the surrounding tissue. Negative values are rare and have small amplitude, indicating the absence of degradation in most cases. The presence of rare positive outliers up to ~0.4–0.6 reflects cases with a particularly pronounced increase in distinguishability. A similar pattern is observed for the robust CNR increment, with the distribution showing a positive shift, a median of approximately 0.05–0.10, and a narrow concentration of values near zero, predominantly in the positive region. Negative deviations are few in number and small in amplitude, while positive outliers reach values of approximately 1–2, indicating a significant improvement in discriminability in some challenging cases. Taken together, the results demonstrate that the increase in local contrast and CNR is systematic and not due to random fluctuations. The proposed method consistently increases the information content of ROIs of suspicious calcifications without causing widespread degradation, confirming its effectiveness as a globally consistent and monotonic mechanism for dynamic range redistribution.
Figure 10.
Distributions of deltas of local ROI metrics for calcifications (NEW-STANDARD).
Figure 11 demonstrates a qualitative comparison of the standard and proposed preprocessing approaches using a specific R-MLO image with a marked region of interest (ROI) containing a suspicious calcification. The top row shows the full image with a superimposed bounding box, while the bottom row presents a zoomed-in ROI fragment for detailed analysis of texture and contrast. The STANDARD (uint8) approach exhibits dynamic range compression typical of 8-bit conversion: gradations within the parenchyma are partially smoothed, and low-contrast microstructures within the ROI are less clearly separated from the surrounding tissue. The zoomed-in fragment exhibits moderate intensity homogeneity, making it difficult to visually distinguish fine brightness variations. The PROPOSED (uint16 → u8 view) approach visually demonstrates more pronounced separation of low-contrast structures while maintaining natural geometry and eliminating locally dependent “contrast spots.” Within the ROI, microtextural detail is enhanced, calcification boundaries are more distinguishable against the background, and the brightness distribution within the anatomical region appears more graded. At the same time, the background and tissue geometry remain consistent with the standard version, confirming the absence of artificial structural distortions. Thus, Figure 9 qualitatively confirms the quantitative results of previous metrics: the proposed method increases local discernibility of calcifications by redistributing the dynamic range globally in a monotonic manner, maintaining image structural consistency and avoiding the artifacts typical of locally adaptive contrast enhancement methods.
Figure 11.
ROI visualization of suspicious calcifications: comparison of STANDARD and PROPOSED in full field and a magnified fragment.
The resulting global and local metrics demonstrate that the proposed transformation preserves the structural consistency of images while simultaneously increasing information content within the anatomically significant region. High values of correlation and structural indicators confirm the absence of inversions and geometric distortions. At the same time, the increase in effective bit depth, entropy, and ROI contrast reflects a controlled redistribution of the dynamic range. Thus, quantitative verification without training confirms the correctness and reproducibility of the proposed pipeline and provides a basis for further evaluation of its practical effectiveness in the detection task.
3.3. Downstream Validation via Training of a Calcification Detector
The practical effectiveness of the standard and proposed preprocessing methods is assessed by training a machine learning model on the mammography image datasets processed by each approach, with the data split into training and test sets. The goal of this experiment is not to select the optimal architecture but to confirm that differences in preprocessing lead to measurable changes in the model’s ability to detect stable patterns associated with target features under identical training conditions. Model training allows for a transition from purely structural and statistical image validation to functional evaluation: if preprocessing truly improves the information content of the representation and enhances the visibility of low-contrast details, the model should more effectively extract discriminative features, demonstrate more stable convergence, and better transfer knowledge to test data. To eliminate the influence of extraneous factors, training is performed with the same configuration for both data sets, including the same splitting strategy, input size preprocessing, optimization mode, and evaluation criteria, so that the only source of differences in the final model performance is the input image generation method. This approach provides practical confirmation that the proposed method not only preserves the structure of images in a metric sense but also provides a more suitable representation for algorithmic analysis, thereby increasing the extractability of features and the quality of target pattern detection in mammograms.
In this subsection, we describe an applied test of the impact of preprocessing on the quality of subsequent machine analysis. For two sets of images (STANDARD and NEW, generated using different methods), we train pathological-region detectors using bounding-box labels from finding_annotations.csv. To eliminate the influence of extraneous factors, the same training/evaluation protocol is used for both data sets, including a fixed train/test split, identical optimization hyperparameters, and uniform rules for calculating test metrics. To improve inference reliability, two architectures of different strengths are used: a lightweight detector (a fast model for testing preprocessing sensitivity with limited computation) and a boosted detector (a stronger model to confirm that the effect is preserved with increased representativeness). Importantly, augmentations are applied only to the training set and are geometrically soft and bbox-consistent (without texture/contrast changes) to avoid distorting diagnostically significant structures and simultaneously increase the robustness of the training. Table 3 presents a unified, controlled experimental protocol that makes the comparison between STANDARD and NEW valid: only the image preprocessing changes, while the partitioning, labeling, augmentation rules, optimization, and evaluation criteria remain the same.
Table 3.
General protocol for training and evaluation of the detector (single for STANDARD and NEW).
It is emphasized that augmentations do not alter photometry or texture and are applied only to the TRAIN, while bounding rectangles are transformed strictly in accordance with the image, eliminating markup drift. Table 4 lists the two detector complexity levels used to test the preprocessing method.
Table 4.
Detector architectures used and their role in the preprocessing method validation.
Using the lightweight and boosted architectures in parallel increases the evidence: if improvements/differences are consistent across different model sizes, this indicates a robust contribution from preprocessing, rather than random network-specific features. Based on training results on two preprocessed image sets (STANDARD and NEW), both detector architectures demonstrated robust convergence: loss function values decreased across epochs without any signs of divergence, confirming the correctness of the labeling and the stability of the chosen hyperparameters. The lightweight Faster R-CNN MobileNetV3-FPN model reached a faster plateau. At the same time, the boosted Faster R-CNN ResNet50-FPN v2 model showed a more pronounced and uniform loss reduction toward the final epochs, consistent with its greater representativeness. Importantly, training and evaluation were performed using the same protocol (single scheduler, SGD, 12 epochs, score threshold of 0.20, and IoU criterion of 0.50), so the comparison between STANDARD and NEW is interpreted as the effect of differences in preprocessing. On the test set, detection quality was assessed using Precision@IoU0.5, Recall@IoU0.5, and MeanIoU_matched, allowing comparison of localization accuracy and detection recall. The obtained results are further used to justify how the chosen preprocessing affects the suitability of data for training detection models and the final reproducibility of quality in an independent test.
Figure 12 shows a bar chart of the final detector metrics on TEST with the same model architecture and training/evaluation protocol; the differences between experiments are due only to the image preprocessing method. Quality is assessed using Precision@IoU0.5, Recall@IoU0.5, and MeanIoU_matched (the average IoU across matched predictions), enabling simultaneous analysis of detection accuracy, recall, and localization precision.
Figure 12.
Comparison of detection quality on the test set for the lightweight Faster R-CNN MobileNetV3-FPN model with two image preprocessing options (STANDARD vs. NEW).
For the STANDARD set, Precision@IoU0.5 = 0.465 was obtained, while for NEW, it was 0.442, indicating a slight increase in the proportion of false positives for NEW at a fixed threshold of IoU = 0.5. At the same time, the detection recall remains the same: Recall@IoU0.5 = 0.513 for both variants, indicating that the ability to find target regions does not deteriorate on average across preprocessing methods. Finally, MeanIoU_matched for NEW (0.735) is almost the same and even minimally higher than for STANDARD (0.733), indicating comparable (and potentially slightly more accurate) localization of frames for correctly detected objects. Taken together, the results show that preprocessing with NEW preserves recall and localization quality but requires additional threshold/filtering adjustments to compensate for the decrease in accuracy. Figure 13 shows the final detector metrics on TEST with a fixed complex model architecture and the same training/evaluation protocol; the difference between the experiments is due only to the image preprocessing method (STANDARD and NEW). Quality is assessed using Precision@IoU0.5, Recall@IoU0.5, and MeanIoU_matched, which allows for separate analysis of detection classification accuracy, detection recall, and frame localization accuracy.
Figure 13.
Comparison of detection quality on a test set for the complex Faster R-CNN ResNet50-FPN v2 model with two image preprocessing options (STANDARD vs. NEW).
According to the Precision@IoU0.5 metric, the STANDARD method achieves 0.277, while NEW achieves 0.251, indicating a higher proportion of false positives for NEW at the IoU = 0.5 threshold. At the same time, Recall@IoU0.5 is almost identical (0.698 for STANDARD and 0.696 for NEW), indicating that the model’s sensitivity to target objects is maintained across preprocessing methods. An important result is the increase in MeanIoU_matched for NEW (0.741 versus 0.728 for STANDARD), indicating more accurate localization of object boundaries when the detection is considered correct. Thus, NEW preprocessing for a complex model provides comparable recall and improves bounding-box geometric accuracy but is accompanied by a decrease in overall accuracy, which justifies optimizing confidence/postprocessing thresholds to reduce FP.
For the strong model, the proposed preprocessing method demonstrated increased detection sensitivity compared to the standard scheme. Specifically, for the STRONG + NEW configuration, the Recall@0.5 value increased from 0.254157 to 0.294537, the number of true positives increased from 107 to 124, and the number of missed hits decreased from 314 to 297. At the same time, the number of false positives increased from 242 to 255, accompanied by a change in the balance between precision and recall (Table 5). This result profile is interpreted as an expected compromise: the new pipeline improves the distinguishability of weak and low-contrast features, resulting in the model detecting more candidates, including both true hits and some background structures. In practical applications, this effect can be further adjusted by selecting the working confidence threshold and subsequent postprocessing of the predictions. From a clinical perspective, the acceptability of this trade-off depends on the application scenario: in screening applications, a higher recall may be preferable, whereas in diagnostic verification scenarios, a more stringent operating point may be used to reduce the number of false positives.
Table 5.
Detector testing results: detection metrics (IoU = 0.5) for different models and preprocessing.
It should be noted that for some metrics, including AP@0.5, the confidence intervals for the compared configurations partially overlap. This means that the differences between the methods should not be interpreted as an absolute statistical superiority for a single metric without additional caveats. In particular, for the strong model, the AP@0.5 intervals are [0.105, 0.155] for STRONG + NEW and [0.095, 0.143] for STRONG + STANDARD, which indicates the need for cautious interpretation. In this regard, the conclusions in this study are made not for a single metric but for a set of indicators, including Recall@0.5, F1@0.5, TP, and FN, as well as the results of structural-metric validation and ROI analysis. Thus, the overlap of confidence intervals is considered as a factor of statistical uncertainty requiring a comprehensive assessment of all the results obtained, and not as a denial of the observed trend.
Table 6 reflects the quality of geometric localization and computational costs. In terms of average IoU on matched objects, STRONG + STANDARD demonstrates the best value (MeanIoU = 0.8374). At the same time, the difference with STRONG + NEW (0.8371) is minimal, indicating that the new preprocessing does not degrade bounding box accuracy for detected objects. STRONG + STANDARD also demonstrates the smallest median box center error (10.37 px). In comparison, STRONG + NEW has a slightly larger error (12.62 px), suggesting a slight shift in centers while maintaining a comparable IoU. In terms of processing speed, the lightweight model, as expected, leads: the shortest time per image is for LIGHT + STANDARD (22.19 ms/img), practically on par with LIGHT + NEW. The strong model is significantly heavier (≈102–103 ms/img), so the choice of configuration should take into account the speed requirement: if the priority is sensitivity, STRONG + NEW is optimal; if the priority is speed, LIGHT + STANDARD/NEW is more rational, while NEW in the light model has a greater impact on precision than on recall.
Table 6.
Detector testing results: localization metrics and computational efficiency (frame quality and speed assessment).
The standard processing method demonstrated stable, predictable behavior across structural and textural characteristics and in the downstream detection task. In terms of global metrics, it produces a more familiar image profile: the entropy and effective bit-depth distributions are shifted toward lower values compared to the new method, corresponding to a more limited information range and potentially weaker expression of fine details. In paired similarity metrics with reference data (high Spearman/NMI), the standard approach provides high consistency. At the detector training level, it demonstrates competitive balance in the lightweight model. In terms of AP@0.5 and F1@0.5, LIGHT + STANDARD performed slightly better and yielded slightly more accurate center localization (lower MedianCenterErr) and minimal inference time. The new processing method proved more informative in terms of data structure: context entropy and effective bits increased, clipping was reduced (especially at the lower boundary), and distributions of texture metrics (Laplacian variance, high-frequency components) indicated increased microstructure discernibility. This is consistent with the ROI analysis for suspicious calcifications: ROI contrast and robust CNR statistics demonstrate a shift toward improved ROI discernibility, and visualization examples show more pronounced details in the bbox zone. In the downstream evaluation, it was the new preprocessing that provided an advantage for the complex model: STRONG + NEW provided better AP@0.5 and higher Recall@0.5 (and, accordingly, lower FN), that is, it increased detection sensitivity while maintaining comparable localization quality (MeanIoU_matched remained virtually unchanged relative to STRONG + STANDARD).
Figure 14 shows the curves of the average loss function change over epochs for two detector architectures of different complexity, LIGHT and STRONG, using two image preprocessing options: STANDARD and NEW. All models were trained using the same experimental protocol with fixed hyperparameters, the same number of epochs, and the use of pre-trained weights. Therefore, the differences between the curves can be interpreted as the effect of differences in the input data preprocessing. For the light model, the training loss values were in the range of approximately 0.22–0.20 and demonstrated stable behavior without signs of divergence. For the LIGHT + STANDARD configuration, the loss changed from 0.2227 in the first epoch to 0.2046 in the twelfth, while for LIGHT + NEW, it changed from 0.2259 to 0.1989. Small fluctuations between individual epochs are expected for stochastic detector training and do not indicate process instability. For the more complex model, the decrease in the loss function is noticeably more pronounced. In the STRONG + STANDARD configuration, the training loss decreased from 0.2357 to 0.1446, while in the STRONG + NEW configuration, it decreased from 0.2314 to 0.1356. This indicates stable convergence for both strong models and simultaneously shows that the proposed preprocessing resulted in a slightly lower final loss than the standard scheme. Taken together, the figure confirms that the chosen 12-epoch training regime was sufficient to achieve stable convergence for both the lightweight and more powerful architectures, while the proposed preprocessing option did not degrade the optimization process and, in both models, resulted in a slightly lower final training loss compared to the standard preprocessing.
Figure 14.
Training curves (training loss) for LIGHT and STRONG models with STANDARD and NEW preprocessing.
The new image processing method is competitive and virtually equivalent to the standard method in terms of robustness and geometric accuracy, while providing a systematic gain in the informativeness of structural and textural features and increasing detection sensitivity in a more powerful model. Consequently, the new pipeline is preferable for tasks where identifying low-contrast and small features (e.g., calcifications) and minimizing missing objects are critical. At the same time, the standard method remains a strong baseline alternative for scenarios where speed and a slightly more even balance of metrics in a lightweight model are a priority.
The obtained training results demonstrate that the proposed preprocessing scheme provides a stable increase in detection metrics compared to the standard version with identical data partitioning and unchanged model hyperparameters. Improved precision and recall are accompanied by reduced variability between runs, indicating a more stable input data distribution and improved distinguishability of low-contrast objects. Thus, downstream validation confirms that the increase in information content identified at the levels of structural and ROI metrics translates into a practical increase in the detector’s efficiency, and the observed improvements are due to a systematic, monotonically controlled redistribution of the dynamic range, rather than random learning effects.
4. Discussion
The study aimed to test how replacing standard mammography image preprocessing with a new approach simultaneously impacts (i) the preservation of the original signal structure relative to DICOM, (ii) texture-frequency characteristics and image information content, (iii) local ROI metrics in areas of suspicious calcifications, and (iv) the performance of the downstream detection task (bounding-box) when training models of varying complexity. Crucially, the comparison was performed under controlled conditions: only the preprocessing was varied, while the detector architectures, train/test partitioning protocol, augmentation set (geometric and bbox-consistent only), and evaluation criteria were fixed. At the global metric level, the new method demonstrated consistent improvement in consistency with the original data and an expanded information range. Thus, the NMI relative to DICOM increased from 0.8778 to 0.8921 (Δ ≈ +0.0143) with an extremely high win-rate (0.983) and a statistically significant difference (p-value of the order of 10−261), indicating a systematic nature of the effect rather than random fluctuations. The almost perfect rank agreement (Spearman ρ ≈ 1.0, also statistically significant) means that the new pipeline preserves the relative intensity ratios and does not distort the overall structure of the brightness distribution. At the same time, a decrease in clipping and a pronounced increase in entropy and effective bits were observed (e.g., context entropy: 7.03 → 8.46; effective bits: 7.88 → 10.11), which is interpreted as an increase in the dynamic range and “visible” information content of the signal, potentially critical for low-contrast microstructures.
In terms of texture-frequency properties, the new method also appears more “detailed.” The shift in the Laplacian variance and high-frequency component (hf_std) distributions toward higher values is consistent with the fact that preprocessing emphasizes fine boundaries and localized intensity differences. This is particularly important for mammography, where diagnostically significant features (microcalcifications, fine spicules, faint consolidations) often appear as localized high-frequency structures against a background of heterogeneous tissue. It is important to understand the duality of this effect: increasing high-frequency energy can improve the distinguishability of findings, but it also increases the risk of perceiving noise and normal textures as “pathology-like,” which is reflected in the detector’s FP/Precision balance. The ROI analysis results within the bboxes of suspicious calcifications support the hypothesis of increased local discriminability. A comparison of the ROI contrast distributions (the difference between the ROI and annular medians) and the robust CNR shows a shift in median values toward improvement for the new approach (based on visual distributions and deltas); that is, for a significant proportion of images, calcifications become more contrasting relative to the local background. Illustrative ROI examples (overall view and zoomed-in fragment) qualitatively confirm this effect. In the bbox window, the structure and brightness differences appear more pronounced, which is important for subsequent detector training and visual interpretation.
Downstream evaluation through detector training shows that the effect of preprocessing depends on the model’s capacity and the features it can extract. For the lightweight detector, the differences between the methods are small and involve trade-offs: in Figure 10, Precision@IoU0.5 is slightly higher for STANDARD (0.465 vs. 0.442), Recall is almost identical (0.513 vs. 0.513), and MeanIoU_matched is slightly higher for NEW (0.735 vs. 0.733). The tabular evaluation of several metrics (Table 5 and Table 6) also indicates the closeness of the results: LIGHT + STANDARD has slightly higher AP@0.5 and F1@0.5, while LIGHT + NEW offers comparable Precision and inference speed. This is consistent with the interpretation: the lightweight model may be more sensitive to the growth of the “textural complexity” of the image (some additional structures are interpreted as candidates, increasing FP). At the same time, the geometric consistency of the predictions is preserved. For a more powerful detector, the new method appears preferable based on the integrated quality metrics. In Figure 11, MeanIoU_matched is significantly higher for NEW (0.741 vs. 0.728), with similar Recall@IoU0.5 values (0.696–0.698) and a decrease in Precision for NEW (0.251 vs. 0.277). However, the overall tabular evaluation shows that STRONG + NEW achieves the highest AP@0.5 (0.1288) among all pipeline methods, outperforms STRONG + STANDARD (0.1185), and increases recall (Recall@0.5: 0.2945 vs. 0.2542) at the expense of higher FP. This profile is typical when preprocessing enhances potentially useful weak features: the powerful model begins to find more true objects (TP increases, FN decreases) but simultaneously expands the set of candidates. For medical screening tasks, this may be an acceptable and even desirable mode, since missing suspicious findings is usually more critical than the additional burden of subsequent filtering/verification (e.g., by a second cascade, classifier, or expert assessment).
The main contribution of this work should be considered at the system level. Individual components, such as LUT, masking, robust normalization, or monotone tone mapping, are not entirely new. However, the proposed framework integrates these components into a single pixel-monotonic architecture governed by explicit engineering constraints: preserving intensity rank order, avoiding locality-dependent pseudotextures, separating the training representation from the display representation, and quantitatively verifying these properties. It is this architectural integration that provides the observed improvements in information preservation and detector stability in subsequent stages, thereby distinguishing the proposed method from traditional preprocessing pipelines that rely on visually convenient but analytically unconstrained transforms. Practical tradeoffs should be discussed separately. The proposed method results in a significant increase in file size (on average, from approximately 1059 KB to 3182 KB), which is most likely due to maintaining the higher dynamic range/bit depth and the characteristics of PNG encoding. This increases storage and bandwidth requirements, although it does not necessarily impair computational feasibility when performing offline preprocessing and training or inference on the prepared data, as the observed ms/img values remain within comparable ranges across different model classes. From a reproducibility perspective, an important advantage of the study design is the use of the same augmentation protocol without strong photometric transformations, which reduces the risk that preprocessing effects will be masked by artificial changes in brightness or contrast. From a clinical perspective, the increase in false positive results should be interpreted in relation to the intended application. In screening settings, where reducing the number of missed suspicious results is often more important than minimizing additional recalls, a moderate increase in the false-positive rate may be acceptable if followed by expert review. However, in more stringent diagnostic scenarios, a more conservative operating point may be preferable to limit the burden associated with excessive false-positive results. Overall, the practical utility of the proposed preprocessing method depends on the balance between improved sensitivity to weak and low-contrast features, the additional number of candidates requiring analysis, and the requirements of a specific clinical workflow.
This study has several limitations. First, the evaluation was conducted on a single dataset and under fixed experimental conditions, including bbox detection with predefined score and IoU thresholds. Therefore, the presented results should be interpreted within the framework of this controlled comparison. Second, the AP@0.5 estimates are approximate and provided with confidence intervals; the partial overlap of these intervals suggests that some of the observed differences are moderate and should be further validated with external data. Third, the current analysis was limited to a fixed object detection protocol and therefore included only directly comparable detection metrics, namely, precision, recall, F1, AP@0.5, and MeanIoU_matched. Although these metrics are suitable for methodological comparison, clinically relevant metrics such as FROC, AUC, and sensitivity at a fixed false-positive rate would provide additional insight into the practical diagnostic value of the approach and should be included in future clinical validation. At the same time, within the limitations of this study, the proposed preprocessing method can be considered competitive. It systematically improves image information content and better maintains consistency with the original data representation. In the detection task, its effect is particularly noticeable for higher-throughput models, where it improves both the integrated detection quality (AP) and sensitivity. This finding has practical implications for AI-assisted mammography analysis, where reducing missed suspicious findings may be important depending on the clinical workflow. A promising direction for further research is to optimize the evaluation threshold and postprocessing strategy to reduce the number of false positives for NEW without sacrificing true positives or recall, as well as to evaluate the impact of the proposed preprocessing pipeline on downstream tasks such as classification, segmentation, and multimodal analysis.
5. Conclusions
This paper presents a comparative study of standard and proposed methods for preprocessing mammography DICOM images to produce a representation more suitable for quantitative analysis and machine learning tasks while preserving the structural correctness of the original signal. Verification was conducted in three complementary areas: (i) global structural information verification (consistency with the original DICOM, clipping, and entropy-bit-depth metrics), (ii) local assessment of suspicious calcifications in clinically significant ROIs, and (iii) applied downstream assessment through training bounding box detectors on fixed train/test sets.
The obtained results confirm that the proposed method provides controlled redistribution of the dynamic range without destroying the intensity structure: near-perfect rank consistency is maintained, clipping is reduced, and the information richness of the representation increases, manifested in an increase in entropy and bit-depth characteristics and in the enhancement of texture indicators of fine details. ROI analysis and visual examples demonstrate that the changes are concentrated in anatomically informative areas and enhance discrimination of low-contrast structures relevant to calcifications. Downstream experiments with two detectors of varying complexity demonstrated that the new method does not degrade geometric localization accuracy and achieves the greatest practical effectiveness with a more powerful model, thereby increasing integral quality indicators and detection sensitivity. However, the expected engineering tradeoff of increased file size while maintaining a more informative representation was identified.
Overall, within the present mammography dataset and evaluation protocol, the proposed preprocessing pipeline is a competitive alternative to the standard approach and may be preferred when the detection of weak, low-contrast mammographic features is prioritized. Future work could focus on optimizing confidence thresholds and post-processing to reduce false positives, as well as on testing the transferability of the effect on independent external mammography datasets and datasets acquired with other medical imaging modalities.
6. Patents
A patent related to the methodology presented in this work was granted: Tusupov, D.A.; Abdikerimova, G.B.; Ismailova, A.A.; Aitimov, M.Z.; Yessenova, M.B., Method for Diagnosing Breast Cancer. Utility Model Patent No. 11385, Republic of Kazakhstan, issued by the National Institute of Intellectual Property, 14 November 2025.
Author Contributions
Conceptualization, M.Y. and G.A.; methodology, M.Y.; software, K.K.; validation, M.Y., K.K. and A.I.; formal analysis, A.S.; investigation, A.O. and B.Z.; resources, G.R.; data curation, A.I.; writing—original draft preparation, M.Y.; writing—review and editing, G.A. and A.S.; visualization, K.K.; supervision, Z.M.; project administration, M.Y.; funding acquisition, M.Y. All authors have read and agreed to the published version of the manuscript.
Funding
This research received no external funding and was conducted without financial support from any funding agency.
Data Availability Statement
The dataset used in this study is publicly available on Zenodo: TimeSen2Crop, https://zenodo.org/records/4715631, accessed on 2 February 2026.
Conflicts of Interest
The authors declare no conflicts of interest.
Abbreviations
The following abbreviations are used in this manuscript:
| AI | Artificial Intelligence |
| CAD | Computer-Aided Detection |
| CADx | Computer-Aided Diagnosis |
| CNN | Convolutional Neural Network |
| DL | Deep Learning |
| DICOM | Digital Imaging and Communications in Medicine |
| LUT | Look-Up Table |
| VOI LUT | Value of Interest Look-Up Table |
| ROI | Region of Interest |
| NMI | Normalized Mutual Information |
| IoU | Intersection over Union |
| AP | Average Precision |
| FP | False Positive |
| TP | True Positive |
| BI-RADS | Breast Imaging Reporting and Data System |
| CLAHE | Contrast-Limited Adaptive Histogram Equalization |
| PNG | Portable Network Graphics |
| MLO | Mediolateral Oblique |
| CC | Craniocaudal |
References
- Bahl, M.; Chang, J.M.; Mullen, L.A.; Berg, W.A. Artificial intelligence for breast ultrasound: AJR expert panel narrative review. Am. J. Roentgenol. 2024, 223, e2330645. [Google Scholar] [CrossRef] [Scilit]
- Hoh, Y.K. Applications of Artificial Intelligence in Life Sciences. Am. Biol. Teach. 2025, 87, 165–172. [Google Scholar] [CrossRef] [Scilit]
- Chang, Y.W.; Ryu, J.K.; An, J.K.; Choi, N.; Park, Y.M.; Ko, K.H.; Han, K. Artificial intelligence for breast cancer screening in mammography (AI-STREAM): Preliminary analysis of a prospective multicenter cohort study. Nat. Commun. 2025, 16, 2248. [Google Scholar] [CrossRef] [Scilit]
- Ahmed, S.; Elazab, N.; El-Gayar, M.M.; Elmogy, M.; Fouda, Y.M. Multi-Scale Vision Transformer with Optimized Feature Fusion for Mammographic Breast Cancer Classification. Diagnostics 2025, 15, 1361. [Google Scholar] [CrossRef] [Scilit]
- Peter, O.O.E.; Emakporuena, D.; Tunde, B.D.; Abdulkarim, M.; Umar, A.B. Transformer-based explainable deep learning for breast cancer detection in mammography: The mammoformer framework. arXiv 2025, arXiv:2508.06137. [Google Scholar] [CrossRef] [Scilit]
- Tian, Y.; Xu, Z.; Ma, Y.; Ding, W.; Wang, R.; Gao, Z.; Cheng, G.; He, L.; Zhao, X. Survey on deep learning in multimodal medical imaging for cancer detection. Neural Comput. Appl. 2025, 37, 22239–22254. [Google Scholar] [CrossRef] [Scilit]
- Ghodhbani, H.; Rimer, S.; Ouahada, K.; Alimi, A.M. A Survey of Machine Learning Techniques Leveraging Brightness Indicators for Image Analysis in Biomedical Applications. IEEE Access 2025, 13, 66122–66148. [Google Scholar] [CrossRef] [Scilit]
- Urso, L.; Badrane, I.; Manco, L.; Castello, A.; Lancia, F.; Collavino, J.; Crestani, A.; Castellani, M.; Cittanti, C.; Bartolomei, M.; et al. The role of radiomics and artificial intelligence applied to staging PSMA PET in assessing prostate cancer aggressiveness. J. Clin. Med. 2025, 14, 3318. [Google Scholar] [CrossRef] [Scilit] [PubMed]
- Panahi, M.; Hosseini, M.S.; Aghamiri, S.M.R. Impact of image preprocessing methods on MRI radiomics feature variability and classification performance in Parkinson’s disease motor subtype analysis. Sci. Rep. 2025, 15, 40030. [Google Scholar] [CrossRef] [Scilit]
- Ahmed, A.; Zeng, X. A Robust Framework for Domain-Generalized Classification of Ovarian Cancer Histology Images. Diagnostics 2025, 15, 2954. [Google Scholar] [CrossRef] [Scilit]
- Yu, Y.; Cao, X.; Li, C.; Zhou, M.; Liu, T.; Liu, J.; Zhang, L. A review of machine Learning-Assisted gas sensor arrays in medical diagnosis. Biosensors 2025, 15, 548. [Google Scholar] [CrossRef] [Scilit]
- Rangaiah, P.K.; Augustine, R. Improving burn diagnosis in medical image retrieval from grafting burn samples using B-coefficients and the CLAHE algorithm. Biomed. Signal Process. Control 2025, 99, 106814. [Google Scholar] [CrossRef] [Scilit]
- Singroul, B.; Soni, A.K. Hybrid CLAHE-EfficientNet U-Net for Mammogram-Based Breast Cancer Detection. In 2025 13th International Conference on Intelligent Systems and Embedded Design (ISED); IEEE: New York, NY, USA, 2025; pp. 690–696. [Google Scholar] [CrossRef] [Scilit]
- Ismael, M.A.; Alwazzan, M.J.; Mohammed, R.A. Reducing Noise and Improving Image Contrast with a Hybrid Approach to Enhance the Quality of Medical Imaging. J. Med. Phys. 2025, 50, 751–759. [Google Scholar] [CrossRef] [Scilit]
- Liu, H.; Zhang, S.; He, K. Residual Learning for Self-Knowledge Distillation: Enhancing Neural Networks Through Consistency Across Layers. IEEE Trans. Big Data 2025, 11, 2615–2627. [Google Scholar] [CrossRef] [Scilit]
- Trigka, M.; Dritsas, E. A comprehensive survey of deep learning approaches in image processing. Sensors 2025, 25, 531. [Google Scholar] [CrossRef] [Scilit]
- Kim, J.W.; Khan, A.U.; Banerjee, I. Systematic review of hybrid vision transformer architectures for radiological image analysis. J. Imaging Inform. Med. 2025, 38, 3248–3262. [Google Scholar] [CrossRef] [Scilit]
- Albuquerque, C.; Henriques, R.; Castelli, M. Deep learning-based object detection algorithms in medical imaging: Systematic review. Heliyon 2025, 11, e41137. [Google Scholar] [CrossRef] [Scilit]
- Hsu, P.Y.; Xu, J.L.; Chen, L.L.; Chen, M.Y. Using deep learning to construct microcalcification clusters in a mammography prediction model. Innov. Emerg. Technol. 2025, 12, 2550030. [Google Scholar] [CrossRef] [Scilit]
- Jiang, Z.; Ma, J.; Zhou, W.; Liu, G.; Sun, G.; Yan, Q.; Xia, T.; Wang, Q. Multi-scale contextual information enhancement network based on multi-level feature similarity fusion for improved mammogram classification. Biomed. Signal Process. Control 2026, 112, 108562. [Google Scholar] [CrossRef] [Scilit]
- Pérez-Sanpablo, A.I.; Quinzaños-Fresnedo, J.; Gutiérrez-Martínez, J.; Lozano-Rodríguez, I.G.; Roldan-Valadez, E. Transforming medical imaging: The role of artificial intelligence integration in PACS for enhanced diagnostic accuracy and workflow efficiency. Curr. Med. Imaging 2025, 21, e15734056370620. [Google Scholar] [CrossRef] [Scilit]
- Wang, L.; Zhang, S.; Xu, N.; He, Q.; Zhu, Y.; Chang, Z.; Wu, Y.; Wang, H.; Qi, S.; Zhang, L.; et al. Role of artificial intelligence in medical image analysis. Chin. Med. J. 2025, 138, 2879–2894. [Google Scholar] [CrossRef] [Scilit]
- Chang, H.; Zhao, J.; Qin, R.; Bao, W.; Xie, H.; Tan, Y.; Guo, Z.; Zou, H.; Wang, X.; Dong, K. Ultra-Wideband Hybrid Triboelectric–Piezoelectric Acoustic Sensors Enabled by Acoustic Metasurface Lens for Environment Perception and Medical Imaging. Adv. Funct. Mater. 2026, 36, e13202. [Google Scholar] [CrossRef] [Scilit]
- Flaiban, E.; Orhan, K.; Gonçalves, B.C.; Lopes, S.L.P.D.C.; Costa, A.L.F. Radiomics in Action: Multimodal Synergies for Imaging Biomarkers. Bioengineering 2025, 12, 1139. [Google Scholar] [CrossRef] [Scilit] [PubMed]
- Ismailova, A.; Abdikerimova, G.; Uzakkyzy, N.; Muratkhan, R.; Aitimov, M.; Tergeusizova, A.; Beissegul, A. Development of a feature vector for accurate breast cancer detection in mammographic images. Int. J. Cogn. Comput. Eng. 2026, 7, 12–25. [Google Scholar] [CrossRef] [Scilit]
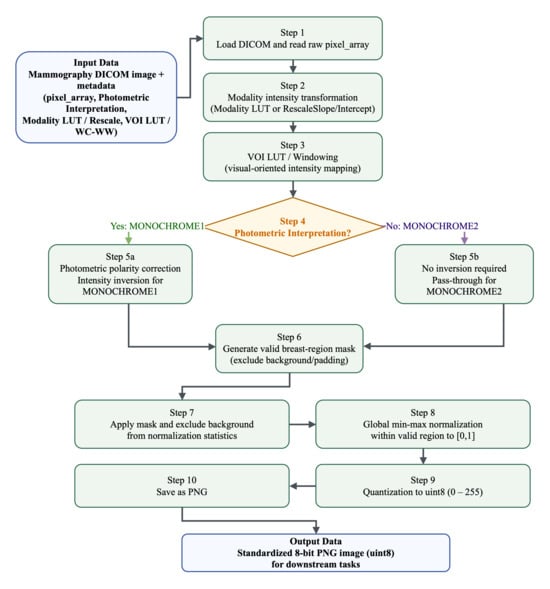
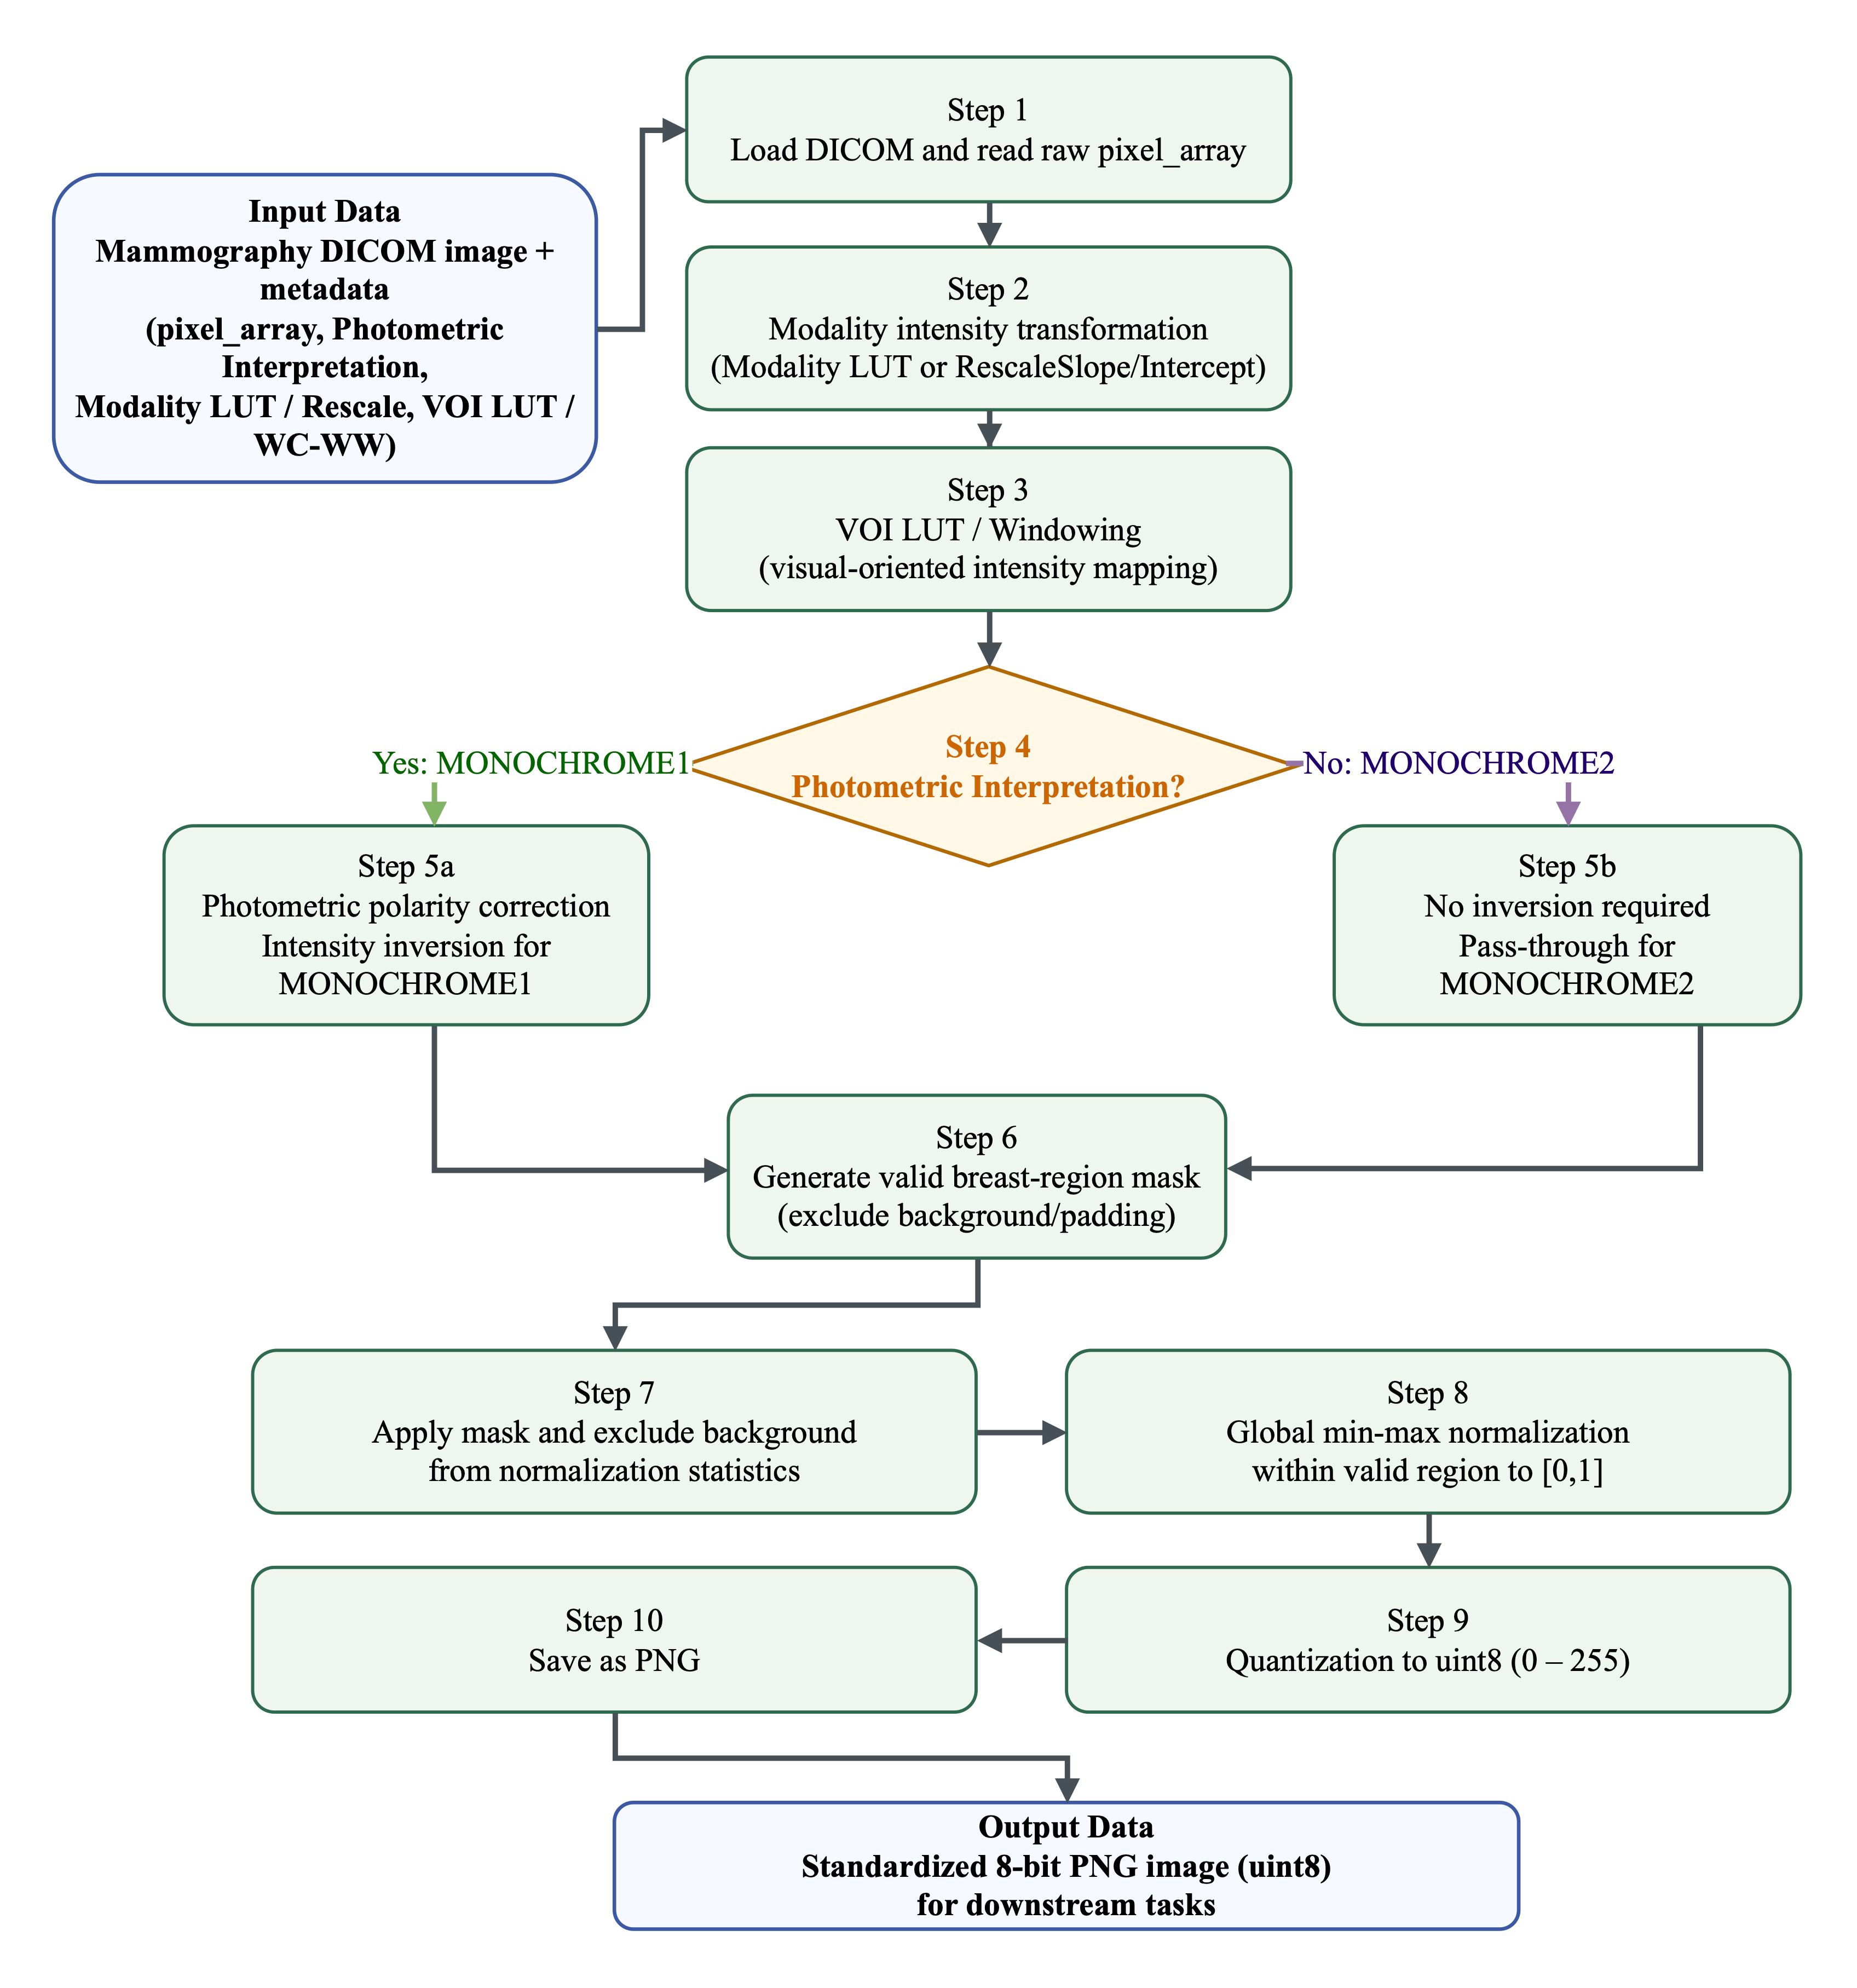
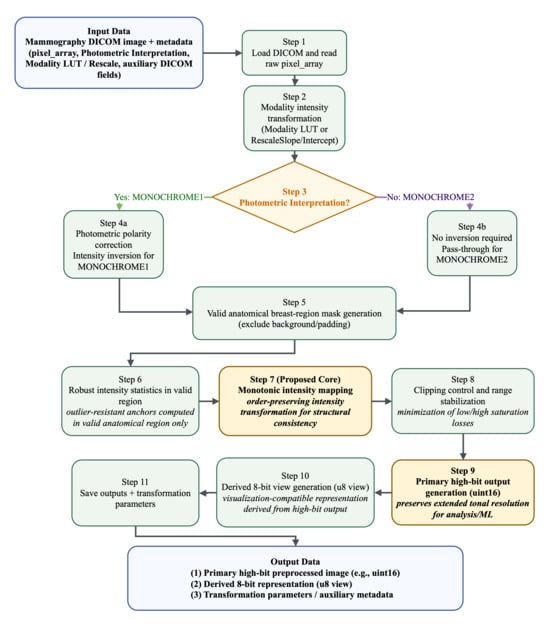
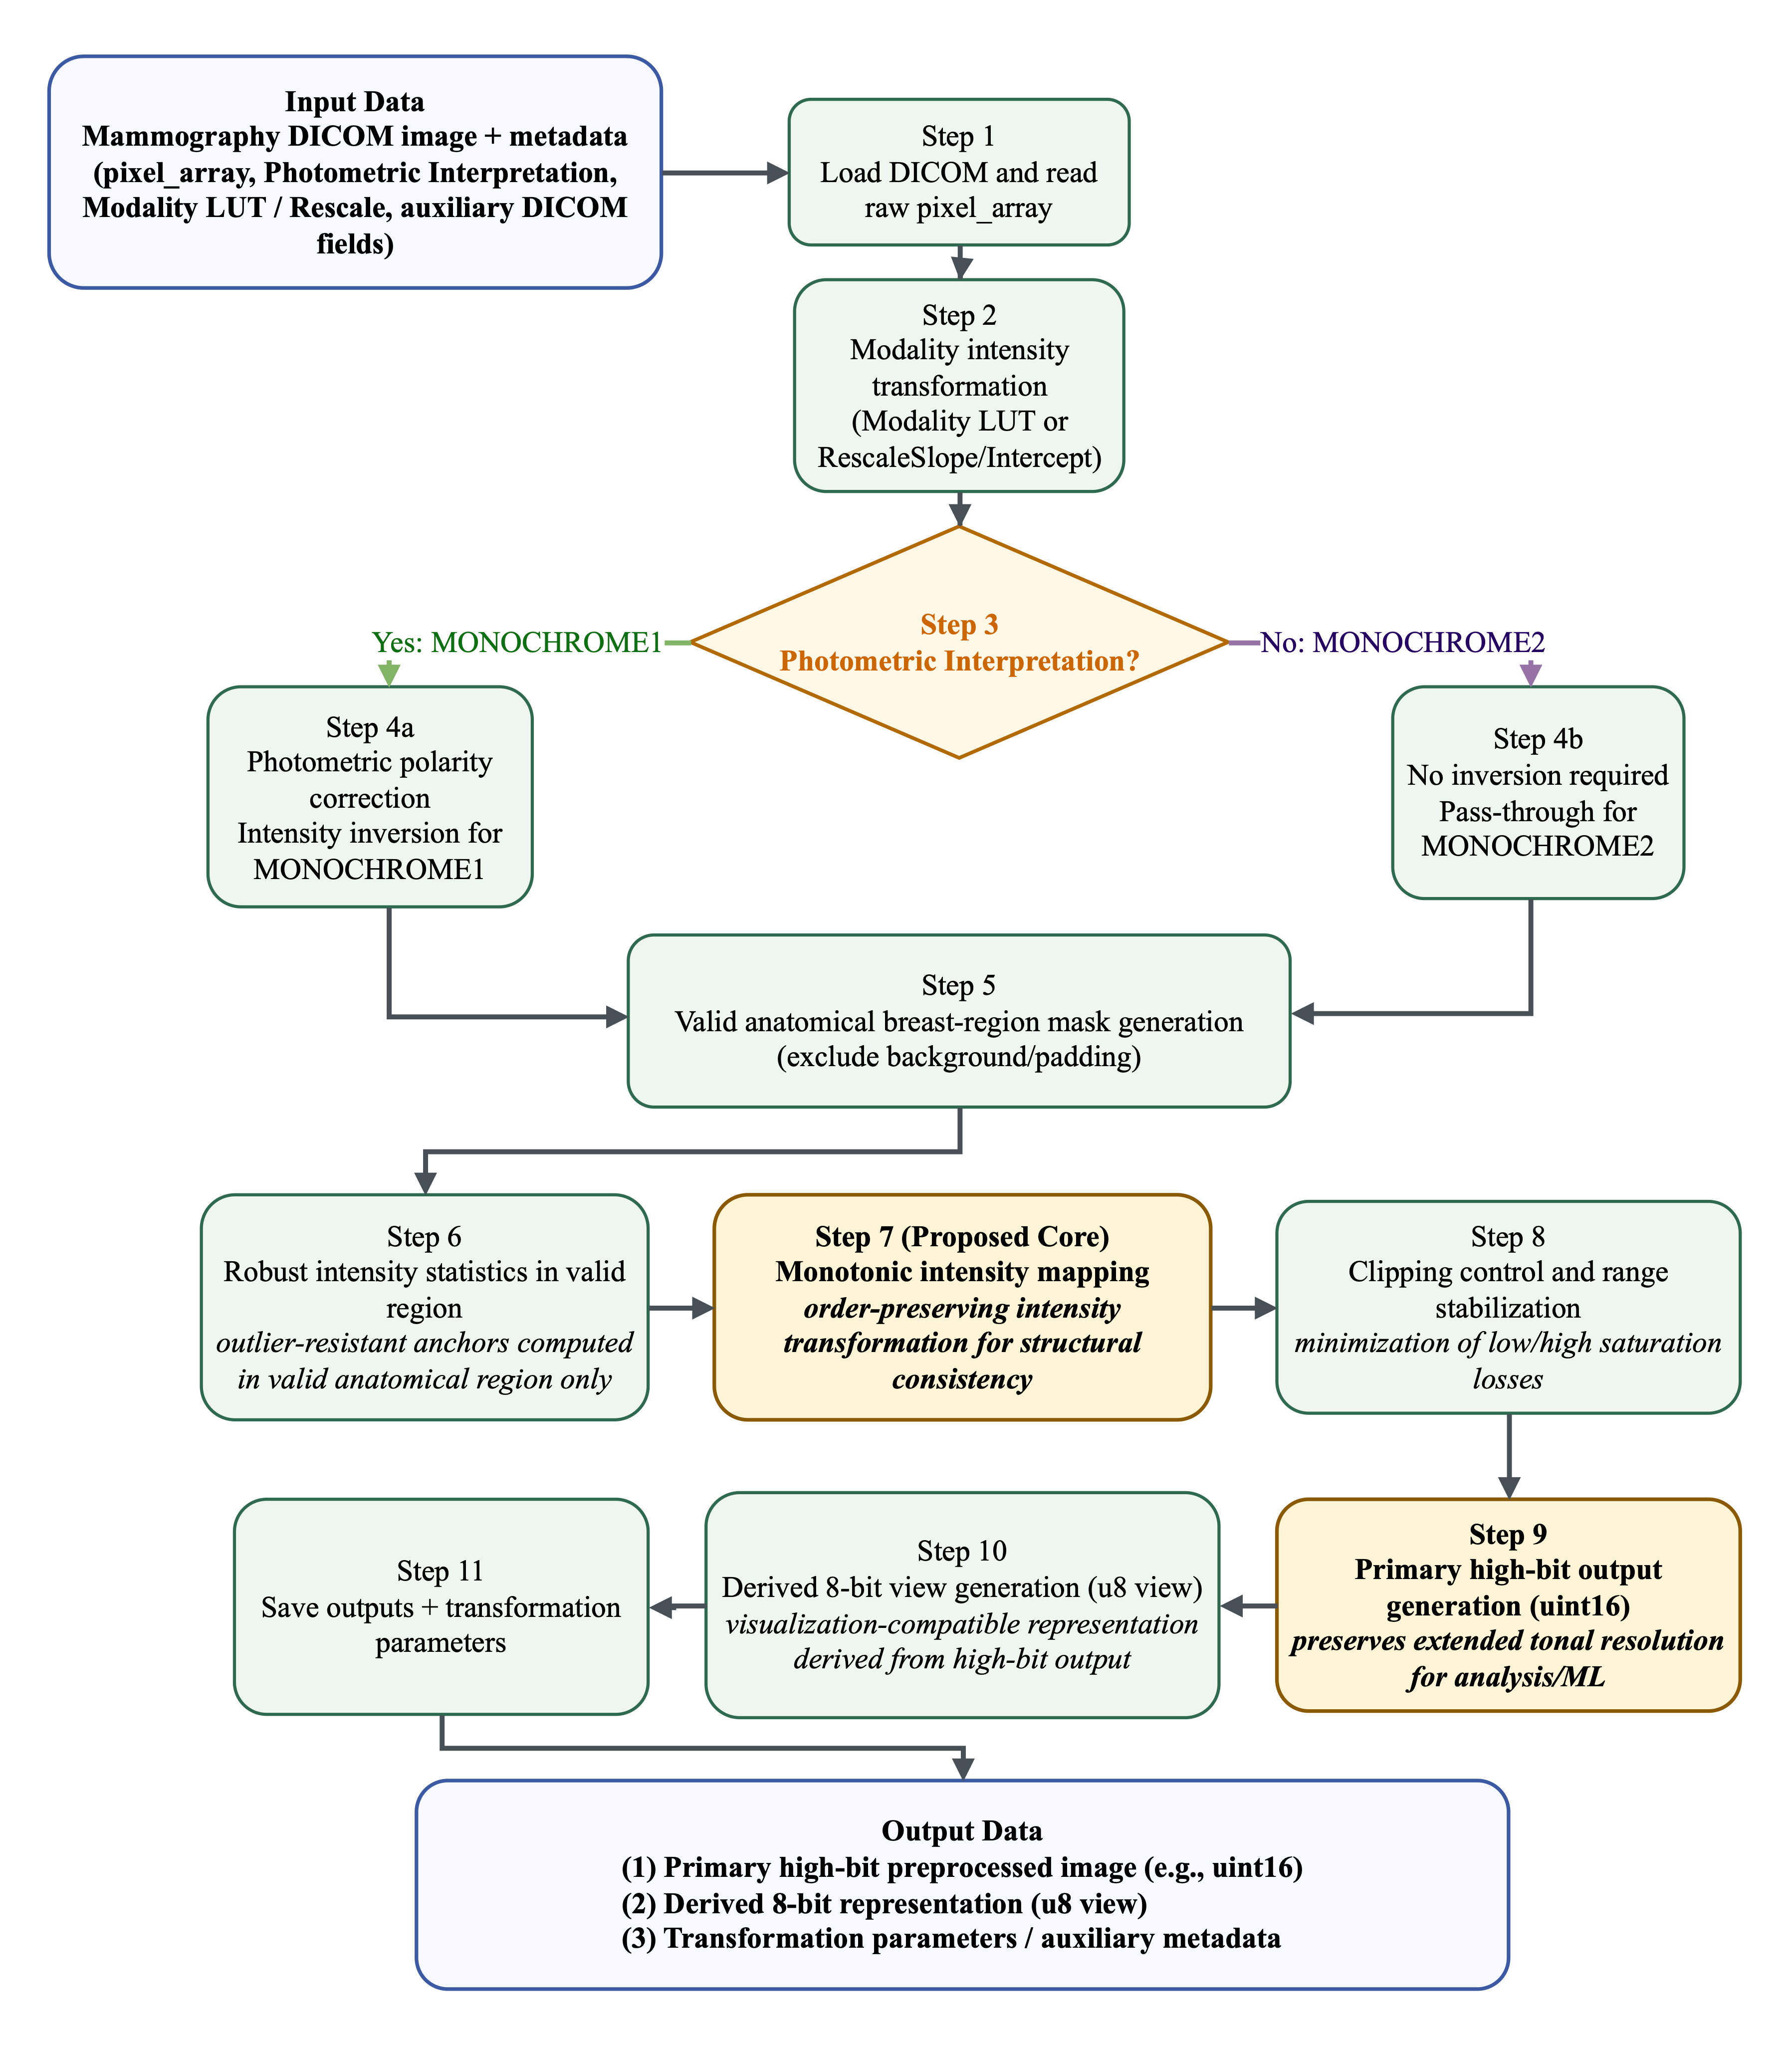
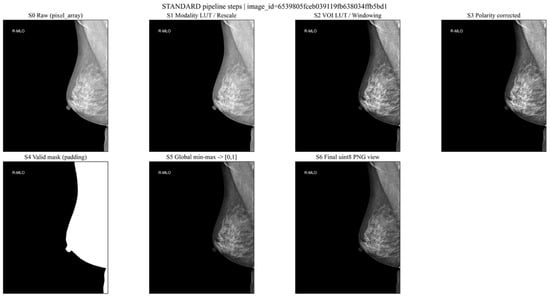
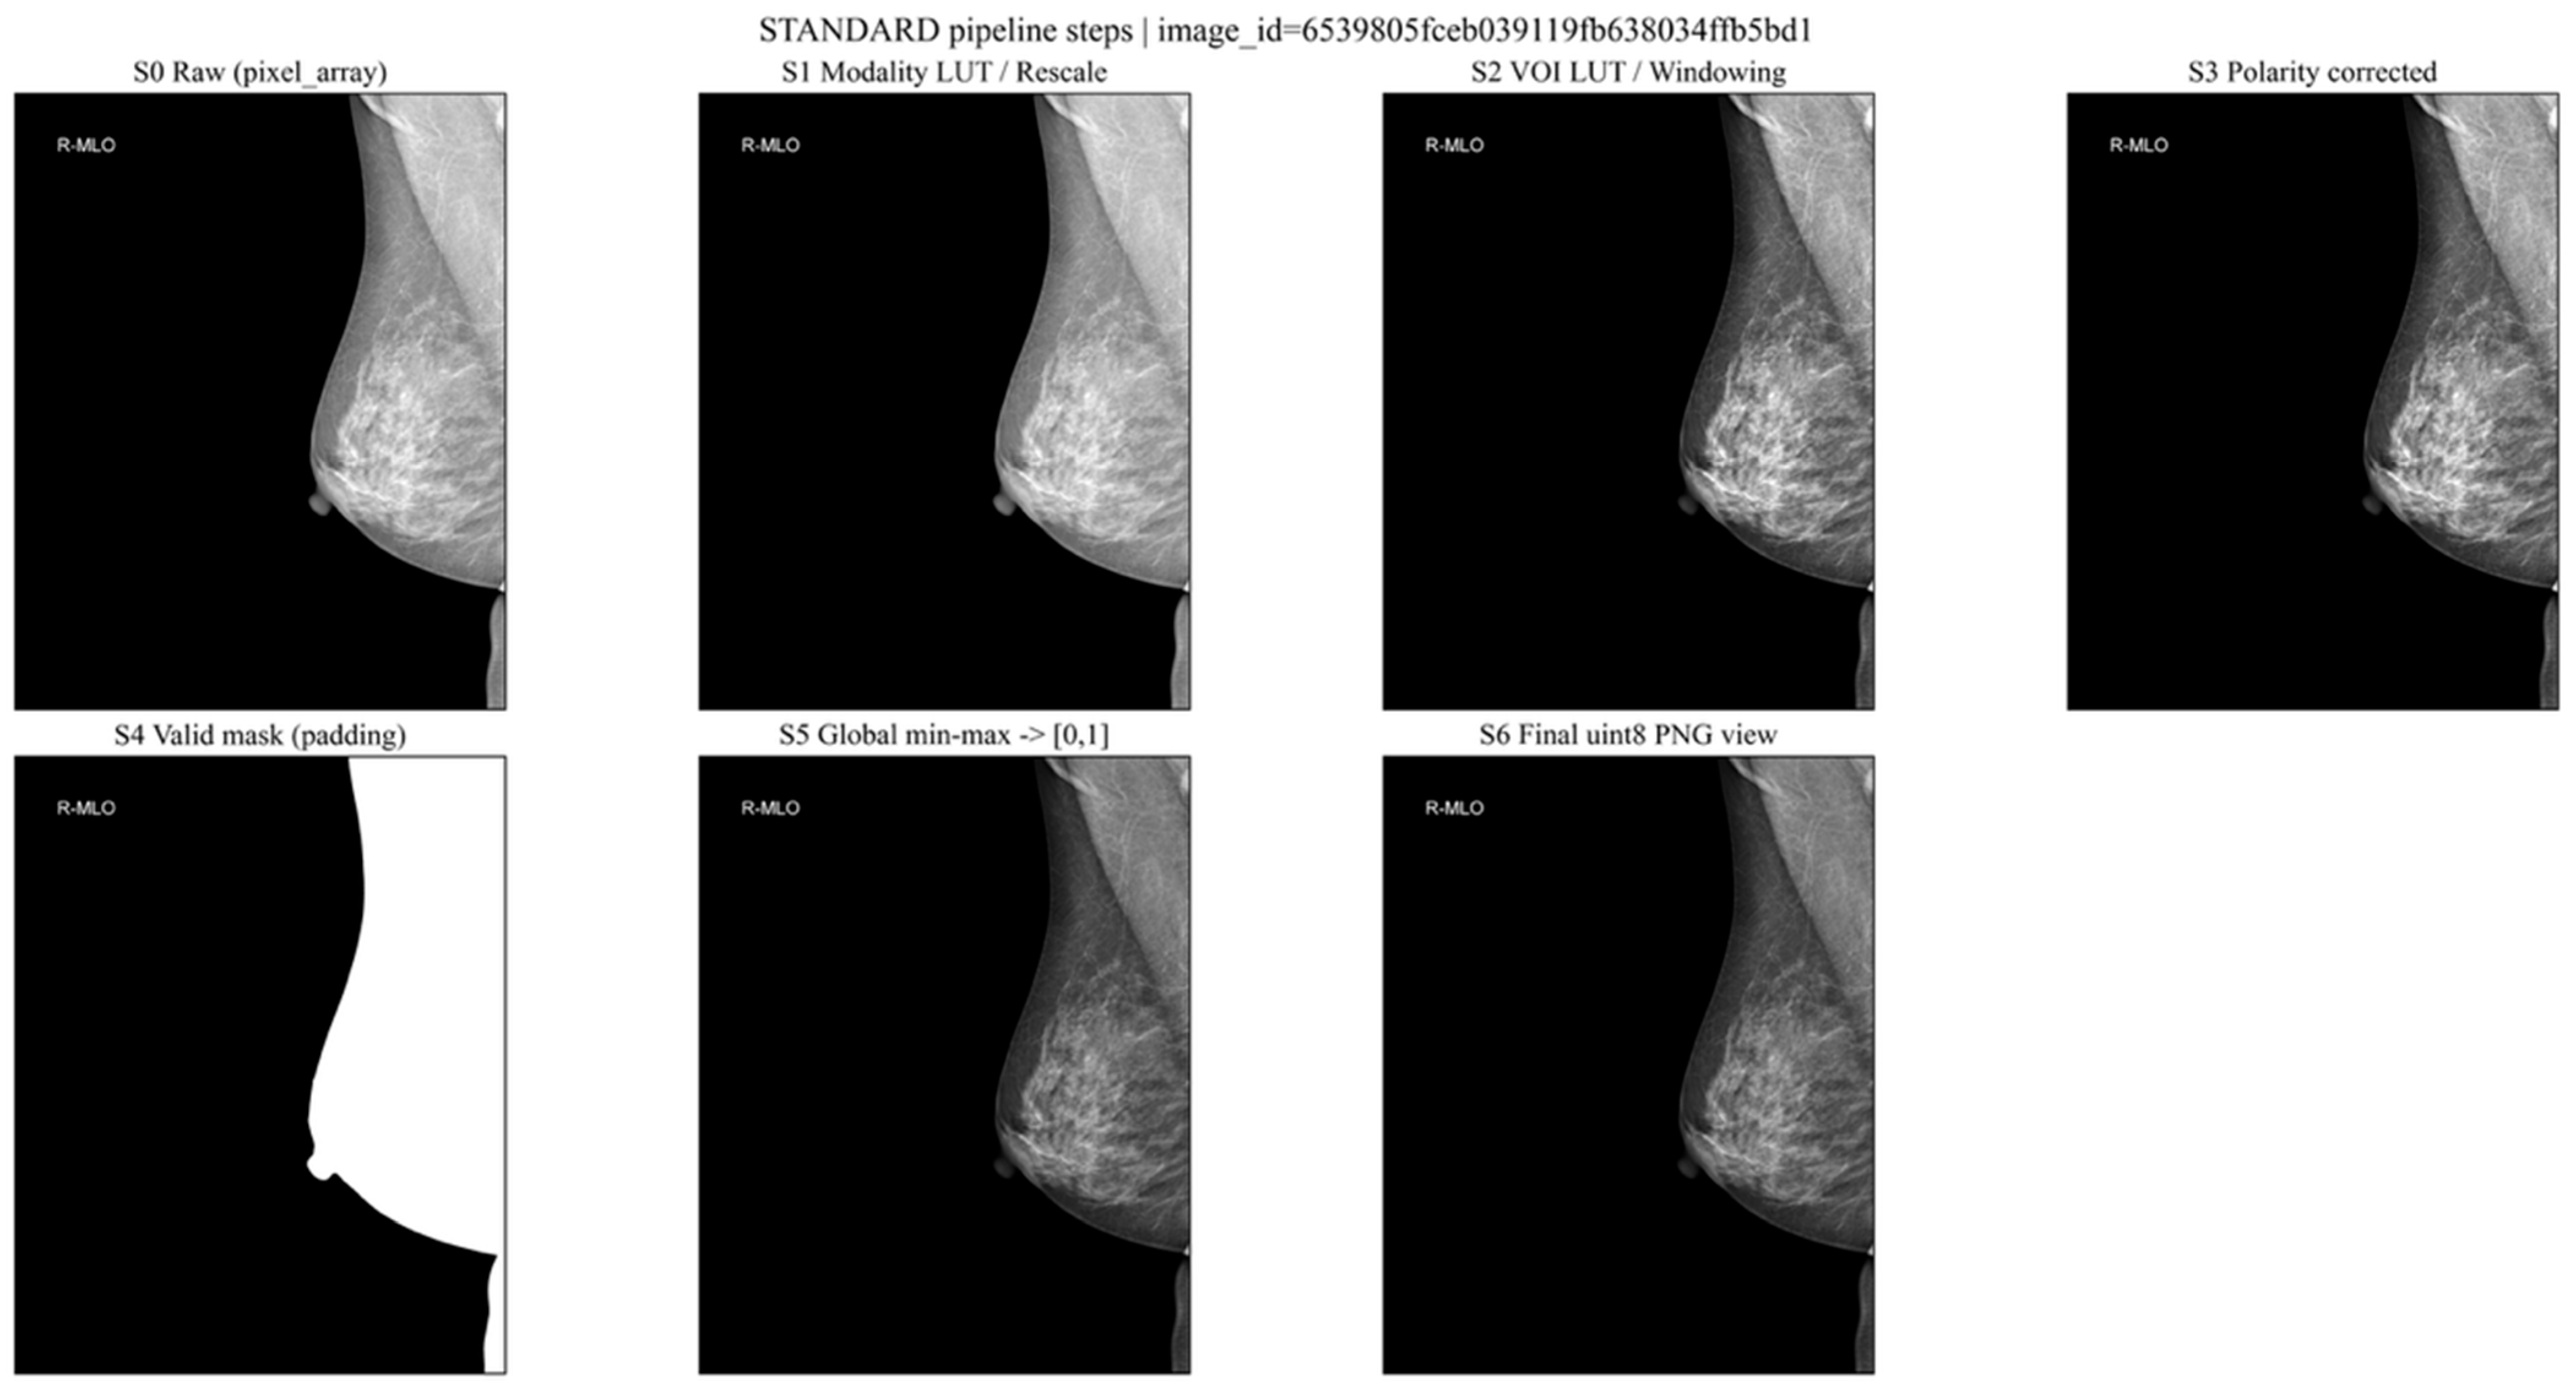
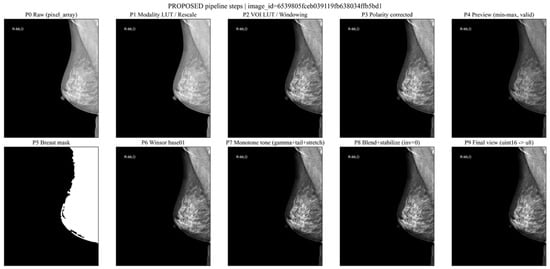
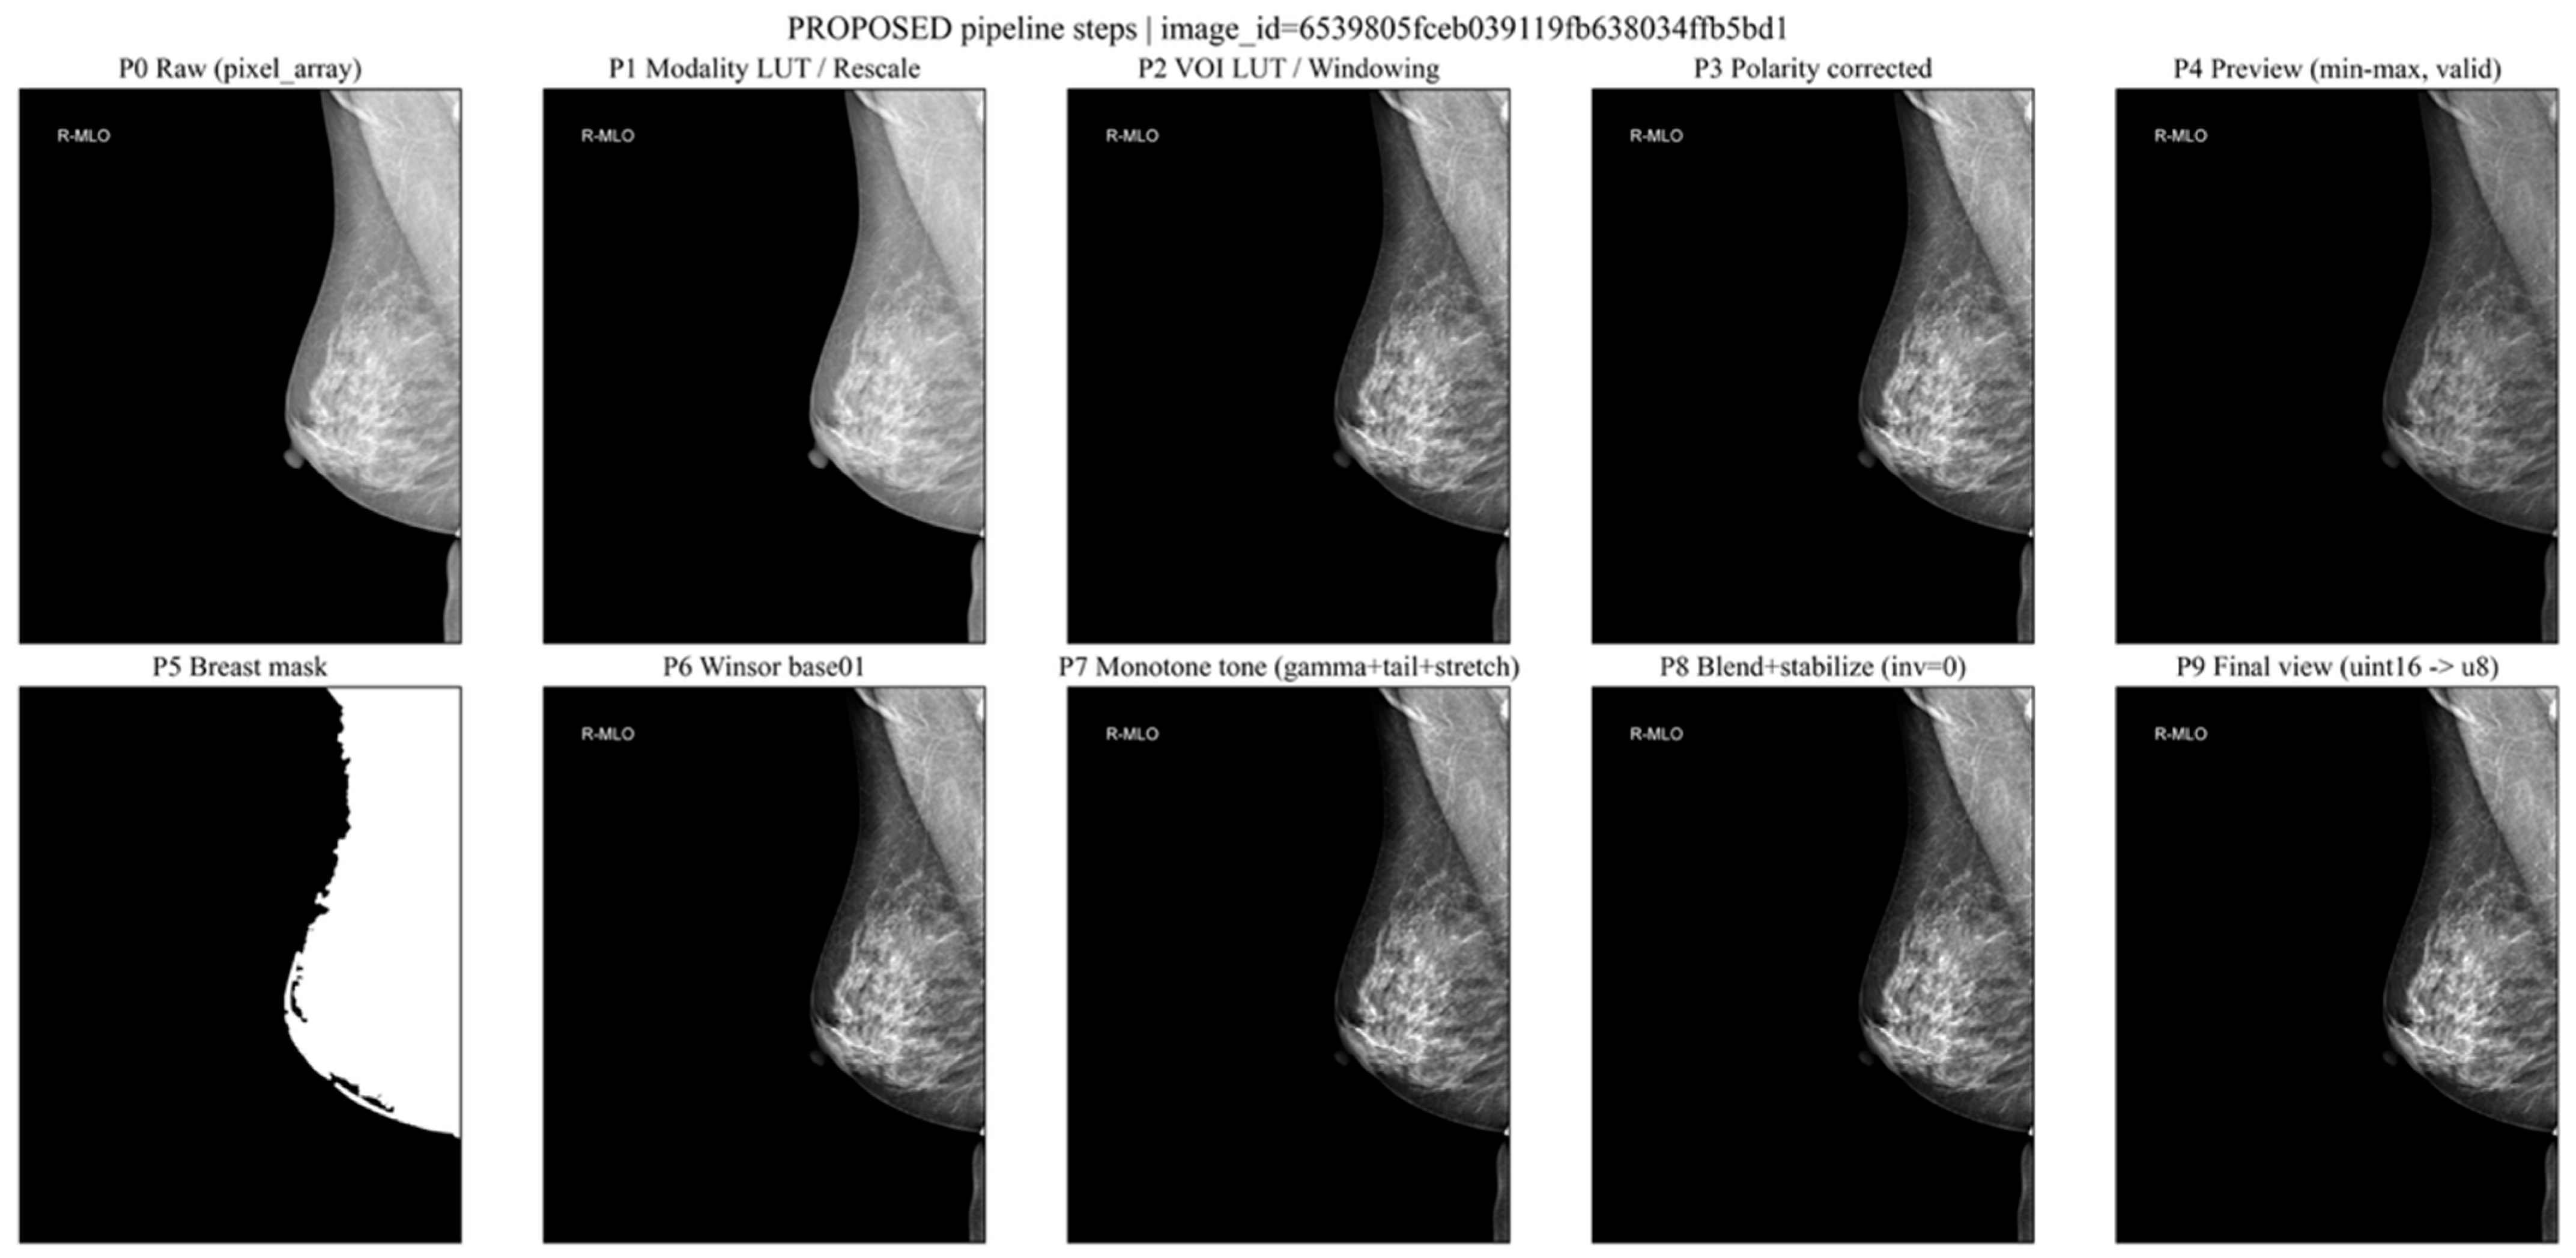
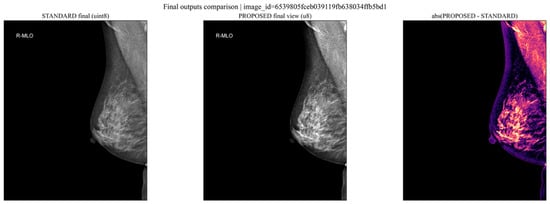
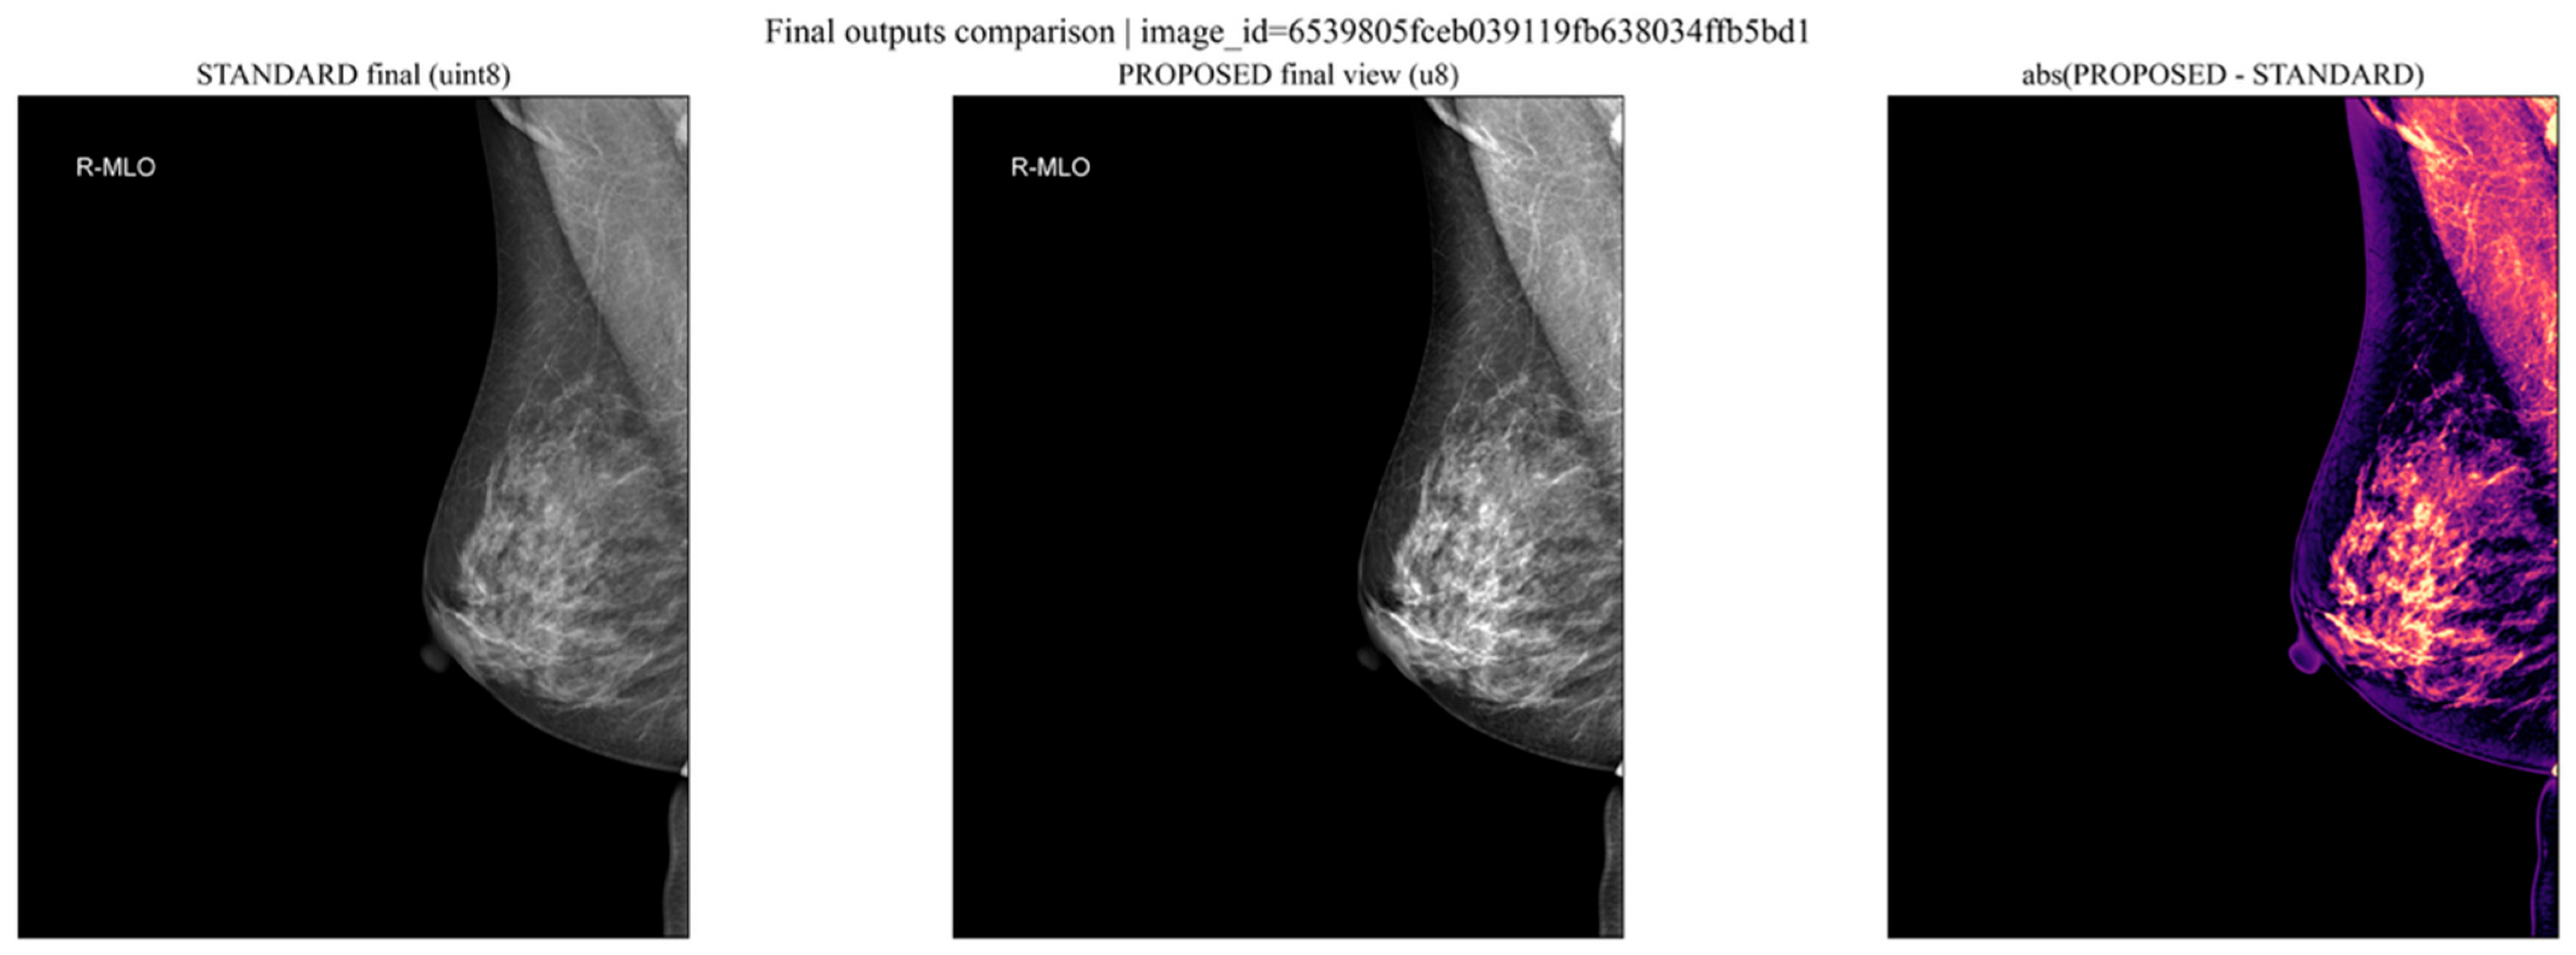
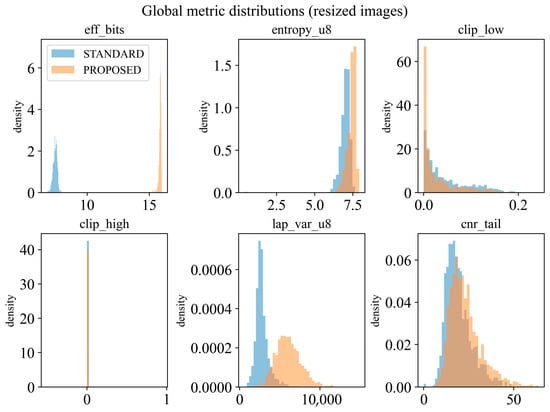
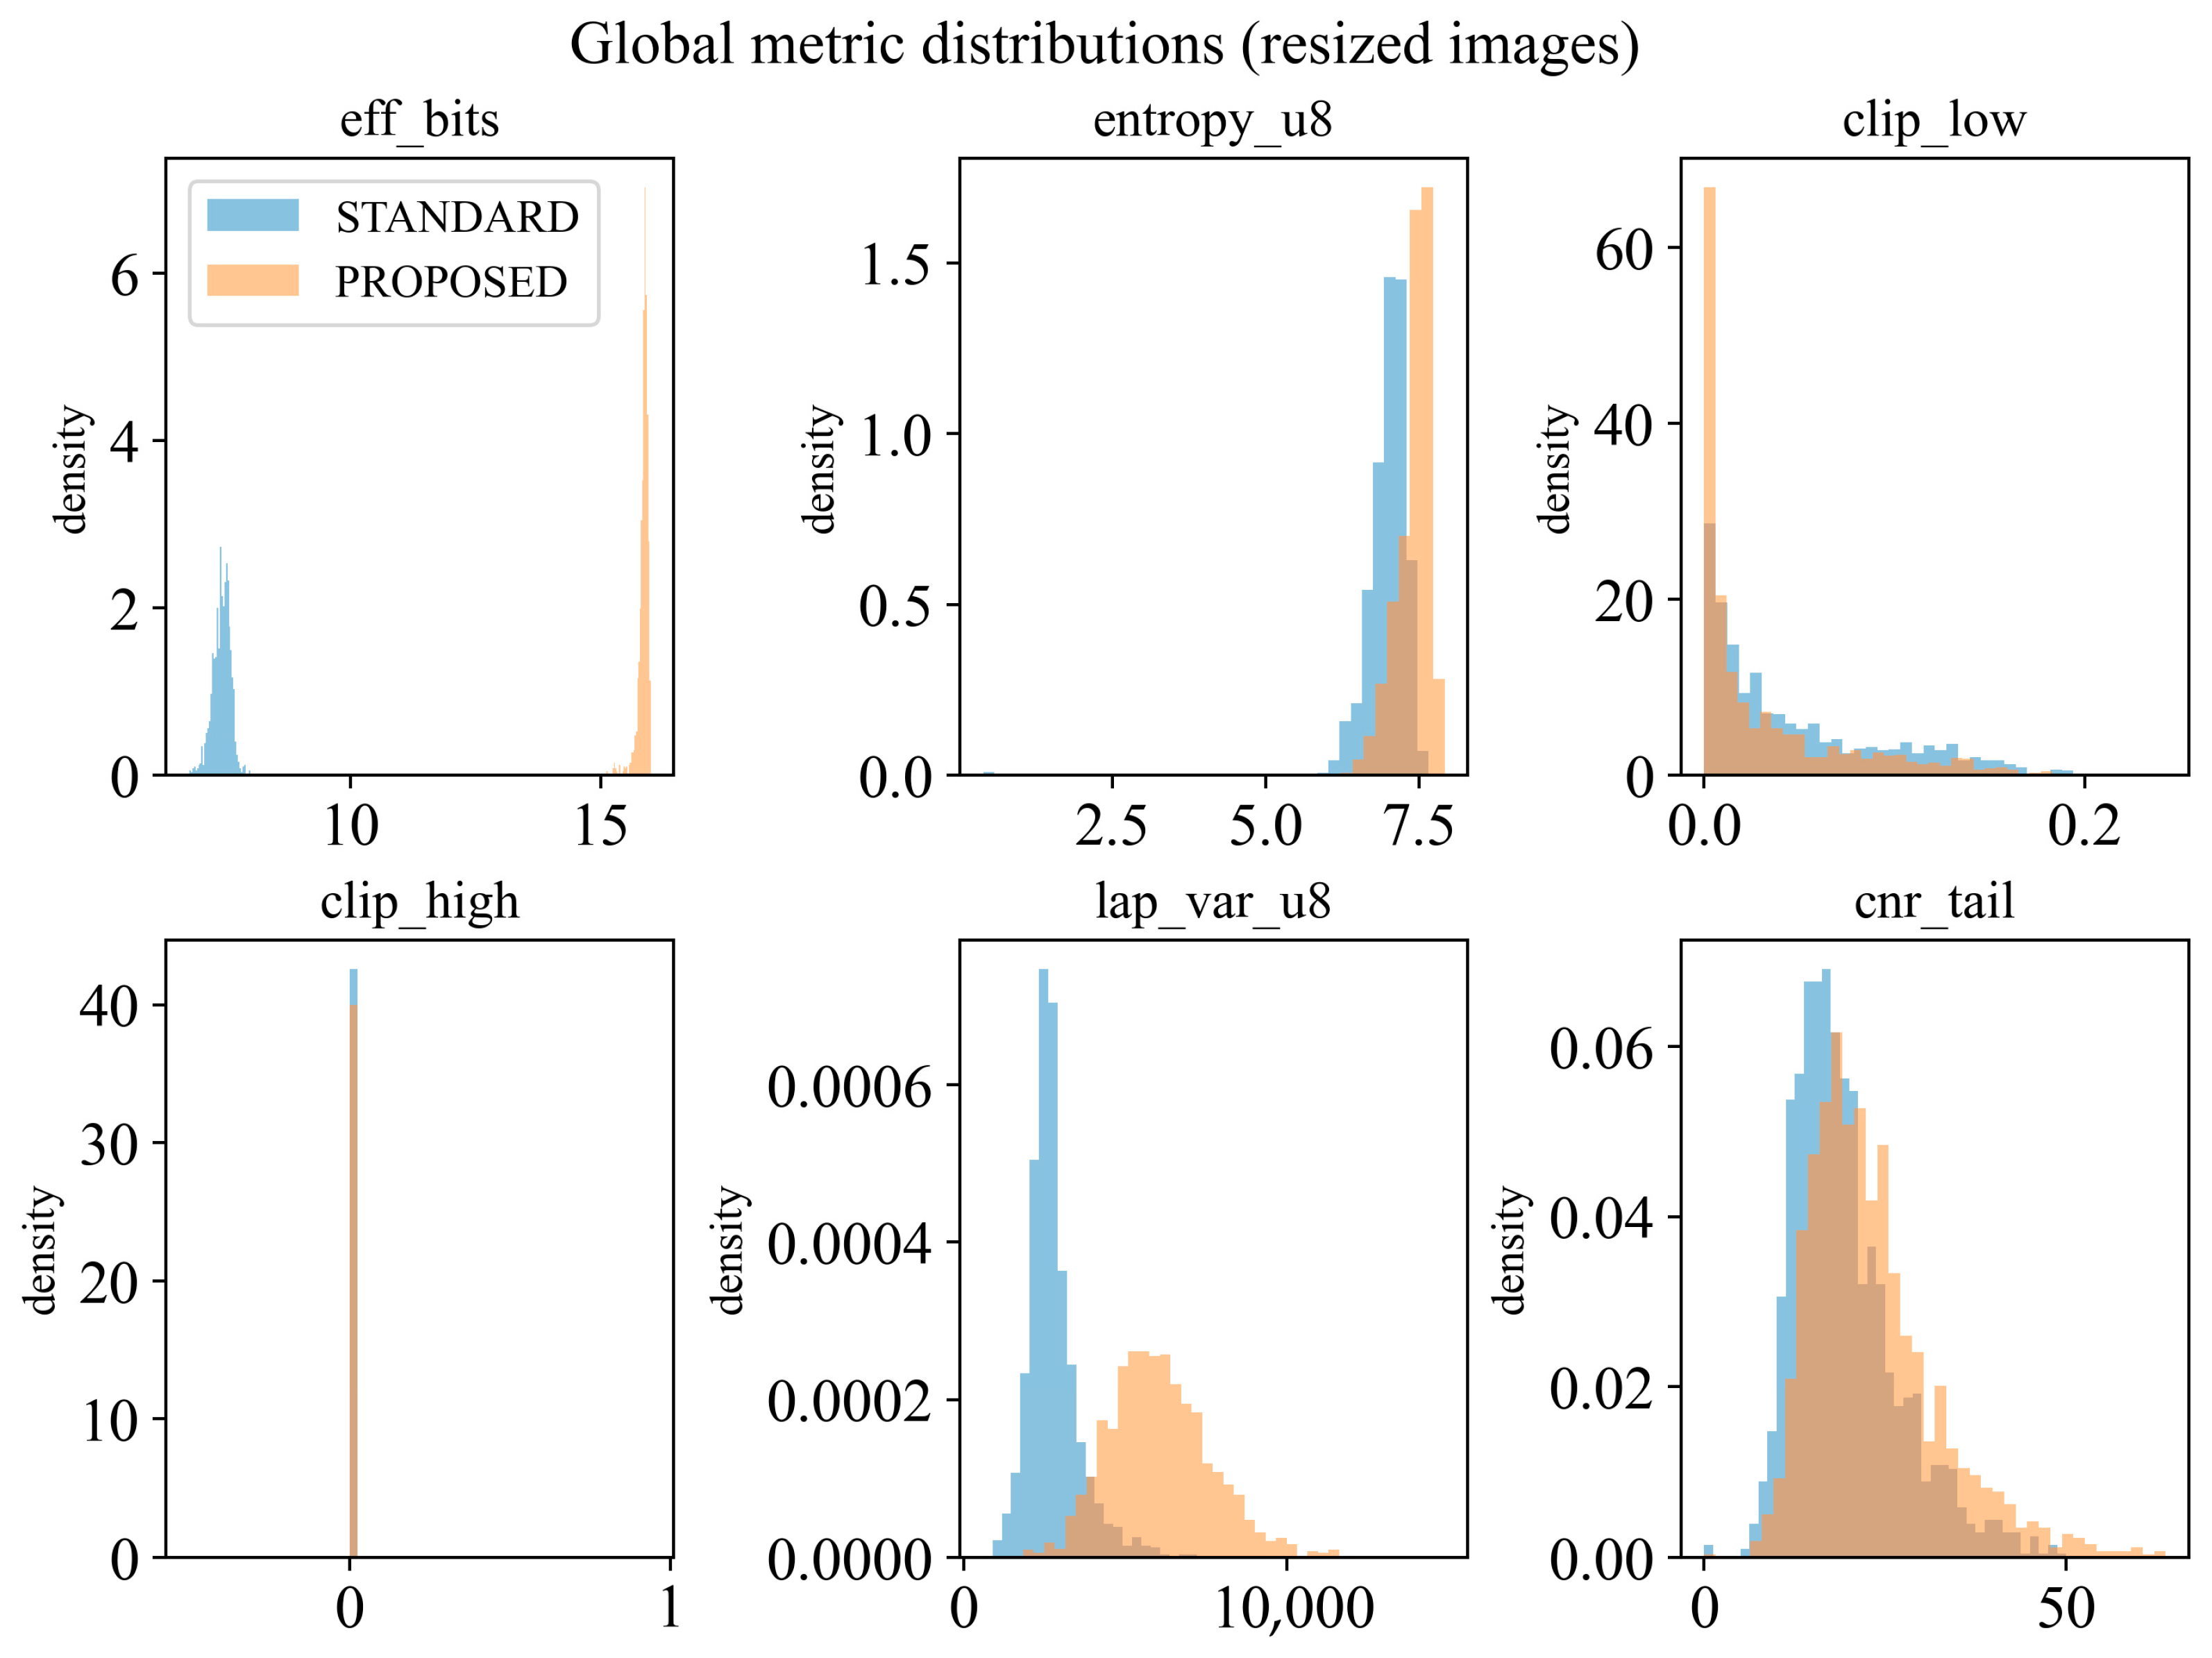
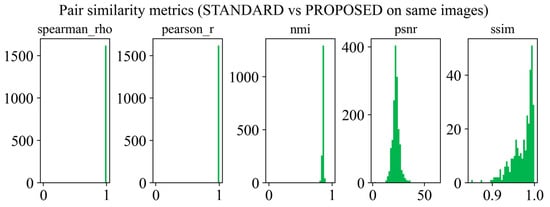
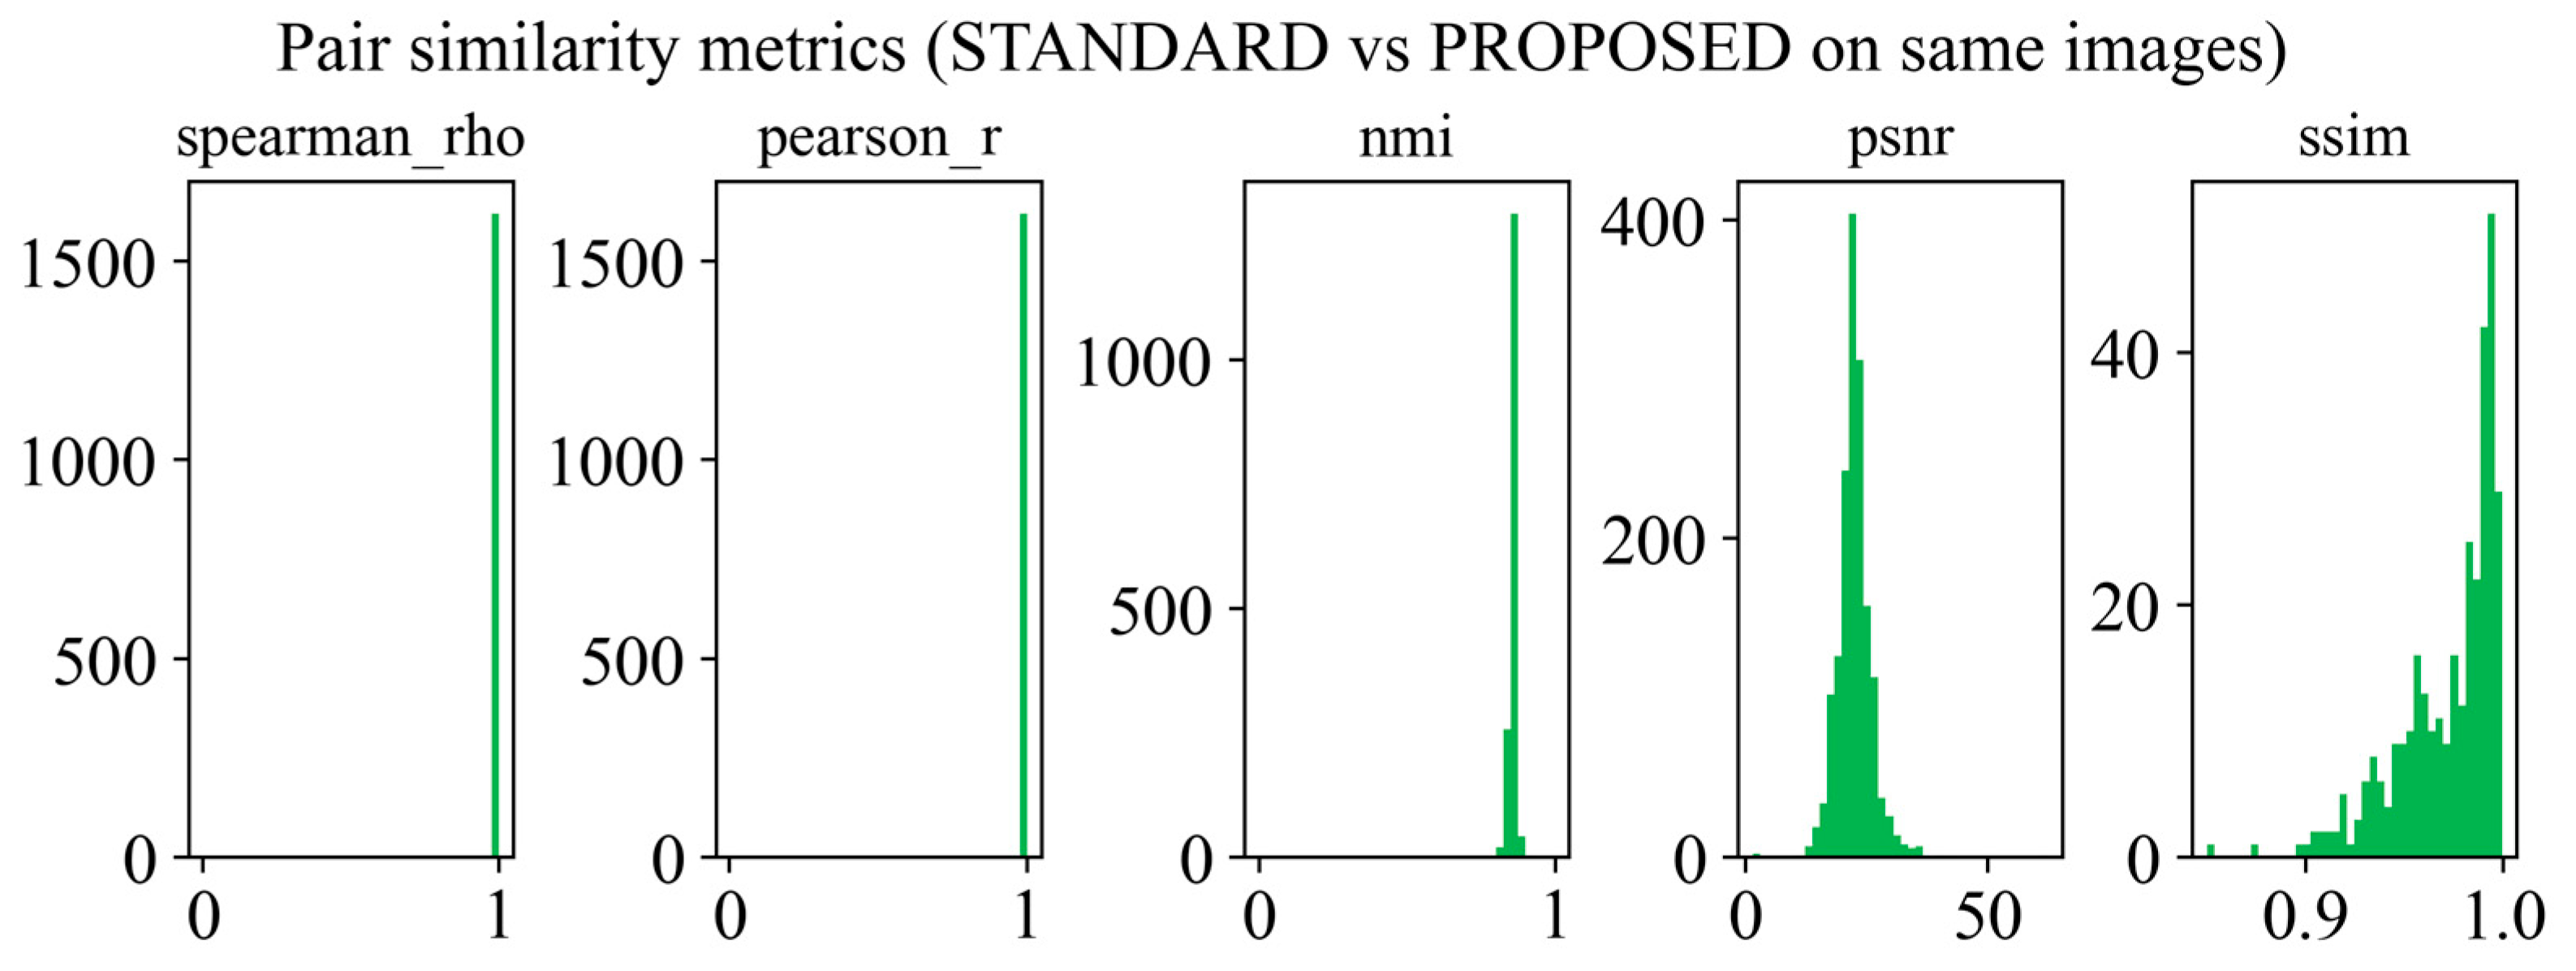
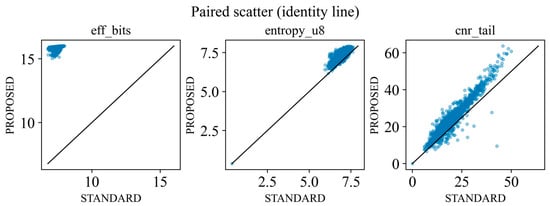
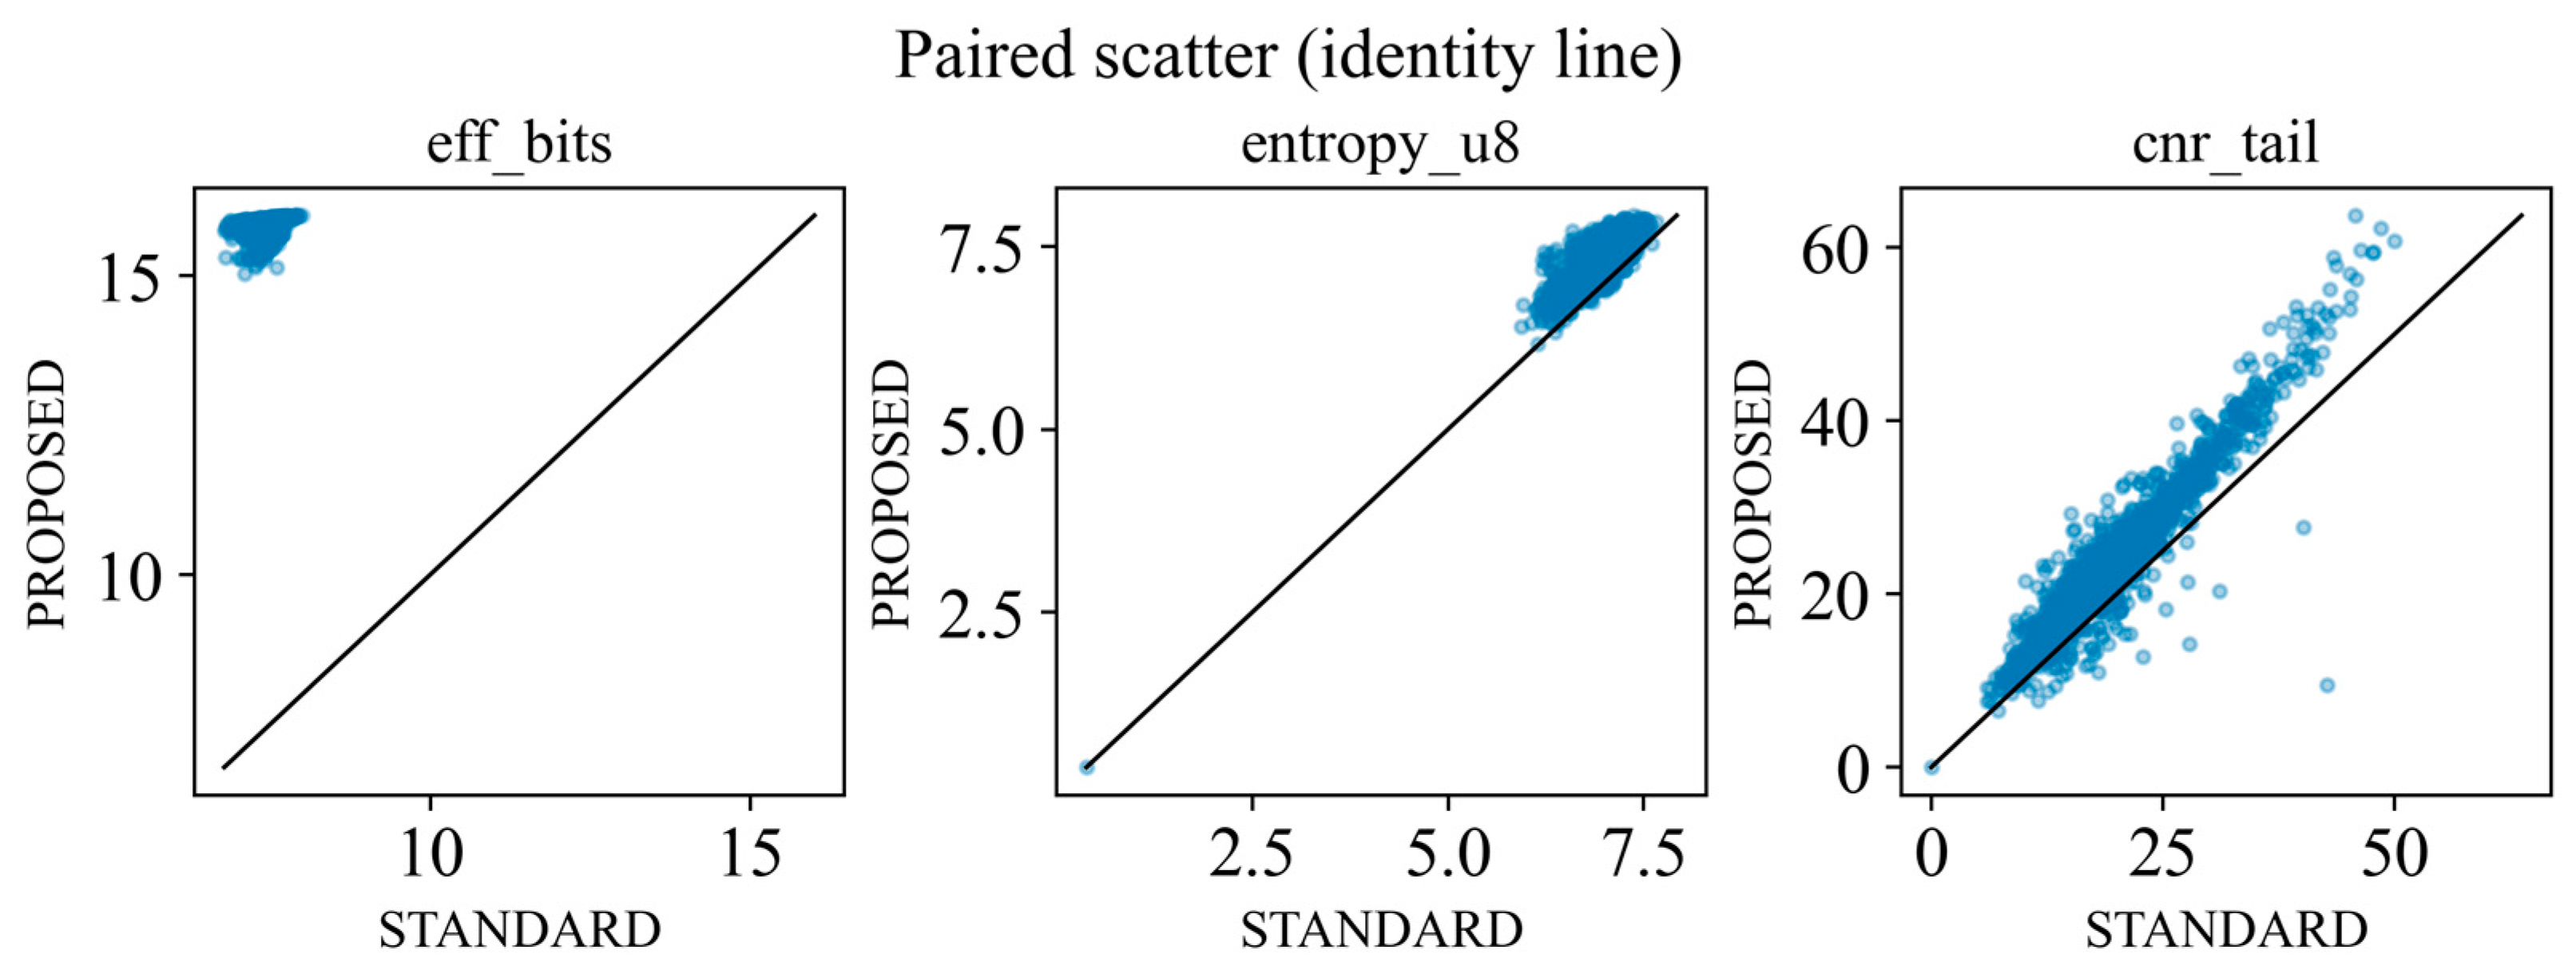
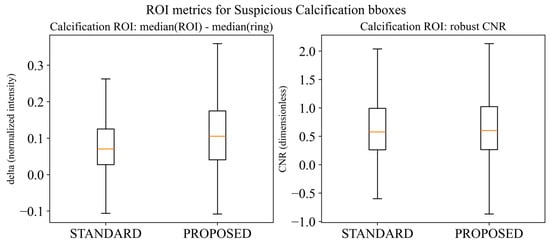
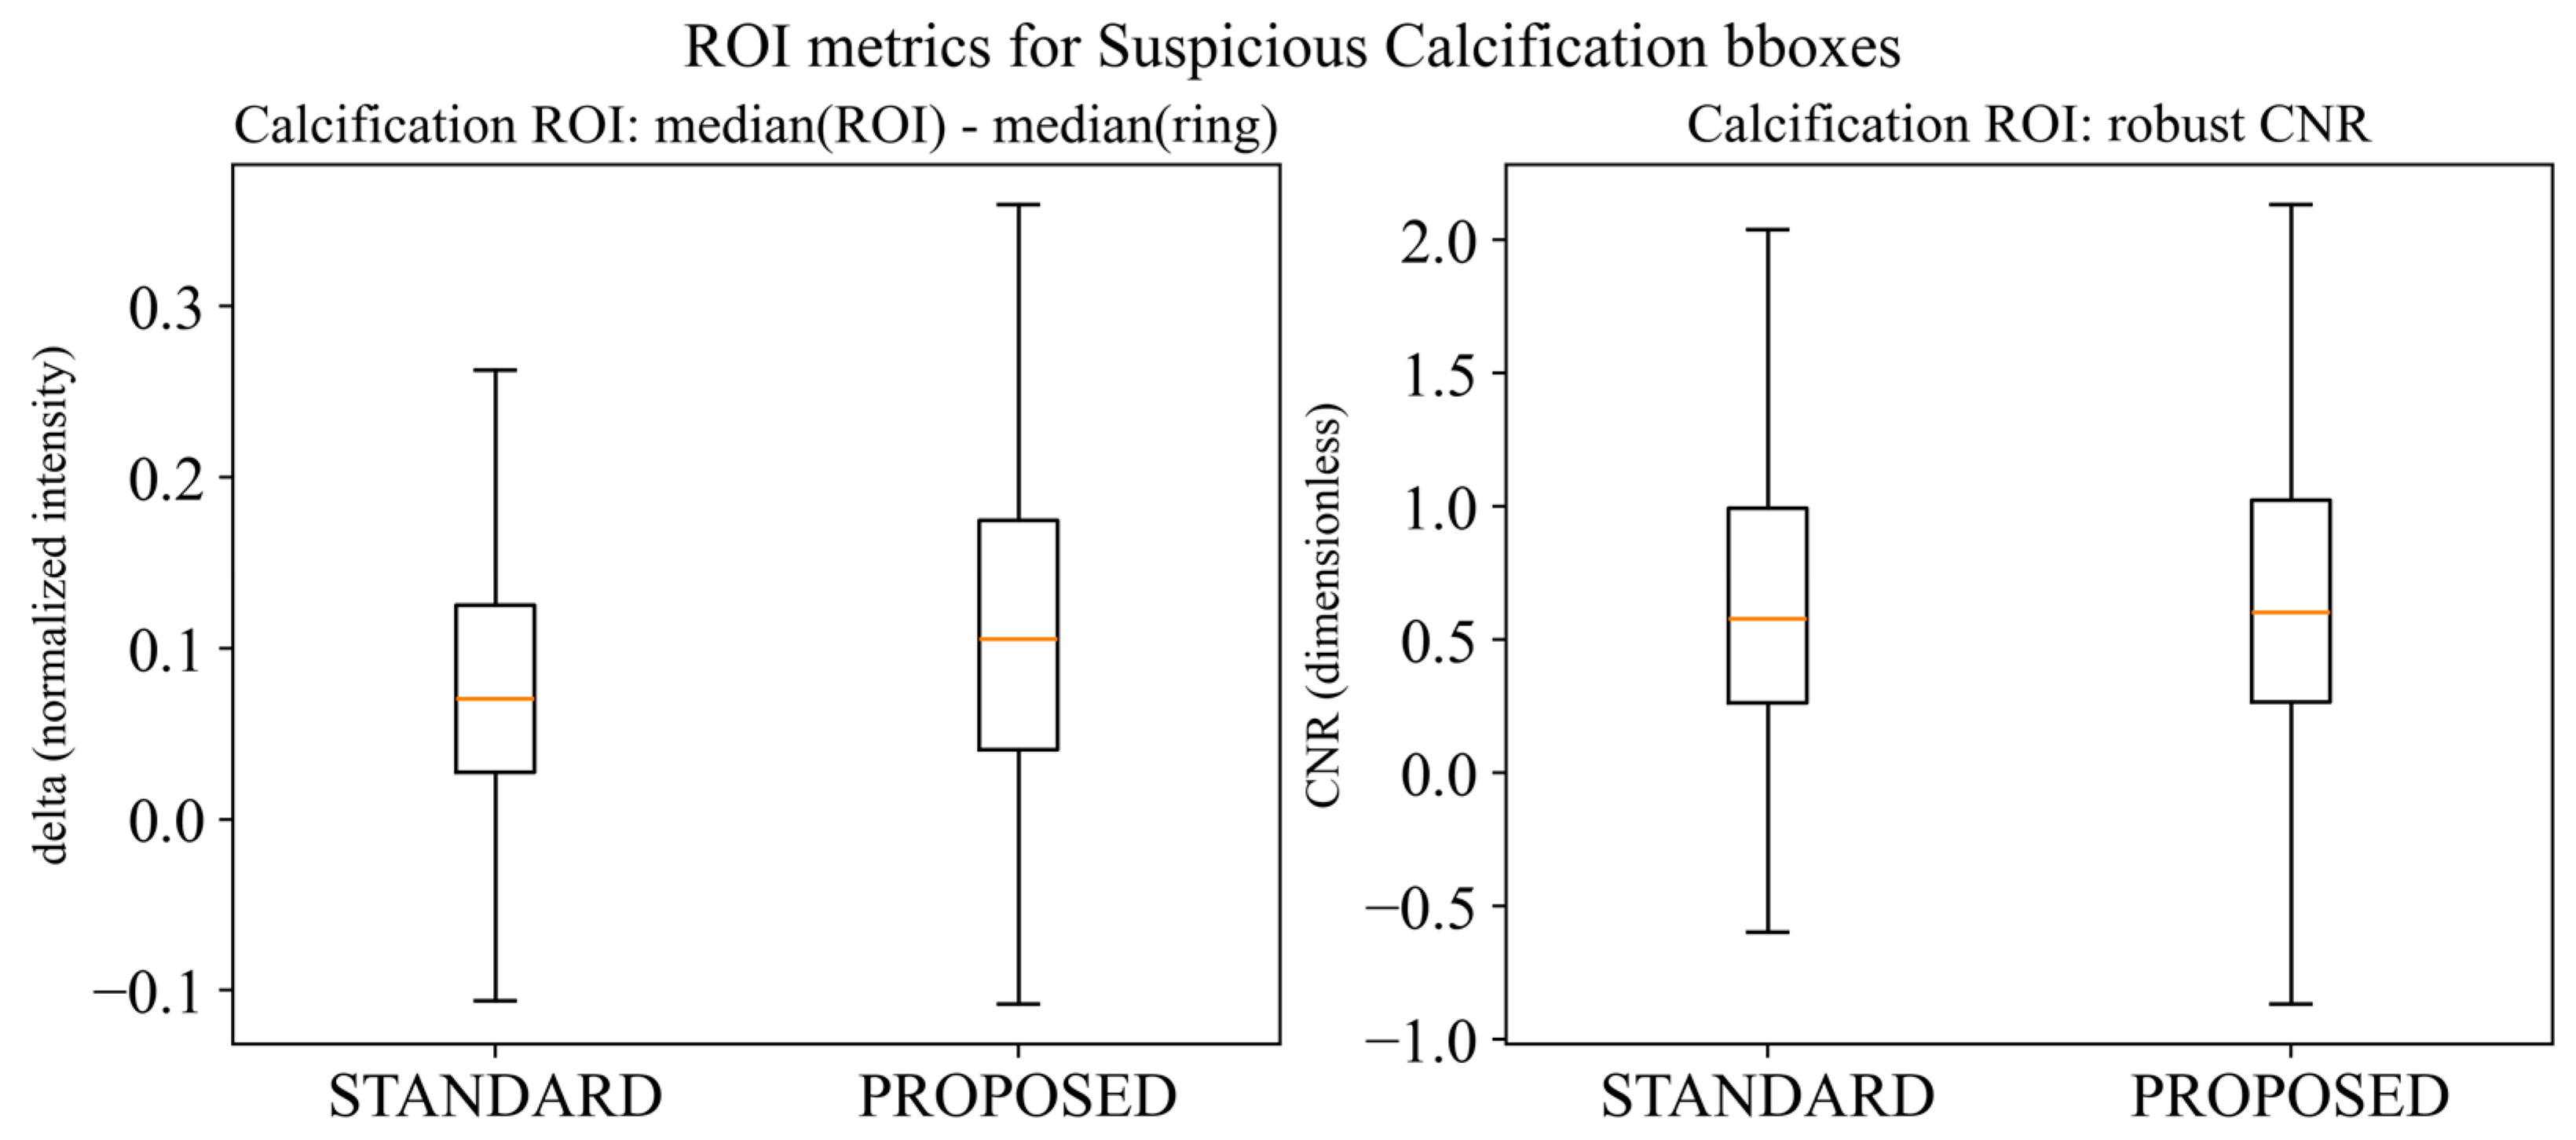
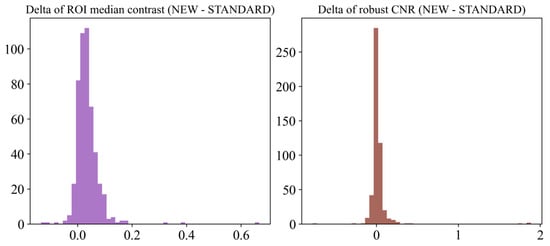
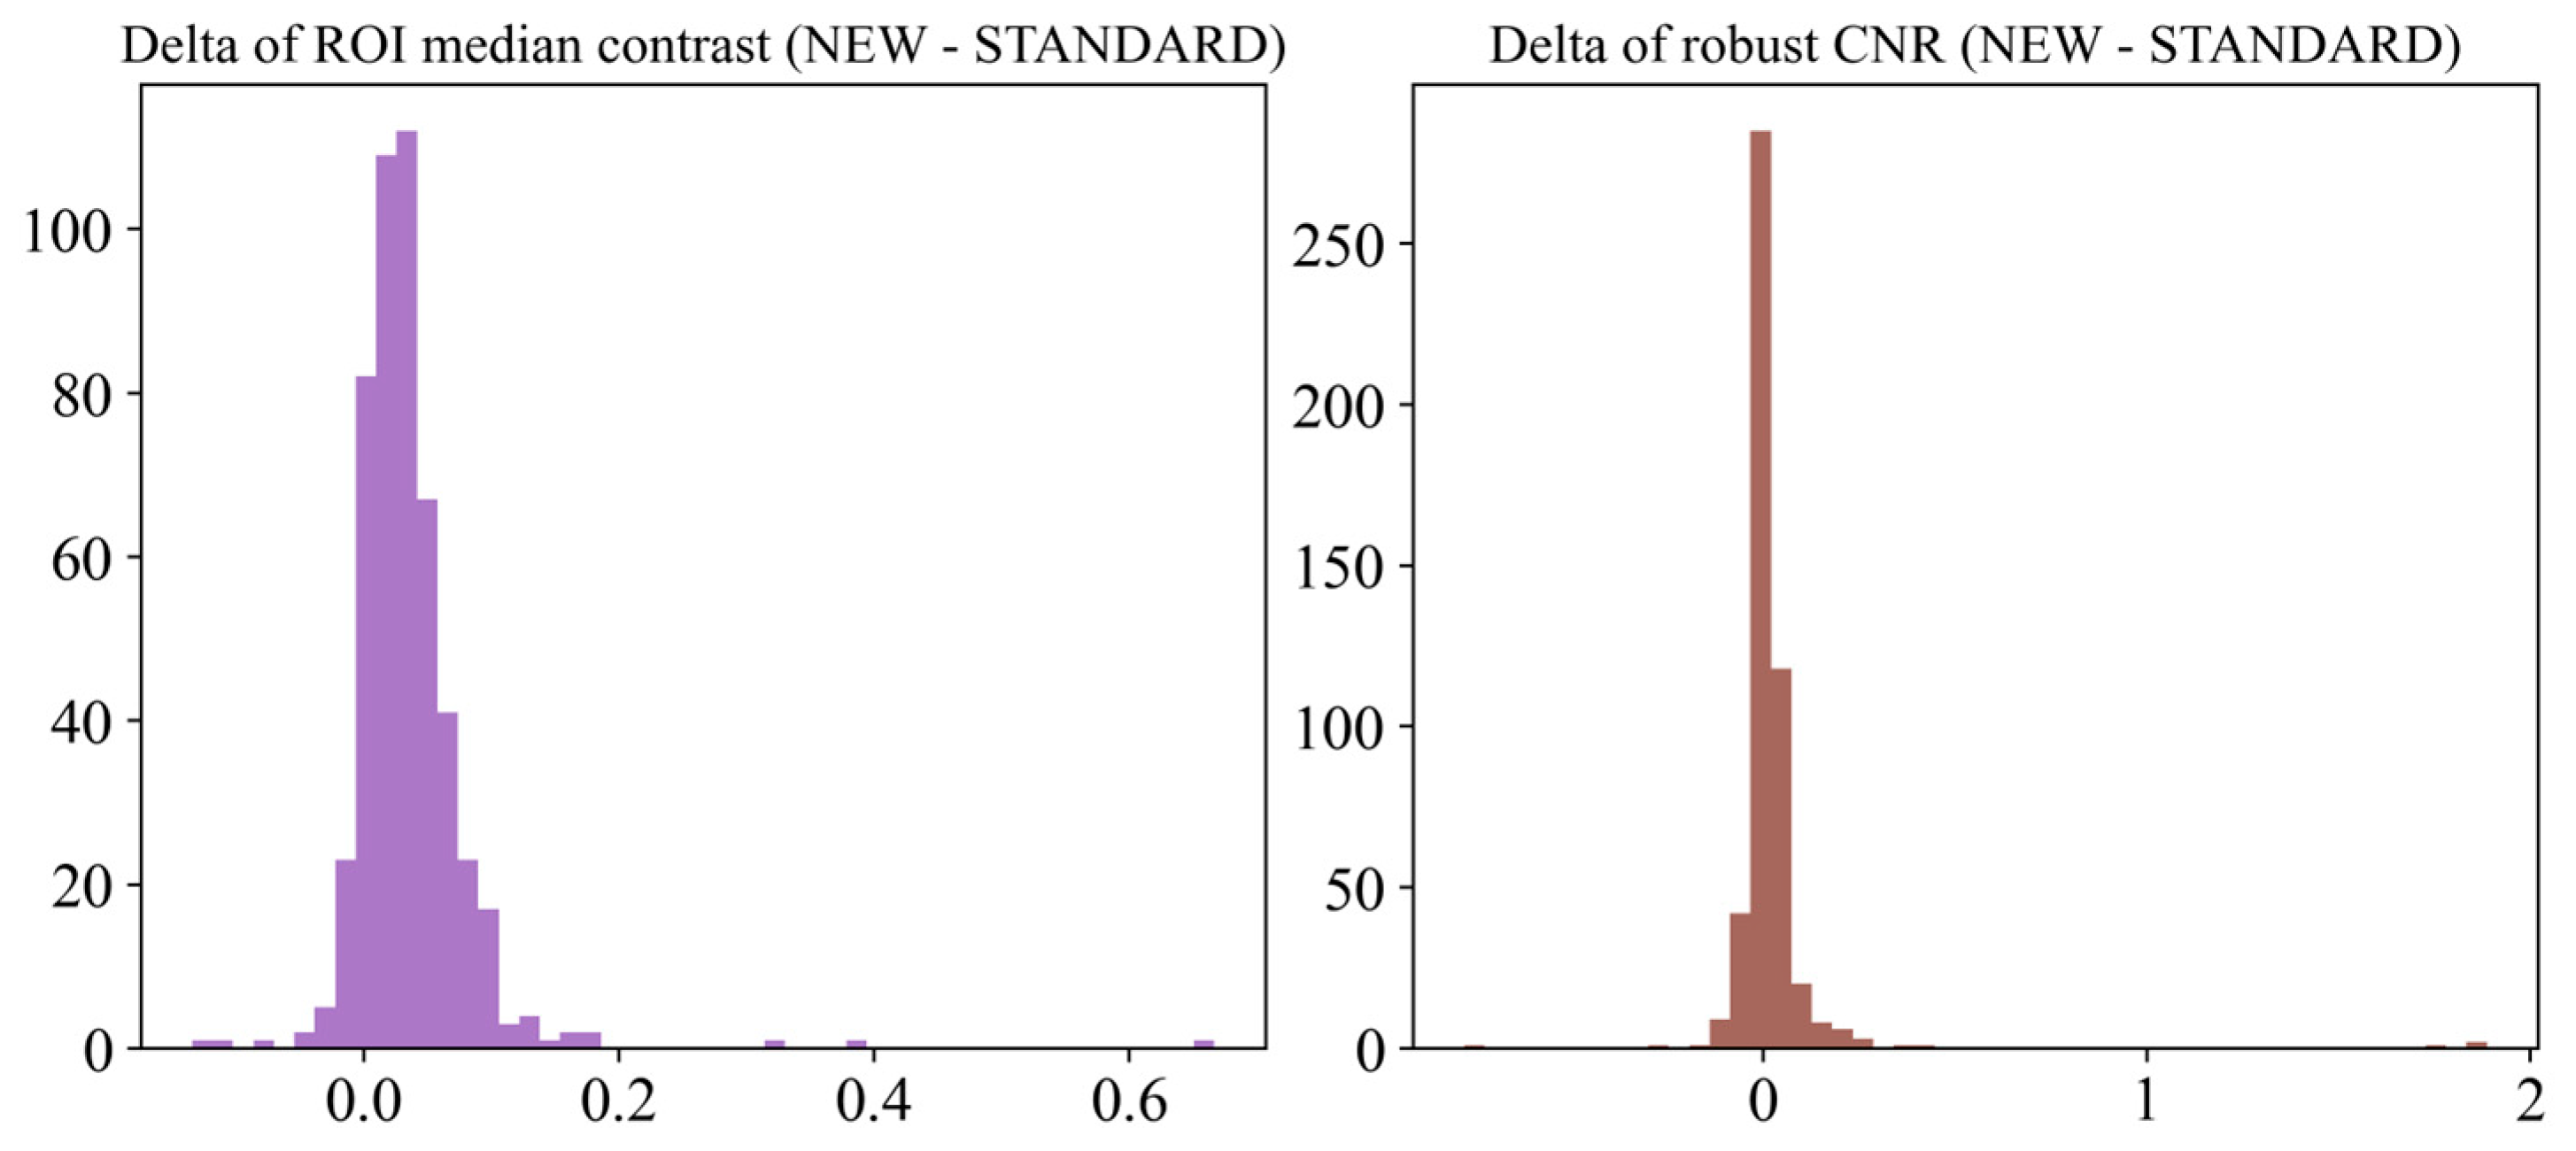
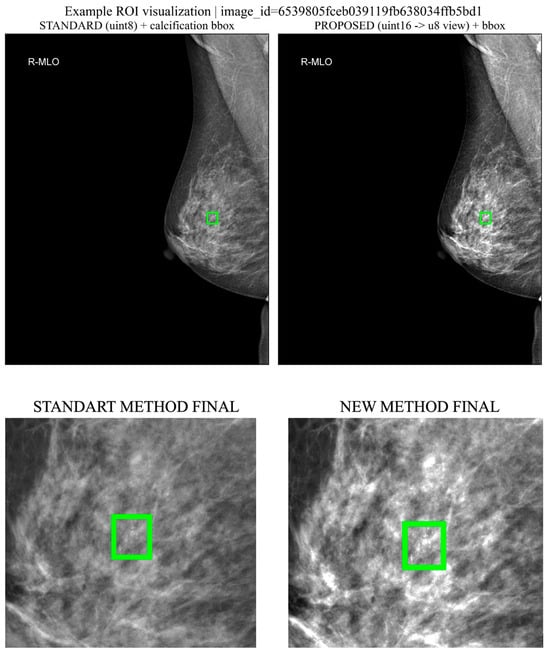
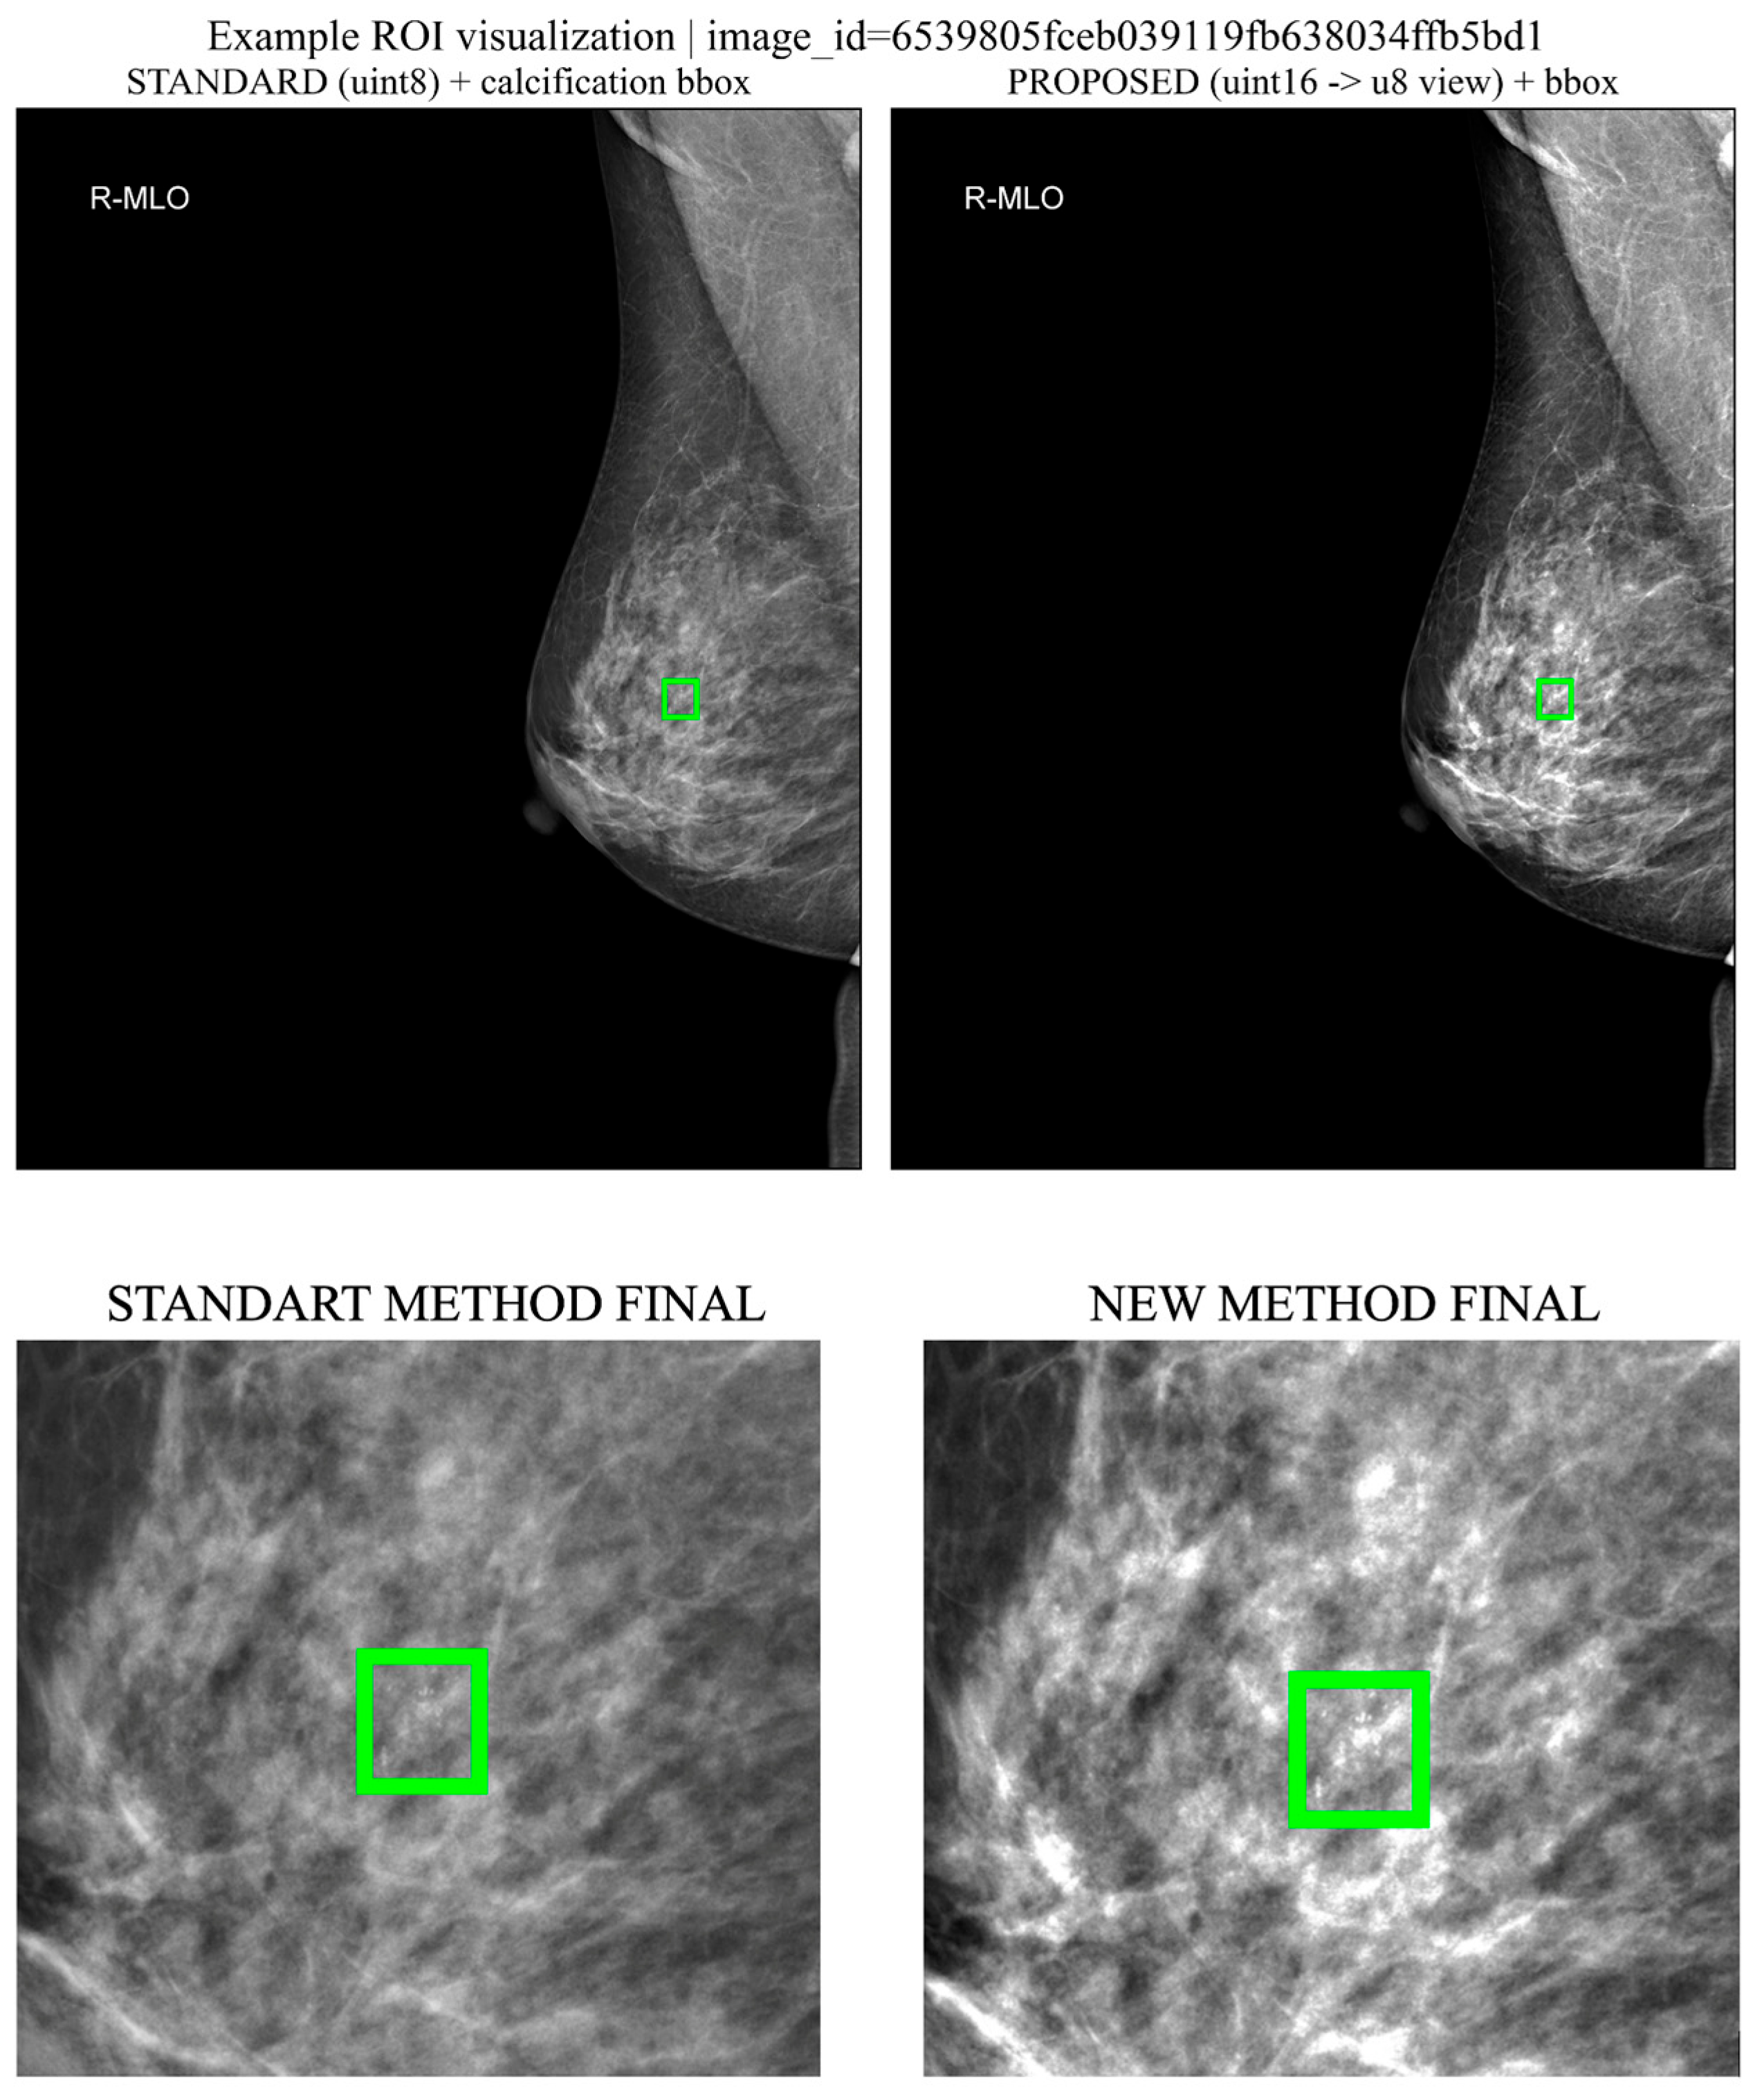
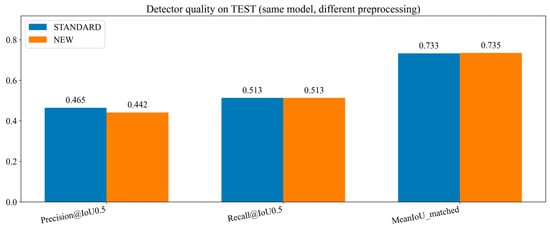
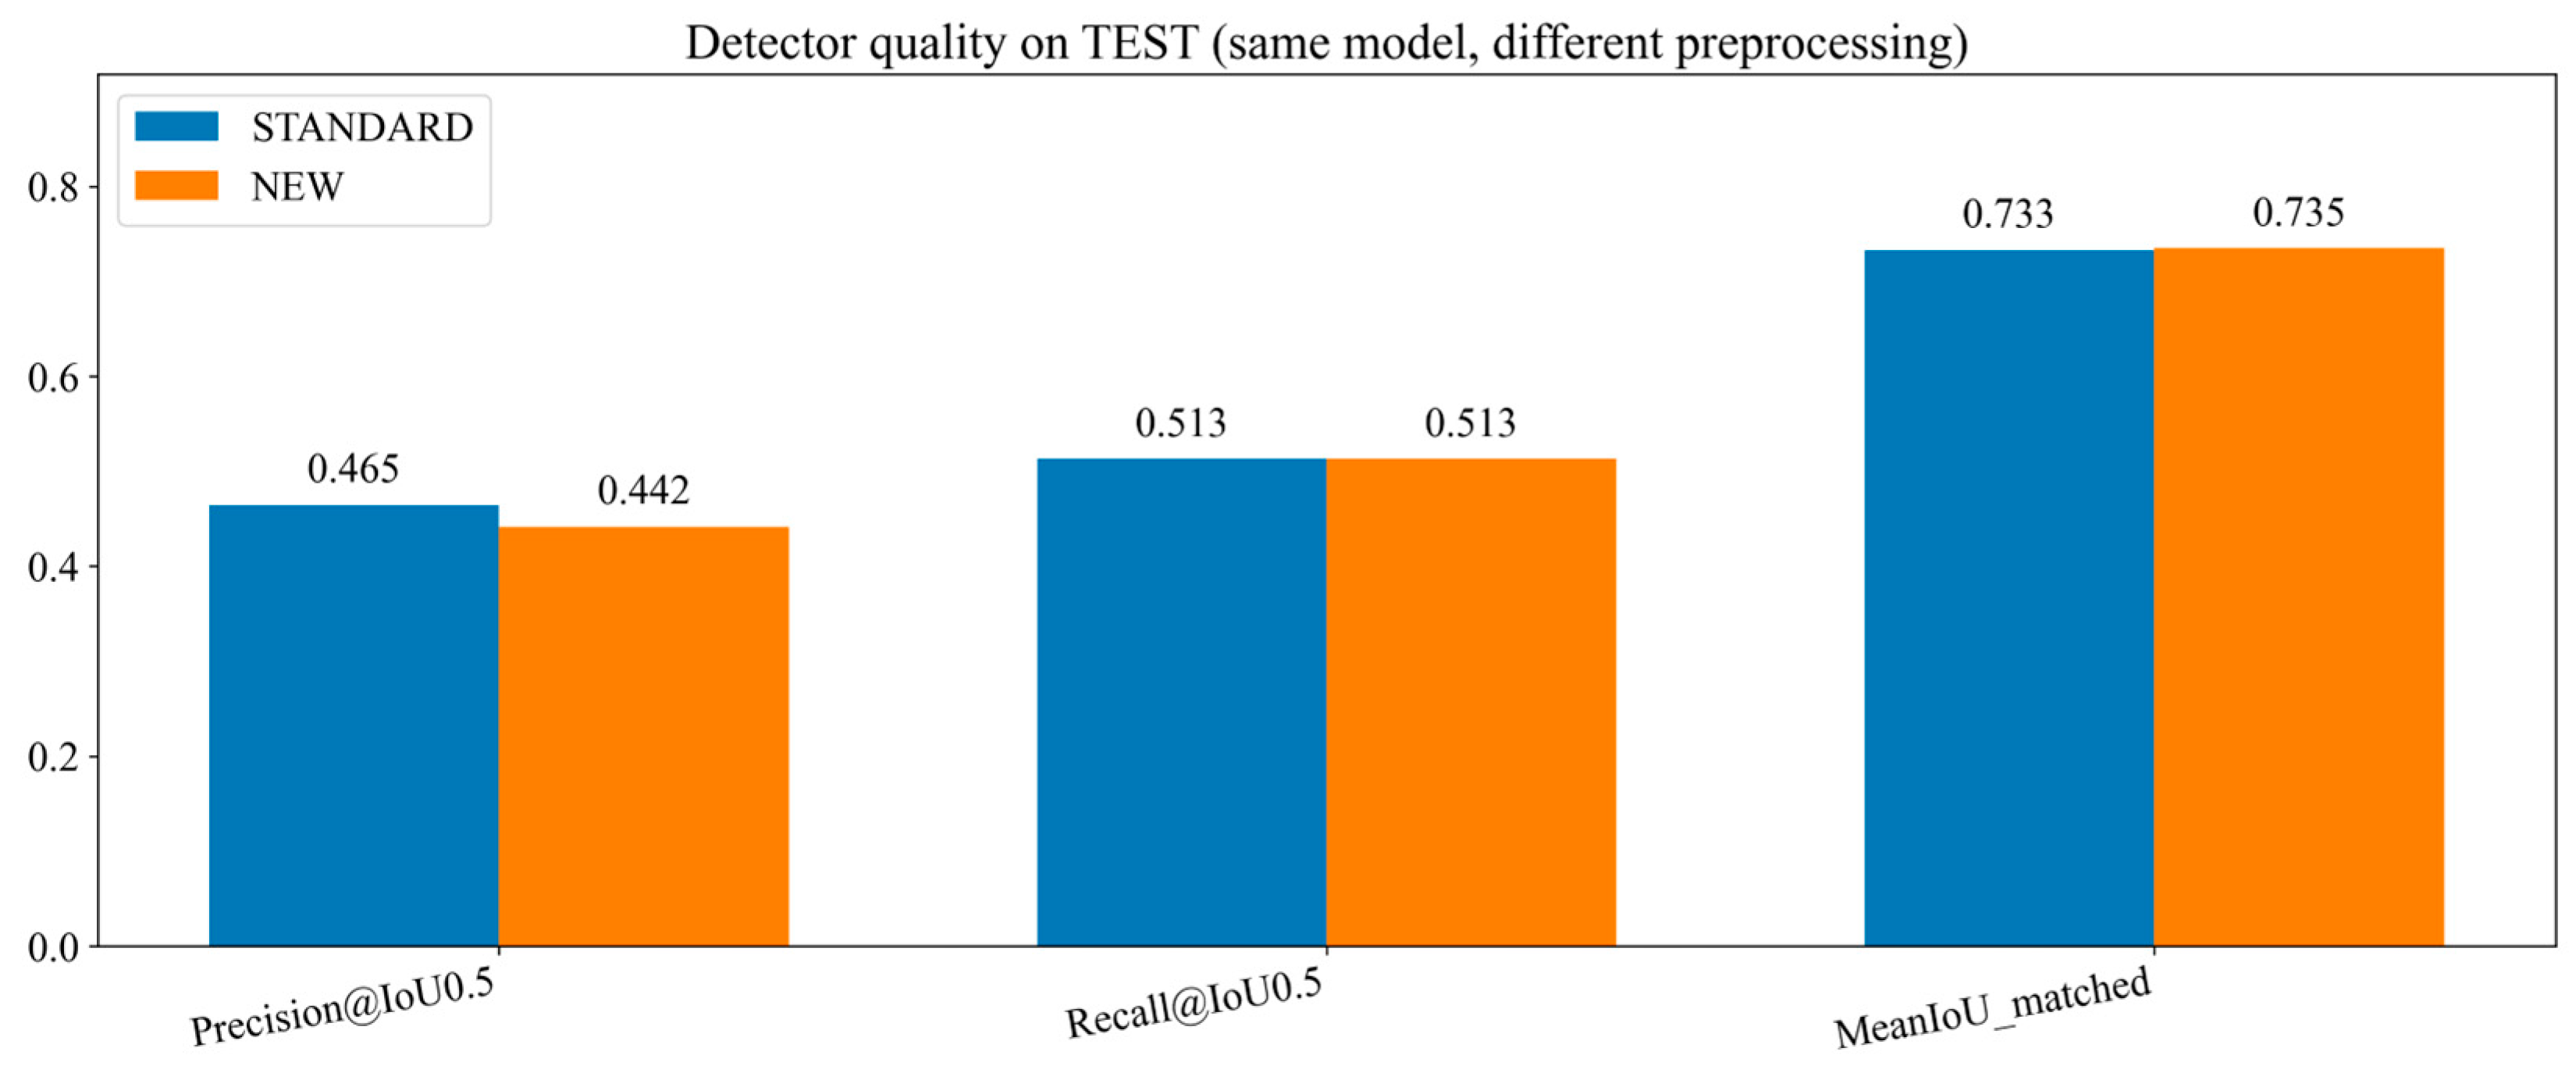
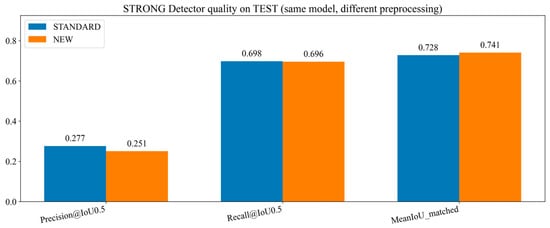
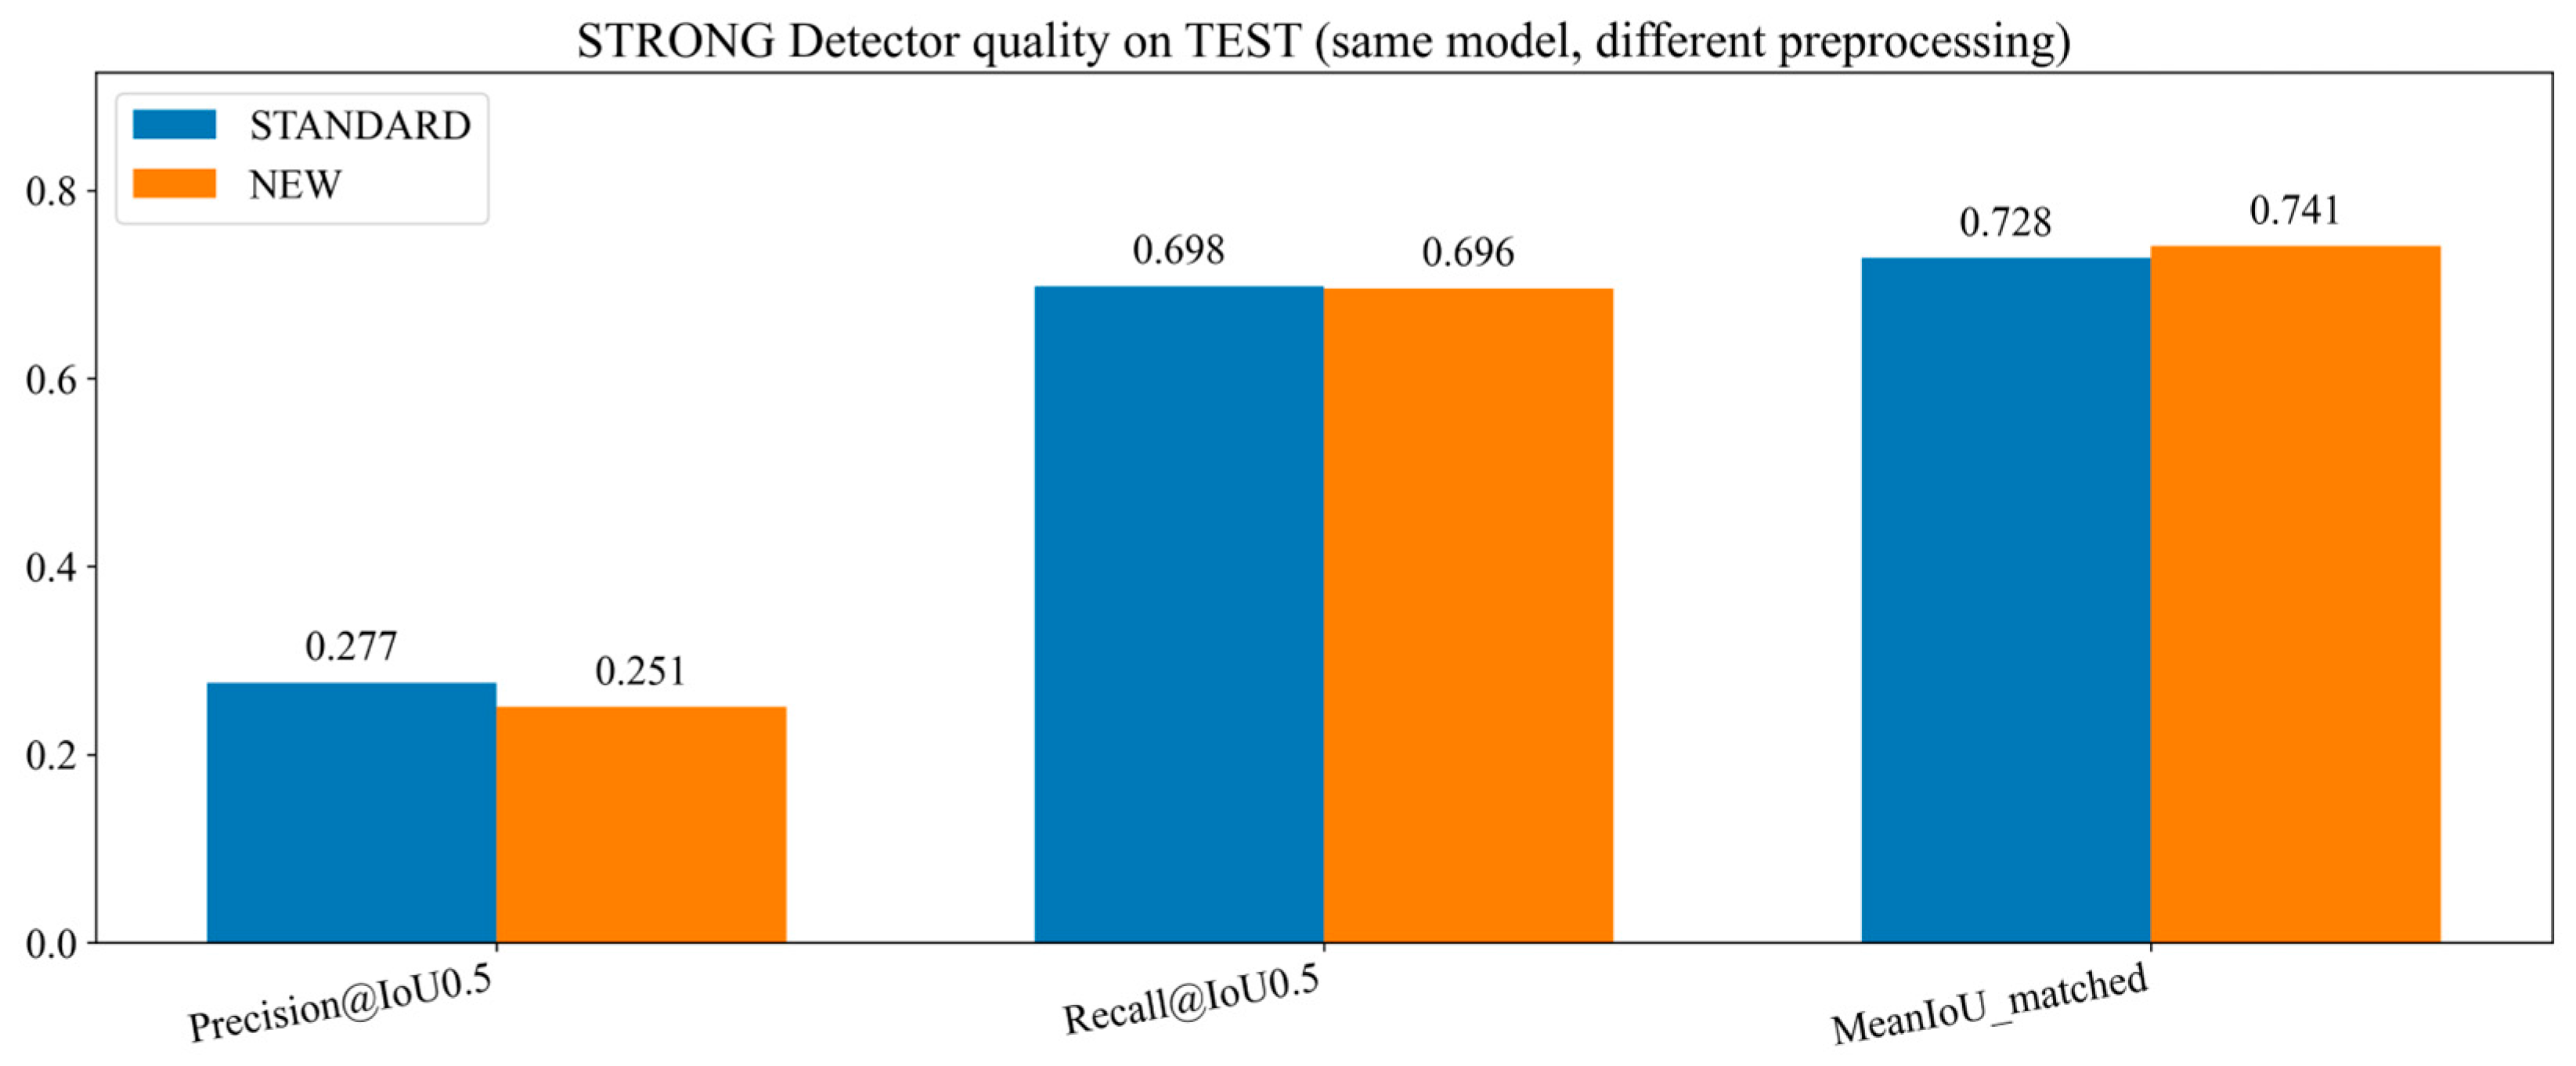
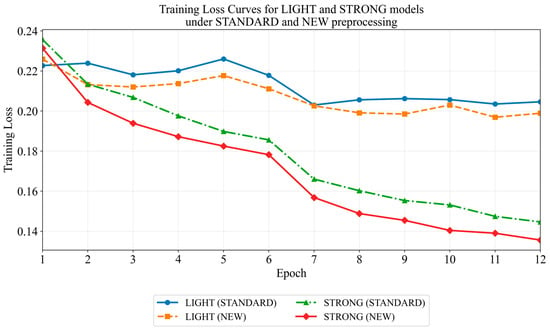
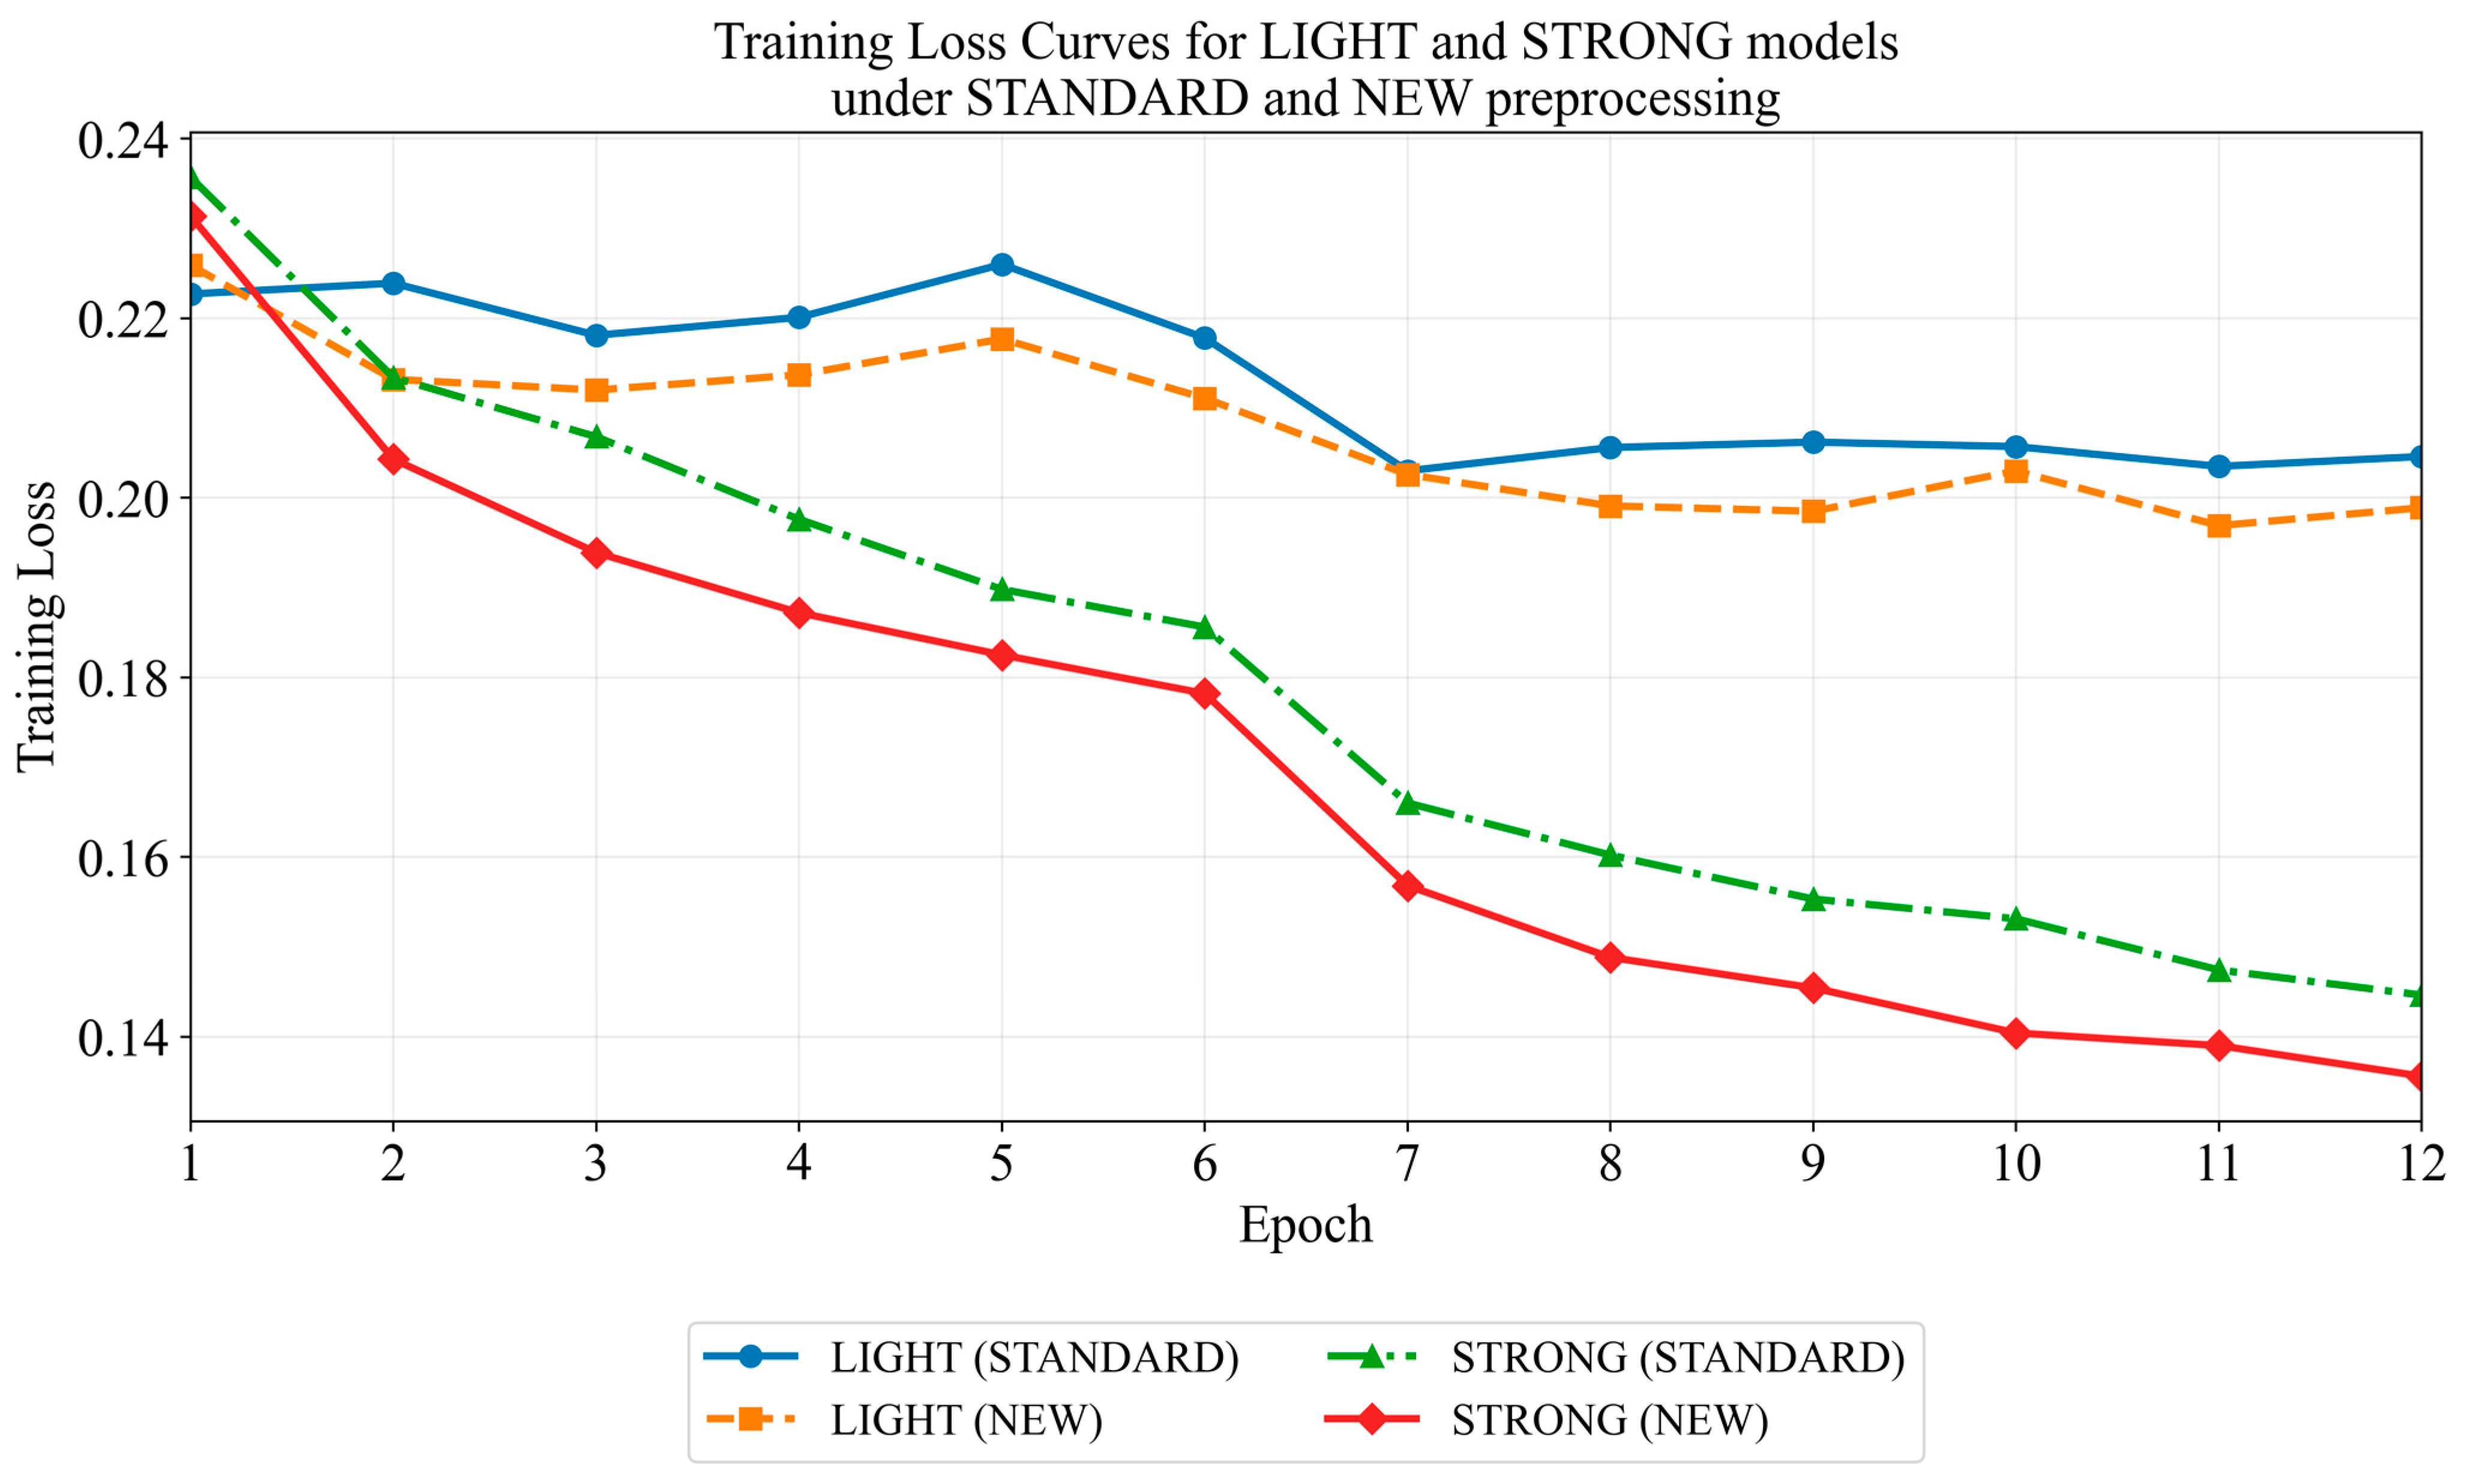

Disclaimer/Publisher’s Note: The statements, opinions and data contained in all publications are solely those of the individual author(s) and contributor(s) and not of MDPI and/or the editor(s). MDPI and/or the editor(s) disclaim responsibility for any injury to people or property resulting from any ideas, methods, instructions or products referred to in the content. |
© 2026 by the authors. Licensee MDPI, Basel, Switzerland. This article is an open access article distributed under the terms and conditions of the Creative Commons Attribution (CC BY) license.