


Abstract
The global transition towards sustainable and resilient energy systems has emphasized the need for efficient utilization of renewable energy sources (RESs) and rapid electrification of transportation. However, smart grids must address the intermittency of solar and wind power while accommodating the growing demand from electric vehicles (EVs). Hence, in this paper, a data-driven energy management system (EMS) is proposed that combines multivariable forecasting, generation scheduling, and EV charging coordination in a dual-level decentralized framework to increase the efficiency, reliability, and scalability of modern power grids. First, short-term forecasts of solar irradiance, wind speed, and load demand are addressed via five machine learning models ranging from nonlinear to ensemble models. Accordingly, a unified CatBoost-based platform for forecasting these three variables is selected because of its better performance and accuracy. These forecasts are subsequently utilized in a mixed-integer linear programming (MILP) framework for optimal generation scheduling in the considered network, fulfilling load demand at reduced electricity and emission costs while maintaining grid stability. Finally, a priority-based scheme is proposed for charging/discharging coordination of the aggregated EVs, minimizing demand variability while fulfilling vehicles’ charging needs and maintaining their batteries’ lifetime. The superiority of the proposed method lies in integrating a multivariable forecasting pipeline, linear MILP generation scheduling, and battery-health-aware V2G coordination in a unified decoupled framework, unlike many recent frontier works that treat these capabilities independently. Simulation results, under different scenarios, confirm that the proposed intelligent EMS can significantly reduce operational fluctuations, satisfy load and EV demands, optimize RES utilization, and support system cost-effectiveness, sustainability, and resilience.
1. Introduction
The enhancement of power grid efficiency, resilience, and sustainability through the integration of renewable energy sources (RESs) and e-mobility technologies into modern power networks is crucial. However, effective demand response analysis and advanced energy management strategies are needed to optimally coordinate generation and demand, improve system cost-effectiveness and decarbonization performance while maintaining reliability and stability [1,2].
Although the diversification of such energy sources helps stabilize supply, manage peak demand, and support the transition to a low-carbon future, renewables, such as solar and wind sources, suffer from intermittent performance, which may affect grid reliability [3,4]. Since power generation is highly dependent on weather conditions, accurate weather forecasting is essential [5,6]. This allows grid operators to anticipate the availability of these resources and optimize their operations in advance, which aids in planning generation schedules and ensuring grid stability [7]. Similarly, load forecasting anticipates electricity consumption at various periods, allowing for better alignment of supply and demand [8]. Hence, weather and load forecasts work together to guarantee the effective and dependable integration of variable renewable energy, which lowers curtailment, improves economic dispatch, and increases the energy system’s consistency [9].
Additionally, a key factor in the shift to a more resilient and sustainable energy system is the integration of EVs, with Vehicle-to-Grid (V2G) capabilities, into the grid [10,11,12]. In V2G technology, EVs act as mobile energy storage devices that can return stored energy to the grid. This can aid in supply and demand balance and smooth out fluctuations from intermittent RESs, in addition to providing frequency regulation and peak load shaving services [13]. In turn, grid resilience is enhanced, and economic benefits can be provided to EV owners through participation in energy markets [14]. Overall, V2G-supported EVs represent a key strategy for supporting the sustainable and decarbonized transportation industry.
Nevertheless, owing to the decentralization and fast dynamics of these systems, employing advanced EMSs in modern power grids is vital [15]. Real-time monitoring, demand–response analysis, optimal RES utilization, and coordinated EV charging and discharging schedules are all made possible by an effective EMS. By harmonizing the supply–demand balance and addressing renewables’ intermittency and significant demand shifts caused by EV charging, effective EMSs can transform the infrastructure of modern power grids to become more economical, resilient, sustainable, and efficient [16,17].
EMSs in smart grids are frequently categorized into rule-based, optimization-based, and learning-based methods according to the control methodology [18,19]. Rule-based techniques use logic and preestablished rules to regulate grid operations, whereas optimization-based methods apply mathematical optimization algorithms to find the most efficient solutions for complex energy management problems. On the other hand, learning-based solutions use machine learning (ML) and artificial intelligence (AI) to learn from large datasets to make increasingly intelligent decisions over time, predict patterns, and adapt to changing conditions.
In this paper, an efficient energy management framework, achieved at two hierarchical decentralized levels (grid operator level and EV aggregator level), is proposed for a grid network incorporating solar and wind sources as well as aggregated EVs. The proposed EMS combines ML-based forecasts, optimization-based scheduling, and priority-based EV charging coordination. In turn, it can significantly satisfy load demands, reduce operational fluctuations, optimize RES utilization, and support system cost-effectiveness and decarbonization. Notably, all these merits are realized at a decoupled frame, enhancing system sustainability, resilience, and scalability, with simple to moderate implementation complexity, making the proposed framework practical for real-world deployment. The contributions of the proposed EMS are highlighted as follows:
- Decentralized and decoupled control: Short-term forecast and generation scheduling are handled at the grid operator level, whereas EV charging/discharging is managed at the EV aggregator level, which enhances scalability, flexibility, privacy, and system reliability while enabling efficient coordination.
- Accurate forecast and efficient scheduling abilities without incurring a high computational burden: This is achieved by employing computationally efficient ML models for weather and load forecasts instead of the more complicated ANN-based approaches and applying an MILP-based optimization framework for generation scheduling and a priority-based strategy for EV charging coordination rather than metaheuristic control.
- Standardized multi-model forecasting framework: A common pipeline forecasting framework is developed for short-term forecasting of solar irradiance, wind speed, and load demand.
- MILP-based optimal generation scheduling: Forecast results are utilized in an MILP framework for optimal generation scheduling to optimize RES utilization, fulfill load demand, and reduce electricity cost while maintaining grid stability.
- Efficient priority-based coordination framework: A priority-based strategy is implemented to dynamically coordinate EV operation, fulfilling vehicle charging needs while benefiting from its discharging capability to minimize demand variability and increase grid consistency while maintaining EV battery health.
The structure of this paper is as follows: The introduction in Section 1 is followed by a literature review presenting a comprehensive overview of recent related studies in Section 2. Section 3 presents the proposed energy management framework at the two decentralized hierarchical levels (the grid operator level and EV aggregator level). The control methodology and simulation results of the former are analyzed in Section 4, while the control and results of the latter level are demonstrated in Section 5. Section 6 includes a discussion of the proposed work’s outcomes, contributions, and potential, while the last section presents the conclusions of this study.
2. Literature Review
A comprehensive comparative overview of recent related studies in the literature is reported in Table 1 [20,21,22,23,24,25,26,27,28,29,30,31,32,33]. The dominant application setting is a grid-connected EV charging station or microgrid coordinated with photovoltaic generation and may be extended with wind generation, stationary storage, and/or broader distribution system interactions. The energy management strategies applied in studies in the literature are typically designed to reduce operating costs and grid imports; increase RES utilization; mitigate grid-related operational impacts such as congestion, losses, or peak demand; and coordinate EV charging and/or achieve forecasts.
Table 1.
Comparison table for relevant work in literature.
For forecasting capability, forecasting is commonly used either to predict renewable availability or to predict demand, with techniques ranging from classical time series models (e.g., ARIMA/SARIMA) [26,31] to ML models [20,27,29] to complex ANN-based architectures [21,22,23,25,28,30,33]. On the other hand, the remaining studies did not involve forecast or prediction tasks [24,32].
Regarding the control scheme that achieves power scheduling and energy management, optimization techniques ranging in complexity from MILP-based scheduling [22,26] to more complex metaheuristics or learning-based control, with objectives centered on cost reduction, peak mitigation, improved renewable integration, and charging scheduling, are used. However, [27,28,31] did not involve optimization methods since they focused solely on a forecast function for the charging of the associated EVs.
Despite these advances, only a limited subset of papers explicitly considers the problem from a grid-operator perspective, where both supply-side (PV/wind) forecasting and demand-side forecasting are jointly needed for operational planning. Similarly, few studies introduce a unified classical forecasting approach capable of forecasting PV, wind, and load/EV demand within a single coherent framework; instead, most works focus on a single variable (PV or EV demand) or use separate models per variable. In addition, while peak shaving and valley filling are frequently discussed as desired outcomes, relatively few papers demonstrate load flattening via simple optimization that actively leverages EV batteries in both charging and discharging modes, with many others studying G2V-only (charging-focused) [22,24,27,28,29,31]. Additionally, SOH-aware control is often abandoned, and battery aging is neglected or only conceptually discussed, which limits the practical deployment of V2G strategies in real-world EV fleets. Moreover, most of the literature focuses on a centralized single-layer control level, which is carried out from either the grid side or the EVCS side, losing the merits of decentralized control. Additionally, some have applied ANN-based forecast techniques and/or metaheuristic optimization strategies, which may increase the computational burden and complicate EMS implementation.
To address these issues, this paper proposes an integrated, forecast-driven EMS for renewable-integrated grids with aggregated EV fleets. The proposed framework combines a unified ML-based forecasting model for solar irradiance, wind speed, and demand consumption with MILP-based generation scheduling to optimize renewable utilization and reduce the operational cost. In addition, a priority-based EV charging and discharging coordination strategy is developed to actively perform peak shaving and valley filling through V2G participation while considering the EV battery state of charge (SOC) and state of health (SOH) constraints, thus ensuring extended battery time operation. A hierarchical control architecture is implemented, integrating both grid-operator-level generation scheduling and EV-aggregator-level coordination. This decoupled dual-level control enhances system performance, enables scalability and realism, and improves applicability to large-scale EV fleets. Finally, the ML-based forecast along with the MILP optimization and priority-based coordination are considered to have moderate complexity with relatively fewer computations than the ANN-based forecast and metaheuristic optimization control.
3. Proposed Energy Management Framework
For the grid network shown in Figure 1, which incorporates RESs, EVs, and industrial and commercial loads, optimal energy management is required to leverage RES utilization and V2G capabilities, achieving the required economic, environmental, and technical objectives [34,35]. Thus, this study proposes an energy management framework that is divided into two hierarchical decentralized levels: (a) the grid operator level and (b) the EV aggregator level.
Figure 1.
Single-line diagram of the proposed test network.
At the grid operator level, three core tasks are performed. First, hour-ahead ML-based forecasting models are adopted for solar irradiance, wind speed, and load consumption via a unified machine learning framework. Second, the forecasted variables serve as essential inputs to the MILP-based generation scheduling stage, which determines the optimal energy mix from the grid, PV, and wind sources, such that the main goal is to minimize operating costs, ensure stable power balance, and achieve maximum utilization of available renewable resources while maintaining grid reliability. Third, load variation control minimization is carried out, in which upper and lower target power bands are set to regulate the demand profile.
At the EV aggregator level, managing the charging and discharging of EVs is the control focus through the adoption of a priority-based scheduling algorithm, according to the grid power limits obtained from the grid-operator-level stage. The aggregator manages EV fleets by dynamically switching between G2V and V2G modes on the basis of grid conditions, the EV battery SOC and SOH. This control layer contributes to minimizing the load variation through peak shaving and valley filling, thus ensuring a smoother consumption profile with a sustained EV battery lifetime. The simulation in this work is carried out via the MATLAB software platform. Weather and load datasets, covering solar irradiance, wind speed, and demand profiles, are obtained from [36]. The complete workflow of the proposed energy management framework is summarized in Table 2, where for each process stage, the control level, inputs, outputs, and underlying motivation are explicitly stated to ensure clarity and logical consistency. This is followed by demonstrating the respective flowchart of the proposed energy management system in Figure 2. This workflow is explained in detail in the following sections.
Table 2.
Stepwise workflow of the proposed energy management methodology.
Figure 2.
Flowchart of the proposed energy management methodology.
It is worth noting that in this work, the underlying grid infrastructure is assumed to satisfy standard planning and protection requirements and operates within acceptable technical limits such as permissible bus voltage magnitude deviations, feeder and transformer thermal loading limits, protection coordination constraints, and power quality standards for frequency stability and voltage unbalance thresholds. Under this assumption, the proposed framework focuses on operational energy management decisions—namely forecast-driven generation scheduling and coordinated EV charging/discharging—while considering that network adequacy has been ensured at the planning stage [37,38]. This assumption is consistent with many system-level energy management and economic dispatch studies, where infrastructure constraints are addressed through network design, reinforcement planning, and protection schemes, whereas operational scheduling strategies are evaluated at an aggregated level. Therefore, the objective is to evaluate the effectiveness of hierarchical forecast-driven scheduling and EV coordination strategies at the energy management level rather than to perform detailed distribution network feasibility assessment.
4. Control and Simulation Results at the Grid Operator Level
In this section, the control proposed at the grid operator level is discussed in detail, followed by the implementation of the corresponding simulation and the demonstration of the simulation results. As mentioned earlier, a two-level decentralized control approach is carried out in this work, where each level functions independently while benefiting from coordinated information exchange [39].
4.1. Grid-Operator-Level Control
This control layer is performed on the medium-voltage (MV) main bus and is responsible for ensuring stable, economical, and reliable utility operation of the renewable energy integrated grid by forecasting resources and load, generating scheduling, and minimizing load deviation. First, the grid operator uses a unified forecasting framework to generate hour-ahead predictions of solar irradiance, wind speed, and load demand. These forecasts are then used as direct inputs to the MILP-based generation scheduling stage, where the operator determines the optimal power contributions from the PV, wind, and utility grids while fulfilling capacity constraints, RES penetration limits, and economic dispatch requirements. In parallel, the grid operator implements load deviation control by defining upper and lower target power bands that represent acceptable operating limits for demand fulfillment, peak shaving, and valley filling. The instantaneous net grid demand is continuously compared against these thresholds, and the resulting deviation triggers one of three operating modes: valley filling, demand fulfillment, or peak shaving. Through this hierarchical decision-making structure, the grid operator establishes real-time power limits and operating conditions that guide the second control layer at the EV aggregator level.
4.1.1. Weather and Demand Forecast
Since solar irradiance, wind speed, and electricity demand are highly weather dependent, any variations in meteorological conditions directly affect RES power generation as well as electrical load consumption behavior. Therefore, adopting a single, unified forecasting framework that can learn the temporal and contextual relationships among these variables substantially enhances scheduling efficiency, reduces computational complexity, and ensures coordinated decision-making across the entire energy management system.
In this section, short-term forecasts of solar irradiance, wind speed, and load are carried out for hour-ahead forecasting. Five ML algorithms are evaluated—SVR, DT, RF, XGBoost, and CatBoost—three of which are ensemble-based models, to find the best model in terms of accuracy and the lowest number of errors. These values are then used for the prediction of the wind turbine output power, solar power, and electricity load consumption. The forecasting framework used in this work involves several stages, including data collection and preprocessing, ML model building, hyperparameter tuning and cross-validation, and finally evaluating model performance. All the data were split into 80% for training the five ML models and 20% for testing and validating the models’ performance. To assess the predictive accuracy of the adopted models, four evaluation metrics—the mean absolute error (MAE), root mean squared error (RMSE), mean absolute percentage error (MAPE), and co-efficient of determination (R2)—are used. These metrics provide a comprehensive view of how well each model performs in terms of error reduction, data variability capture, and overall fit the observed data. These metrics are given in (1)–(4):
where is the mean observed values, is the actual observed value, is the predicted value, and is the total number of predictions.
4.1.2. Generation Scheduling
After adopting a unified ML model for predicting hourly irradiance, wind, and load consumption via CatBoost from Section 4.1.1, these values are then utilized as inputs for generation scheduling and power management within the renewable-integrated system. The predicted values of solar irradiance and wind speed generated are directly applied to estimate the corresponding RES outputs and assess the ability of these sources to meet the forecasted load demand. In this way, effective scheduling will take place on the basis of accurate hour-ahead RES availability, thus ensuring successful coordination between renewable-based generation sources, grid supply, and load consumption rather than reactive measurements.
The wind power generation can be determined via Equation (5) as follows:
where denotes the power generated by the wind turbines at time , is the air density, is the wind speed at the rotor hub, is the total blade area, is the turbine’s power coefficient, and the turbine efficiency is denoted by .
Similarly, PV power generation, , is determined via Equation (6) as follows:
where A is the total solar panel area, r is the solar panel yield coefficient, is the solar irradiance, and represents the performance ratio.
For efficient wind power generation, a minimum wind speed of 5 m/s is necessary, which aligns with the cut-in speed required for electrical power production by wind turbines. Furthermore, to prevent potential turbine damage from elevated wind speeds, the wind velocity must not exceed 12 m/s for cut-off operation [40]. Similarly, the minimum irradiance must be no less than 100 W/m2 to provide sufficient power generation [41].
To achieve optimal power scheduling, an economic dispatch model is developed that employs MILP, where the objective function is to minimize the operation cost with system constraints. The system constraints include generation capacities and power constraints. Additionally, owing to the intermittent nature of the PV and wind generating units, a maximum of 30% for RES penetration is set as a technical constraint for stable power system operation [42,43]. The 30% RES penetration level is imposed as a technical operational constraint based on system-level integration studies identifying the 30–40% range as a critical transition region for frequency stability and inertia-related challenges [44]. Therefore, a conservative 30% limit is adopted to ensure stable operation within the proposed framework, while higher penetration levels and the associated large-scale stability challenges are beyond the scope of this study.
For generation scheduling, the system’s objective function representing the total short-term generation dispatch cost can be represented as follows (7):
Given that is the total short-term operational energy cost, for any time, , , and are the powers delivered from the wind, PV, and grid, respectively. represents unit energy purchasing price from the grid, while and represent the unit operational energy costs of wind and PV generation, respectively. The technical equality and nonequality constraints for generation limits and power balance can be represented as follows (8)–(13):
To model the on/off operational status of generation units, binary commitment variables are introduced for the grid, wind, and PV sources:
where a value of 1 represents the committed (ON) state of the corresponding generation unit at time , and a value of 0 represents the non-operational state, which occurs when solar irradiance or wind speed levels are inadequate to support generation. The generation capacity constraints are formulated as follows (9)–(12):
where denotes the required load consumption. , , and are the corresponding maximum power limits of the grid, wind, and PV, respectively, whereas , , and correspond to their respective minimum power limits.
The cost of utility grid generation can vary significantly on the basis of several factors, including geographic location, fuel price fluctuations, and market supply–demand dynamics [45]. In this study, the electricity purchasing price from the main grid was assumed to range between $0.08 and $0.20 per kilowatt-hour (kWh), $0.03 to $0.10 per kWh for PV systems, and $0.03 to $0.08 per kWh for wind energy [46].
4.1.3. Demand Deviation Control
The main goal of the grid-level optimization stage is to minimize the grid demand deviation, as described by (13) and (14).
where is the optimized power grid loading; is the target loading; is the grid loading; reflects the system losses, including those of the transformer and cables; and is the total charging/discharging power of the EV. The grid targets for both minimum and maximum operation are set to a fixed typical daily load range, where the minimum target, , is set to approximately 1.05–1.15 times the minimum daily load for valley filling, whereas the maximum target, , is set to approximately 0.80–0.90 times the peak daily load for peak shaving and demand fulfillment.
At this level, the grid operator determines the current grid load by comparing the instantaneous load with the predetermined target load band, and accordingly, the algorithm enters into one of three appropriate operating modes, which are valley filling, peak demand shaving, or demand fulfillment. In the demand fulfillment mode, the total grid load lies within the predefined target band; therefore, no corrective action is needed. However, when the grid load drops below the minimum target limit, , the system activates the valley filling mode, where all connected EVs are charged via the G2V mode of operation. Conversely, peak shaving mode is activated when the grid load exceeds the maximum target limit, , set by the grid operator to decrease grid stress. In this situation, EVs help relieve the overloaded grid by discharging energy back into the system via the V2G mode of operation. Moreover, EVs with an SOC above 55% are permitted to discharge during peak shaving, whereas those below this threshold continue to charge to protect battery health and ensure reliable participation.
4.2. Grid-Operator-Level Simulation Results
At the grid operator level, two main functions are carried out:
- Irradiance, wind, and load short-term forecasts using five different ML models to select the one which offers consistent forecast accuracy among the three forecasted variables. Thus, a unified multivariable forecast platform is achieved
- Generation scheduling to minimize the system’s energy cost, under four distinct scenarios (grid only, grid with PV and wind, grid with PV only, grid with wind only)
4.2.1. Weather and Demand Forecast Results
As mentioned earlier, the first function of the grid operator is to accurately forecast solar irradiance, wind speed, and load demand to support generation scheduling and grid stability. Historical weather and load data were used as the primary input sources for model development, and simulations were carried out via ML libraries to construct, train, and evaluate the forecasting models. These forecasts enable the grid operator to anticipate renewable availability and demand patterns with sufficient accuracy for real-time operational decisions while using a unified, consistent, and computationally efficient predictive framework. The forecasting framework in this study comprises a data preprocessing stage, feature engineering, scaling and transformation, and finally model training and optimization. First, the historical datasets for irradiance, wind speed, and load demand are collected, followed by the preprocessing phase, where all missing and zero values were addressed through interpolation methods to improve data quality. In the feature engineering phase, diurnal cycles, short-term trend smoothing, and temporal relationships were included for wind and irradiance forecasting, whereas time and lag features were added for load forecasting to account for periodic consumption patterns. Afterwards, the dataset was scaled and transformed to improve generalization and avoid biasing during model training. Lastly, the dataset was split into training and testing sets with an 80:20 ratio, and hyperparameter optimization was conducted using GridSearchCV with 10-fold cross-validation to determine the best-suited model parameters. The hyperparameters for the three forecasted variables are provided in Table 3.
Table 3.
Hyper-tuned parameters for irradiance, wind, and load.
Table 4 shows the performance metric parameters of the five tested ML algorithms for predicting irradiance, wind speed, and demand load. Although the five tested models clearly differ in their predictive accuracy across irradiance, wind speed, and load forecasting, all five models have high determination coefficients, with R2 performance values of 0.95 and higher across all the cases, except for RF. For irradiance prediction, CatBoost achieves the lowest error with an MAE score of 12.30, an RMSE of 21.83, and an MAPE of 0.20%, followed by the DT model which scored 13.94 for MAE and 30.50 for RMSE, while SVR shows higher errors with an MAE of 21.3, an RMSE of 33.14, and an MAPE of 44.4%. In wind speed forecasting, SVR achieved an MAE of 0.23 and an RMSE of 0.35, whereas RF recorded the highest errors with an RMSE of 0.51 and an MAPE of 13.46%. For load demand prediction, SVR and DT achieved MAE values of 330 and 341.40, and MAPE of 0.97% and 0.01%, respectively, while XGBoost exhibited higher errors of MAE = 839.66, RMSE = 1093.62, and an MAPE of 0.03%. Conclusively, it is clear from the error performance and accuracies that CatBoost demonstrates the most consistent performance across all three variables, maintaining an R2 score higher than 0.95 and balanced error values, and is therefore selected for the proposed framework.
Table 4.
Irradiance, wind speed and load performance metrics.
Additionally, Figure 3 provides a visual comparison of actual versus predicted values showing the performance of the CatBoost model for irradiance in Figure 3a, wind in Figure 3b, and load in Figure 3c during a day in July. The plotted curves indicate that CatBoost can effectively capture all data trends as well as temporal variations across the three parameters, with minor observed deviations.
Figure 3.
Actual and predicted values (a) irradiance, (b) wind speed, (c) load.
4.2.2. Generation Scheduling Results
After the forecasting stage is concluded, the next step involves performing generation scheduling. To test the effectiveness of the energy management approach in reducing the system’s energy cost, four distinct scenarios are analyzed for a comparative assessment of system performance with and without renewable integration as follows:
- Scenario I is a base case in which cost minimization is achieved by utilizing forecasted data for load demand when all power is obtained from the utility grid (no renewables integration).
- Scenario II represents an energy mix scenario with full renewable energy (PV and wind) integration to the utility where cost reduction is examined when utilizing forecasted data for PV, wind, and load demand. In this scenario, the power is optimally shared among all sources, verifying the cost-effectiveness of renewables integration.
- Scenario III represents cost minimization when power is received from the utility integrated with PV only. This scenario represents a stress-test condition, where only one renewable resource is available alongside the grid. It is designed to evaluate the system’s capability to maintain stable and economical operation under limited renewable integration, particularly during periods of wind absence and variability in solar generation.
- Scenario IV represents cost minimization when power is received from the utility integrated with wind only. Similar to Scenario III, this configuration represents an extreme operating case intended to test the robustness and adaptability of the proposed energy management strategy when the system relies on a single intermittent renewable source combined with grid support (in case of PV power absence and variability in wind speed).
These scenarios enable comparison and evaluation of the system’s scheduling flexibility and cost reduction attribution across four distinct operating scenarios: a benchmark case in the absence of RES, a combined and fully integrated RES case, a solar-grid-dominant configuration, and a wind-grid-dominant configuration. Additionally, for each of these scenarios, two representative days in January and July were selected to capture realistic variations in operating conditions and provide comparative analysis, i.e., winter and summer, thus reflecting the differences in RES availability and load behavior across various operating conditions. Consequently, a total of eight simulation cases (4 scenarios × 2 seasonal operating conditions) were evaluated, ensuring a broader and more robust assessment of the proposed framework.
This selection was based on the seasonal distribution of load demand and renewable resource availability as indicated by Figure 4 and Figure 5, showing the statistical distribution and monthly averages of demand, irradiance, and wind, respectively. These figures demonstrate that these two months represent distinct and extreme operating conditions in terms of demand and renewable resource availability.
Figure 4.
Statistical distribution: (a) load, (b) irradiance, and (c) wind speed.
Figure 5.
Monthly averages: (a) load, (b) irradiance, and (c) wind speed.
Referring to Figure 4 and Figure 5, July exhibits the highest annual average load of nearly 3.7 × 10⁴ kW, with peak demand values reaching 5.6 × 10⁴ kW. The load distribution also shows wider interquartile ranges compared to most other months. From the renewable resource’s perspective, July corresponds to peak solar availability with a mean irradiance value of 265–270 W/m2, while at the same time presenting the lowest annual average wind speeds of 2.9 m/s. This creates a high-demand, high-solar, wind-limited operating condition with also pressing demands of increasing grid dependency during non-solar hours and making scheduling coordination more challenging.
The selection of January, on the other hand, is based on the fact that it represents the upper-bound winter demand profile, with an average load of approximately 3.4 × 10⁴ kW and peak values reaching 5.0 × 10⁴ kW. Compared to transitional months, January exhibits higher variability and stronger evening demand peaks, thus representing a winter operational stress condition. January, in contrast, is characterized by lower mean solar irradiance ~80 W/m2, thus reflecting a low PV output scenario. However, wind speeds are considerably higher, creating a more wind-supported scenario. This combination allows evaluation of the framework under high-winter-demand, low-solar, and wind-enhanced conditions. Conclusively, the selection of these two months provides a robust test of the system’s operational flexibility under contrasting seasonal conditions.
Figure 6 shows the generation scheduling for Scenario I, where the load demand is completely dependent on the utility grid and acts as the base case. The results in Figure 6a represent the power demand profile in January, where the power demand remains relatively high throughout the day, with the total grid dependence of power ranging between 37,000 and 42,000 kW. Additionally, peak demand is exhibited at approximately 09:00–10:00 h in the morning and in the evening between 19:00 and 21:00 h. In contrast, Figure 6b for July shows consumption ranging from 28,000 kW in the early hours to 43,000 kW at midday. Finally, Figure 6c compares the hourly generation cost variations between January and July. Notably, January’s operational costs are generally 10–15% greater than those in July, which is due mainly to increased power demand during peak daytime hours. This cost variation corresponds to a daily generation cost of $166,992.29 in July compared with $196,807.00 in January, as demonstrated in Figure 6d.
Figure 6.
Scenario I results: (a) January scheduling, (b) July scheduling, (c) cost in Jan and July, and (d) accumulative daily cost.
The results of Scenario II are depicted in Figure 7, where the load demand is shared between all available generating resources, including PV, wind, and grid. In Figure 7a, the January results show that renewable energy sources contribute partially to the total power supply, mainly during midday hours when solar irradiance levels are highest. Although the grid remains the primary contributor due to the penetration level constraint and supply between 35,000 and 40,000 kW, the total absence of wind and PV accounts for an energy share of the total power mix. This is because the wind speed on that day is below the cut-in speed; thus, the wind turbines are not operating. In contrast, the energy mix in Figure 7b for July demonstrates a greater contribution from renewables, particularly from PV units, reaching a maximum output at approximately 12:00–16:00 h due to stronger solar intensity. Again, in July, the grid contributes the majority, followed by PV, then wind, and consequently, the grid dependency is reduced compared with that in January. For the hourly cost, Figure 7c compares both months, indicating that January’s total energy cost remains higher because of greater overall demand and greater utilization of grid power during late-day peak hours. Finally, Figure 7d presents the cumulative daily cost for both periods, showing a total operating cost of $159,165.33 in July compared with $190,805.90 in January.
Figure 7.
Scenario II results: (a) January load scheduling, (b) July scheduling, (c) cost in Jan and July, and (d) accumulative daily cost.
Scenario III results are illustrated in Figure 8, where a PV-grid configuration is tested, without any contribution from the wind source. In this scenario, the grid continues to be the principal source of power, supplemented by PV power during daylight hours based on solar availability. For January, as depicted in Figure 8a, the PV plant output is restricted to hours between 9:00 and 16:00 because of lower solar irradiance during winter months. The maximum PV output reaches approximately 4348.72 kW at hour 13:00. The total PV energy contribution is 24,425.81 kWh, nearly half of the July value, while grid dependency increases to 959,609.20 kWh. Consequently, the total daily operating cost increases to $192,996.57, mainly because of increased grid power demand during late-day peak hours, where demand exceeds 44,000 kW. In contrast, in Figure 8b, July’s PV generation is observed between hours 7:00–18:00, with a maximum output of approximately 6839.84 kW at hour 14, higher than January peak. During this period, the PV plant partially mitigates grid power demand, lowering grid demand from values exceeding 39,000–41,000 kW to lower levels. The total daily PV energy contribution reaches 48,760.18 kWh, while the grid supplies 786,201.30 kWh. Consequently, the total daily operating cost for July is $159,385.71, showing promising cost savings during peak solar hours. Comparatively, July achieves a cost reduction of $33,610.86 relative to January, representing approximately a 17.4% lower operating cost owing to stronger solar availability. Figure 8c,d show the hourly and cumulative cost for both months.
Figure 8.
Scenario III results: (a) January scheduling, (b) July scheduling, (c) cost in Jan and July, and (d) accumulative daily cost.
Finally, the results of Scenario IV in Figure 9 illustrate the operational performance of wind-supported grid scheduling under winter and summer conditions. For January, as depicted in Figure 9a, wind generation is available for the entire day, where the seasonal wind ranges from approximately 99.16 kW to a maximum of 1142.24 kW at 9:00. The total daily wind energy contribution in this month reaches 13,606.70 kWh, while the grid supplies 970,428.30 kWh. This condition reflects the modest magnitude contribution of wind relative to total demand, which frequently exceeds 40,000–44,000 kW during evening peak hours between 19:00 and 21:00. In contrast, for July, as shown in Figure 9b, wind contribution is significantly lower and limited to between the hours of 10:00 and 18:00, with a maximum output of approximately 210.95 kW at hour 16:00. The total daily wind energy contribution is only 1368.83 kWh, nearly one-tenth of the January value. This grid dependency is still dominant at 833,592.65 kWh, covering almost the entire required demand of 834,961.48 kWh. As depicted in Figure 9c, January records a higher hourly energy cost, especially during the evening peak hours between 19:00 and 21:00, where values exceed $8850 per hour. On the contrary, July records relatively lower hourly costs, especially during the peak hours, where values are below $8350. As a result, the cumulative cost of operating the grid in January is $194,616.32, compared to $166,771.91 in July, yielding a cost difference of approximately $27,844.41, as depicted in Figure 9d.
Figure 9.
Scenario IV results: (a) January scheduling, (b) July scheduling, (c) cost in Jan and July, and (d) accumulative daily cost.
Figure 10 shows the daily operational energy cost comparison for the four tested scenarios in January and July. As expected, in both January and July, Scenario II, which integrates all the renewable resources, has the lowest operational energy cost, thus confirming the fact that the integration of all the renewable resources has the most significant economic advantage compared to the others, considering the 30% technical constraint. As expected, the operational energy cost in January is lower than in July, and in January, the operational energy cost reduces from $196,807, as in Scenario I, to $190,805.90, while in July, the operational energy cost reduces from $166,992.30, as in Scenario I, to $159,165.33. Scenario III, which integrates the PV and grid resources, has the second-best economic advantage in July, while Scenario IV, which integrates the wind and grid resources, has a relatively better economic advantage in January, considering the high wind speed in January. As expected, in both January and July, the grid-only scenario has the highest operational energy cost, thus confirming the fact that the integration of renewable resources has a significant economic advantage compared to the grid-only scenario.
Figure 10.
Operational cost comparison of the four tested scenarios: (a) January and (b) July.
Following the generation scheduling stage via grid-level control, the net load demand for January and July is shown in Figure 11a,b, respectively, after the contributions of solar and wind power generation units are subtracted, if any. The net load will then serve as the basis for the EV aggregator control level, which will be discussed in the next section.
Figure 11.
Power demand after RES contribution: (a) Jan and (b) July.
5. Control and Simulation Results at EV Aggregator Level
In this section, the control proposed at the EV aggregator level is discussed in detail, followed by the implementation of the corresponding simulation and the demonstration of this simulation’s results. However, some assumptions are preset to facilitate model implementation as follows:
- In real-world applications, off-board EV chargers operating within a typical DC voltage range of 200–450 V are commonly designed for fast-charging applications, where a rated capacity of 50 kW represents an optimal and widely adopted configuration [47]. Moreover, in V2G applications, most commercially demonstrated bidirectional chargers operate within the 10–60 kW range, making 50 kW a practical mid-scale fast-charging rating that maintains optimal power balance and efficient power transfer, ensures safe battery operation, and limits converter stress, besides avoiding excessive distribution feeder loading [48,49]. Thus, a homogeneous fleet assumption of 50 kW was adopted for all chargers to maintain modeling simplicity and computational tractability.
- While many EV manufacturers consider 70–80% SOH as the end-of-warranty or replacement threshold for automotive performance standards, batteries with a range of SOH between 50% and 100% are still technically functional and are often repurposed for secondary applications [50], apart from depicting the full range of operational lifetimes of EV batteries in aggregated fleet-level energy management studies [51]. Hence, the 55–90% SOH range was adopted to capture aging diversity within a large-scale fleet and reflect realistic long-term degradation scenarios [52]. Moreover, since the proposed model includes degradation-aware scheduling constraints, lower SOH values directly influence available capacity and power capability and help evaluate the robustness of the proposed scheduling framework under varying battery health conditions.
- The proposed framework is based on a threshold-based SOH strategy, in which the SOH is viewed as a scalar health metric of 0.8, as opposed to the incorporation of the dynamic mechanisms of battery degradation. The rationale behind this is that the main focus of the current study is the system-level energy management coordination, rather than the electrochemical modeling of the batteries and the associated complexities of the degradation mechanisms, which are not within the scope of the current study. Within this scope, battery lifetime preservation is supported indirectly via operational safeguards, including conservative SOC operating limits (55–90%), charging/discharging power constraints, and reduced discharge participation for batteries with lower SOH. These measures are intended to mitigate excessive stress and avoid aggressive cycling during V2G operation.
- In regard to modeling, it is assumed that full EV participation is used to evaluate the upper-bound grid support potential and to assess the effectiveness of the proposed forecasting and scheduling framework. This assumption allows the technical performance of the energy management algorithm to be isolated from behavioral and market uncertainties [53]. In practice, EV participation depends on user behavior, connection availability, and economic incentives. Thus, future work will incorporate stochastic availability models and incentive-based participation mechanisms to enhance realism.
5.1. EV-Aggregator-Level Control
With the rapid increase in EV adoption, unmanaged charging can introduce new peaks and stress the distribution network, thus impacting power grid stability and reliability [54,55]. V2G technology, which offers bidirectional power exchange between the EV and power grid, can help mitigate these impacts through controlled bidirectional power exchange [56]. Hence, at the EV aggregator level, a priority-based scheduling algorithm is proposed to dynamically coordinate aggregated EV charging/discharging, thus fulfilling EV charging needs while maintaining an increased lifetime of batteries.
At the EV aggregator level, optimization of the EV charging/discharging power is carried out with respect to both the SOC and SOH level of the EV battery, where the aggregated EV power is computed according to the priority-based charging and discharging rules defined in (15)–(18).
where is the connection status of EV , and is the net EV power as defined by (16)–(18):
The charging power, , for EV is expressed as follows:
The discharging power, , can be given by the following:
Given that is the state of charge of EV , and represent the gradients of the charging and discharging power equations, respectively, and and denote their corresponding intercept terms.
A set of constraints, which includes power grid constraints and EV-related constraints, is considered in the proposed priority-based scheduling algorithm for both the grid operator and EV aggregator stages.
Power grid constraints: Ensure a balance between supply and demand to ensure power stability, as expressed by (19) and (20):
where represents the power supplied by the utility grid. The aggregated EV charging and discharging power, and , are defined as follows (21) and (22):
EV-related constraints: These constraints include limitations on the vehicle connection status and power exchange and the battery SOC and SOH, as described by (23)–(30).
The charging and discharging power of the EV battery is restricted to 50 kW, thus ensuring safe power transfer and protecting the battery and converter hardware from any power surplus. These constraints can be defined by (23) and (24):
For a more realistic EV representation, the EV can be connected to and disconnected from the grid at any given value, as provided by (25):
The battery SOC constraint ensures that EVs retain sufficient energy for propulsion and for prolonged battery lifetime by restricting charging and discharging within an allowable SOC range. In this study, the minimum SOC is set to 55%, whereas the maximum SOC is 90%. These limits correspond to the following as per (26)–(28):
Additionally, during V2G operation, battery health is taken into consideration depending on the battery’s to prevent accelerated degradation, as given by (29) and (30).
In the case where , the EV is allowed to discharge at the full rated power. However, when , the EV may participate in V2G but at a reduced discharge rate.
Figure 12 illustrates the coordinated charging and discharging flowchart for the EV fleet. The process begins by analyzing the grid power demand. The process begins by analyzing the power demand from the grid in relation to the minimum grid power and the maximum grid power , which has been previously coordinated from the grid-level operator. This combined flowchart helps clarify the mode of operation, whether valley filling mode, demand fulfillment mode, or peak shaving mode, according to the SOC and SOH of the vehicle’s battery.
Figure 12.
Proposed model flowchart.
When falls below (i.e., valley filling mode), the aggregator can prioritize charging connected EVs to help increase total demand to the desired level of operation, where the charging decision is based on the vehicle’s SOC. If is between 55% and 90%, the vehicle receives low-priority charging. This means that charging is performed at a slower rate because the battery does not need urgent recharge. However, if , high-priority charging is triggered to prevent the battery from reaching a critical low state of charge. If , the system operates in demand fulfillment mode, representing normal grid operation where the grid demand and supply are balanced. The system checks such that all EVs whose values are lower than 55% are charged with high priority.
When exceeds (peak shaving mode), the grid is under heavy loading and requires V2G support. Here, the EV’s response begins with evaluating its current SOC; if , this indicates that the batteries are adequately charged. In this case, the decision depends on the battery’s . If is greater than 0.8, high-priority discharging is initiated to help alleviate peak demand since battery health is good. However, if is less than 0.8, battery health is prioritized by taking a more conservative approach and performing reduced discharging, which helps protect the battery from excessive wear and tear.
The computational complexity of the proposed EV coordination flowchart in Figure 12 is linear with respect to the number of connected EVs (N); thus, it is conducted using standard asymptotic notation principles [57]. At each time step, the grid-level decision requires constant time , while the EV aggregator performs a fixed number of SOC and SOH threshold comparisons per vehicle, resulting in complexity. Over a scheduling horizon of time steps, the total complexity becomes . Since no nested optimization loops are involved in the flowchart logic, the proposed control strategy is computationally efficient and suitable for real-time large-scale deployment.
Thus, for the considered fleet size of 6000 EVs and a 24 h scheduling horizon, the total computational complexity of the proposed rule-based coordination algorithm is , corresponding to 144,000 EV-level evaluations per day. Considering approximately 6–8 primitive operations per EV decision, the total operation count is around 1.15 million operations per day (≈13 operations per second), which is computationally negligible for real-time deployment. Therefore, the proposed control framework is scalable and suitable for large EV fleets. The considered flowchart was implemented using MATLAB R2021a on a system equipped with an 11th Gen Intel® Core™ i7-1165G7 processor (2.80 GHz), 16 GB RAM, running a 64-bit operating system where the execution time reached 0.01171 s.
5.2. Grid-Operator- and EV-Aggregator-Level Control Simulation Results
For the considered network, the proposed optimization algorithm is employed for optimal coordination of EV charging and discharging operations, focusing specifically on demand variation reduction, which benefits V2G effectiveness and enhances the EV SOC and SOH via three different operational modes: valley filling, demand fulfillment, and peak shaving. For validation, the proposed methodology is tested under the four pre-discussed demand scenarios in the months of January and July, corresponding to the winter and summer load profiles, thus revealing how the EV aggregator adapts to seasonal variability. In both studies, a fleet of 6000 EVs was considered. To show the stochastic EV connection pattern, each vehicle is classified as connected/disconnected via a randomized binary assignment during each hour of the scheduling horizon. This probabilistic representation reflects realistic EV user behavior, including variations in vehicle arrival times, charging participation, and battery usage patterns. Additionally, the initial SOC of each battery was set from 10% to 100% for the EV battery, whereas the SOH was randomly assigned from 50% to 100% [58]. Additionally, the efficiency of the V2G charger is assumed to be 85%. Moreover, the grid targets for each month were derived from the day-ahead forecasts presented in Section 4.1 from the grid-operator-level control, resulting in values of 35,000 kW for July and 40,000 kW for January and values of 30,000 kW and 38,000 kW for July and January, respectively.
Figure 13a–h show the hourly net load profile before and after the EV coordination for the four scenarios considered in January and July, where the blue and red curves represent the original demand and optimized demand and , respectively. The horizontal lines represent the grid target limits, set between 38 MW and 40 MW for January and between 30 MW and 35 MW for July, whereas the shaded areas represent the three operating modes of the proposed strategy, namely valley filling, demand fulfillment, and peak shaving. The EV aggregator will operate the charge and discharge actions depending on the deviation of the grid demand from the limits, taking into account the constraints imposed by the SOC and SOH of the EV batteries.
Figure 13.
Net load with and without EV coordination for all tested scenarios. (a) Scenario I Jan, (b) Scenario I July, (c) Scenario II Jan, (d) Scenario II July, (e) Scenario III Jan, (f) Scenario III July, (g) Scenario IV Jan, and (h) Scenario IV July.
5.2.1. Scenario I Results
In Scenario I for grid-only operation, the EV coordination compensates for the lack of RES, actively shifting the demand during the day.
In January, as presented by Figure 13a, the grid operating band is 38–40 MW. During the early morning hours between 1:00 and 6:00, the original demand decreases below to approximately 36–37 MW. During this period, the system operates in valley filling mode, allowing EVs with SOC < 90% to charge, with priority given to vehicles having SOC ≤ 55%, thereby increasing the demand toward the target band. During the midday period between 7:00 and 14:00, the demand remains within the target limits, and the system operates in demand fulfillment mode, where only EVs with SOC ≤ 55% are permitted to continue charging. During the evening peak of 20:00–21:00, the original demand rises to about 44 MW, exceeding the limit. As a result, peak shaving mode is activated, in which EVs with 55% ≤ SOC < 90% discharge energy to the grid, prioritizing batteries with SOH > 0.8, thereby restricting the optimized demand to approximately 40 MW.
In July, as depicted in Figure 13b, the grid target band is 30–35 MW. During the early morning hours between 1:00 and 8:00, the demand falls to about 26–27 MW, which activates valley filling mode, where EV charging increases the demand toward 30 MW. Around 11:00–13:00, the demand enters the acceptable operating range, and the system shifts to demand fulfillment mode, allowing only low-SOC EVs to charge. After 13:00, the demand exceeds 35 MW and reaches nearly 41 MW during the evening peak between the hours of 19:00 and 21:00. During this interval, peak shaving mode is triggered, where EVs with sufficient SOC between 55 and 90% and healthy batteries with SOH > 0.8 discharge energy back to the grid, thereby reducing and flattening the peak demand.
5.2.2. Scenario II Results
Regarding Scenario II with PV–wind–grid integration, the results for January and July are presented in Figure 13c,d, respectively.
In January, the grid target band remains 38–40 MW. Between the hours of 1:00 and 6:00, the initial demand reduces to a level of about 35–36 MW, which is below . At this time, the system operates in valley filling mode, where only EVs with an SOC level below 90% are allowed to charge, with priority being given to EVs with an SOC level of 55% or below, thus increasing the demand level to the target level. At 7:00–10:00, the demand briefly exceeds the , thus operating in peak shaving mode, where only EVs with a level of 55% ≤ SOC < 90% are used to discharge energy while considering the SOH level, thus keeping the optimized level at about 40 MW. During the remaining hours, the demand generally remains within the target band, and the system operates in demand fulfillment mode, allowing only low-SOC EVs to continue charging.
In July, the grid operating limits are 30–35 MW. During the early morning period between 1:00 and 9:00, the original demand decreases to approximately 25–27 MW, which is well below . In this region, the system operates in valley filling mode, where EV charging increases the demand toward the 30 MW threshold. Around 12:00–14:00, the demand reaches the acceptable operating band, and the system transitions to demand fulfillment mode, allowing only EVs with SOC ≤ 55% to charge. During the evening peak at 19:00–21:00 h, the original demand rises to nearly 41 MW, exceeding the 35 MW upper grid target. Therefore, peak shaving mode is activated, where EVs with sufficient SOC of 55–90% and healthy batteries with SOH > 0.8 discharge energy to the grid, reducing the optimized demand and maintaining it closer to the target operating band.
5.2.3. Scenario III Results
For Scenario III with the PV–grid combination, the results for January and July are presented in Figure 13e,f, respectively.
In January, the grid operates within a target band of 38–40 MW. During the early morning hours of 1:00–6:00, the original demand declines to approximately 36–37 MW, which falls below . As a result, the system enters valley filling mode, where EV charging is enabled for vehicles with SOC < 90%, giving priority to EVs with SOC ≤ 55%. This charging activity raises the demand toward the desired operating band. Between the hours of 7:00 and 10:00, the demand briefly surpasses , which triggers peak shaving mode. During this interval, EVs with 55% ≤ SOC < 90% discharge energy back to the grid while considering SOH constraints, helping maintain the optimized demand close to 40 MW. For the remaining hours of the day, the demand generally stays within the target range, and the system operates in demand fulfillment mode, permitting only EVs with SOC ≤ 55% to charge.
In July, the grid target limits shift to 30–35 MW. During the early morning period (1:00–9:00), the demand drops to about 26–27 MW, which activates valley filling mode. In this phase, EV charging increases the demand toward the 30 MW lower limit. Around 11:00–13:00, the demand moves into the acceptable operating range, prompting the system to transition into demand fulfillment mode, where only EVs with SOC ≤ 55% are allowed to continue charging. Later in the evening period (18:00–21:00), the original demand rises to nearly 41 MW, exceeding the . Consequently, peak shaving mode is activated, allowing EVs with 55% ≤ SOC < 90% and SOH > 0.8 to discharge power to the grid. This action reduces the optimized demand and keeps it closer to the predefined grid operating limits.
During the evening peak (19:00–21:00), the demand reaches nearly 44 MW and coordinated V2G discharging maintains the optimized demand close to 40 MW. In July, the grid operating band is 30–35 MW. During 1:00–9:00, demand drops to about 26–27 MW, triggering valley filling through EV charging to raise demand toward 30 MW. Around 10:00–12:00, the demand enters the acceptable range, and the system shifts to demand fulfillment mode, where only EVs with SOC ≤ 55% continue charging. During the evening peak (17:00–21:00), demand rises to nearly 41 MW, exceeding . Peak shaving is then activated, where EVs with SOC 55–90% and SOH > 0.8 discharge to the grid, reducing the optimized demand closer to the 35 MW target.
5.2.4. Scenario IV Results
For Scenario IV where the wind–grid case is analyzed, the results for January and July are shown in Figure 13g,h, respectively.
In January, during early morning hours between 1:00 and 6:00, the demand falls to about 35–36 MW, below . The system therefore operates in valley filling mode, allowing EV charging for SOC < 90% with priority to EVs having SOC ≤ 55% to raise the demand toward the lower limit. Around 7:00–11:00, demand exceeds 40 MW, activating peak shaving, where EVs with 55% ≤ SOC < 90% discharge to the grid considering SOH constraints. During the evening peak between 19:00 and 21:00, the demand reaches nearly 44 MW and coordinated V2G discharging maintains the optimized demand close to 40 MW.
In July, during the hours of 1:00–9:00, demand drops to about 26–27 MW, triggering valley filling through EV charging to raise demand toward 30 MW. Around 10:00–12:00, the demand enters an acceptable range, and the system shifts to demand fulfillment mode, where only EVs with SOC ≤ 55% continue charging. During the evening peak (17:00–21:00), demand rises to nearly 41 MW, exceeding the upper limit. Peak shaving is then activated, where EVs with SOC 55–90% and SOH > 0.8 discharge to the grid, reducing the optimized demand closer to the 35 MW target.
6. Discussion
This paper underscores the pivotal role of renewable energy sources in reducing electricity costs and improving energy efficiency as well as the vital importance of V2G technology and smart charging strategies as transformative steps toward sustainable EV infrastructure. However, the abovementioned merits cannot be achieved without the effective EMS proposed in this study, which combines ML-based forecasting capabilities and optimized scheduling potentials.
6.1. Comparative Analysis of Simulation Results
A more insightful comparison of the simulation results demonstrates the effectiveness of the proposed EV scheduling framework under different operating scenarios. Table 5 illustrates the performance of the proposed EV scheduling framework for the four studied operating scenarios for January and July.
Table 5.
Performance metrics for the proposed EV scheduling framework.
For January, it is observed that the PAR varies between 1.0844 and 1.1220, reducing after scheduling and varying between 1.0044 and 1.0130, corresponding to a reduction of 6.59–10.48%. The largest improvement is observed for the energy mix in Scenario II, where a reduction of 10.48% is observed, thus proving that the combined integration of renewable sources is more effective for load balancing. For peak demand, it is observed that the proposed scheduling strategy is effective for reducing peak demand for all operation scenarios. In Scenario I for instance, the peak demand reduced from 43,571.88 kW to 40,558.49 kW, and the off-peak demand increased from 36,303.77 kW to 39,653.73 kW. In the PV-grid case of Scenario III, the PAR decreases from 1.1120 to 1.0105, with the peak demand reduced to 40,363.77 kW. Moreover, in the wind-grid case of Scenario IV, the PAR improves from 1.0938 to 1.0076, and the peak demand decreases from 43,342.17 kW to 40,183.24 kW, demonstrating that wind-supported operation also contributes to demand smoothing.
In July, the initial PAR values are higher due to seasonal demands and vary between 1.2084 and 1.2856. These values are reduced to between 1.1108 and 1.1362 after scheduling, with the largest reduction of 7.60–11.62% in the energy mixed case of Scenario II. In Scenario III, the peak load is reduced to 38,229.97 kW from 41,199.15 kW, while the off-peak load is increased to 30,311.74 kW from 26,224.88 kW, owing to the PV contribution. Finally, in Scenario IV, the PAR decreases from 1.2104 to 1.1183, with the peak demand reduced to 38,491.68 kW, indicating that wind-supported operation still provides meaningful peak reduction even with lower wind availability during summer conditions.
6.2. Comparison with Other Methods
The proposed method has been compared with related work done in the literature, as presented in Table 1, which highlights the unique features of the proposed method, such as unified multivariable forecasting, SOC/SOH-sensitive V2G coordination, and hierarchical decentralized control, which are rarely combined. At the simulation level, the forecasting model CatBoost has been compared with RF, XGBoost, SVM, and DT models and has outperformed these models. The generation scheduling stage uses the MILP algorithm, which is sufficient since the problem is linear and can ensure global optimality with reduced computational costs compared to metaheuristic methods. Moreover, various simulation scenarios have been analyzed to prove the robustness of the proposed method, such as grid only versus renewables (PV and wind) tied to the grid, to show the cost-effectiveness of the latter, in addition to testing the proposed scheme in cases of renewables limitation (PV only or wind only) under different seasons of the year.
6.3. Innovation Boundary of the Proposed Work
As previously discussed, the literature reveals the lack of an integrated EMS that jointly couples multisource forecasting (solar, wind, and load) with grid-level generation scheduling from the perspective of the grid operator. Most prior studies either isolate forecasting from operational decision-making or restrict predictions to a single variable, limiting their applicability for real-time grid operations under high renewable penetration. Second, these studies either depend on ANN-based forecast techniques and/or metaheuristic-based scheduling optimization schemes, which increase the computational burden and complicate EMS implementation. Third, only a few studies adopt a hierarchical, decentralized control structure that reflects the coordinated operation between grid operators and EV aggregators while enabling integrated decision-making across both levels. Fourth, most studies that predict more than one variable have not developed a common framework for these predictions. Finally, practical considerations such as the battery SOH and its impact on long-term EV participation in V2G services are often overlooked, thus reducing realism and limiting the scope of research. Hence, the proposed EMS in this paper is developed to address these issues by acquiring the following capabilities: The innovation boundary of the proposed EM method relative to the latest frontier studies does not lie in introducing a new standalone ML or optimization algorithm. However, it is positioned at the proposed dual-level decentralized control framework that integrates unified multisource forecasting, MILP-based scheduling, and SOC/SOH-aware V2G coordination at low implementation complexity and computational count—features rarely integrated simultaneously in prior works. These capabilities are detailed below.
- Hierarchical Decentralized Control Architecture: A decoupled two-layer control framework is proposed, where grid-operator-level optimization is decoupled from the EV-aggregator-level coordination, thus improving scalability, privacy, and applicability of the proposed solution in contrast to the conventional EMS-based centralized control architecture.
- Unified Multivariable Forecast Pipeline: A unified ML forecasting framework jointly predicts PV, wind, and load demand and directly feeds these results into operator-level scheduling, bridging forecasting and operational grid planning.
- Linear MILP Instead of Metaheuristic Control: Most of the recent studies in the literature propose the application of metaheuristic-based optimization techniques such as GA, PSO, and GWO even when the scheduling problem is linear in nature. On the contrary, the proposed scheduling stage is formulated as a structured MILP problem aligned with the considered mathematical structure, avoiding unnecessary algorithmic complexity. This guarantees deterministic global optimality, faster convergence, and less computational burden, which is better suited for operator-level real-world deployment.
- SOC–SOH-aware bidirectional V2G coordination: A practical priority-based EV strategy that actively performs peak shaving and valley filling while explicitly considering battery health constraints, SOC, and SOH, which were rarely considered in previous work, enabling realistic large-scale V2G participation.
- Performance–complexity balanced design: The proposed framework, which integrates efficient ensemble-based ML models, MILP scheduling, and rule-based priority charging/discharging, ensures high accuracy and cost reduction with moderate computational complexity, avoiding the high complexity of deep ANN and metaheuristic approaches, which have been extensively utilized in the literature.
- Scenario-robust validation: The proposed framework was validated using different scenarios, including PV and wind, PV only, wind only, an RES energy mix, and worst-case scenarios. The simulation results validated the effectiveness of the proposed approach in minimizing the grid load variability, satisfying vehicle charging requirements, and taking advantage of its V2G discharging potential, along with increasing the lifespan of the EV batteries.
Conclusively, unlike recent frontier works that treat PV forecasting, EV scheduling, or hierarchical control independently, the proposed method bridges forecasting and operational planning from a grid-operator perspective down to scheduling and coordination at the EV aggregator level, ensuring computational efficiency, reliability, and scalability.
6.4. Future Work Directions
Future work directions for the proposed work may include the following:
- Improved Forecasting Models: Expanding the forecasting model capabilities by taking into consideration other input features that could influence the consumption patterns of EVs, such as traffic information and EV usage patterns.
- Enhanced EV Coordination: Introducing dynamic pricing and demand incentive schemes for modeling V2G operations and introducing cost-based energy management scenarios.
- Integration of Additional Energy Resources: The scope of the study can be extended to include energy storage systems that can enhance the system’s flexibility and handle any surplus energy generated, such as battery energy storage systems. Long-term energy storage solutions, such as hydrogen or thermal energy storage, can also be used for the large-scale implementation of RES.
- Incorporating Battery Dynamics: Battery aging models such as C-rate-dependent aging, cycle-count effects, or depth-of-discharge (DoD)-related capacity fade formulations would further enhance the accuracy of lifetime assessment. Therefore, extending the proposed EMS to include explicit battery degradation modeling within the V2G optimization framework is identified as a promising future research direction
- Including Practical EV Participation Schemes: In practice, EV participation depends on user behavior, connection availability, and economic incentives. Thus, future work can incorporate stochastic availability models and incentive-based participation mechanisms to enhance realism.
- Incorporating Distribution Network Constraints: The scheduling and EV coordination framework presented in this work is based on system-level operation and does not model the explicit distribution network constraints such as bus voltage limits, power flow analysis, and technical system constraints. This system representation allows a tractable MILP formulation that highlights the value of forecast-based scheduling and EV participation for cost and load variance control. Although distribution-level problems, such as voltage violations, feeder congestion, system unbalances, and thermal overloads, can occur for specific high-EV-penetration or low-network-topology cases, they have been omitted in this study. The proposed framework can be extended and validated on standardized IEEE test systems for future work to explicitly incorporate network-constrained power flow models. This integration would enable comprehensive evaluation of both economic performance and technical feasibility, enhancing the applicability of the proposed EMS to practical distribution network environments.
7. Conclusions
In this paper, a decentralized, efficient energy management scheme is proposed and tested on a grid network incorporating wind and solar renewables, aggregated EVs, and residential/commercial loads. The proposed scheme combines ML-driven weather and load forecasting with MILP optimization-based generation scheduling at the grid operator level and priority-based EV charging/discharging coordination at the EV aggregator level. The day-ahead simulation forecast results verified the robustness of CatBoost and its ability to reduce large RMSE values; thus, it is considered an appealing candidate for implementation in smart grid systems where forecasting multiple variables with a common pipeline is necessary. On the other hand, by effectively managing the available energy resources via the MILP optimization scheme, the results confirmed the ability of the system to minimize costs and increase reliance on renewable energy while maintaining grid stability. This makes the proposed methodology an ideal solution for balancing both environmental and economic goals in energy generation, particularly in scenarios where RESs are variable, ensuring the optimal integration of renewables with the grid. Finally, under different environmental conditions and even worst-case scenarios of renewables availability, the proposed priority-based EV charge/discharge coordination method succeeded in minimizing grid load variability, fulfilling vehicle charging needs, and benefitting from its V2G discharging capability while enhancing the EV battery lifetime. Conclusively, the simulation results validate the effectiveness of the proposed EMS in achieving accurate forecasts, efficient generation scheduling, and coordinated EV operation during different seasons of the year, featuring relatively low implementation complexity and decoupled control with the merits of scalability, flexibility, privacy, and system reliability.
Author Contributions
Conceptualization, N.E.Z.; methodology, N.E.Z., R.A.I. and A.M.A.; software, R.A.I. and A.E.; validation, N.E.Z. and R.A.I.; formal analysis, R.A.I. and A.E.; investigation, A.E.; resources, A.E.; data curation, A.E.; writing—original draft preparation, R.A.I. and A.E.; writing—review and editing, N.E.Z., R.A.I. and A.M.A.; visualization, R.A.I. and A.E.; supervision, N.E.Z., R.A.I. and A.M.A.; project administration, R.A.I.; funding acquisition, R.A.I. and A.M.A. All authors have read and agreed to the published version of the manuscript.
Funding
This research received no external funding.
Institutional Review Board Statement
Not applicable.
Informed Consent Statement
Not applicable.
Data Availability Statement
The original data presented in the study are openly available at https://power.larc.nasa.gov/ (accessed on 18 November 2025).
Acknowledgments
During the preparation of this manuscript, the authors used [ChatGPT 5.2 and Quillbot v38.43.2] for the purposes of [text editing]. The authors have reviewed and edited the output and take full responsibility for the content of this publication.
Conflicts of Interest
The authors declare that they have no conflicts of interest.
Abbreviations
The following abbreviations are used in this manuscript:
| AI | Artificial Intelligence |
| ANFIS | Adaptive Neuro-Fuzzy Inference System |
| ARIMA | Auto-Regressive Integrated Moving Average |
| BESS | Battery Energy Storage System |
| CNN | Convolutional Neural Network |
| DER | Distributed Energy Resource |
| DT | Decision Tree |
| DR | Demand Response |
| DoD | Depth-of-Discharge |
| EMS | Energy Management System |
| EV | Electric Vehicle |
| G2V | Grid-to-Vehicle |
| LSTM | Long Short-Term Memory |
| MAE | Mean Absolute Error |
| MILP | Mixed-Integer Linear Programming |
| ML | Machine Learning |
| MV | Medium Voltage |
| PV | Photovoltaic |
| RES | Renewable Energy Source |
| RF | Random Forest |
| RMSE | Root Mean Square Error |
| SARIMA | Seasonal Auto-Regressive Integrated Moving Average |
| SAMSTCN | Supervised Attention Multi-Scale Temporal Convolutional Network |
| SOC | State of Charge |
| SOH | State of Health |
| SVR | Support Vector Regression |
| VCNN | Verifiable Convolutional Neural Network |
| V2G | Vehicle-to-Grid |
References
- Nagappan, B.; Chaudhary, C.; Doda, D.K.; Kumar, S. Review on Smart Grids and Renewable Integration: An Artificial Intelligence-Powered Perspective. Multidiscip. Rev. 2024, 6, 2023ss070. [Google Scholar] [CrossRef] [Scilit]
- Yeboah, S.J.; Nunoo, S.; Attachie, J.C.; Asihene, W.D.; Asuamah, E.Y. Impact and Integration Techniques of Renewable Energy Sources on Smart Grid Operations: A Systematic Review. Sci. Afr. 2025, 29, e02845. [Google Scholar] [CrossRef] [Scilit]
- Ohanu, C.P.; Rufai, S.A.; Oluchi, U.C. A Comprehensive Review of Recent Developments in Smart Grid through Renewable Energy Resources Integration. Heliyon 2024, 10, e25705. [Google Scholar] [CrossRef] [Scilit] [PubMed]
- Elbanna, R.R.; ElMessmary, M.H.; Diab, H.; Abdelsalam, M. A Smart Hybrid Optimization Model for DSSE in Renewable Energy-Powered Distribution Networks. Renew. Energy Sustain. Dev. 2025, 11, 314–334. [Google Scholar] [CrossRef] [Scilit]
- Asadi Aghajari, H.; Niknam, T.; Shasadeghi, M.; Sharifhosseini, S.M.; Taabodi, M.H.; Sheybani, E.; Javidi, G.; Pourbehzadi, M. Analyzing Complexities of Integrating Renewable Energy Sources into Smart Grid: A Comprehensive Review. Appl. Energy 2025, 383, 125317. [Google Scholar] [CrossRef] [Scilit]
- Qu, R.; Kou, R.; Zhang, T. The Impact of Weather Variability on Renewable Energy Consumption: Insights from Explainable Machine Learning Models. Sustainability 2024, 17, 87. [Google Scholar] [CrossRef] [Scilit]
- Meenal, R.; Binu, D.; Ramya, K.C.; Michael, P.A.; Vinoth Kumar, K.; Rajasekaran, E.; Sangeetha, B. Weather Forecasting for Renewable Energy System: A Review. Arch. Comput. Methods Eng. 2022, 29, 2875–2891. [Google Scholar] [CrossRef] [Scilit]
- Hasan, M.; Mifta, Z.; Papiya, S.J.; Roy, P.; Dey, P.; Salsabil, N.A.; Chowdhury, N.-U.-R.; Farrok, O. A State-of-the-Art Comparative Review of Load Forecasting Methods: Characteristics, Perspectives, and Applications. Energy Convers. Manag. X 2025, 26, 100922. [Google Scholar] [CrossRef] [Scilit]
- El Aziz Ahmed, E.A.; Ibrahim, R.A.; Abdelsalam, A.K. A Comparative Analysis for Machine Learning-Based Short-Term Load Forecasting Techniques. In Proceedings of the 2023 IEEE 6th International Electrical and Energy Conference (CIEEC); IEEE: Piscataway, NJ, USA, 2023; pp. 1166–1171. [Google Scholar]
- Mojumder, M.R.H.; Ahmed Antara, F.; Hasanuzzaman, M.; Alamri, B.; Alsharef, M. Electric Vehicle-to-Grid (V2G) Technologies: Impact on the Power Grid and Battery. Sustainability 2022, 14, 13856. [Google Scholar] [CrossRef] [Scilit]
- Hossain, S.; Rokonuzzaman, M.; Rahman, K.S.; Habib, A.K.M.A.; Tan, W.-S.; Mahmud, M.; Chowdhury, S.; Channumsin, S. Grid-Vehicle-Grid (G2V2G) Efficient Power Transmission: An Overview of Concept, Operations, Benefits, Concerns, and Future Challenges. Sustainability 2023, 15, 5782. [Google Scholar] [CrossRef] [Scilit]
- Abdelhamid, A.M.; Zakzouk, N.E.; El Safty, S. A Multi-Agent Approach for Self-Healing and RES-Penetration in Smart Distribution Networks. Mathematics 2022, 10, 2275. [Google Scholar] [CrossRef] [Scilit]
- Kumar, P.; Channi, H.K.; Kumar, R.; Rajiv, A.; Kumari, B.; Singh, G.; Singh, S.; Dyab, I.F.; Lozanović, J. A Comprehensive Review of Vehicle-to-Grid Integration in Electric Vehicles: Powering the Future. Energy Convers. Manag. X 2025, 25, 100864. [Google Scholar] [CrossRef] [Scilit]
- Ibrahim, R.A.; Gaber, I.M. Electric Vehicles: From Charging Infrastructure to Impacts on Utility Grid. In Power, Energy and Electrical Engineering; IOS Press: Amsterdam, The Netherlands, 2024; Volume 54, pp. 326–337. [Google Scholar]
- Ramkumar, G.; Kannan, S.; Mohanavel, V.; Karthikeyan, S.; Titus, A. The Future of Green Mobility: A Review Exploring Renewable Energy Systems Integration in Electric Vehicles. Results Eng. 2025, 27, 105647. [Google Scholar] [CrossRef] [Scilit]
- Liu, W.; Rui, C.; Liu, Z.; Chen, J. Energy Management for Microgrids Integrating Renewable Sources and Hybrid Electric Vehicles. Case Stud. Therm. Eng. 2025, 69, 105937. [Google Scholar] [CrossRef] [Scilit]
- Alsharif, A.; Tan, C.W.; Ayop, R.; Dobi, A.; Lau, K.Y. A Comprehensive Review of Energy Management Strategy in Vehicle-to-Grid Technology Integrated with Renewable Energy Sources. Sustain. Energy Technol. Assess. 2021, 47, 101439. [Google Scholar] [CrossRef] [Scilit]
- Azim Mohseni, N.; Bayati, N.; Ebel, T. Energy Management Strategies of Hybrid Electric Vehicles: A Comparative Review. IET Smart Grid 2024, 7, 191–220. [Google Scholar] [CrossRef] [Scilit]
- Chandra Tella, V.; Alzayed, M.; Chaoui, H. A Comprehensive Review of Energy Management Strategies in Hybrid Electric Vehicles: Comparative Analysis and Challenges. IEEE Access 2024, 12, 181858–181878. [Google Scholar] [CrossRef] [Scilit]
- Testasecca, T.; Bellesini, F.; Arnone, D.; Beccali, M. A Digital Twin for Real-Time and Predictive Optimization of Electric Vehicle Charging in Microgrids Integrating Renewable Energy Sources. Energies 2025, 18, 5605. [Google Scholar] [CrossRef] [Scilit]
- Eissa, M.M.; Swief, R.A.W.; Salam, T.S.A. Demand Side Management with Electric Vehicles and Optimal Renewable Resources Integration under System Uncertainties. Sci. Rep. 2025, 15, 18570. [Google Scholar] [CrossRef] [Scilit] [PubMed]
- Manzolini, G.; Fusco, A.; Gioffrè, D.; Matrone, S.; Ramaschi, R.; Saleptsis, M.; Simonetti, R.; Sobic, F.; Wood, M.J.; Ogliari, E.; et al. Impact of PV and EV Forecasting in the Operation of a Microgrid. Forecasting 2024, 6, 591–615. [Google Scholar] [CrossRef] [Scilit]
- Gunapriya, B.; Santosh Kumar, B.; Rajalakshmi, B.; Palanisamy, K. Cost-Efficient Energy Management between Electric Vehicle Charging Stations and Distribution Systems Using Intelligent Scheduling. Energy 2025, 339, 138687. [Google Scholar] [CrossRef] [Scilit]
- Olano, J.; Camblong, H.; López-Ibarra, J.A.; Lie, T.T. Development of Energy Management Systems for Electric Vehicle Charging Stations Associated with Batteries: Application to a Real Case. Appl. Sci. 2025, 15, 8798. [Google Scholar] [CrossRef] [Scilit]
- Amir, M.; Zaheeruddin; Haque, A.; Bakhsh, F.I.; Kurukuru, V.S.B.; Sedighizadeh, M. Intelligent Energy Management Scheme-based Coordinated Control for Reducing Peak Load in Grid-connected Photovoltaic-powered Electric Vehicle Charging Stations. IET Gener. Transm. Distrib. 2024, 18, 1205–1222. [Google Scholar] [CrossRef] [Scilit]
- van der Meer, D.; Chandra Mouli, G.R.; Morales-Espana Mouli, G.; Elizondo, L.R.; Bauer, P. Energy Management System with PV Power Forecast to Optimally Charge EVs at the Workplace. IEEE Trans. Industr. Inform. 2018, 14, 311–320. [Google Scholar] [CrossRef] [Scilit]
- Zhang, T.; Peng, Q.; Zeng, S. Predicting EV Charging Demand in Renewable-Energy-Powered Grids Using Explainable Machine Learning. Sustainability 2025, 17, 4158. [Google Scholar] [CrossRef] [Scilit]
- Wang, S.; Zhuge, C.; Shao, C.; Wang, P.; Yang, X.; Wang, S. Short-Term Electric Vehicle Charging Demand Prediction: A Deep Learning Approach. Appl. Energy 2023, 340, 121032. [Google Scholar] [CrossRef] [Scilit]
- Durrani, A.M.; Asar, A.U.; Aziz, A.; Khan, W.; Yousaf, M.Z.; Anjam, F.; Farooq, U.; Abdullah, M.; Shabaz, M. Lightweight Machine Learning Framework Using Temporal Features for Electric Vehicle Demand Response Forecasting on Edge Devices. Sci. Rep. 2026, 16, 947. [Google Scholar] [CrossRef] [Scilit]
- Shang, Y.; Li, S. FedPT-V2G: Security Enhanced Federated Transformer Learning for Real-Time V2G Dispatch with Non-IID Data. Appl. Energy 2024, 358, 122626. [Google Scholar] [CrossRef] [Scilit]
- Akshay, K.C.; Grace, G.H.; Gunasekaran, K.; Samikannu, R. Power Consumption Prediction for Electric Vehicle Charging Stations and Forecasting Income. Sci. Rep. 2024, 14, 6497. [Google Scholar] [CrossRef] [Scilit] [PubMed]
- Khou, S.A.; Olamaei, J.; Hosseini, M.H. Strategic Scheduling of the Electric Vehicle-Based Microgrids under the Enhanced Particle Swarm Optimization Algorithm. Sci. Rep. 2024, 14, 30795. [Google Scholar] [CrossRef] [Scilit] [PubMed]
- Abdullah, H.M.; Gastli, A.; Ben-Brahim, L. Reinforcement Learning Based EV Charging Management Systems–A Review. IEEE Access 2021, 9, 41506–41531. [Google Scholar] [CrossRef] [Scilit]
- Zakzouk, N.E.; Abdelsalam, A.K.; Helal, A.A.; Williams, B.W. DC-Link Voltage Sensorless Control Technique for Single-Phase Two-Stage Photovoltaic Grid-Connected System. In Proceedings of the 2014 IEEE International Energy Conference (ENERGYCON); IEEE: Piscataway, NJ, USA, 2014; pp. 58–64. [Google Scholar]
- Ibrahim, R.A.; Ahmed, K.H.; Williams, B.W.; Hamad, M.S.; Dessouky, Y.G. Improved Ride-through of PMSG Wind Turbine during Symmetrical Voltage Dip Using a Magnetic Amplifier. In Proceedings of the 2nd IET Renewable Power Generation Conference (RPG 2013); Institution of Engineering and Technology: Stevenage, UK, 2013; p. 3-C51. [Google Scholar]
- NASA. NASA Power. Available online: https://power.larc.nasa.gov/ (accessed on 18 November 2025).
- Chandra, I.; Singh, N.K.; Samuel, P.; Bajaj, M.; Zaitsev, I. Coordinated Charging of EV Fleets in Community Parking Lots to Maximize Benefits Using a Three-Stage Energy Management System. Sci. Rep. 2024, 14, 32026. [Google Scholar] [CrossRef] [Scilit]
- Gu, W.; Yu, H.; Liu, W.; Zhu, J.; Xu, X. Demand Response and Economic Dispatch of Power Systems Considering Large-Scale Plug-in Hybrid Electric Vehicles/Electric Vehicles (PHEVs/EVs): A Review. Energies 2013, 6, 4394–4417. [Google Scholar] [CrossRef] [Scilit]
- Abo Gabl, O.M.; Morgan, M.Y.; El-Sobki, M.S., Jr. Decentralized Economic Operation of Isolated AC, DC, and Hybrid Microgrids. Renew. Energy Sustain. Dev. 2025, 11, 175. [Google Scholar] [CrossRef] [Scilit]
- Saint-Drenan, Y.-M.; Besseau, R.; Jansen, M.; Staffell, I.; Troccoli, A.; Dubus, L.; Schmidt, J.; Gruber, K.; Simões, S.G.; Heier, S. A Parametric Model for Wind Turbine Power Curves Incorporating Environmental Conditions. Renew. Energy 2020, 157, 754–768. [Google Scholar] [CrossRef] [Scilit]
- Michael, P.R.; Johnston, D.E.; Moreno, W. A Conversion Guide: Solar Irradiance and Lux Illuminance. J. Meas. Eng. 2020, 8, 153–166. [Google Scholar] [CrossRef] [Scilit]
- Allwyn, R.G.; Al-Hinai, A.; Margaret, V. A Comprehensive Review on Energy Management Strategy of Microgrids. Energy Rep. 2023, 9, 5565–5591. [Google Scholar] [CrossRef] [Scilit]
- Ragab, M.M.; Ibrahim, R.A.; Desouki, H.; Swief, R. Optimal Energy Management Applying Load Elasticity Integrating Renewable Resources. Sci. Rep. 2023, 13, 15000. [Google Scholar] [CrossRef] [Scilit]
- Alqahtani, S.; Shaher, A.; Garada, A.; Cipcigan, L. Impact of the High Penetration of Renewable Energy Sources on the Frequency Stability of the Saudi Grid. Electronics 2023, 12, 1470. [Google Scholar] [CrossRef] [Scilit]
- Gaber, I.M.; Ibrahim, R.A. Hourly Electricity Price Prediction Applying Deep Learning for Electricity Market Management. In Proceedings of the 2023 IEEE International Conference on Environment and Electrical Engineering and 2023 IEEE Industrial and Commercial Power Systems Europe (EEEIC/I&CPS Europe); IEEE: Piscataway, NJ, USA, 2023; pp. 1–5. [Google Scholar]
- IRENA. Renewable Power Generation Costs in 2022; International Renewable Energy Agency: Abu Dhabi, United Arab Emirates, 2023. [Google Scholar]
- Shahed, M.T.; Rashid, A.B.M.H. Battery Charging Technologies and Standards for Electric Vehicles: A State-of-the-Art Review, Challenges, and Future Research Prospects. Energy Rep. 2024, 11, 5978–5998. [Google Scholar] [CrossRef] [Scilit]
- Ejaz, B.; Zamora, R.; Reusser, C.; Lin, X. A Comprehensive Review of Partial Power Converter Topologies and Control Methods for Fast Electric Vehicle Charging Applications. Electronics 2025, 14, 1928. [Google Scholar] [CrossRef] [Scilit]
- Sagaria, S.; van der Kam, M.; Boström, T. Vehicle-to-Grid Impact on Battery Degradation and Estimation of V2G Economic Compensation. Appl. Energy 2025, 377, 124546. [Google Scholar] [CrossRef] [Scilit]
- Li, J.; He, S.; Yang, Q.; Wei, Z.; Li, Y.; He, H. A Comprehensive Review of Second Life Batteries Toward Sustainable Mechanisms: Potential, Challenges, and Future Prospects. IEEE Trans. Transp. Electrif. 2023, 9, 4824–4845. [Google Scholar] [CrossRef] [Scilit]
- Li, H.; Zhuo, S.; Zhou, Y.; Bin Kaleem, M.; Jiang, Y.; Jiang, F. Robust SOH Estimation for Li-Ion Battery Packs of Real-World Electric Buses with Charging Segments. Sci. Rep. 2025, 15, 24871. [Google Scholar] [CrossRef] [Scilit] [PubMed]
- Etxandi-Santolaya, M.; Mora-Pous, A.; Canals Casals, L.; Corchero, C.; Eichman, J. Quantifying the Impact of Battery Degradation in Electric Vehicle Driving through Key Performance Indicators. Batteries 2024, 10, 103. [Google Scholar] [CrossRef] [Scilit]
- Ibrahim, R.A.; Gaber, I.M.; Zakzouk, N.E. Analysis of Multidimensional Impacts of Electric Vehicles Penetration in Distribution Networks. Sci. Rep. 2024, 14, 27854. [Google Scholar] [CrossRef] [Scilit]
- Zhang, C.; Greenblatt, J.B.; MacDougall, P.; Saxena, S.; Jayam Prabhakar, A. Quantifying the Benefits of Electric Vehicles on the Future Electricity Grid in the Midwestern United States. Appl. Energy 2020, 270, 115174. [Google Scholar] [CrossRef] [Scilit]
- Solanke, T.U.; Ramachandaramurthy, V.K.; Yong, J.Y.; Pasupuleti, J.; Kasinathan, P.; Rajagopalan, A. A Review of Strategic Charging–Discharging Control of Grid-Connected Electric Vehicles. J. Energy Storage 2020, 28, 101193. [Google Scholar] [CrossRef] [Scilit]
- Anuja, G.; Kepha Rhenie, S.E.; Remsangpuii, K.; Sridhar, M.R.; Sridharan, R.; Elango, S. Bidirectional Charger for Electric Vehicle Applications. Int. Res. J. Adv. Eng. Hub 2024, 2, 520–528. [Google Scholar] [CrossRef] [Scilit]
- Cormen, T.H.; Leiserson, C.E.; Rivest, R.L.; Stein, C. Introduction to Algorithms, 3rd ed.; The MIT Press: Cambridge, MA, USA, 2009. [Google Scholar]
- Hashim, M.S.; Yong, J.Y.; Ramachandaramurthy, V.K.; Tan, K.M.; Mansor, M.; Tariq, M. Priority-Based Vehicle-to-Grid Scheduling for Minimization of Power Grid Load Variance. J. Energy Storage 2021, 39, 102607. [Google Scholar] [CrossRef] [Scilit]
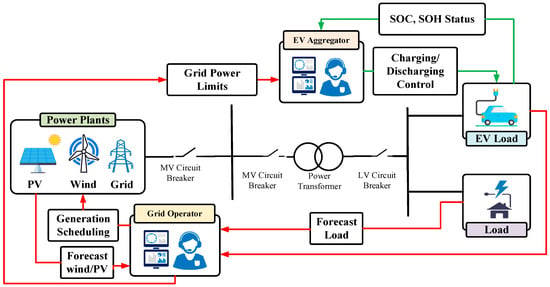
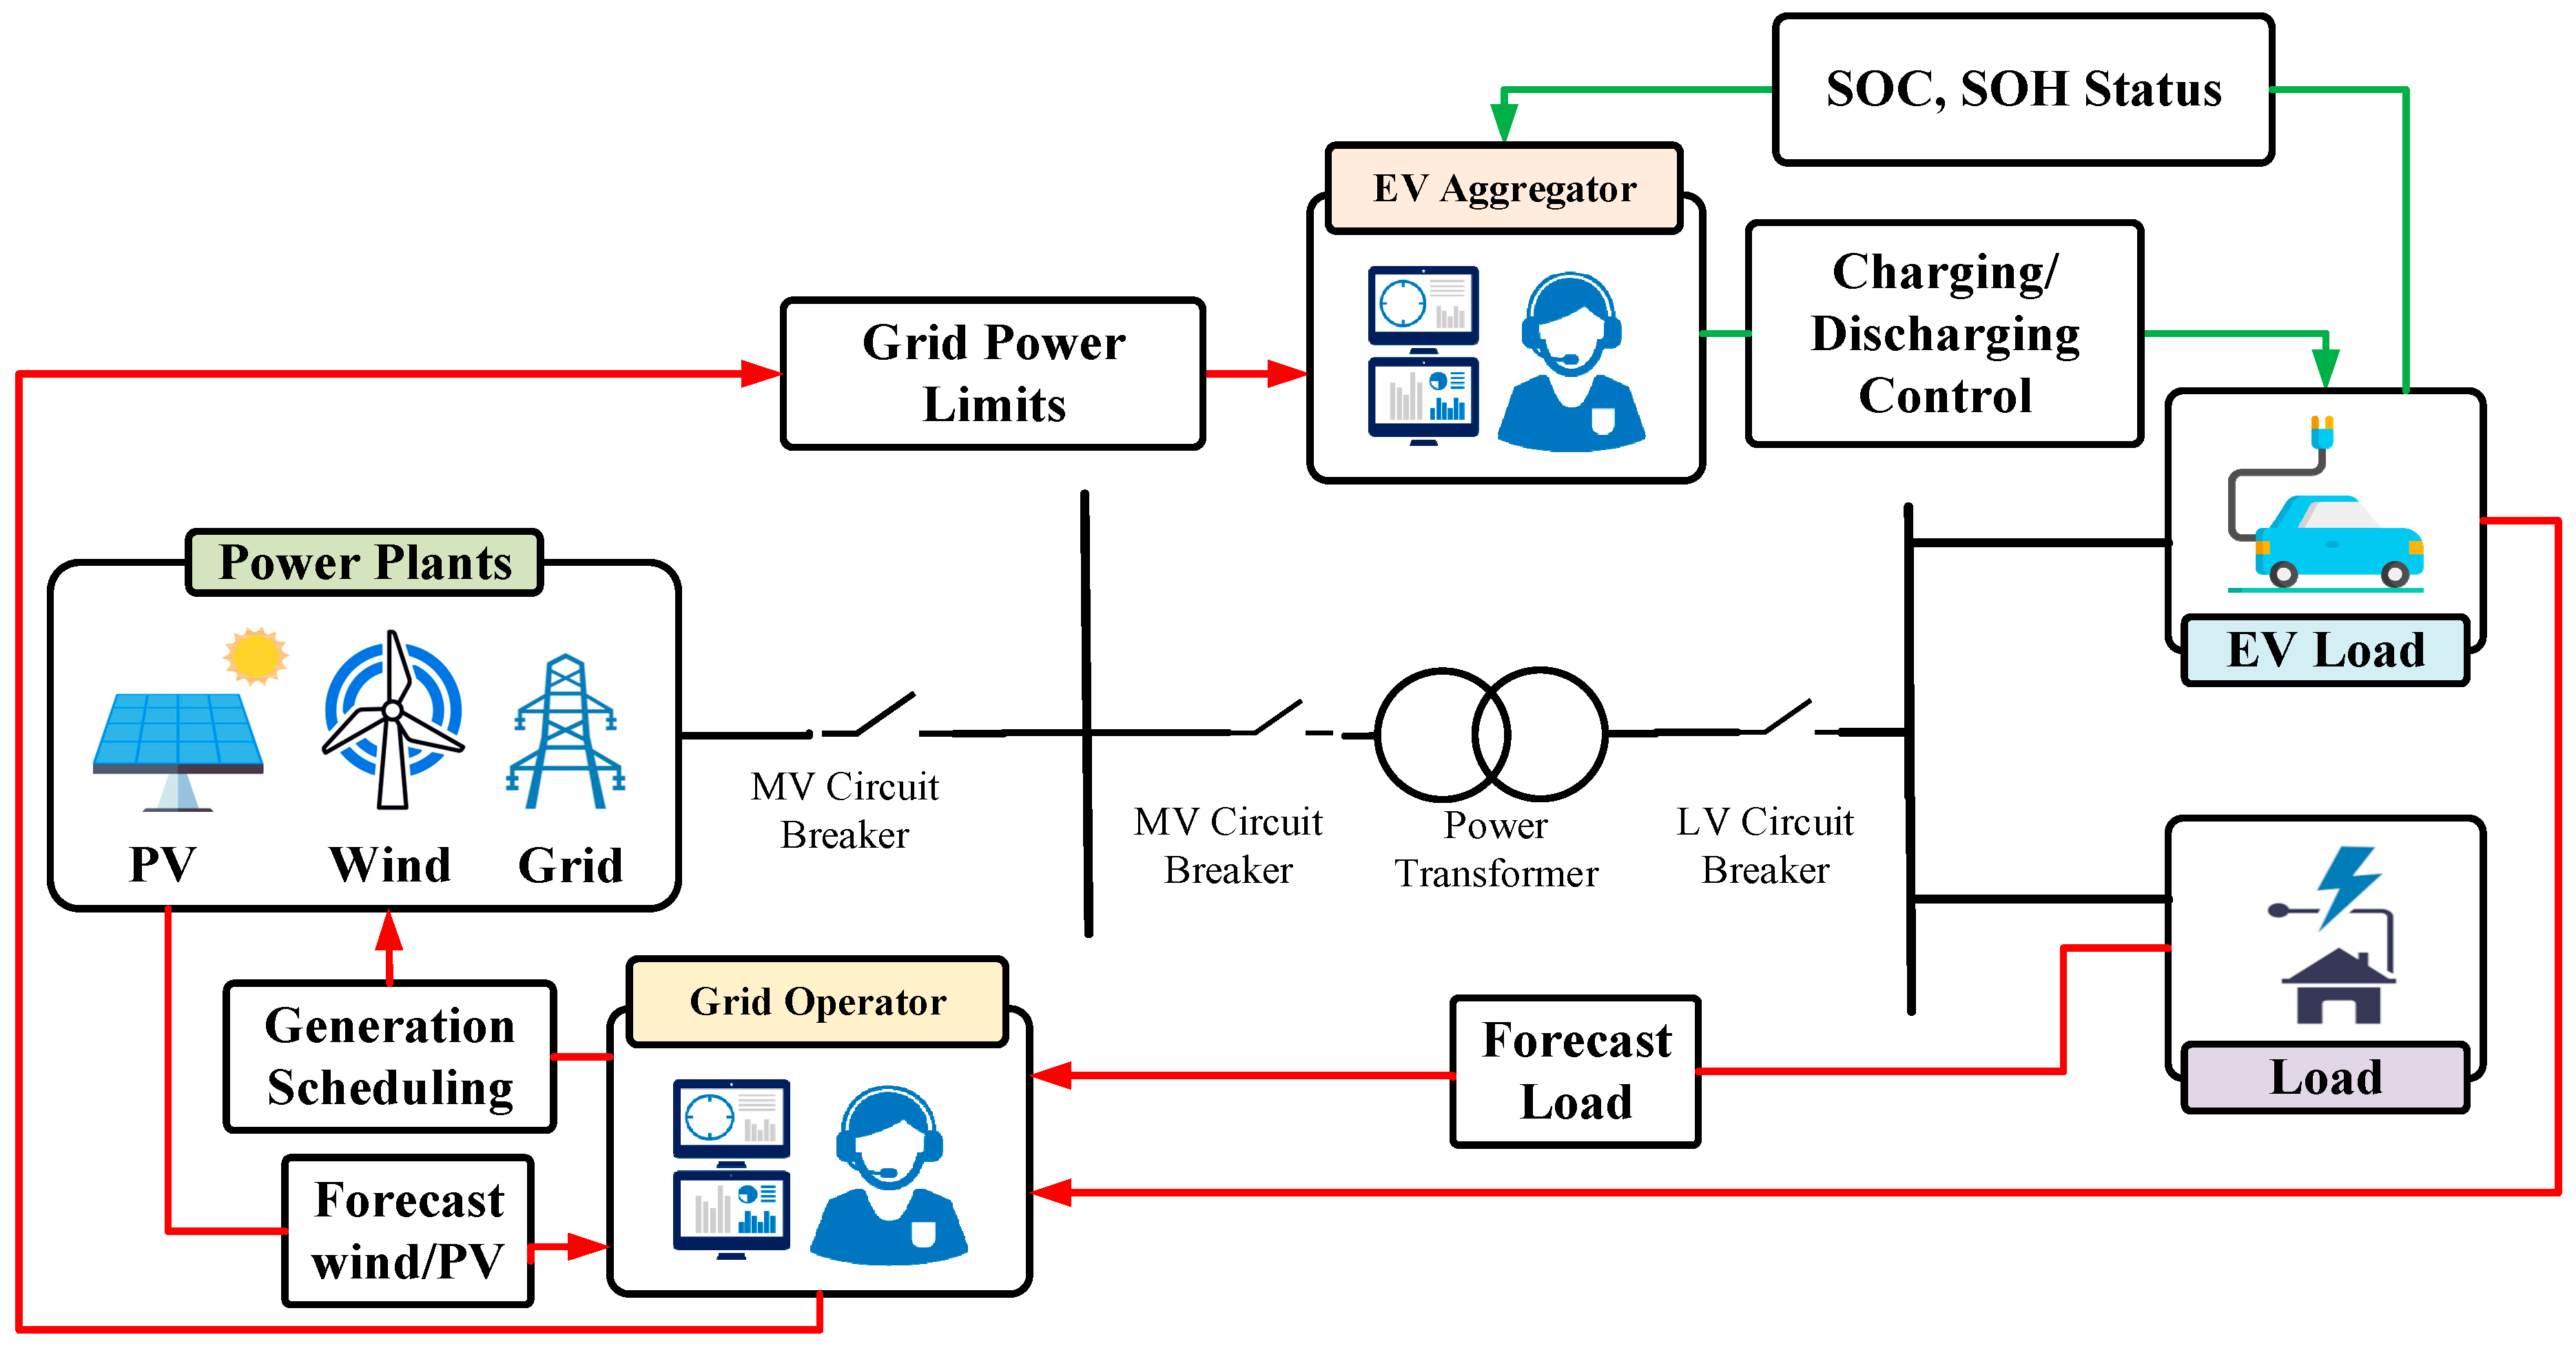
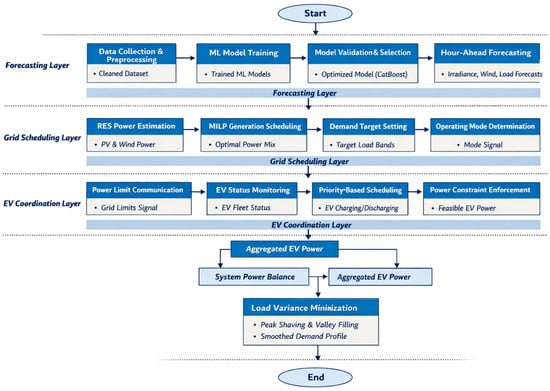
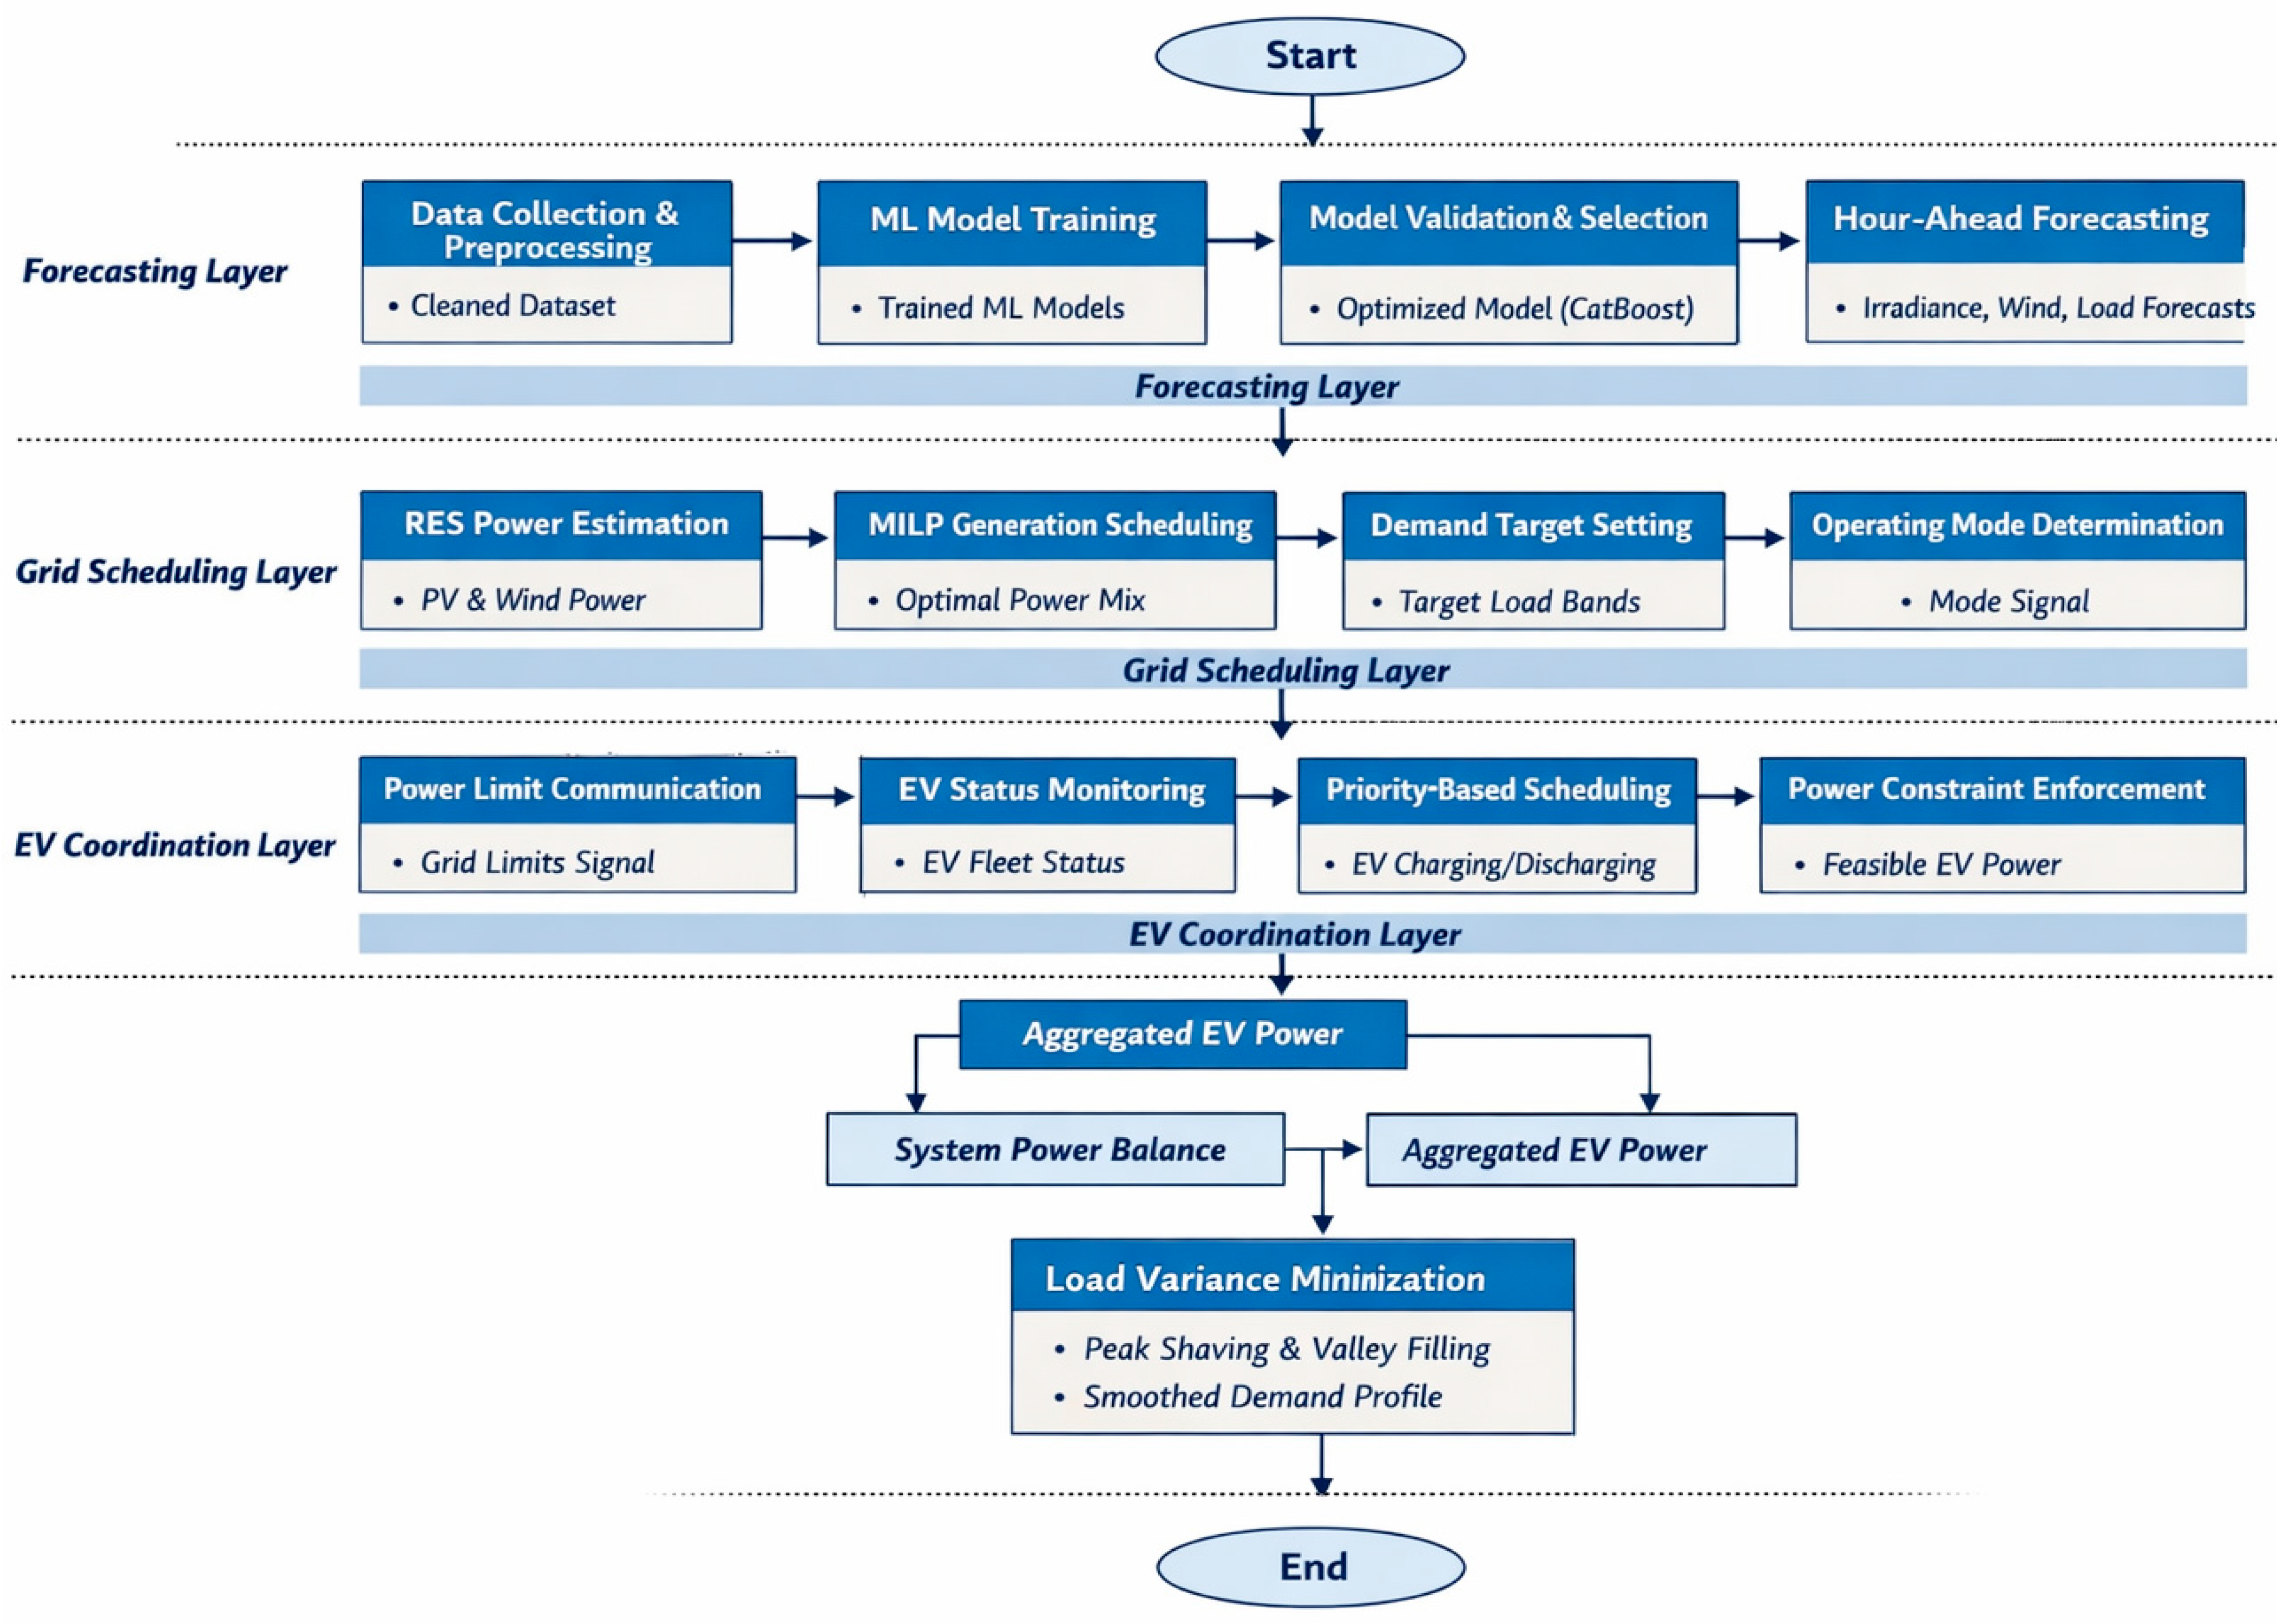
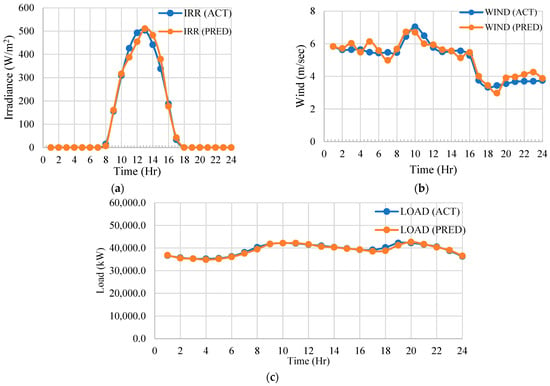
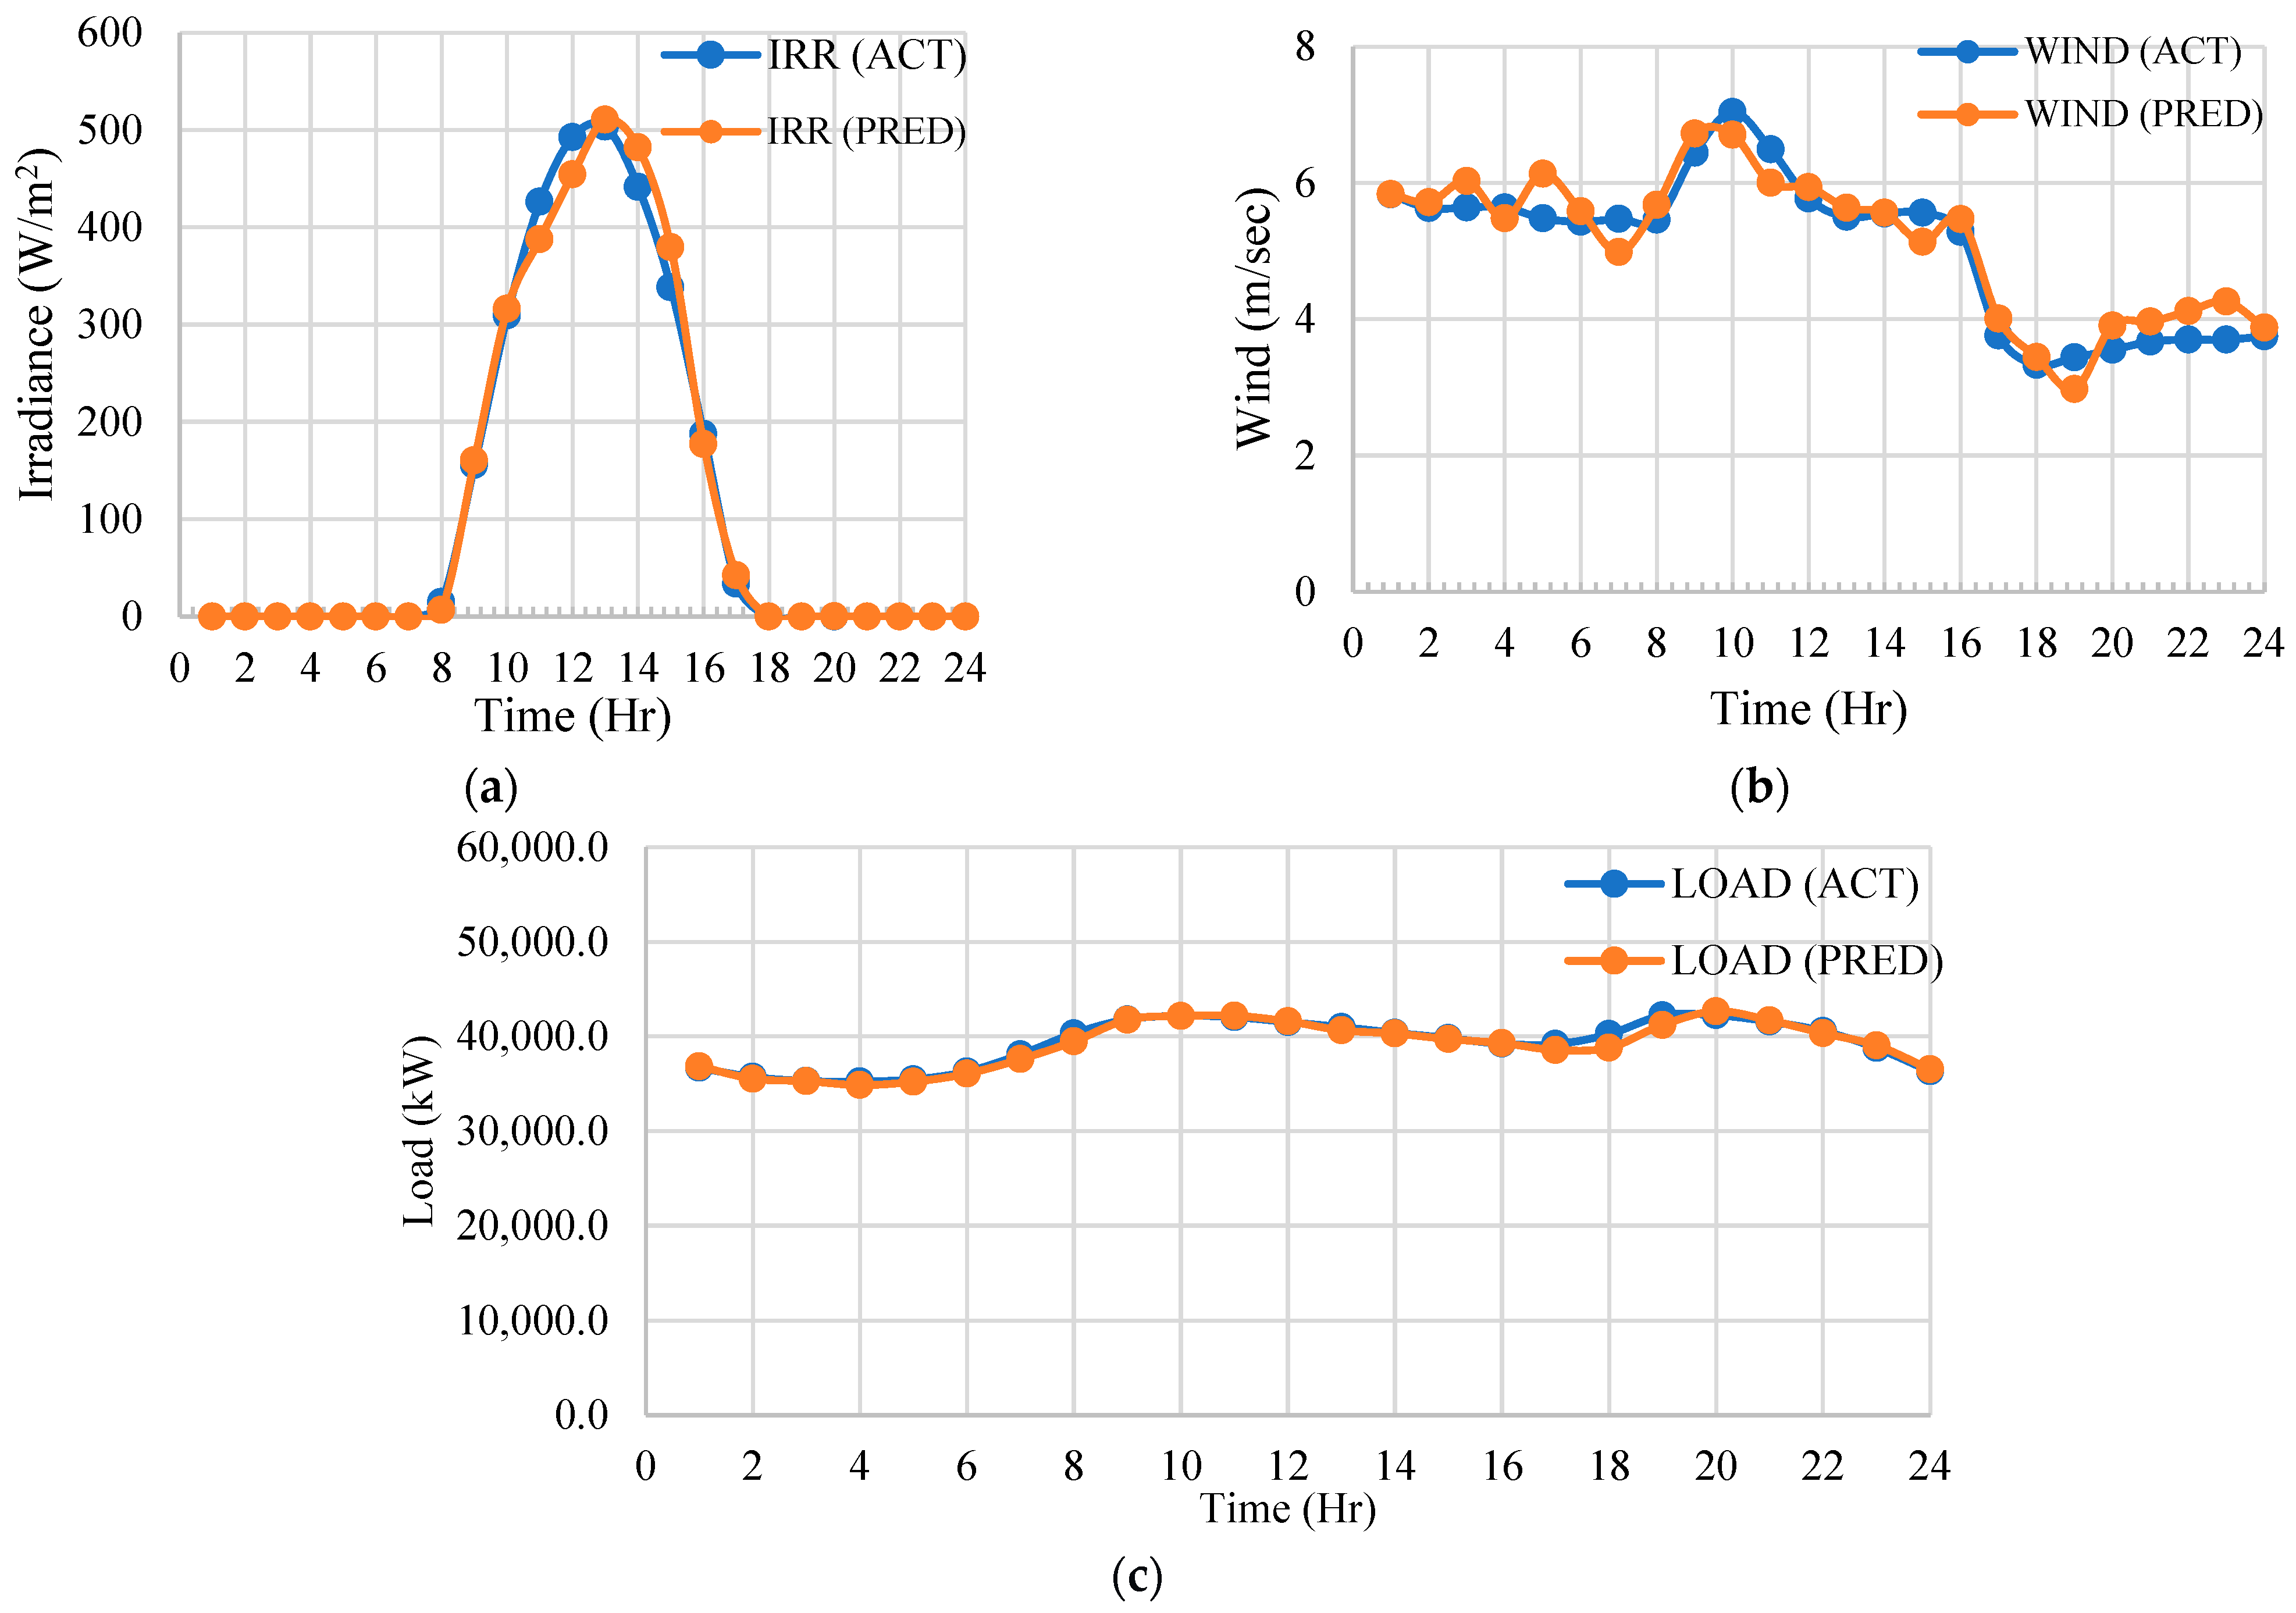
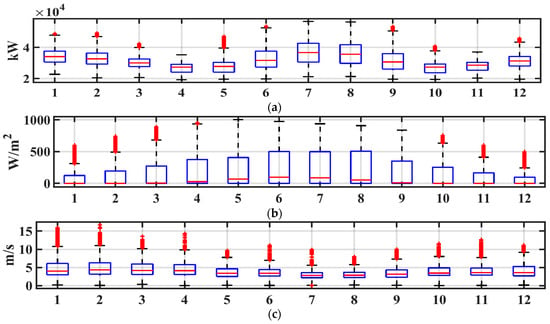
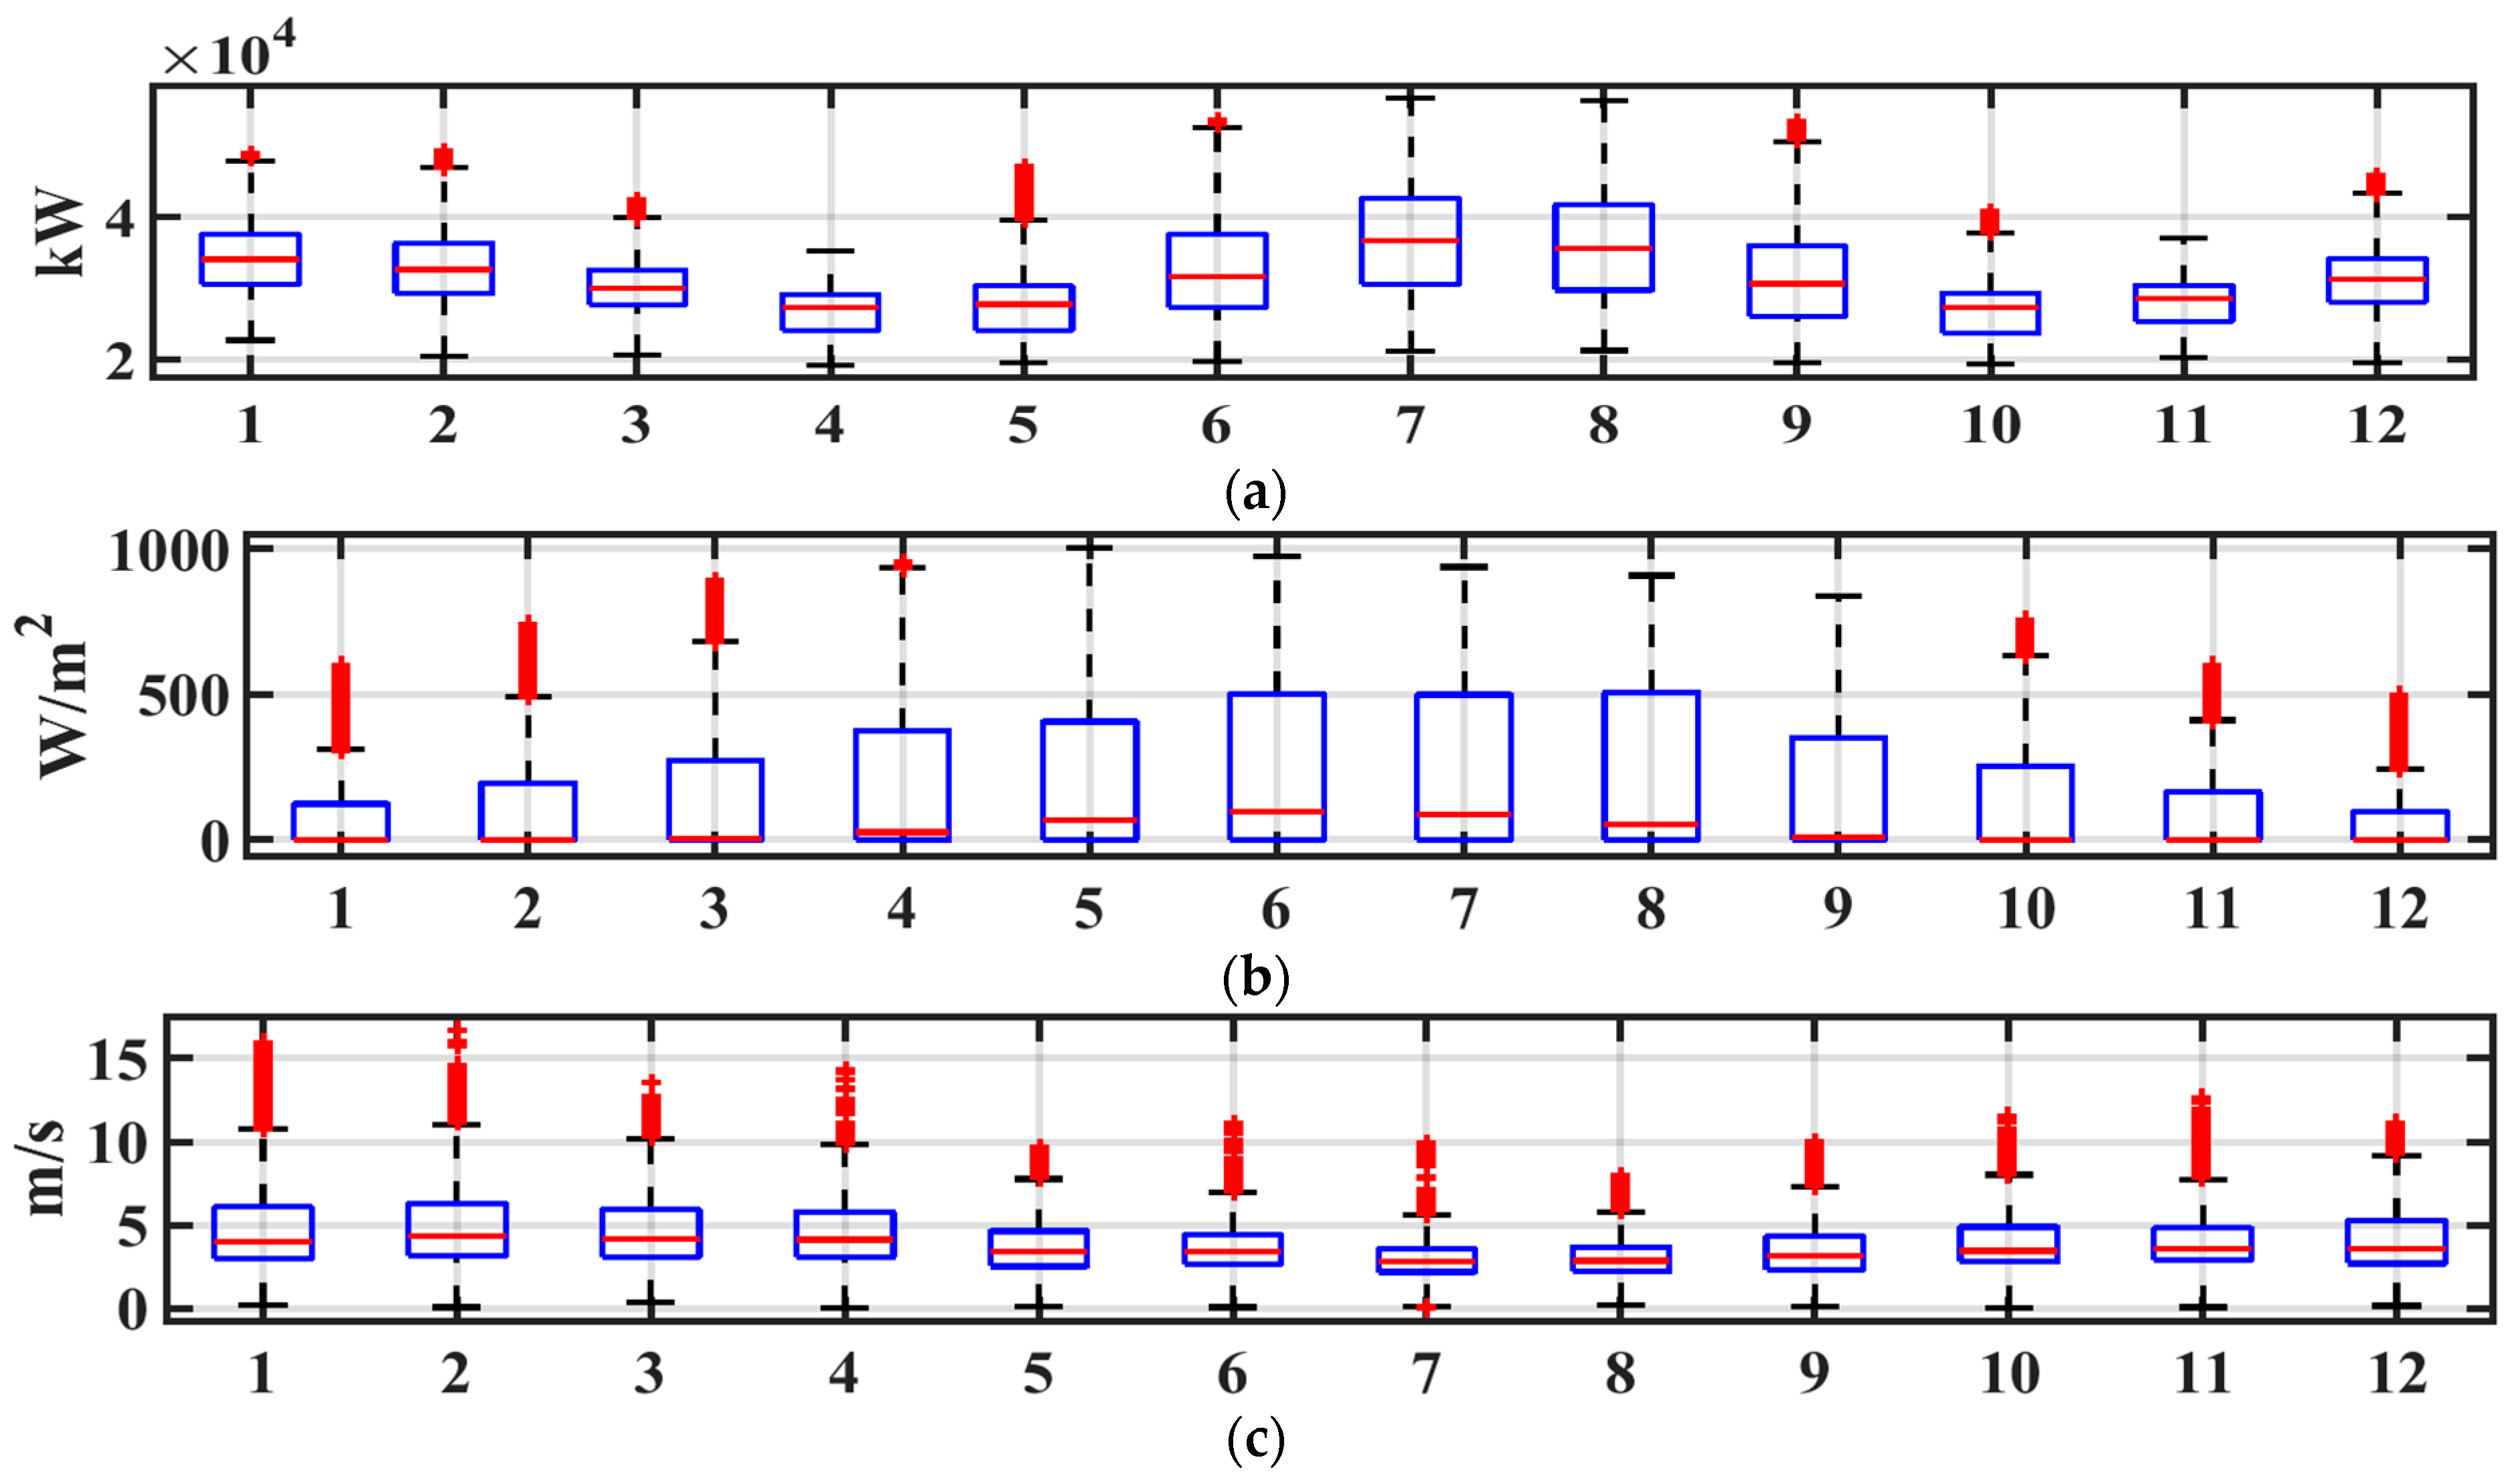
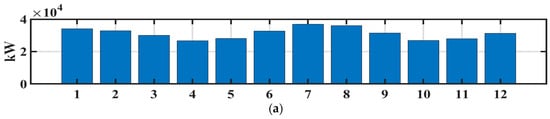
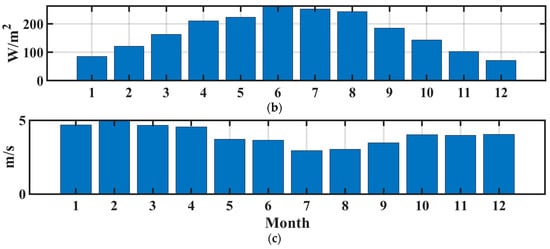
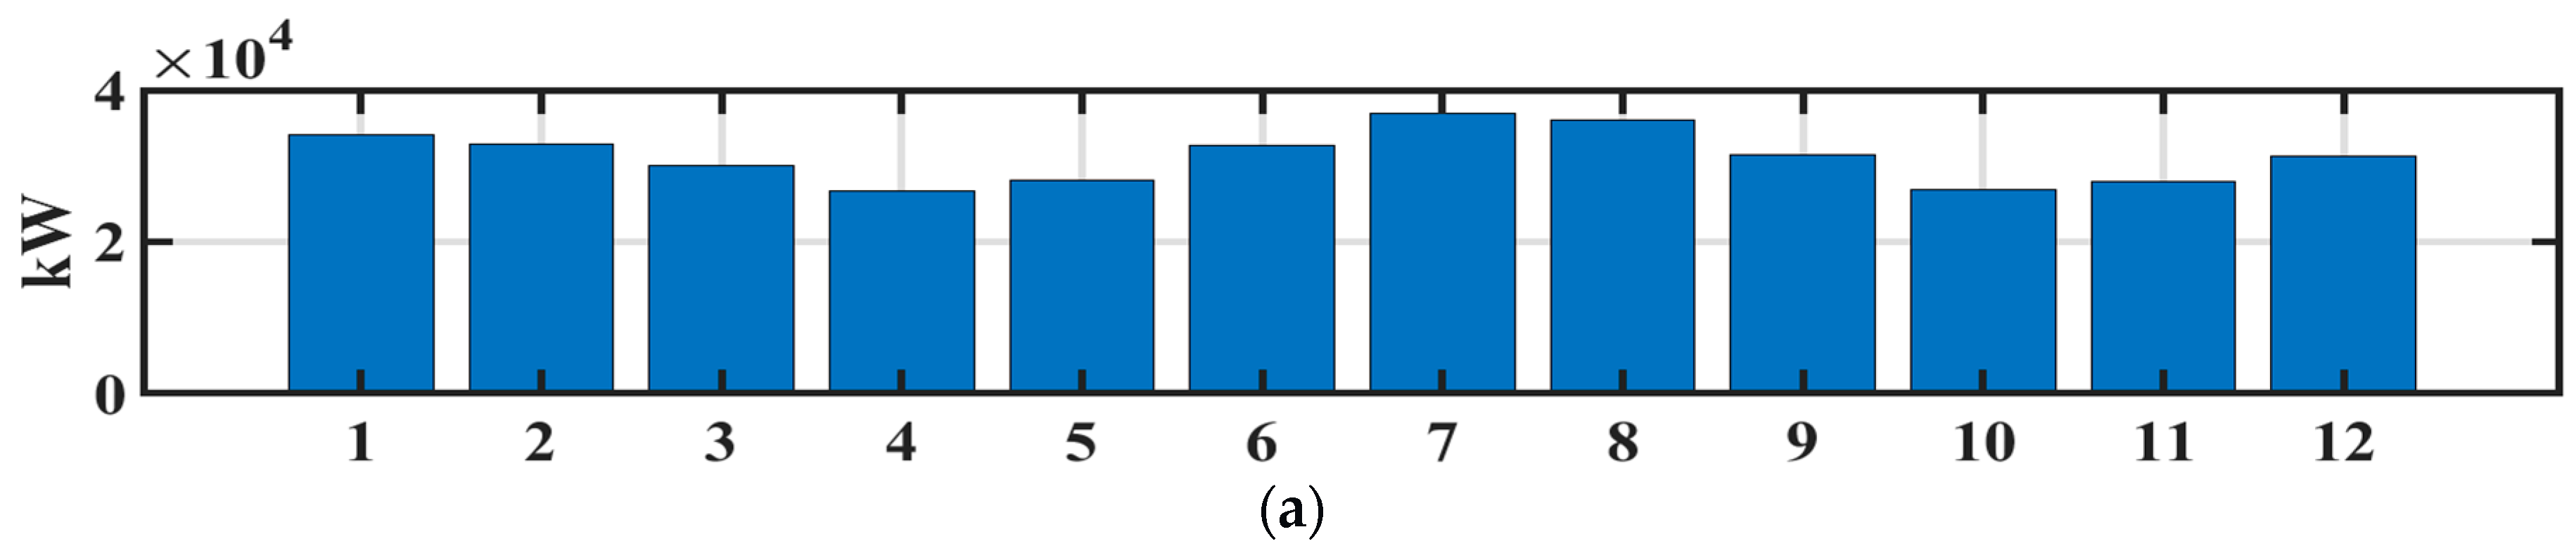
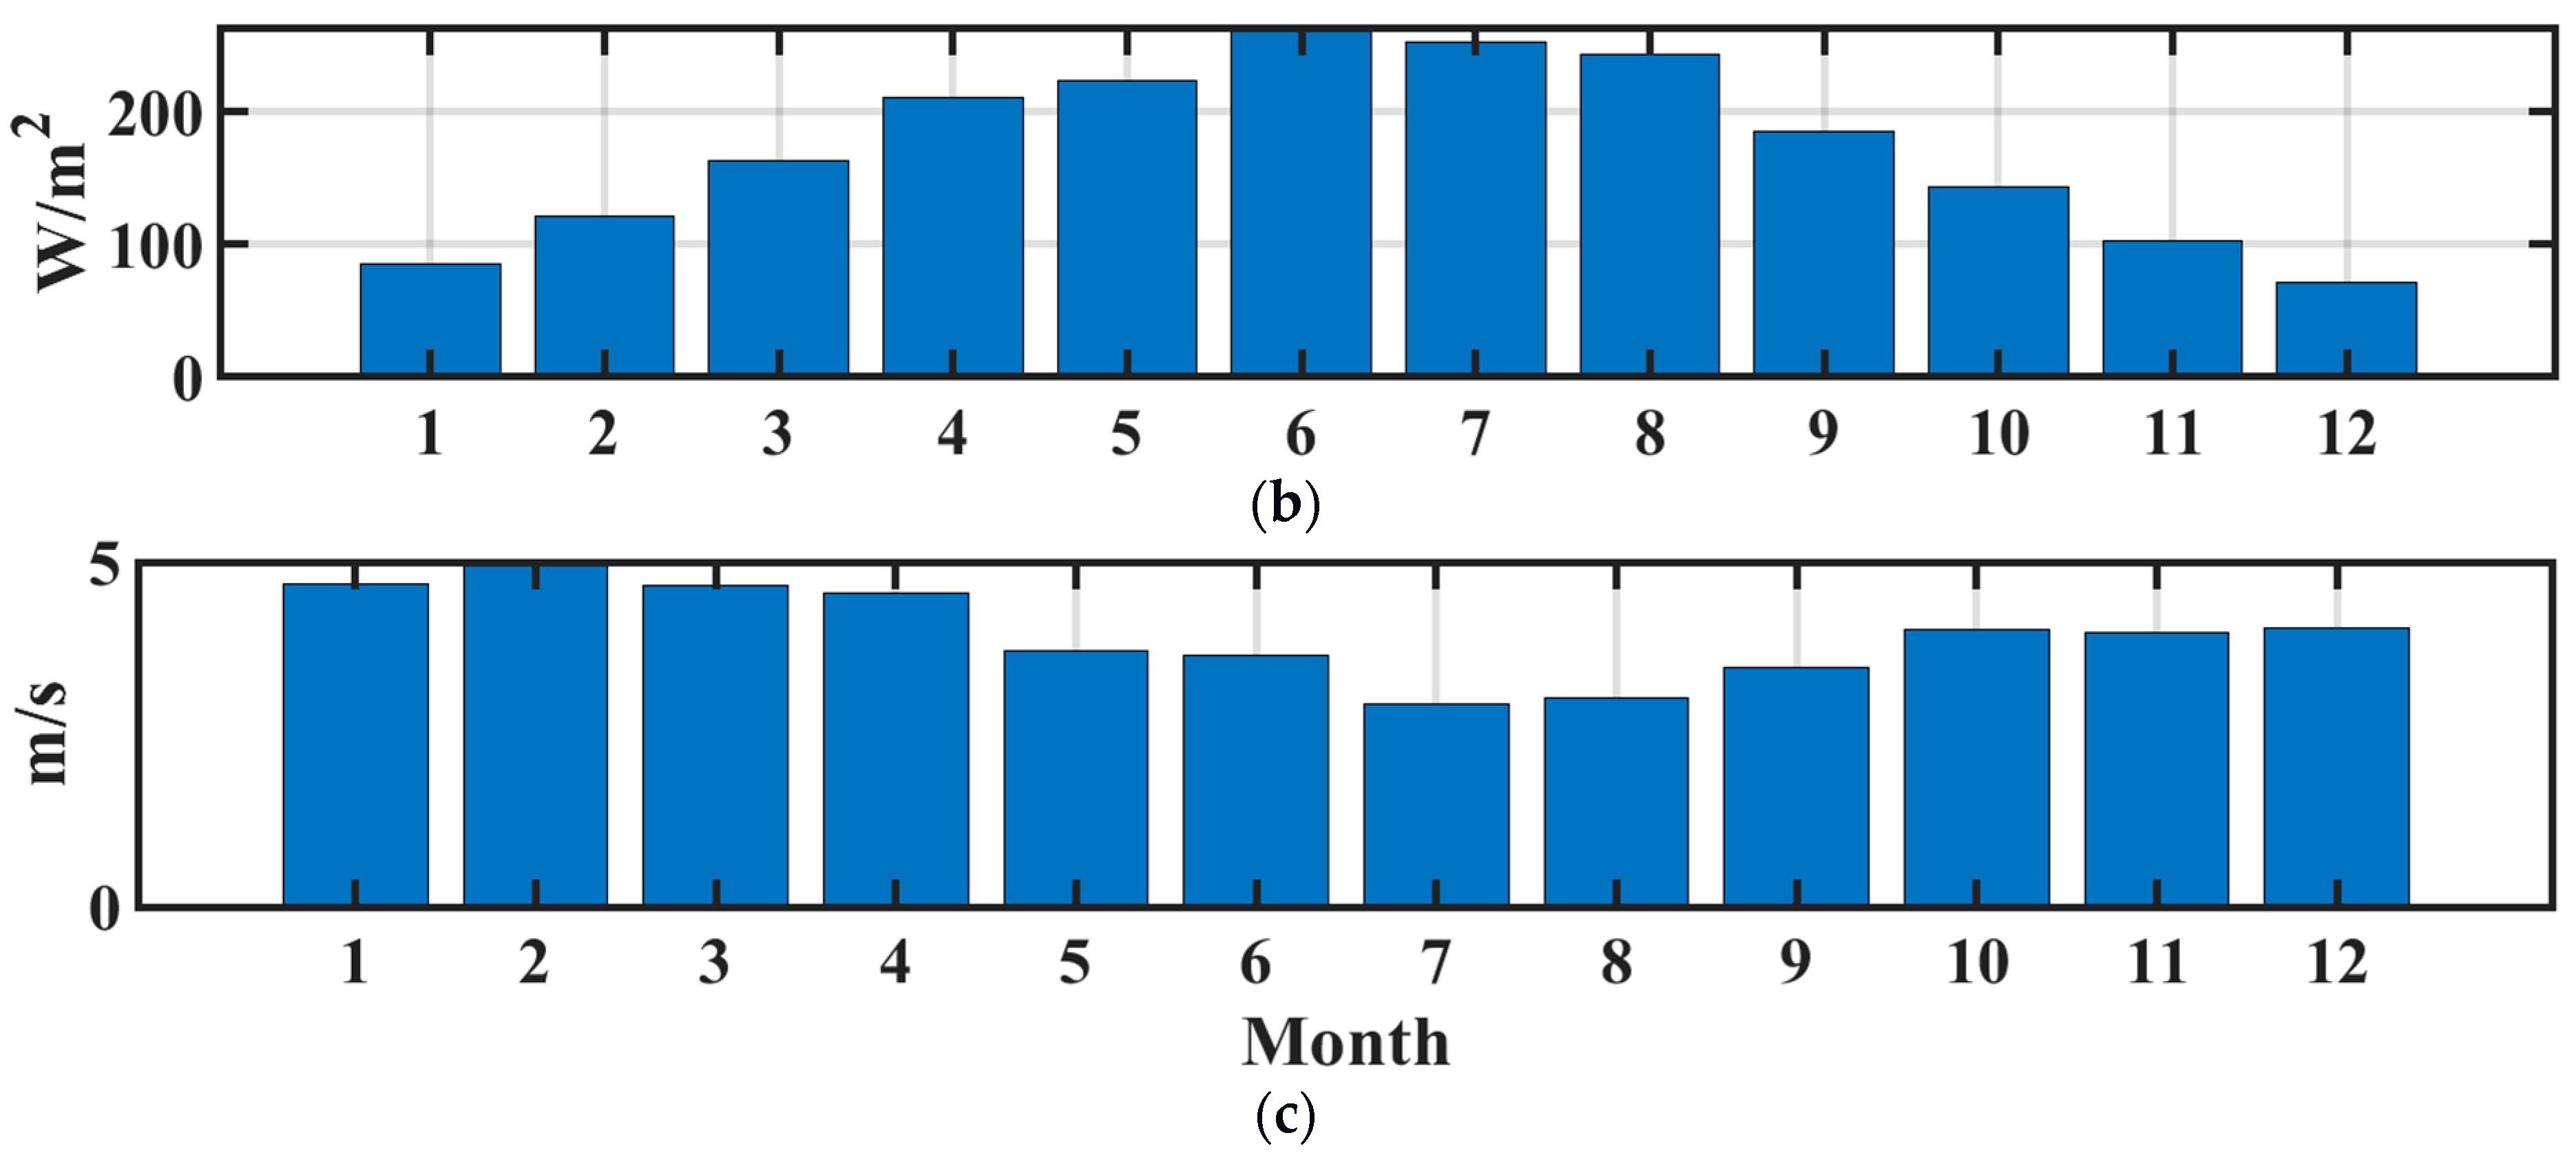
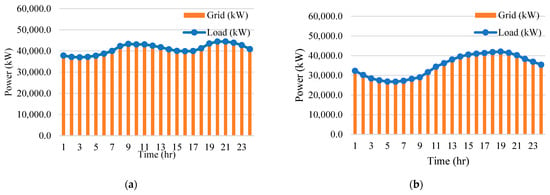
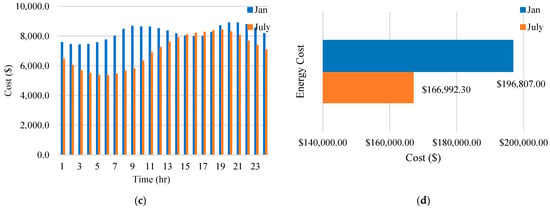
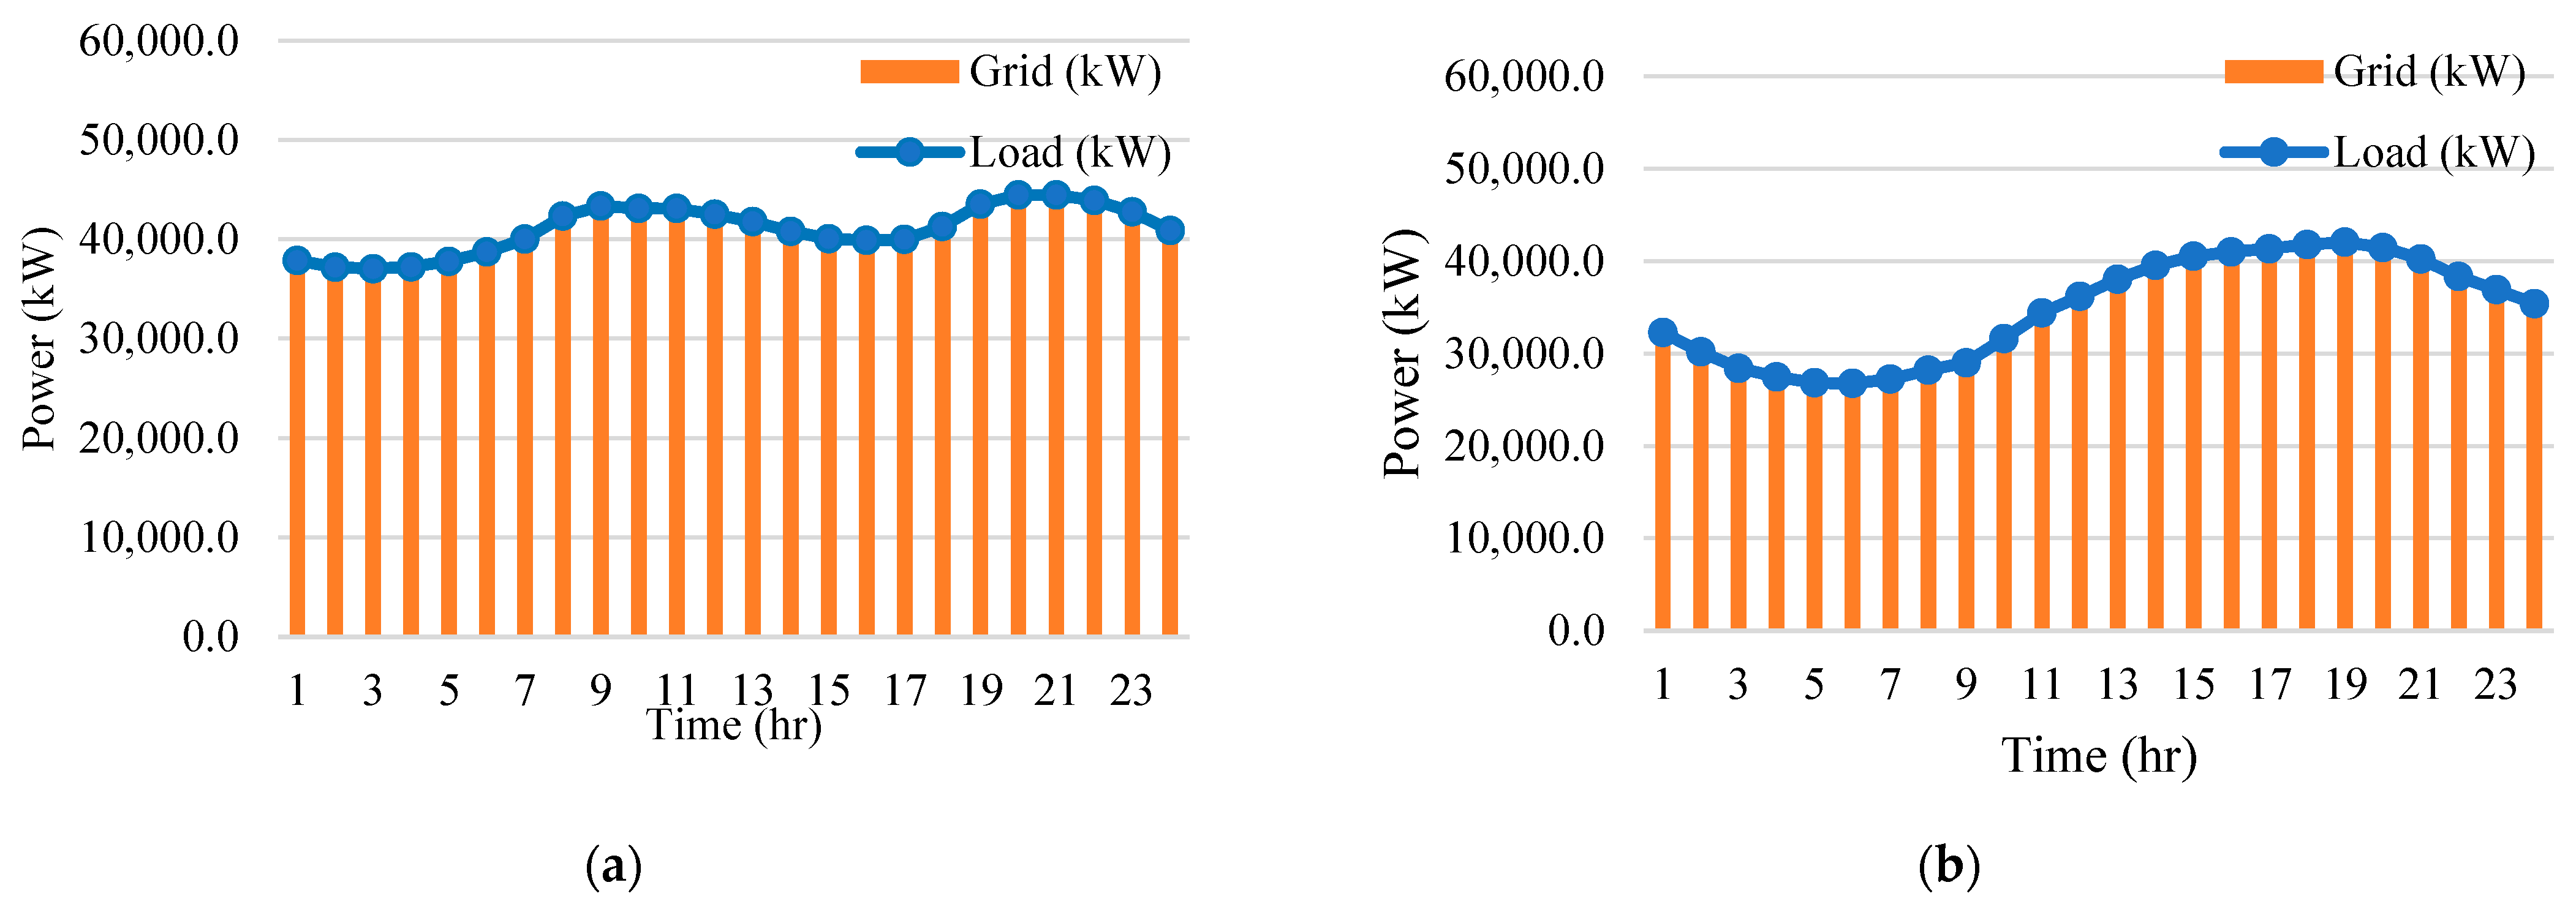
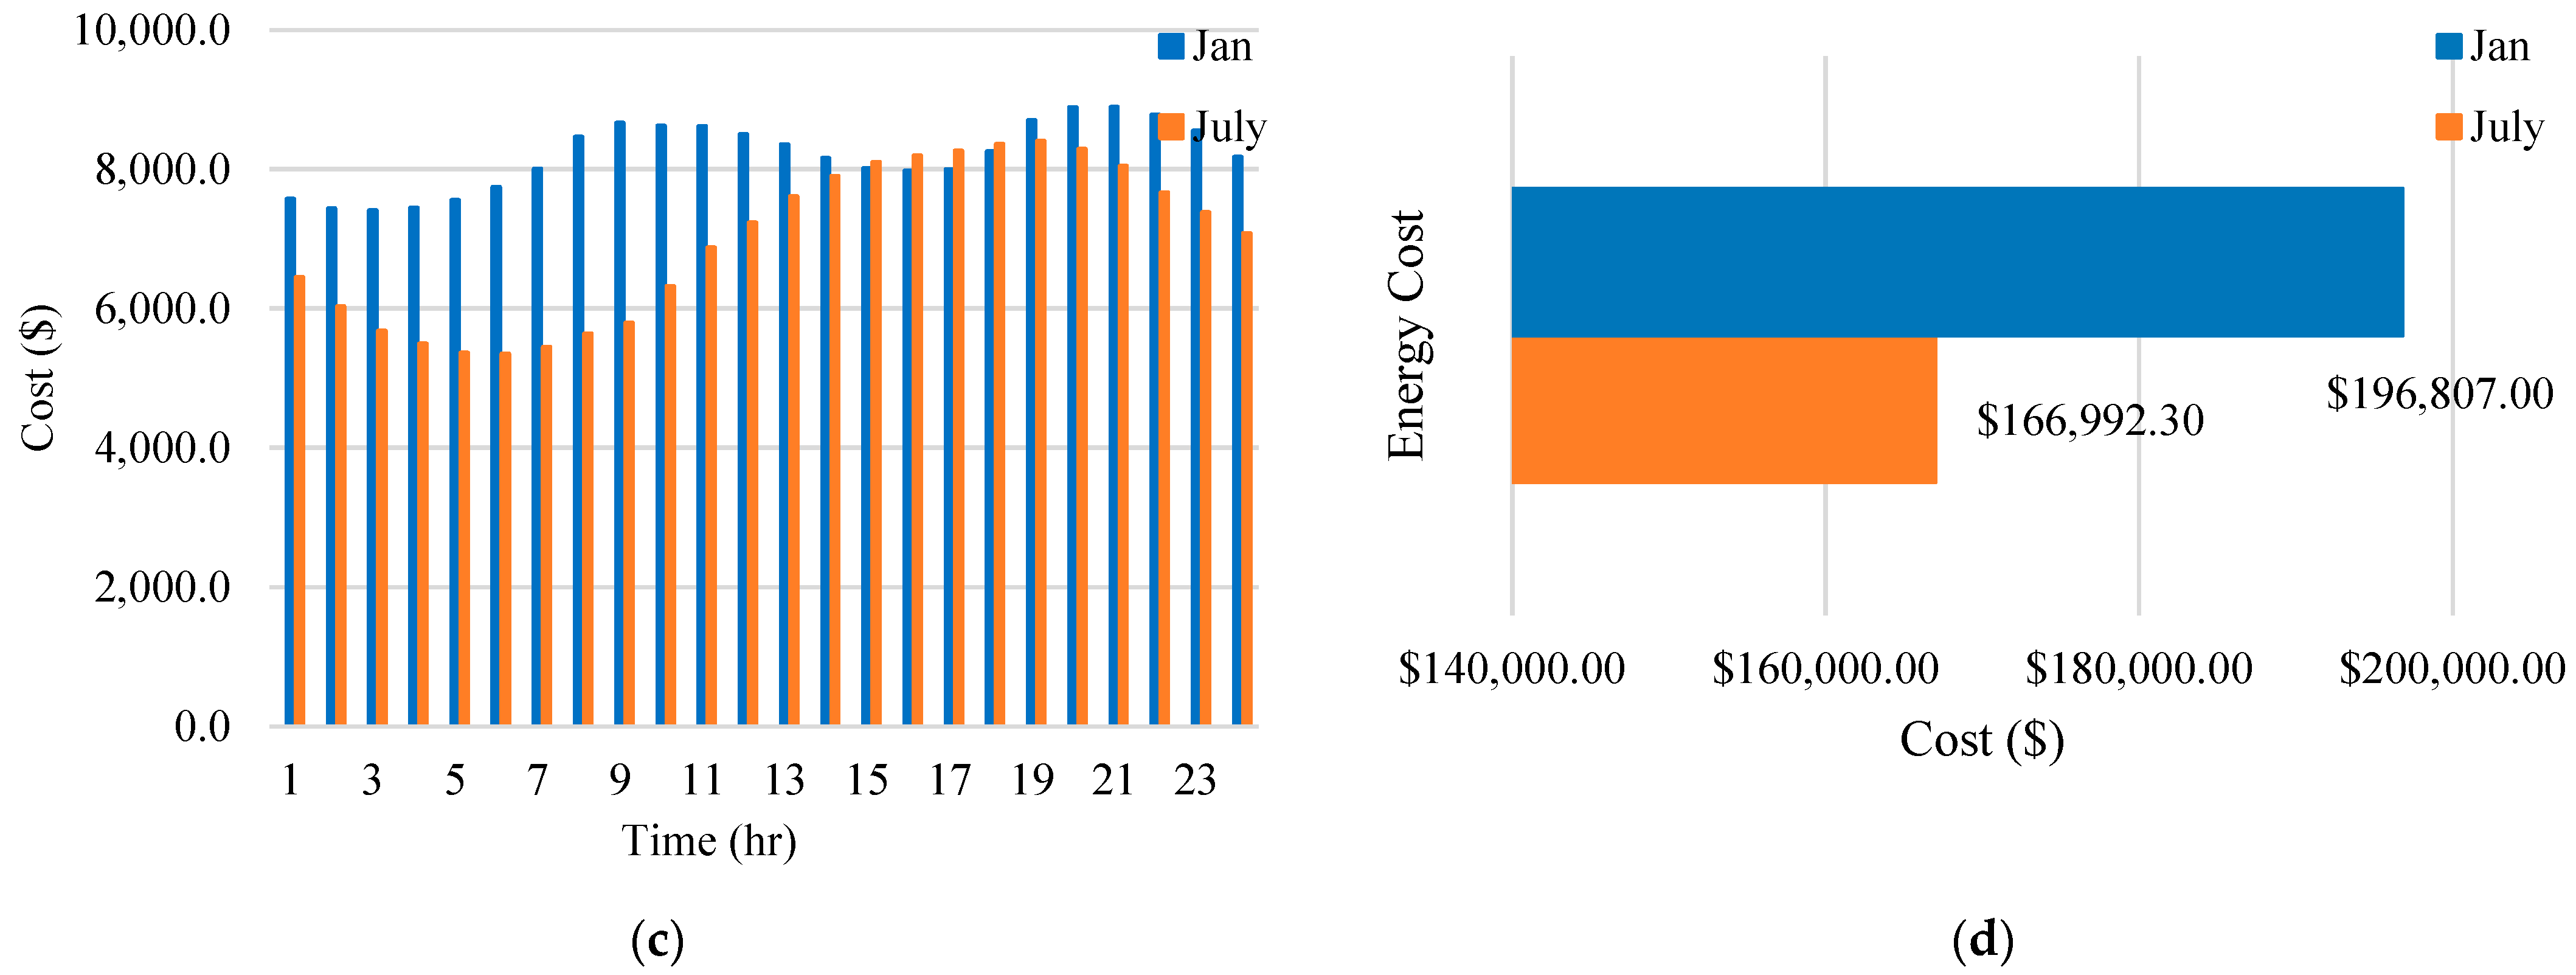
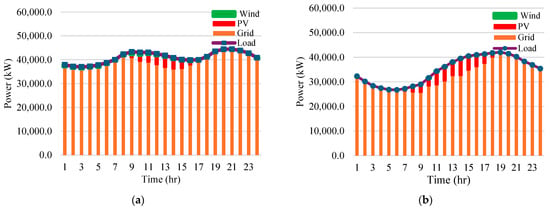
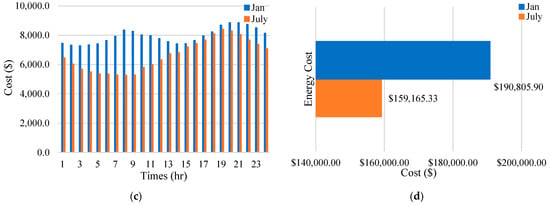
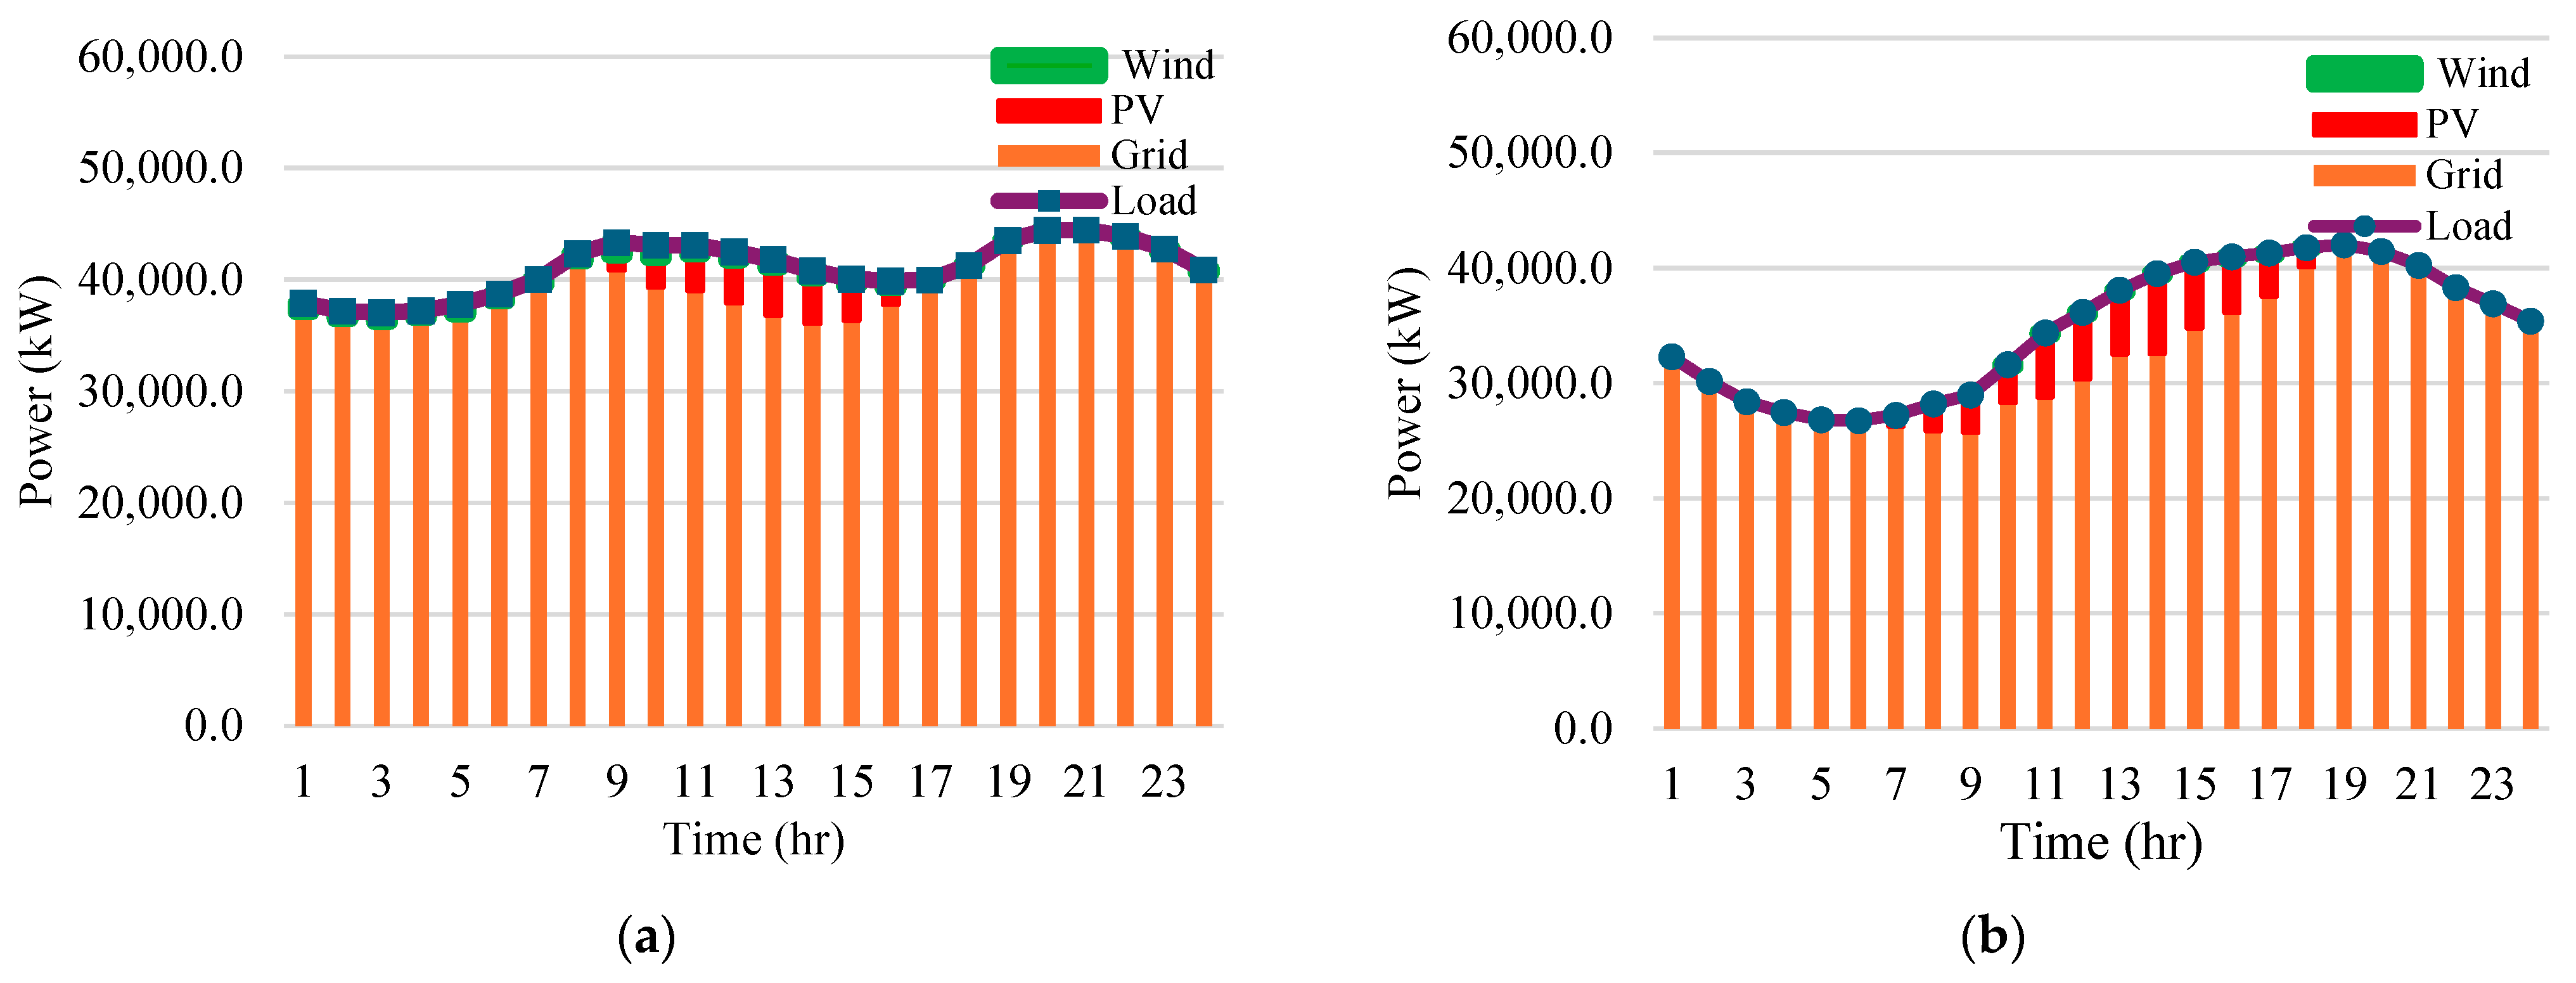
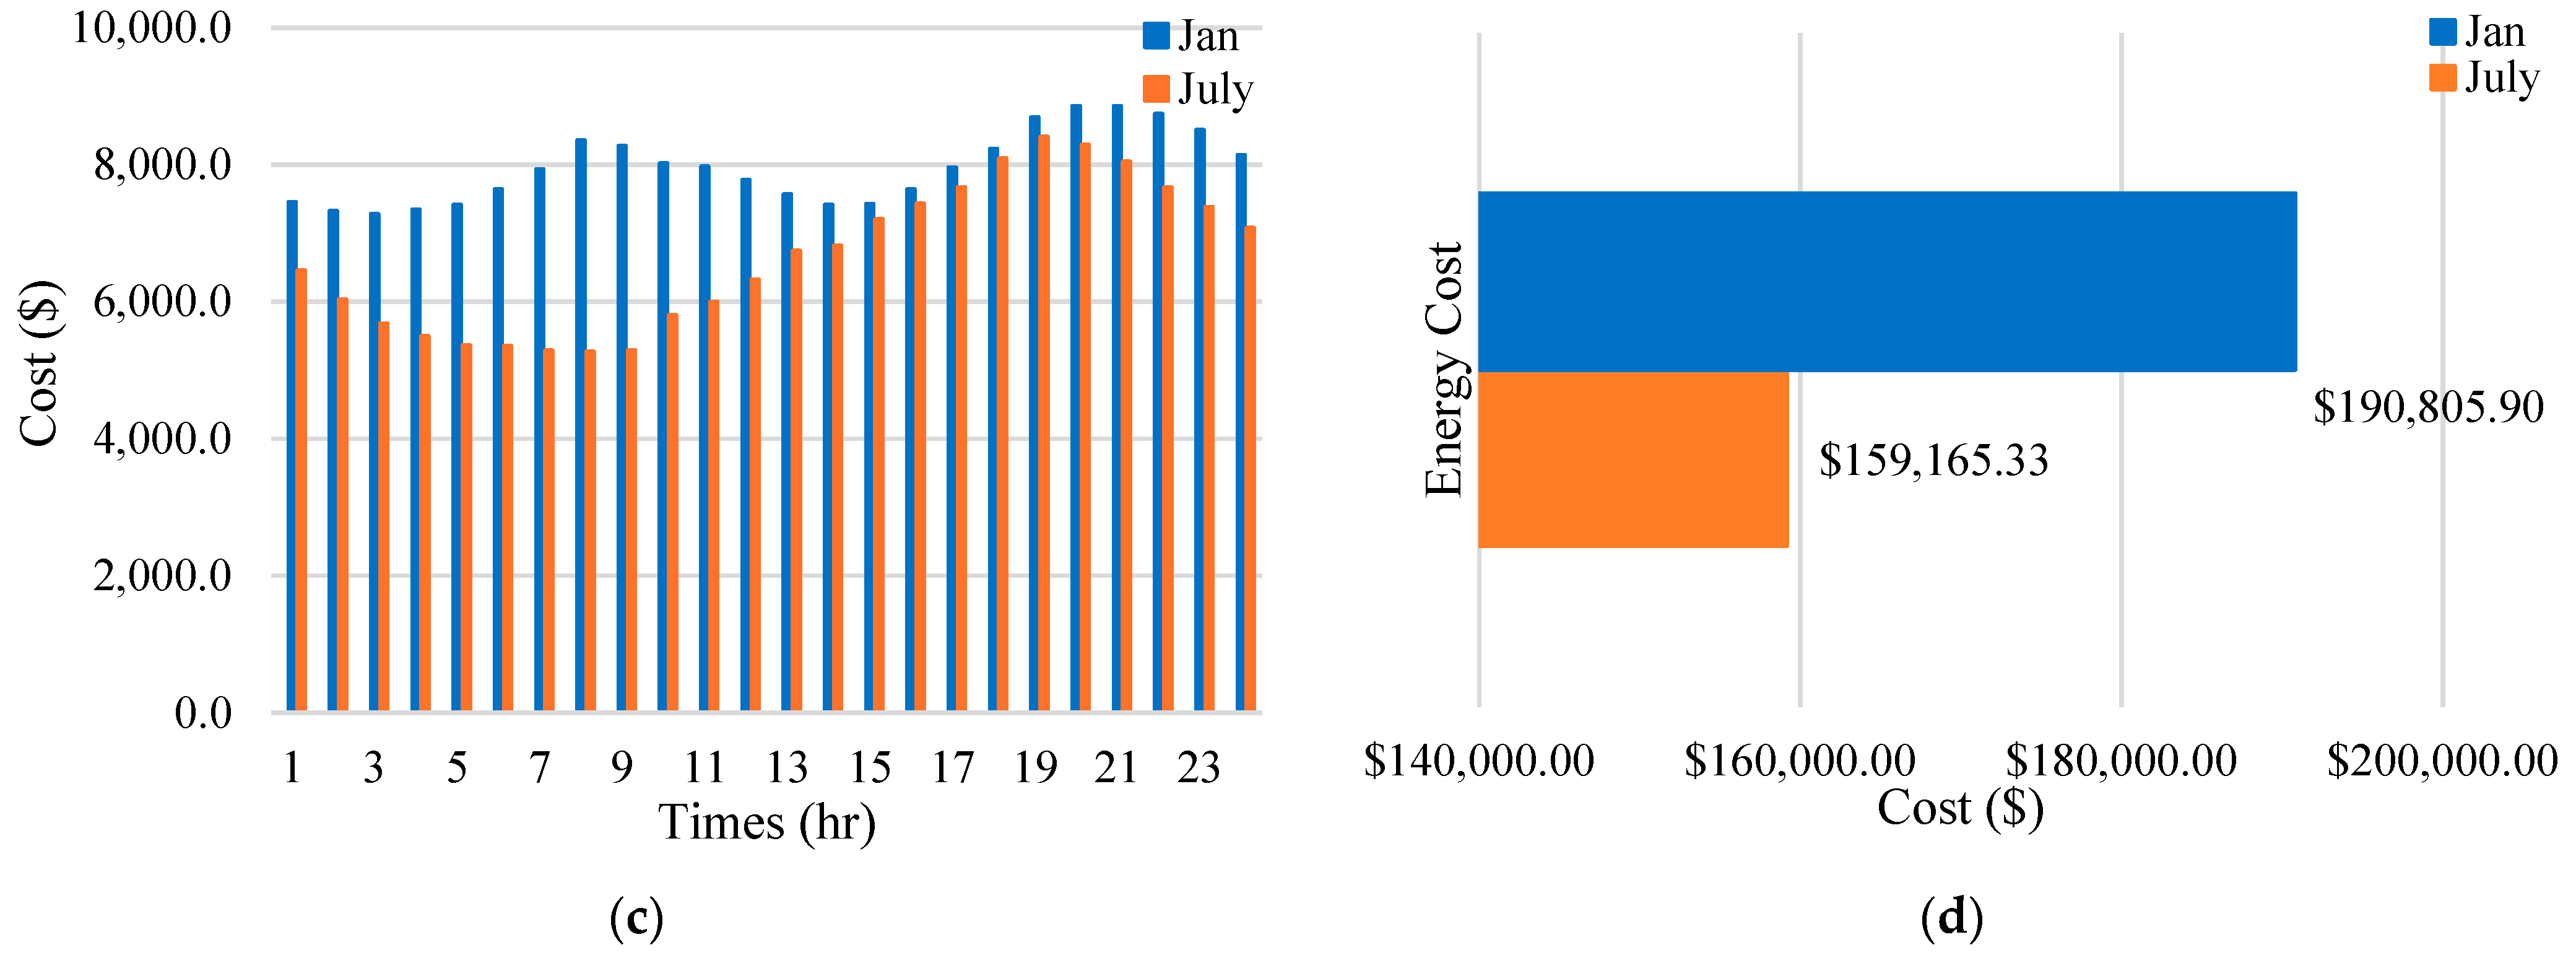
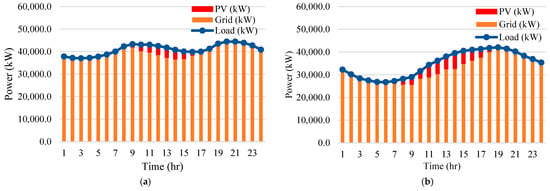
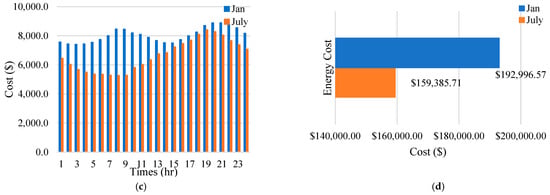
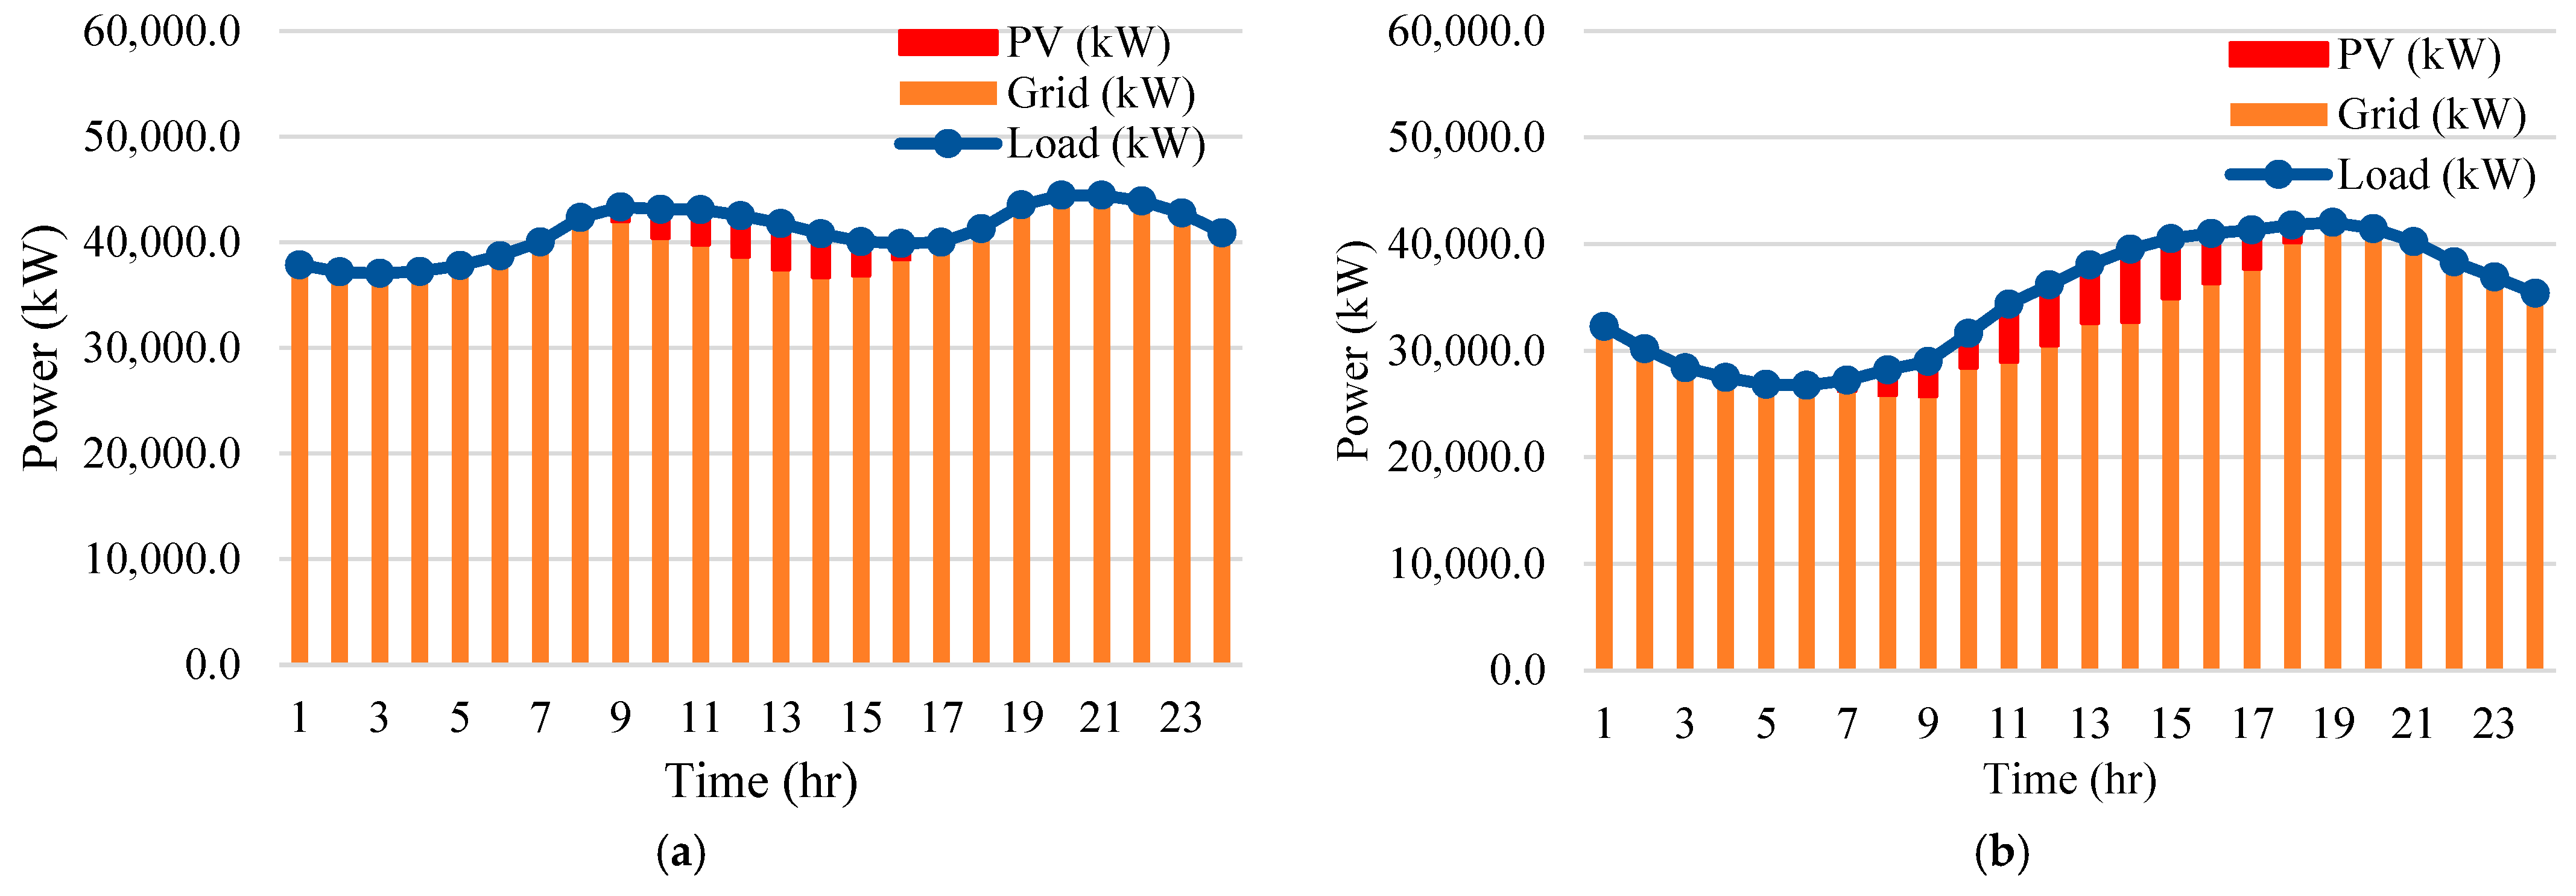
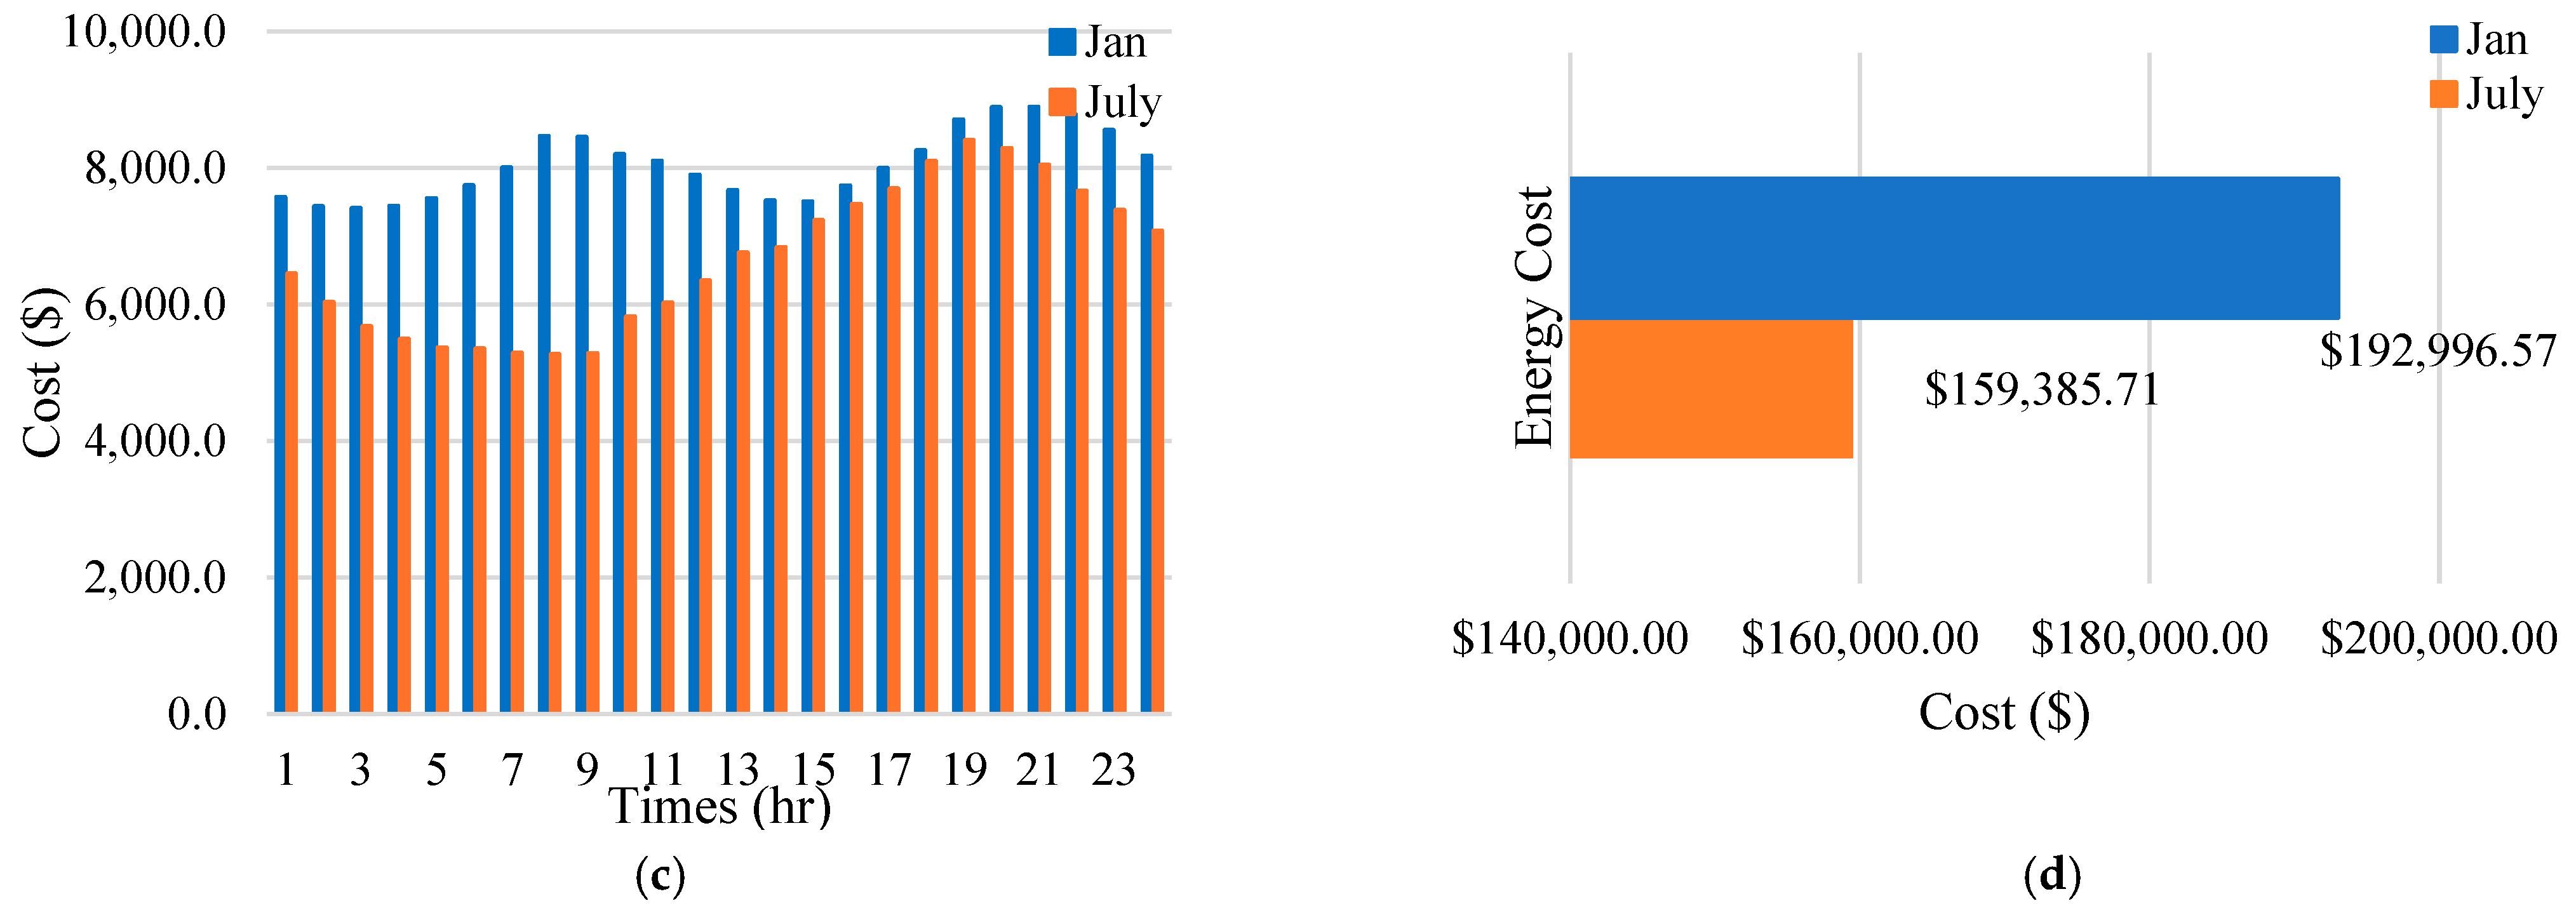
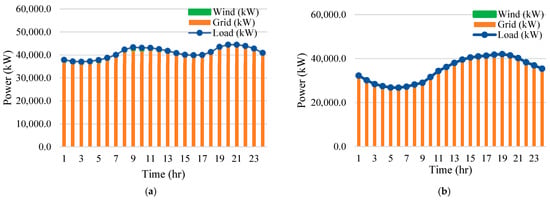
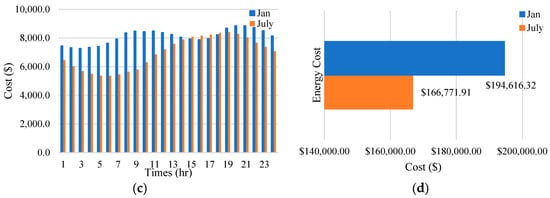
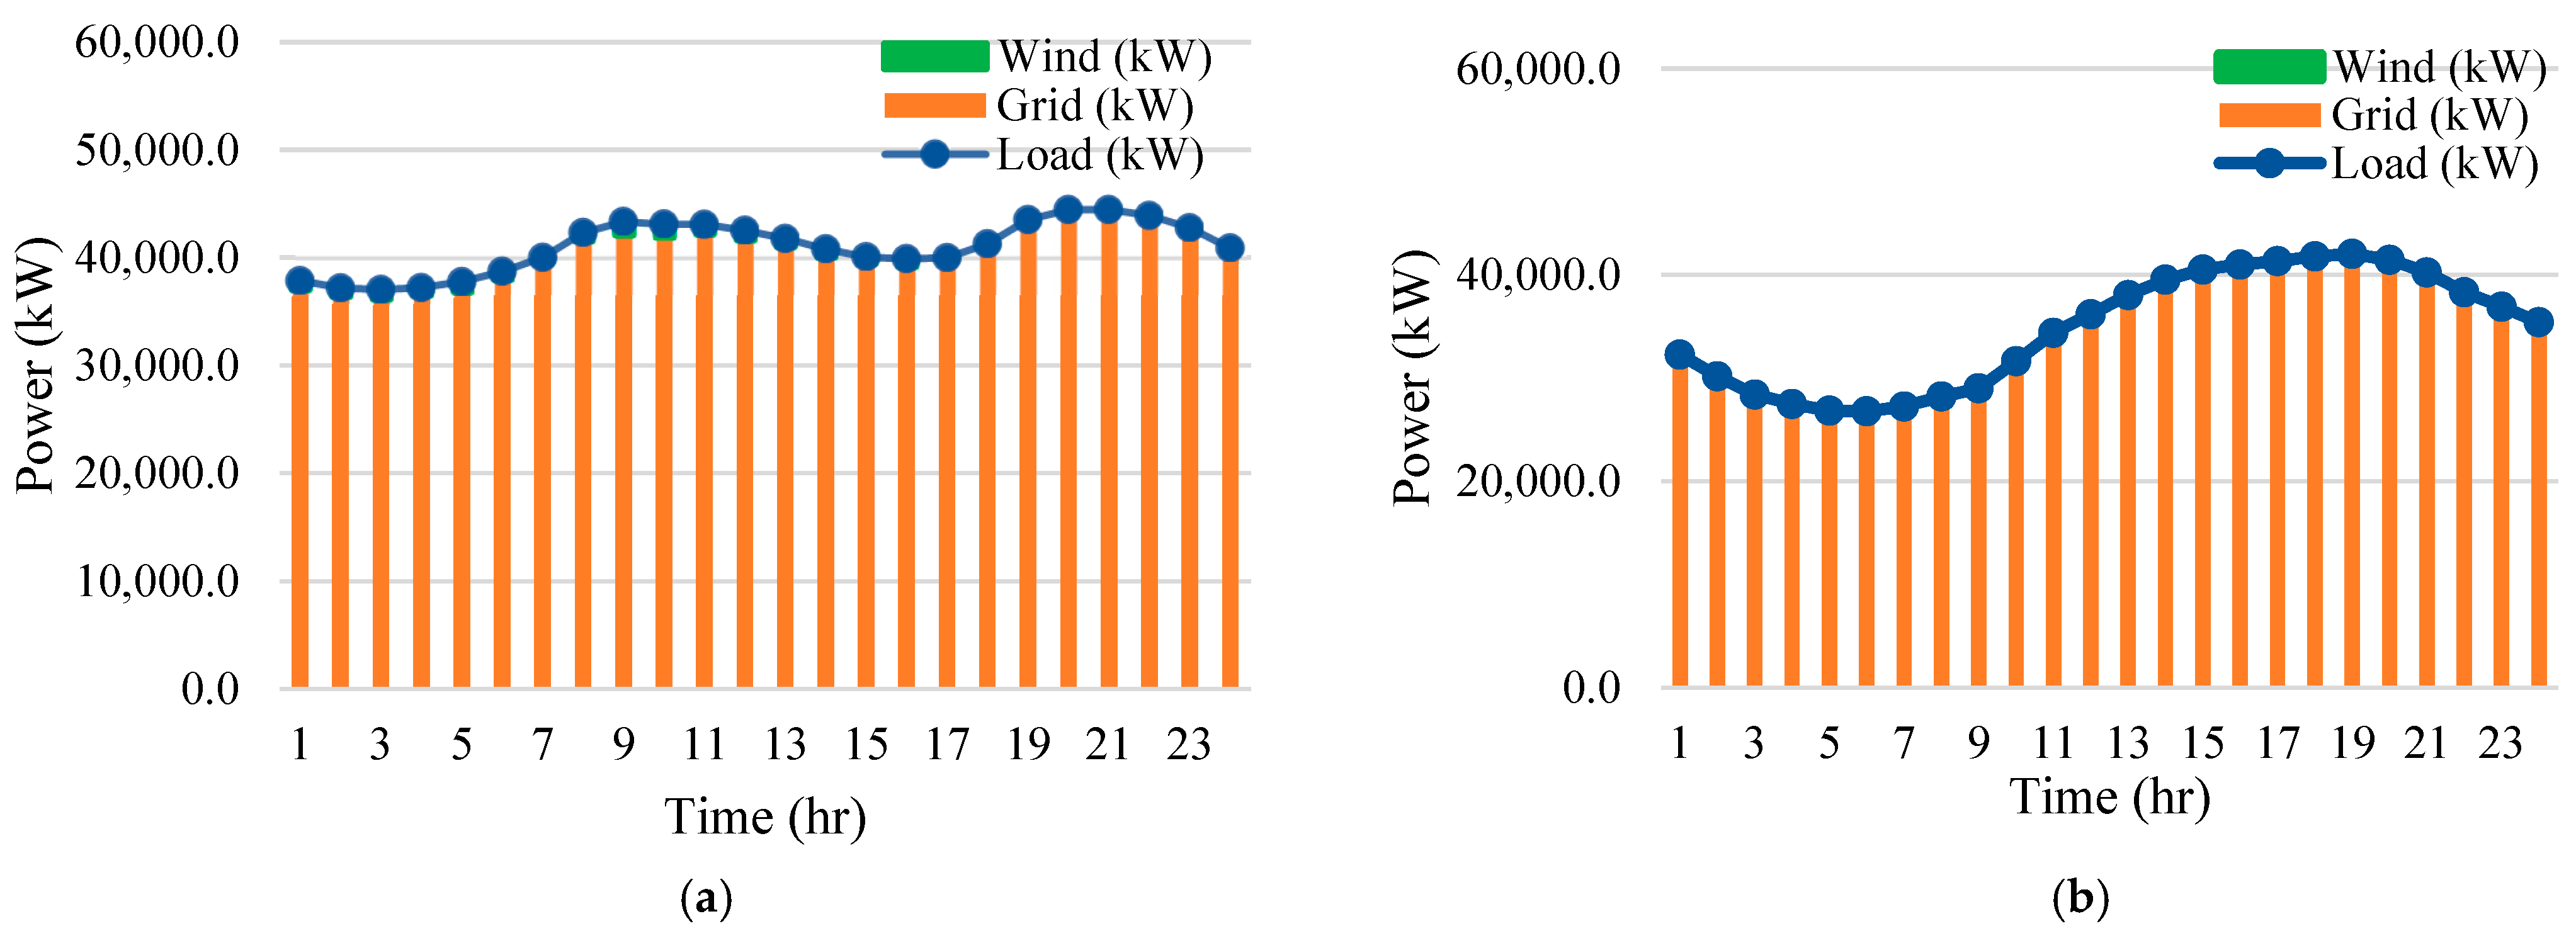
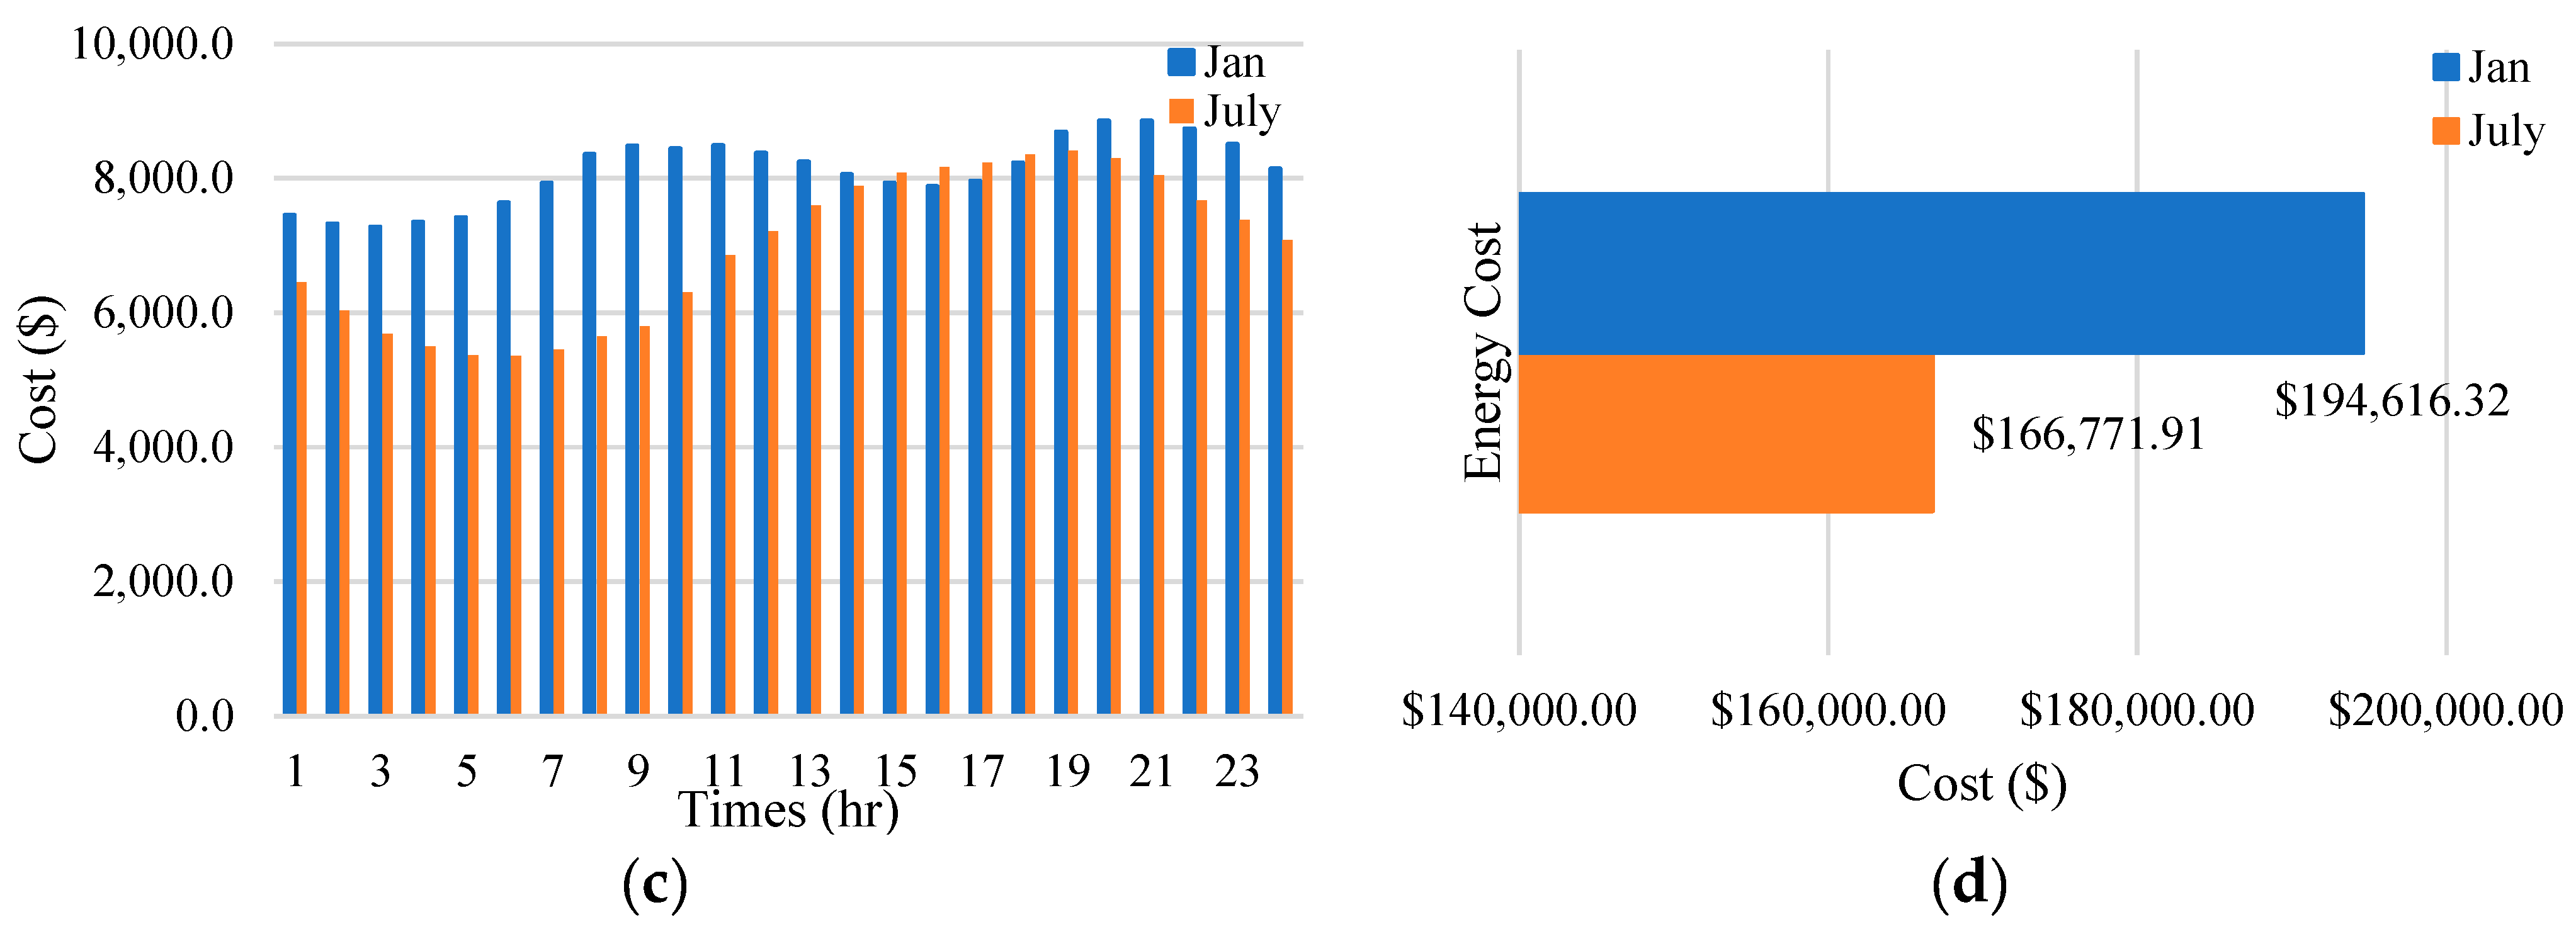
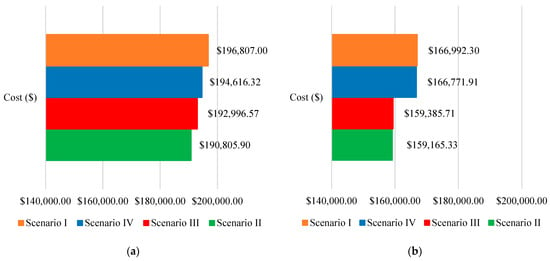
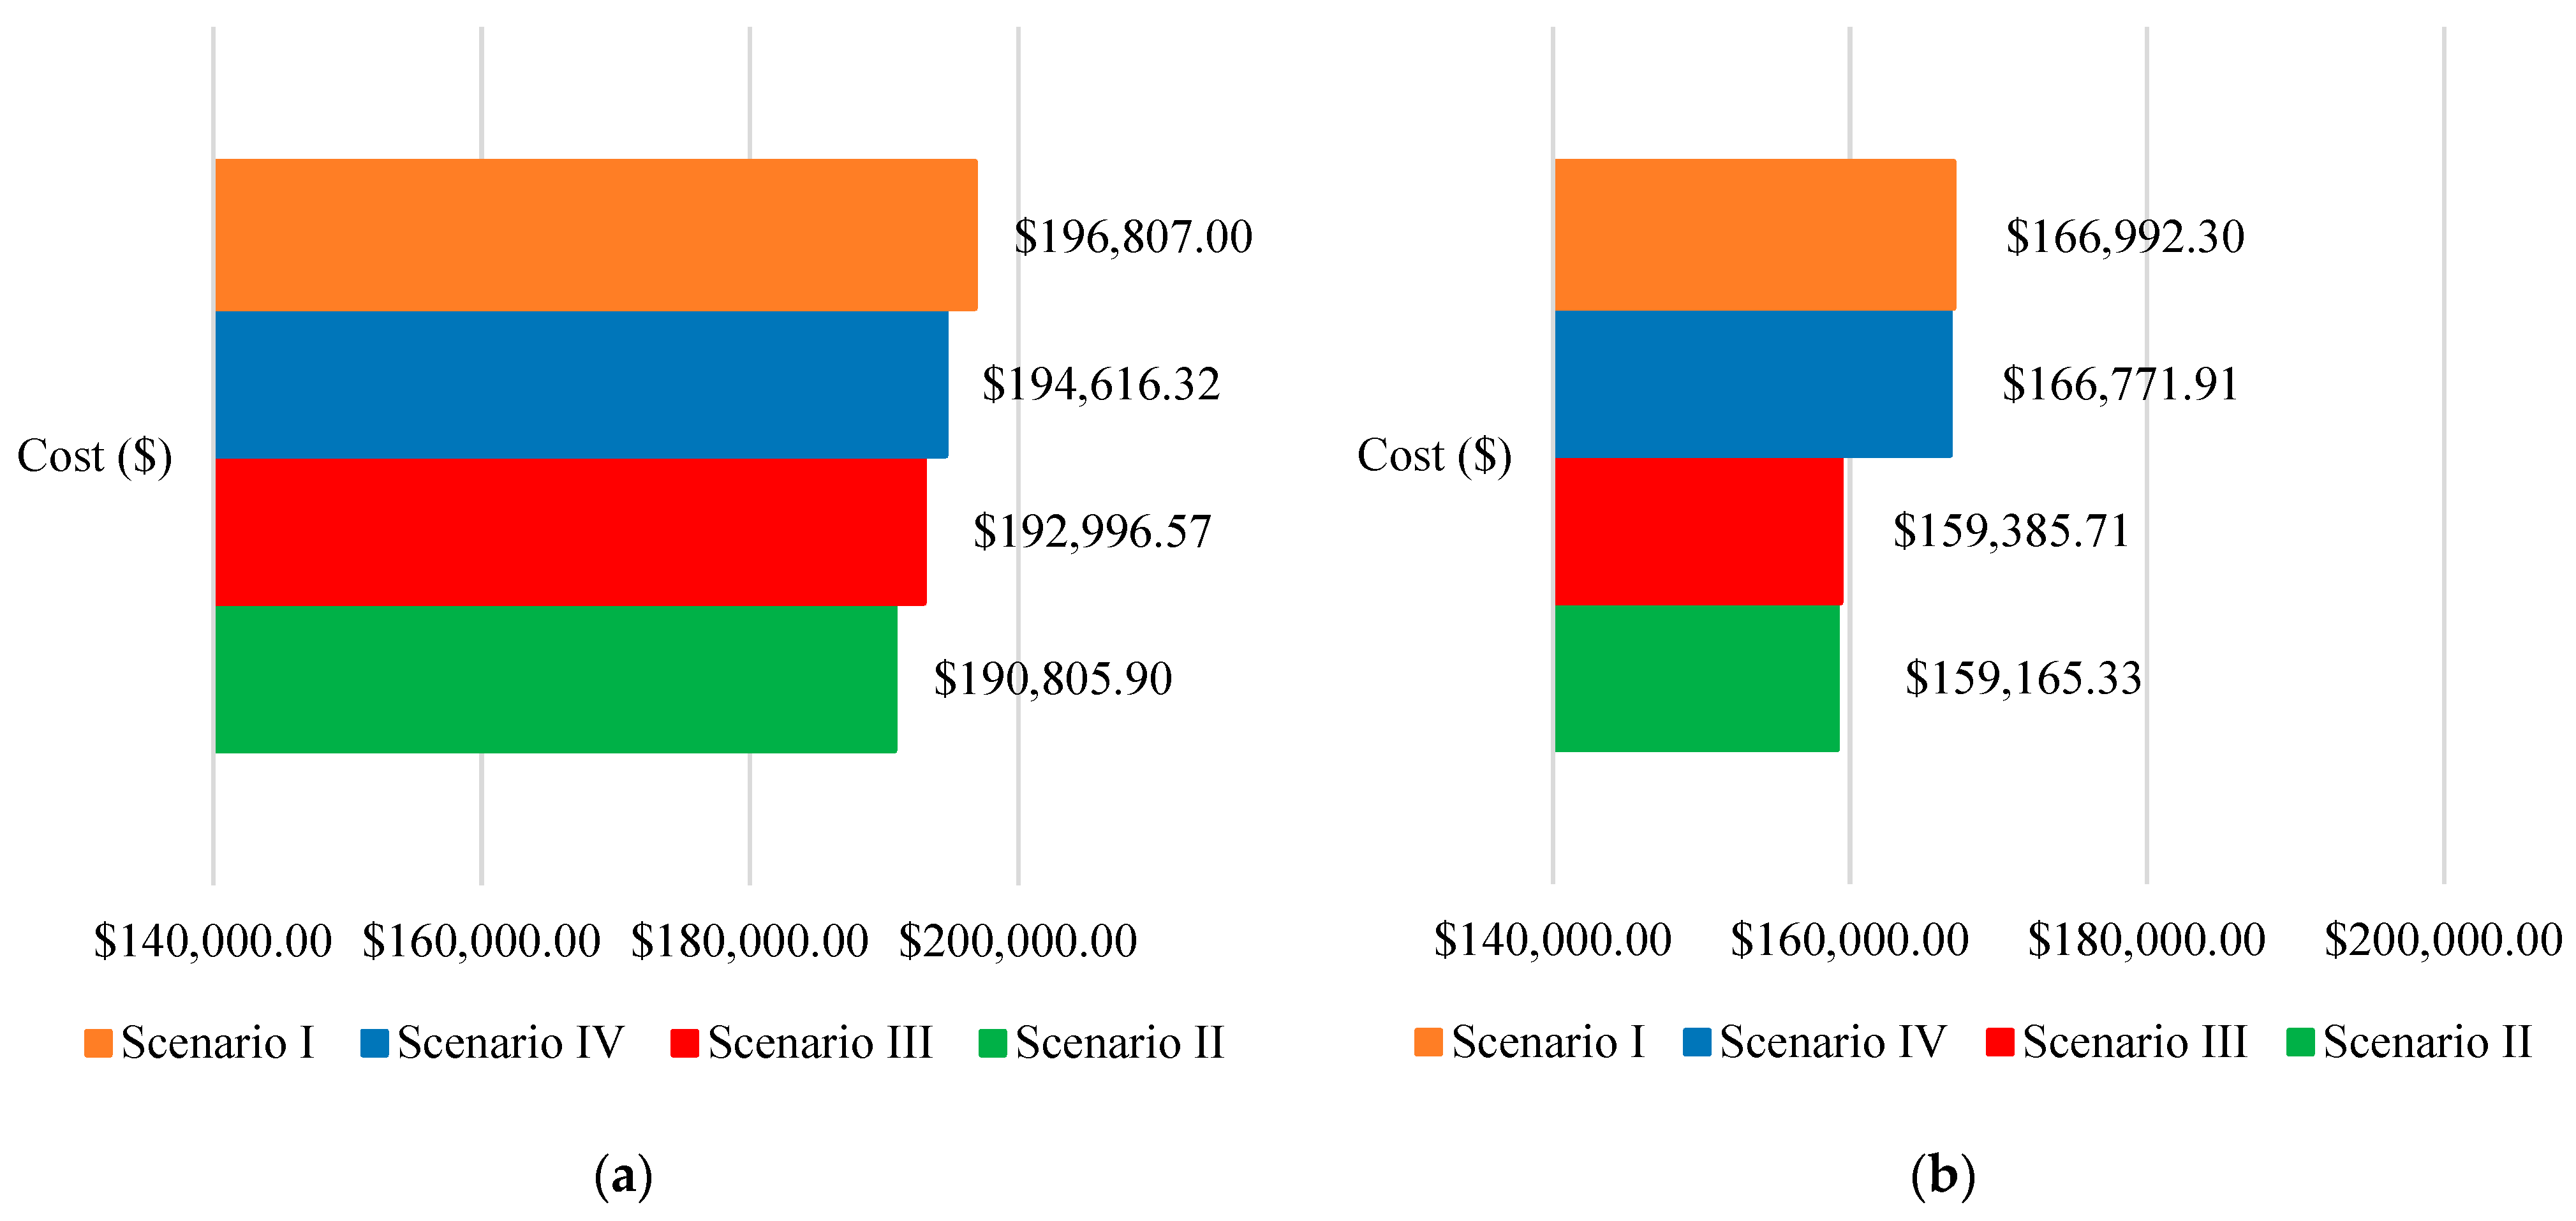
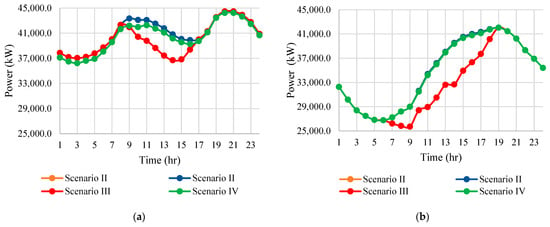
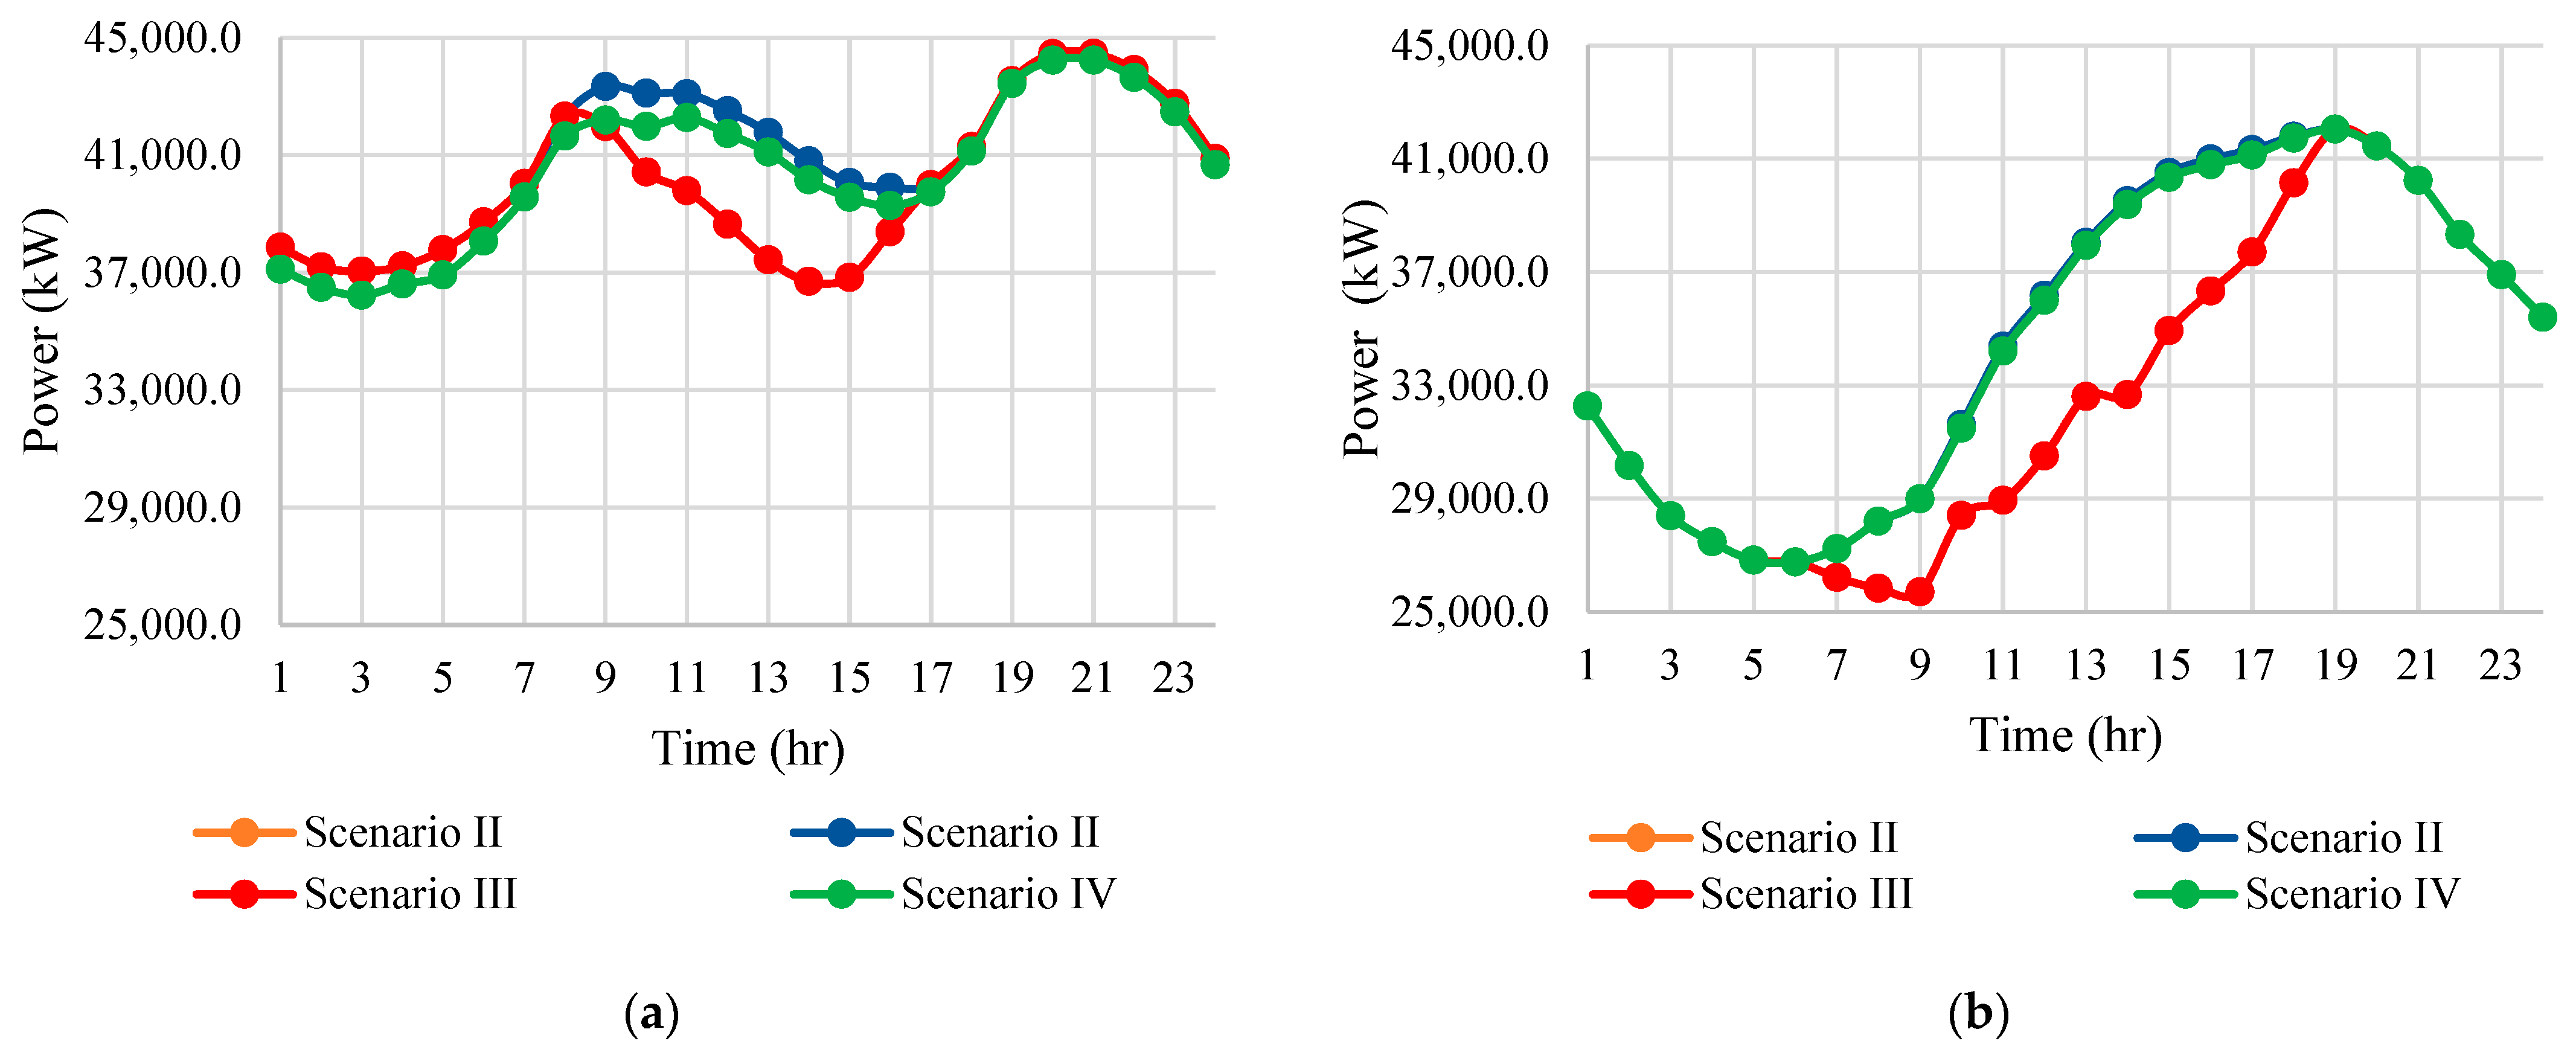
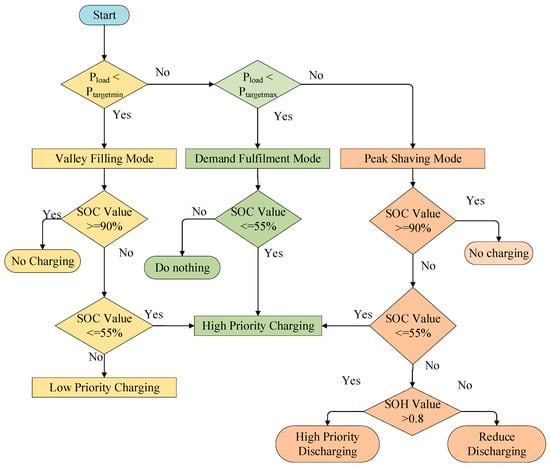
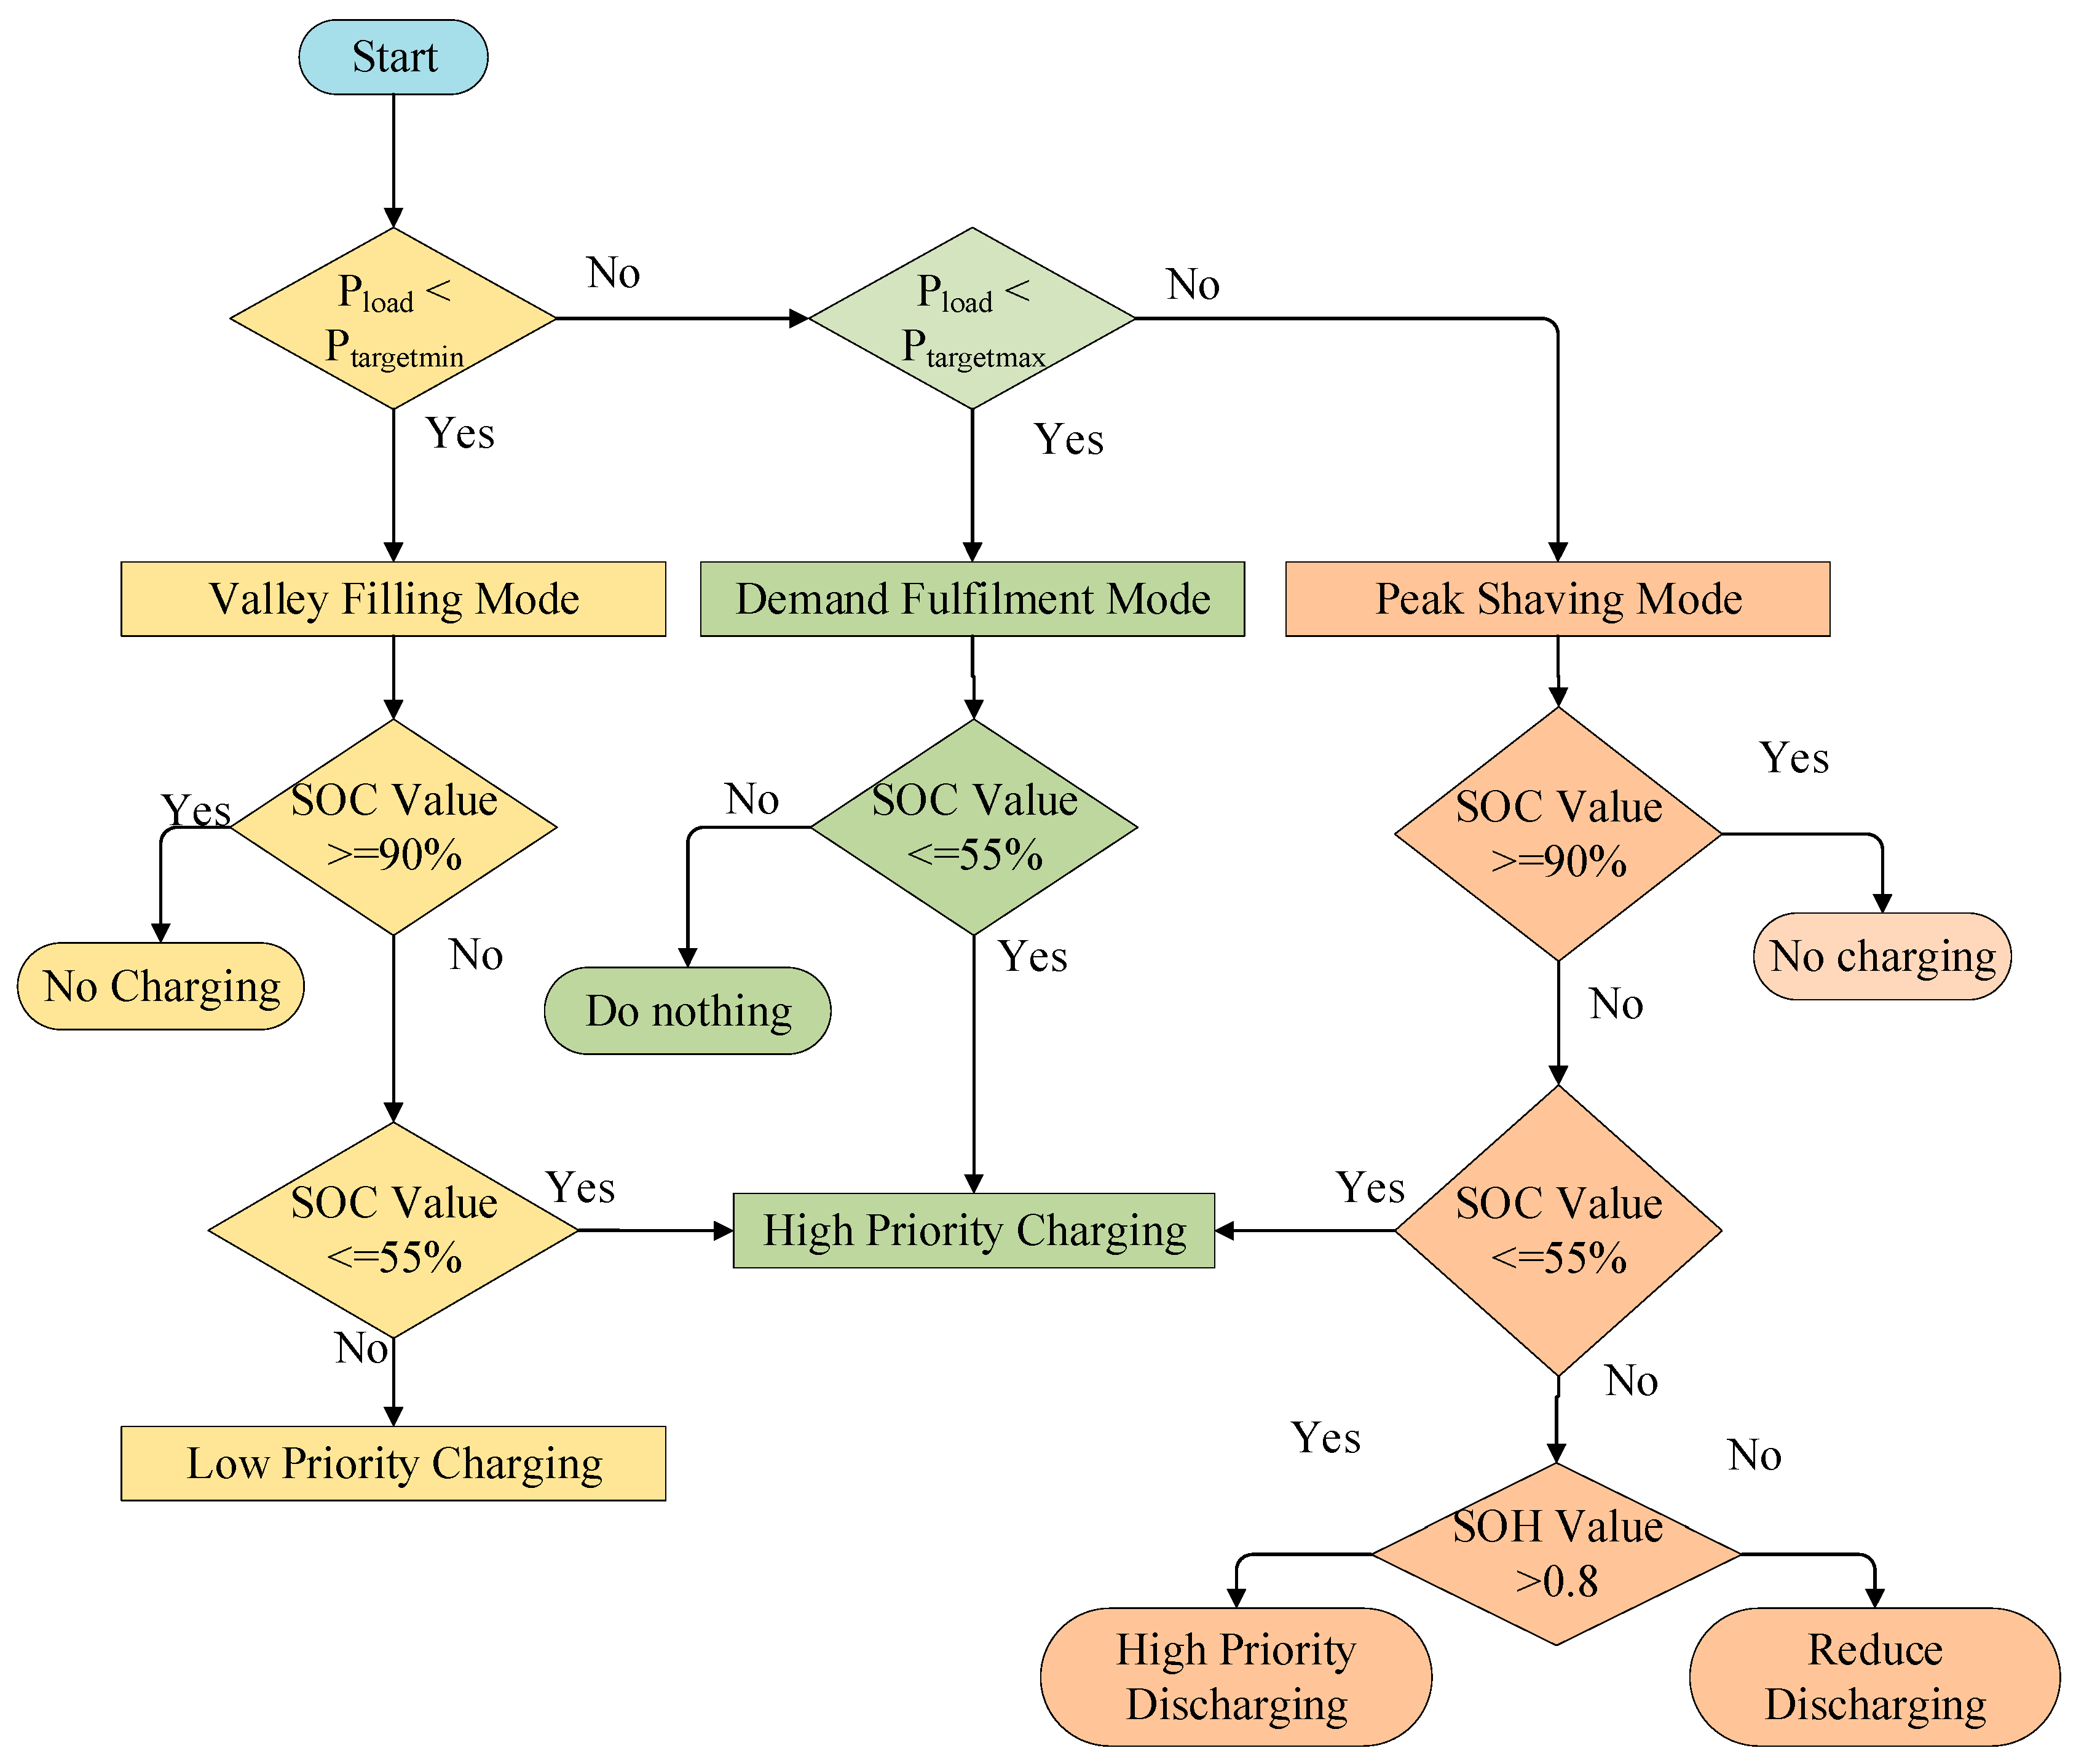
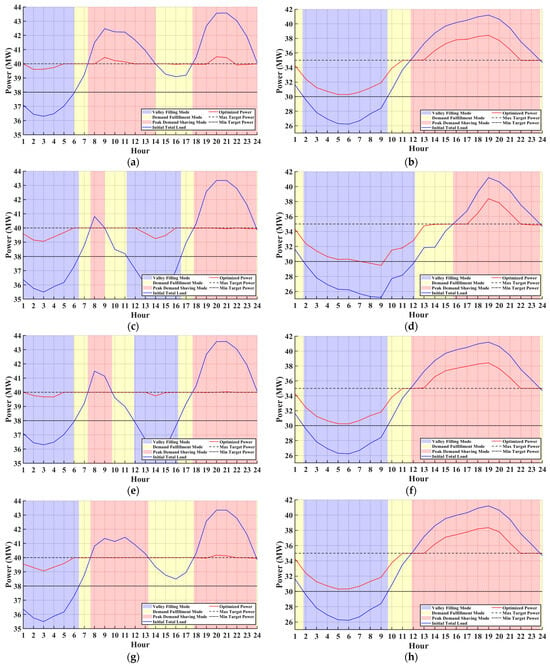
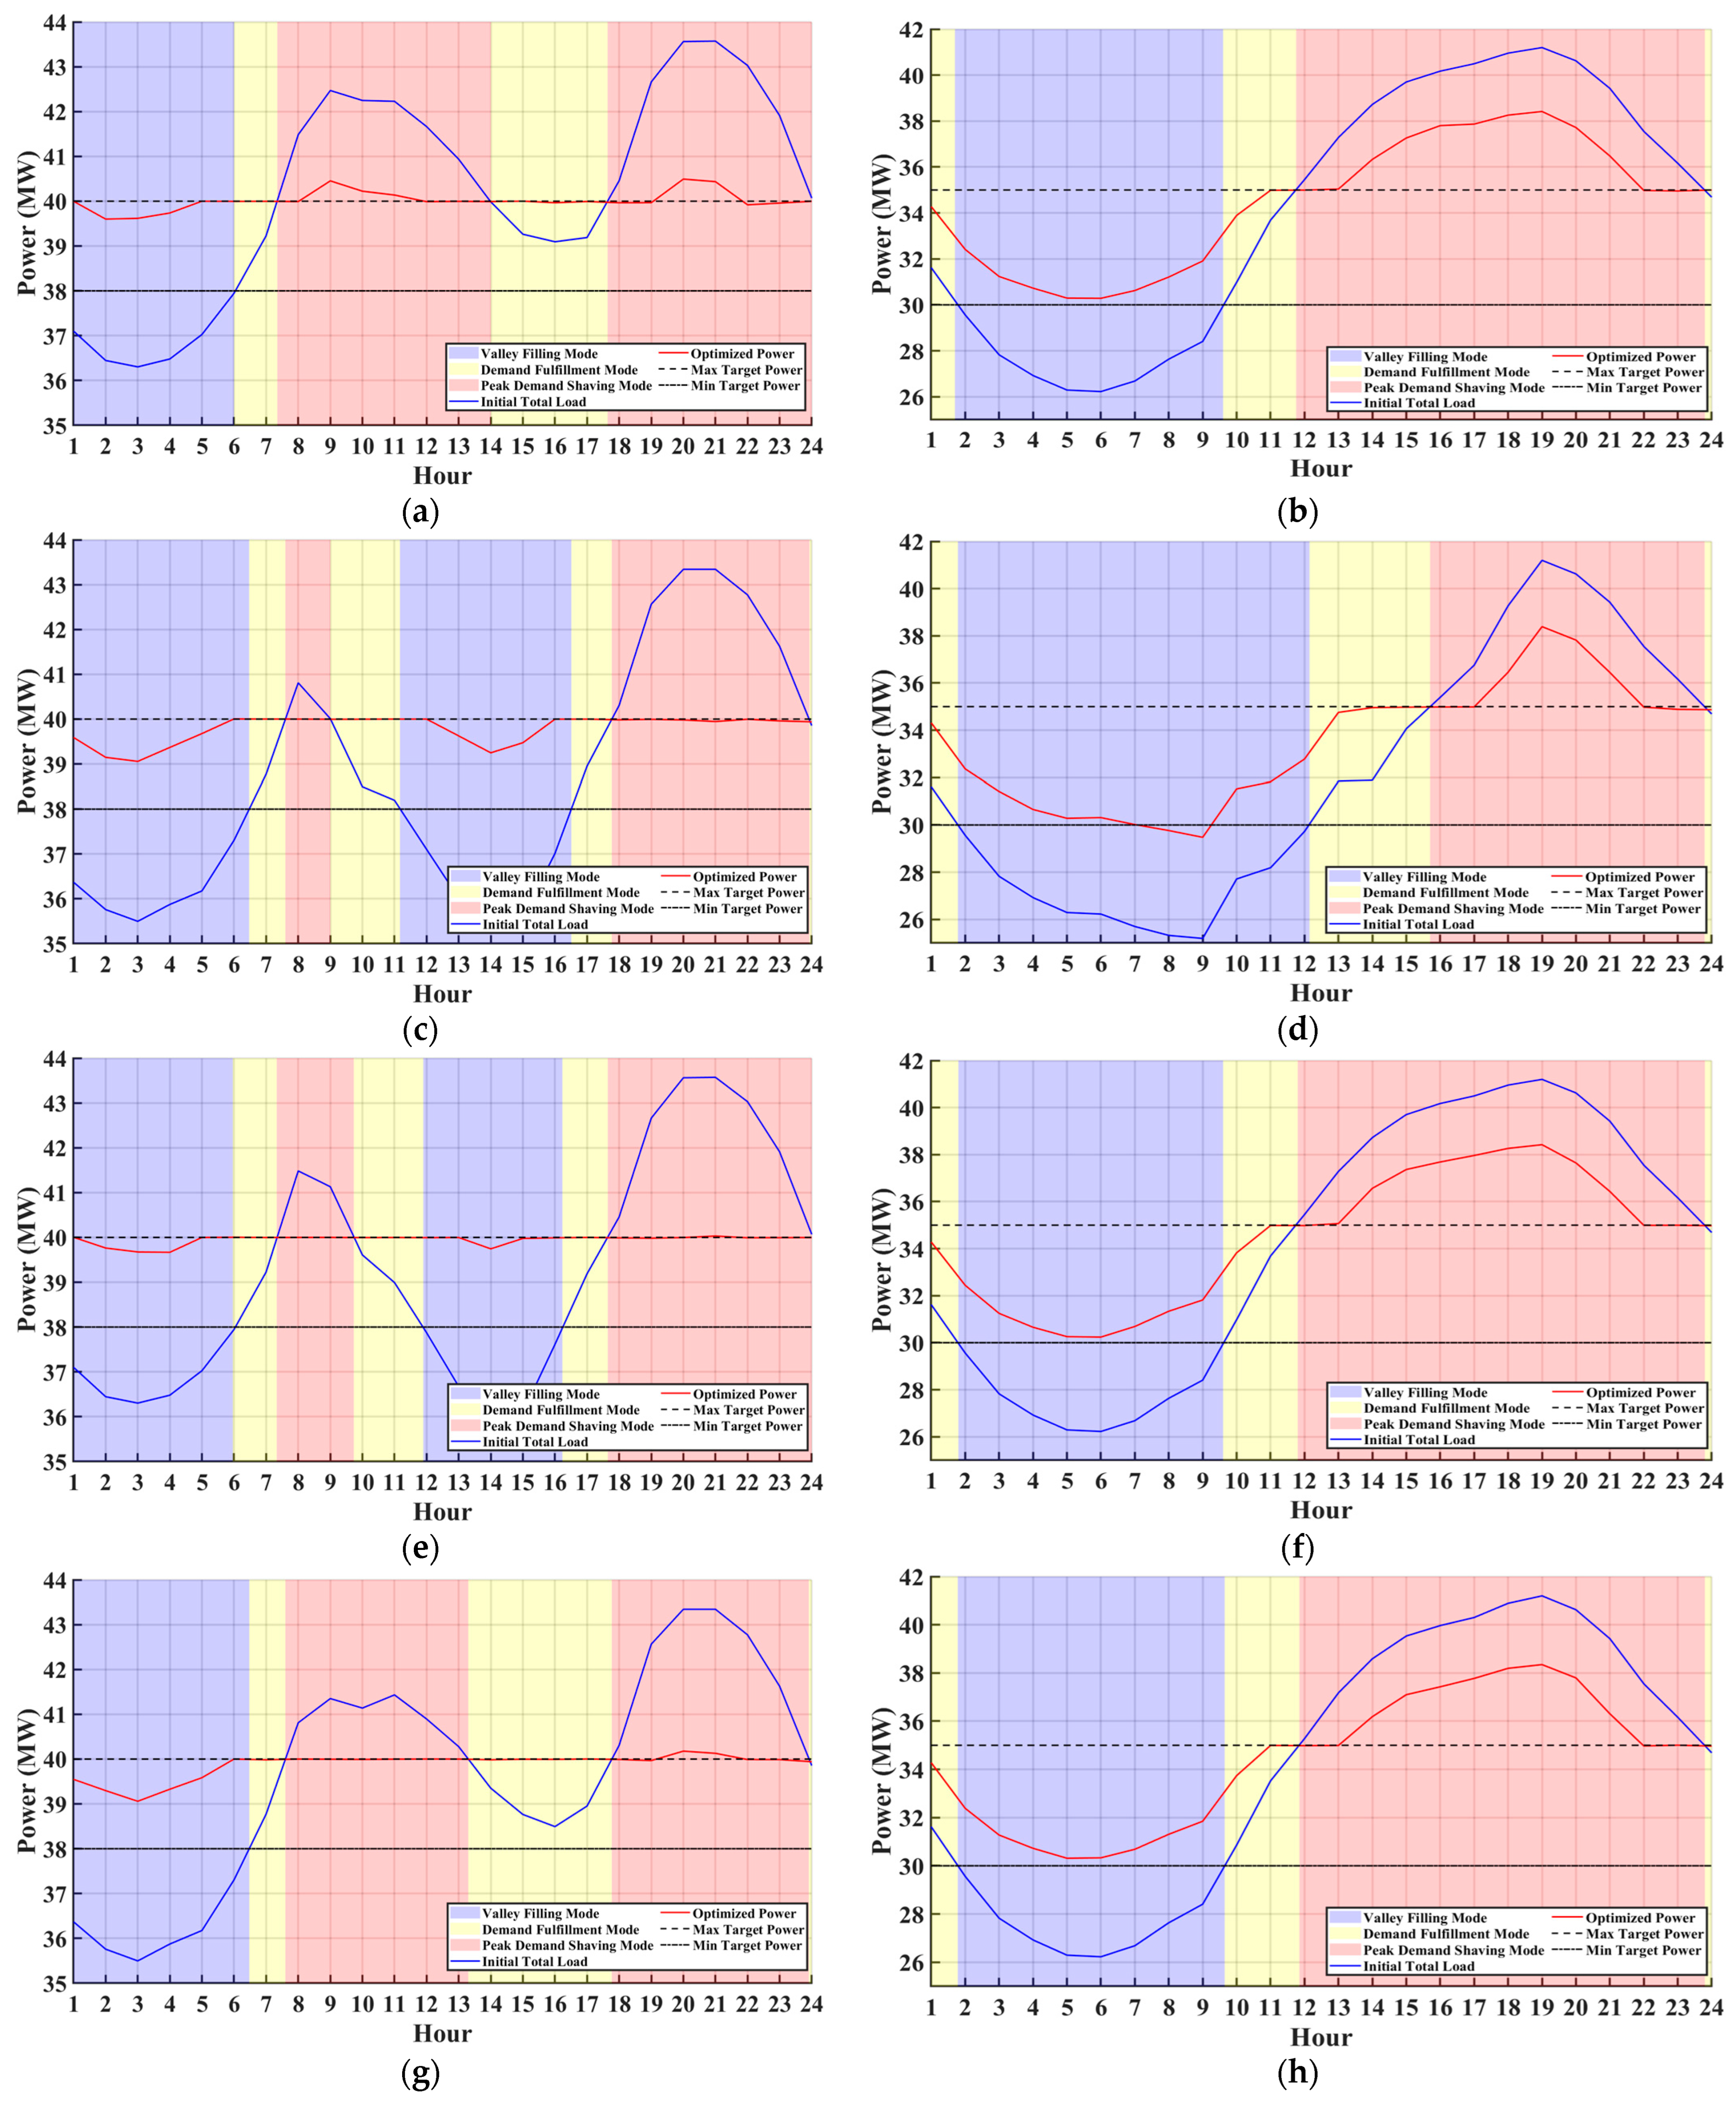

Disclaimer/Publisher’s Note: The statements, opinions and data contained in all publications are solely those of the individual author(s) and contributor(s) and not of MDPI and/or the editor(s). MDPI and/or the editor(s) disclaim responsibility for any injury to people or property resulting from any ideas, methods, instructions or products referred to in the content. |
© 2026 by the authors. Licensee MDPI, Basel, Switzerland. This article is an open access article distributed under the terms and conditions of the Creative Commons Attribution (CC BY) license.