Article

Seamlessly Natural: Image Stitching with Natural Appearance Preservation

by
Gaetane Lorna N. Tchana
1,
Damaris Belle M. Fotso
1,
Antonio Hendricks
2 and
Christophe Bobda
2,*
1
Computer Sciences Department, Faculty of Sciences, University of Yaounde I, Yaounde 812, Cameroon
2
Electrical and Computer Engineering Department, University of Florida, Gainesville, FL 32611, USA
*
Author to whom correspondence should be addressed.
Technologies 2026, 14(3), 186; https://doi.org/10.3390/technologies14030186
Submission received: 6 January 2026 / Revised: 13 February 2026 / Accepted: 5 March 2026 / Published: 19 March 2026
(This article belongs to the Special Issue Image Analysis and Processing)

Abstract

Conventional image stitching pipelines predominantly rely on homographic alignment, whose planar assumption often breaks down in dual-camera configurations capturing non-planar scenes, producing geometric warping, bulging, and structural distortion. To address these limitations, this paper presents SENA (Seamlessly Natural), a geometry-driven image stitching approach with three complementary contributions. First, we propose a hierarchical affine-based warping strategy that combines global affine initialization, local affine refinement, and a smooth free-form deformation field regulated by seamguard adaptive smoothing. This multi-scale design preserves local shape, parallelism, and aspect ratios, thereby reducing the hallucinated distortions commonly associated with homography-based models. Second, SENA incorporates a geometry-driven adequate zone detection mechanism that identifies regions with reduced parallax directly from the disparity consistency of correspondences filtered by RANSAC, without relying on semantic segmentation or depth estimation. Third, within this zone, anchor-based seamline cutting and segmentation enforce one-to-one geometric correspondence between image pairs, reducing ghosting and smearing artifacts. Extensive experiments demonstrate that SENA achieves 26.2 dB PSNR and 0.84 SSIM, obtains the lowest BRISQUE score (33.4) among compared methods, and reduces runtime by 79% on average across resolutions. These results confirm improved structural fidelity and computational efficiency while maintaining competitive alignment accuracy.

1. Introduction

The rise of digital imaging technology has fundamentally transformed how individuals engage with digital content and their surrounding environments [1], directly enabling the development of advanced immersive experiences such as virtual and augmented reality. A critical requirement for these platforms is the ability to capture complex scenes from multiple viewpoints to provide users with continuous, seamless panoramic visuals. This is typically achieved by synthesizing and merging image data acquired simultaneously from two or more cameras in a process known as image stitching. Most image stitching methods establish correspondences between images using salient visual features [2,3,4,5,6,7,8]. These correspondences define a geometric transformation that is used to warp images into a common coordinate frame. The final panorama is then obtained by merging overlapping regions, either directly or with additional mechanisms such as seam selection or blending to reduce visual artifacts. Contributions to the state of the art are most often focused on the refinement or acceleration of one or more of these individual stages.
Geometric warping plays a central role in stitching quality, with homography remaining the dominant transformation model. Owing to its eight degrees of freedom, homography can accurately model full perspective effects and provides exact alignment for planar scenes or pure camera rotations. However, real-world scenes are rarely planar and often contain significant depth variation. In such cases, homography attempts to reconcile non-planar motion using a planar model, leading to over-flexible geometric distortions such as stretching, bending of straight lines, and shape deformation.
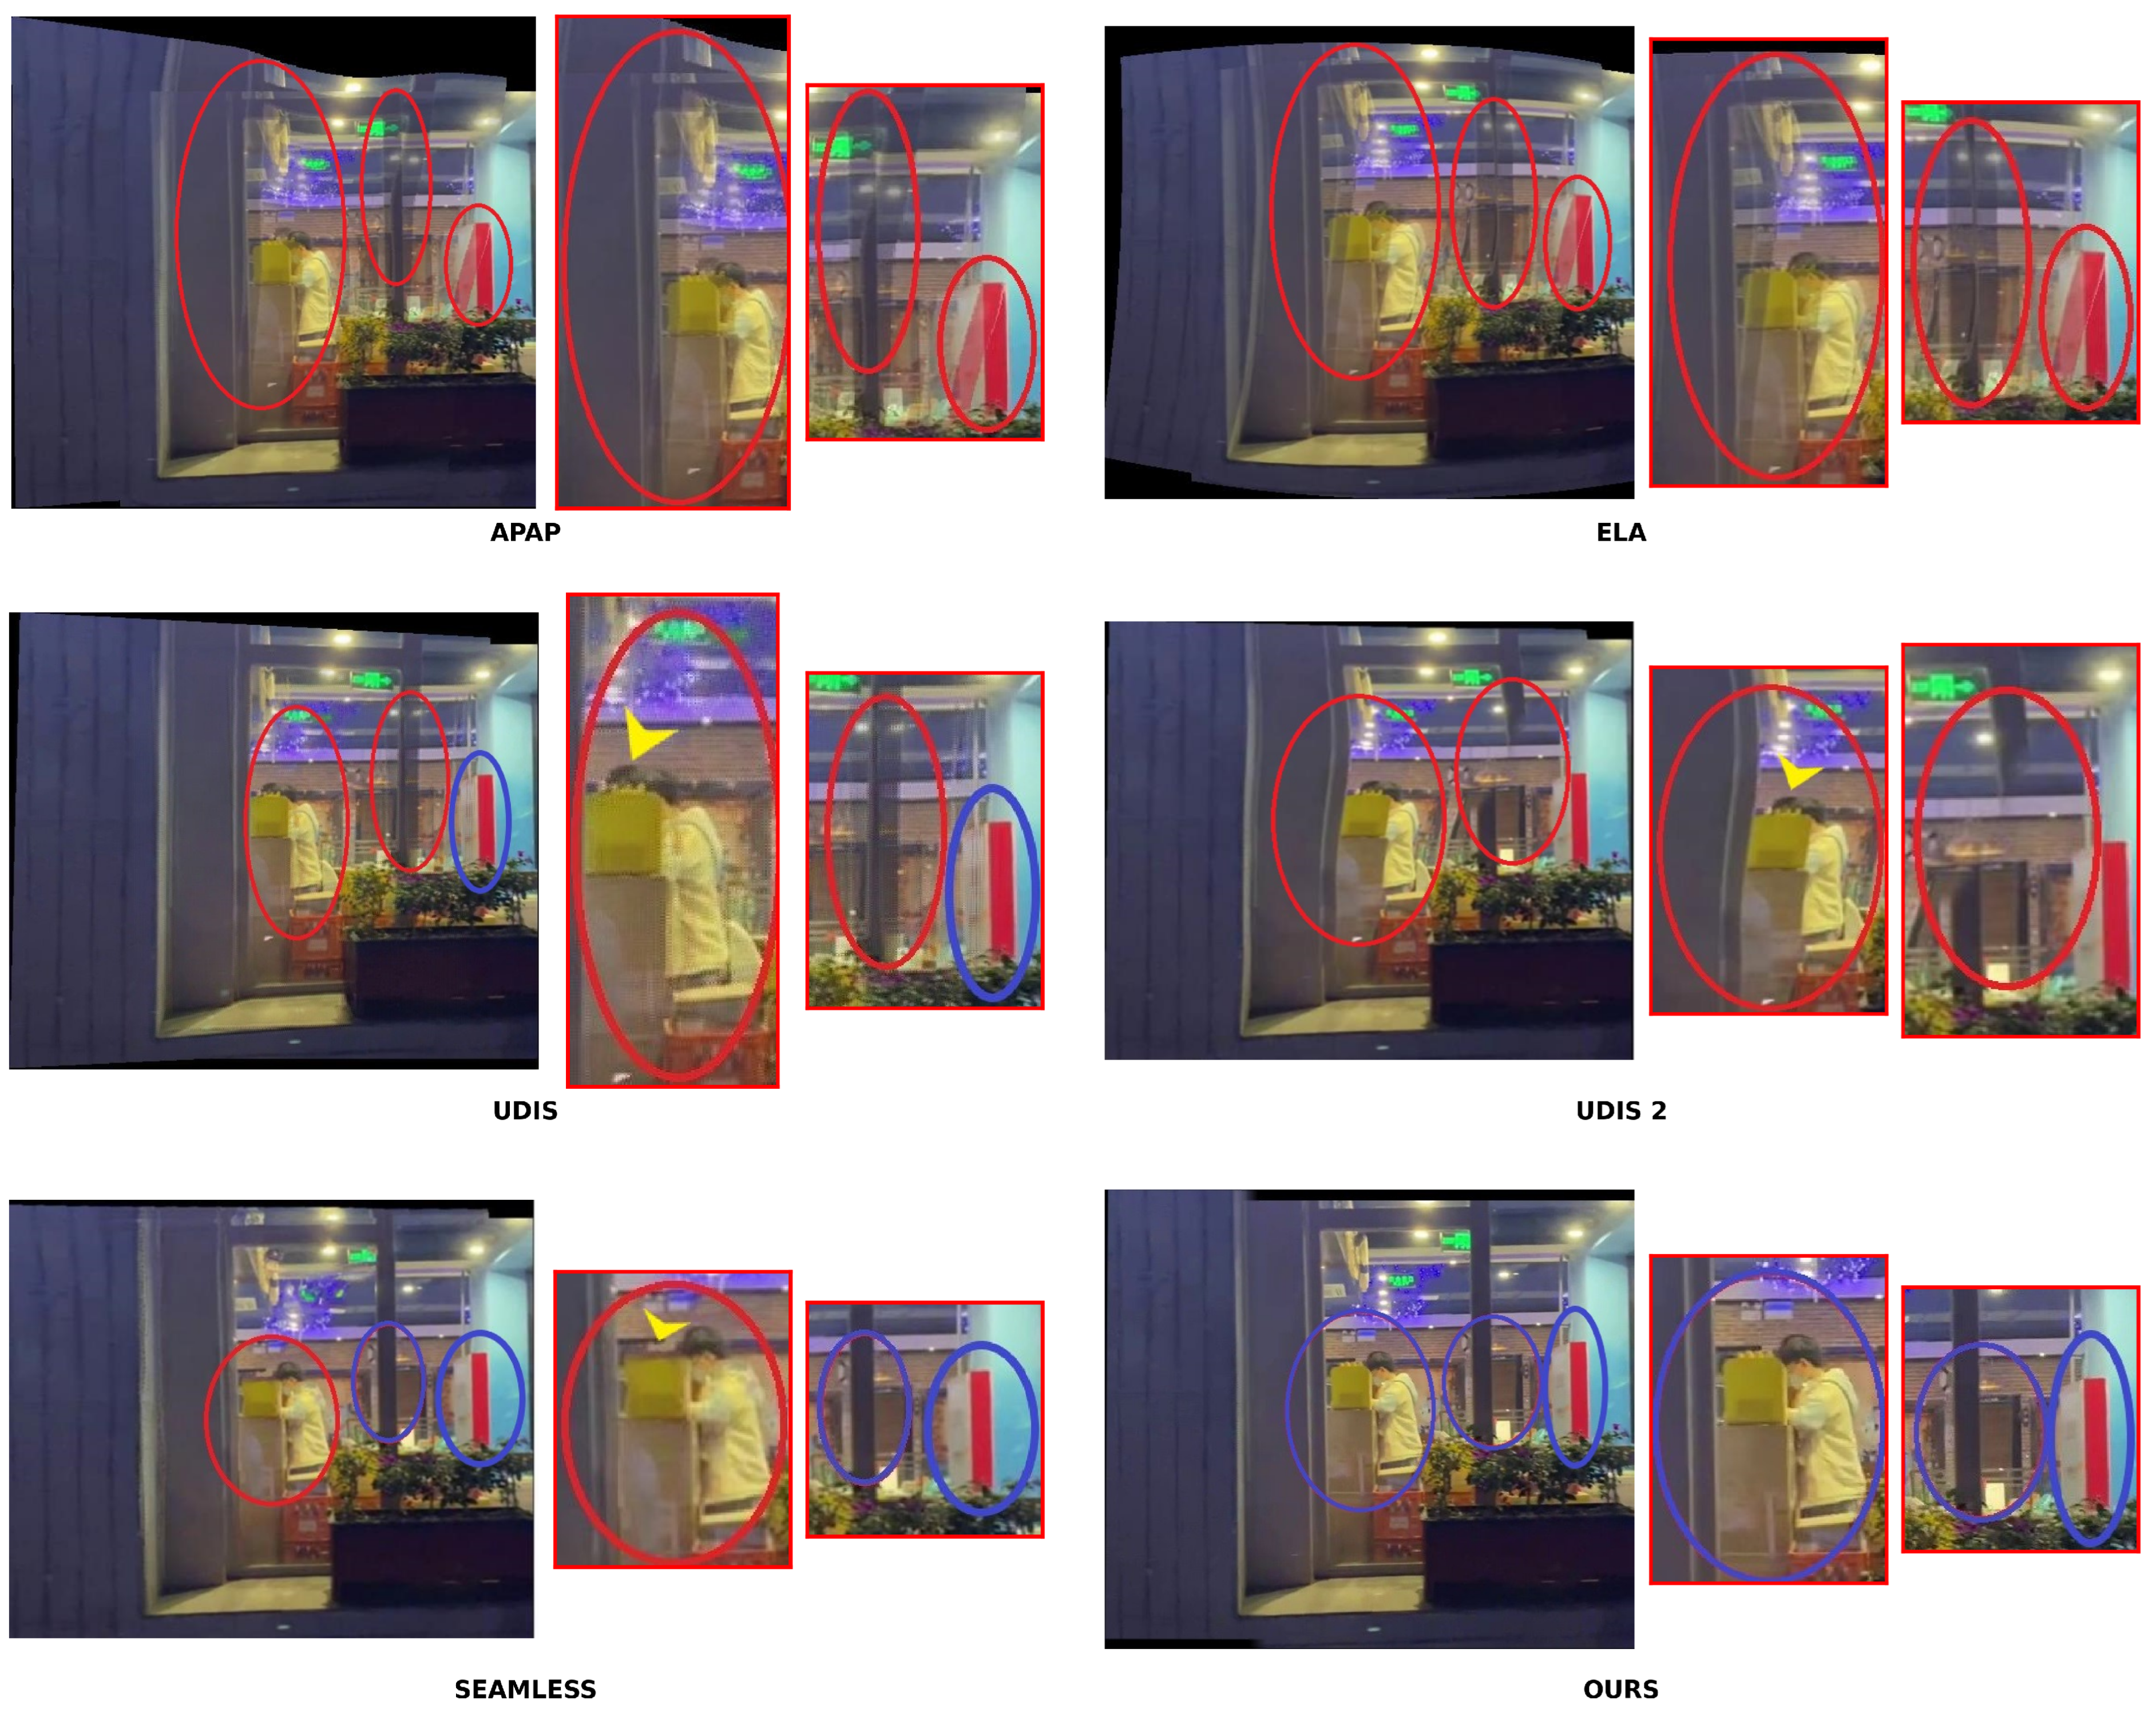
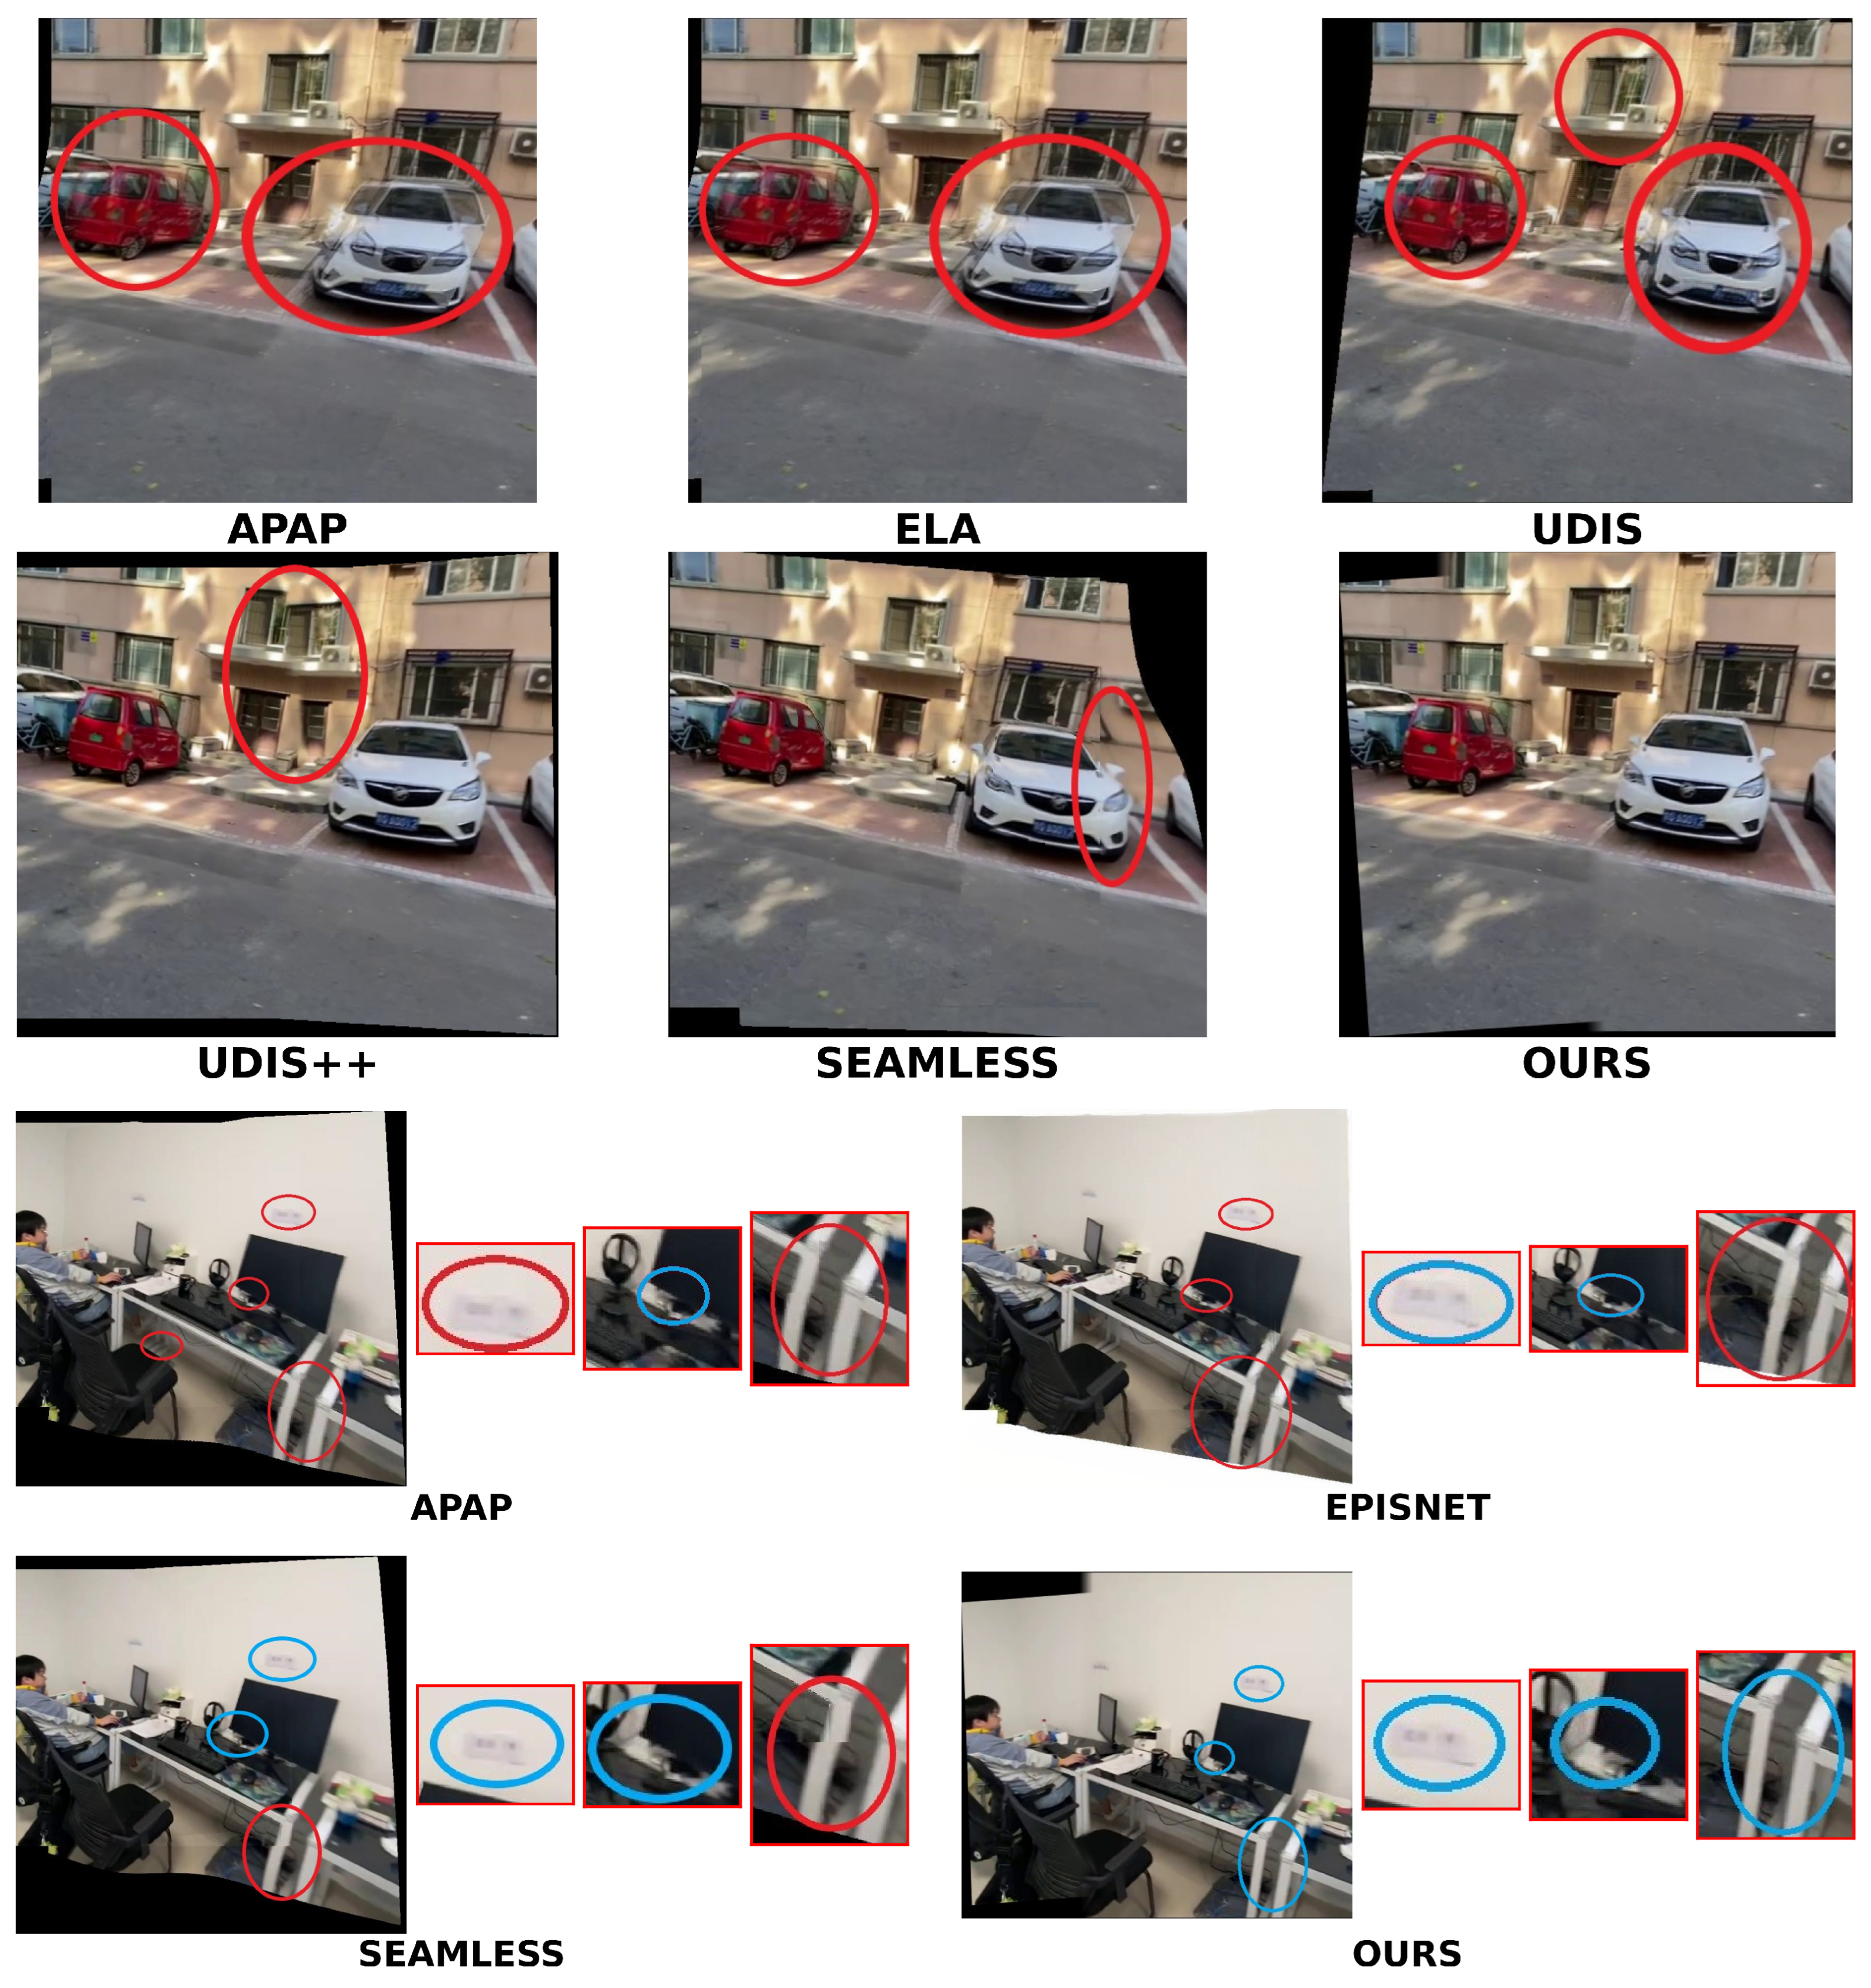
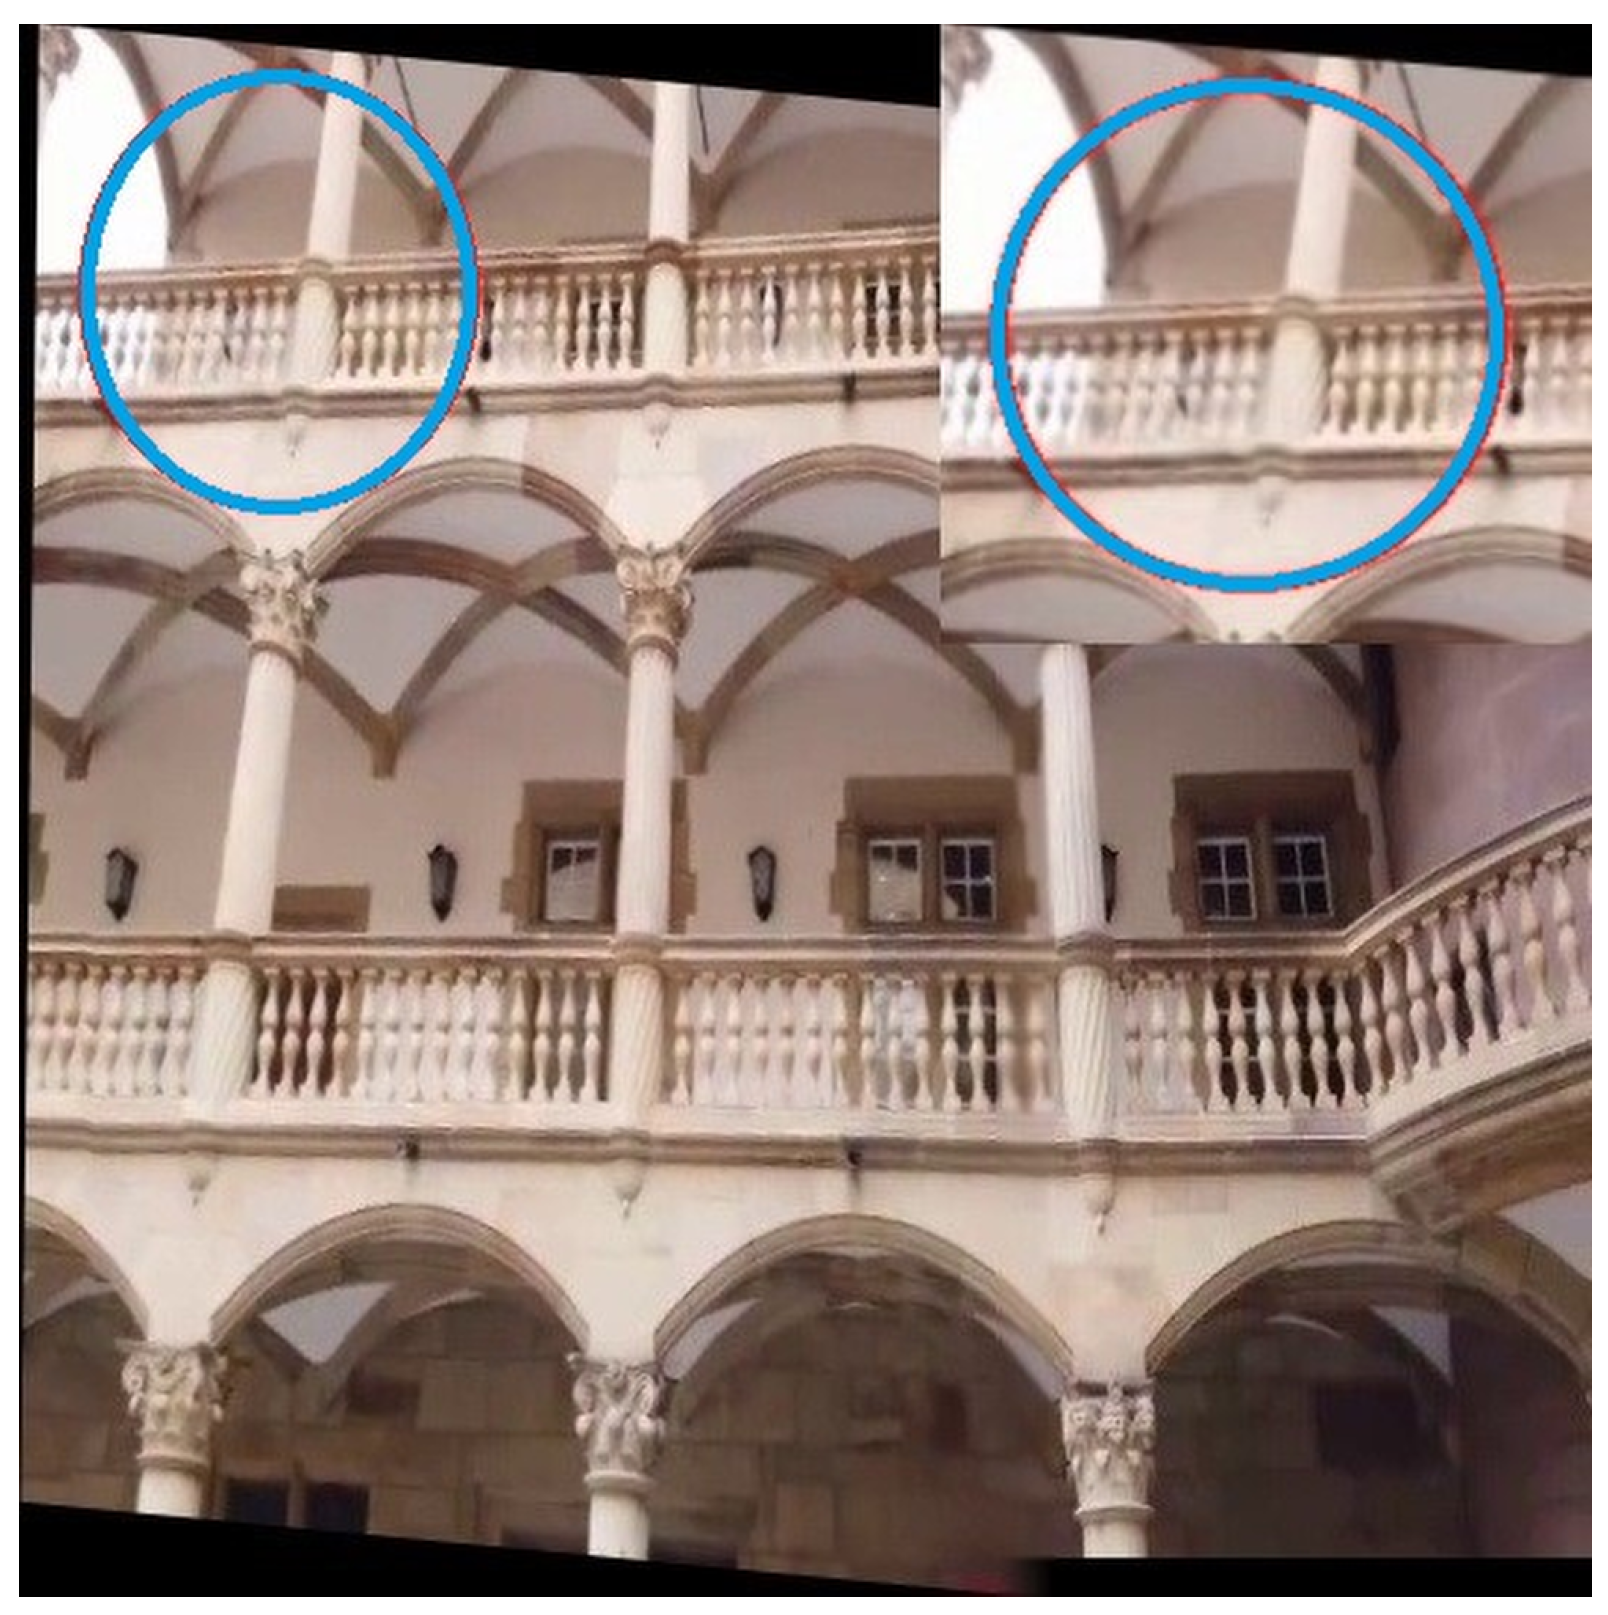
A large body of work in image stitching focuses on improving geometric alignment through increasingly flexible warping models. Hybrid deformation models [9] estimate multiple homographies for different scene regions or depth layers to better preserve structural consistency. Other methods replace global homography with local spline-based registration, such as thin-plate spline (TPS) warps, to increase alignment flexibility [10,11]. While these approaches often improve overlap alignment, their additional degrees of freedom frequently introduce excessive geometric deformation, leading to stretched textures, bent lines, and loss of structural realism. Even combinations of homographic and affine transformations [12] reduce but do not eliminate these artifacts, particularly in scenes with strong parallax. Figure 1 illustrates these limitations in representative state-of-the-art methods (APAP, ELA, UDIS, UDIS++, and SEAMLESS), where artifacts such as ghosting, structural bending, and information loss are visible in the highlighted regions. These artifacts primarily arise from the inherent tendency of homography-based models to compensate for depth-induced parallax through non-physical geometric distortions.
In parallel, many stitching methods address misalignment artifacts not by correcting geometry, but by carefully selecting where images are merged. Seam-based approaches define a stitching path through the overlapping region that minimizes visual discrepancy according to a predefined cost function. Representative works [13,14,15,16] guide seam placement using cues such as intensity differences, gradients, semantic labels, or feature consistency. Although effective in visually hiding some misalignments, these methods often rely on heavy preprocessing pipelines—including semantic segmentation, feature classification, or depth inference, which increase computational cost and sensitivity to errors. Furthermore, seam optimization alone does not guarantee geometric consistency across the seam, leaving duplication or ghosting unresolved in many cases.
Overall, stitching methods still face three major challenges. First, global or overly flexible warps (e.g., homography-only or spline-based models) often introduce geometric distortions and compromise structural fidelity. Second, seam selection strategies based on cost function minimization frequently depend on complex preprocessing steps such as semantic segmentation or feature classification, which increases sensitivity to inaccuracies. Third, even when alignment is locally accurate, blending across regions often lacks consistency, leading to duplication, stretching, or ghosting that reduce the visual realism of the stitched panorama.
This work addresses the above limitations through three contributions. (1) We introduce a hierarchical deformation strategy that combines global affine initialization (using RANSAC-filtered correspondences), local affine refinement within the overlap region, and a smooth free-form deformation (FFD) field regulated by seamguard adaptive smoothing. This multi-scale design preserves structural fidelity while avoiding the excessive distortions of global models and the instability of spline-based warps. (2) Within the same seam-selection paradigm, we propose an adequate zone detection strategy that departs from prior methods based on semantic segmentation. Instead of such complex preprocessing, we analyze the disparity consistency of feature correspondences, providing a lightweight, model-free criterion that robustly identifies parallax-minimized regions. (3) We perform anchor-based segmentation aligned with the detected adequate zone, ensuring structural consistency across image pairs and enabling seamless stitching. Unlike prior approaches that stop at defining a seamline and then rely on blending to hide artifacts, our method partitions both images into corresponding vertical slices anchored by refined keypoints. This guarantees one-to-one geometric correspondence across segments, reducing duplication and ghosting in the final panorama.

2. Related Work

Research in image stitching has explored a wide range of strategies, from feature-based methods to deep learning approaches, yet three major limitations persist across the state of the art.
  • Geometric Distortion from Global Warps: The dominant homography model [17,18,19] is frequently used because its eight degrees of freedom allow it to model full perspective effects. However, when applied to real-world scenes with parallax and depth variation, the homography is forced to reconcile conflicting motions, which often results in non-uniform distortions like spindle-shaped warps, unnatural stretching, or spherical bulging. Advanced hybrid warps, such as “as-projective-as-possible” (APAP) [20] and elastic warping [21], improve flexibility but risk overfitting or over-flexibility, which can produce local stretching artifacts.
  • Reliance on Complex Preprocessing: Many seamline optimization methods [13,14,15] formulate a cost function over the overlapping region and search for a seam that minimizes this cost, ideally passing through visually consistent areas. However, these approaches often depend on complex preprocessing steps, such as semantic segmentation or depth estimation, to guide the cost map, increasing computational cost and sensitivity to errors and inaccuracies.
  • Structural Assumptions and Computational Overhead:
    Plane or multi-homography models [9,18] attempt to reduce single homography distortion by fitting local projective models per plane or blending dual homographies. These methods, however, rely on strong assumptions about scene structure (e.g., two planes or projective-consistent regions) and can become brittle in complex or irregular depth geometries.
    Structure-preserving warps successfully reduce distortions and preserve salient structures by incorporating complex optimization frameworks and constraints (e.g., collinearity constraints). These methods, however, are often computationally demanding and remain sensitive to poor feature distribution.
    Learning-based approaches use deep learning for tasks like transformer-based warping and optical flow with inpainting [10,11,22,23]. While they generalize well and show strong performance, they demand heavy training requirements, reliance on large datasets, and risk hallucinating content or propagating errors, reducing interpretability compared to geometric models.
Overall, prior methods still face three major challenges: (1) global or overly flexible warps compromise structural fidelity and introduce geometric distortions; (2) seam selection strategies based on cost function minimization often rely on complex preprocessing steps (like semantic segmentation or feature classification), increasing sensitivity to inaccuracies that reduce the visual realism of the stitched panorama; and (3) dependence on strong scene assumptions (planarity, dual planes, or consistent surface normals).

3. Seamless and Structurally Consistent Image Stitching

To overcome the excessive distortion and misalignment common in image stitching, we propose a three-stage framework that emphasizes local adaptability, geometry-driven parallax handling, and structurally consistent reconstruction. The method transforms the source image into the domain of the target image while rigorously preserving geometric structure.

3.1. The Three-Stage Framework

  • Local Image Warping: We deliberately move beyond global homographies and spline-based deformations. The source image is coarsely aligned using a global affine transformation (estimated via RANSAC). This is followed by a refinement stage where the overlap is subdivided into local grids, and distinct affine models are fitted to local feature correspondences. This process generates a smooth free-form deformation (FFD) field, which is blended and adaptively smoothed using a seamguard strategy that utilizes a ramp mask and match density weighting to prevent discontinuities at boundaries. This preserves overall structural fidelity while reducing geometric distortion.
  • Adequate Parallax-Minimized Zone Identification: In contrast to seam selection methods relying on semantic segmentation, we introduce a model-free strategy. This method analyzes disparity variations and geometric consistency among matched features to isolate a stable stitching zone that inherently minimizes parallax artifacts.
  • Image Partitioning and Reconstruction: Within the identified stable zone, an ordered chain of refined keypoints defines the optimal stitching line. Both images are then partitioned into corresponding vertical slices anchored by these keypoints. This anchor-based segmentation enforces structural consistency between the two images by construction: every vertical slice in one image has a direct, aligned counterpart in the other. By tying the seamline to these geometric anchors, our method eliminates the duplication, ghosting, and misalignment issues often associated with blending.

3.2. Locally Adaptive Image Warping

Our approach generates a content-aware, seam-guarded deformation field to precisely align a source image ( I s ) to a target image ( I t ) using only sparse feature matches. The pipeline is structured in six sequential steps, strategically combining global alignment with local adaptivity. This methodology ensures both structural fidelity and robustness through confidence-weighted blending and specific gating mechanisms.
  • Step 1: Global Affine Estimation via RANSAC
We begin by detecting, extracting, and matching features using the XFeat algorithm [8], which is selected for its effective balance between computational efficiency and matching accuracy. From the resulting set of matched keypoints { ( p s i , p t i ) } , we compute a robust global affine transformation A glob R 3 × 3 using the RANSAC algorithm. This initial step serves two critical functions: establishing a coarse alignment and filtering outliers. Only the inlier matches, as determined by RANSAC, are retained for all subsequent local refinement steps.
  • Step 2: Overlap Region and Local Grid Cell Generation
This step defines the alignment area and prepares it for localized warping.
Using the global affine transformation A glob , the four corners of the source image ( I s ) are projected into the coordinate space of the target image ( I t ), creating a quadrilateral. This quadrilateral is then clipped to the bounds of I t using the Sutherland–Hodgman algorithm to precisely define the polygonal overlap region. A binary mask, M tgt overlap , is generated from this resulting polygon.
Next, a uniform G x × G y grid is overlaid onto the bounding box of this overlap region. For each resulting grid cell ( c j ), the following parameters are computed:
  • A binary mask M c j , derived from the intersection of the grid cell with M tgt overlap .
  • A centroid c j = ( c x j , c y j ) , calculated using image moments.
  • A bounding box ( ( x 0 ( j ) , x 1 ( j ) , y 0 ( j ) , y 1 ( j ) ) ), utilized for subsequent spatial weighting and diagnostics.
We fix G x × G y = 2 × 2 We found that higher grid resolutions produce overly local transformations with insufficient support per cell, while smaller grids reduce flexibility in parallax handling. A 2 × 2 configuration provides a stable balance between transformation accuracy and computational cost.
  • Step 3: Local Affine Refinement with Adaptive Transformation Selection and Confidence Scoring
For each grid cell c j , a local affine transformation T j is fitted using the feature matches that fall within the cell and its immediate neighbors. This fitting employs ridge regression with a regularization λ 1 , which biases the local solution toward the initial global transformation A glob to ensure stability.

3.2.1. Spatial Confidence Metric

Instead of relying on statistical residuals or covariance, a novel confidence score is defined for each local affine transformation based on the density and spatial distribution of its supporting feature points. The Gaussian weight w i ( j ) of a feature point i relative to the cell center c j is computed as:
w i ( j ) = exp p t i c j 2 2 σ j 2
Here, the Gaussian standard deviation is defined by the scaling factor α applied to the diagonal length of the cell’s bounding box, i.e., σ j = α · diag ( c j ) . The overall confidence score is then computed from this weighted density.
The confidence score is computed as:
conf j = max κ min , min κ max , i w i ( j ) β · max i w i ( j )
where κ min , κ max , and β are clamping and normalization constants. This score reflects the weighted mass of matches in the cell and provides a heuristic that is robust to sparsity and uneven spatial distributions.

3.2.2. Adaptive Transformation Selection via Composite Diagnostic Score

The system employs an adaptive strategy to maintain geometric stability. If the initial local affine transformation T j produces unstable geometry—diagnosed using metrics such as root mean square error (RMSE), the determinant, the condition number, or the displacement from the global affine A glob —the transformation is refitted using a stronger regularization parameter λ 2 > λ 1 . The superior version of the transformation is then selected based on a composite instability score:
score ( T ) = RMSE + ω cond · cond + ω det · max ( 0 , τ det | det | ) + ω δ · δ mean
where ω cond , ω det , ω δ , and τ det are weighting and threshold parameters; and δ mean is the mean displacement between the outputs of the local affine transformation and the global affine transformation, computed over an N g × N g evaluation grid uniformly sampled within the cell’s bounding box. This embedded selection mechanism ensures geometric stability without manual intervention.
  • Step 4: Free-Form Deformation Field via Confidence-Weighted Local Transformation Blending
We construct a deformation field on an N y × N x lattice over the output canvas. For each lattice point u = ( u , v ) , we compute its corresponding coordinate in target space p t = ( u o x , v o y ) , and its base source coordinate via the global affine transformation:
p base = Π A glob 1 · [ p t , 1 ] T ,
where Π ( x ) = ( x / z , y / z ) denotes perspective division. For each local transformation T j , we compute its mapped source coordinate
p local ( j ) = Π T j 1 · [ p t , 1 ] T ,
and the displacement
Δ p ( j ) = p local ( j ) p base .

3.2.3. Confidence-Weighted Spatial Blending

The final displacement Δ p is a normalized blend of all local transformation displacements, weighted by both spatial proximity and transformation confidence:
Δ p = j = 1 J w j ( p t ) · Δ p ( j ) where w j ( p t ) = conf j · exp p t c j 2 2 σ f 2 k = 1 J conf k · exp p t c k 2 2 σ f 2
where σ f = α f · mean ( cell diagonals ) , and α f is a spatial decay factor. Displacements are clipped to [ d max , d max ] and lightly smoothed with Gaussian blur ( σ l ) before upsampling to full canvas resolution via bicubic interpolation.
  • Step 5: Seam Guarding via Dual-Channel Gating
The final step in suppressing artifacts near boundaries or in sparse regions is modulation of the full-resolution deformation field Δ p using a multiplicative gate ( G ) derived from two primary signals:
  • Geometric Ramp ( R canvas ): A smootherstep function applied to the signed distance field of the overlap region, with bandwidth proportional to the image diagonal ( b = ρ · diag img ).
  • Match Density Map ( D canvas ): A Gaussian-blurred heatmap of inlier keypoint locations, normalized to [ 0 , 1 ] , with kernel standard deviation σ d .

3.2.4. Dual-Gated Seam Suppression

The final gating mask combines both signals multiplicatively:
G ( u ) = S R canvas ( u ) γ p geometric   falloff · γ min + ( 1 γ min ) · S D canvas ( u ) density - aware   modulation
where S ( t ) = 6 t 5 15 t 4 + 10 t 3 is the smootherstep function, γ p controls ramp steepness, and γ min is the minimum gate value. The guarded deformation field is then smoothed:
Δ p guarded ( u ) = GaussianBlur σ g Δ p ( u ) · G ( u )
This is not post-warp blending; rather, it is a mechanism for pre-warp suppression of unreliable deformations. The final displacement field Δ p is modulated by the gate G:
Δ p gated = G Δ p
This multiplicative gating ensures that the full-resolution displacement is applied only in geometrically stable and feature-supported areas. To the best of our knowledge, the combination of geometric and match-density-based gating for free-form deformation (FFD) fields has not been explicitly explored in prior image stitching methods.
  • Step 6: Final Warping and Output
The final source-to-canvas mapping is computed by combining the inverse global affine transformation with the gated deformation field. The source image I s is then warped into the final canvas space using bilinear interpolation. Concurrently, the target image I t is pasted onto the output canvas using the pre-computed offset ( o x , o y ) .
For evaluation purposes, the final transformed coordinates of the original inlier matches are computed. This involves a simple translation to canvas coordinates for target points and applying the full warp (global affine + FFD + multiplicative gate) with bilinear interpolation of the displacement field for source points.
These collective innovations enable our method to produce seamless, artifact-free alignments even when operating with sparse, uneven, or noisy feature matches.

3.3. Optimal Stitching Line

  • Determination of an Adequate Parallax-Free Zone
Identifying an adequate stitching area relies on finding a region containing a high density of reliable feature correspondences governed by a dominant geometric transformation. Initially, regions with low information content, which are quantifiable by low local image variance, are systematically excluded as they produce unstable matches. However, scenes with significant depth often exhibit motion parallax, resulting in a multi-modal distribution of disparity vectors that complicates the search for a consistent seam.
To robustly handle this parallax, our method focuses on isolating the most extensive and stable surface. This is achieved by identifying the dominant motion group, which corresponds to the true inliers for a stable stitch. Specifically, the algorithm locates regions where keypoint disparities are statistically consistent (exhibiting low local variance) and where their local mean converges to the global mean μ of the primary motion mode. This approach allows the algorithm to robustly handle parallax by isolating the most extensive and stable surface.
Given a set of matched keypoint pairs (( x S , y S ),( x T , y T )), where x S and y S denote the coordinates in the source image and x T and y T denote the coordinates in the target image, respectively, keypoints are initially sorted using two primary spatial criteria to account for the camera geometry.
  • First, x S > x T , reflecting the relative frontal position of the camera of the source image.
  • ( y S > y T ) ( y T > y S ) , accounting for cases in which one camera is physically positioned above the other.
The matched keypoints are partitioned into classes C i based on their abscissa values (x-coordinates). Each class corresponds to a spatial range, R, which is defined as R = width/20. For every keypoint within a class, we compute its disparity as ( x S x T ) and subsequently calculate the mean disparity for that class.
The matched keypoints are partitioned into classes C i based on their abscissa values (x-coordinates). Each class corresponds to a spatial range R, defined as R = width / 20 . For every keypoint within a class, we compute its disparity as ( x S x T ) and subsequently calculate the mean disparity for that class.
We then iterate through the resulting list of mean disparities (one value per class) and group the corresponding classes into clusters based on the statistical consistency of these mean disparity values. This clustering process isolates the most dominant motion groups, enabling the identification of the parallax-minimized adequate zone.
The threshold-based disparity clustering procedure used to group consecutive disparity classes is summarized in Algorithm 1.
The optimal stitching cluster is selected based on a scoring metric that evaluates the consistency and reliability of each cluster against three key parameters:
  • Standard Deviation ( σ k ): This measures the internal coherence of the cluster. A smaller standard deviation indicates that the individual class mean disparities are tightly grouped around the cluster mean, suggesting a more consistent depth plane.
  • Cardinality ( C k ): This is the total number of keypoints contained within all classes of the cluster. High cardinality indicates that the cluster is supported by a large amount of data, which directly increases the reliability and robustness of its mean disparity calculation.
  • Disparity Deviation ( Δ μ k ): This is defined as the absolute difference between the mean disparity of the cluster ( μ c , k ) and the global mean disparity of all classes ( μ g ).
Algorithm 1: Threshold-Based Disparity Clustering
Require: D: A list of mean disparities d 1 , d 2 , , d n , where d i corresponds to the mean disparity of class i.
Require: v: A positive, user-threshold value for disparity difference.
Ensure: C: A set of clusters, where each cluster is a list of consecutive classes from D.
1:
Initialize an empty list of clusters C
2:
Initialize the current cluster C current with the first class d 1
3:
for  i = 2 to n do
4:
   if  | d i d i 1 | v  then
5:
      Add class i to C current
6:
   else
7:
      if  C current contains at least two classes then
8:
          Add C current to the list of clusters C
9:
      end if
10:
    Start a new cluster with class i: C current { d i }
11:
  end if
12:
end for
13:
if  C current contains at least two classes then
14:
    Add C current to the list of clusters C
15:
end if
16:
 
17:
return C
To prevent the selection of clusters with low reliability (low cardinality), high incoherence (high standard deviation), or minimal deviation from the global mean (low significance), we define a weighted score, w k , for each cluster k given by Equation (5).
w = C ( σ + λ · Δ μ ) + ϵ
where:
  • σ : standard deviation of the disparities within the cluster;
  • C: cardinality (number of keypoints in the cluster);
  • λ : weighting factor controlling the influence of the disparity deviation;
  • Δ μ = | μ c μ g | : absolute difference between the mean disparity of the cluster μ c and the global mean disparity μ g ;
  • ϵ : a small constant added to avoid division by zero.
The cluster with the highest calculated score, w m a x , is selected as the optimal cluster. The adequate zone is then defined as the combination of all the classes within this selected cluster.

Keypoint Chain Refinement

Once an adequate overlapping area is identified, the initial set of keypoint correspondences cannot be used directly, as this raw data is inherently unreliable and contains significant outliers or misaligned matches. Using these erroneous points to guide partitioning would create inconsistent divisions between the two images, leading directly to visible stitching artifacts such as ghosting and duplications. Therefore, refining this initial set of keypoints is a critical prerequisite.
A dedicated algorithm is employed to generate two clean, synchronized, and ordered lists of keypoints, forming a coherent keypoint chain. For brightness consistency, a selection step is performed, determining each keypoint’s intensity and retaining only those with similar levels. An initial anchor is established at the keypoint closest to the image edge. From there, the algorithm iteratively matches each point in the first image with its closest corresponding point in the second based on Euclidean distance. A crucial constraint is applied during this process: each match must be unique in its horizontal (×).
The optimal stitching line in each image is defined by the path connecting the first element to the last element of the refined set in the corresponding pair.

3.4. Partitioning and Reconstruction

3.4.1. Image Partitioning

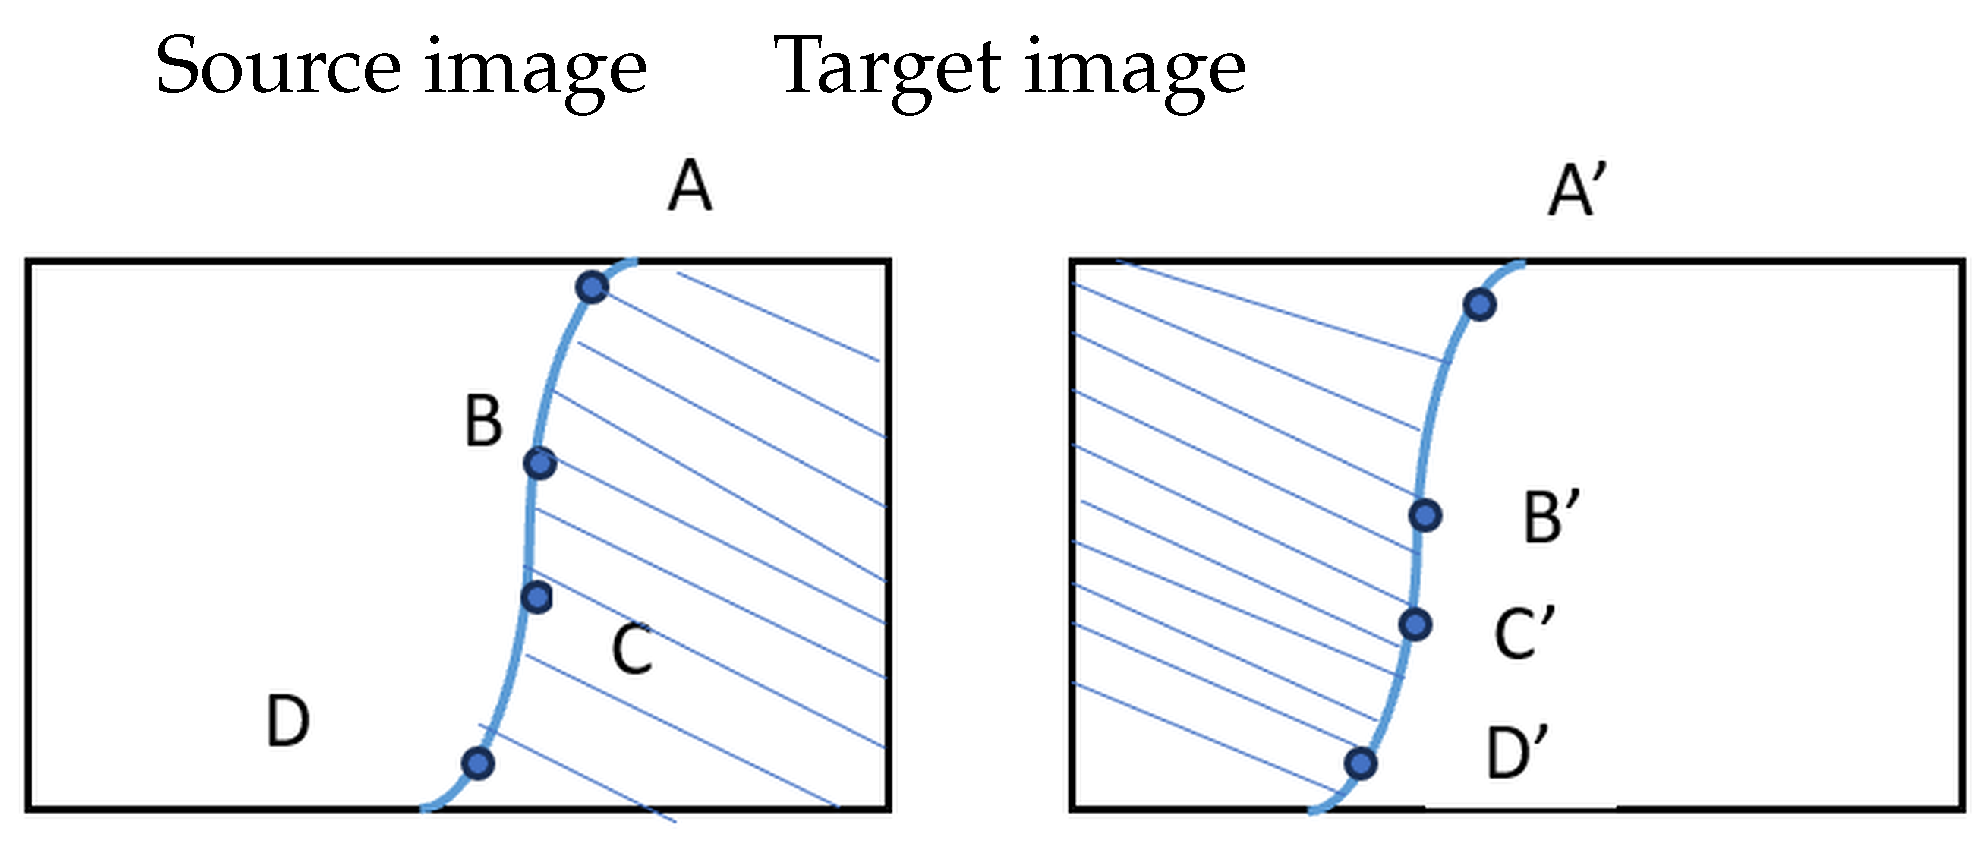
The image partitioning process begins with the optimal stitching line, which is defined by an ordered set of n reliable keypoint pairs (see Figure 2). These points function as anchors for segmenting each image into S = n + 1 vertical slices.
To ensure the resulting vertical slices are structurally complementary (meaning they maintain consistent relative order and direction between the two images), a directional validation is performed on each consecutive pair of anchors ( A , B ) and their corresponding pair ( A , B ) from the second image:
  • Valid Segments (Consistent Direction):
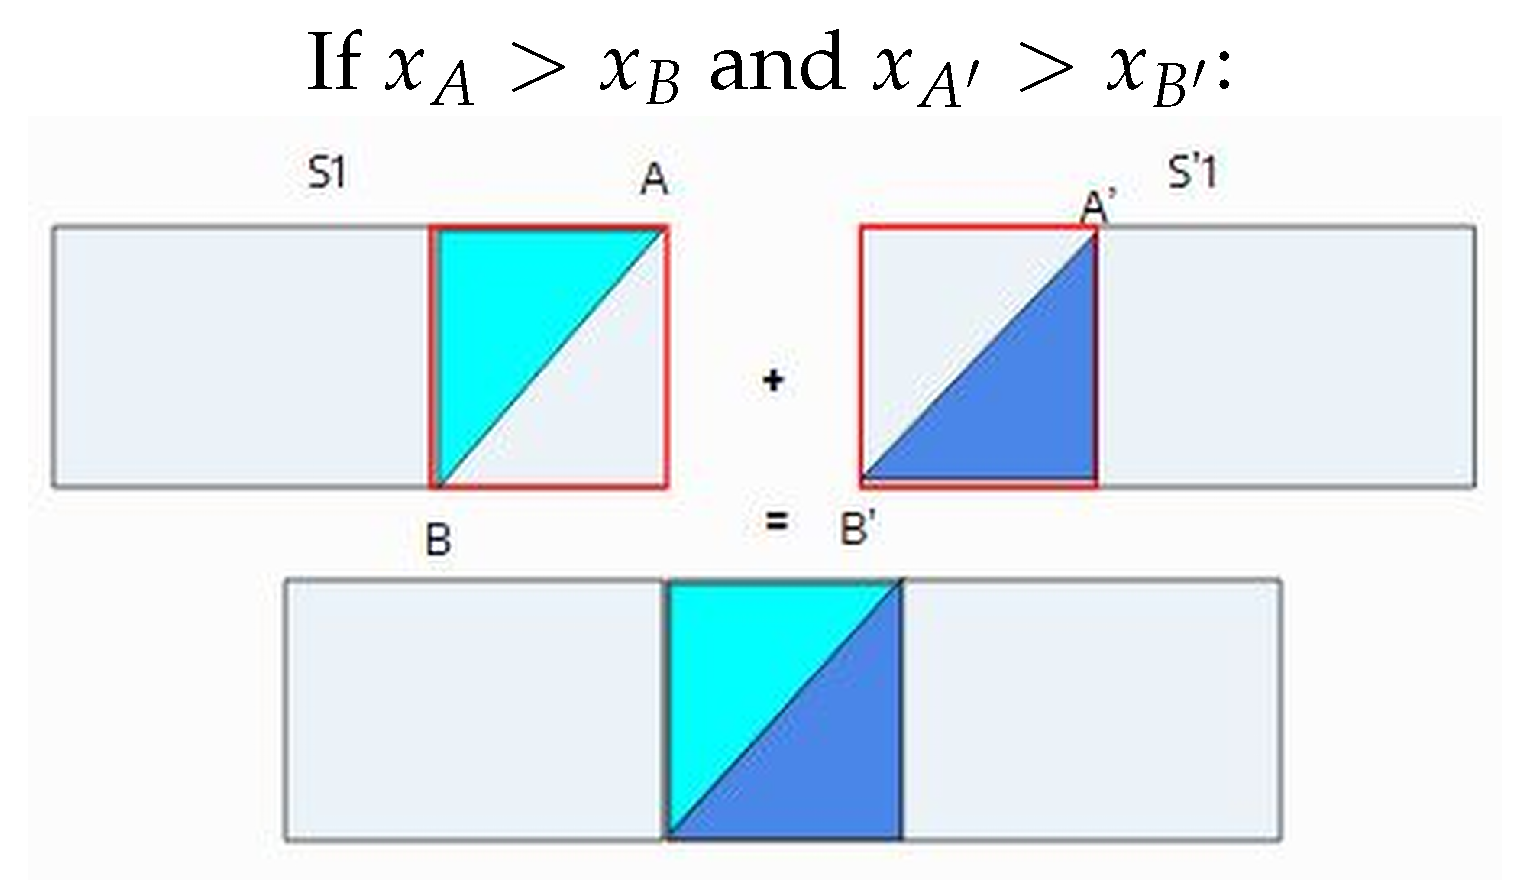
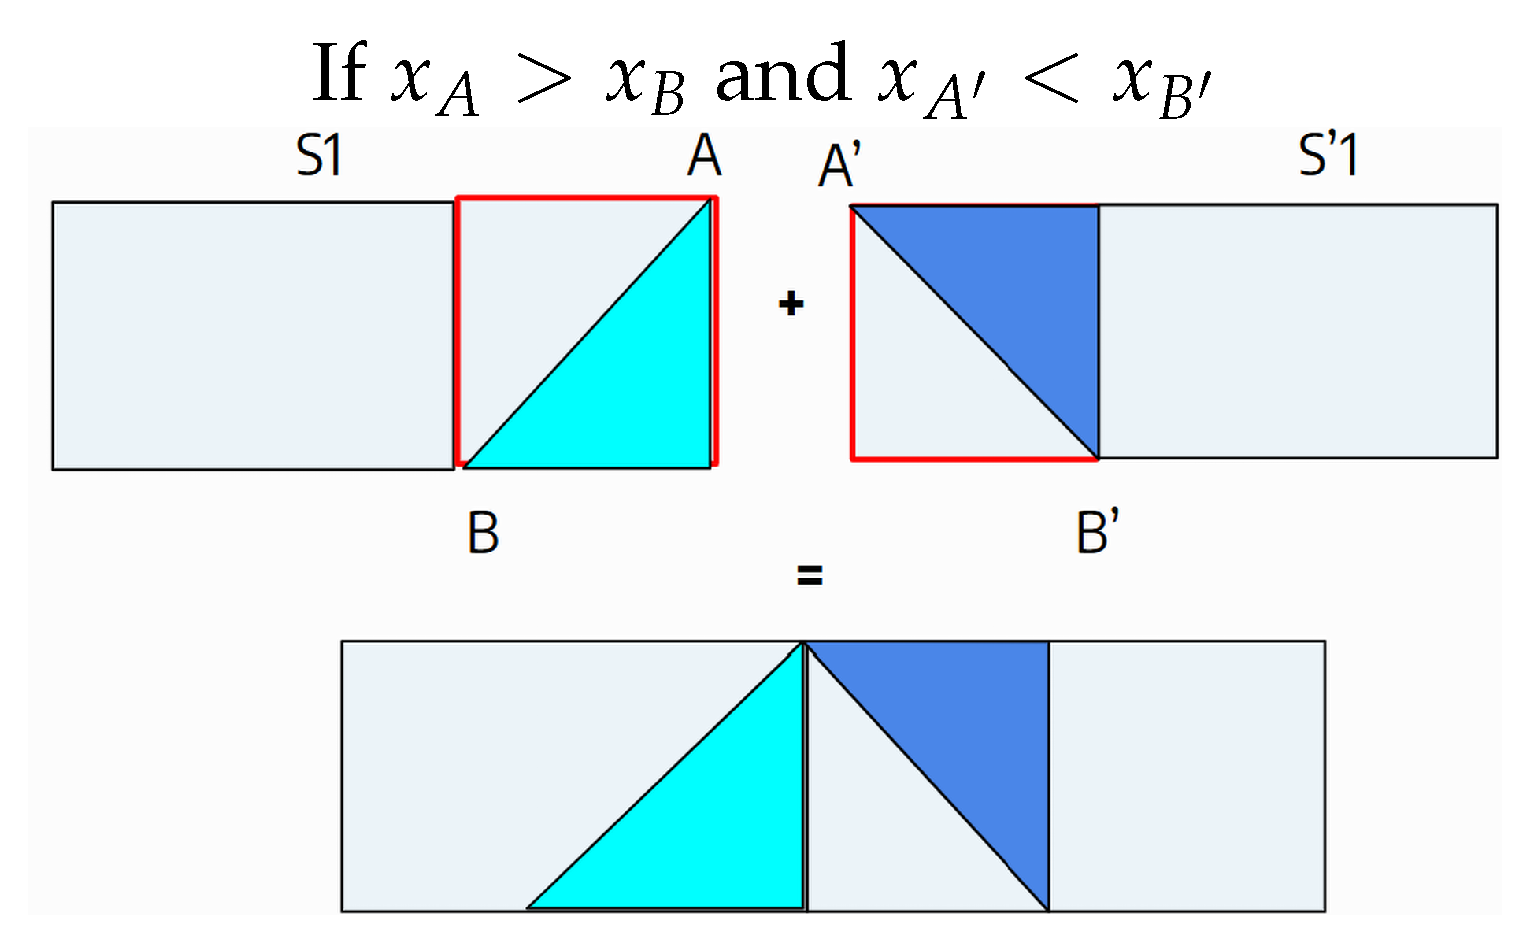
    If the x-coordinate of A is greater than B ( x A > x B ) AND A is greater than B ( x A > x B ): The segments are valid, as both pairs move from right to left (see Figure 3).
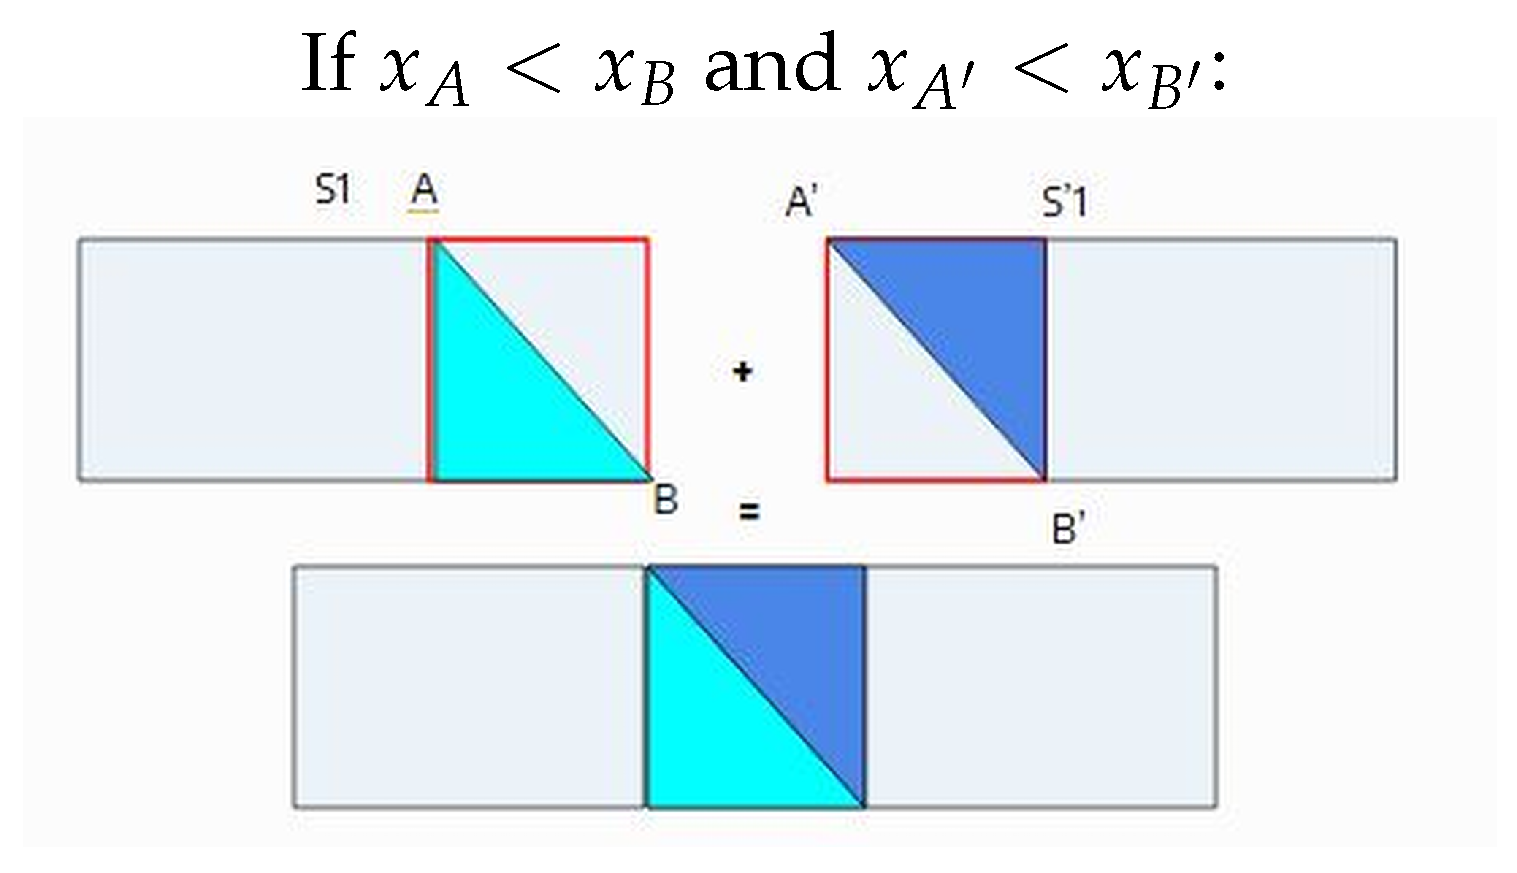
    If x A < x B and x A < x B : The segments are valid, as both pairs move from left to right (see Figure 4).
  • Invalid Segments (Inconsistent Direction): If the direction is inconsistent between the two images (e.g., x A > x B and x A < x B or vice versa), the segments are rejected as they are not complementary (see Figure 5). This prevents structural inconsistencies from being introduced during the final reconstruction.

3.4.2. Reconstruction

After the segments have been validated, the process moves to the fusion phase. Because both input images share an identical partitioning pattern, each segment of the first image corresponds directly to a segment of the second image. Corresponding segments are merged using a simple linear alpha transition: the contribution of the left segment decreases linearly from left to right, while the contribution of the right segment increases symmetrically. A final, light Gaussian smoothing is then applied across the seam area to suppress any residual visible artifacts. The resulting blended composites are fused horizontally, and the constructed rows are subsequently stacked vertically to form the final stitched image.
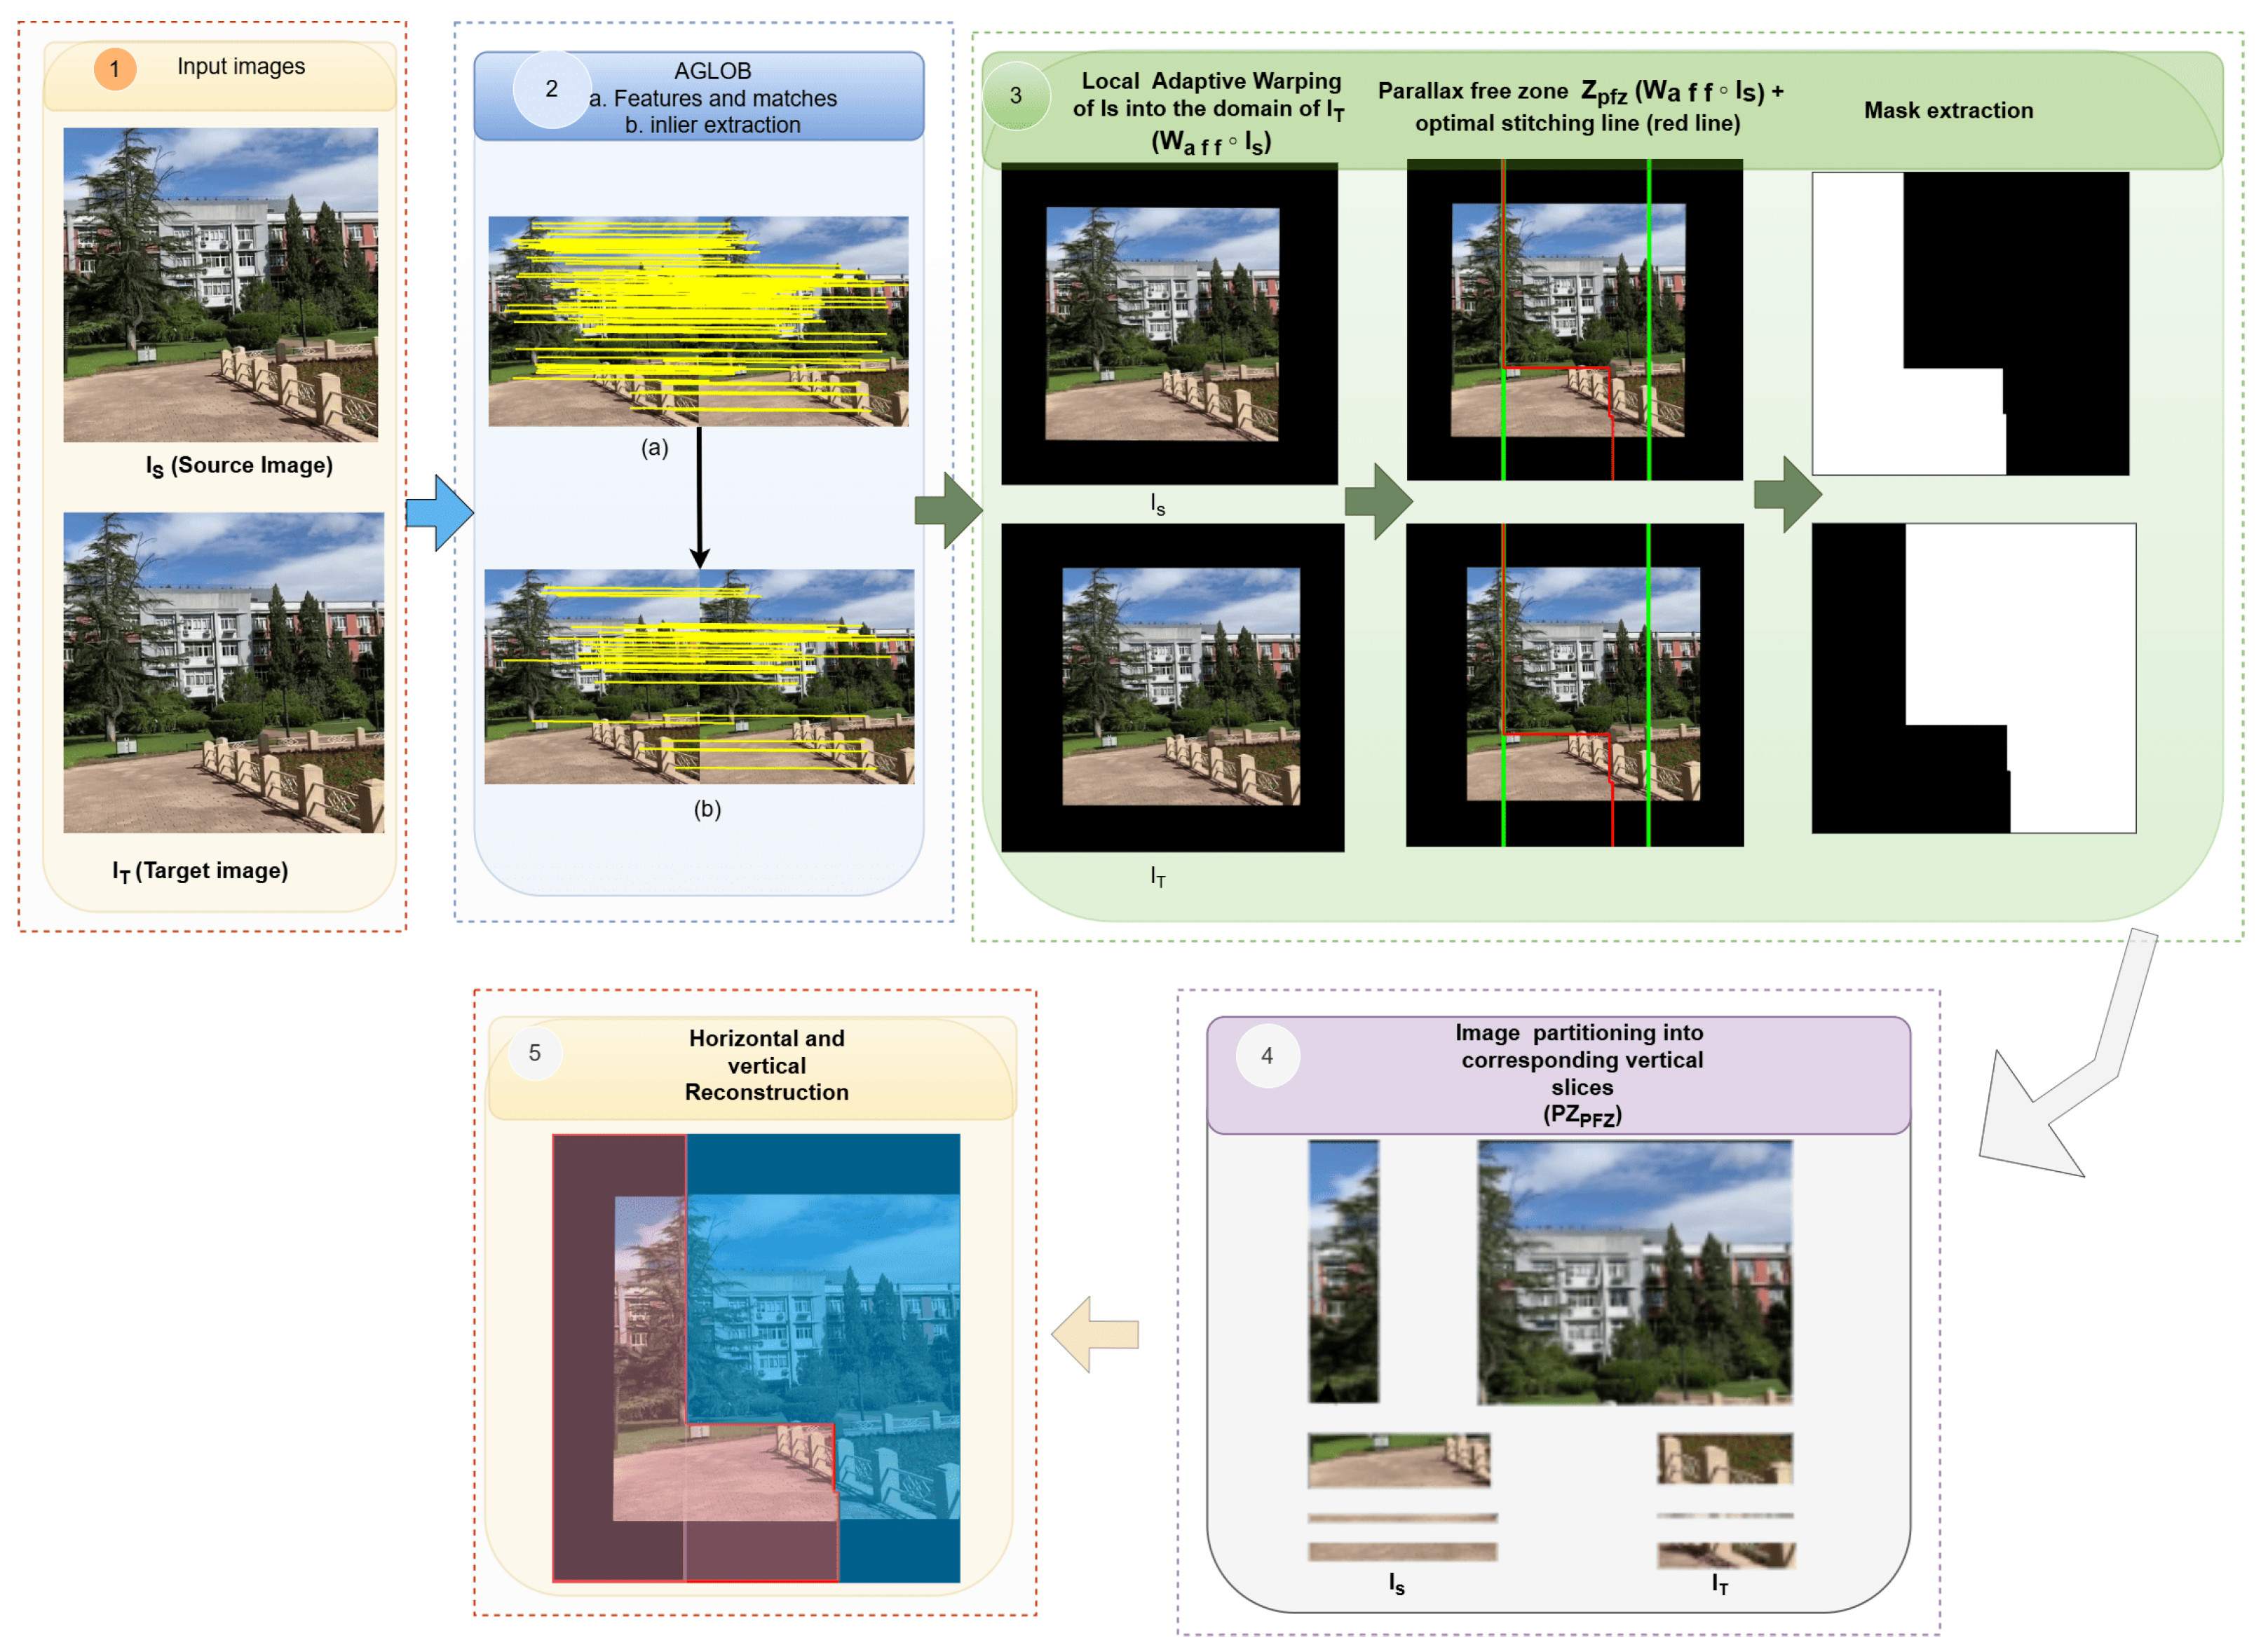
Figure 6 summarizes all the described processes.
During global affine matrix estimation from correspondences between the source image I s and target image I t , only inliers are retained for subsequent processing. The source image I s is then warped into the domain of I t using the locally adaptive affine warping operator W aff . Within the overlap region, a parallax-minimized zone Z pfz is identified, corresponding to the area bounded by the two green lines in Figure 6. An optimal stitching line is then extracted from this zone. Based on this seam, both images are partitioned into corresponding vertical slices through the partitioning operator P. Finally, the slices are reconstructed horizontally and vertically using the composition operator C v , h to produce the final stitched image I stitch .

4. Experimentation and Results

4.1. Dataset and Implementation Details

Datasets: We evaluated our method on several widely used benchmark datasets, including UDIS-D [22], REW [24], the SPHP dataset [25], the Natural Image Stitching dataset [26], and LPC benchmark scenes [18]. These datasets present varying levels of difficulty in terms of geometric distortion, viewpoint changes, and scene complexity. The code is available on GitHub, https://github.com/Camertronix-Cm/seamlessly-natural-sena-/tree/main (accessed on 1 December 2025). Implementation Details: We use the following fixed parameter configuration across all experiments without dataset-specific tuning. We set the grid resolution to G x × G y = 2 × 2 and the deformation lattice to 64 × 64 . Ridge regularization uses λ 1 = 2.2 and λ 2 = 2.8 . The confidence bounds are fixed to κ min = 0.2 and κ max = 1.5 . The disparity clustering threshold is set to v = 5 . For seam gating (Equation (4)), we set ρ = 0.10 , γ p = 1.2 , σ d = 24 , γ min = 0.30 , and σ g = 1.1 .
All experiments were conducted in a Google Colaboratory environment equipped with 12.67 GB of RAM and 107.72 GB of disk storage.

4.2. Quantitative Evaluation

This section reports quantitative results obtained on several benchmark datasets, comparing image quality assessment (IQA) metrics and runtime performance.

4.2.1. Image Quality Accessment

Table 1 summarizes quantitative results for recent algorithms on the most challenging datasets of the literature.
PSNR and SSIM
Alignment accuracy in the overlap region between stitched images is evaluated using peak signal-to-noise ratio (PSNR) and the structural similarity index measure (SSIM). PSNR and SSIM are computed only within the overlapping region between the aligned image pairs. Specifically, the warped source image is compared with the target image inside the overlap mask, which provides a reference region where both images should ideally coincide after alignment. We used the UDIS-D dataset (1106 images grouped by difficulty: easy, moderate, and hard) for this experiment.
Table 1 presents PSNR and SSIM results for warp alignment on the easy, moderate, and hard subsets. Most methods achieve competitive performance on easy scenes, while their accuracy degrades as scene difficulty increases due to parallax and geometric inconsistency. Learning-based approaches, particularly UDIS++, perform well on easy and moderate cases but show reduced robustness on hard scenes. In contrast, our method demonstrates improved robustness as scene difficulty increases and achieves the best results on the hard subset as well as the highest average PSNR and SSIM. These results indicate stronger robustness to severe parallax and complex scene geometry.
BRISQUE
The perceptual quality is also evaluated using the Blind/Referenceless Image Spatial Quality Evaluator (BRISQUE) metric.
A perceptual quality evaluation is shown in Table 2, reporting BRISQUE (BRI) scores, where lower values indicate better perceptual quality. For some methods, BRISQUE scores could not be computed and are therefore marked as F. Among the methods with valid outputs, our approach achieves the lowest BRI score, indicating improved perceptual quality. These results complement the quantitative alignment evaluation by providing an additional perspective on visual quality.

4.2.2. Runtime Execution

We selected four images at varying resolutions to evaluate runtime performance. For each image and method, we executed the complete stitching pipeline five times and report the average execution time in Table 3.
As expected, and as seen in Table 3, runtime generally decreases as image resolution decreases. However, certain methods exhibit non-monotonic behavior, occasionally requiring more time on smaller images. These variations arise primarily from the number of detected and matched features, which does not scale linearly with resolution and can dominate the computational cost of feature-based alignment stages. Our approach achieves the lowest execution time across all resolutions due to its reduced computational complexity.
Each pair of images was processed five times during both experiments. Table 4 presents the execution time of our algorithm on the largest individual image from each pair. As expected, runtime increases with image resolution, reflecting the higher computational cost of processing larger inputs.

4.3. Qualitative Evaluation

We compare our approach against several state-of-the-art methods, including APAP [20], ELA [21], UDIS [22], UDIS++ [10], and SEAMLESS [11]. Readers are encouraged to zoom in on the images to better observe the highlighted regions. Additional data are provided in the online resource, and comprehensive visual comparisons are provided in Google Drive, https://drive.google.com/drive/folders/1CUV0PjbWwC7lh_VVOazLt5XnPYELgjfc?usp=drive_link (accessed on 20 October 2025).
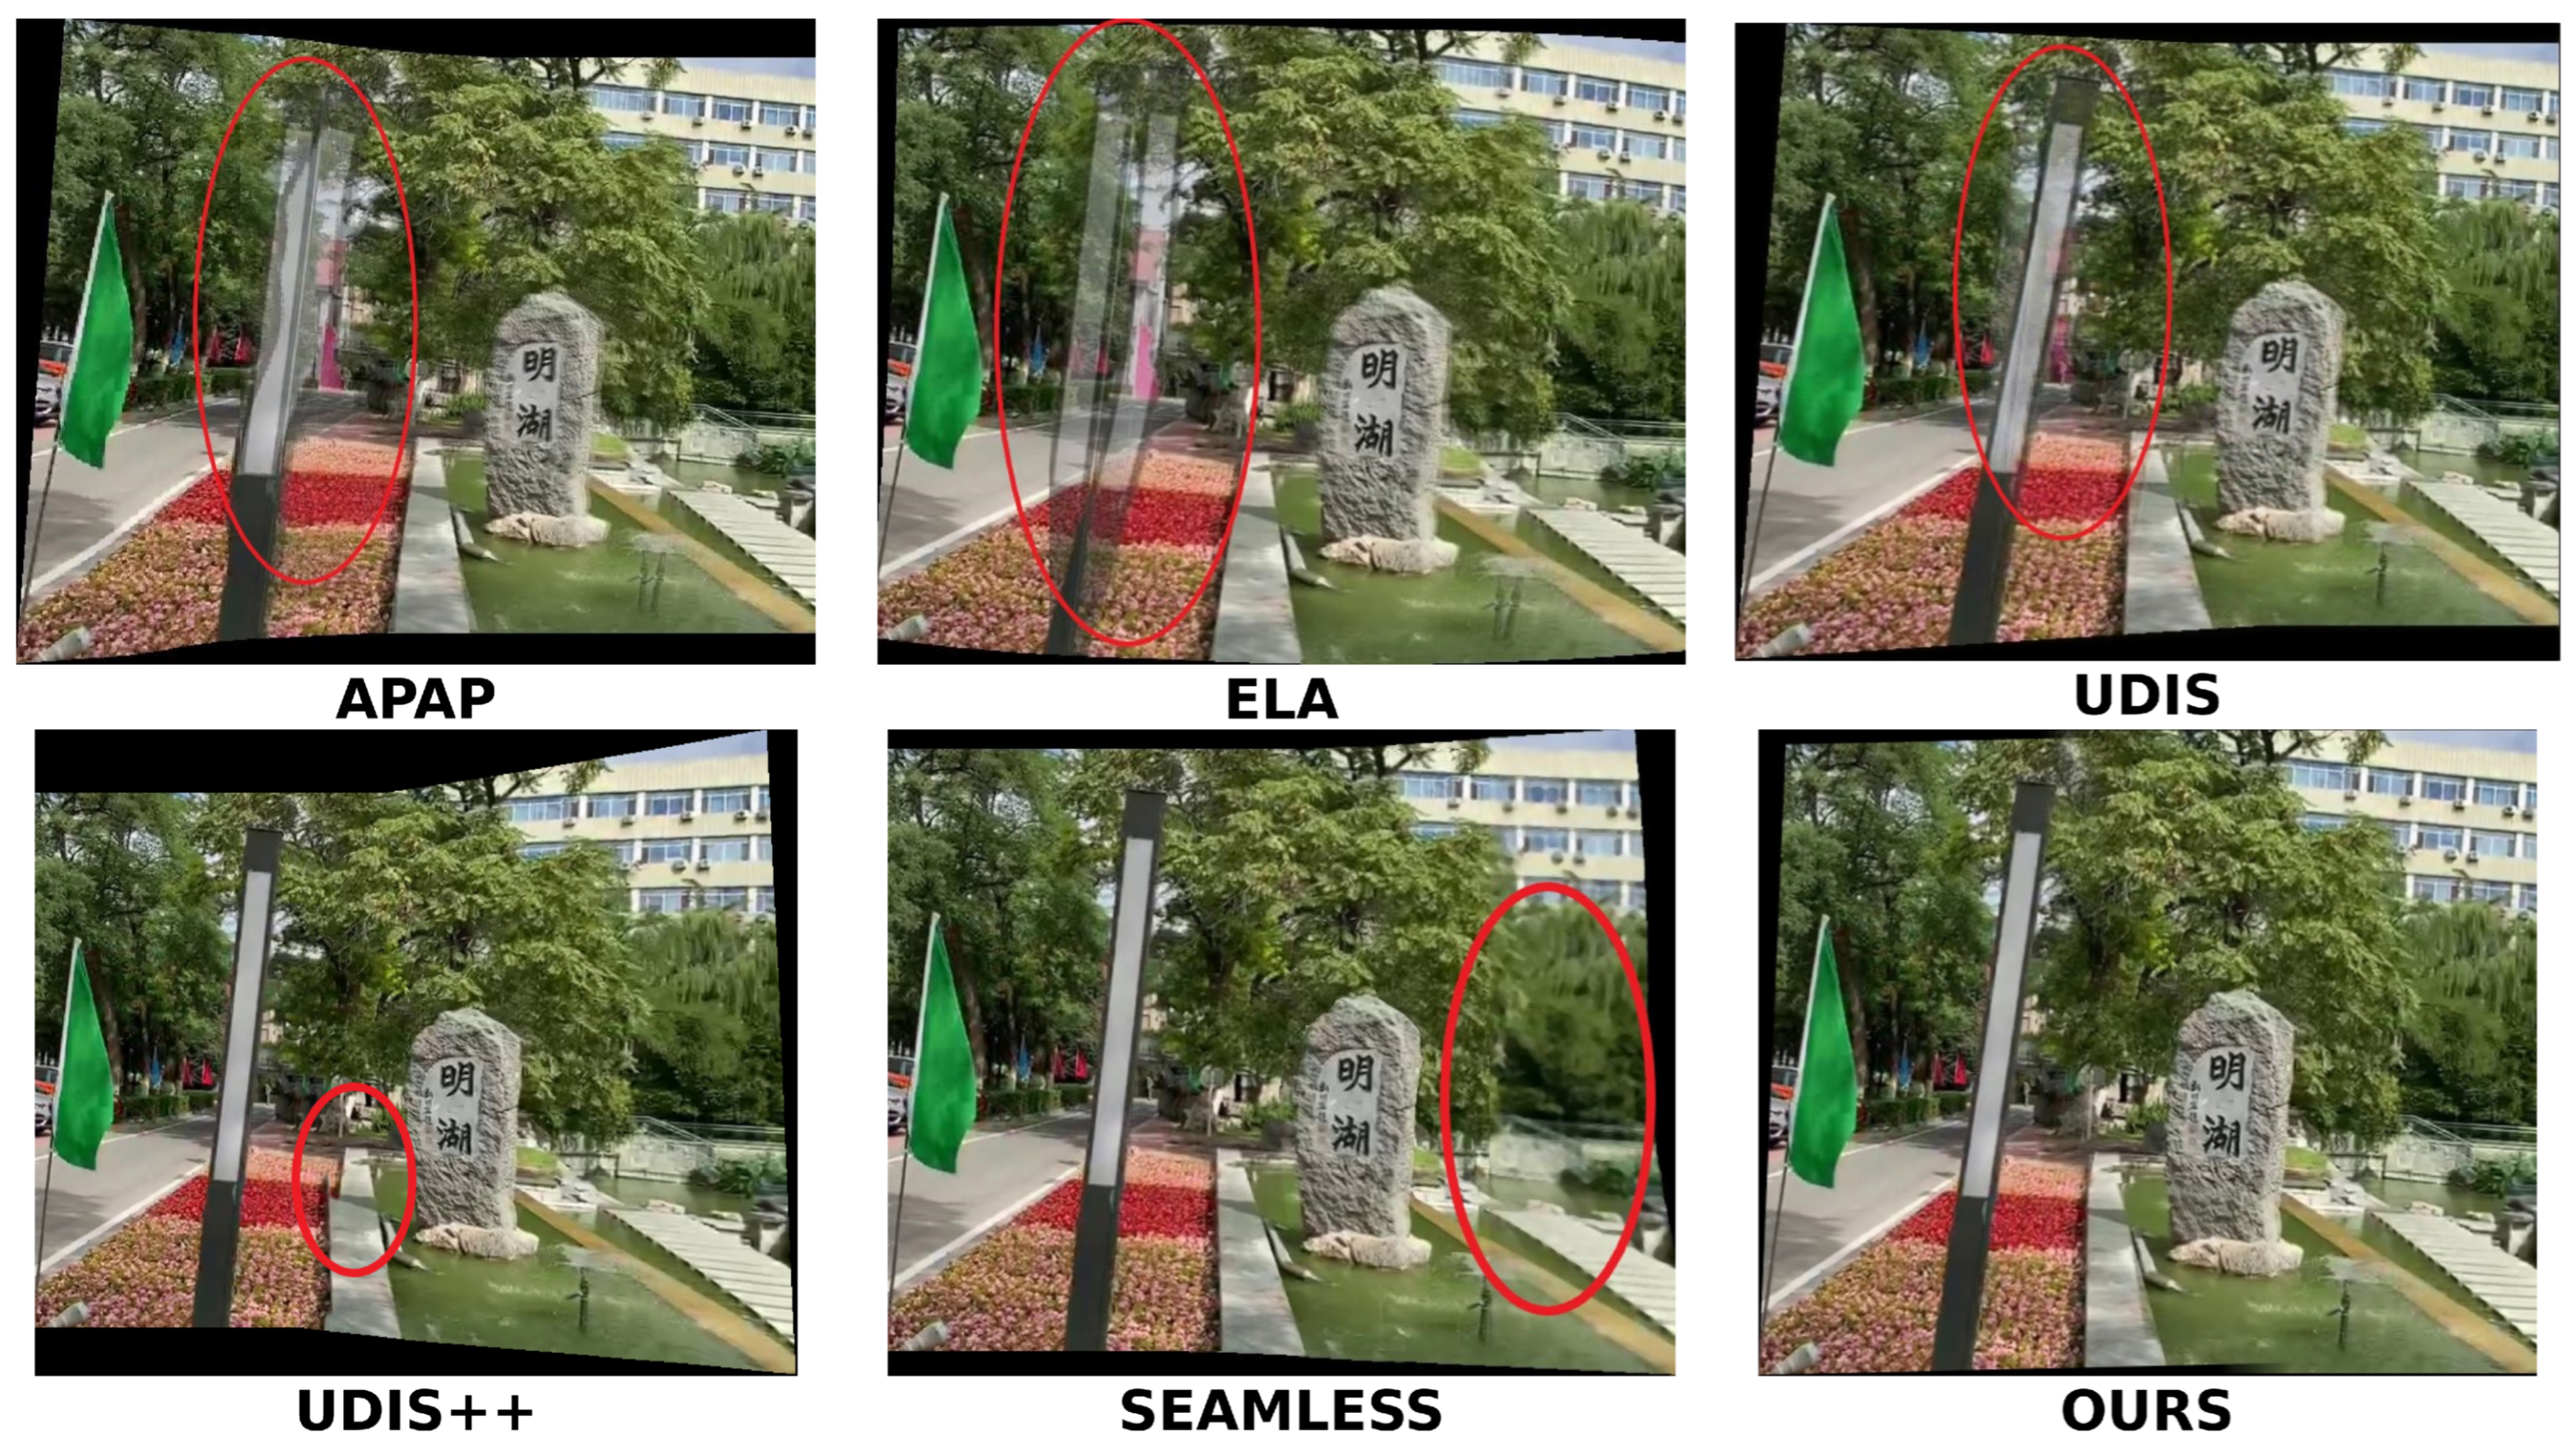
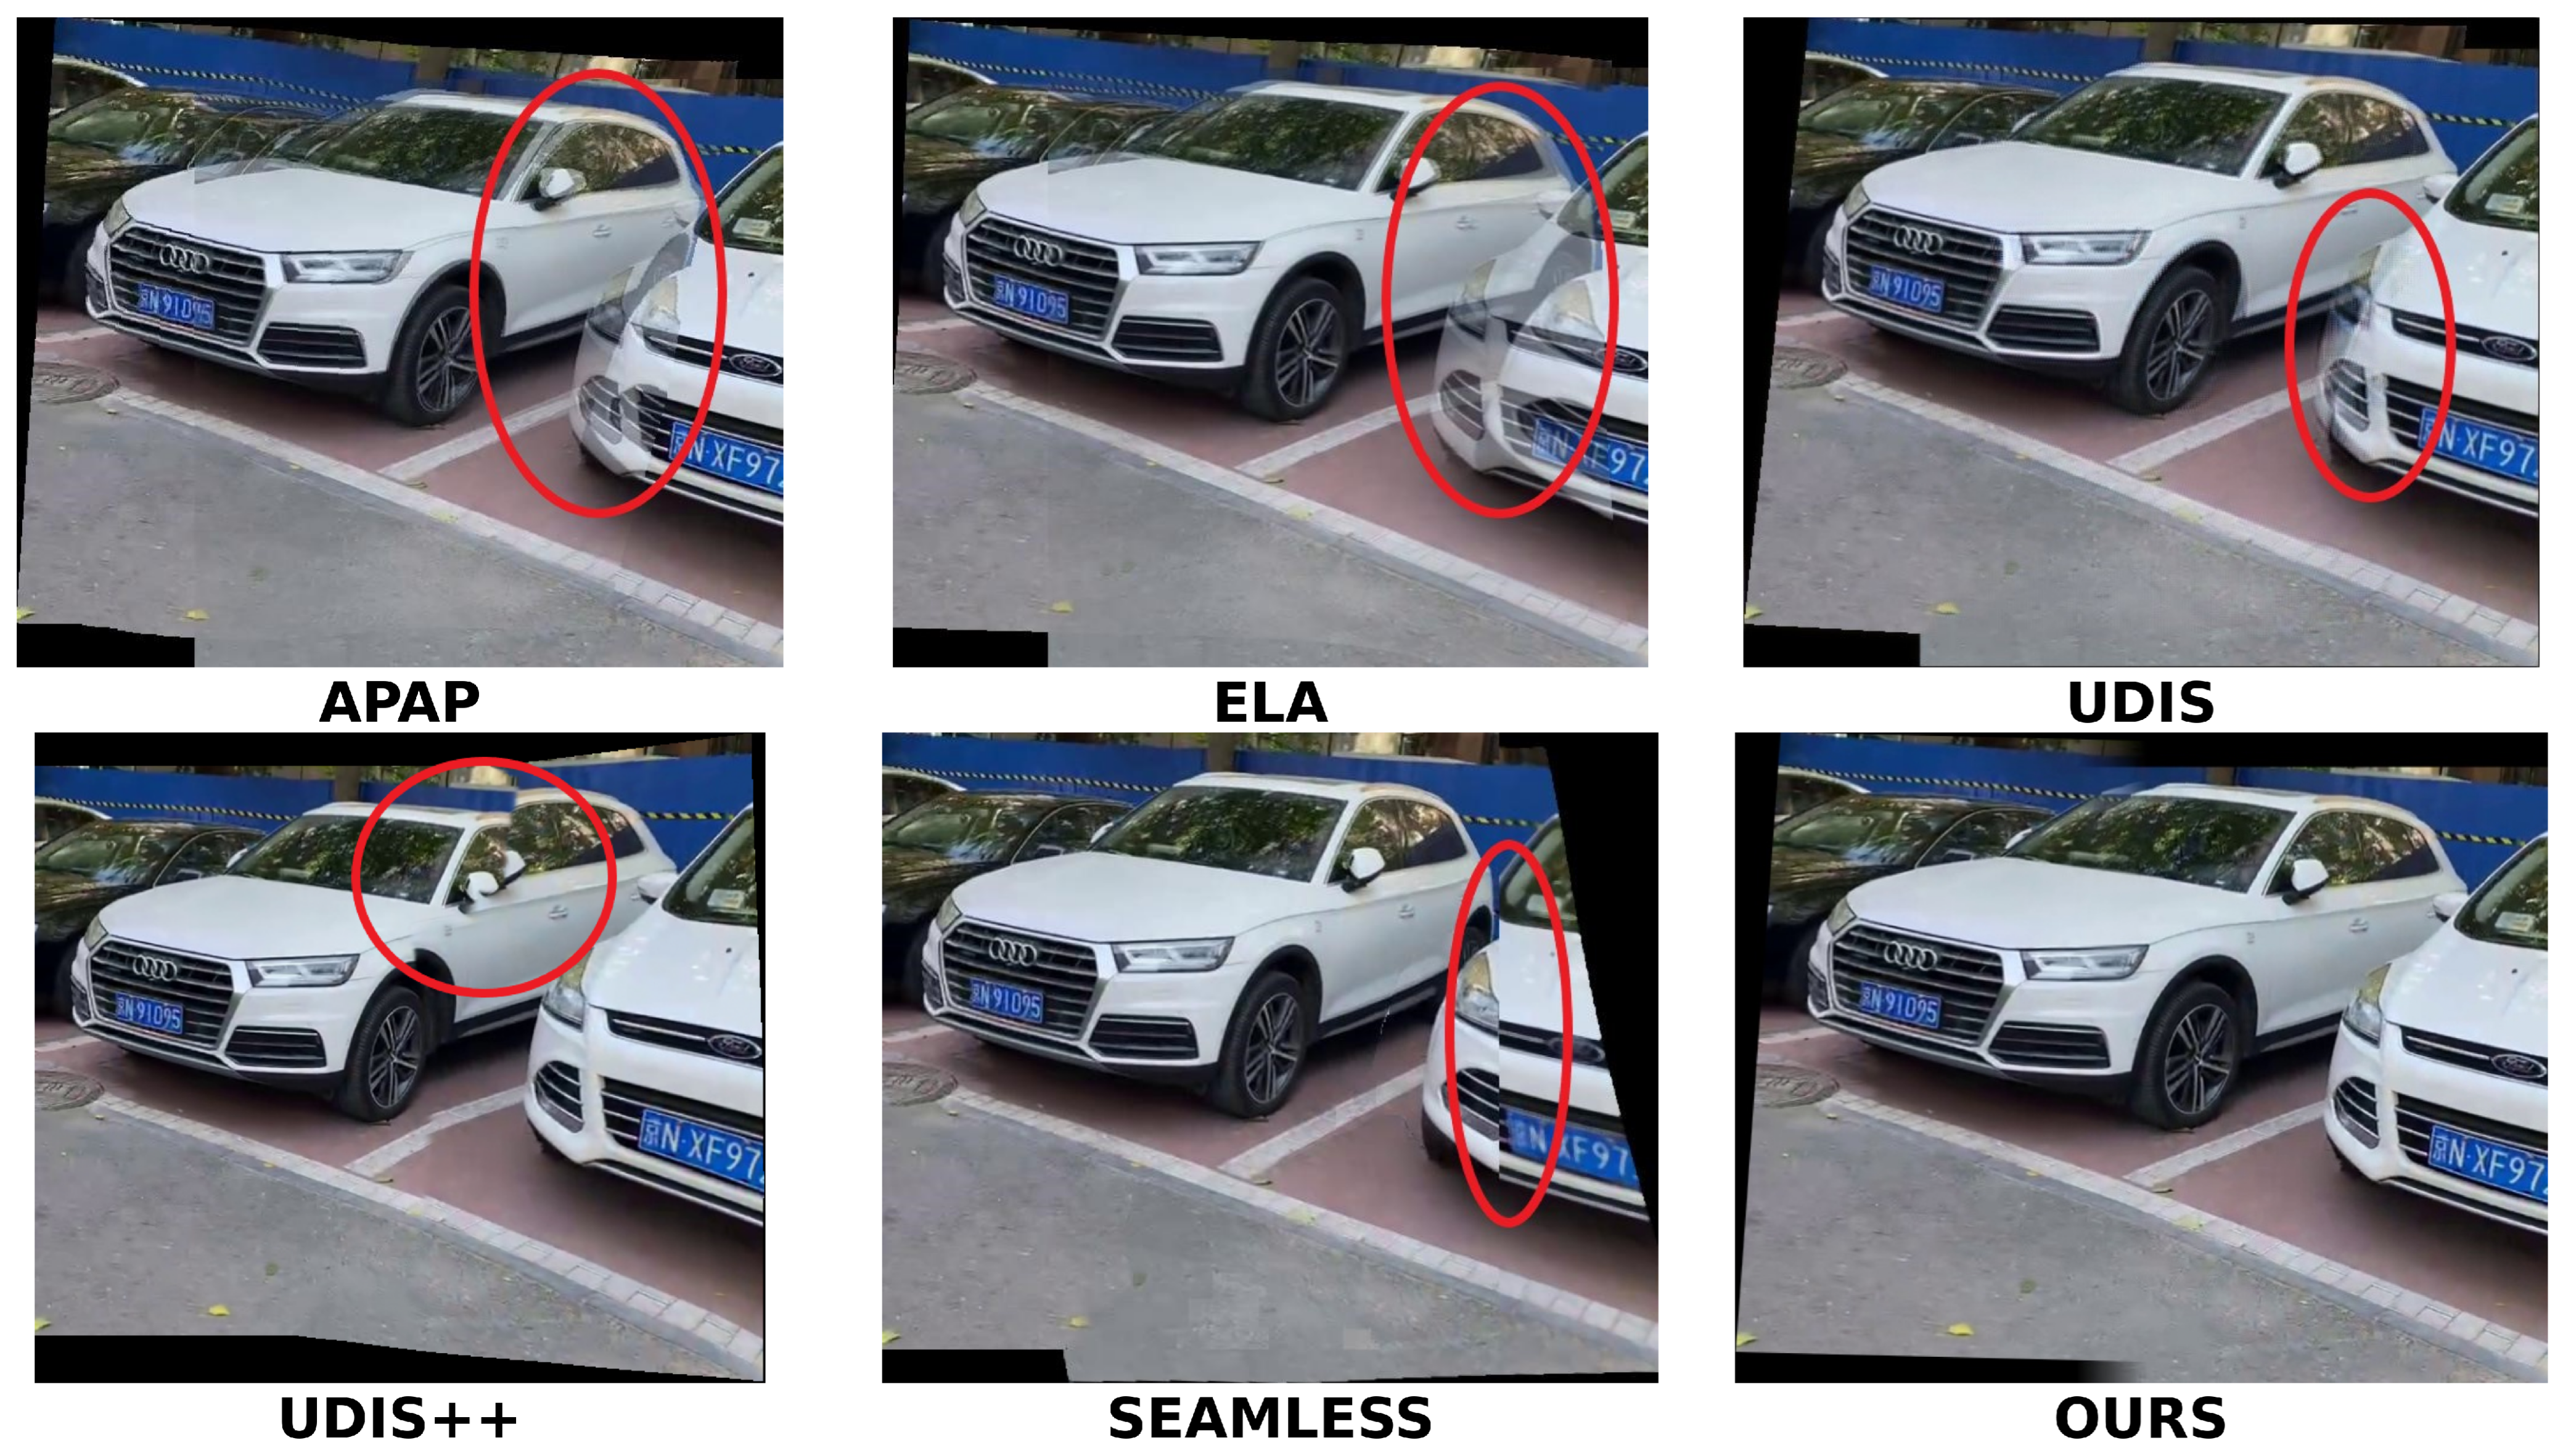
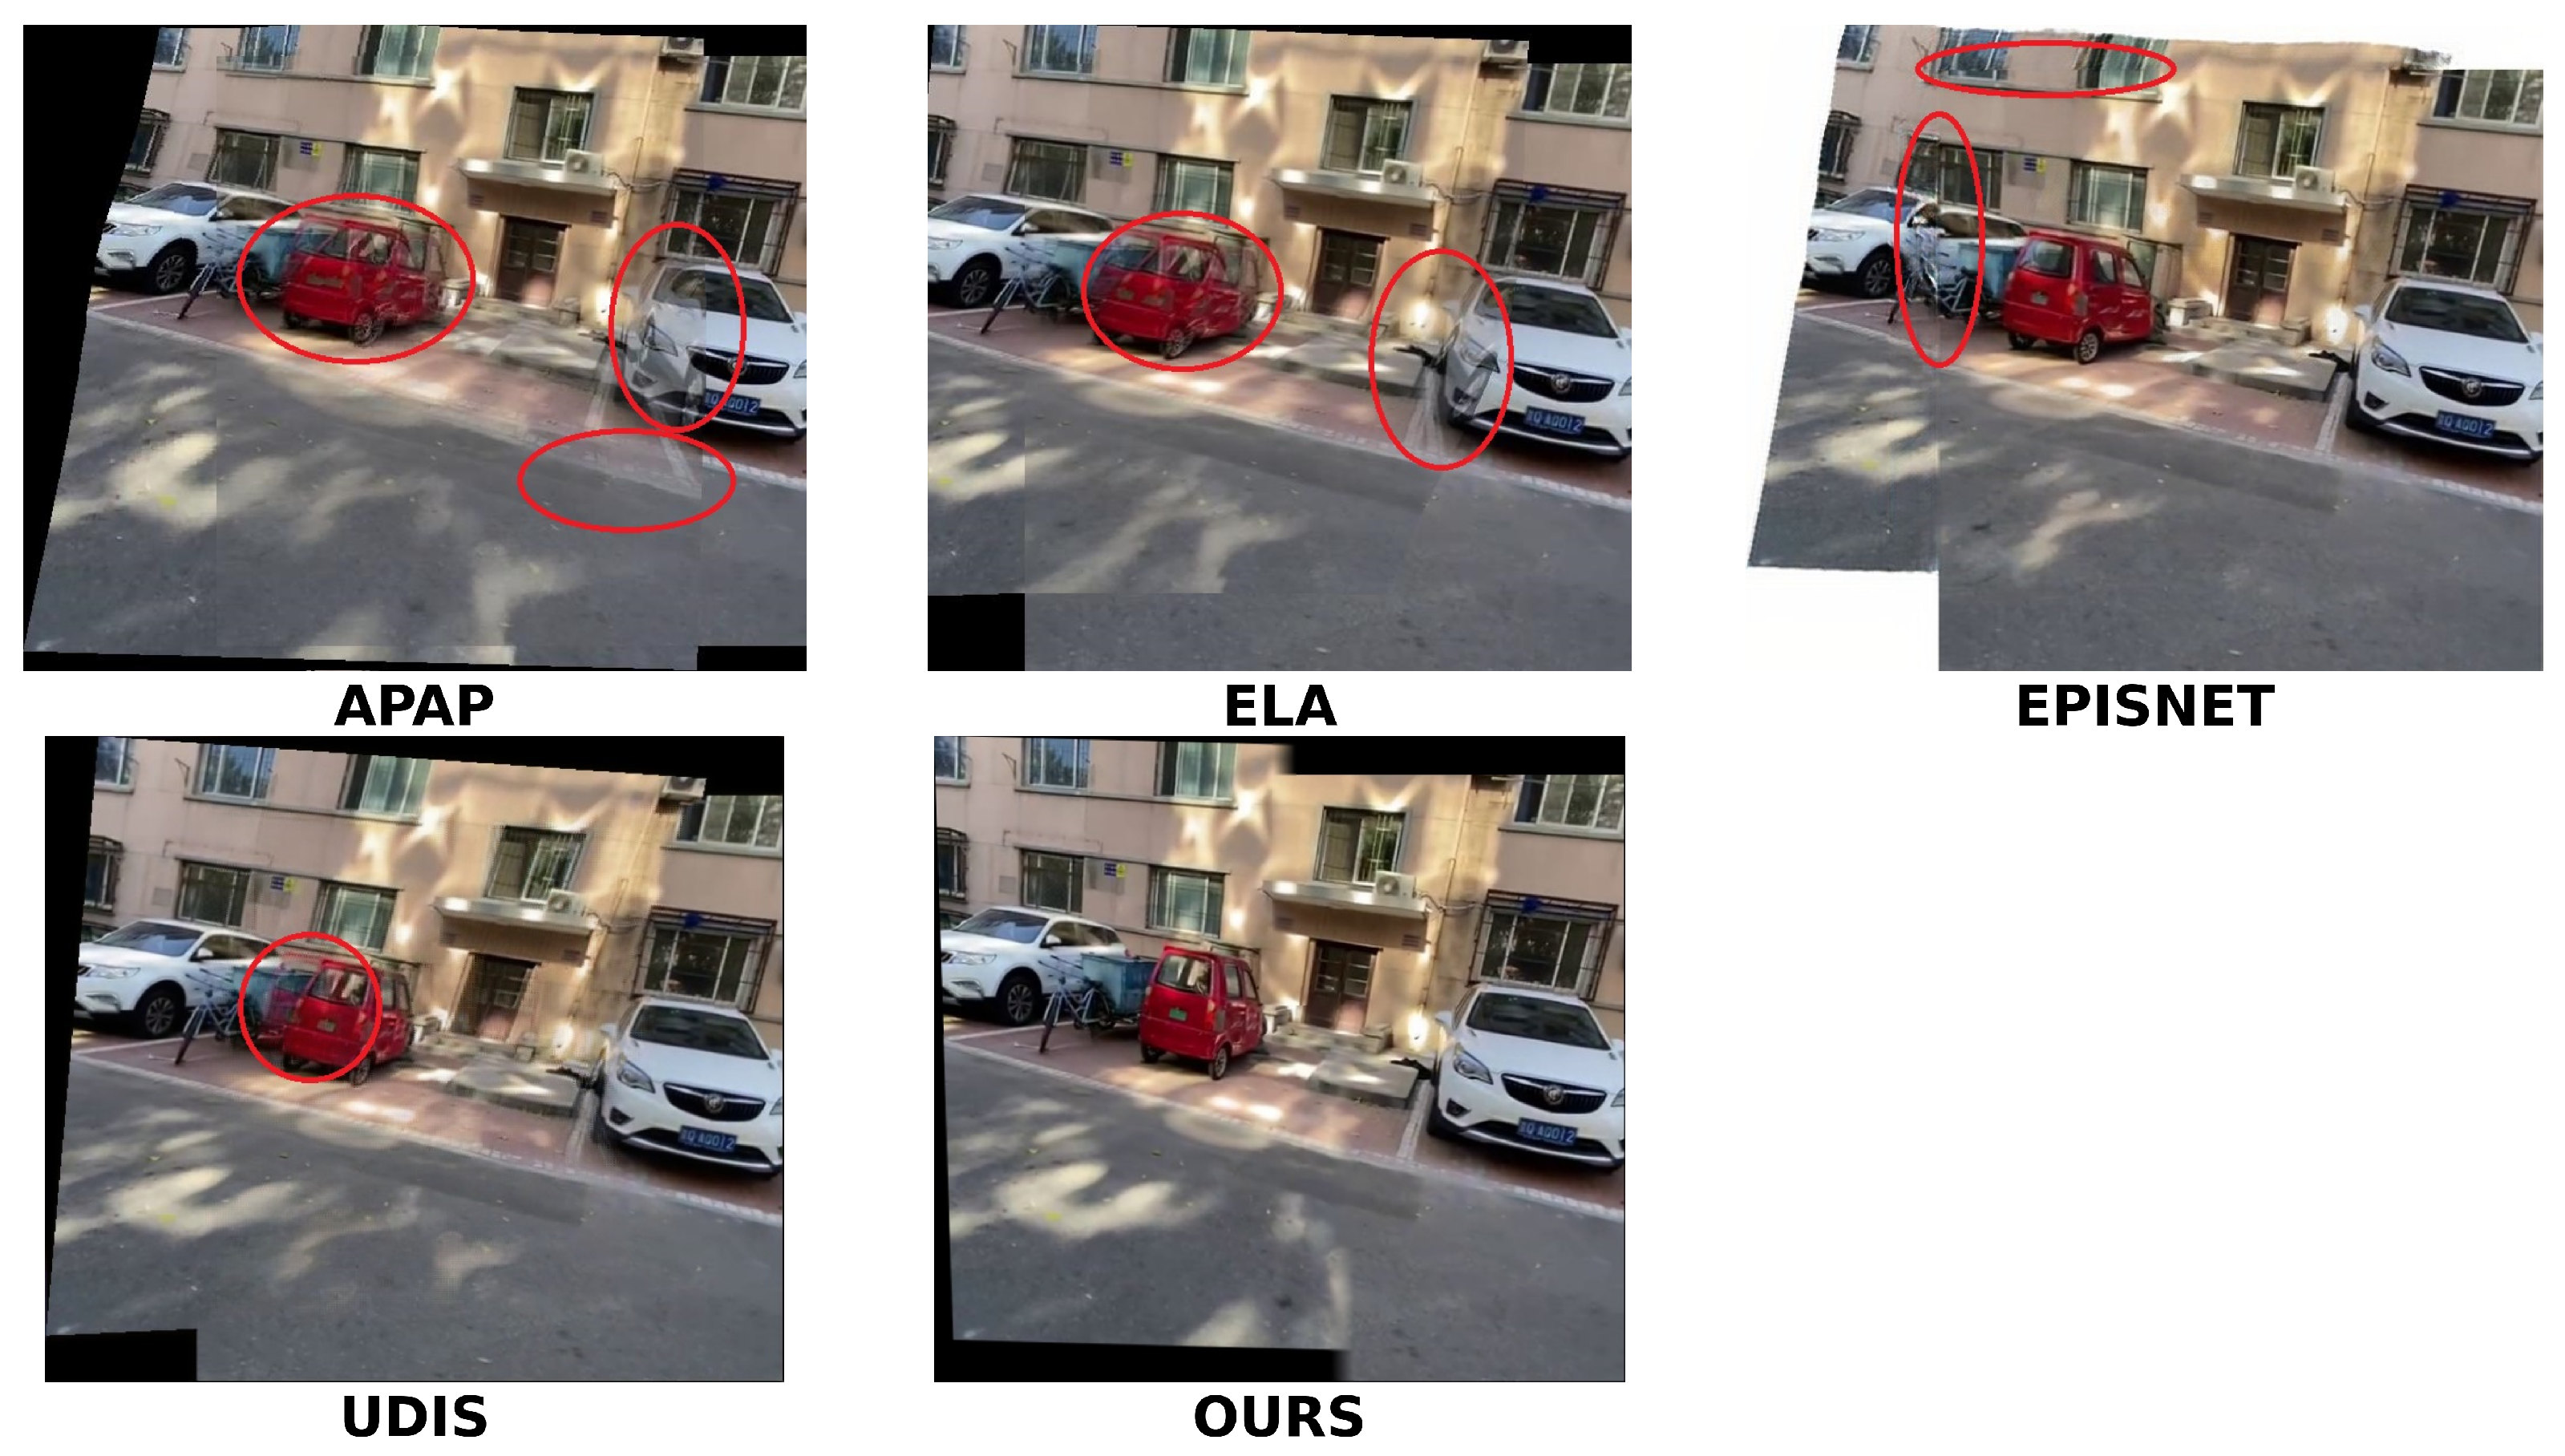
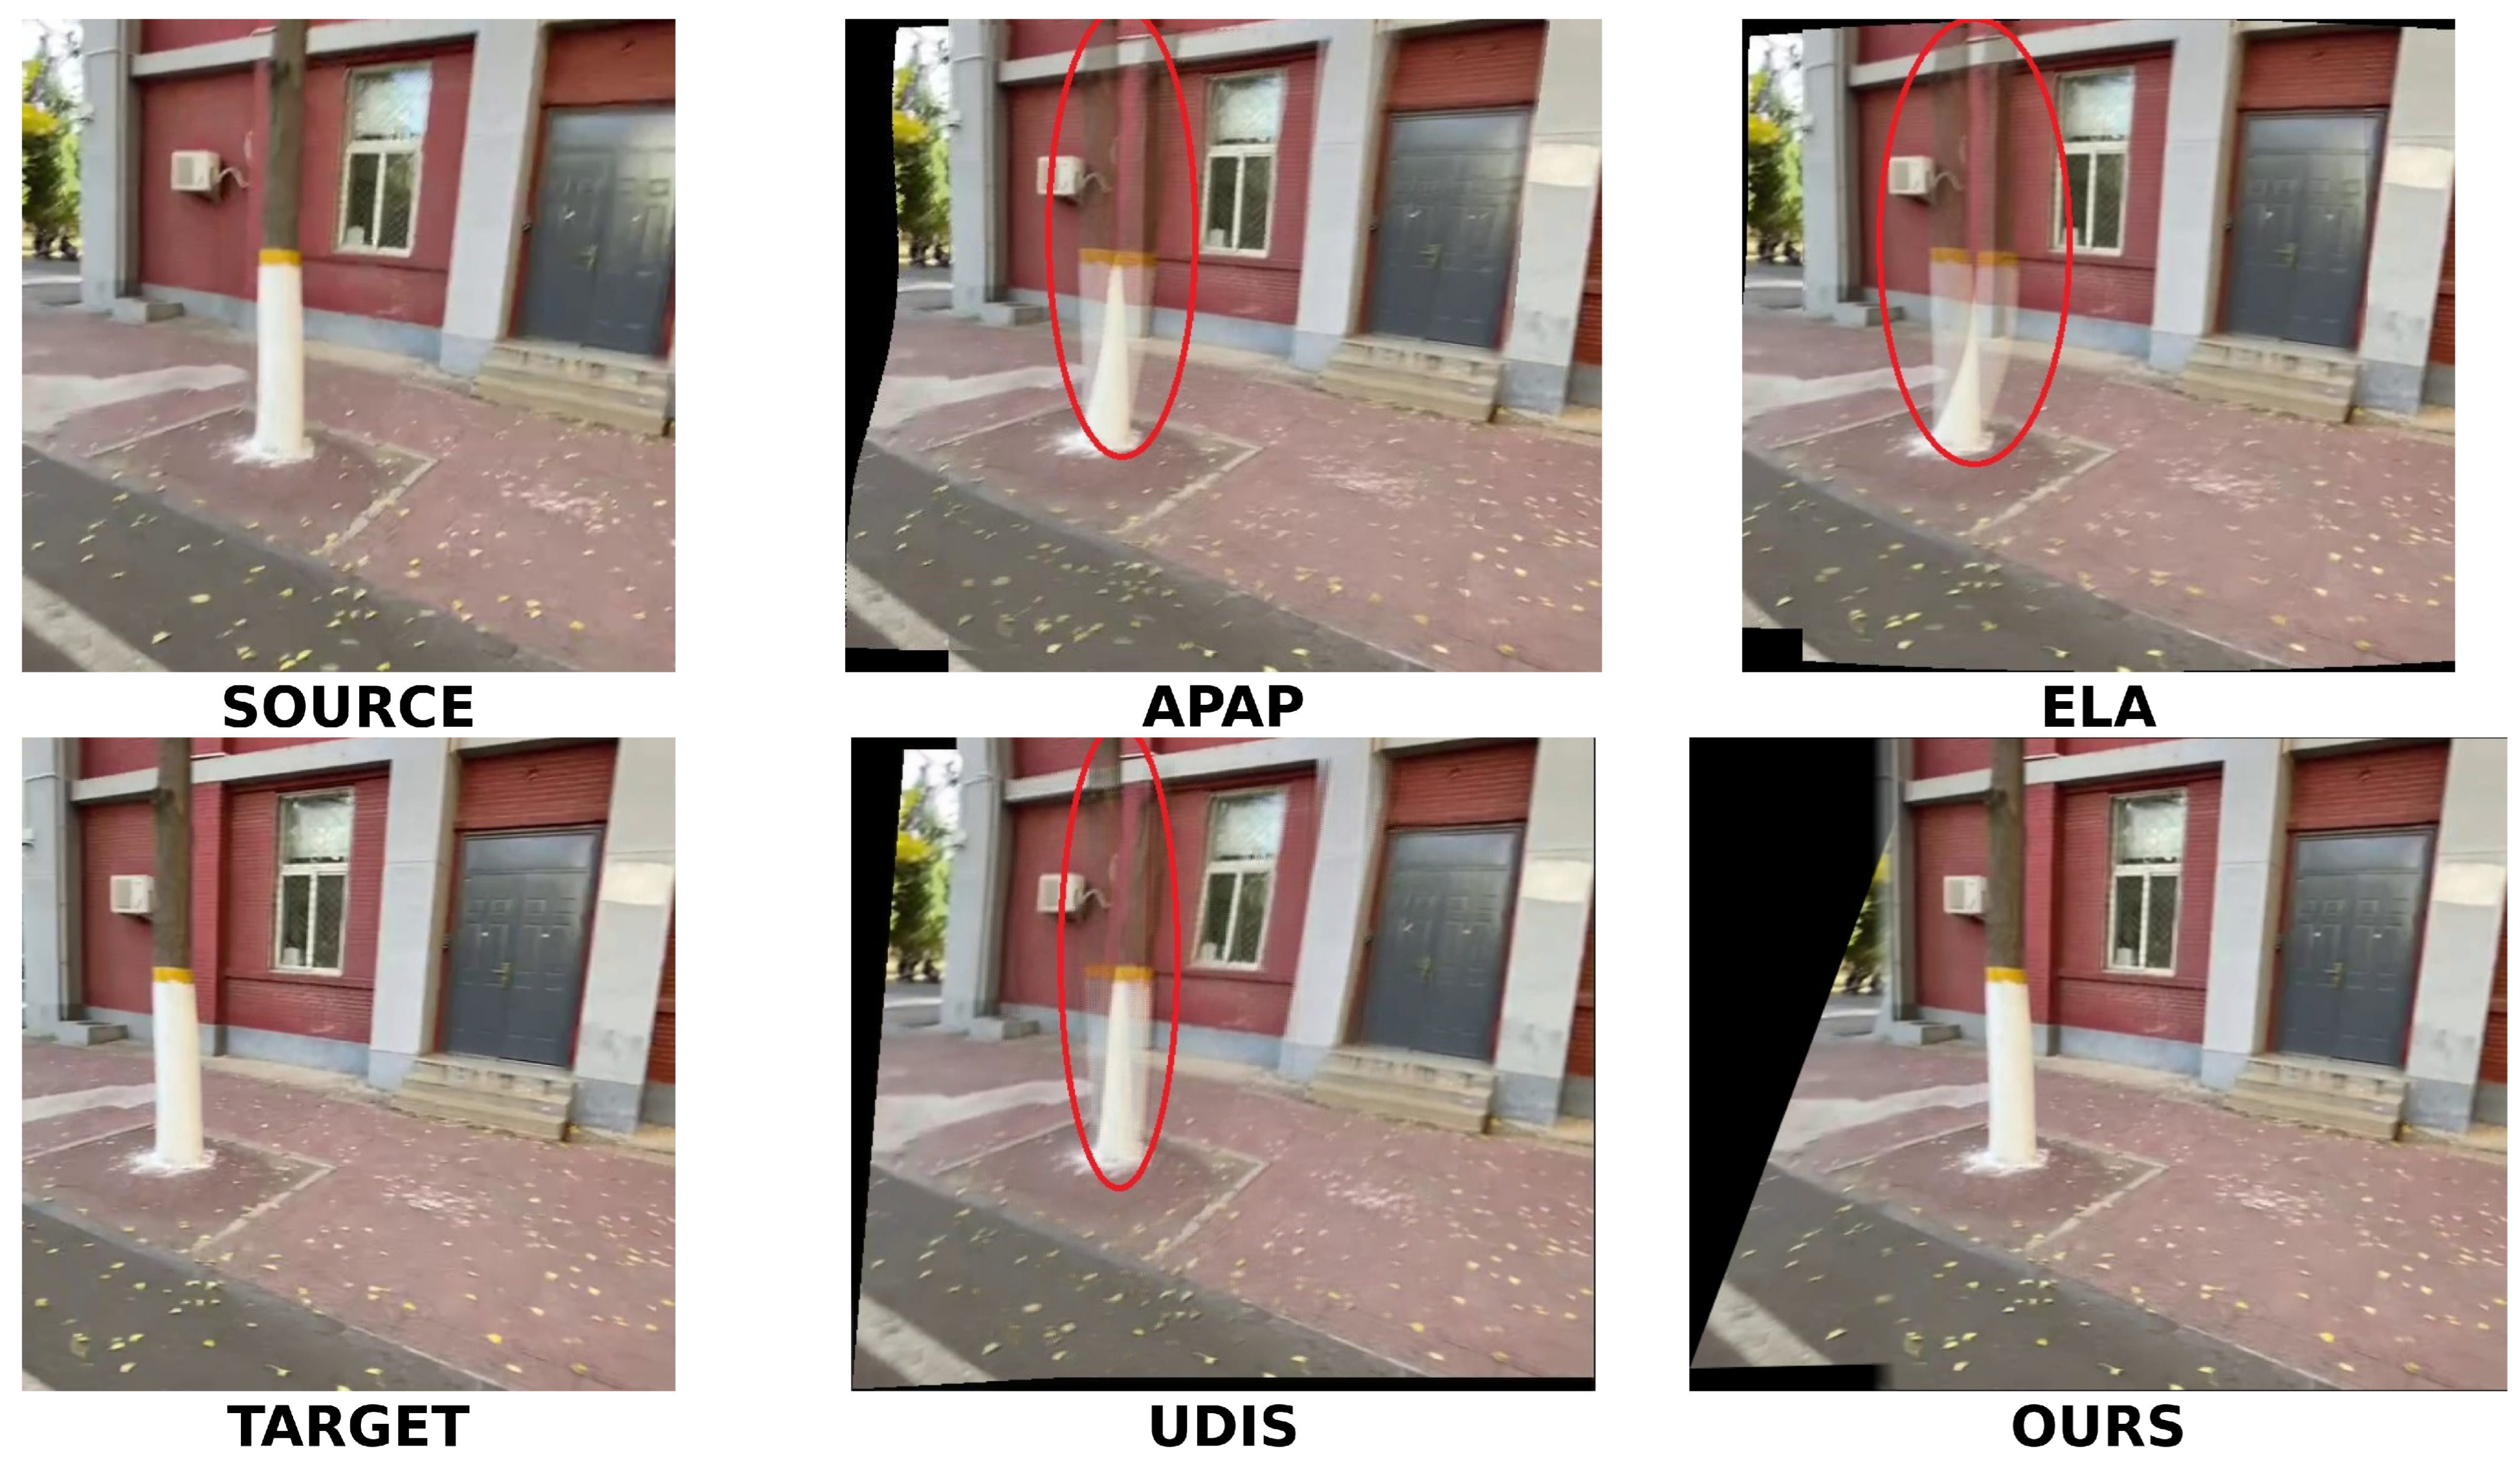
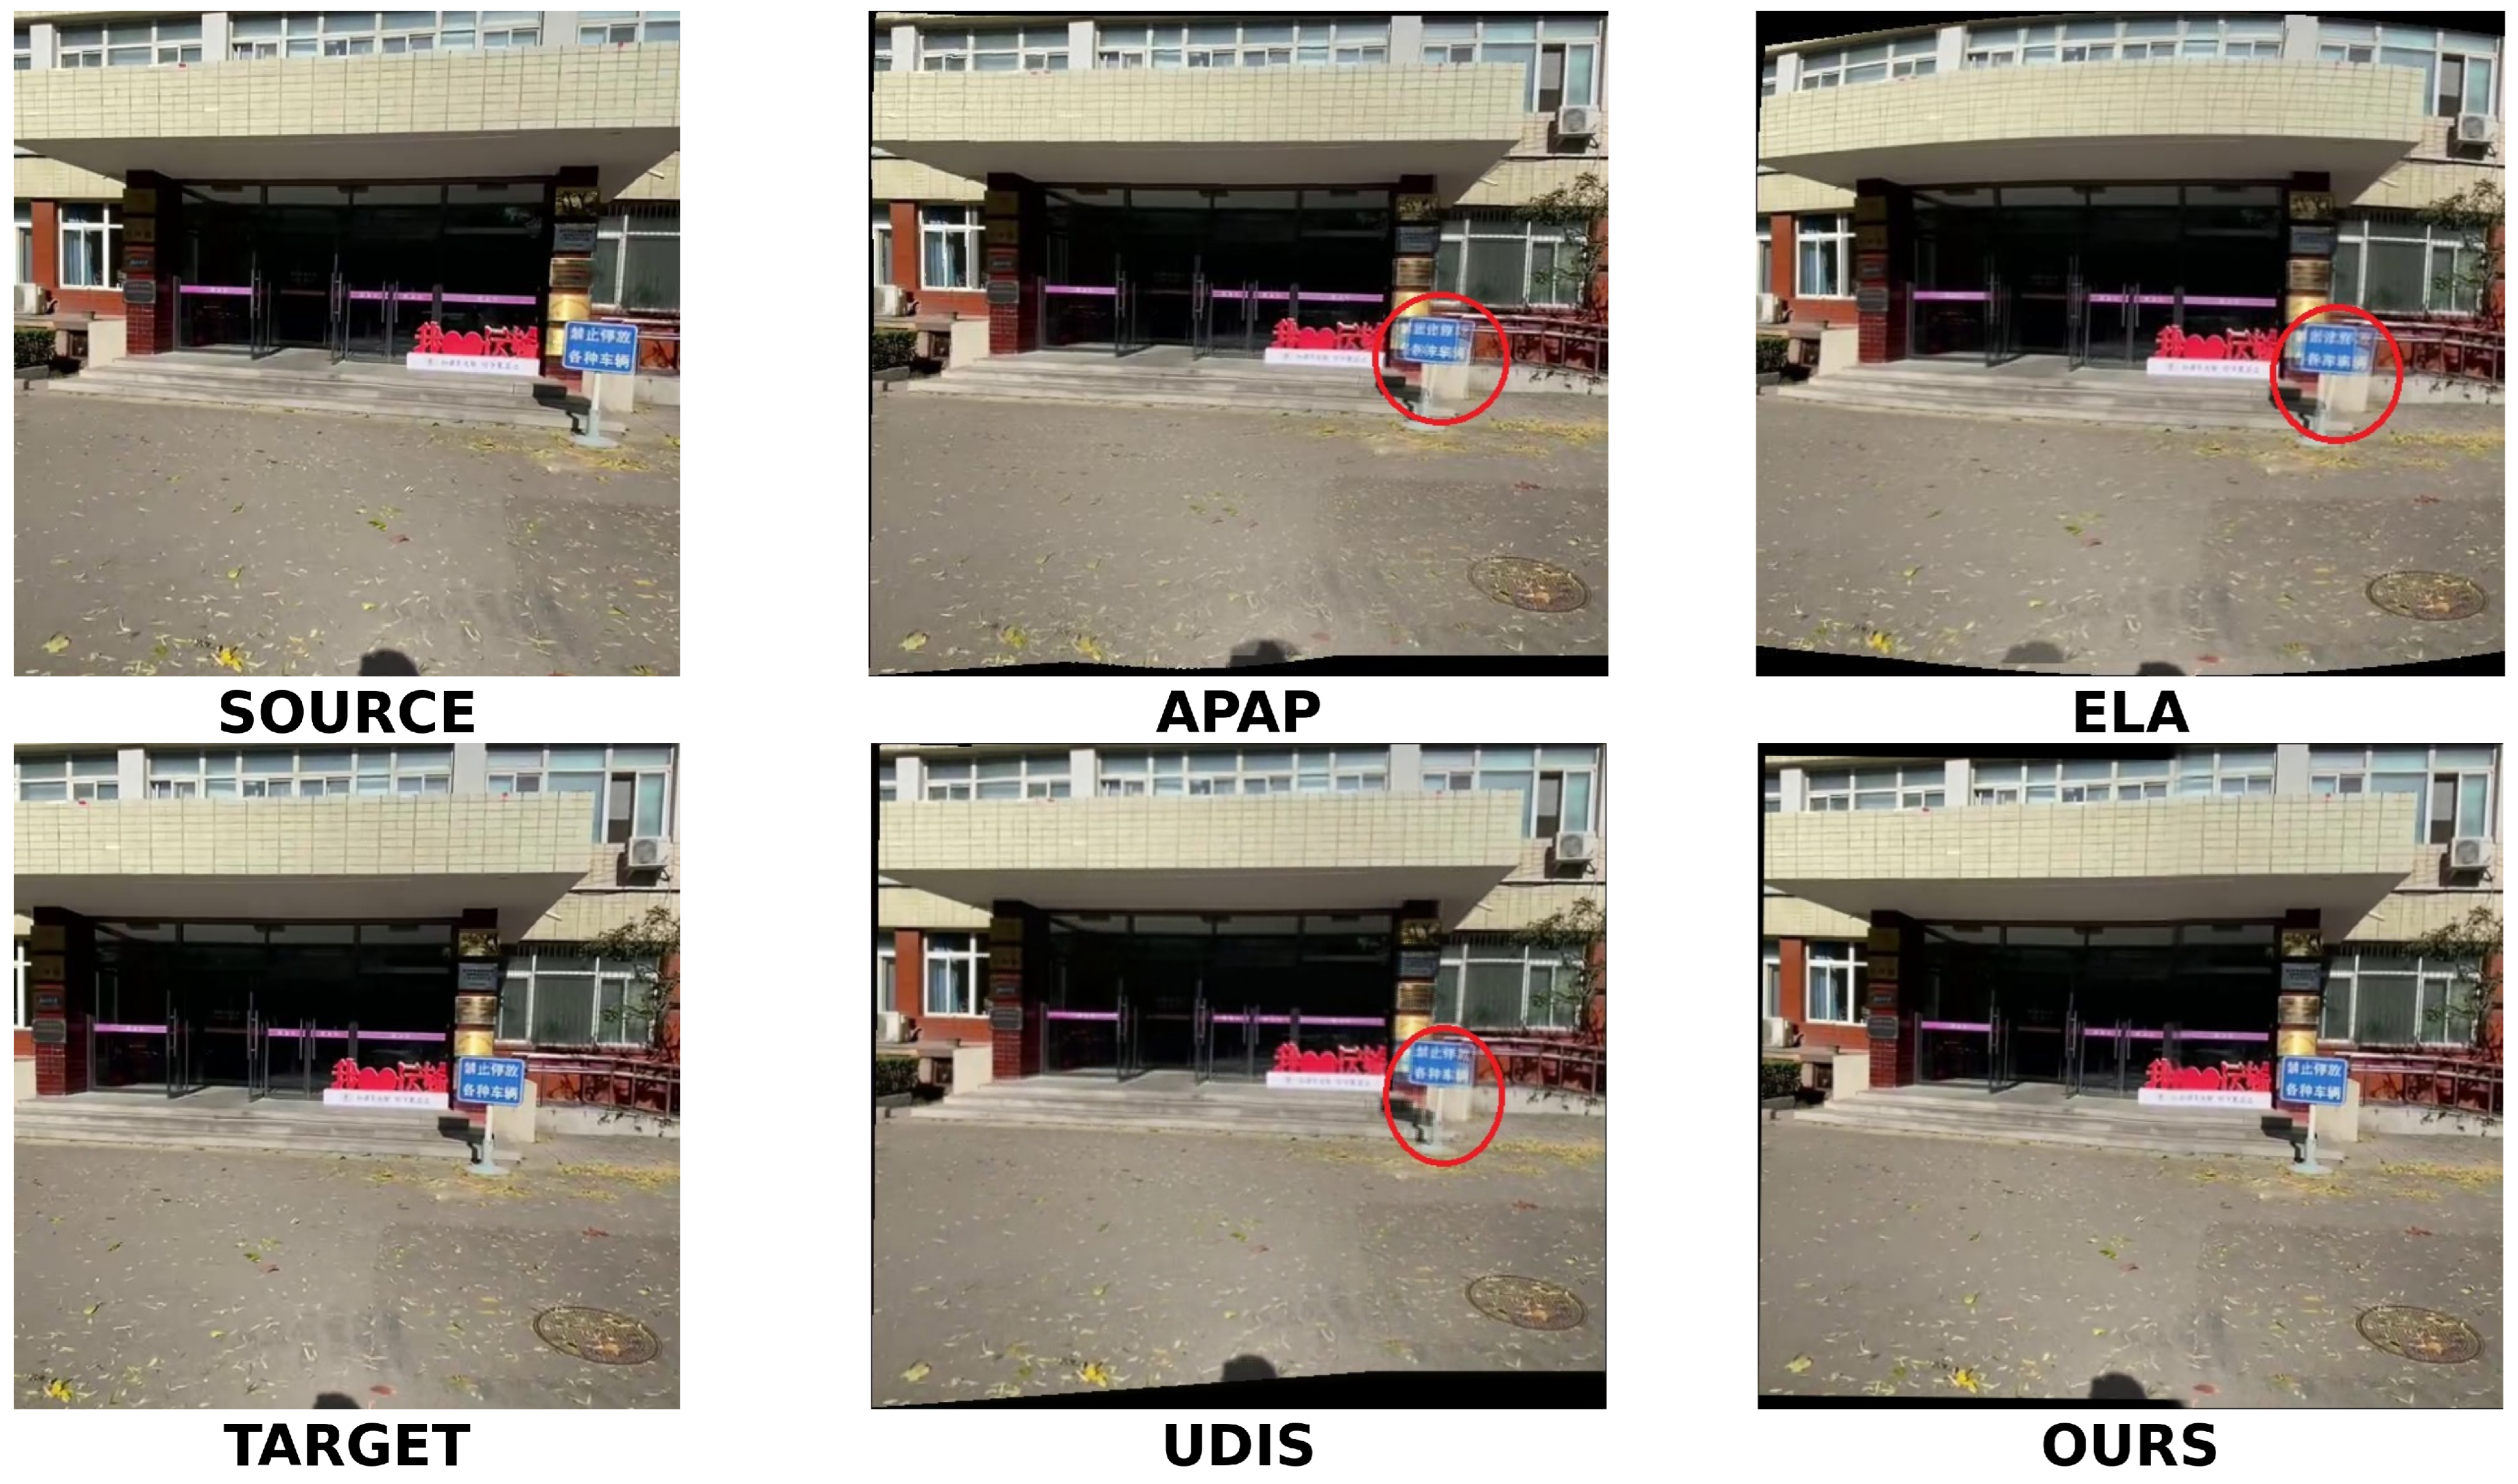
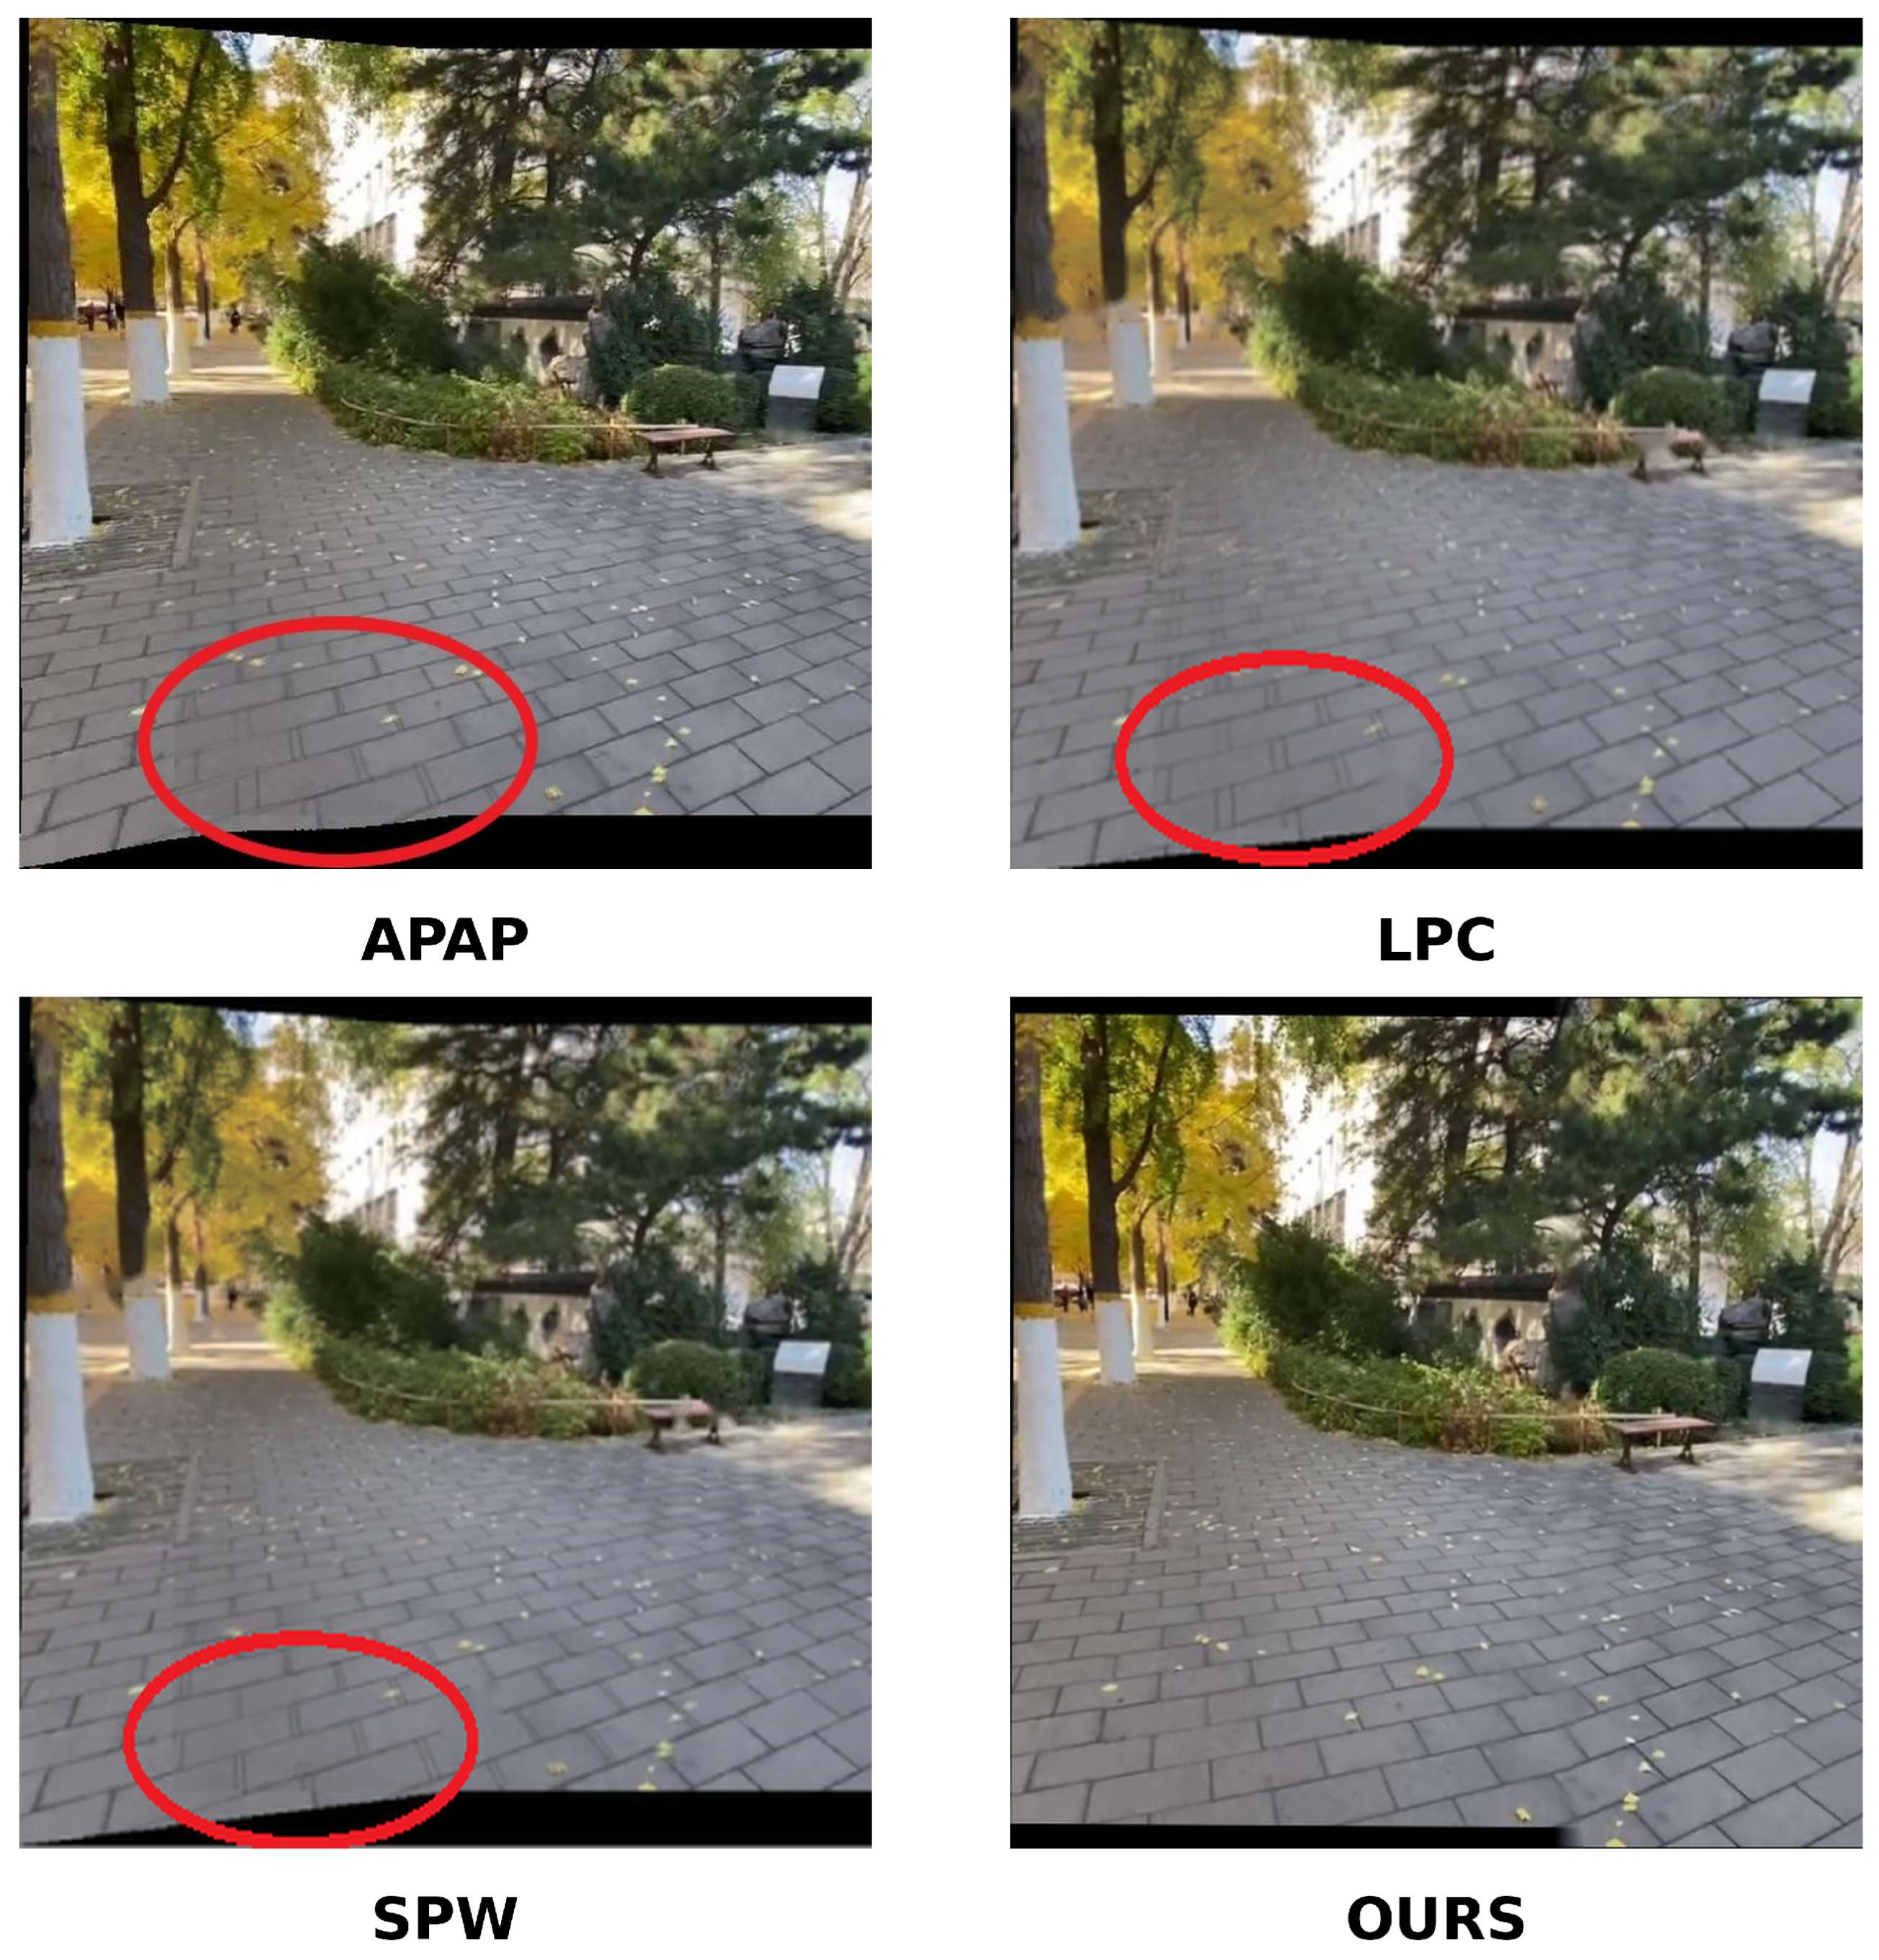
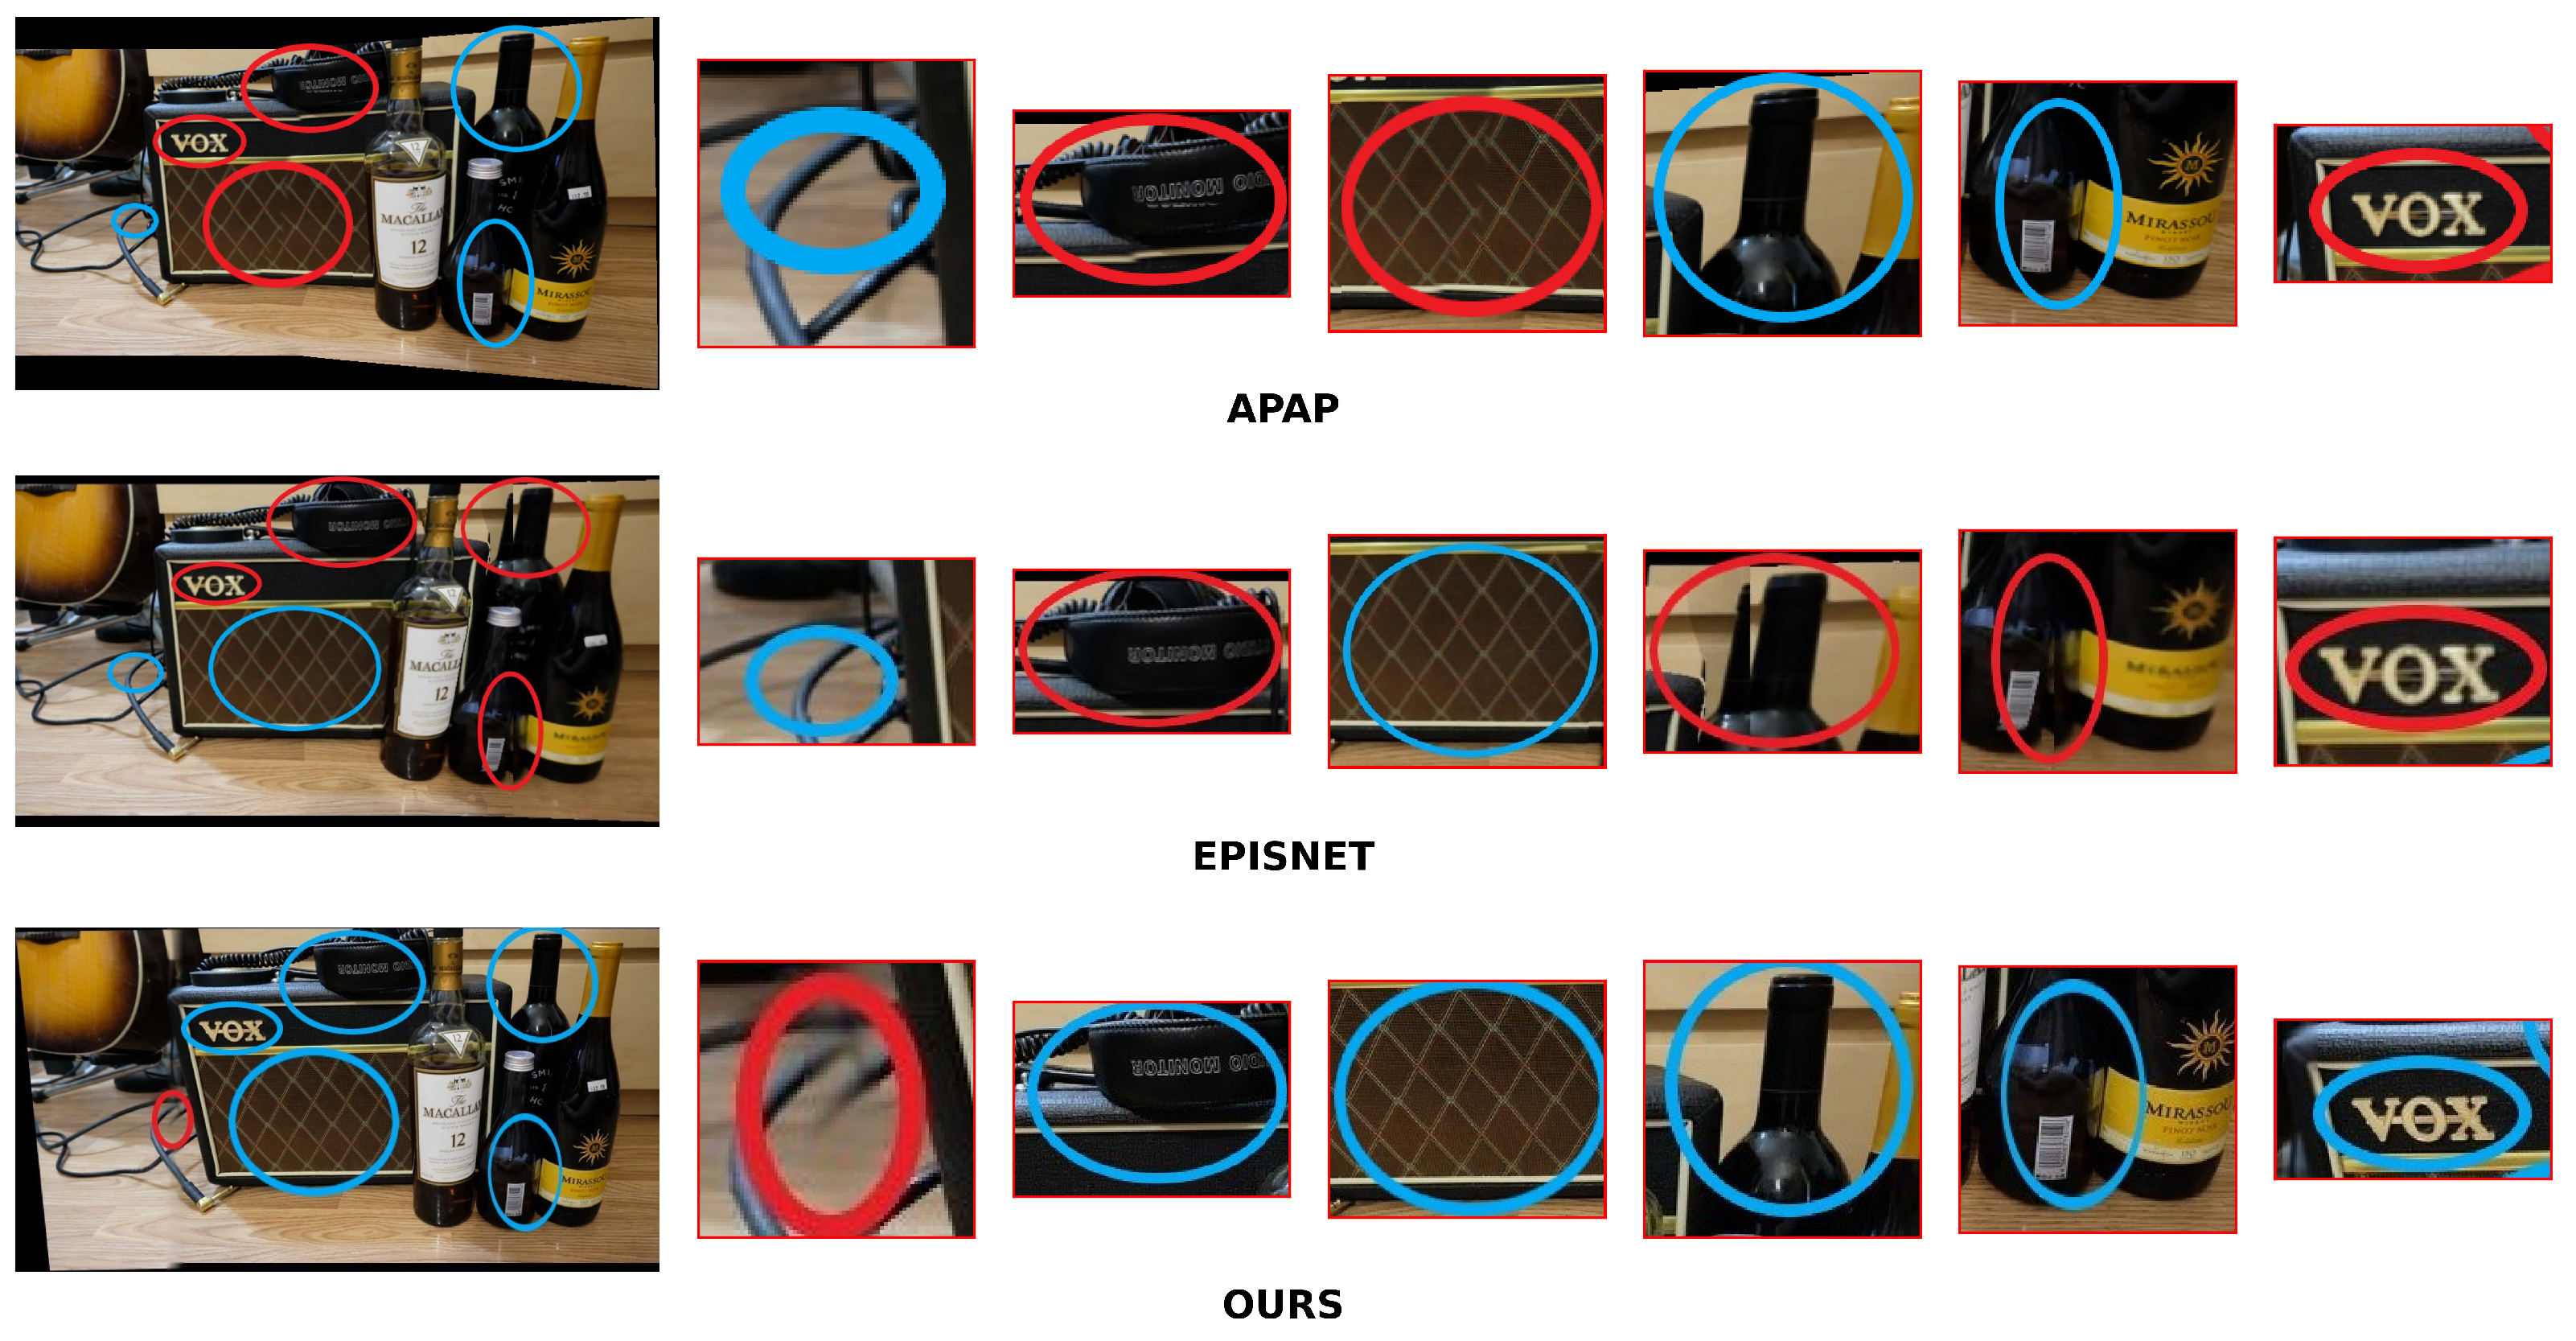
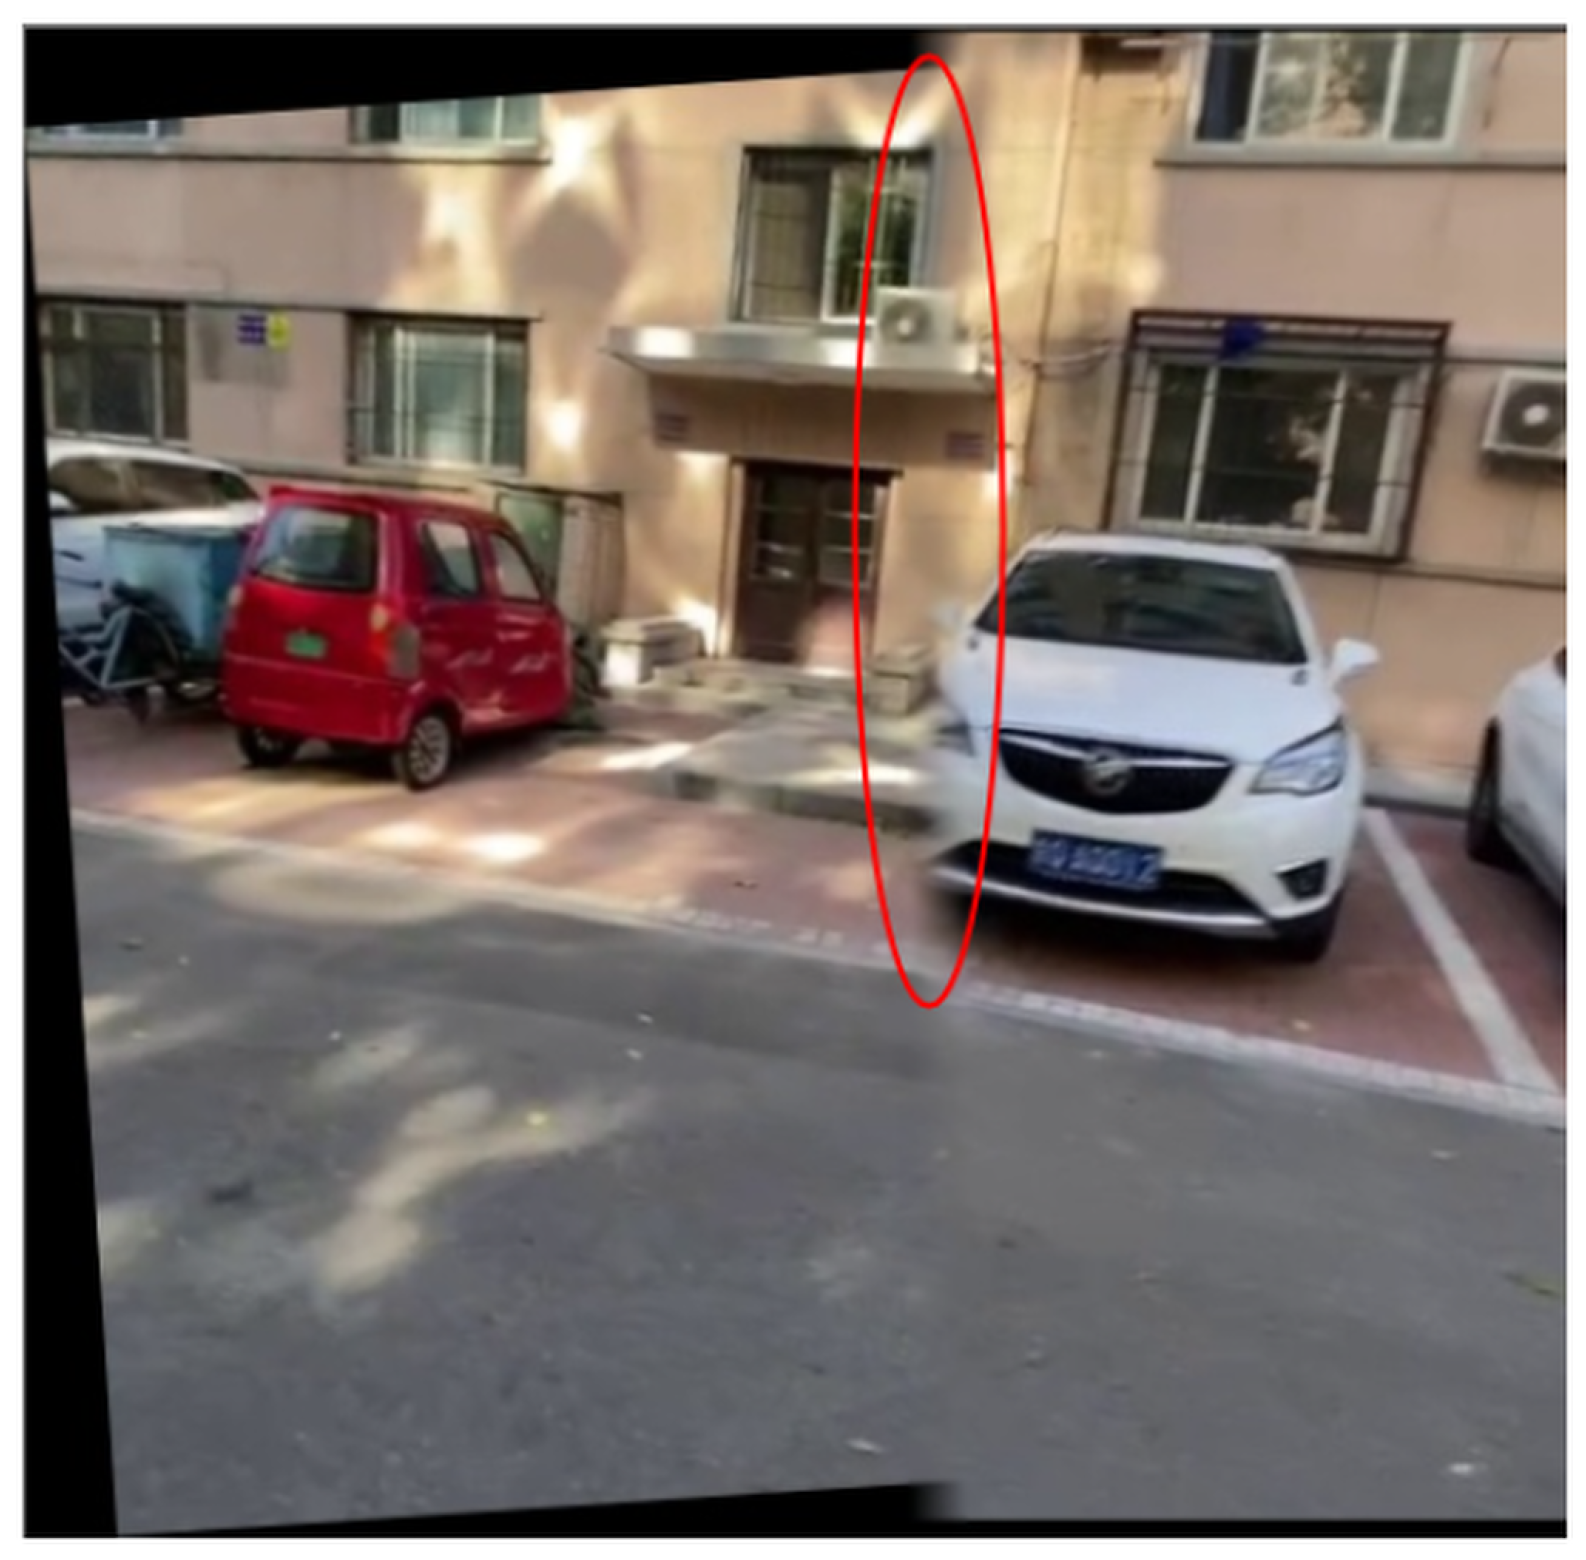
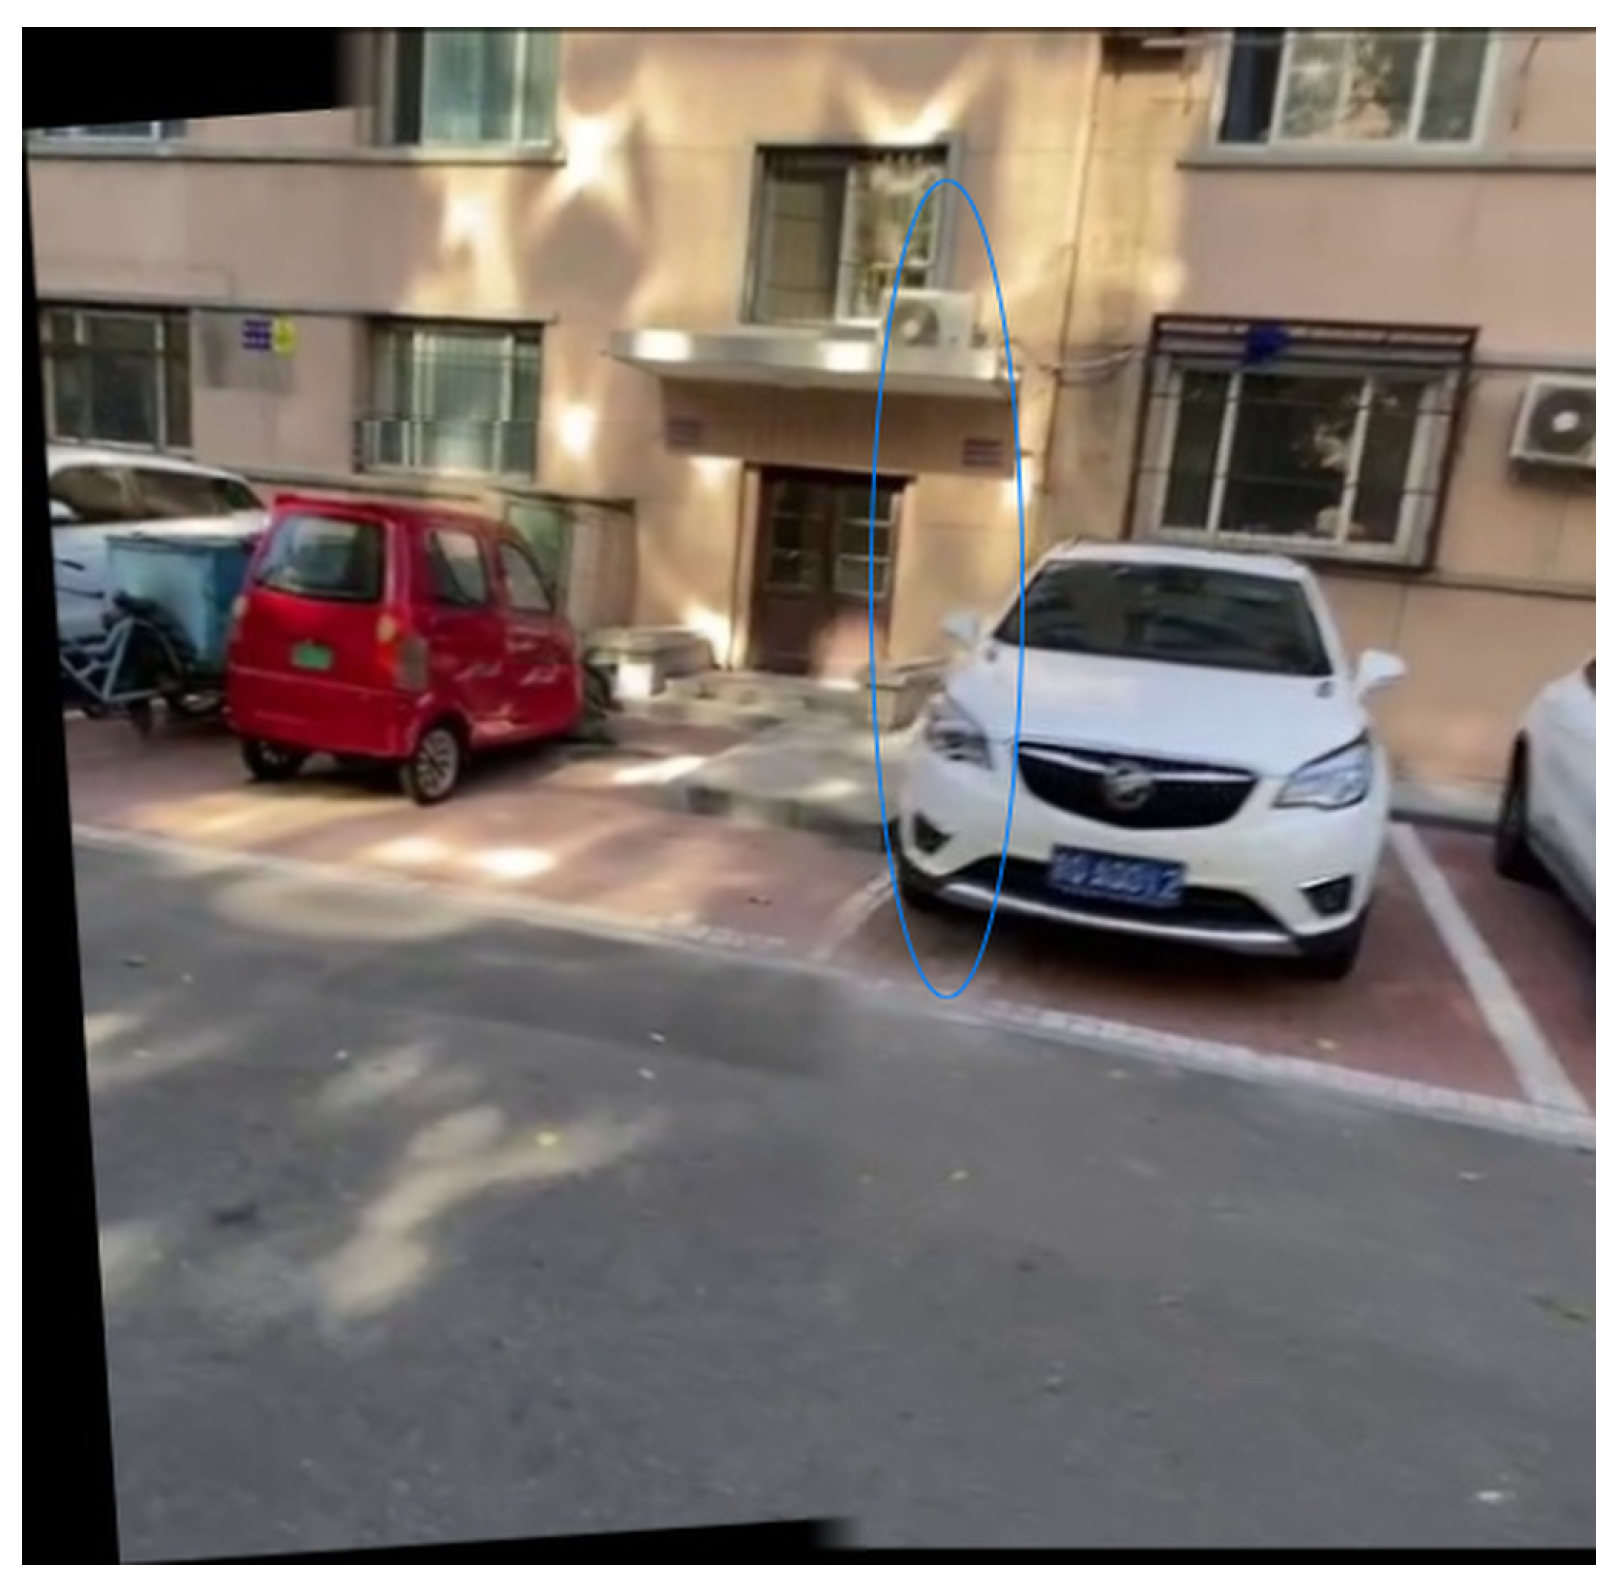
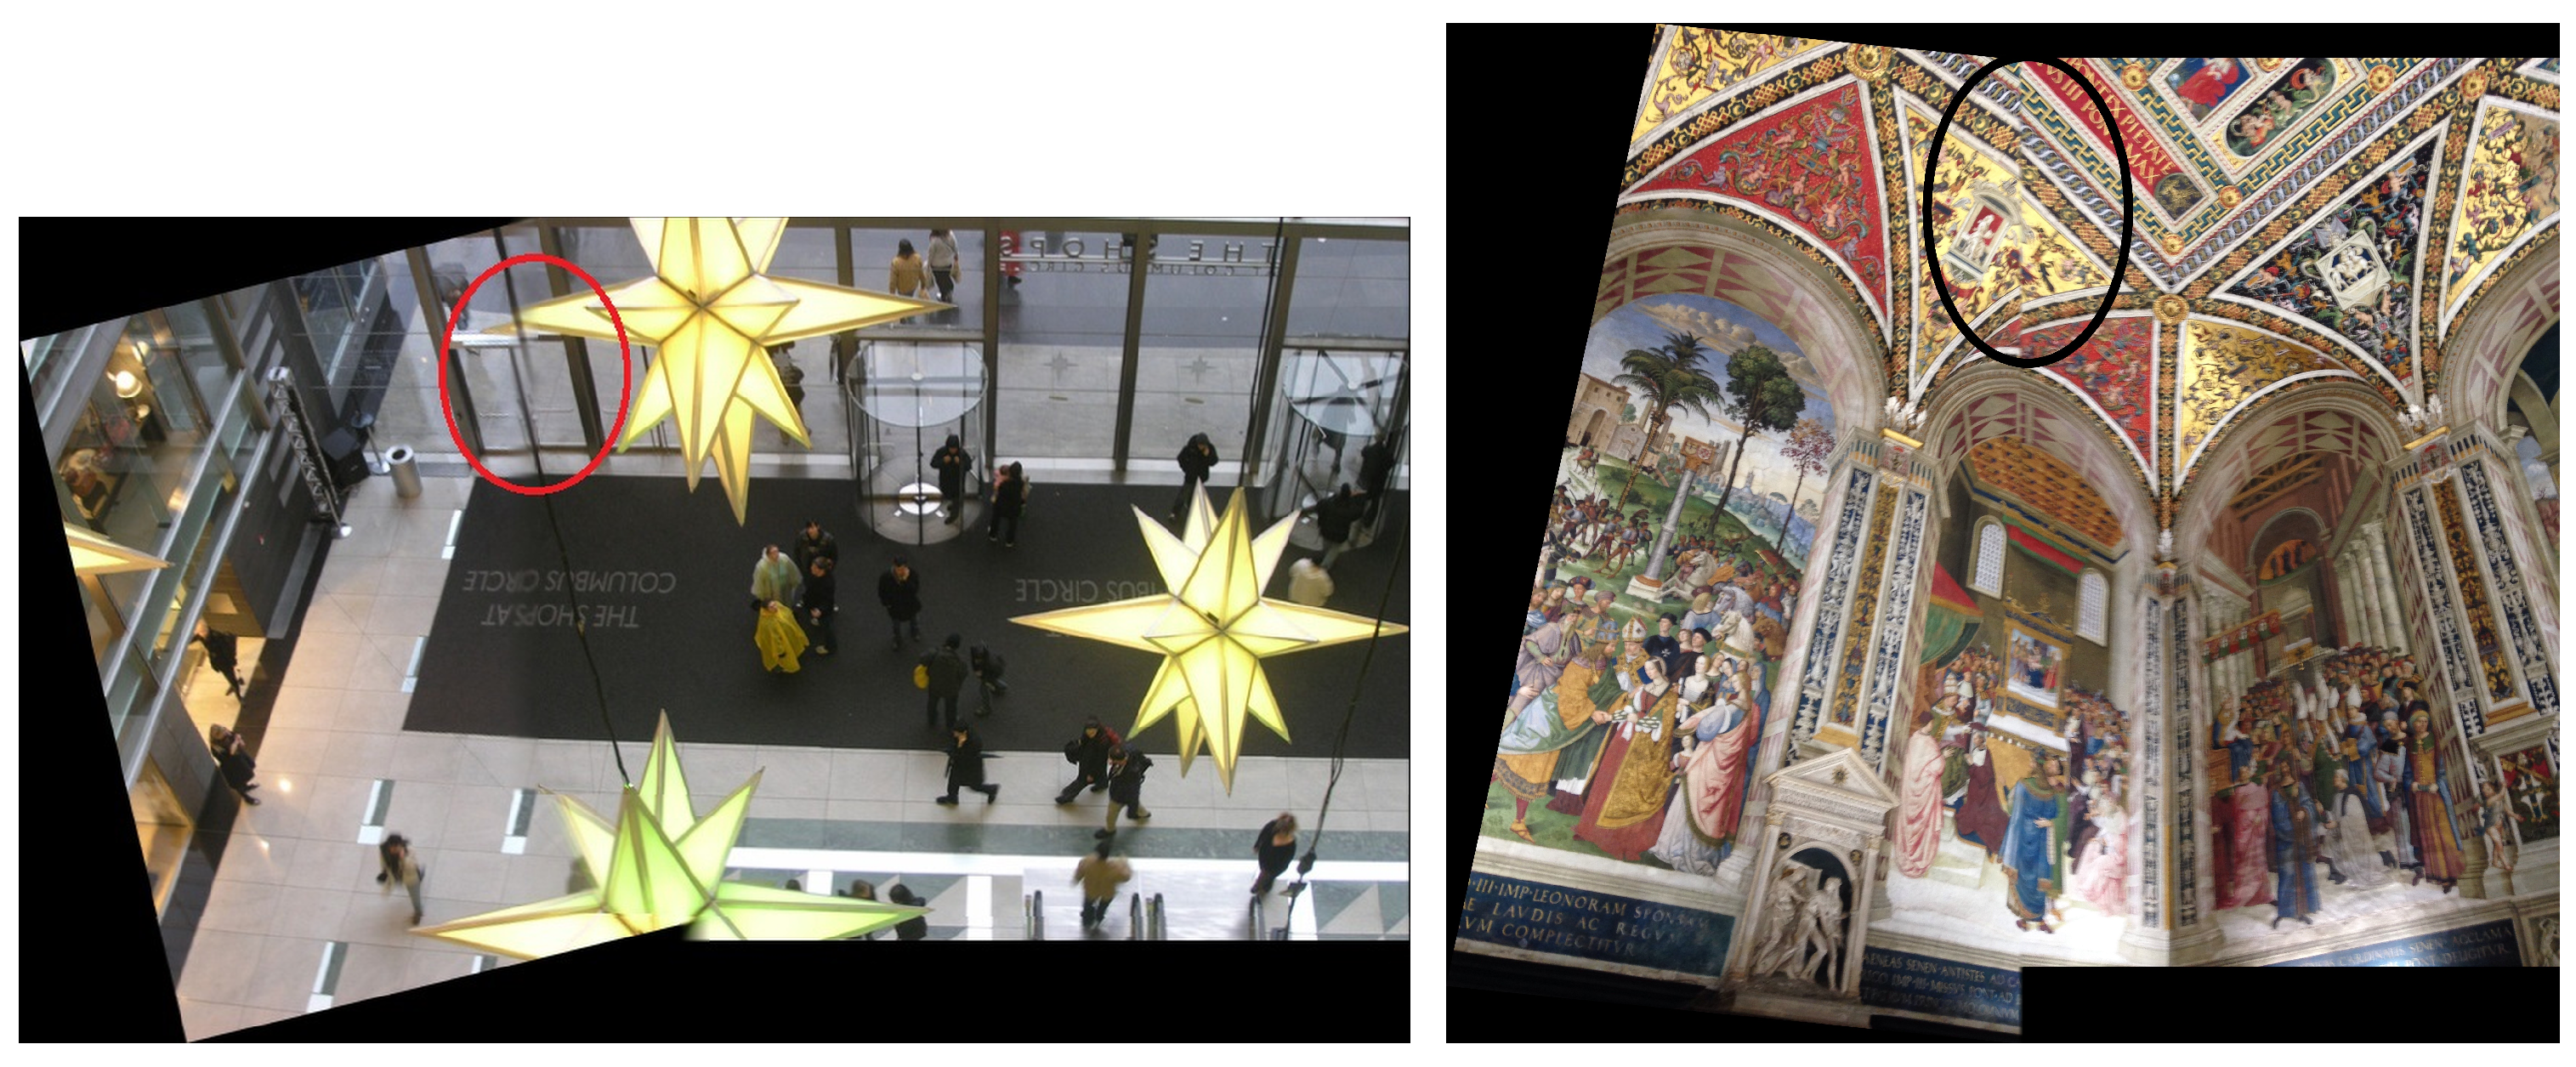
Qualitative results show that state-of-the-art methods often produce noticeable artifacts, including duplication, texture loss, and stretching of image structures, as is clearly perceptible in Figure 7, Figure 8, Figure 9, Figure 10, Figure 11, Figure 12, Figure 13 and Figure 14. In contrast, our method (SENA) generates sharper, higher-resolution stitched images while preserving structural integrity and visual realism.
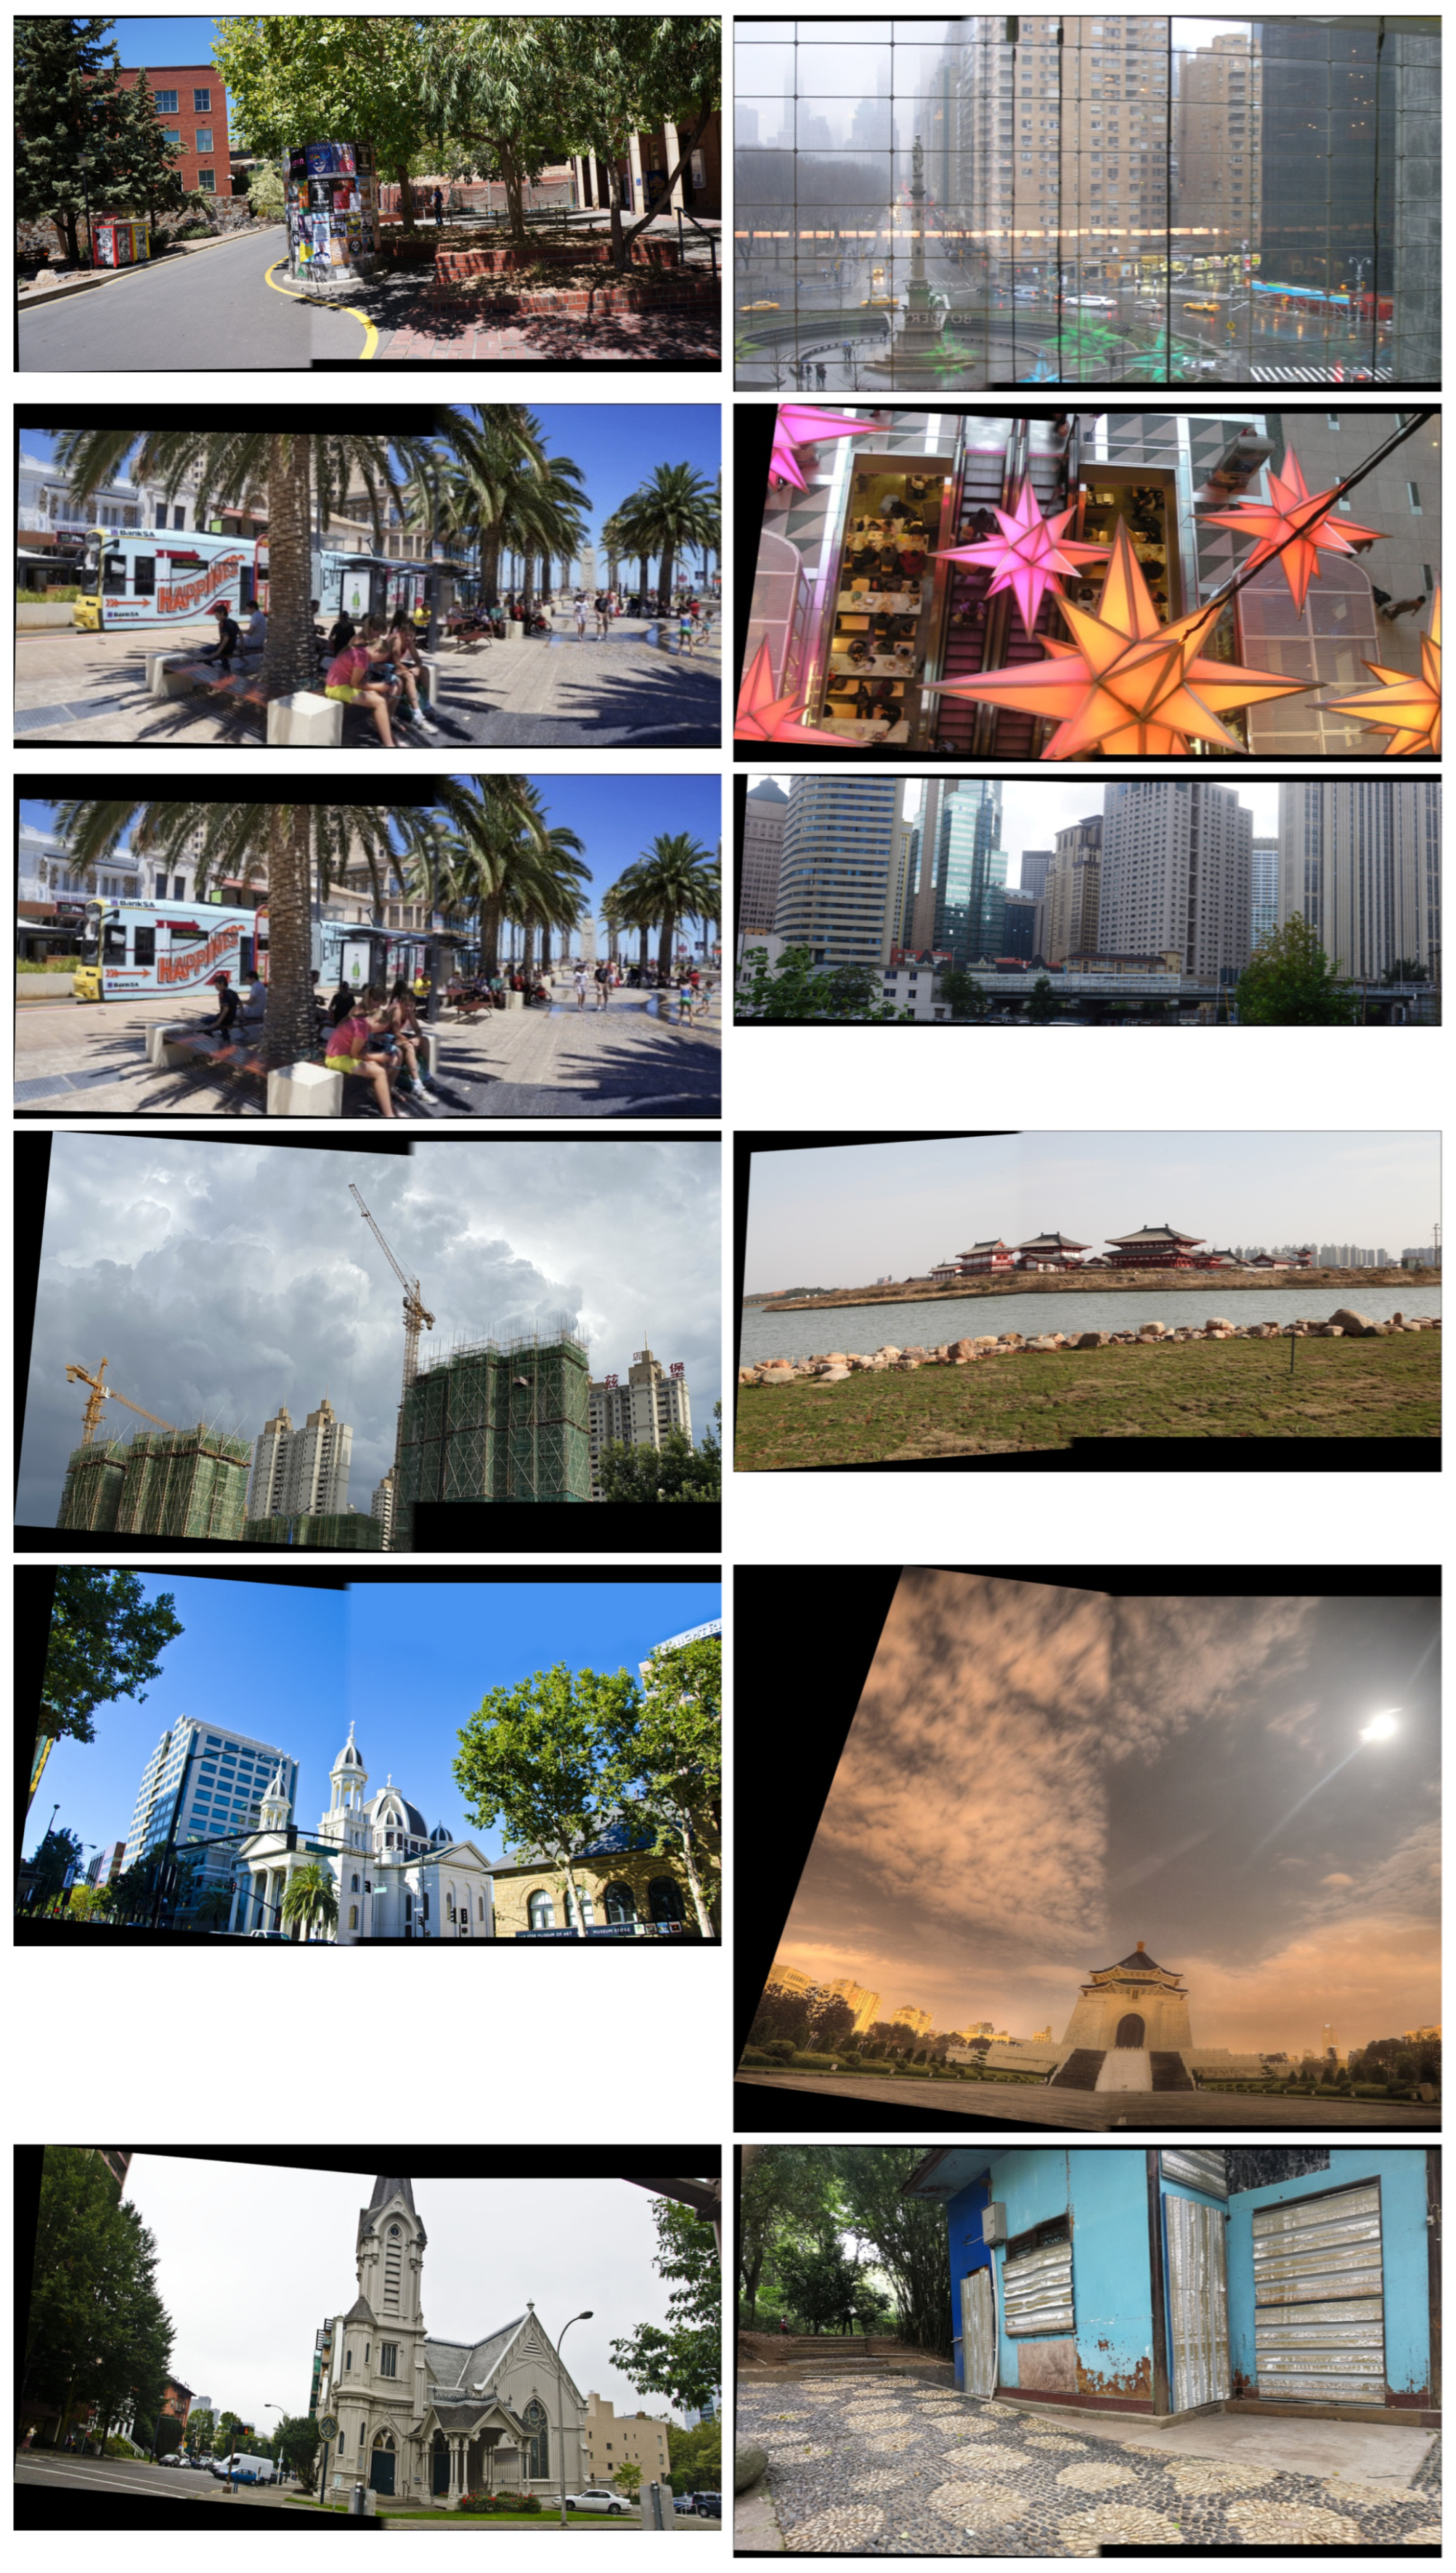
The experiment referenced in Figure 15 shows that our algorithm is able to stitch images even in high resolution.

4.4. Ablation Studies

We perform ablation studies to evaluate both the contribution of individual modules and the robustness of the method to hyperparameter variations.

4.4.1. Component Analysis

We evaluate here the effectiveness of our three main components—the locally adaptive image warping, the adequate parallax-free zone identification, and the segment-based reconstruction—in improving alignment and removing artifacts.
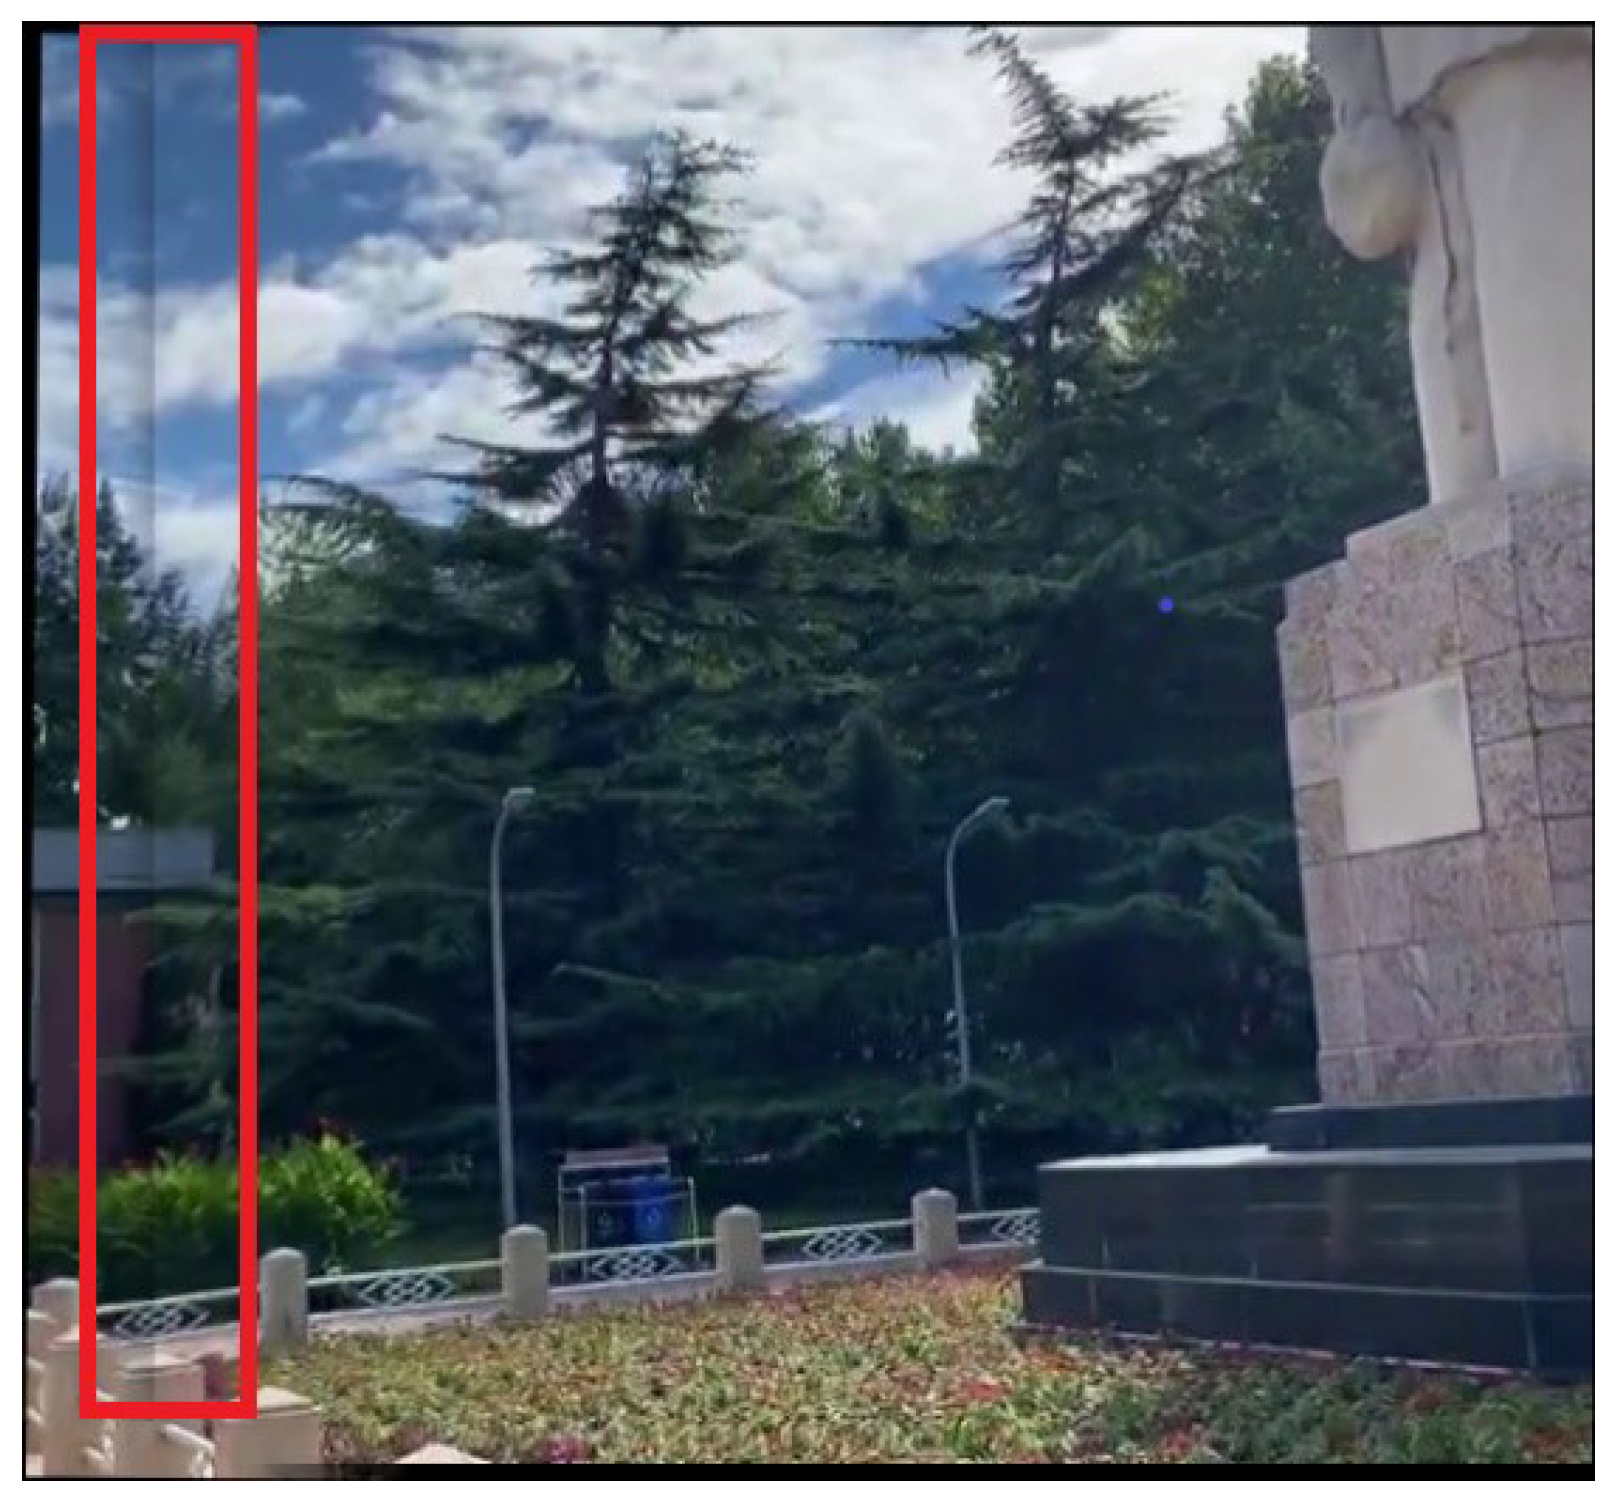
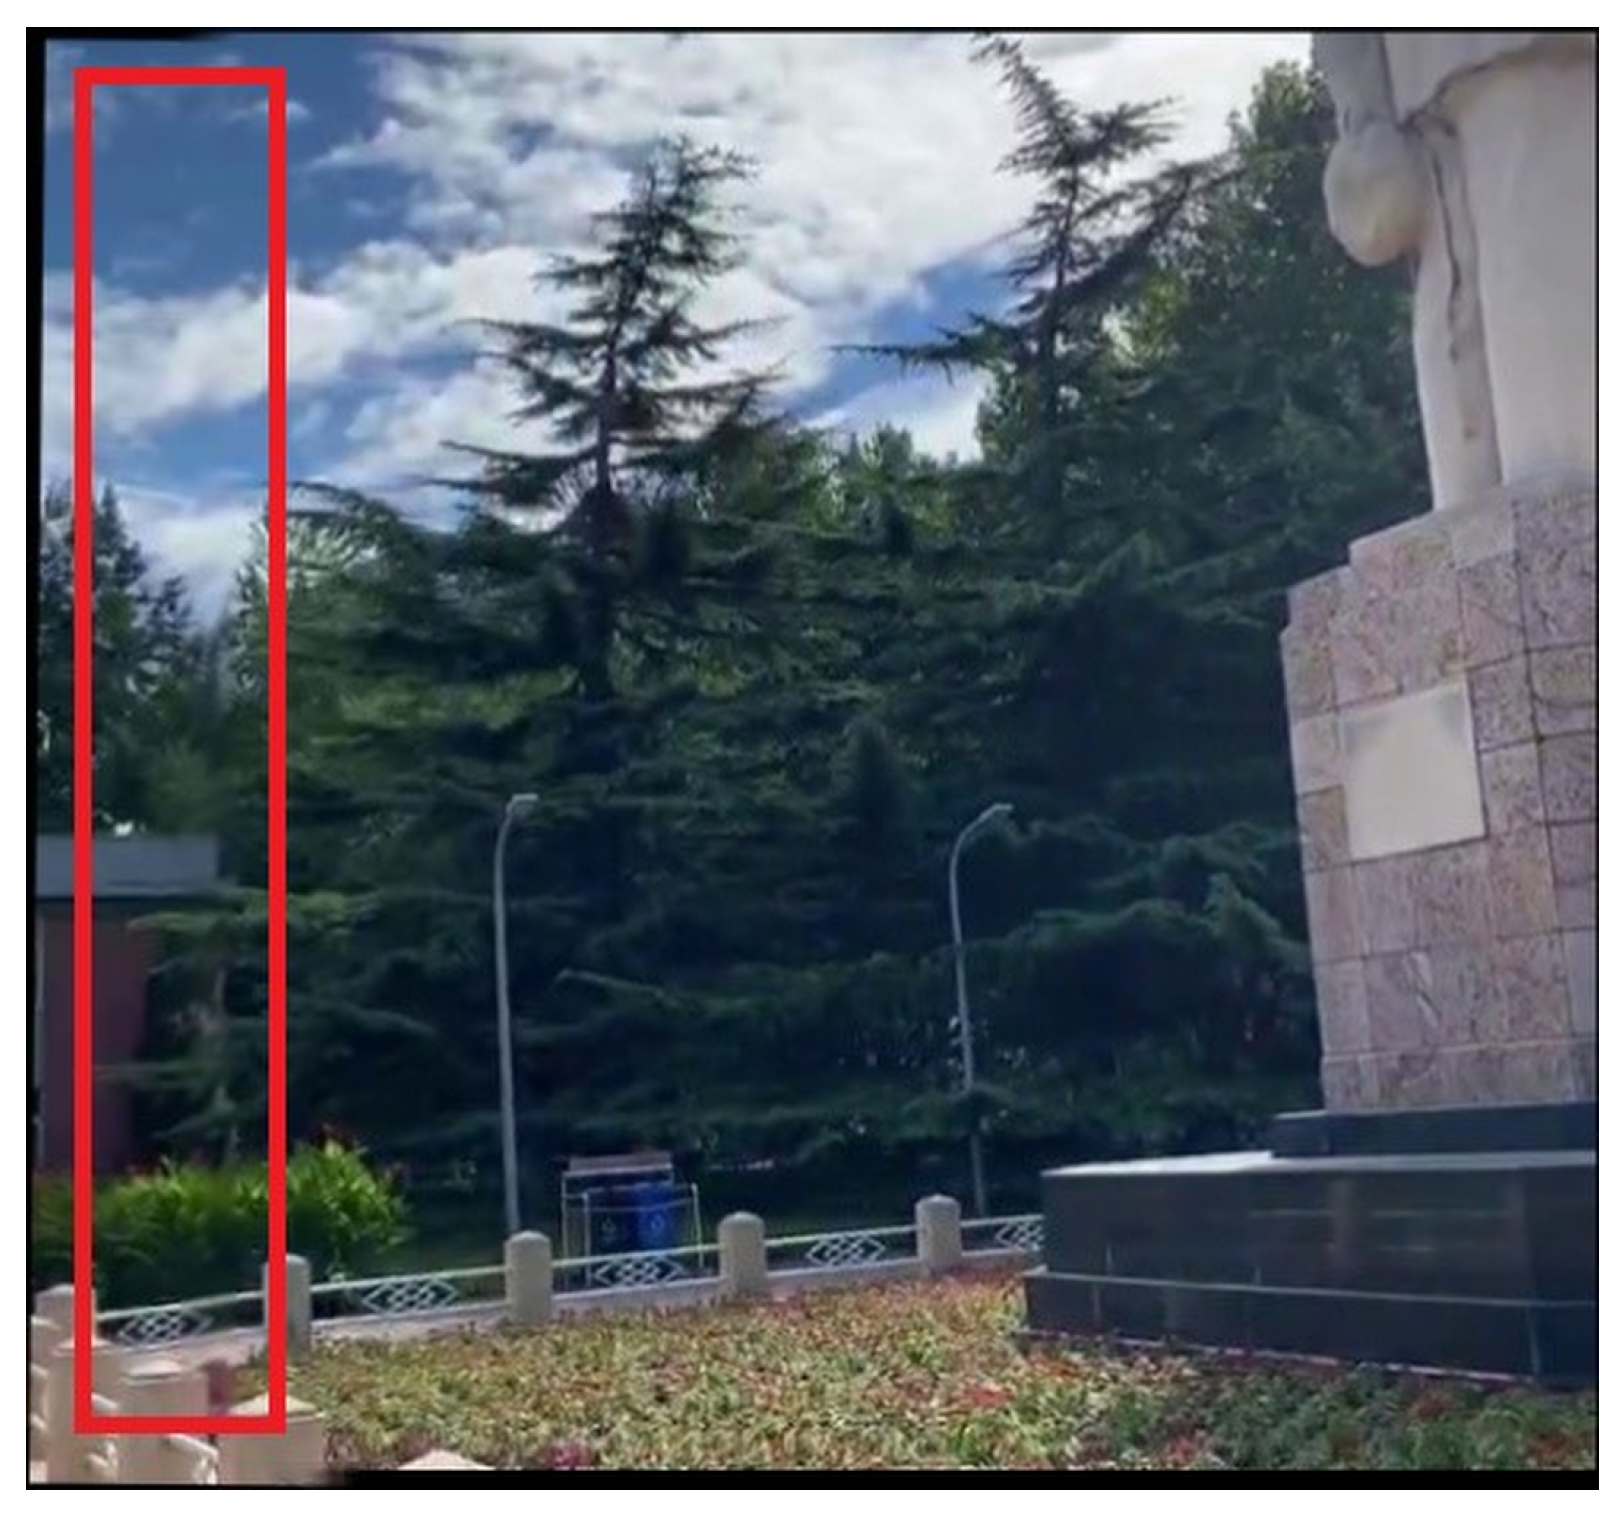
Experimental results demonstrate the critical role of each component in enhancing stitching quality. As illustrated in Figure 16, the absence of locally adaptive warping leads to significant misalignment. In contrast, our warping strategy (Figure 17) corrects misalignments at the segment level, preventing error propagation across the entire image, a key advantage of our localized approach. The selection of a parallax-free zone (Figure 18 and Figure 19) is equally vital, as it ensures the stitching line is positioned in regions with consistent keypoints, thereby minimizing information loss and improving structural coherence. Finally, our segment-based blending technique (Figure 20 and Figure 21), which combines linear alpha blending with light Gaussian smoothing, effectively eliminates residual artifacts such as ghosting and seams, yielding visually seamless results.

4.4.2. Parameter Sensitivity Analysis

Most parameters (e.g., Gaussian smoothing constants, clamping bounds, and stability constants) serve as numerical safeguards and do not materially affect final alignment quality within reasonable ranges; hence, detailed sensitivity plots are omitted for brevity. Empirically, performance is mainly influenced by mesh resolution (grid and lattice). We therefore analyze the sensitivity of the method to these parameters below.
Table 5 shows that PSNR and SSIM remain identical for 1 × 1 and 2 × 2 grids, while a finer 3 × 3 grid slightly degrades performance (−0.39 dB PSNR), likely due to reduced feature support per cell. Varying the deformation lattice ( 32 × 32 to 96 × 96 ) has a negligible impact on accuracy, indicating that it mainly refines smoothness rather than global alignment. We therefore adopt 2 × 2 and 64 × 64 as a balanced and stable configuration.

4.5. Limitations

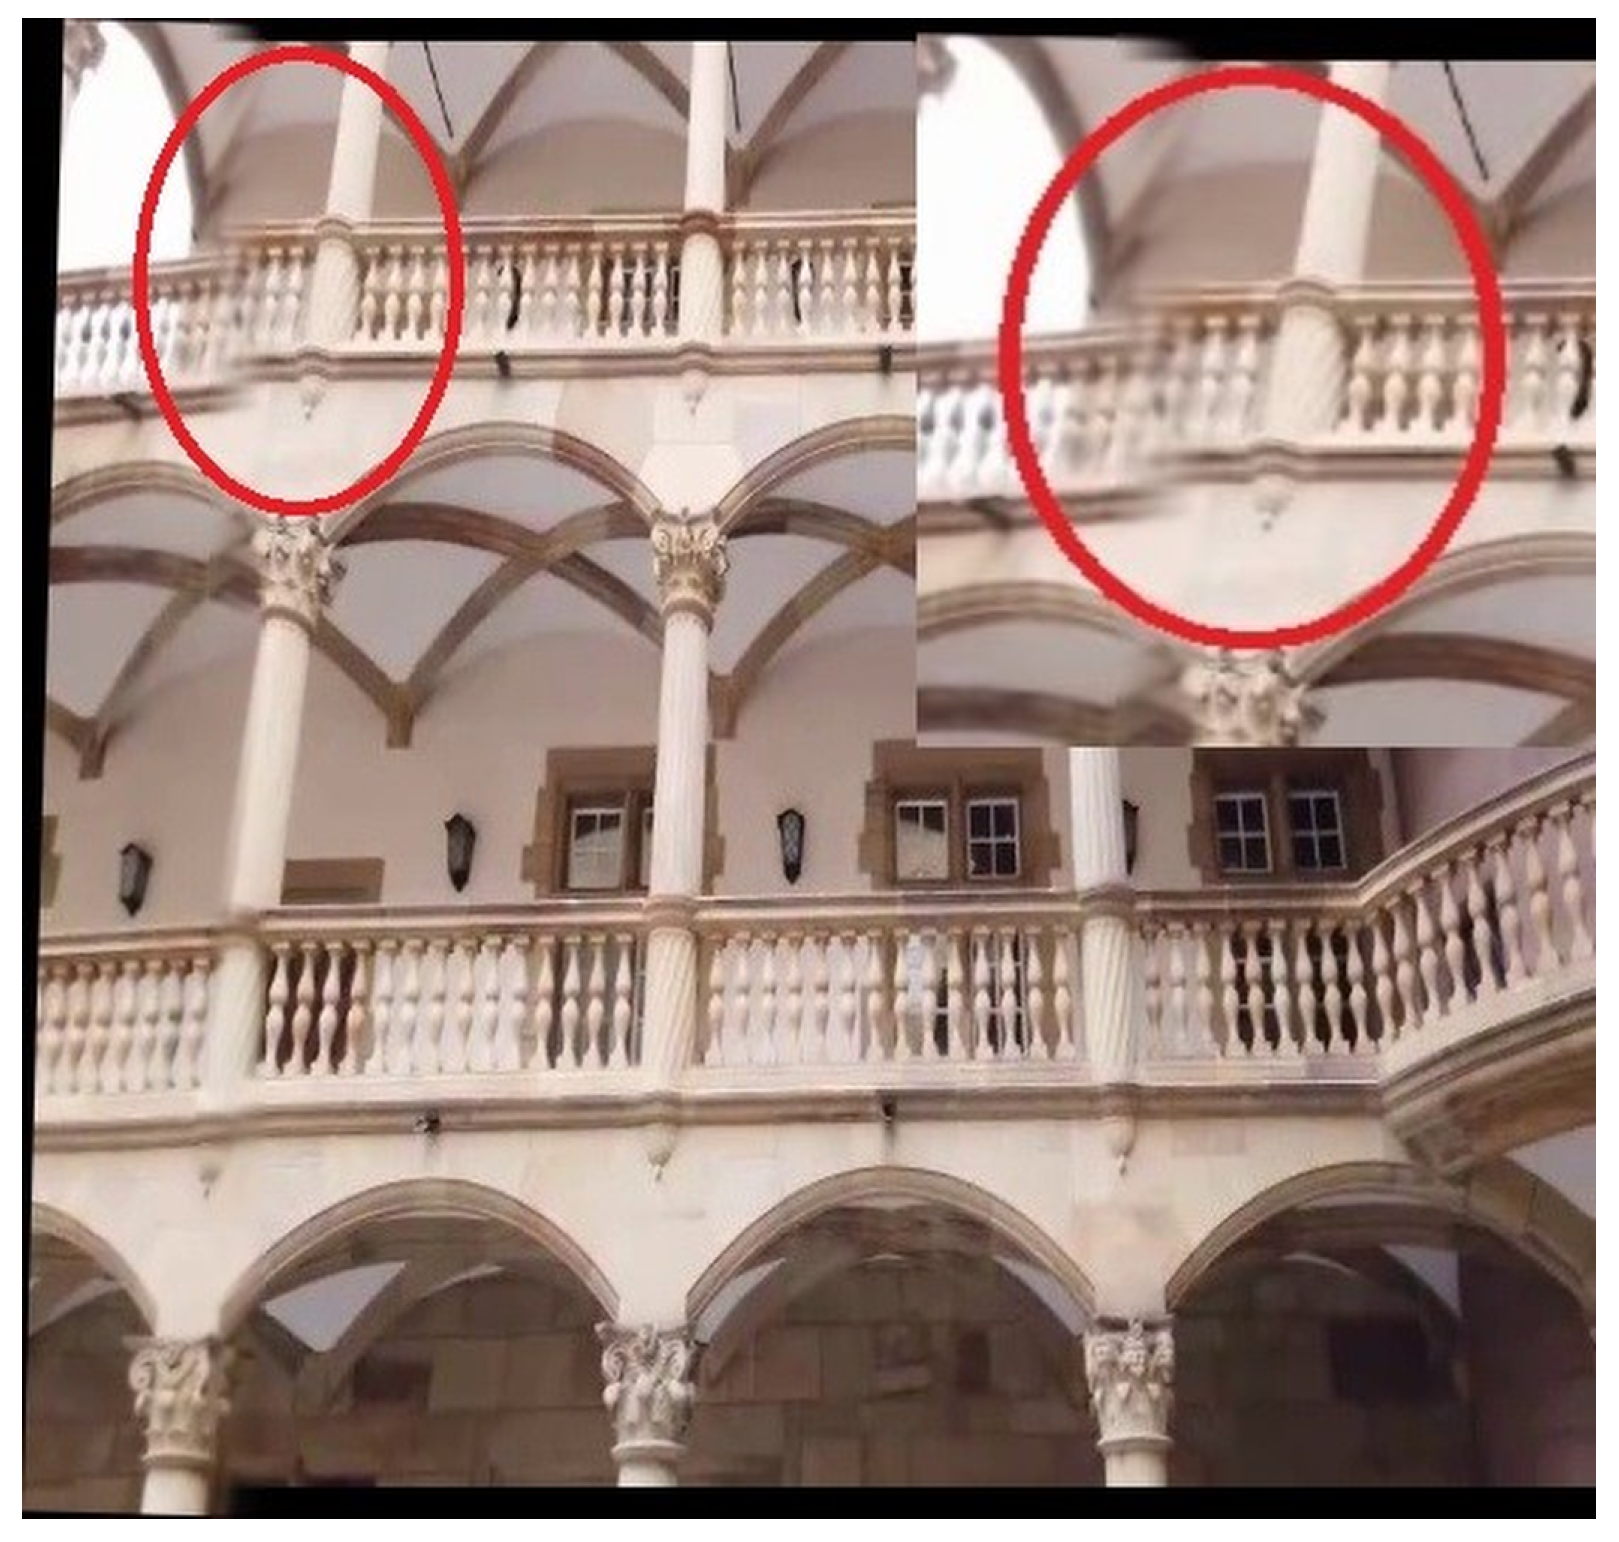
As demonstrated earlier, SENA effectively stitches images while preserving their natural appearance and geometric structure. However, certain limitations remain. The alignment between images is achieved through a multi-stage local deformation process: a global affine transformation estimated via RANSAC provides coarse alignment, which is then refined within the overlap region using locally adaptive affine models interpolated into a smooth free-form deformation (FFD) field. This design allows accurate alignment while mitigating excessive distortion and maintaining shape and texture consistency. Nevertheless, in scenes with complex depth variations, the estimation of local models may become unstable, leading to locally inconsistent deformations or slight geometric discontinuities. Furthermore, the quality of the detected keypoints directly influences the identification of the adequate parallax-minimized zone and the subsequent stitching line extraction. When feature detection or matching is unreliable, artifacts such as minor ghosting, blurring, or local misalignment may still appear in the final panorama, as shown in Figure 22.

5. Conclusions

This work introduced SENA, a structure-preserving image stitching framework that addresses the geometric limitations of homography-based and over-flexible warps through hierarchical affine deformation and free-form local refinement. A geometry-driven stitching mechanism ensures one-to-one correspondence across overlapping regions, reducing ghosting, duplication, and texture stretching. Quantitative results confirm its effectiveness: SENA achieves higher PSNR and SSIM and the lowest BRISQUE scores among compared competitive methods, and reduces runtime by 79% on average. These findings demonstrate improved structural fidelity, visual realism, and computational efficiency. While robust across diverse scenes, performance may slightly degrade under extreme viewpoints or severely texture-deprived areas, motivating future work on adaptive deformation and hybrid-learning-based components.

Author Contributions

Conceptualization, G.L.N.T. and D.B.M.F.; methodology, G.L.N.T. and D.B.M.F.; software, G.L.N.T. and D.B.M.F.; validation, G.L.N.T., D.B.M.F., A.H. and C.B.; formal analysis, G.L.N.T., D.B.M.F. and A.H.; investigation, G.L.N.T. and D.B.M.F.; resources, C.B.; writing—original draft preparation, G.L.N.T. and D.B.M.F.; writing—review and editing, G.L.N.T., D.B.M.F., A.H. and C.B.; visualization, G.L.N.T. and A.H.; supervision, C.B.; project administration, C.B. All authors have read and agreed to the published version of the manuscript.

Funding

This research received no external funding.

Institutional Review Board Statement

Not applicable.

Informed Consent Statement

Not applicable.

Data Availability Statement

The data presented in this study are available in Google Drive at https://drive.google.com/drive/folders/1CUV0PjbWwC7lh_VVOazLt5XnPYELgjfc?usp=drive_link (accessed on 20 October 2025). These data were derived from the following resources available in the public domain: https://github.com/nie-lang/UnsupervisedDeepImageStitching (accessed on 16 June 2025), https://drive.google.com/file/d/1OIDwCcmVlSMqrLmwPBA8G2A5G4NgcQMF/view (accessed on 18 July 2025) and https://github.com/flowerDuo/GES-GSP-Stitching/tree/master/Dataset (accessed on 3 August 2025).

Conflicts of Interest

The authors declare no conflicts of interest.

References

  1. Nghonda, E. Enable 360-Degree Immersion for Outside-In Camera Systems for Live Events. Ph.D. Thesis, University of Florida, Gainesville, FL, USA, 2023. [Google Scholar]
  2. Bay, H.; Tuytelaars, T.; Van Gool, L. SURF: Speeded up robust features. In Computer Vision–ECCV 2006; Springer: Graz, Austria, 2006; pp. 404–417. [Google Scholar]
  3. Lowe, D.G. Distinctive image features from scale-invariant keypoints. Int. J. Comput. Vis. 2004, 60, 91–110. [Google Scholar] [CrossRef] [Scilit]
  4. Juan, L.; Gwun, O. A comparison of SIFT, PCA-SIFT and SURF. Int. J. Image Process. 2009, 3, 143–152. [Google Scholar]
  5. Sikka, P.; Asati, A.R.; Shekhar, C. Real time FPGA implementation of a high speed and area optimized Harris corner detection algorithm. Microprocess. Microsyst. 2021, 80, 103514. [Google Scholar] [CrossRef] [Scilit]
  6. Ji, X.; Yang, H.; Han, C. Research on image stitching method based on improved ORB and stitching line calculation. J. Electron. Imaging 2022, 31, 051404. [Google Scholar] [CrossRef] [Scilit]
  7. Liu, W.; Zhang, K.; Zhang, Y.; He, J.; Sun, B. Utilization of merge-sorting method to improve stitching efficiency in multi-scene image stitching. Appl. Sci. 2023, 13, 2791. [Google Scholar] [CrossRef] [Scilit]
  8. Potje, G.; Cadar, F.; Araujo, A.; Martins, R.; Nascimento, E.R. XFeat: Accelerated features for lightweight image matching. In Proceedings of the IEEE/CVF Conference on Computer Vision and Pattern Recognition (CVPR), Seattle, WA, USA, 16–22 June 2024; pp. 2682–2691. [Google Scholar]
  9. Wen, S.; Wang, X.; Zhang, W.; Wang, G.; Huang, M.; Yu, B. Structure preservation and seam optimization for parallax-tolerant image stitching. IEEE Access 2022, 10, 78713–78725. [Google Scholar] [CrossRef] [Scilit]
  10. Nie, L.; Lin, C.; Liao, K.; Liu, S.; Zhao, Y. Parallax-tolerant unsupervised deep image stitching. In Proceedings of the IEEE/CVF International Conference on Computer Vision (ICCV), Paris, France, 4–6 October 2023; pp. 7399–7408. [Google Scholar]
  11. Chen, K.; Garg, A.; Wang, Y.-S. Seamless-through-breaking: Rethinking image stitching for optimal alignment. In Proceedings of the Asian Conference on Computer Vision (ACCV), Hanoi, Vietnam, 8–12 December 2024; pp. 4352–4367. [Google Scholar]
  12. Li, X.; He, L.; He, X. Combined regional homography-affine warp for image stitching. In Proceedings of the International Conference on Graphics and Image Processing (ICGIP), Nanjing, China, 21–23 October 2022; SPIE: Philadelphia, PA, USA, 2022; Volume 12705, pp. 258–264. [Google Scholar]
  13. Huang, H.; Chen, F.; Cheng, H.; Li, L.; Wang, M. Semantic segmentation guided feature point classification and seam fusion for image stitching. J. Algorithms Comput. Technol. 2021, 15, 17483026211065399. [Google Scholar] [CrossRef] [Scilit]
  14. Qin, Y.; Li, J.; Jiang, P.; Jiang, F. Image stitching by feature positioning and seam elimination. Multimed. Tools Appl. 2021, 80, 20869–20881. [Google Scholar] [CrossRef] [Scilit]
  15. Chai, X.; Chen, J.; Mao, Z.; Zhu, Q. An upscaling–downscaling optimal seamline detection algorithm for very large remote sensing image mosaicking. Remote Sens. 2022, 15, 89. [Google Scholar] [CrossRef] [Scilit]
  16. Garg, A.; Dung, L.-R. Stitching strip determination for optimal seamline search. In Proceedings of the International Conference on Imaging, Signal Processing and Communications (ICISPC), Virtual, 23–25 October 2020; pp. 29–33. [Google Scholar]
  17. Yadav, S.; Choudhary, P.; Goel, S.; Parameswaran, S.; Bajpai, P.; Kim, J. Selfie Stitch: Dual homography based image stitching for wide-angle selfie. In Proceedings of the IEEE International Conference on Multimedia & Expo Workshops (ICMEW), San Diego, CA, USA, 23–27 July 2018; pp. 1–4. [Google Scholar]
  18. Jia, Q.; Li, Z.; Fan, X.; Zhao, H.; Teng, S.; Ye, X.; Latecki, L.J. Leveraging line-point consistence to preserve structures for wide parallax image stitching. In Proceedings of the IEEE/CVF Conference on Computer Vision and Pattern Recognition (CVPR), Nashville, TN, USA, 20–25 June 2021; pp. 12186–12195. [Google Scholar]
  19. Zheng, J.; Wang, Y.; Wang, H.; Li, B.; Hu, H.-M. A novel projective-consistent plane based image stitching method. IEEE Trans. Multimed. 2019, 21, 2561–2575. [Google Scholar] [CrossRef] [Scilit]
  20. Zaragoza, J.; Chin, T.-J.; Brown, M.S.; Suter, D. As-projective-as-possible image stitching with moving DLT. In Proceedings of the IEEE Conference on Computer Vision and Pattern Recognition (CVPR), Portland, OR, USA, 23–28 June 2013; pp. 2339–2346. [Google Scholar]
  21. Li, J.; Wang, Z.; Lai, S.; Zhai, Y.; Zhang, M. Parallax-tolerant image stitching based on robust elastic warping. IEEE Trans. Multimed. 2017, 20, 1672–1687. [Google Scholar] [CrossRef] [Scilit]
  22. Nie, L.; Lin, C.; Liao, K.; Liu, S.; Zhao, Y. Unsupervised deep image stitching: Reconstructing stitched features to images. IEEE Trans. Image Process. 2021, 30, 6184–6197. [Google Scholar] [CrossRef] [Scilit] [PubMed]
  23. Cai, W.; Yang, W. Object-level geometric structure preserving for natural image stitching. In Proceedings of the AAAI Conference on Artificial Intelligence (AAAI), Philadelphia, PA, USA, 25 February–4 March 2025; Volume 39, pp. 1926–1934. [Google Scholar]
  24. Du, P.; Ning, J.; Cui, J.; Huang, S.; Wang, X.; Wang, J. Geometric structure preserving warp for natural image stitching. In Proceedings of the IEEE/CVF Conference on Computer Vision and Pattern Recognition (CVPR), New Orleans, LA, USA, 18–24 June 2022; pp. 3688–3696. [Google Scholar]
  25. Herrmann, C.; Wang, C.; Bowen, R.S.; Keyder, E.; Zabih, R. Object-centered image stitching. In Proceedings of the European Conference on Computer Vision (ECCV), Munich, Germany, 8–14 September 2018; pp. 821–835. [Google Scholar]
  26. Chen, Y.-S.; Chuang, Y.-Y. Natural image stitching with the global similarity prior. Eur. Conf. Comput. Vis. 2016, 9909, 186–201. [Google Scholar]
  27. Fischler, M.A.; Bolles, R.C. Random sample consensus: A paradigm for model fitting with applications to image analysis and automated cartography. Commun. ACM 1981, 24, 381–395. [Google Scholar] [CrossRef] [Scilit]
  28. Liao, T.; Li, N. Single-perspective warps in natural image stitching. IEEE Trans. Image Process. 2019, 29, 724–735. [Google Scholar] [CrossRef] [Scilit] [PubMed]
  29. Nie, L.; Lin, C.; Liao, K.; Liu, M.; Zhao, Y. A view-free image stitching network based on global homography. J. Vis. Commun. Image Represent. 2020, 73, 102950. [Google Scholar] [CrossRef] [Scilit]
  30. Nie, L.; Lin, C.; Liao, K.; Zhao, Y. Learning edge-preserved image stitching from multi-scale deep homography. Neurocomputing 2022, 491, 533–543. [Google Scholar] [CrossRef] [Scilit]
  31. Feng, C.-B.; Zhang, J.; Li, J.; Zhou, Y. Seam mask guided partial reconstruction with quantum-inspired local aggregation for deep image stitching. In Proceedings of the IEEE International Conference on Acoustics, Speech and Signal Processing (ICASSP), Seoul, Republic of Korea, 14–19 April 2024; IEEE: Piscataway, NJ, USA, 2024; pp. 2430–2434. [Google Scholar]
  32. Jia, Q.; Feng, X.; Liu, Y.; Fan, X.; Latecki, L.J. Learning pixel-wise alignment for unsupervised image stitching. In Proceedings of the ACM International Conference on Multimedia, Ottawa, ON, Canada, 29 October–3 November 2023; pp. 1392–1400. [Google Scholar]
Figure 1. Structural degradation of existing stitching approaches under parallax conditions. Highlighted regions illustrate representative artifacts produced by different methods. Red circles indicate areas where geometric distortions or stitching artifacts occur (e.g., misalignment, ghosting, or structural deformation). Blue circles denote regions where certain methods preserve structural consistency without visible artifacts. In some cases, yellow arrows are used to explicitly point to the precise location of the artifact within the highlighted region.
Technologies 14 00186 g001
Figure 2. Optimal stitching line. The letters A , B , denote ordered anchor keypoints in the source image, while A , B , denote their corresponding anchor keypoints in the target image. The line connecting these anchors defines the stitching path in each image.
Technologies 14 00186 g002
Figure 3. Complementary segments with consistent right-to-left ordering. A and B denote two consecutive anchor points in the source image, while A and B denote their corresponding anchor points in the target image. Matching colors indicate corresponding segments and help visualize which image regions are preserved in the final reconstruction.
Technologies 14 00186 g003
Figure 4. Complementary segments with consistent left-to-right ordering. The same notation and color coding as in Figure 3 are used.
Technologies 14 00186 g004
Figure 5. Invalid segment configuration. The same notation is used as in Figure 3, but the opposite horizontal ordering indicates a non-complementary segment, which is therefore rejected.
Technologies 14 00186 g005
Figure 6. Flowchart of the proposed approach. The arrows indicate the processing flow between successive stages. Green lines denote the boundaries of the detected parallax-minimized zone Z pfz . Rectangular blocks represent the main processing modules, and the symbols W aff , P, and C v , h denote the affine-guided warping, partitioning, and reconstruction operators, respectively.
Technologies 14 00186 g006
Figure 7. APAP Red circles indicate regions where stitching artifacts such as ghosting, texture loss, or structural distortion appear in competing methods. APAP [20], ELA [21], and UDIS++ [10] exhibit pronounced ghosting artifacts, UDIS [22] exhibits misalignment, and SEAMLESS [11] produces noticeable blurring. In contrast, our method preserves sharp textures and eliminates duplication artifacts.
Technologies 14 00186 g007
Figure 8. The red circles highlight ghosting artifacts in APAP, ELA, UDIS, and UDIS++, and misalignment in SEAMLESS. Our approach eliminates these defects, preserving structural integrity.
Technologies 14 00186 g008
Figure 9. Ghosting and blurring artifacts observed in state-of-the-art methods within the regions highlighted by red circles. Our approach produces seamless and visually consistent stitching results.
Technologies 14 00186 g009
Figure 10. Similar artifacts within the red-circled zones are consistent with those shown in Figure 8, affecting state-of-the-art methods.
Technologies 14 00186 g010
Figure 11. Similar Artifacts within the red-circled zones are consistent with those shown in Figure 8, affecting state-of-the-art methods.
Technologies 14 00186 g011
Figure 12. Similar artifacts within the red-circled zones are consistent with those shown in Figure 8, affecting state-of-the-art methods.
Technologies 14 00186 g012
Figure 13. Misalignments (visible in floor tiles within the red-circled zones) appear in APAP, LPC, and SPW, whereas SENA achieves correct alignment.
Technologies 14 00186 g013
Figure 14. UDIS++ [10] and SEAMLESS [11] present illegible text due to blurred textures and misalignments. Within the red circles, artifact zones are highlighted; the blue zone indicates the expected appearance. In SENA, the text remains clear, as in the input images, with only a single slight misalignment observed.
Technologies 14 00186 g014
Figure 15. Qualitative results on 13 diverse scenes of varying resolution, from the lowest (640 × 480) to the highest (2000 × 1329).
Technologies 14 00186 g015
Figure 16. Without our warping strategy, alignment errors and geometric distortions appear (within the red zone).
Technologies 14 00186 g016
Figure 17. With our locally adaptive image warping (within the blue zone).
Technologies 14 00186 g017
Figure 18. Without the identification of a parallax-free zone, stitching may be performed in an unstable region, leading to visual artifacts (within the red circle).
Technologies 14 00186 g018
Figure 19. When identifying a parallax-free zone, stitching is performed in a more stable region with consistent keypoints, resulting in improved alignment (within the blue-circled regions).
Technologies 14 00186 g019
Figure 20. Without blending. The red shapes highlight visible seam before the blending stage.
Technologies 14 00186 g020
Figure 21. With our blending (linear alpha transition + light Gaussian smoothing). The red shapes indicate regions where seam artifacts are suppressed after blending.
Technologies 14 00186 g021
Figure 22. Some failure cases. Blurring is visible within the red circle, and misalignment within the black circle.
Technologies 14 00186 g022
Table 1. Quantitative comparison using PSNR and SSIM metrics across difficulty levels (Easy, Moderate, Hard). Best results are highlighted in bold.
MethodPSNRSSIM
Easy Mod Hard Avg Easy Mod Hard Avg
I 3 × 3 15.8712.7610.6812.860.5300.2860.1460.303
SIFT+RANSAC [27]28.7524.0818.5523.270.9160.8330.6360.779
APAP [20]27.9624.3920.2123.790.9010.8370.6820.794
ELA [21]29.3625.1019.1924.010.9170.8550.6910.808
SPW [28]26.9822.6716.7721.600.8800.7580.4900.687
LPC [18]26.9422.6319.3122.590.8780.7640.6100.736
UDIS [22]25.1620.9618.3621.170.8340.6690.4950.648
UDIS++ [10]30.1925.8421.5725.430.9330.8750.7390.838
OURS24.9226.0027.8926.270.8230.8390.8820.848
Table 2. BRISQUE (BRI) scores scores (↓) across methods. Best results are highlighted in bold. Lower values indicate better perceptual quality. Entries marked with F indicate cases where the BRISQUE score could not be computed.
MethodSIFTAPAP [20]ELA [21]VFISNet [29]EPIS [30]UDIS [22]SMSR [31]Ours
BRI ↓36.387FF48.27555.84640.15535.35033.433
Table 3. Execution time (seconds) across image resolutions comparisons. Best results are highlighted in bold.
Method1000 × 750975 × 583640 × 480600 × 400
APAP [20]19.4176.40820.2915.534
SPW [28]4.47911.8136.2282.773
ELA [21]4.0673.1921.9382.106
LPC [18]3.23047.26512.7488.397
UDIS [22]4.0353.9923.6713.642
LPWA [32]2.6892.6531.3701.168
Ours1.9691.7871.2870.811
Table 4. Runtime execution (seconds) for largest individual images at varying resolutions.
ImageResolutionRuntime (s)
APAP-garden2000 × 13297.099
REW_cabin1080 × 9603.336
dgpark1200 × 6752.516
a-zzy-line1000 × 7502.515
fcase_foundation1000 × 6662.079
Table 5. Mesh resolution sensitivity.
GridLatticePSNRSSIMTime (s)
1 × 164 × 6424.4160.85010.8913
2 × 264 × 6424.4160.85010.9477
3 × 364 × 6424.0230.83800.9546
2 × 232 × 3224.4160.85011.0211
2 × 296 × 9624.4160.85010.9331
Disclaimer/Publisher’s Note: The statements, opinions and data contained in all publications are solely those of the individual author(s) and contributor(s) and not of MDPI and/or the editor(s). MDPI and/or the editor(s) disclaim responsibility for any injury to people or property resulting from any ideas, methods, instructions or products referred to in the content.