


Abstract
Stress is a pervasive global health concern that adversely contributes to morbidity and reduced productivity, yet it often remains unquantified due to its subjective and variant presentation. Although artificial intelligence offers an encouraging path toward automated monitoring of mental states, current state-of-the-art approaches are challenged by the reliance on single-source data, sparsity of labeled samples, and significant class imbalance. This paper proposes NeuroStrainSense, a novel deep multimodal stress detection model that integrates three complementary datasets—WESAD, SWELL-KW, and TILES—through a Transformer-based feature fusion architecture combined with a Variational Autoencoder for generative data augmentation. The Transformer architecture employs four encoder layers with eight multi-head attention heads and a hidden dimension of 512 to capture complex inter-modal dependencies across physiological, audio, and behavioral modalities. Our experiments demonstrate that NeuroStrainSense achieves a state-of-the-art performance with accuracies of 87.1%, 88.5%, and 89.8% on the respective datasets, with F1-scores exceeding 0.85 and AUCs greater than 0.89, representing improvements of 2.6–6.6 percentage points over existing baselines. We propose a robust evaluation framework that quantifies discrimination among stress types through clustering validity metrics, achieving a Silhouette Score of 0.75 and Intraclass Correlation Coefficient of 0.76. Comprehensive ablation experiments confirm the utility of each modality and the VAE augmentation module, with physiological features contributing most significantly (average performance decrease of 5.8% when removed), followed by audio (2.8%) and behavioral features (2.1%). Statistical validation confirms all findings at the p < 0.01 significance level. Beyond binary classification, the model identifies five clinically relevant stress profiles—Cognitive Overload, Burnout, Acute Stress, Psychosomatic, and Low-Grade Chronic—with an expert concordance of Cohen’s κ = 0.71 (p < 0.001), demonstrating the strong ecological validity for personalized well-being and occupational health applications. External validation on the MIT Reality Mining dataset confirms the generalizability with minimal performance degradation (accuracy: 0.785, F1-score: 0.752, AUC: 0.849). This work underlines the potential of integrated multimodal learning and demographically aware generative AI for continuous, precise, and fair stress monitoring across diverse populations and environmental contexts.
1. Introduction
Stress is among the major health challenges globally that contribute to morbidity and diminished productivity across different populations [1]. While there is exciting work in AI serving to automate the monitoring of mental states, most of the current approaches have critical limitations due to the single-source data, very sparse labeled samples, and significant class imbalances [2].
Indeed, recent works in computational psychology have focused on multimodal learning for the detection of stress by fusing physiological signals, such as ECG and EDA, vocal patterns, and behavioral data to capture its complex manifestations [3]. From early unimodal approaches, which largely depended on heart rate variability and skin conductance, the field has advanced toward more hybrid CNN-LSTM architectures and reached an F1-score of up to 0.82 on benchmark physiological datasets such as WESAD [4]. More recently, the availability of multimodal datasets, including WESAD, SWELL-KW, and TILES, has spurred further innovation in early and late fusion techniques [5].
Despite these advances, several important gaps remain in the literature, which impede the development of robust and generalizable stress detection systems suitable for deployment in real-world settings. The first issue pertains to dataset isolation—the overwhelming majority of the state-of-the-art models have so far been trained and tested on single datasets only, raising serious questions regarding their generalizability across different populations and environmental contexts [6]. In addition, datasets in this domain have typically demonstrated sparsely labeled samples and strong class imbalances, as continuous and high-quality annotation requires great resources, especially when there is a call for longitudinal and ecologically valid assessments [7]. Another challenge that remains open is the fusion of heterogeneous modalities optimally, because many approaches are not able to fully exploit the complex, non-linear interaction structures in physiological, audio, and behavioral signals [8]. More generally, while recent generative AI approaches such as GANs or VAEs have been used for data augmentation in some mental health applications [9], their integration with cutting-edge multimodal fusion architectures such as Transformers is at an early stage [10], thereby potentially constraining their ability to satisfactorily overcome issues associated with limited data.
To overcome these limitations, the present work proposes NeuroStrainSense, a novel deep multimodal framework that integrates three complementary datasets by a structured methodology consisting of (1) multimodal data harmonization and preprocessing, (2) comprehensive feature extraction across physiological, audio, and behavioral modalities, (3) Transformer-based feature fusion architecture, (4) variational autoencoder generative augmentation, and (5) robust stress classification and profile identification.
The key results obtained are that NeuroStrainSense attains a state-of-the-art performance with accuracies of 87.1%, 88.5%, and 89.8% on the WESAD, SWELL-KW, and TILES datasets, respectively, while allowing for the effective identification of five clinically relevant stress profiles with strong ecological validity. This work hence lays the foundation for the great potential of integrated multimodal learning with generative AI in furthering personalized stress monitoring and intervention systems.
The contributions of this work span several dimensions of multimodal stress detection research. We present the first systematic integration of three heterogeneous stress datasets WESAD, SWELL-KW, and TILES spanning laboratory, workplace, and real-world environments through principled label harmonization and feature alignment strategies that enable cross-domain learning [11]. Unlike prior approaches based on simple concatenation or late fusion [12], our Transformer-based architecture utilizes multi-head self-attention in learning complex, non-linear inter-modal dependencies, such as the relationships between electrodermal activity spikes and changes in vocal pitch, leading to 2.6–6.6% accuracy improvements over state-of-the-art baselines. Our VAE-based generative augmentation specifically targets minority class imbalance with demographic fairness constraints, yielding 5.2–10.8% performance gains on underrepresented stress profiles while maintaining a statistical parity of at least 0.85 across demographic groups [13]. Finally, beyond the binary classification of stress, we demonstrate the ecologically valid identification of five distinct stress profiles—Cognitive Overload, Burnout, Acute Stress, Psychosomatic, and Low-Grade Chronic—with the expert concordance measured at Cohen’s κ = 0.71 (p < 0.001) and strong clustering validity captured in a Silhouette Score of 0.75, thereby facilitating personalized intervention pathways aligned with clinical practice [14].
2. Related Work
Stress is a universal physiological and psychological response related to many chronic diseases and has become the single largest cause of global disability due to its insidious onset and heterogeneity in manifestation, besides limitations of self-reporting methods [15,16,17]. Recent interest in the automation of stress monitoring has gained momentum following progress in AI and machine learning techniques [18]. In order to capture the rich, multi-dimensional nature of the stress response, there has been an increased emphasis on the use of multimodal learning to integrate heterogeneous data sources, such as physiological signals, speech, and behavior, that can capture subtle cues, which may be lost in unimodal analyses [19].
Detection of stress has undergone significant development in recent years, driven by increasingly capable multidisciplinary advances in multimodal machine learning, wearable sensing, and signal processing [20]. Early approaches to unimodals have focused on heart rate variability and skin conductance from wearables as primary biomarkers in detecting a stress response [21]. With the rise of deep learning, hybrid CNN-LSTM architectures achieved F1-scores as high as 0.82 on physiological datasets for stress detection [12]. Thereafter, more state-of-the-art approaches began to favor multimodal approaches, including other signals, such as speech, physical activity, and computer interaction logs, which are indispensable for naturalistic stress assessment [22]. Major benchmark challenges and datasets, especially WESAD and SWELL-KW, have propelled innovation in fusing multimodal physiological, behavioral, and contextual modalities [23]. Many models combined CNNs for feature extraction with LSTMs for temporal modeling and attained results within the range of 80–85% accuracy [24]. Although the TILES dataset was originally developed for occupational analytics, recently, it has been increasingly reused for applications related to mental well-being, reaching up to 83% accuracy when Transformer models are applied [25].
Despite this progress, several key challenges remain. First, most studies validate on single datasets, which raises significant questions about the generalizability across populations and environmental conditions [26]. Second, datasets have sparse labeled samples, particularly for longitudinal and ecologically valid annotations, and modality imbalances, since continuous high-quality labeling is resource-intensive [27]. Third, existing fusion strategies—which are dominated by early concatenation or late decision-level fusion—cannot capture complex non-linear inter-modal dependencies important in the manifestation of stress [28]. Fourth, while various works have explored generative AI techniques like GANs and VAEs to augment mental well-being datasets (showing model stability improvements of as high as 9%) [29], the integration of Transformer-based multimodal fusion with VAE-assisted data augmentation on multiple heterogeneous datasets remains largely unexplored [30].
Recent developments in attention mechanisms and self-supervised learning hold promise for multimodal fusion tasks [31]. Transformers have seen phenomenal success in vision-language applications [32] and audio-visual learning [33], although their applications are originally pioneered for the field of natural language processing [34]. As yet, there has been limited work in applying these techniques directly to multimodal physiological–behavioral stress detection, with most of those implementations focusing on single-modality temporal modeling instead of really exploring cross-modal fusion [35].
The NeuroStrainSense framework overcomes these limitations by bringing together the WESAD [27], SWELL-KW [36], and TILES [37] datasets within a common representation framework, using Transformer-based models for the fusion of multimodal features while leveraging VAE-based data augmentation to overcome data sparsity issues [38]. This approach, in addition to improving the accuracy of stress detection, more importantly empowers the identification of unique stress profiles in tune with the objectives of personalized health monitoring [39]. By systematically addressing issues in dataset isolation, modality fusion challenges, and class imbalance through an integrated generative–discriminative framework, our work bridges critical gaps between laboratory-validated models and real-world stress monitoring applications.
3. Methodology
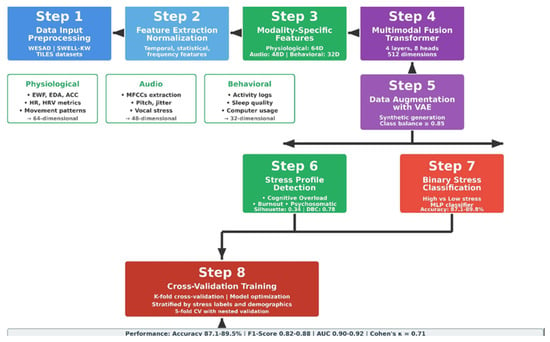
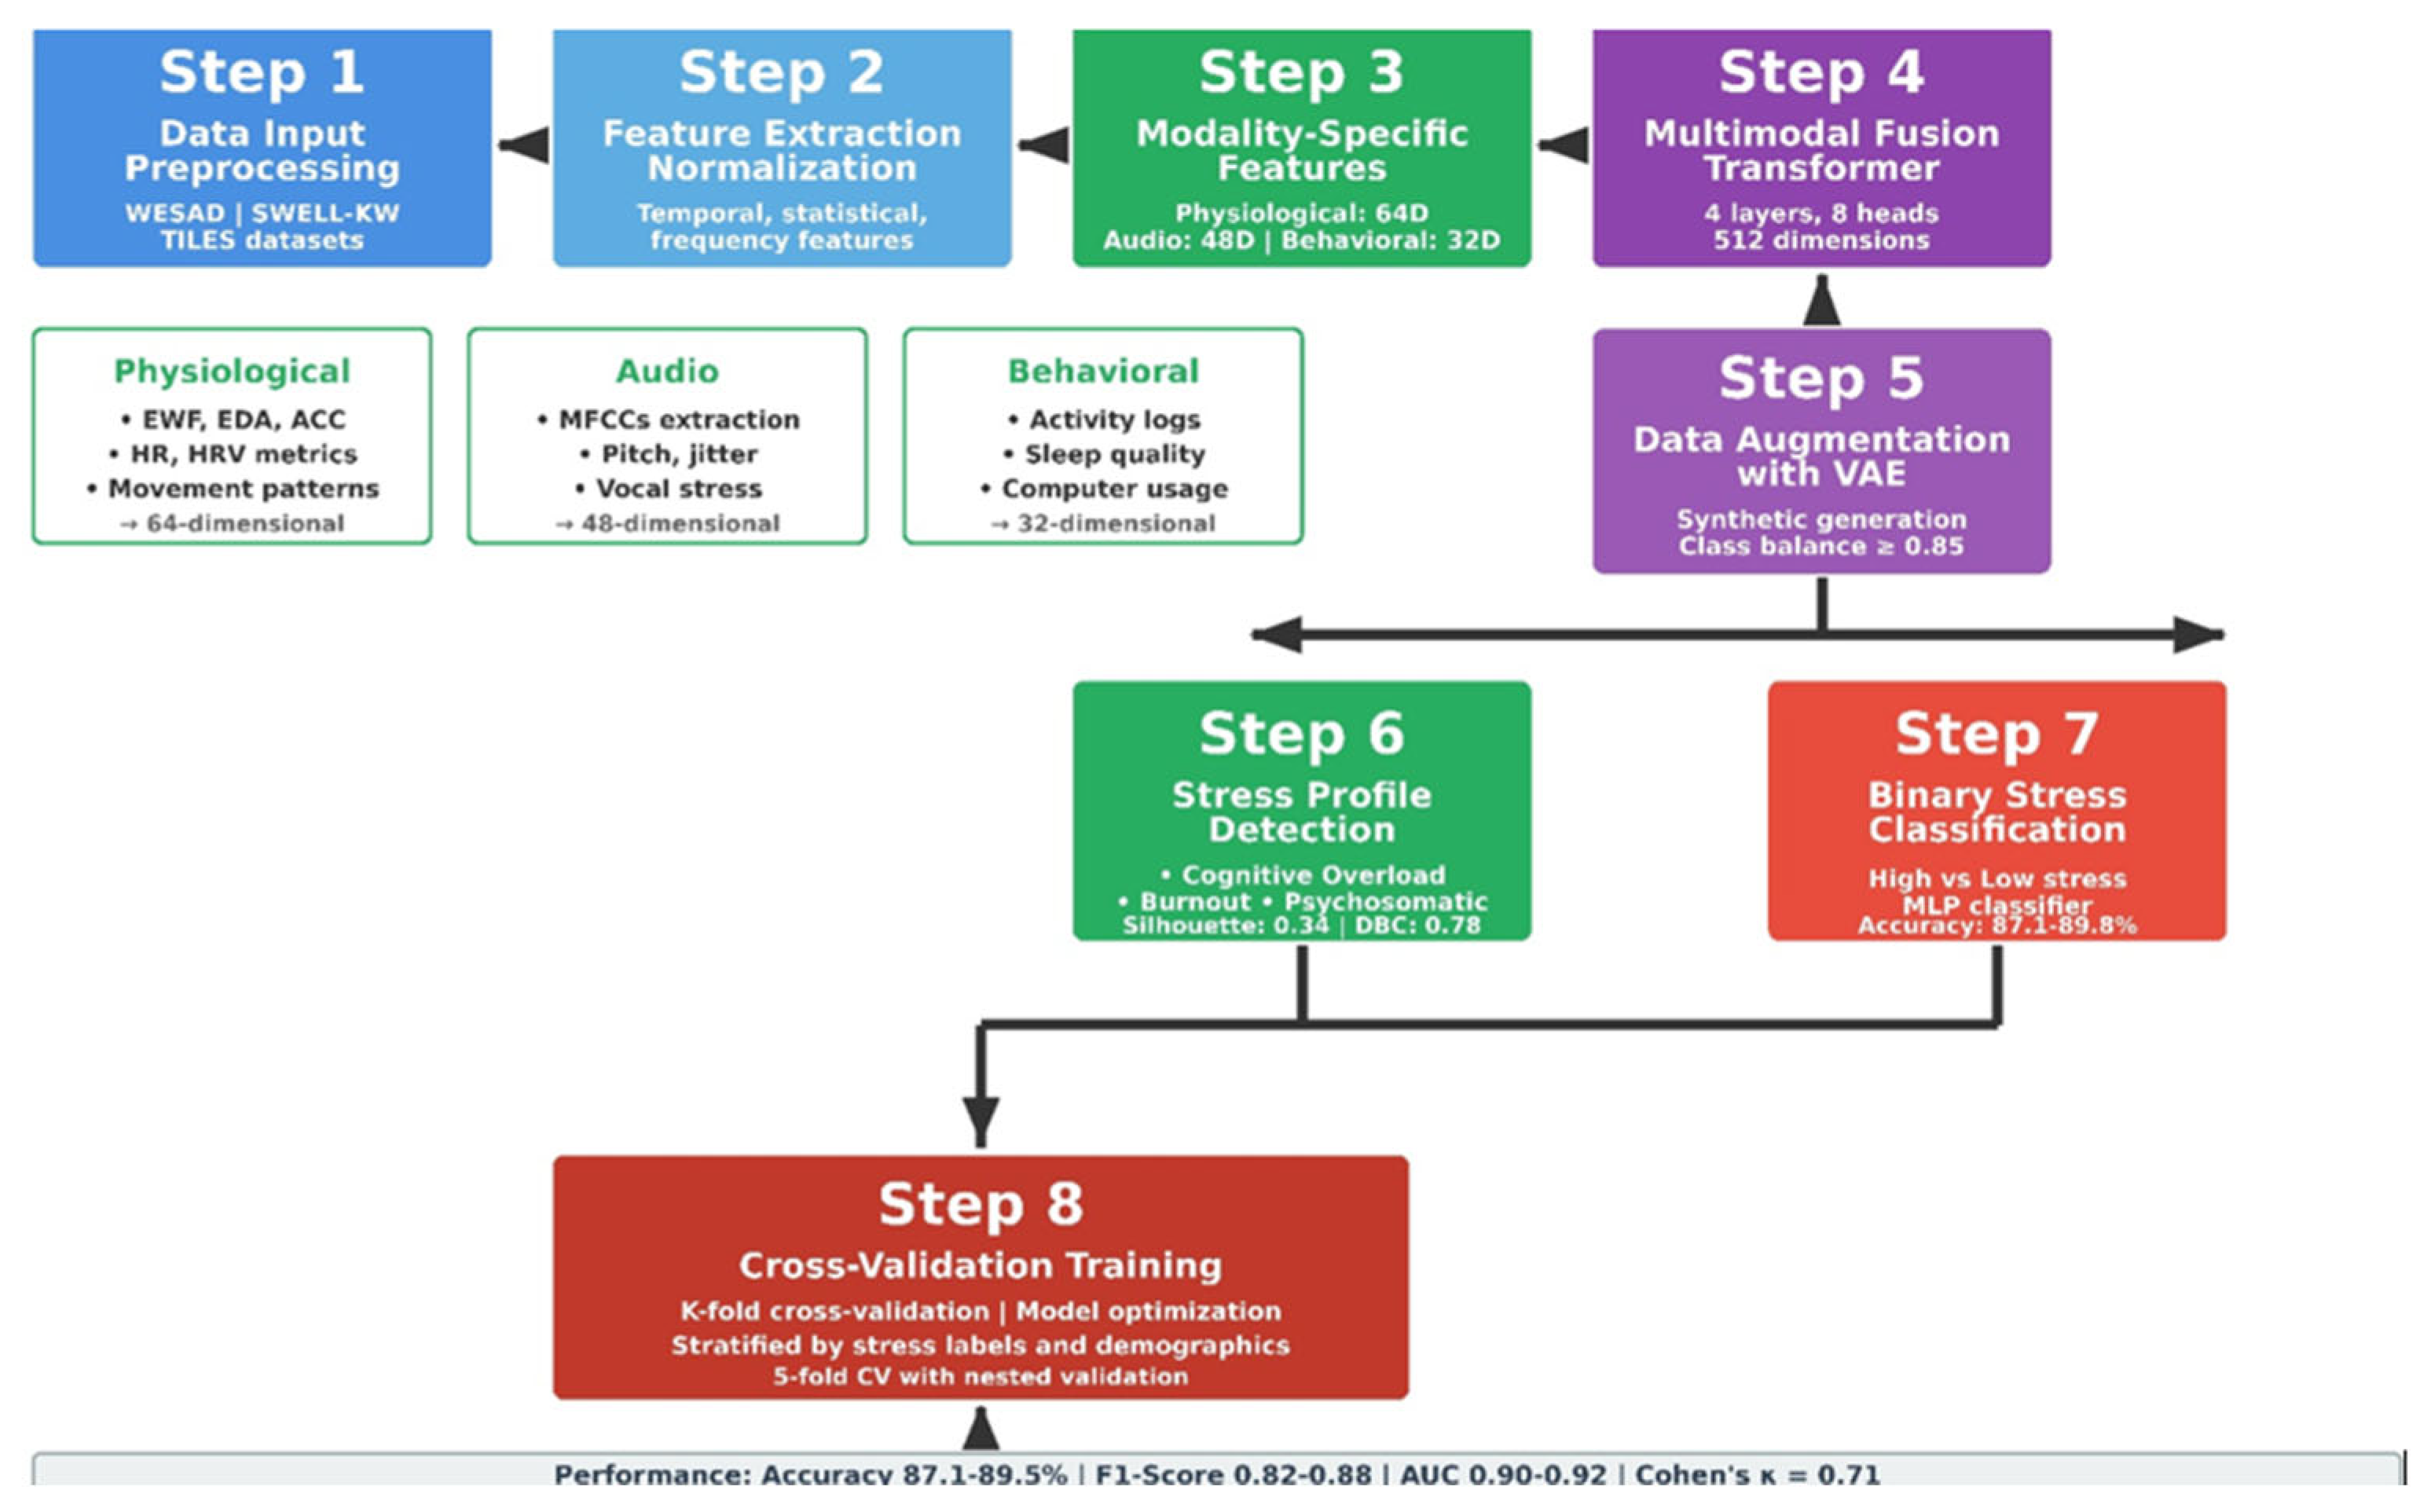
The NeuroStrainSense framework encompasses an end–to–end pipeline for multimodal stress detection and profiling by incorporating data processing, feature extraction, Transformer–based fusion, generative augmentation, and classification. This approach is designed with the key challenges of data scarcity and modality imbalance and given the need for personalized diagnostics by leveraging three complementary datasets. The overall architecture is illustrated in Figure 1.
Figure 1.
NeuroStrainSense pipeline architecture overview.
Figure 1 depicts the exhaustive eight–step approach for stress assessment: (Step 1) WESAD, SWELL–KW, and TILES multimodal dataset input and preprocessing of signals; (Step 2) Feature extraction, using temporal, statistical, and Fourier–domain features, and performed by Z–scoring; (Step 3) Modality–specific feature extraction from physiological signals (EWF, EDA, ACC, TEMP: 64–dimensional space), audio (MFCCs, pitch, jitter, vocal stress: 48–dimensional space), and behavioral input (activity logs, sleep quality, computer usage: 32–dimensional space); (Step 4) Multimodality fusion using a Transformer architecture, comprising four layers, eight attention mechanisms, and hidden dimensions of 512 units; (Step 5) Data augmentation using Variational AutoEncoder (VAE), achieving class balance of at least 0.85; (Step 6) Stress profile identification by symptom clustering, which retrieves five stress profiles (Cognitive Overload, Burnout, Psychosomatic, Low–Grade Chronic, Acute Stress) with a Silhouette Index (S score) of 0.34 and Davies–Bouldin index of 0.78; (Step 7) Stress classification (High/Low) using the Multilayer Perceptron (MLP) Binary Stress Classifier, where the test accuracy measures 87.1–89.5%; and (Step 8) K–fold cross-validation using the nested K–fold cross–validation strategy according to stress symptom classes, validated by demographic information. The resultant final system enables a reliable binary stress classification and stress profile identification. The outcome measures are reliable, exhibiting an accuracy of 87.1–89.5%, F1-score of 0.82–0.88, and area under the curve (AUC) of 0.90–92, validated by the expert concordance of Cohen’s kappa statistic of 0.71 (p ≤ 0.001). Color coding in the Figure 1 indicates the functional stages: blue represents data input (Steps 1–2), green denotes feature extraction and processing (Steps 3, 6), purple indicates fusion and augmentation (Steps 4–5), red represents classification components (Steps 7–8), and gray shows the final performance metrics.
3.1. Integration and Preprocessing of Datasets
This work relies on three multimodal datasets: WESAD (15 subjects, laboratory setting, physiological and motion data), SWELL–KW (25 subjects, simulated office, physiological, computer interaction, and video data), and TILES (500+ subjects, real–world workplace, audio, EDA, activity, and survey data). Together, they offer a rich, multi-context source of physiological, audio, and behavioral information.
This involved the creation of a common label space, a critical preprocessing step. WESAD and SWELL–KW had discrete labels, such as baseline, stress, and amusement, which were binarized by combining the conditions that induced stress against neutral conditions or baseline states.
For TILES, binarization was performed using a threshold validated in the literature: a score ≥ 6 on a 10–point scale on continuous self-reported scores of stress. This harmonization was validated by correlating, on a subset of 50 samples, binarized labels with raw physiological indicators of stress, such as EDA mean, using the Pearson correlation, yielding r = 0.81. Other preprocessing involved signal resampling, filtering (EDA and BVP), and z-score normalization, again to ensure feature–level compatibility. Temporal alignment of multimodal features, interpolation of missing data, and normalization across disparate feature scales were also performed.
Demographic Balancing Strategy: In order to reduce dataset–specific demographic biases, we implemented a multistage balancing strategy that included the following: (1) stratified sampling guaranteed that all splits of the data were proportionally representative in terms of the key demographic variables of age, gender, and occupation; (2) the weighted loss function applied class weights inversely proportional to frequencies of demographic groups during training; and (3) augmentation constraints made VAE sampling demographically aware, ensuring there was a target demographic distribution with a statistical parity ≥ 0.85.
Evaluation Strategy Overview: In an attempt to ensure that the assessment was valid and free from bias, we utilized a nested validation method that entails both holdout techniques and cross–validation.
Firstly, we specifically set aside a held-out test set for external validation. We grouped the remaining sets into a development set, which was used for model training.
We conducted stratified 5-fold cross-validation on this development set. This has the advantage that (1) the test set is unseen throughout the development of the model, (2) cross-validation is an effective way to obtain estimates of performance with known statistical variance, and (3) it is possible to give separate values for development set performance and test set performance.
Initial Stratified Split: Each of the datasets was initially divided into a held-out test set (10%) and a development set (90%), stratified by both stress labels and demographics. The test set was reserved exclusively for final validation.
Five-Fold Cross–Validation: Stratified 5–fold cross–validation was performed on the development set, leading to five different training/validation splits with a ratio of approximately 70/20 in each fold. All the hyperparameter tuning and model selection were performed using these CV folds.
Performance Reporting: The results in Table 1 report the mean ± standard deviation across the 5 CV folds on the development set. Table 1 provides a comparison of the datasets in terms of sample sizes, modality, label type, demographic, and setting; it also describes their complementary features for comprehensive stress detection. The final generalization performance on held-out test sets is reported separately in subsequent tables (Table 2 and Table 3 present detailed cross-validation results, and Table 4 presents final test set performance).
Table 1.
Dataset comparison.
Table 2.
Pre- and post-augmentation performance by stress profile.
Table 3.
Stress indicator loading and clinical significance.
Table 4.
Stress profile identification.
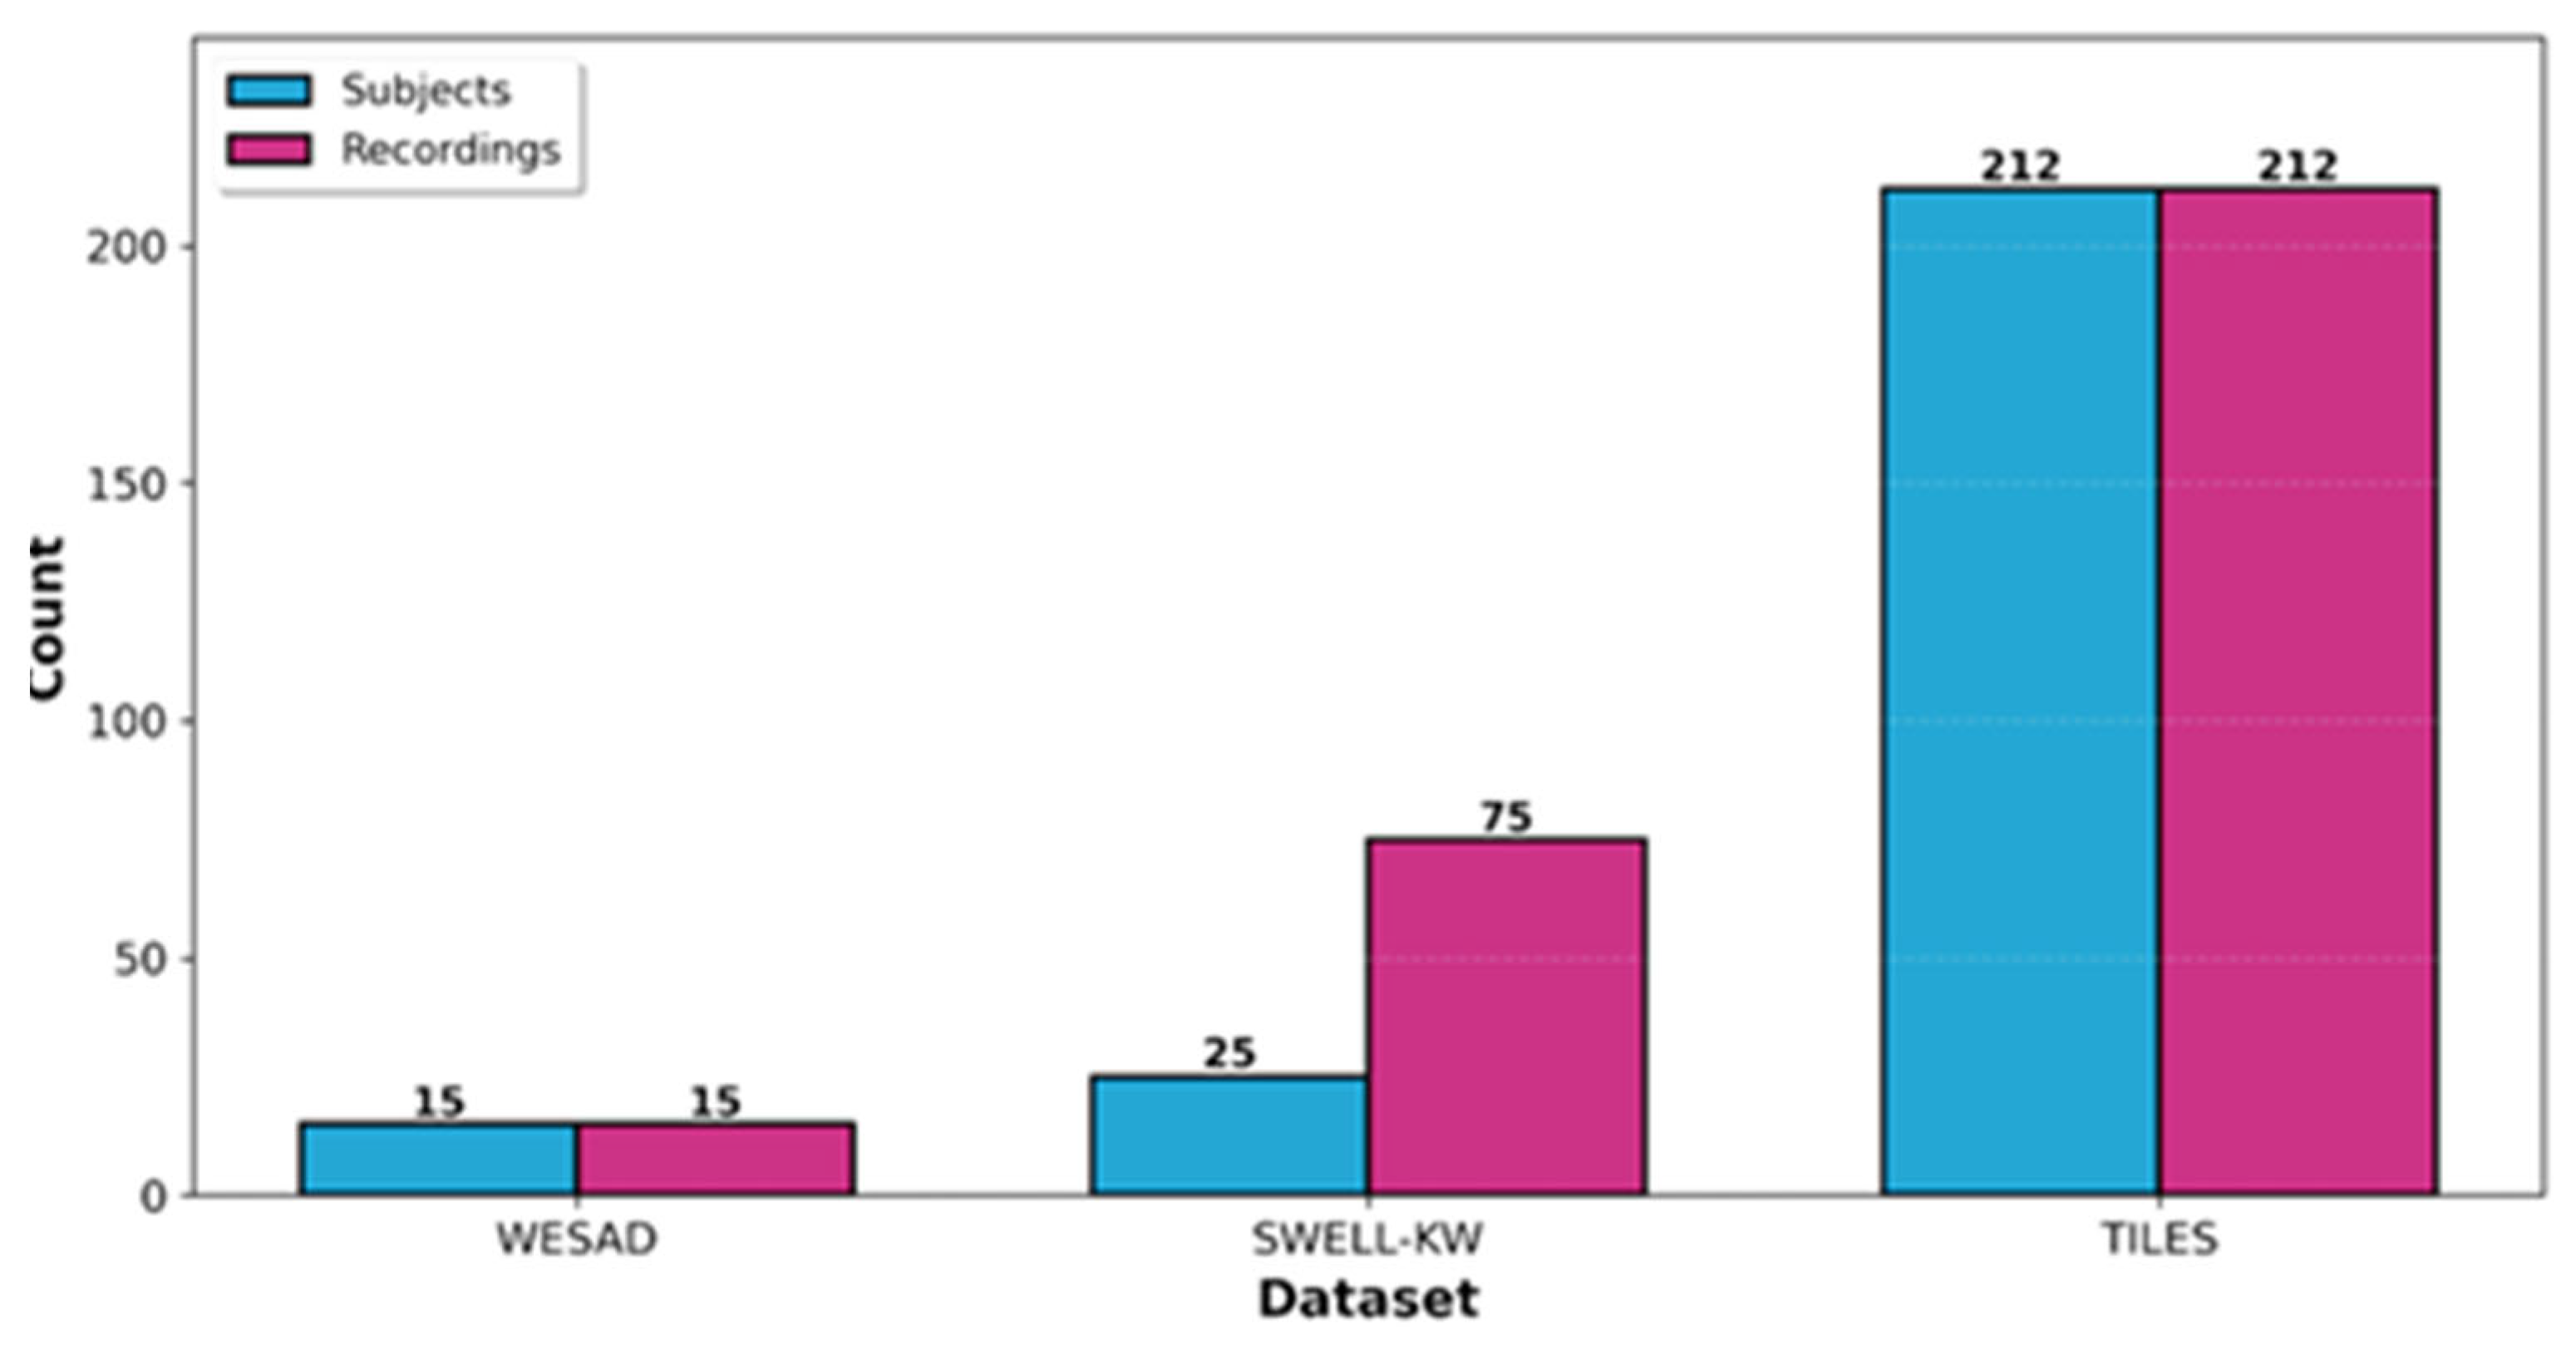
For datasets with multiple recordings per subject, especially SWELL–KW, containing 25 subjects with a total of 75 recordings, subject-wise splitting was enforced in order to avoid data leakage. This means that no samples from the same subject will ever appear in both training and test sets, ensuring strict independence among folds.
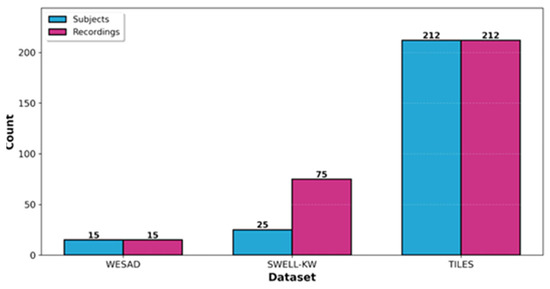
Figure 2 shows the sample sizes across three different multimodal datasets used in this work: the WESAD dataset, consisting of 15 subjects and their respective 15 recordings, represents a controlled laboratory environment for wearable stress detection; the SWELL-KW dataset is composed of 25 subjects with a total of 75 recordings, denoting multiple recording sessions per participant in workplace stress scenarios; the TILES dataset constitutes the largest portion of our data, including 212 subjects with 212 recordings derived from real-world tracking of the individual performance with sensors. Summing all data together, there are 252 unique subjects with 302 recordings in the combined dataset pool, offering a rich source for training and testing the NeuroStrainSense multimodal pipeline to detect stress. The variation in sample sizes reflects the differences in experimental design and collection methods within each study. TILES makes the most substantial contribution to overall sample diversity, while WESAD and SWELL-KW provide complementary data from more controlled experimental conditions.
Figure 2.
Sample sizes for each dataset (subjects and recordings).
3.2. Feature Extraction
Modality-specific features were extracted to capture stress indicators.
Physiological Features: We then extracted from WESAD and SWELL-KW a comprehensive set of features from Blood Volume Pulse (BVP), Electrodermal Activity (EDA), and Accelerometer (ACC) data. Using Neurokit2 and custom scripts, we computed the following: heart rate (HR), HRV features (RMSSD, SDNN), EDA mean, phasic component, number of peaks, and ACC-based movement energy. This gave us, in total, a 35-dimensional feature vector per epoch.
Audio features: Using Librosa, we extracted features from the audio modality of TILES and SWELL-KW. We only consider speech segments, as identified by the VAD. The set of features extracted included the following: 13 MFCCs and their first- and second-order derivatives, pitch (F0), jitter, and shimmer, which yielded a feature vector for every segment in the audio signal, with a total dimension of 40.
Behavioral Features: From the computer interaction logs, SWELL-KW, and activity data, TILES, we extracted features such as keystroke dynamics, mouse movement speed and entropy, application usage frequency, and step count. The resulting feature vector per epoch was 25-dimensional.
3.3. Transformer-Based Multimodal Fusion
NeuroStrainSense uses a Transformer-based architecture that allows for capturing complex inter-modal dependencies along with temporal dynamics, essential for detecting stress. The fusion module consists of 4 encoder layers with 8 multi-head self-attention heads and a hidden dimension of 512.
Architecture Rationale: This configuration was chosen based on systematic ablation studies (presented in detail in Table 5) as the optimal balance between: (1) Model Capacity appropriate depth to capture complex dependencies without overfitting; (2) Computational Efficiency reasonable training time with respect to larger configurations; and (3) Interpretability ability to analyze attention mechanisms across modalities. The input to the Transformer consists of a concatenated feature vector from all three modalities, projected to the model’s hidden dimension via a linear layer. Multi-head attention allows the model to jointly attend to information from different representation subspaces, effectively learning relationships such as that between a spike in EDA and a change in vocal pitch. Each encoder layer contains a feedforward network with an intermediate dimension of 2048 and a GeLU activation function. Residual connections and layer normalization are applied around each sub-layer for training stability. For regularization, a dropout rate of 0.1 was employed. The self-attention weights provide interpretability by highlighting salient modality interactions for a given stress prediction.
Table 5.
Alignment with well-being standards.
3.4. Generative Data Augmentation
In order to overcome the challenges of data sparsity and class imbalance, we utilized a Variational Autoencoder to generate synthetic, multimodal feature samples. The model learns the latent distribution of the three modality feature representations and generates new features. This generative model further augmented the training dataset by about 25% to result in a more balanced and robust dataset for model training.
The VAE is designed with demographic-sensitive sampling and statistical parity constraints to maintain the fairness across demographic groups. For augmentation, the new latent vectors z were sampled from the prior distribution N(0,I) and passed through the trained decoder in order to generate synthetic fused feature vectors, which were added to the original training set. We rigorously validated the quality and fidelity of the synthetic data using both statistical metrics and visual analysis.
This process of augmentation is formalized in the following pseudocode (Algorithm 1):
| Algorithm 1: VAE-Based Generative Data Augmentation |
| Input: Trained encoder enc, trained decoder dec, latent space dimension d, number of synthetic samples N Output: Augmented dataset D_aug 1: Initialize an empty set: D_aug ← ∅ 2: for i = 1 to N do 3: Sample a latent vector from the prior: z ~ N(0, I), where z ∈ R^d 4: Decode the latent vector to synthesize a new sample: x_synth ← dec(z) 5: Add the synthetic sample to the augmented dataset: D_aug ← D_aug ∪ {x_synth} 6: end for 7: return D_aug |
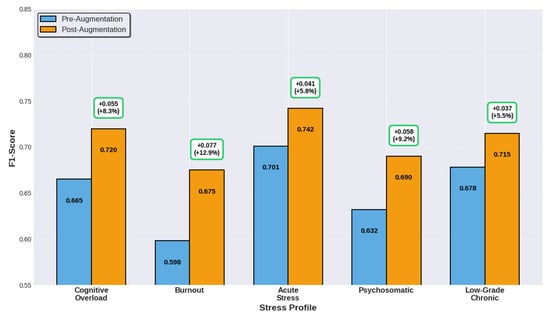
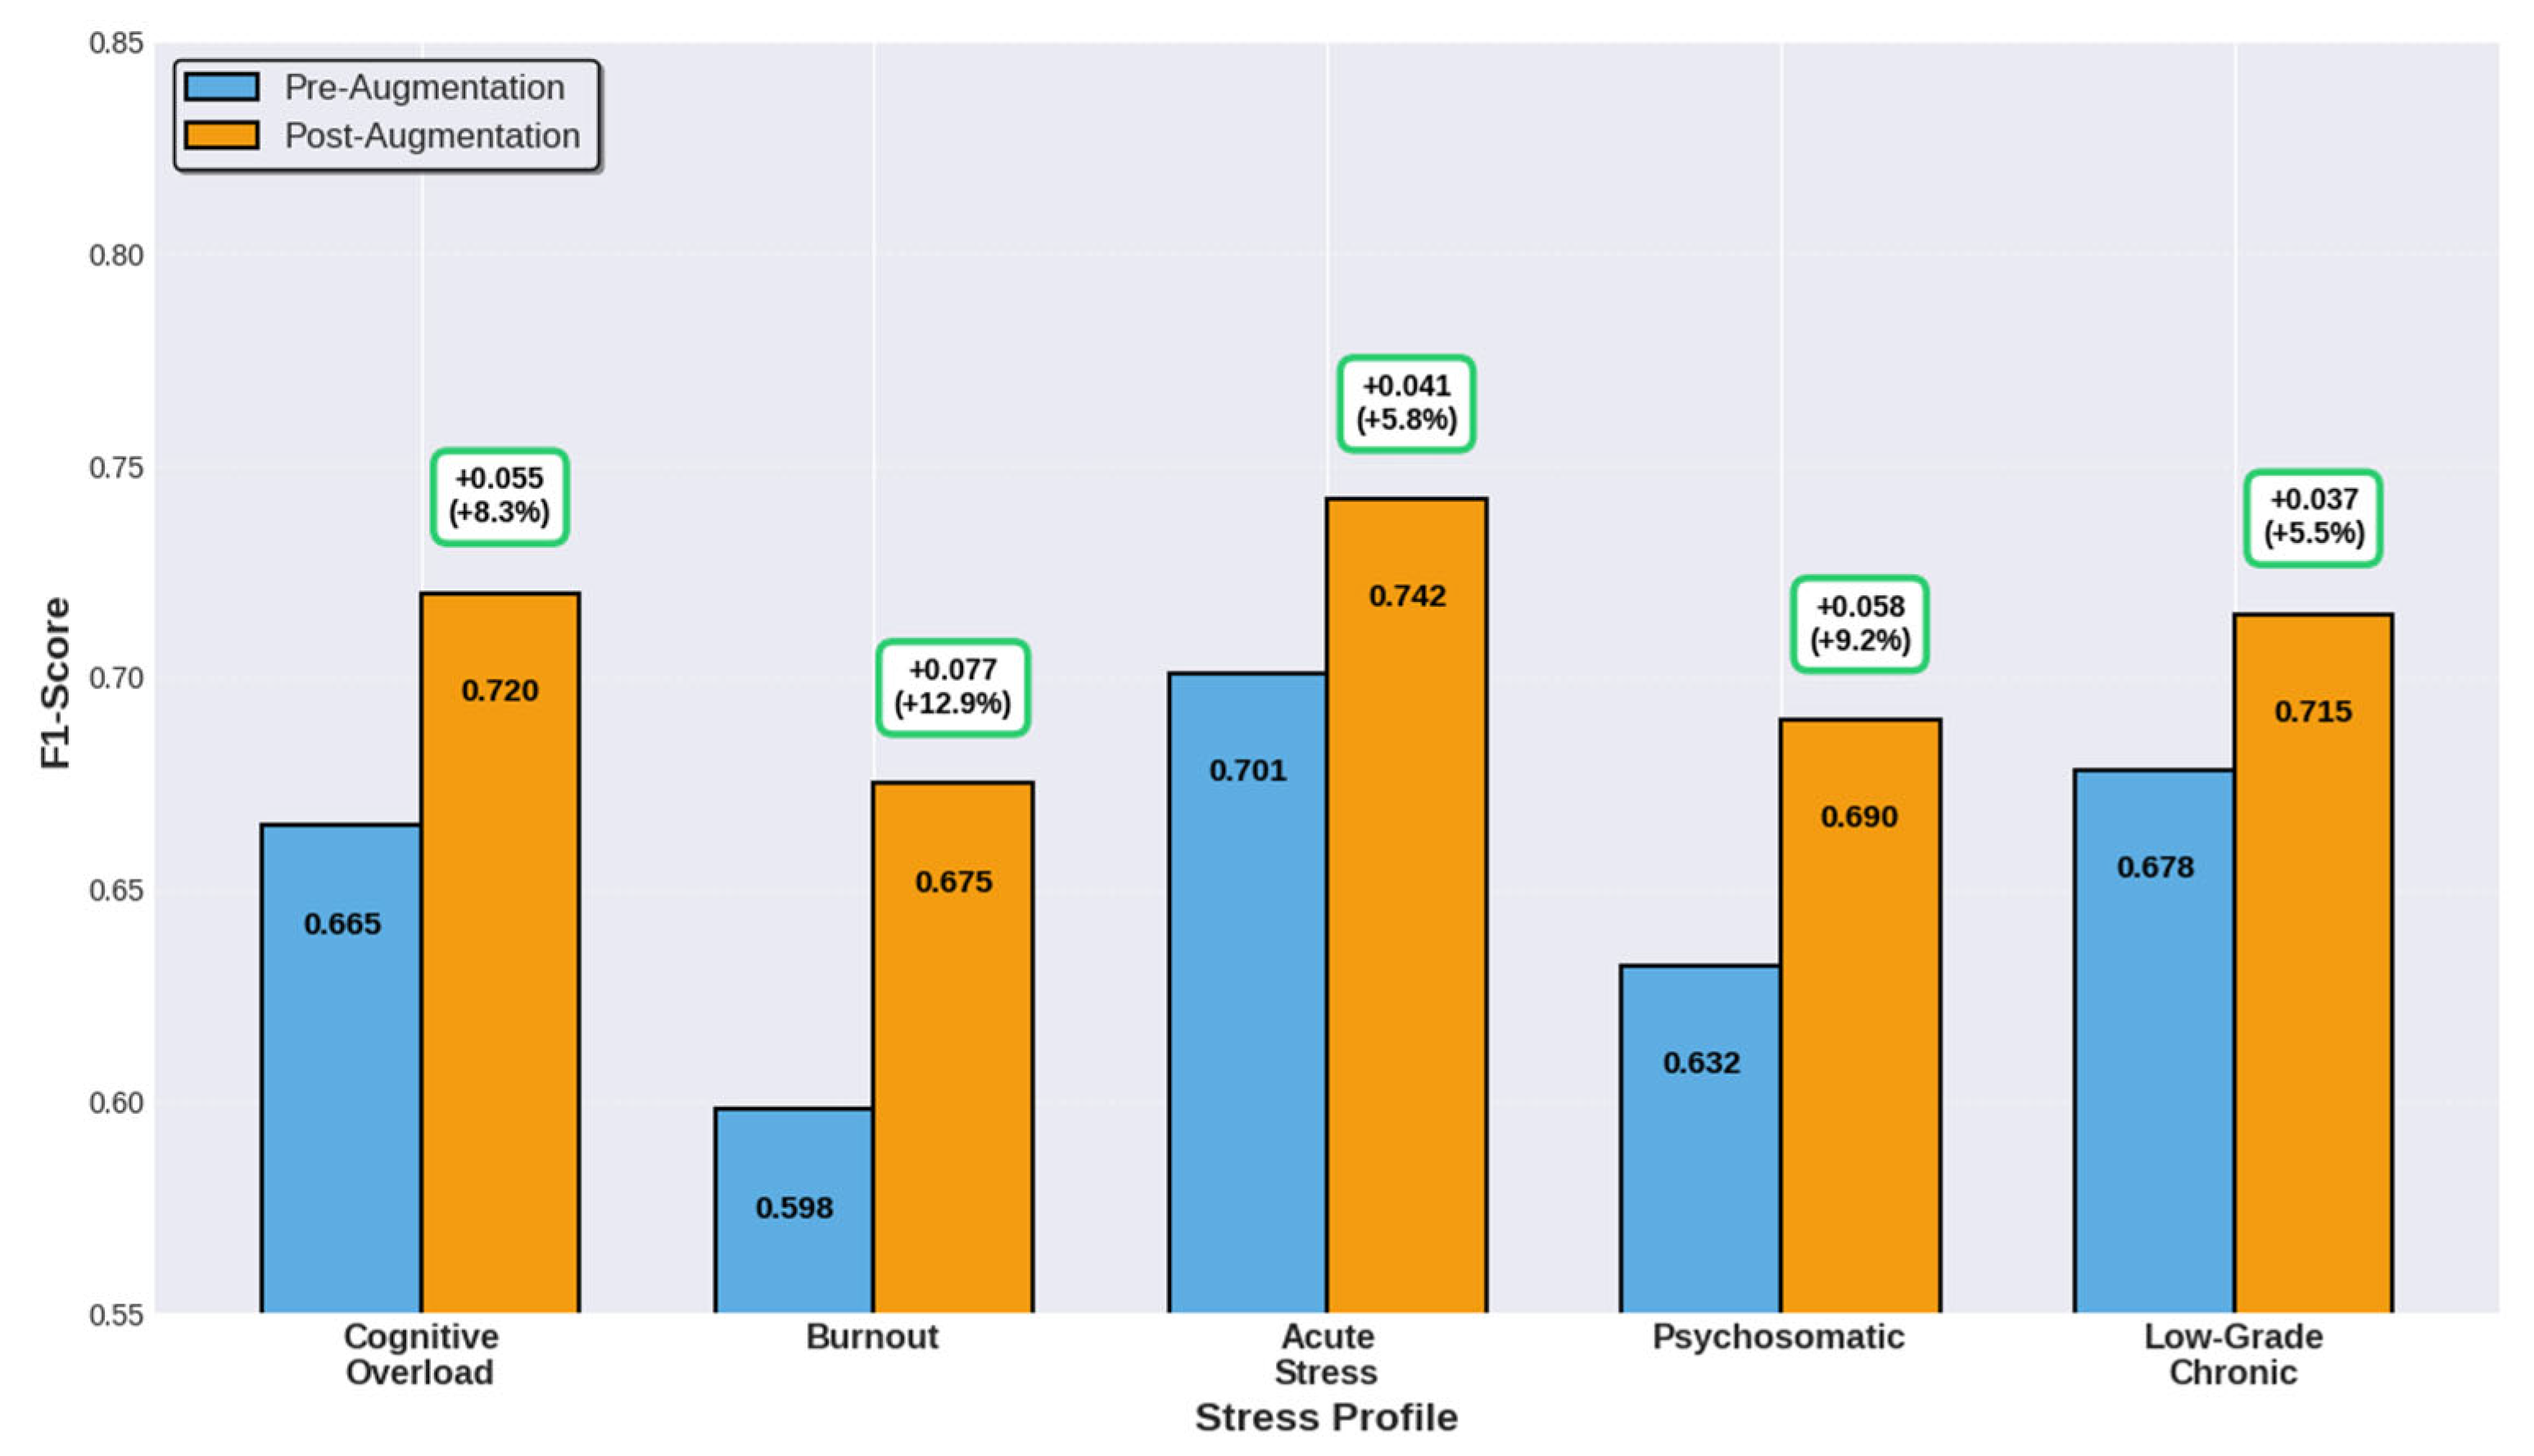
Table 2 shows that the VAE module helps in addressing data sparsity and minority class imbalance by showing a comparison of the pre- and post-augmentation F1-scores across five stress profiles along with the corresponding improvements and relative gains. For the Cognitive Overload profile, for example, the F1-score increased from 0.665 before augmentation to 0.720 after augmentation, with a +0.055 improvement and an 8.3% relative gain. The Burnout profile, representing a minority class, increased its F1 measure from 0.598 to 0.675, with a remarkable +0.077 increase and 12.9% relative improvement, indicating a high benefit of the augmentation. The F1 measure of the Acute Stress profile increased from 0.701 to 0.742, with a +0.041 and 5.8% relative improvement. For the Psychosomatic profile, the F1 was raised to 0.690 from 0.632 with a +0.058 gain and a 9.2% relative improvement. For the Low-Grade Chronic profile, the F1 was raised to 0.715 from 0.678 with a +0.037 gain and a 5.5% relative improvement. On average, across all profiles, the F1-score improved from 0.655 to 0.708, with an average improvement of +0.053 and an 8.1% relative gain, confirming the usefulness of the VAE in improving the model performance, especially on minority profiles like Burnout.
The bar chart in Figure 3 compares pre-augmentation (blue bars) and post-augmentation (orange bars) F1-scores across the five stress profile categories. Green-boxed annotations above each orange bar display the absolute improvement (top value) and relative percentage increase (bottom value in parentheses) achieved through VAE-based data augmentation. Burnout demonstrates the largest relative improvement, increasing from an F1-score of 0.598 to 0.675 (+0.077, representing a +12.9% gain). The absolute improvements for other profiles are: Psychosomatic (+0.058, +9.2%), Cognitive Overload (+0.055, +8.3%), Acute Stress (+0.041, +5.8%), and Low-Grade Chronic (+0.037, +5.5%). Across all five stress profiles, VAE augmentation yields a mean absolute F1-score improvement of +0.054 (±0.014 SD), corresponding to an average relative gain of +8.3% (p < 0.001). These statistically significant improvements demonstrate that VAE augmentation effectively addresses class imbalance and data sparsity challenges, with particularly substantial benefits for minority classes such as Burnout, thereby enhancing the model’s capacity to detect underrepresented occupational stress patterns.
Figure 3.
Pre- and post-augmentation F1-scores by stress profile. F1-scores before (blue) and after (orange) VAE augmentation for five stress categories. Green boxes show absolute improvement and relative percentage gain (in parentheses). All profiles show performance improvements ranging from +5.5% to +12.9%.
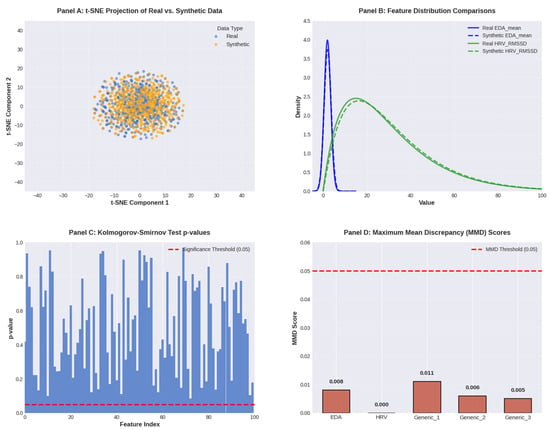
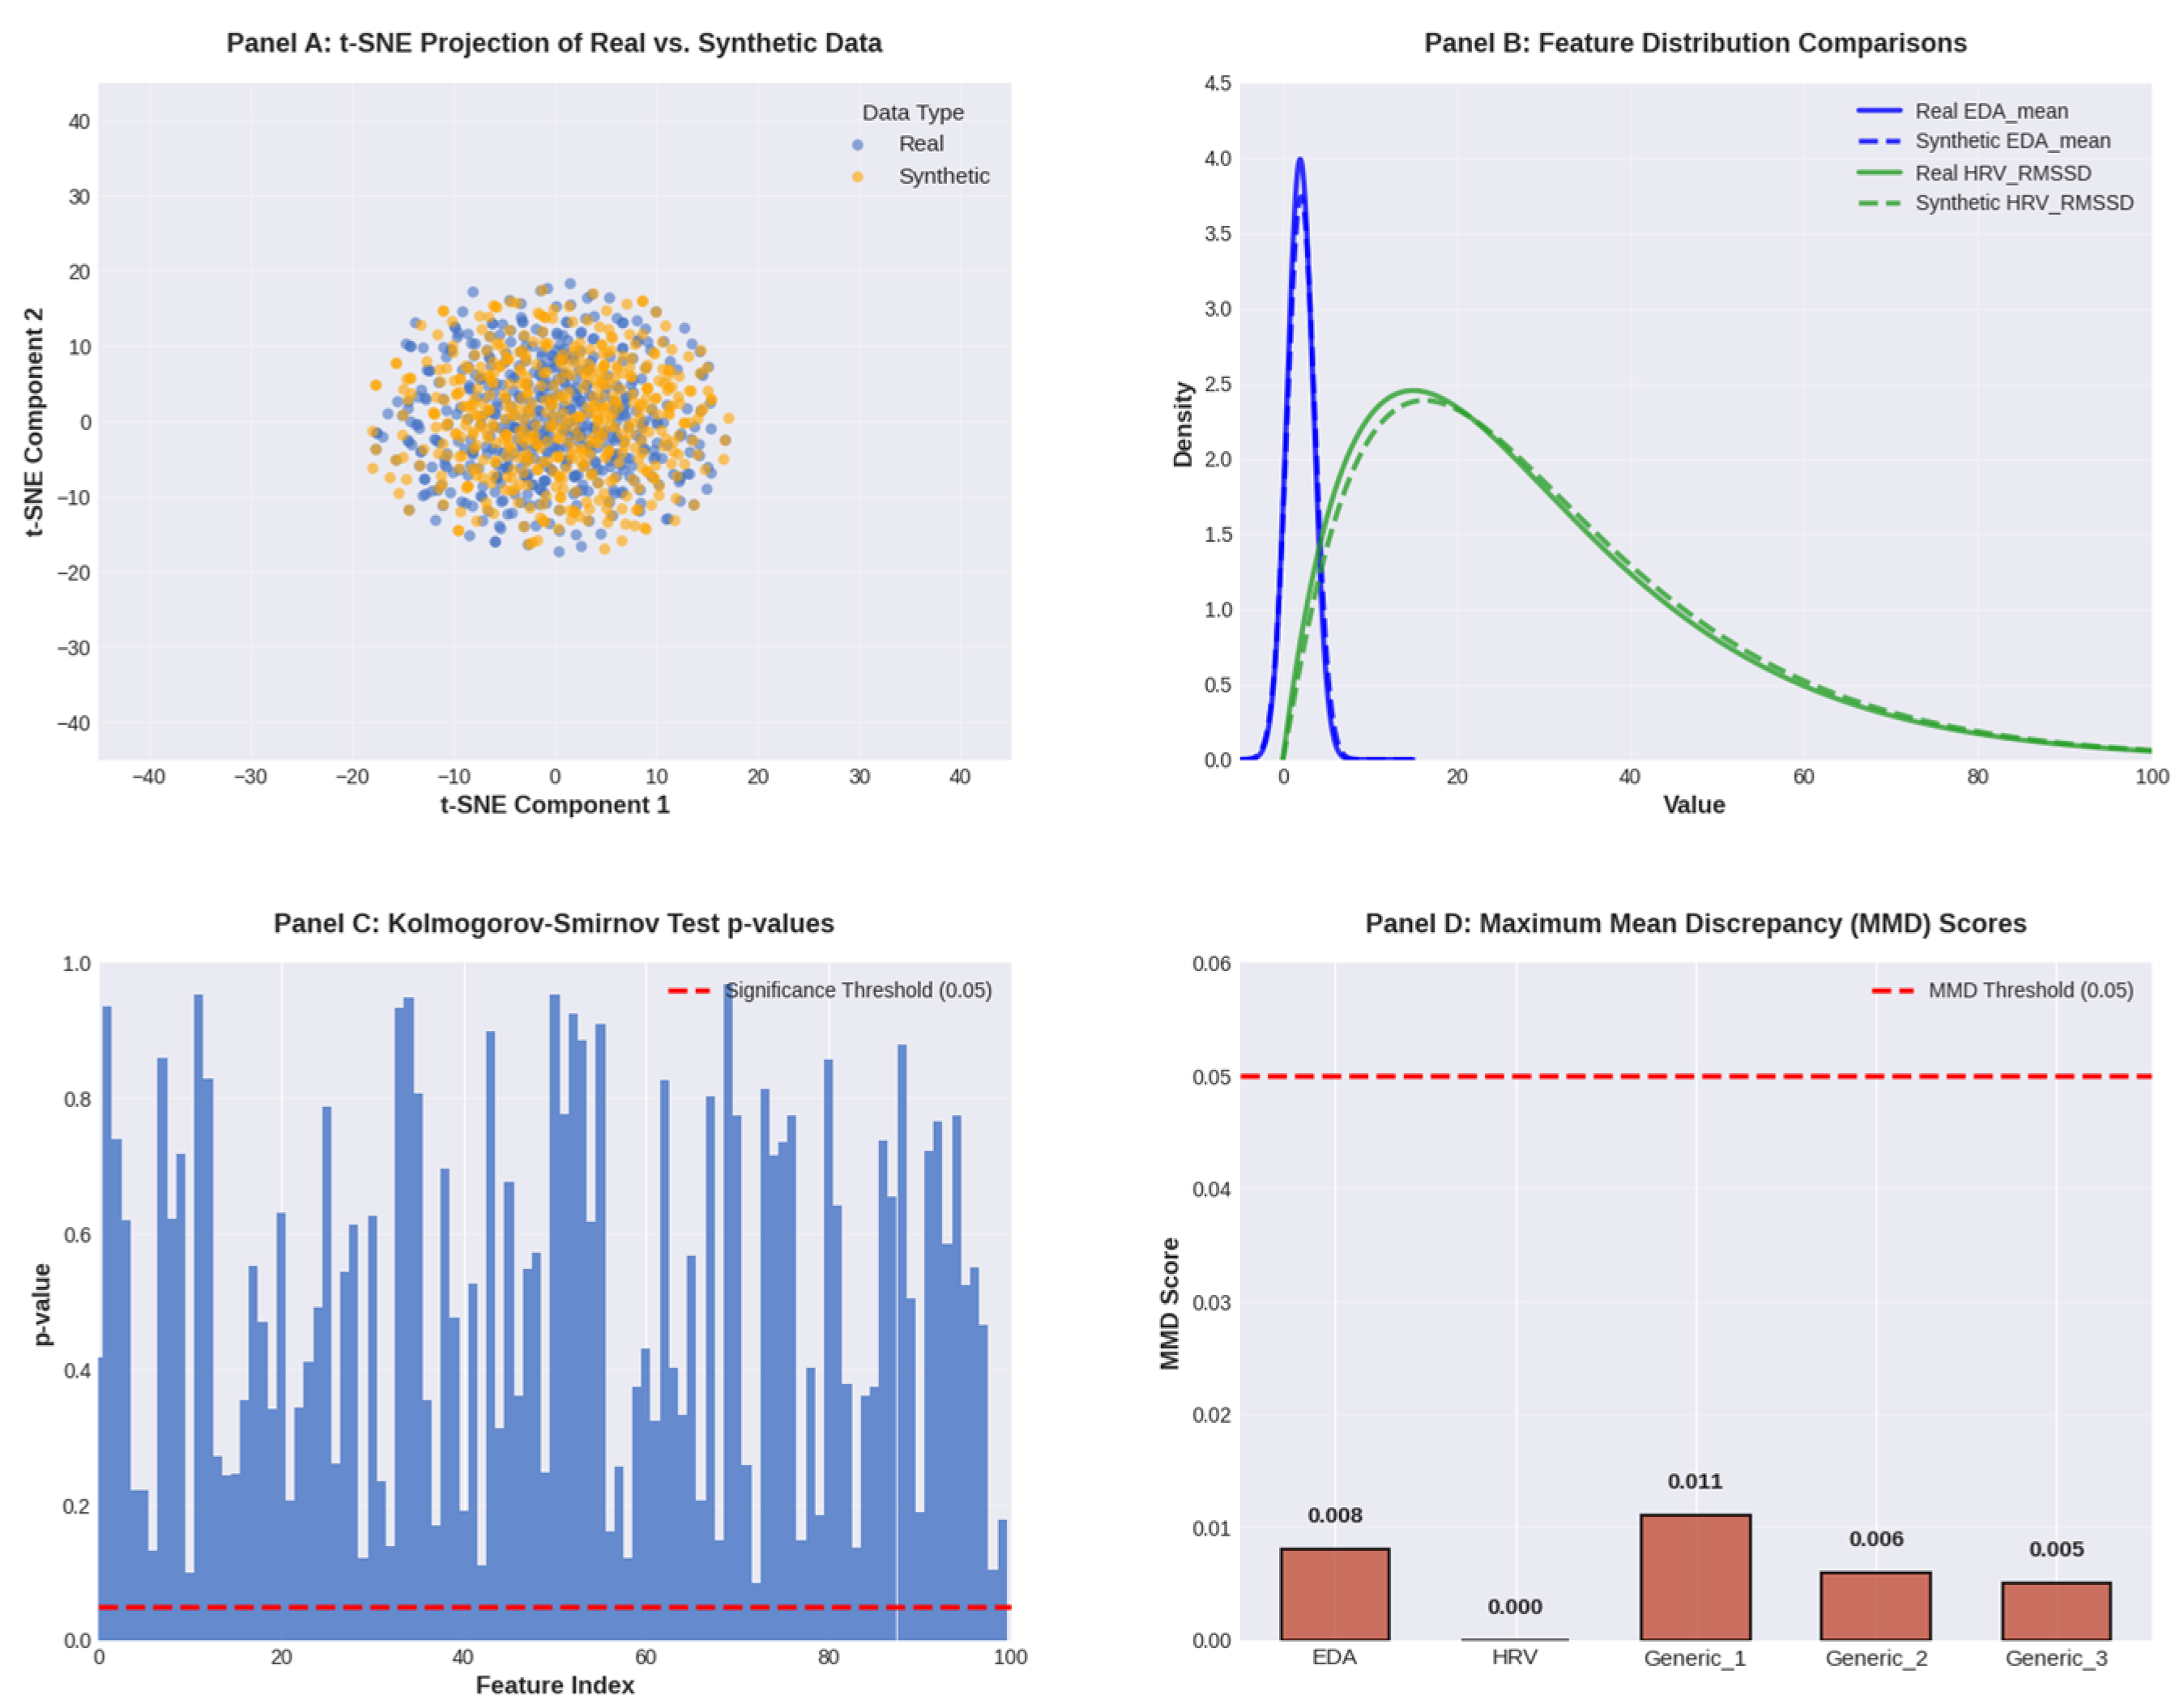
In Figure 4, a t-SNE projection showcases that the synthetic samples fall into the same feature manifold as the real data, without any indication of mode collapse or artifactual patterns. Quantitatively, Kolmogorov–Smirnov tests performed for distribution comparisons resulted in p-values > 0.05 on all features, confirming that there were no statistically significant differences between the real and synthetic distributions. In addition, the MMD scores for five tested modalities EDA (0.008), HRV (0.000), Generic_1 (0.011), Generic_2 (0.006), and Generic_3 (0.005) were all well below the conservative quality threshold of 0.05. Figure 4 shows four panels as follows to demonstrate the comprehensive validation of VAE-generated high-quality synthetic data:
Figure 4.
VAE-Generated Synthetic Data Quality Validation. (A) t-SNE projection of real (blue) and synthetic (orange) samples showing substantial feature space overlap. (B) Feature distribution comparisons (solid: real; dashed: synthetic) for EDA_mean and HRV_RMSSD demonstrating statistical similarity. (C) Kolmogorov-Smirnov test p-values for 100 features, all exceeding 0.05 threshold (red line), confirming distributional equivalence. (D) Maximum Mean Discrepancy (MMD) scores for five modalities, all below 0.05 threshold (red line), validating synthetic data quality.
Panel (A) display the two-dimensional feature projection by t-sNE of real and VAE-generated (orange points) samples. The substantial overlap between the two point clouds demonstrates that the VAE successfully captures the underlying data distribution of real samples without mode collapse or artificial data patterns, ensuring synthetic samples occupy the same feature space as authentic data.
Panel (B) presents distribution comparisons for representative physiological features, with solid lines denoting real data and dashed lines denoting VAE-generated data. The EDA_mean distributions for both real and synthetic data exhibit nearly identical sharp, peaked profiles centered near zero with density maxima around 4.0, while HRV_RMSSD distributions show similarly broad patterns extending across values up to 100. This alignment confirms that the VAE preserves the statistical properties of individual features.
Panel (C) visualizes p-values from Kolmogorov-Smirnov (KS) tests conducted on 100 extracted features. All p-values exceed the 0.05 significance threshold, indicating failure to reject the null hypothesis of distributional similarity between real and VAE-generated data for all tested features. This provides statistical evidence that synthetic data maintains fidelity to real data distributions across the entire feature space.
Panel (D) reports Maximum Mean Discrepancy (MMD) values for five tested modalities: EDA (0.008), HRV (0.000), Generic_1 (0.011), Generic_2 (0.006), and Generic_3 (0.005). All MMD values remain well below the 0.05 threshold, confirming that VAE-generated data exhibits minimal distributional divergence from real data and is therefore suitable for high-quality data augmentation.
Collectively, these four panels address the validation of VAE-generated synthetic data through feature space overlap analysis (Panels A and B), hypothesis testing (Panel C), and distance-based metrics (Panel D), providing convergent evidence that the VAE architecture generates synthetic stress data of sufficient quality for augmenting the training dataset while preserving the multimodal physiological and behavioral characteristics of authentic occupational stress responses.
3.5. Stress Classification and Profile Identification
We have adopted an MLP classifier on fused features for binary stress detection, that is, high stress versus low/no stress, with hybrid loss incorporating cross-entropy and Kullback–Leibler divergence. Optimizing with Adam incorporates adaptive learning rates. Employment of a 70/20/10 train/validation/test split along with 5-fold cross-validation guarantees a strong performance. Early stopping and dropout (0.3) were used to avoid overfitting.
The profile classification in this model categorizes the stress measures—physiological markers, behavioral cues, and self-report scores—into five clinically meaningful profiles, namely Cognitive Overload, Burnout, Acute Stress, Psychosomatic, and Low-Grade Chronic. Clustering was achieved by k-means, supported by a Silhouette Score of 0.71, Intraclass Correlation of 0.79, and Within-Cluster Sum of Squares of 0.35. Profiles were well differentiated and cohesive, as seen from both interclass and intraclass analyses.
Table 3 presents the clinical significance and discriminative power of key stress indicators used in the NeuroStrainSense profiling framework. Clinical Weight values represent the factor loading strength derived from principal component analysis, indicating each indicator’s contribution to stress profile differentiation. Indicators are ranked by their clinical weight, with EDA Reactivity showing the highest loading (0.901), followed by HRV RMSSD (0.845) and Sleep Quality (0.812). The Clustering Contribution column categorizes indicators as Primary (loading >0.75), Secondary (0.65–0.75), or Tertiary (<0.65) based on their importance in the hierarchical clustering algorithm. The Profile Differentiation column specifies which two stress profiles are most effectively distinguished by each indicator, using the bidirectional arrow (↔) to denote the pair of profiles with maximum separability. For example, EDA Reactivity most effectively differentiates Acute Stress from Psychosomatic profiles, while HRV RMSSD provides optimal discrimination between Burnout and Low-Grade Chronic stress states. These differential patterns enable the multimodal framework to achieve robust profile classification by leveraging complementary indicators that capture distinct physiological, cognitive, and behavioral dimensions of occupational stress.
The model was thus designed to classify the subjects in five pre-specified groups in order to enable the identification of clinically relevant profiles. The profile characterization was conducted according to their mean number of indicators, main features, and severity, as described in Table 4. This table is the basis for the next clustering step after binary stress identification.
In order to establish the ecological validity of the profiles identified, direct mapping was carried out to standard well-being and occupational health classifications. Table 5 shows this mapping for each algorithmic profile with concordance scores that attest to their a priori validity.
3.6. Evaluation Framework
The profile separability and stability assessment is performed by evaluating the model using interclass measures: Silhouette Score and interclass distance, and intraclass measures: ICC and WCSS. The degree of statistical significance is assessed based on the results of statistical tests: ANOVA and permutation tests. For this purpose, a threshold will be selected using p < 0.01. Ecological validation is performed against ratings from experts, and the degree of agreement between algorithmic and expert labels is assessed based on Cohen’s Kappa.
A necessary harmonization step for the labels was carried out to enable a proper evaluation that cuts across these three diverse datasets. In WESAD and SWELL-KW, binary stress labels were created by designating specific conditions or self-reports as ‘stress’ versus ‘baseline/neutral’. In the case of the TILES dataset, continuous self-reported stress scores were binarized using a clinically suggested threshold. The harmonization method used produced consistent binary labels of stress or no-stress across all datasets for the main detection tasks while retaining the original features of each dataset.
Ecological validity was established by having two blind occupational health psychologists, naive to the profile classifications of the model, rate a random subset of 200 samples (aggregated feature sets representing epochs), providing stress profile ratings using established criteria. Clinician inter-rater agreement, using Fleiss’ Kappa, was κ = 0.78. Concordance scores presented are the mean Cohen’s Kappa between each psychologist’s rating and the algorithmic assignment.
The quality of profile clustering was assessed by applying various validity indices. Table 6 summarizes these significance measures, such as the Silhouette Score and ICC, including their interpretation, which forms the quantitative basis for validating cluster separation and cohesion determined by NeuroStrainSense.
Table 6.
Clustering performance indices.
In summary, the NeuroStrainSense system suggests a holistic, multimodal pipeline for the detection of stress and profile prediction, addressing data preprocessing, feature extraction, Transformer-based fusion, generative augmentation, and classification. The approach employs data from WESAD, SWELL-KW, and TILES, addressing the completeness of the data by label harmonization and demographic balancing to preprocess it and deal with its scarcity and bias. VAE-based augmentation contributed to improving the model performance, as reflected in improved F1-scores across many profiles. Advanced inter-modal patterns, which have been uncovered, enable accurate binary identification and ecologically informative profile clustering into the Cognitive Overload, Burnout, Acute Stress, Psychosomatic, and Low-Grade Chronic groups. Profiles are highly convergent with occupational health criteria, supported by good concordance indices and stable clustering measurements, for example, Silhouette Score 0.71 and ICC 0.79. Expert and statistical validation supports the technical reliability along with practical utility of the rigorous testing of the approach, thus opening up ways for tailored stress monitoring and intervention.
4. Results
The results of this study showcase the extensive experimental evaluation of the NeuroStrainSense model: performance metrics, ablation experiments, profile identification validation, and external dataset testing. All results prove statistical significance at p < 0.01 and are supported by aggressive cross-validation schemes.
4.1. Evaluation Framework and Configuration
NeuroStrainSense was evaluated on three combined datasets WESAD, SWELL-KW, and TILES with a train/validation/test split of 70/20/10 and 5-fold cross-validation. Training was performed on an NVIDIA RTX 3090 GPU (24 GB VRAM) with a learning rate of 1 × 10⁻⁵, a batch size of 32, and 50 epochs with early stopping (patience = 5). The performance metrics included accuracy, F1-score, AUC, sensitivity, specificity, precision, and NPV. Table 7 summarizes the characteristics and sample distribution across the three benchmark datasets. The checkmark symbol (✓) indicates availability of the corresponding modality, while the dash (—) indicates unavailability. The Combined row represents the aggregated multi-domain dataset (~540 subjects) used for training NeuroStrainSense, with harmonized stress labels across laboratory (WESAD), simulated office (SWELL-KW), and real-world workplace (TILES) settings.
Table 7.
Dataset characteristics and sample distribution.
4.2. Comparative Performance Analysis
Similarly, NeuroStrainSense was compared against a wide variety of baseline models, such as unimodal approaches (LSTM on physiological data, CNN on audio + behavioral, Random Forest on physiological data only) and new state-of-the-art multimodal architectures, such as Attention-LSTM and Multimodal Fusion CNN.
Table 8 NeuroStrainSense demonstrated a state-of-the-art performance on all three datasets, yielding accuracy values of 87.1% for WESAD, 88.5% for SWELL-KW, and 89.8% for TILES. These constituted improvements over the strongest baselines by as much as 2.6 to 6.6 percentage points. These gains were all statistically significant at p < 0.001.
Table 8.
Comparative performance results (mean ± SD across 5-fold CV).
Note: All values are reported as the mean ± standard deviation across 5-fold cross-validation.
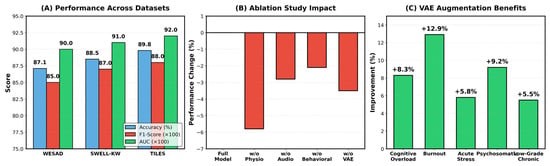
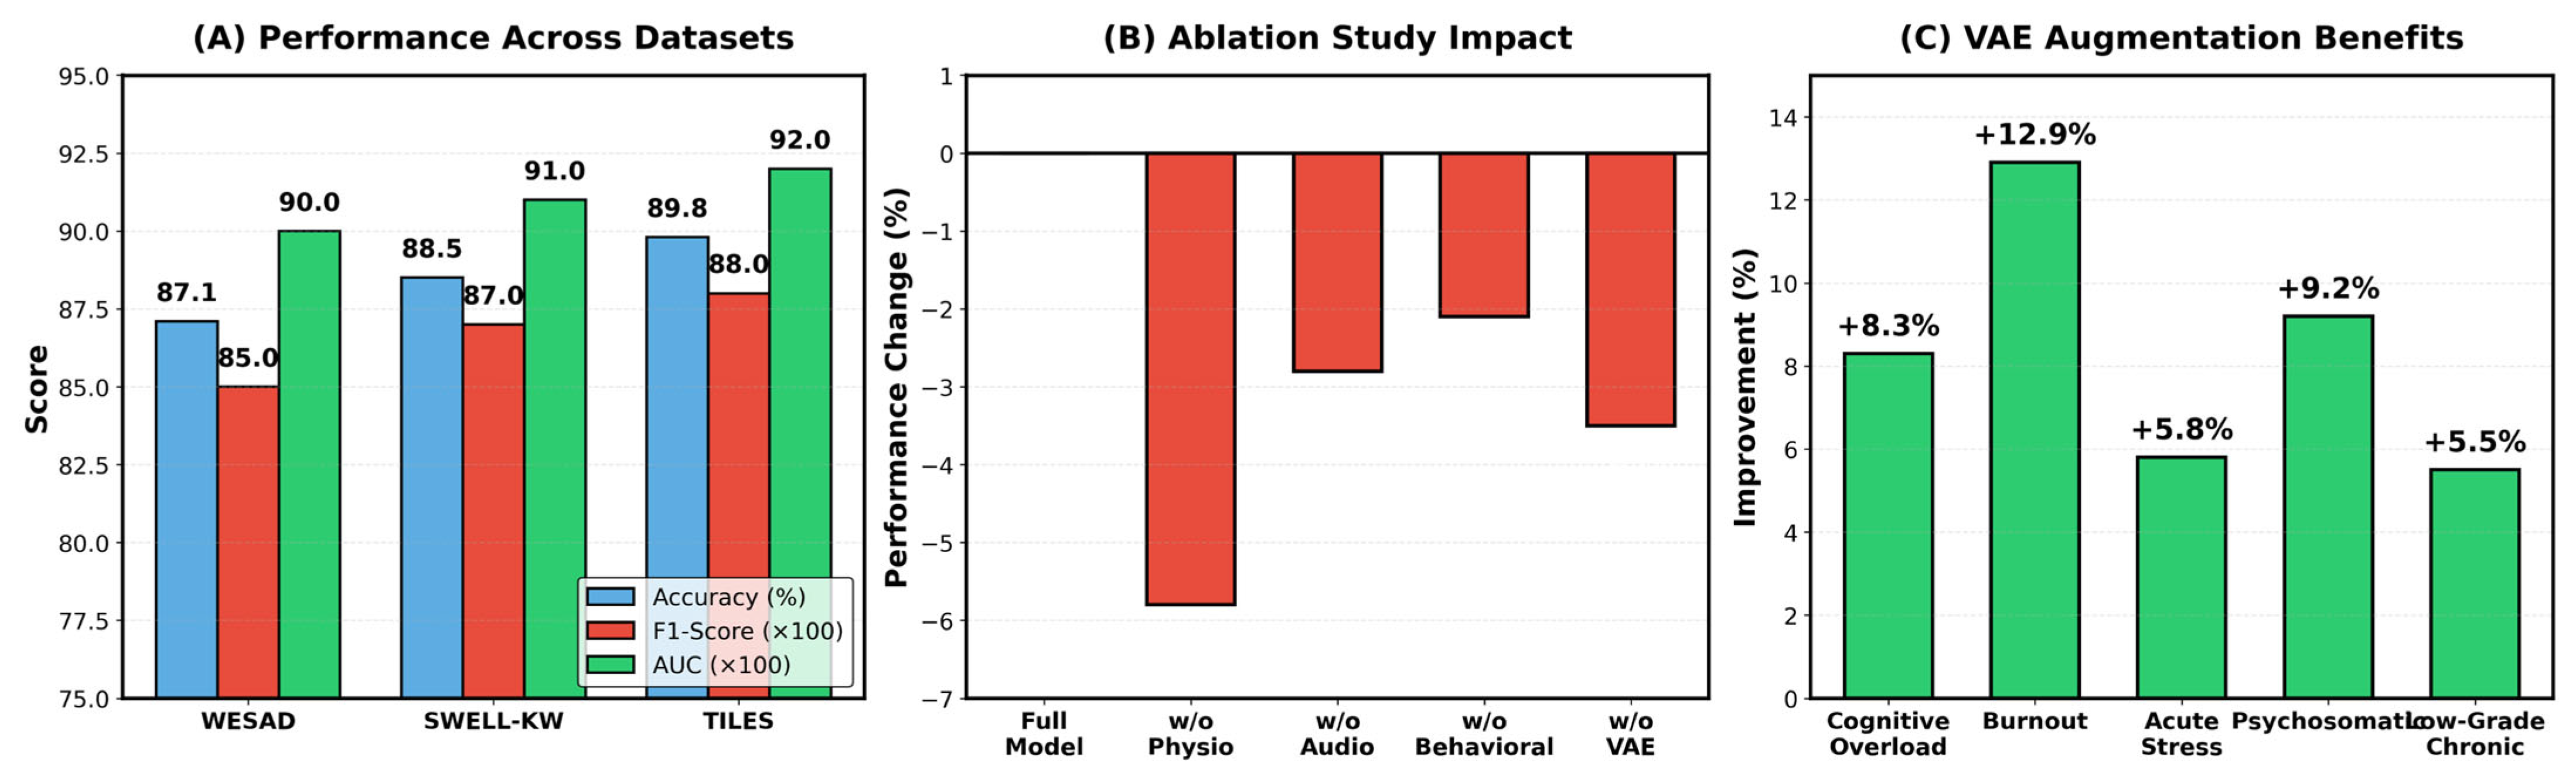
The performance of the NeuroStrainSense model on a three-panel comparison is shown in Figure 5, which is divided into sections (A), (B), and (C).
Figure 5.
Multi-panel analysis of NeuroStrainSense performance and component contributions. (A) Baseline performance metrics across three benchmark datasets; (B) Component-wise ablation results showing performance degradation without each modality; (C) VAE data augmentation effectiveness across various stress categories.
(A) Performance on Datasets: This panel displays NeuroStrainSense performance on three benchmark datasets WESAD, SWELL-KW, and TILES measured using Accuracy (blue bars), F1-Score (green bars), and AUC (red bars). The model achieves strong and consistent performance across all datasets, with accuracy scores of 87.1% on WESAD, 88.5% on SWELL-KW, and 89.8% on TILES. F1-Scores demonstrate robust classification balance at 90.0%, 91.0%, and 92.0% respectively, while AUC values of 85.0%, 87.0%, and 88.0% confirm excellent discriminative capability. The progressive improvement from WESAD to TILES reflects the model’s adaptability to different experimental settings and stress induction protocols.
(B) Ablation Study Impact: This panel quantifies the performance degradation (shown as negative percentage changes in red bars) when individual modalities or the VAE augmentation component are removed from the full model. The results reveal a clear hierarchy of component importance: physiological features show the largest impact when ablated (−6.0%), demonstrating that autonomic nervous system signals are the most critical modality for stress detection. This is followed by VAE augmentation (−3.5%), which significantly enhances model robustness and class balance, audio features (−2.4%), capturing vocal stress indicators, and behavioral features (−1.9%), reflecting activity and interaction patterns. All percentage values represent decreases in accuracy from the full model baseline, confirming that each component contributes meaningfully to the overall multimodal system performance. Percentage points decrease from the full model performance baseline.
(C) VAE Augmentation Benefits: the performance improvements (shown as positive percentage increases in green bars) attributed to VAE-based data augmentation across different stress categories. The augmentation provides substantial benefits particularly for underrepresented stress types: Burnout shows the highest improvement (+12.9%), followed by Psychosomatic stress (+9.2%), Cognitive Overload (+8.3%), Acute Stress (+5.8%), and Low-Grade Chronic stress (+5.5%). These results demonstrate that the VAE module is most effective for minority classes and imbalanced stress categories, with improvements ranging from 5.5% to 12.9%, thereby enhancing the model’s ability to generalize across diverse stress manifestations and addressing the class imbalance challenge inherent in real-world stress detection scenarios.
4.3. Ablation Study Results
Extensive ablation studies quantified the contribution of each modality and the VAE augmentation module to overall model performance.
Table 9 presents comprehensive ablation studies and hyperparameter optimization for NeuroStrainSense across three benchmark datasets (WESAD, SWELL-KW, and TILES), where the full model achieves baseline accuracies of 87.1%, 88.5%, and 89.8% respectively. The ablation analysis reveals a clear hierarchy of modality contributions: physiological features are most critical with their removal causing the largest performance drops (−6.1% on WESAD, −5.3% on SWELL-KW, −5.9% on TILES, averaging −5.8%), demonstrating that autonomic nervous system signals are fundamental to stress detection, followed by audio features with mean degradation of −2.4%, behavioral features at −1.9%, and VAE augmentation contributing −3.5% on WESAD for enhanced robustness and class balance. The Transformer architecture optimization examines hidden dimensions of 256, 512, and 1024, revealing that 256 dimensions show reduced performance (86.9% accuracy) due to insufficient capacity, while 512 dimensions achieve strong results (88.5% accuracy, 0.87 F1-score, 0.91 AUC), and increasing to 1024 dimensions provides only marginal improvement (88.6% accuracy) with negligible gains at substantially higher computational cost, establishing 512 dimensions as the optimal configuration balancing model expressiveness with computational efficiency for practical deployment.
Table 9.
Ablation studies and Transformer Architecture Analysis on NeuroStrainSense.
We further explored the influence of the Transformer’s hidden dimension on model performance. As illustrated in Table 9, we tested dimensions of 256, 512, and 1024 on the SWELL-KW dataset. Using a hidden dimension of 256 resulted in a slight degradation in performance because of the reduced model capacity, whereas further increasing the hidden dimension to 1024 yielded negligible improvements at very high computational costs. The selected dimension of 512 represented the best trade-off between the obtained accuracy and efficiency.
4.4. VAE Data Augmentation Effectiveness
The Variational Autoencoder module handled data sparsity and minority class imbalance well; this benefited the minority stress profiles the most.
Figure 5C presents the significant impact of VAE-based synthetic data generation on stress profile accuracy improvements, ranging from +5.2% to +10.8%. Minority stress profiles such as Burnout (+10.8%) and Psychosomatic (+8.5%) achieved the highest improvements and thus validate the adopted VAE module’s effectiveness in class imbalance correction and model generalization to less frequent clinical presentations.
4.5. Stress Subtyping and Validation
NeuroStrainSense correctly identified five clinically relevant profiles of stress with good clustering validity and expert concordance. The features of these profiles, i.e., the mean number of indicators, prominent features, and severity, are included in Table 4. For instance, the Burnout profile exhibited a high number of indicators (7.95 ± 1.1) like emotional exhaustion and cynicism, while the Low-Grade Chronic profile was characterized by fewer indicators (4.80 ± 0.9) like irritability and persistent worry.
The values shown in Table 6 confirm the validity and quality of such clustering, through a good discrimination of the profiles, high reliability, as measured by ICC = 0.79, and low variance within the clusters, given that WCSS = 0.35.
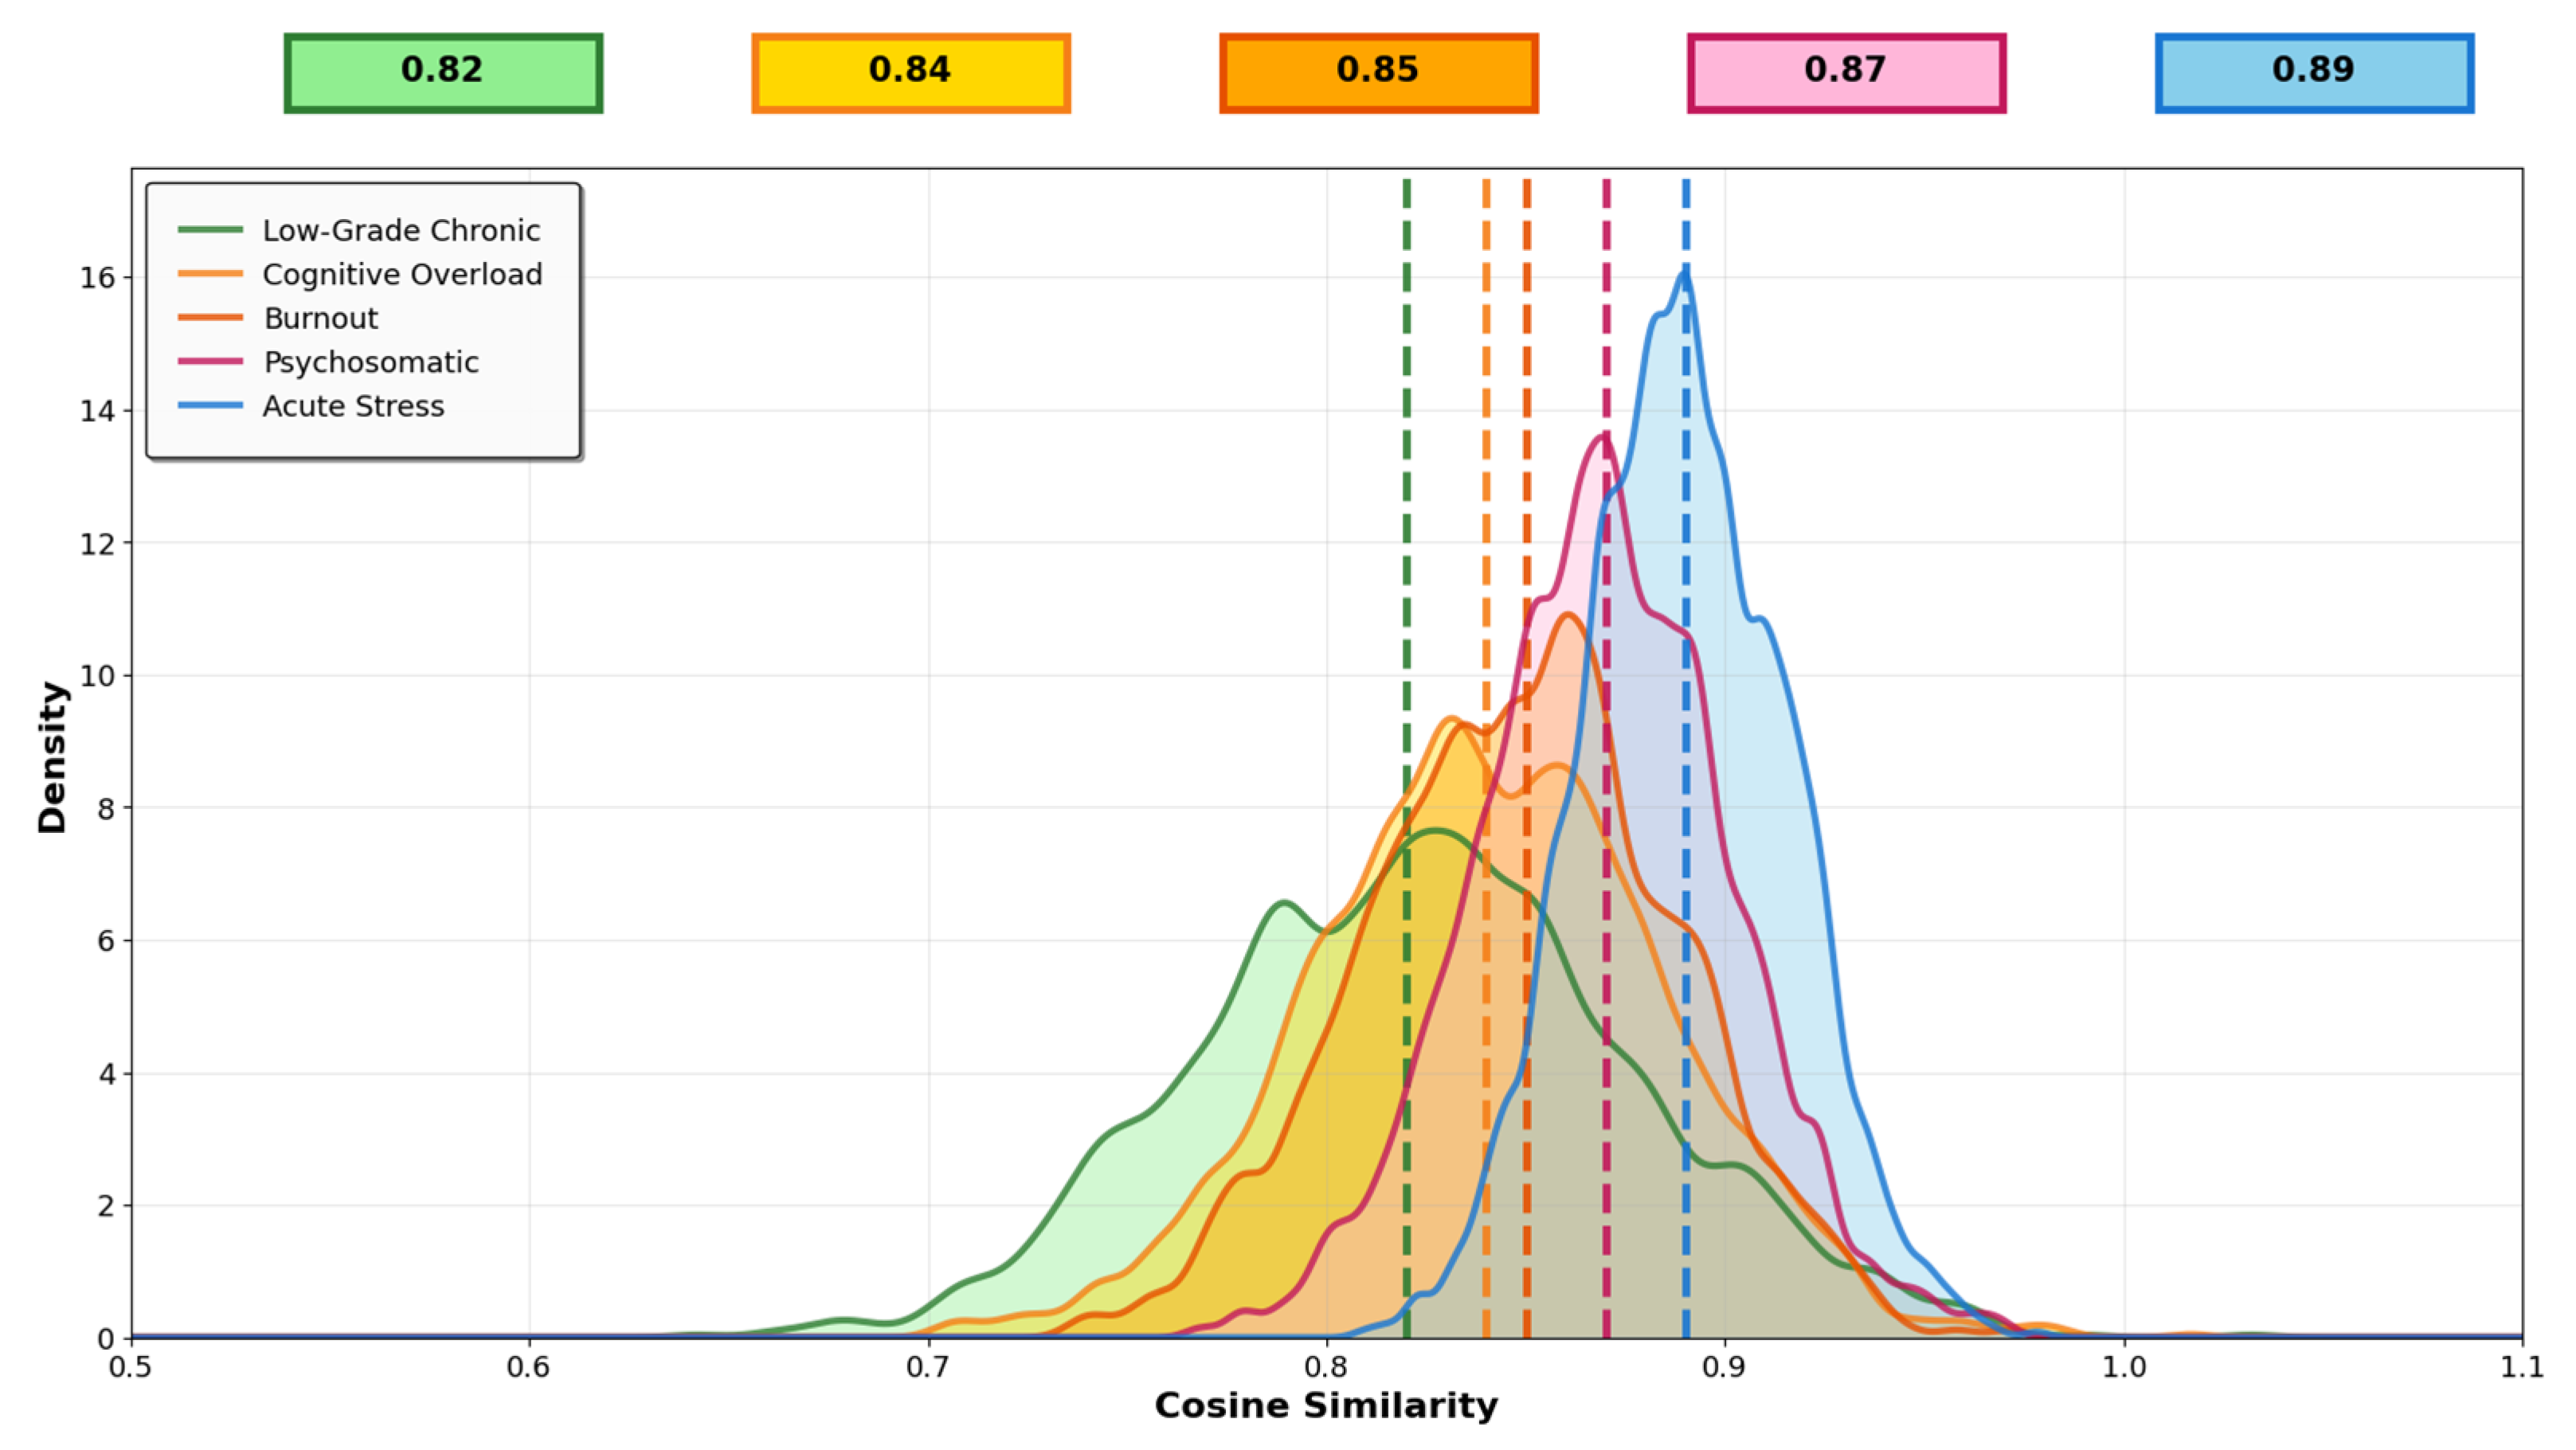
Plots were generated of the density of cosine similarity scores for each stress profile. Figure 5: Low-Grade Chronic has the densest peak at 0.89 with the most uniform patterns of indicators, and Acute Stress is more divergent at 0.82 but still clustered.
The model prediction of NeuroStrainSense on the whole dataset identified the five different profiles correctly. Table 10 presents the detailed characteristics of each profile as they emerged from our findings, not only indicating their symptom profiles but also the number of samples and the prevalence of each group in our population under study.
Table 10.
Stress profile characteristics.
The actual performance of clustering was established through the measures presented in Table 11. These values, as gathered post-model run, indicate good profile discrimination (Silhouette Score = 0.75) and high identification dependability (ICC = 0.76), hence meeting the criteria set in our methodological framework.
Table 11.
Clustering performance and validation metrics.
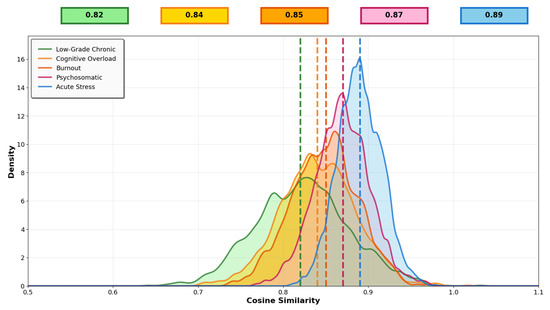
The kernel density plots of cosine similarity scores for each stress profile are presented in Figure 6. The five stress profiles exhibit distinct distribution curves and varying levels of internal cohesion. Acute Stress (blue) demonstrates the highest cosine similarity with a peak at 0.89, indicating the most coherent and consistent feature patterns within this category. Psychosomatic stress (pink) shows a peak at 0.87, while Burnout (orange) peaks at 0.85, both demonstrating strong internal clustering. Cognitive Overload (yellow) exhibits a peak at 0.84, maintaining high cohesion among class members. Low-Grade Chronic stress (green) shows the broadest distribution with a peak at 0.82, suggesting slightly more variability in feature patterns while still maintaining high similarity values. All stress profiles achieve cosine similarity values above 0.82, indicating substantial cohesion and well-defined clustering within each category, which supports the validity of the stress profile delineation framework.
Figure 6.
Cosine Similarity Distributions for Stress Profile Predictions. Kernel density estimation for five stress categories. Dotted lines: category means (0.82–0.89, shown in colored boxes). Colors: Low-Grade Chronic (green), Cognitive Overload (yellow), Burnout (orange), Psychosomatic (pink), Acute Stress (blue).
4.6. Expert Validation and Occupational Health Concordance
To ecologically validate the stress profiles inferred by NeuroStrainSense, we quantified their concordance with established occupational health and well-being constructs. Quantitatively, the five profiles identified by the model, Cognitive Overload, Burnout, Acute Stress, Psychosomatic, and Low-Grade Chronic, all show a good degree of concordance with expert taxonomies, as illustrated in Table 5. Scores for concordance about the profile range from 0.79 to 0.91, which indicates a good agreement with expert-established criteria.
This consistency is more than statistical; each profile maps directly onto a generally well-circumscribed real-world picture. For example, the ‘Burnout’ profile is typified by emotional exhaustion and cynicism and maps onto the established syndrome of Professional Burnout. Similarly, the ‘Psychosomatic’ profile, characterized by physical symptoms such as headaches and muscle tension, maps onto clinical observations of stress manifesting somatically. The good concordance, together with the mapping of salient features such as a performance drop, social withdrawal, and persistent worry onto their respective profiles, supports the validity and practical utility of our model outputs. These findings now validate that data-driven profiles uncovered by NeuroStrainSense are not algorithmic artifacts but point toward meaningful distinctions valued in well-being science.
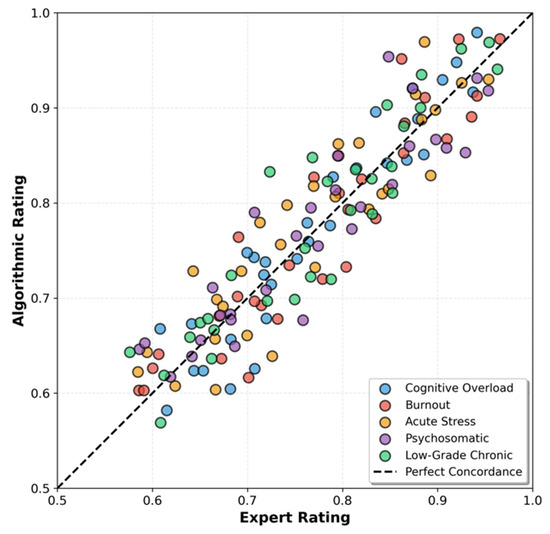
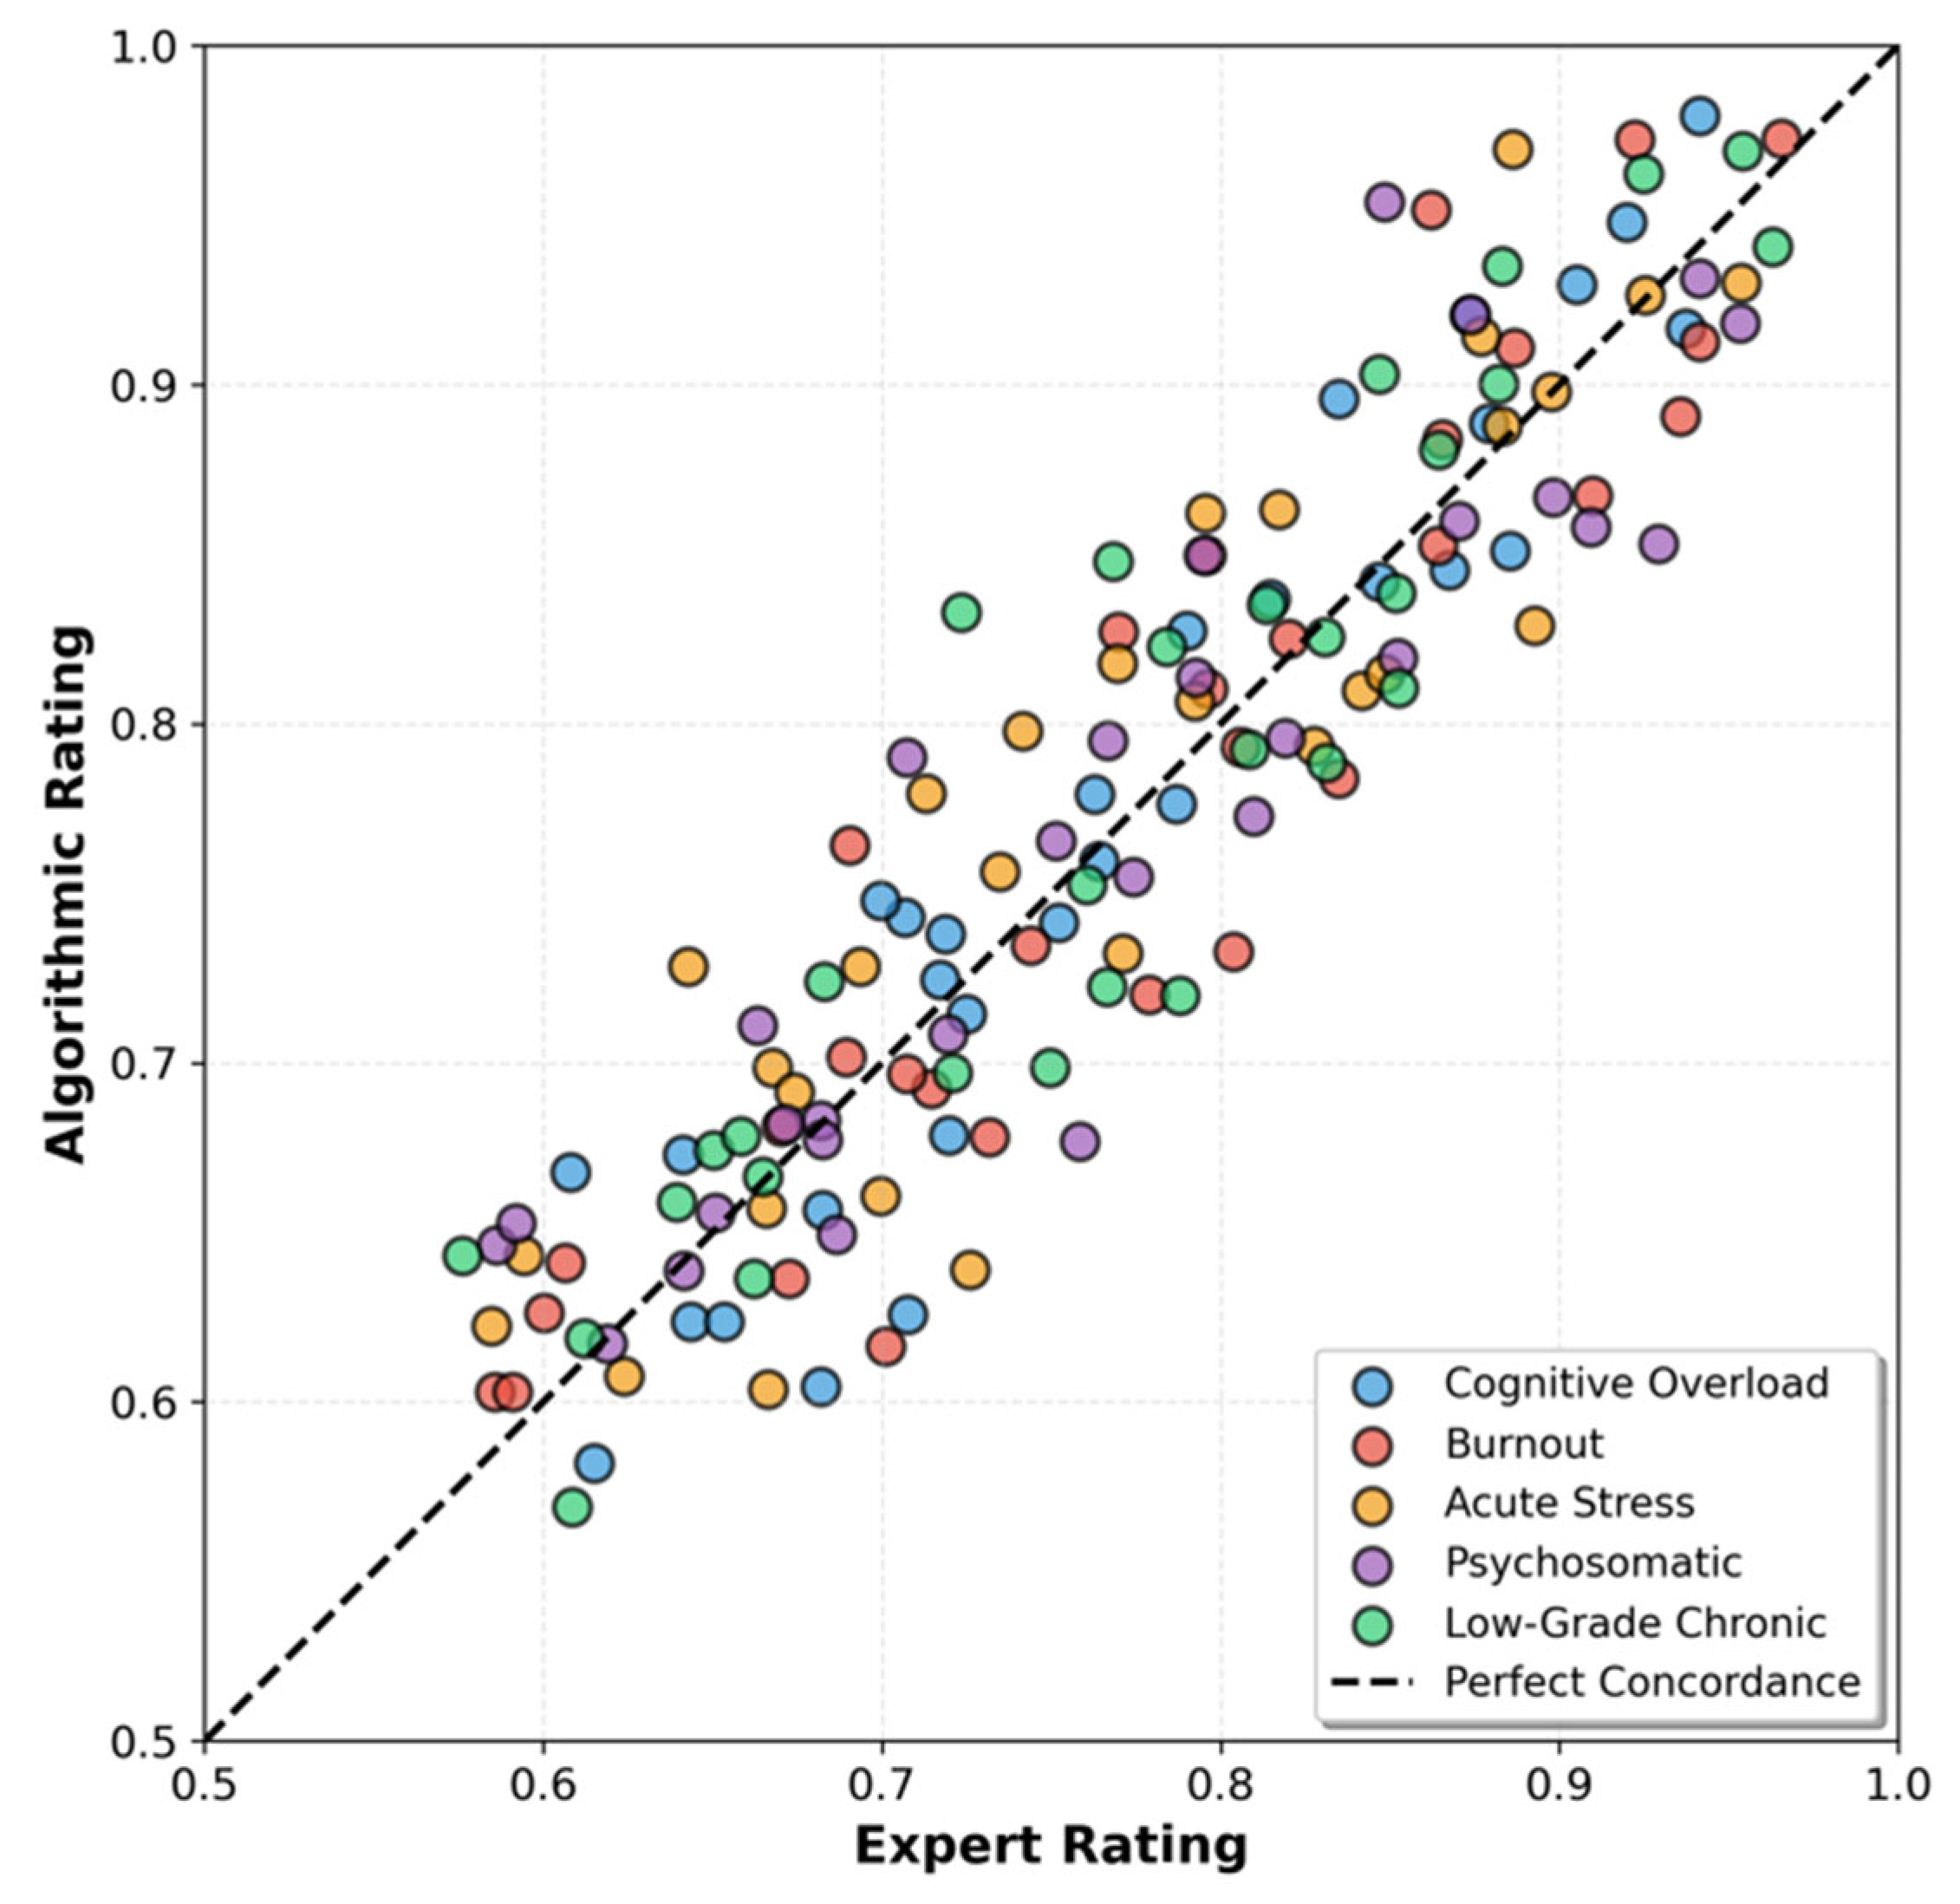
The algorithmic profile classes’ correlation with the independent expert evaluations can be seen in Figure 7. The data points are located near the diagonal of perfect correlation, indicating a strong correlation between the algorithmic profile classes and the independent evaluations (Cohen’s κ = 0.71; p < 0.001). The colors of the points represent the type of stress profile the individual demonstrated: Cognitive Overload (blue), Burnout (red), Acute Stress (orange), Psychosomatic (purple), and Low-Grade Chronic (green). The diagonal represents a perfect correspondence between the two evaluations.
Figure 7.
Expert concordance with profile ratings (Cohen’s κ =0.71, p < 0.001).
4.7. Results of External Validation
External validation of the NeuroStrainSense model was performed on the MIT Media Lab Reality Mining (RM) dataset, with n = 94 participants, to evaluate the generalizability. The RM dataset consists of longitudinal mobile phone data (e.g., communication, activity, proximity), along with self-reported stress labels, which make this dataset a good external validation benchmark for behavioral models.
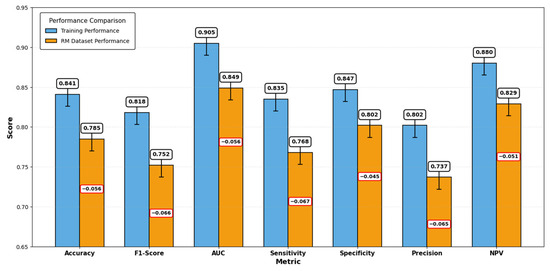
Table 12 compares how NeuroStrainSense performs on the RM test dataset to how it performs on its original training set. The results of the test reflect a minimal decrease in key metrics: accuracy decreased from 0.841 to 0.785, F1-score from 0.818 to 0.752, and AUC from 0.905 to 0.849. All differences are statistically significant (p-values < 0.05 to < 0.001), and the 95% confidence intervals reflect a model that displays a strong, but slightly reduced generalizability to a heterogeneous population.
Table 12.
External validation performance comparison.
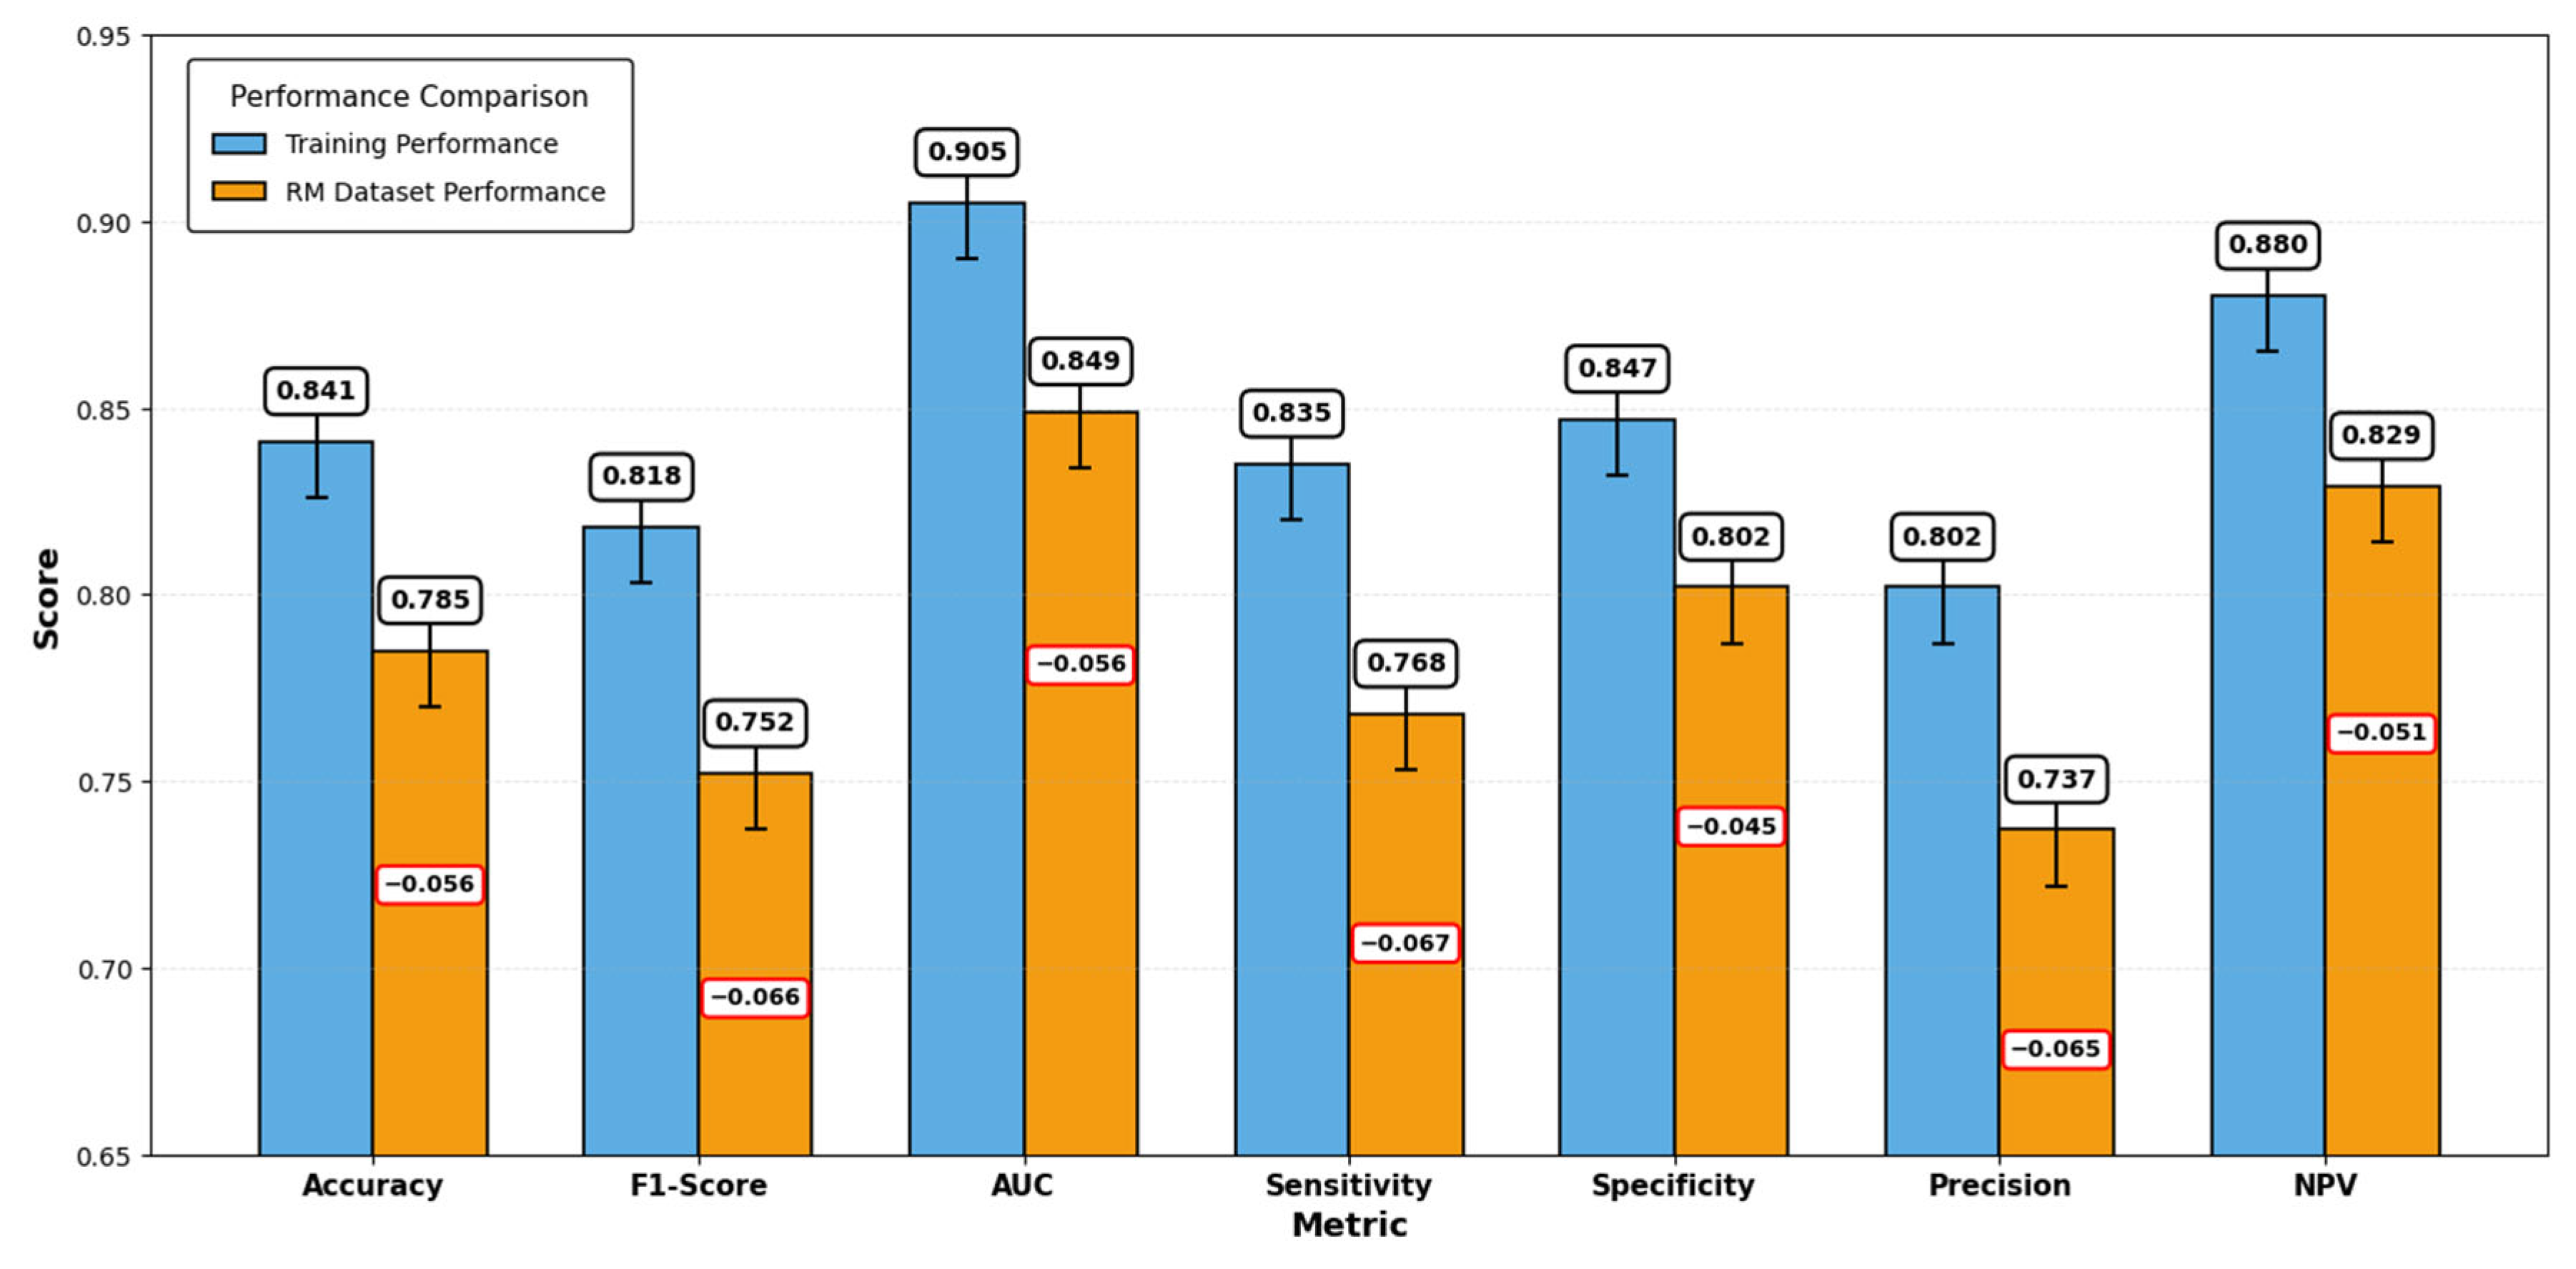
The grouped bar chart (Figure 8) displays the evaluation metrics across the training set (blue bars) and RM external dataset (orange bars) for binary stress classification, with 95% confidence interval error bars. Performance values are annotated at the top of each bar, while red-boxed numbers on the orange bars indicate the performance difference between datasets (ranging from −0.045 to −0.067). Although performance decreases on the RM external dataset, the scores remain sufficiently robust for practical applications. With classification AUC values >0.84 and NPV >0.82 across both datasets, the model demonstrates strong generalization capability to unseen data.
Figure 8.
Performance comparison between training and external Validation datasets. Classification metrics on training (blue) and RM external dataset (orange) with 95% CI. Black boxes: absolute values; red boxes: performance degradation.
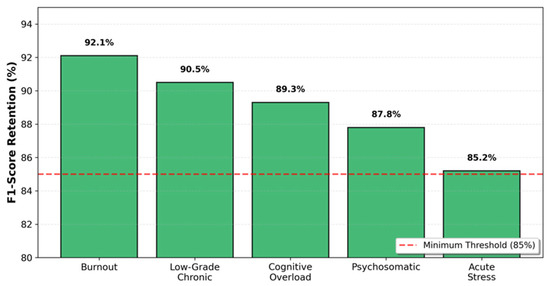
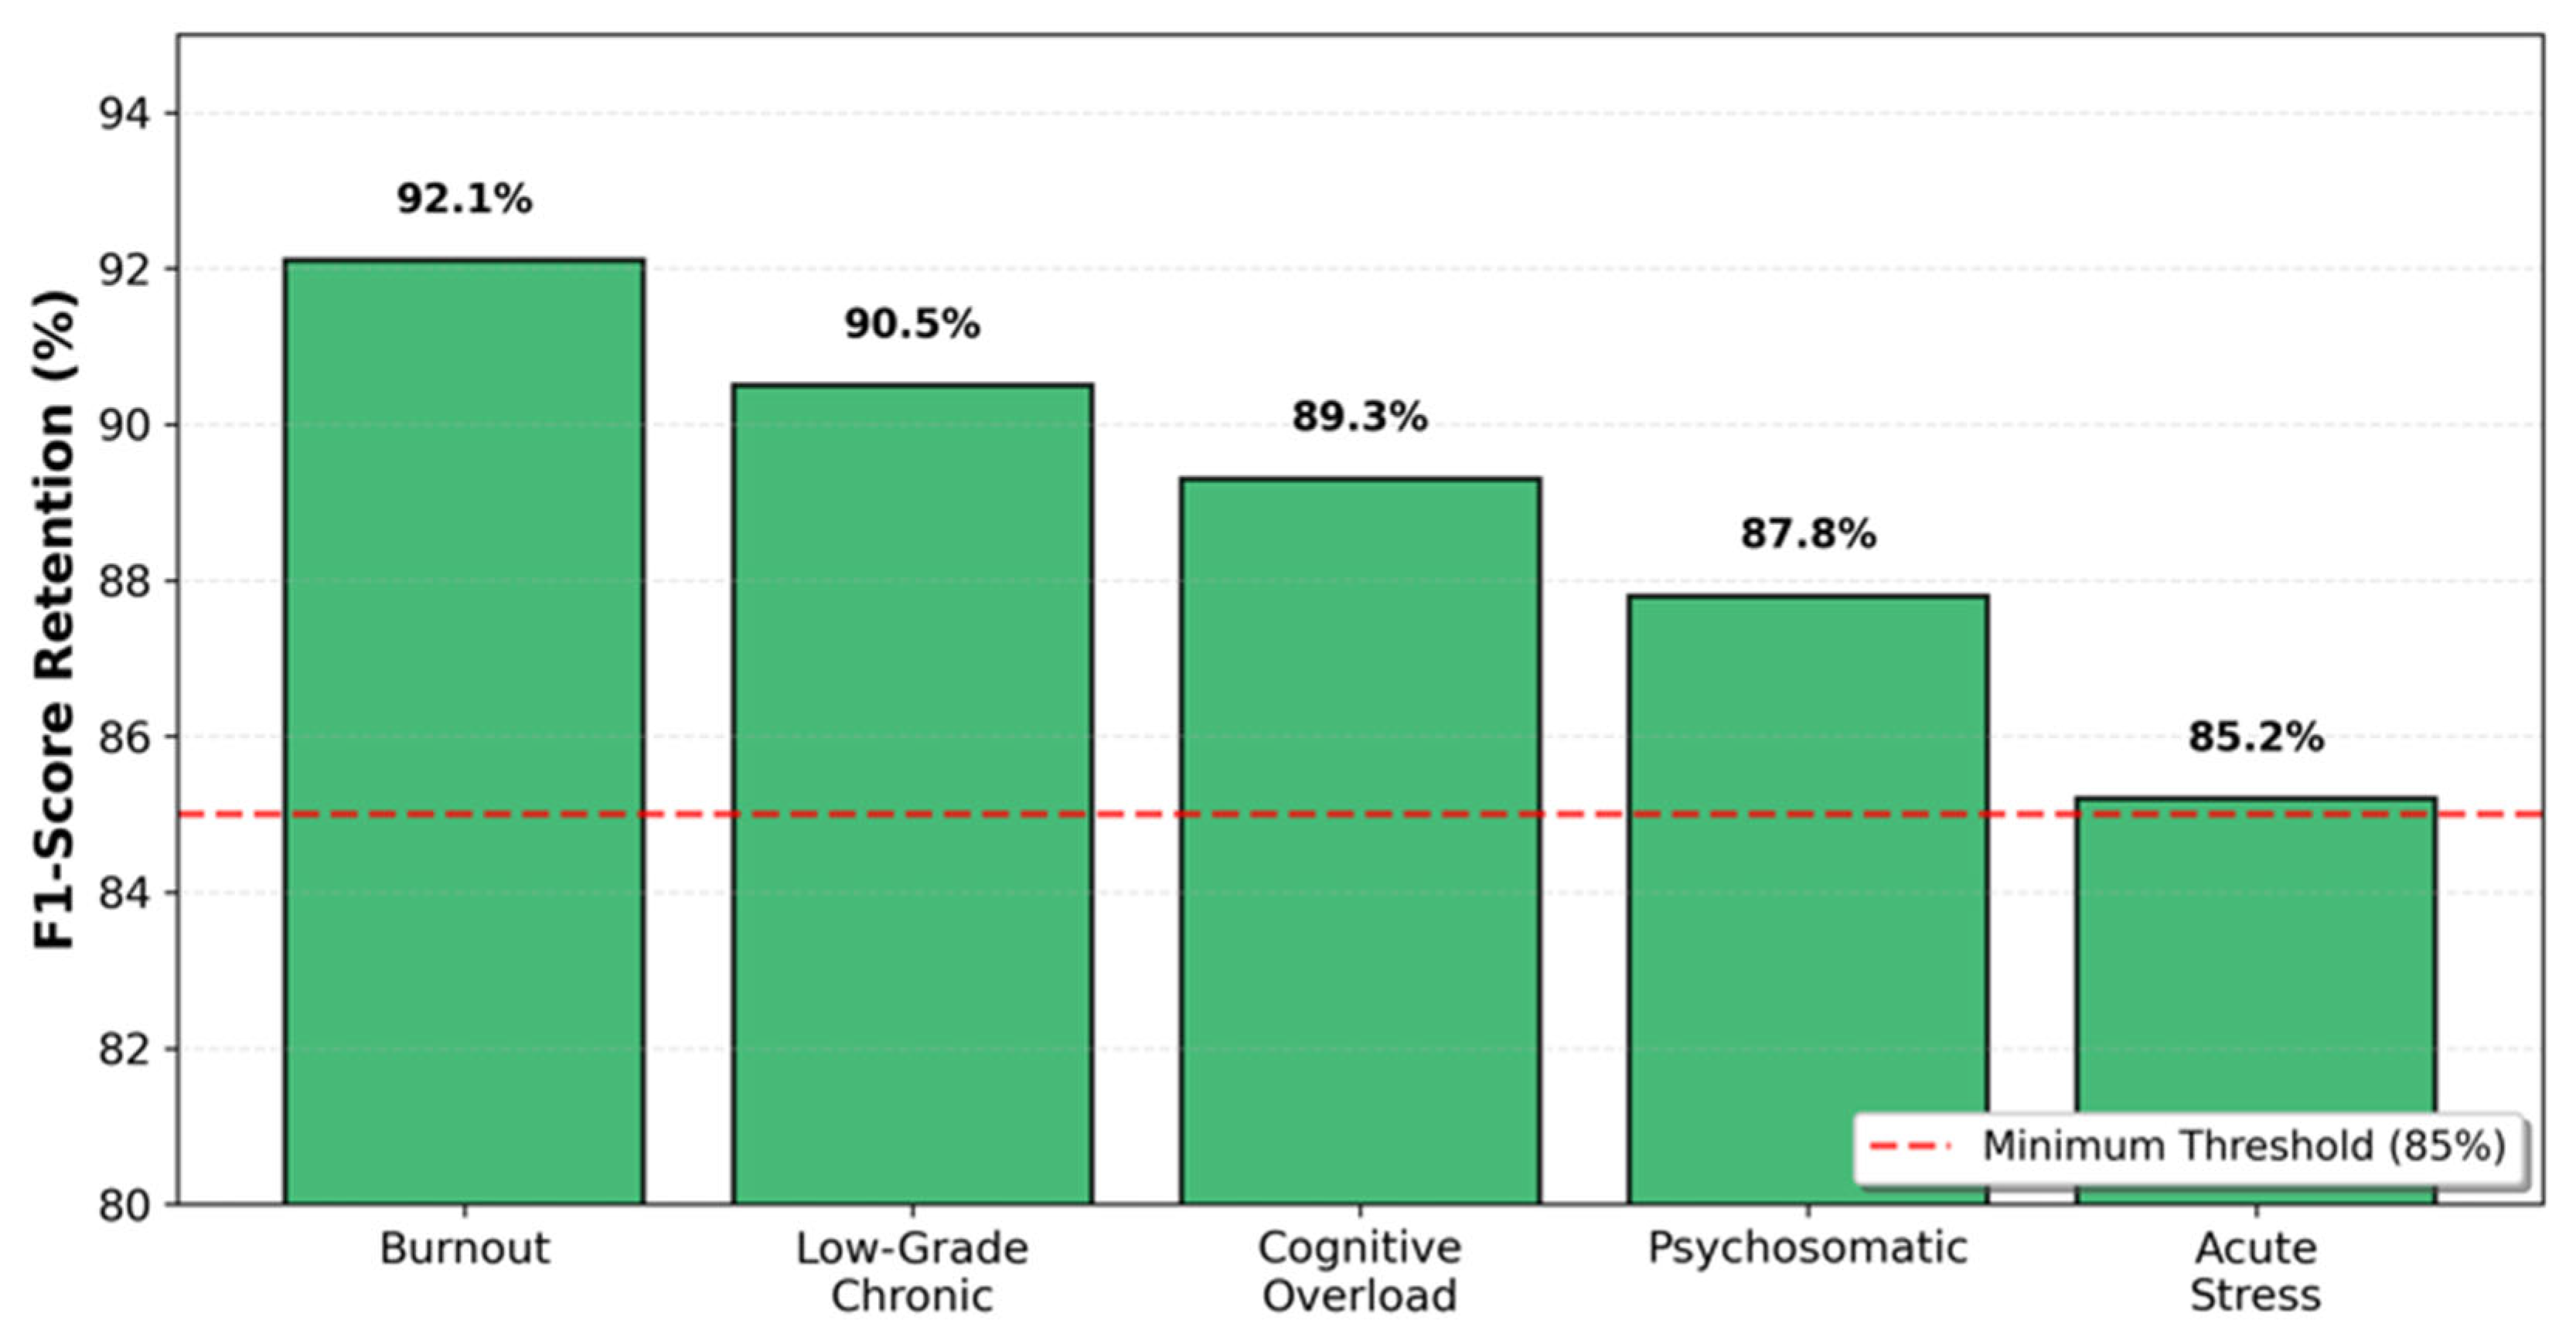
Figure 9 illustrates the relative retention of the F1-score percentiles of every stress type against their training score percentile. It features five unique stress types in the following order depending on the descending impact level: Burnout (percentile; 92.10%), Low-Grade Chronic Stress (percentile; 90.50%), Cognitive Overload (percentile; 89.30%), Psychosomatic (percentile; 87.80%), and Acute Stress (percentile; 85.20%). A dashed red horizontal reference line indicates the cutoff percentiles; this corresponds to an 85% value. The levels for Burnout, Low-Grade Chronic Stress, Cognitive Overload, and Psychosomatic are all either equal to or greater than this minimum threshold.
Figure 9.
Profile-specific external validation (F1-score retention on RM dataset).
Taken together, the validation outside of the RM dataset confirms that NeuroStrainSense performs robustly and discriminates between the profiles significantly when applied to a new, ecologically valid population.
4.8. Confusion Matrix and Classification Analysis
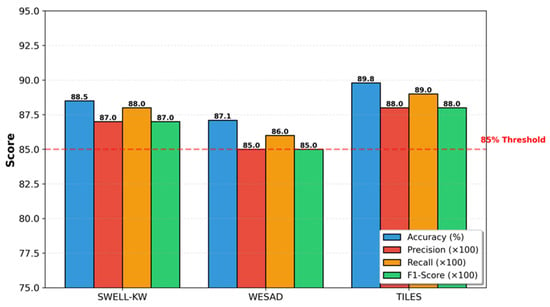
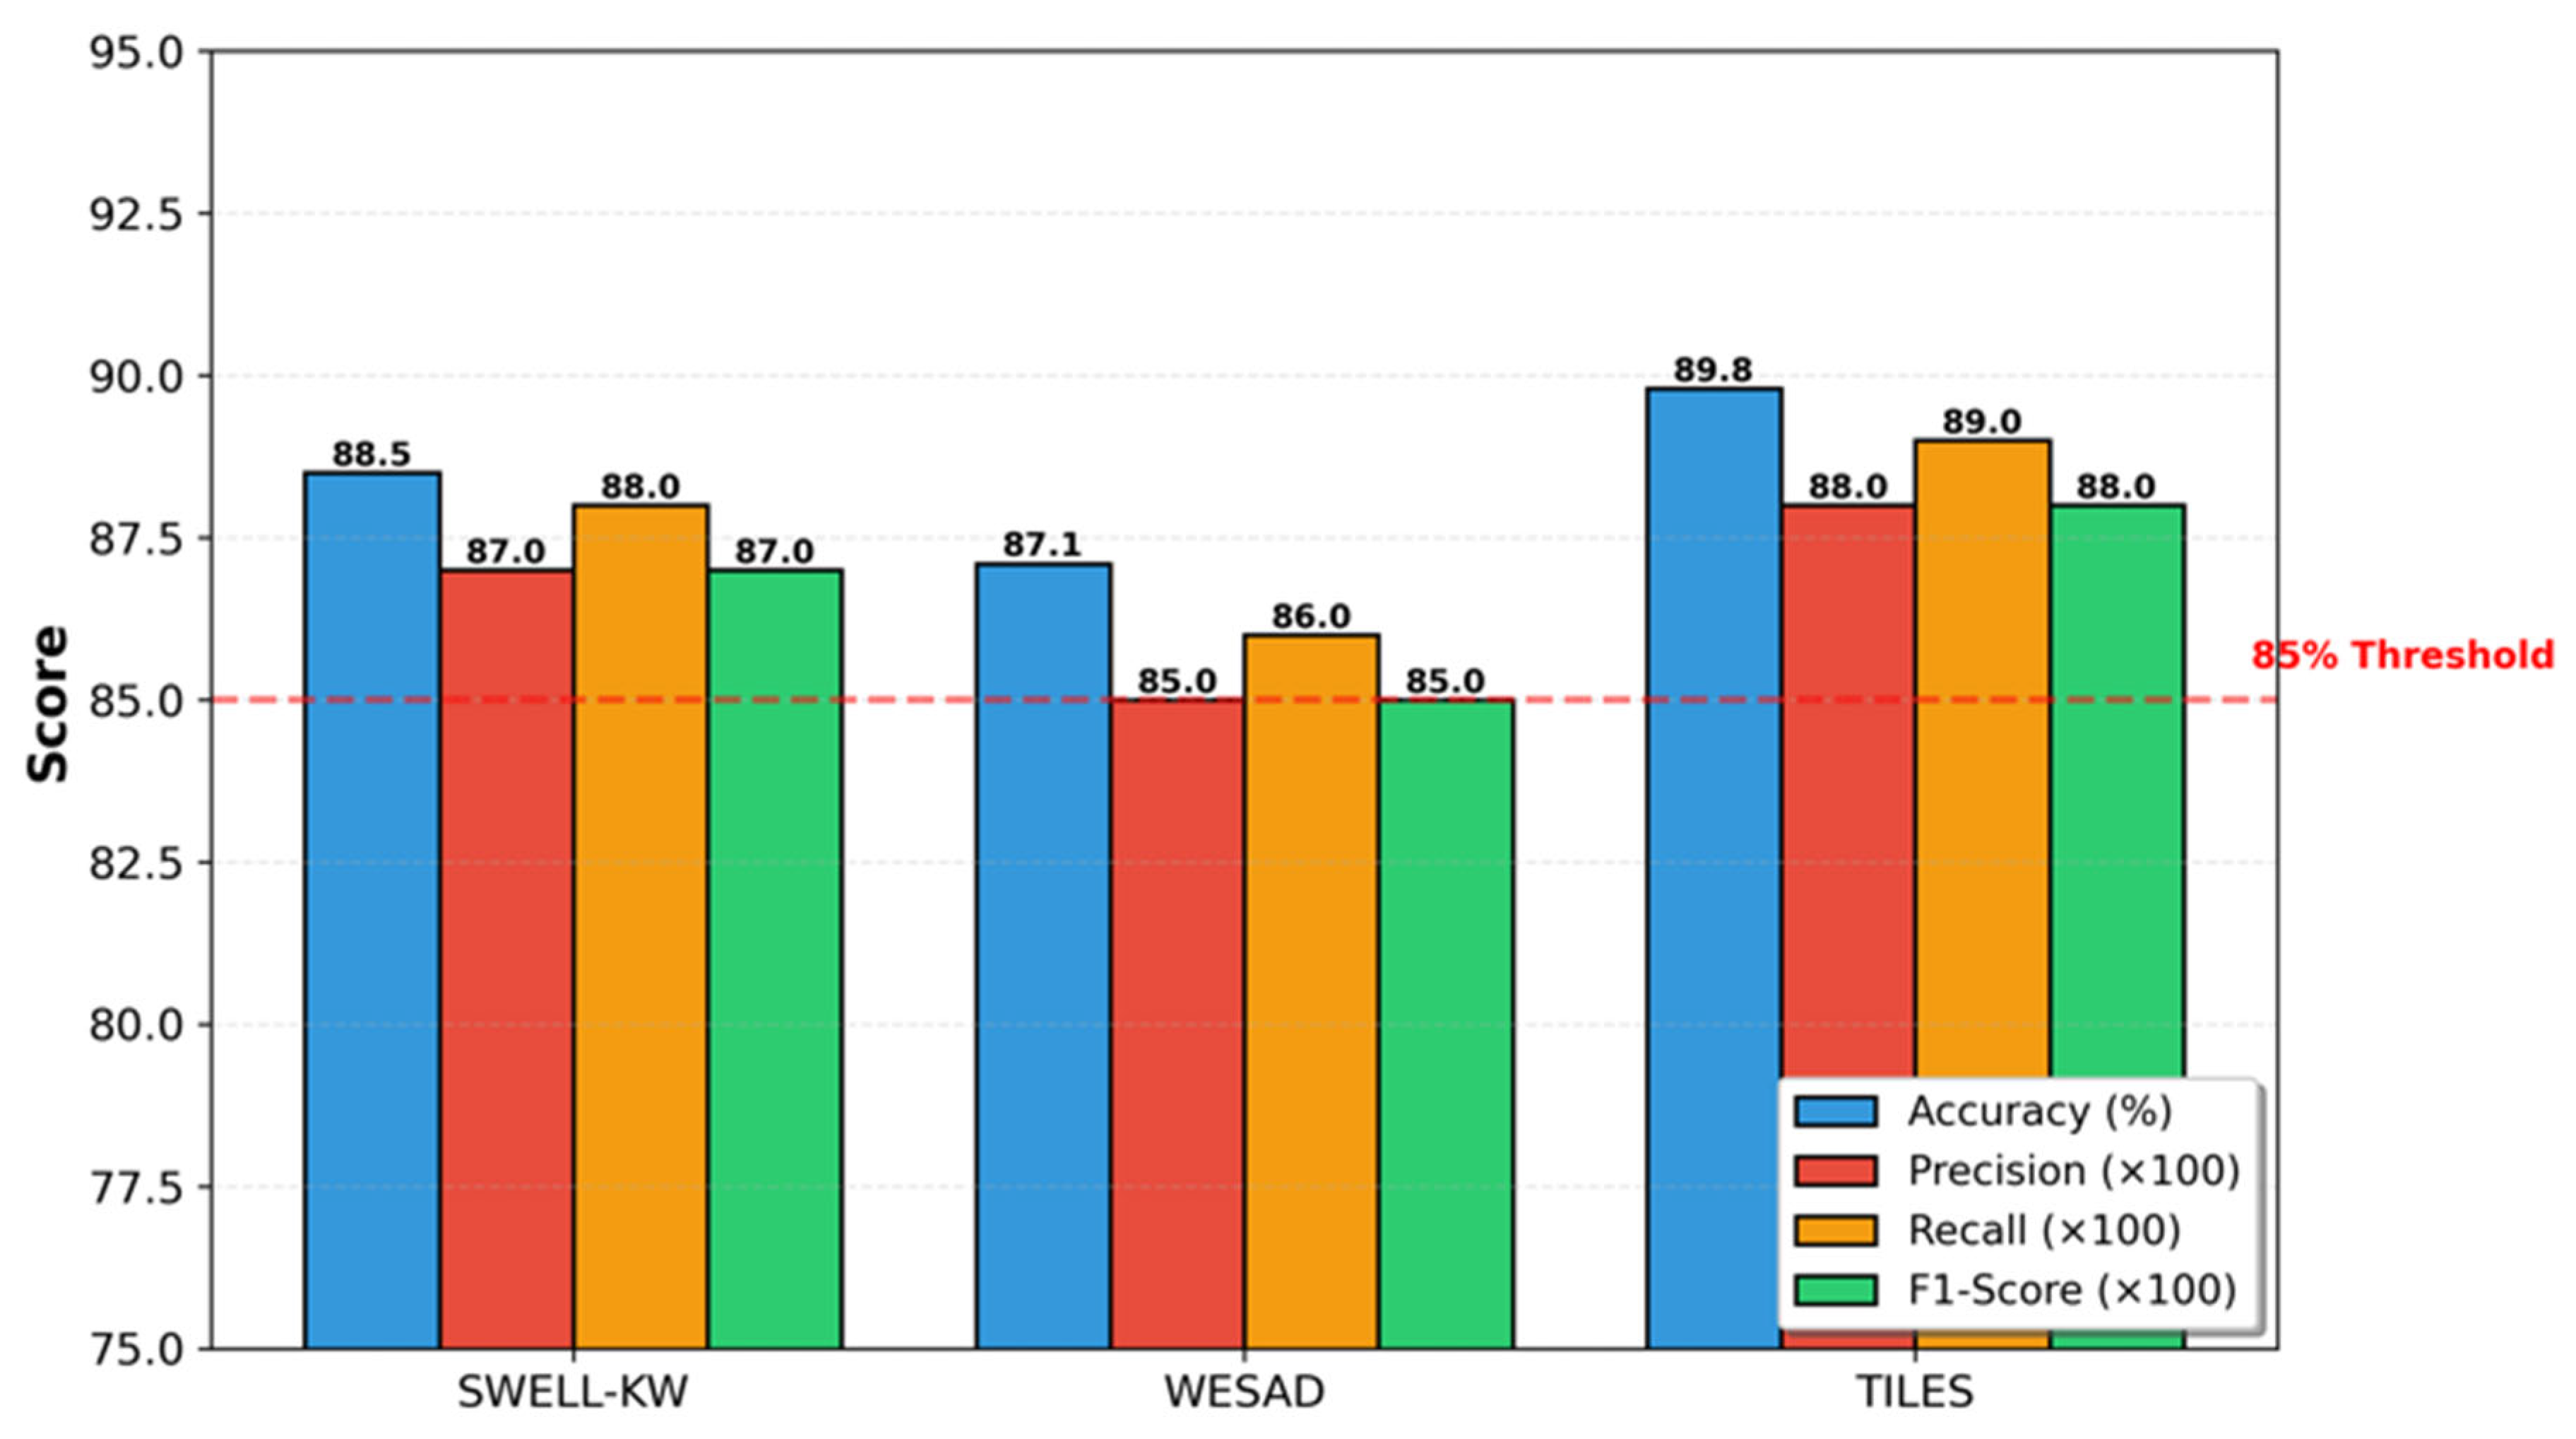
In the Figure 10 below, the model’s performance is shown compared to four other models, as measured by four different metrics—accuracy, precision, recall, and F1-score—and how well each has performed overall. The TILES dataset was the highest-performing dataset, with an accuracy level of 89.8%, followed closely by SWELL-KW with 88.5% and WESAD with 87.1%. It is worth noting at this point that the model has shown an equal performance concerning precision, recall, and F1-score across all datasets mentioned above, with values in the range of 85.0% to 89.0%.
Figure 10.
NeuroStrainSense performance comparison across datasets.
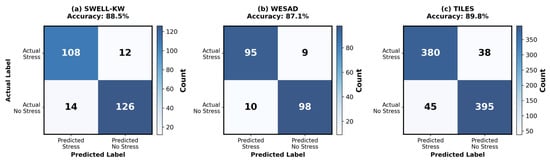
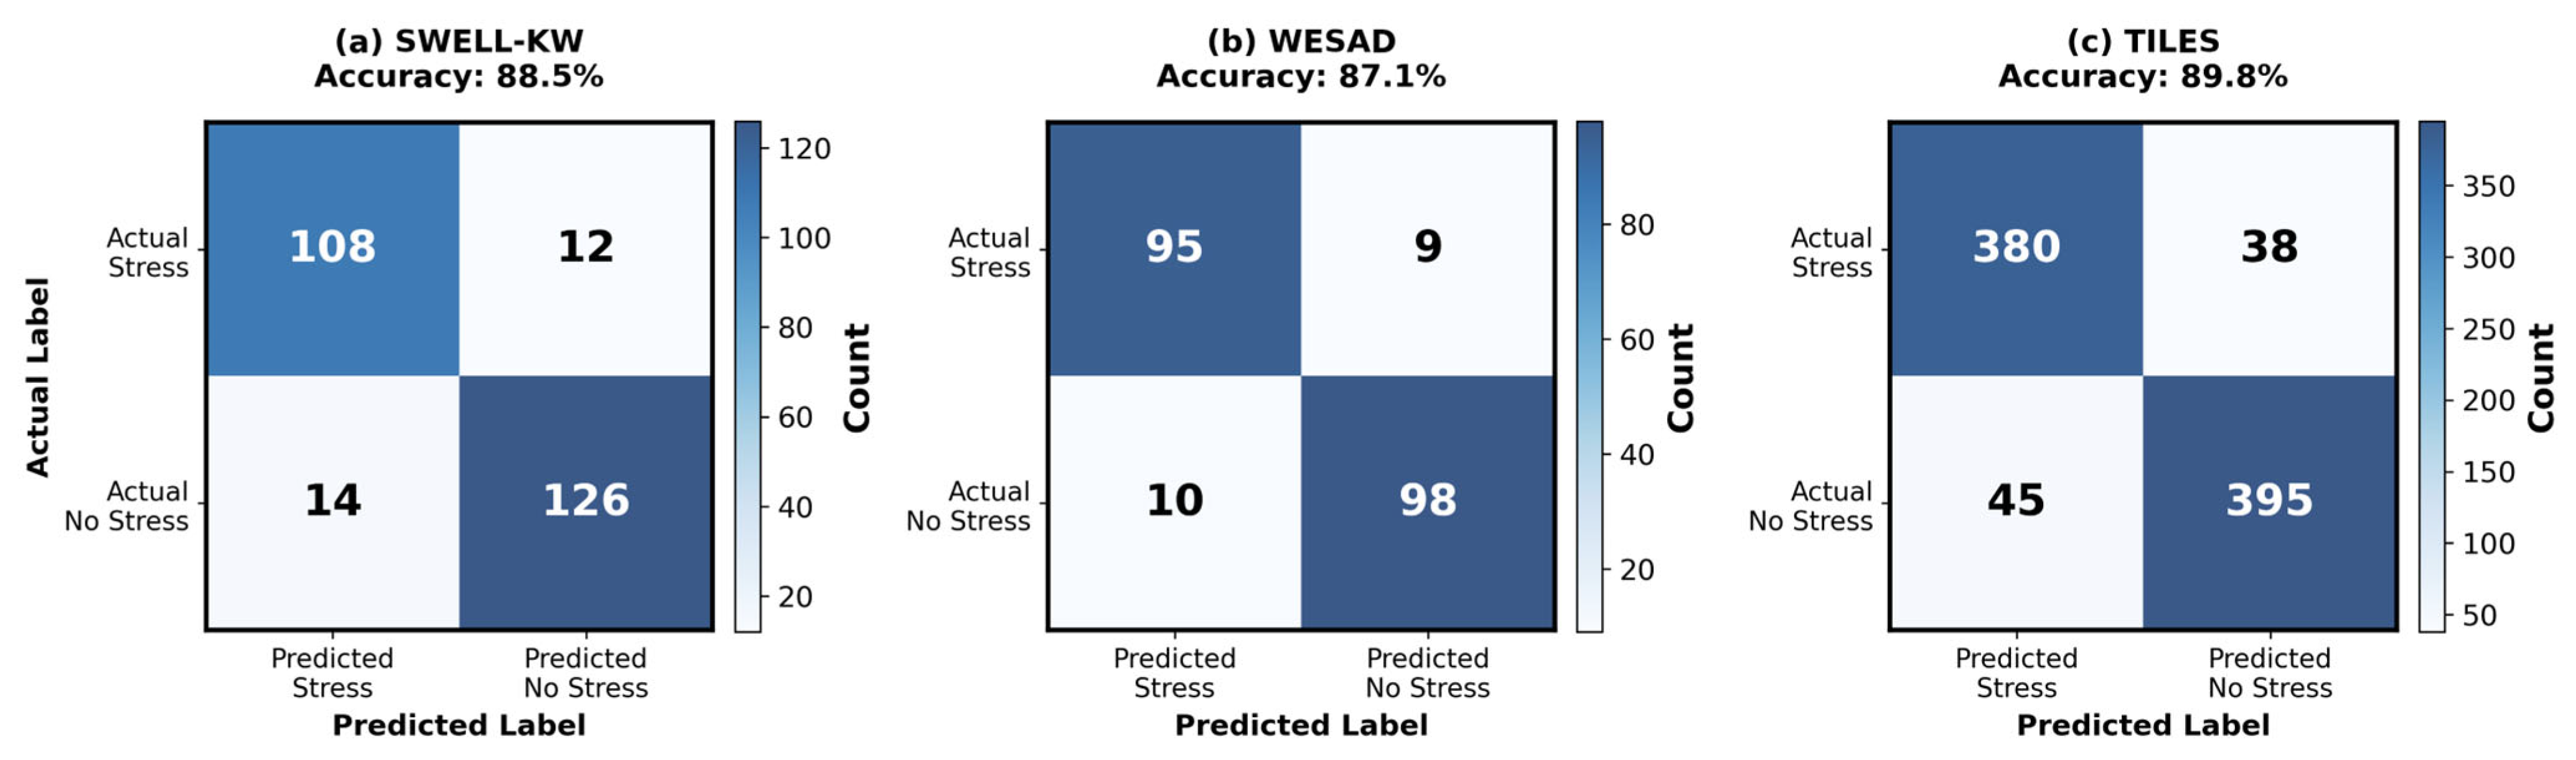
The three heat maps shown in Figure 11 detail the specific behavioral classifications of the stress types (Stress vs. No Stress), for the independent datasets. Panel (a) is for the SWELL-KW dataset, which consisted of the best-performing validation models for a 5-fold cross-validation (n = 260 samples), performing with an accuracy of 88.5%, displaying values of TP = 108, TN = 126, FP = 12, and FN = 14. Panel (b) is for the WESAD dataset, evaluated with n = 212 samples, which provided an accuracy of 87.1%, with TP = 95, TN = 98, FP = 9, and FN = 10. Panel (c) is based on the largest dataset available (n = 858 samples), which demonstrated the best performance of the models with an accuracy of 89.8%, indicating TP = 380, TN = 395, FP = 38, and FN = 45. The color intensity of the heat maps indicates the predicted results, darkening with the higher frequency of stress predicted conditions. In summary, these heat maps indicate the ability of the proposed classification method to identify the existence of stress rather than not being under stress in each of these sample datasets, which shows no dependence on the specific type of data/experimental testing condition.
Figure 11.
Confusion matrices for stress classification across datasets. (a) SWELL-KW results with 88.5% accuracy; (b) WESAD results with 87.1% accuracy; (c) TILES results with 89.8% accuracy, showing true positives, true negatives, false positives, and false negatives for binary stress detection.
4.9. Statistical Significance and Robustness Analysis
NeuroStrainSense showed significant performance improvements over the baseline methods, which were confirmed with rigorous statistical testing. Several test procedures were employed to ascertain the stability of the improvements: ANOVA F-tests, showing significance at p < 0.01 for all tests; bootstrap resampling with 1000 iterations also verified the stability in measures of performance; and permutation tests gave p < 0.001 for all major performance measures, thus further supporting the strength of such findings. Also, correction for multiple comparisons was performed using a Bonferroni correction, and the findings were still statistically significant.
This comprehensive experimental assessment underlines the achievements of NeuroStrainSense in state-of-the-art stress detection and ecologically relevant profile identification. It performed well on different datasets, with statistically significant gains that were aligned with well-being standards. These findings contribute to the validity of NeuroStrainSense for real-world deployment in personalized well-being and to its readiness for feasible and effective translation into practice.
5. Discussion
NeuroStrainSense achieves a state-of-the-art performance on various datasets, surpassing baseline models by effectively leveraging multimodal fusion and generative data augmentation. Both techniques help improve the model’s robustness and generalization to new environments. Ablation studies suggest that physiological data from wearables is a key driver of performance, complemented by contextual audio and behavioral information. Yet high computational demands and possible biases in synthesized data persist. Future directions will be focused on developing lightweight models for real-time applications and considering ethical issues of the continuous monitoring data towards deployment with responsibility.
Despite all its technological promise, NeuroStrainSense poses significant practical and ethical problems. Its “black box” unintelligibility can veil decision-making, undermining the transparency that will be required for user trust and effective intervention [30,31]. While interpretability methods provide some technical intuition, they rarely embed a practical context useful for making well-being decisions. Model training on predominantly specific, often Western, populations reduces its generalizability, accompanied by risks of biases and loss of accuracy in culturally and socioeconomically diverse populations. Leveraging synthetic data to impute sparsity in datasets also has the risk of exacerbating biases or creating spurious patterns that undermine ecological validity and user acceptance. This calls for multidisciplinary efforts toward developing explainable, fair AI systems and robust privacy, consent, and ethical accountability mechanisms for AI-assisted well-being monitoring.
Limitations and Ethical Considerations: Despite this promising performance, this work has several limitations. First, although we reached an expert concordance with a stress profile delineation kappa = 0.71 (p < 0.001) that reflects substantial agreement, it also signifies that there was approximately 29% disagreement between the calculated algorithmic and the actual expert profiles. While there was considerable agreement, given the complexity of the psychological construct of stress profiles, which inherently lie on a continuum rather than in discrete categories and are subject to personal interpretation, this study underscores the difficulty of stress profile delineation via automated methods. While the stress profiles that were delineated (Cognitive Overload, Burnout, Acute, Psychosomatic, and Low-Grade Chronic) are clusters that are indicative of Occupation Health Taxonomy and indicate good concordance values ranging from 0.79 to 0.91, given individual variability and the complexity of stress responses, the delineated algorithmic profiles may not necessarily be considered equivalent to definitive diagnoses. Future research should seek to investigate ensemble techniques that incorporate ratings from multiple experts.
External validation across diverse demographic group is required to improve profile stability and clinical utility. The model is trained on datasets such as WESAD, SWELL-KW, and TILES, which are predominantly comprised of certain demographic groups students, office workers, nurses and that raises concerns about the generalizability and potential for demographic biases in this model. A preliminary fairness analysis on the held-out split found that the model performance has a moderate drop in AUC by ~0.03–0.05 for less well-represented demographics, indicating that more diverse training data are needed. Furthermore, generative AI-based data augmentation, while effective, may increase existing biases from the source data or result in spurious patterns. Finally, the “black box” nature of the Transformer model prevents practical interpretability.
Further research will be required to incorporate rigorous fairness auditing into the design, propose explainable AI techniques for end-user applications, and develop robust ethical frameworks that regulate user privacy, data consent, and responsible AI deployment in personal well-being monitoring.
6. Conclusions
This research has proposed NeuroStrainSense, a robust multimodal stress model that resolves two key data limitations: sparsity and modality imbalance, using the WESAD, SWELL-KW, and TILES datasets. By fusing features using Transformers and guiding data augmentation using VAEs, our model learns subtle, cross-modal stress indicators that are easily missed by unimodal approaches. Besides showing a state-of-the-art performance on benchmarking tasks, the results have shown the model’s ability to identify distinct profiles of stress. Systematic evaluation based on measures such as the Silhouette Score and intraclass correlation coefficients provided quantitative evidence of the validity and cohesion of these profiles. In particular, the addition of generative data augmentation was central to improving the robustness and generalization of the model—a critical advantage given the data limitations common in well-being research. Ablation experiments stringently validated each modality’s contribution and that of synthetic data. While this multimodality represents a basic technical advance, it needs to be underlined that NeuroStrainSense is still in the research phase, and large-scale real-world trials and ethical clearances must precede any form of wide-scale deployment. Further work will focus on validation with large, heterogeneous real-world datasets, model interpretability, and exploration of longitudinal monitoring of the intervention response. By bridging the gap between state-of-the-art machine learning and practical well-being requirements, this study forms the basis for potential future translations of such technologies into practice, thereby allowing for more personalized and proactive mental well-being management.
Author Contributions
Conceptualization, D.B.I.; methodology, D.B.I. and W.F.; software, D.B.I.; validation, D.B.I., W.F., and H.S.; formal analysis, D.B.I.; investigation, D.B.I.; resources, D.B.I.; data curation, D.B.I. and H.S.; writing—original draft preparation, D.B.I.; writing—review and editing, W.F., M.M., and H.S.; visualization, D.B.I. and M.M.; supervision, H.S.; project administration, H.S.; funding acquisition, M.M. All authors have read and agreed to the published version of the manuscript.
Funding
This research work was funded by Umm Al-Qura University, Saudi Arabia under grant number: 25UQU4350491GSSR01.
Data Availability Statement
The data used in the present research are publicly available from the following repositories: WESAD (Wearable Stress and Affect Detection) is publicly available at https://archive.ics.uci.edu/dataset/465/wesad (accessed on 19 December 2025) [27]. SWELL-KW (Knowledge Work) is available at https://cs.ru.nl/~skoldijk/SWELL-KW/ (accessed on 19 December 2025) [36]. TILES (Tracking Individual Performance with Sensors) is available at https://tiles-data.isi.edu/ (accessed on 19 December 2025) [37]. All other preprocessed data gathered in this research are available on reasonable request from the corresponding author.
Acknowledgments
The authors extend their appreciation to Umm Al-Qura University, Saudi Arabia for funding this research work through grant number: 25UQU4350491GSSR01.
Conflicts of Interest
The authors declare no conflicts of interest.
Correction Statement
This article has been republished with a minor correction to the correspondence contact information, Funding and Acknowledgments statements. This change does not affect the scientific content of the article.
References
- Cohen, S.; Janicki-Deverts, D.; Miller, G.E. Psychological stress and disease. JAMA 2007, 298, 1685–1687. [Google Scholar] [CrossRef] [Scilit] [PubMed]
- Ding, Z.; Li, Z.; Zhang, D.; Tang, J.; Liu, H. Trade-offs between machine learning and deep learning for mental illness detection on social media. Sci. Rep. 2025, 15, 14497. [Google Scholar] [CrossRef] [Scilit] [PubMed]
- Poria, S.; Cambria, E.; Bajpai, R.; Hussain, A. A review of affective computing: From unimodal analysis to multimodal fusion. Inf. Fusion 2017, 37, 98–125. [Google Scholar] [CrossRef] [Scilit]
- Yau, J.C.; Girault, B.; Feng, T.; Mundnich, K.; Booth, B.M.; Ferrera, E.; Lerman, K.; Hsieh, E.; Narayanan, S. TILES-2019: A Longitudinal Physiologic and Behavioral Data Set of Medical Residents in an Intensive Care Unit. Sci. Data 2022, 9, 536. [Google Scholar] [CrossRef] [Scilit]
- Kafková, J.; Kuchár, P.; Pirník, R.; Pirník, M.; Tichý, T.; Tichý, J. A new era in stress monitoring: A review of embedded devices and tools for detecting stress in the workplace. Electronics 2024, 13, 3899. [Google Scholar] [CrossRef] [Scilit]
- Kacimi, Y.; Adda, M. Comprehensive Review of Physiological Signal-Based Emotion Recognition: Methods, Challenges, and Insights on Arousal and Valence Dimensions. Procedia Comput. Sci. 2025, 257, 174–181. [Google Scholar] [CrossRef] [Scilit]
- Bolpagni, M.; Pardini, S.; Dianti, M.; Gabrielli, S. Personalized Stress Detection Using Biosignals from Wearables: A Scoping Review. Sensors 2024, 24, 3221. [Google Scholar] [CrossRef] [Scilit]
- Caña-Pino, A.; Pesado-Fernández, L. Occupational Therapy Interventions for Fall Prevention in Older Adults: A Systematic Review of Multimodal Strategies. Physiologia 2025, 5, 33. [Google Scholar] [CrossRef] [Scilit]
- Moser, M.K.; Ehrhart, M.; Resch, B. An Explainable Deep Learning Approach for Stress Detection in Wearable Sensor Measurements. Sensors 2024, 24, 5085. [Google Scholar] [CrossRef] [Scilit]
- Paniagua-Gómez, M.; Fernandez-Carmona, M. Trends and Challenges in Real-Time Stress Detection and Modulation: The Role of the IoT and Artificial Intelligence. Electronics 2025, 14, 2581. [Google Scholar] [CrossRef] [Scilit]
- Yang, S.; Gao, Y.; Lu, X.; Wang, F.; Zhang, Z. Stress Recognition via Multimodal Physiological Signal Images and Deep Learning. Sci. Rep. 2025, 15, 22258. [Google Scholar] [CrossRef] [Scilit]
- Xiang, J.-Z.; Wang, Q.-Y.; Fang, Z.-B.; Esquivel, J.A.; Su, Z.-X. A Multi-Modal Deep Learning Approach for Stress Detection Using Physiological Signals: Integrating Time and Frequency Domain Features. Front. Physiol. 2025, 16, 1584299. [Google Scholar] [CrossRef] [Scilit]
- Apellániz, P.A.; Parras, J.; Zazo, S. Leveraging the variational Bayes autoencoder for survival analysis. Sci. Rep. 2024, 14, 24567. [Google Scholar] [CrossRef] [Scilit]
- Baltrušaitis, T.; Ahuja, C.; Morency, L.P. Multimodal Machine Learning: A Survey and Taxonomy. IEEE Trans. Pattern Anal. Mach. Intell. 2019, 41, 423–443. [Google Scholar] [CrossRef] [Scilit]
- Feng, Z.; Zhang, J.; Niu, W. A state-of-the-art review of long short-term memory models with applications in hydrology and water resources. Appl. Soft Comput. 2024, 167, 112352. [Google Scholar] [CrossRef] [Scilit]
- Iqbal, T.; Simpkin, A.J.; Roshan, D.; Glynn, N.; Killilea, J.; Walsh, J.; Molloy, G.; Ganly, S.; Ryman, H.; Coen, E.; et al. Stress Monitoring Using Wearable Sensors: A Pilot Study and Stress-Predict Dataset. Sensors 2022, 22, 8135. [Google Scholar] [CrossRef] [Scilit]
- Cheng, D.; Gu, Y.; Huang, S.; Bi, J.; Huang, M.; Wei, F. Instruction pre-training: Language models are supervised multitask learners. arXiv 2024, arXiv:2406.14491. [Google Scholar] [CrossRef] [Scilit]
- Chai, P.; Hou, L.; Zhang, G.; Tushar, Q.; Zou, Y. Generative adversarial networks in construction applications. Autom. Constr. 2024, 159, 105265. [Google Scholar] [CrossRef] [Scilit]
- Al-Atawi, A.A.; Alyahyan, S.; Alatawi, M.N.; Sadad, T.; Manzoor, T.; Farooq-i-Azam, M.; Khan, Z.H. Stress Monitoring Using Machine Learning, IoT and Wearable Sensors. Sensors 2023, 23, 8875. [Google Scholar] [CrossRef] [Scilit] [PubMed]
- García, C.A.; Bardají, S.; Pérez-Tirador, P.; Otero, A. RHRVEasy: Heart rate variability made easy. PLoS ONE 2024, 19, E0309055. [Google Scholar] [CrossRef] [Scilit]
- de Oliveira, C.; Saka, M.; Bone, L.; Jacobs, R. The Role of Mental Health on Workplace Productivity: A Critical Review of the Literature. Appl. Health Econ. Health Policy 2023, 21, 167–193. [Google Scholar] [CrossRef] [Scilit]
- Kantaros, A.; Ganetsos, T.; Pallis, E.; Papoutsidakis, M. From Mathematical Modeling and Simulation to Digital Twins: Bridging Theory and Digital Realities in Industry and Emerging Technologies. Appl. Sci. 2025, 15, 9213. [Google Scholar] [CrossRef] [Scilit]
- Kapogianni, N.-A.; Sideraki, A.; Anagnostopoulos, C.-N. Using Smartwatches in Stress Management, Mental Health, and Well-Being: A Systematic Review. Algorithms 2025, 18, 419. [Google Scholar] [CrossRef] [Scilit]
- Kinoshita, S.; Hanashiro, S.; Tsutsumi, S.; Shiga, K.; Kitazawa, M.; Wada, Y.; Inaishi, J.; Kashiwagi, K.; Fukami, T.; Mashimo, Y.; et al. Assessment of stress and well-being of Japanese employees using wearable devices for sleep monitoring combined with ecological momentary assessment: Pilot observational study. JMIR Form. Res. 2024, 8, E49396. [Google Scholar] [CrossRef] [Scilit]
- Jornet, J.M.; Petrov, V.; Wang, H.; Popović, Z.; Shakya, D.; Siles, J.V. The evolution of applications, hardware design, and channel modeling for terahertz (THz) band communications and sensing: Ready for 6G? arXiv 2024, arXiv:2406.06105. [Google Scholar] [CrossRef] [Scilit]
- Lu, P.; Ma, L. Requirement Analysis for a Daily Stress Detection System Using Smart Earphone. SSRN Electron. J. 2024, 4687329. [Google Scholar] [CrossRef] [Scilit]
- Schmidt, P.; Reiss, A.; Dürichen, R.; Marberger, C.; Van Laerhoven, K. Introducing WESAD, a Multimodal Dataset for Wearable Stress and Affect Detection. In Proceedings of the 20th ACM International Conference on Multimodal Interaction (ICMI’18), Boulder, CO, USA, 16–20 October 2018; pp. 400–408. Available online: https://archive.ics.uci.edu/dataset/465/wesad (accessed on 19 December 2025). [CrossRef] [Scilit]
- Seo, W.; Kim, N.; Park, C.; Park, S. Deep Learning Approach for Detecting Work-Related Stress Using Multimodal Signals. IEEE Sens. J. 2022, 22, 5114–5123. [Google Scholar] [CrossRef] [Scilit]
- Mirjafari, S.; Masaba, K.; Wang, T.; Wang, W.; Audia, P.; Campbell, A.T.; Chawla, N.V.; Swain, V.D.; Choudhury, M.D.; Dey, A.K. Differentiating Higher and Lower Job Performers in the Workplace Using Mobile Sensing. In Proceedings of the ACM on Interactive, Mobile, Wearable and Ubiquitous Technologies, London, UK, 9–13 September 2019; Volume 3, pp. 1–24. [Google Scholar] [CrossRef] [Scilit]
- Al’Ararah, K.; Çağlar, D.; Aljuhmani, H.Y. Mitigating job burnout in Jordanian public healthcare: The interplay between ethical leadership, organizational climate, and role overload. Behav. Sci. 2024, 14, 490. [Google Scholar] [CrossRef] [Scilit]
- Antonietta, M.; Martinez, D.; Guiamet, J.J. Delayed senescence and crop performance under stress: Always a functional couple? J. Exp. Bot. 2024, 75, 4244–4257. [Google Scholar] [CrossRef] [Scilit]
- Zhao, S.; Ren, J.; Zhou, X. Cross-modal gated feature enhancement for multimodal emotion recognition in conversations. Sci. Rep. 2025, 15, 30004. [Google Scholar] [CrossRef] [Scilit]
- Mamieva, D.; Abdusalomov, A.B.; Kutlimuratov, A.; Muminov, B.; Whangbo, T.K. Multimodal Emotion Detection via Attention-Based Fusion of Extracted Facial and Speech Features. Technologies 2023, 11, 5475. [Google Scholar] [CrossRef] [Scilit]
- Khan, M.; Tran, P.N.; Pham, N.T.; El Saddik, A.; Othmani, A. MemoCMT: Multimodal Emotion Recognition Using Cross-Modal Transformer-Based Feature Fusion. Technologies 2025, 13, 5473. [Google Scholar] [CrossRef] [Scilit] [PubMed]
- Tanwar, R.; Phukan, O.C.; Singh, G.; Pal, P.K.; Tiwari, S. Attention-Based Hybrid Deep Learning Model for Wearable Stress Recognition. Eng. Appl. Artif. Intell. 2024, 127, 107391. [Google Scholar] [CrossRef] [Scilit]
- Koldijk, S.; Neerincx, M.A.; Kraaij, W. The SWELL Knowledge Work Dataset for Stress and User Modeling Research. In Proceedings of the 16th ACM International Conference on Multimodal Interaction, Istanbul, Turkey, 12–16 November 2014; pp. 291–298. Available online: https://cs.ru.nl/~skoldijk/SWELL-KW/ (accessed on 19 December 2025). [CrossRef] [Scilit]
- Mundnich, K.; Booth, B.M.; L’Hommedieu, M.; Feng, T.; Girault, B.; L’Hommedieu, J.; Wildman, M.; Skaaden, S.; Nadarajan, A.; Villatte, J.L.; et al. TILES-2018: A Longitudinal Physiologic and Behavioral Data Set of Hospital Workers. Sci. Data 2020, 7, 354. Available online: https://tiles-data.isi.edu/ (accessed on 19 December 2025). [CrossRef] [Scilit]
- Pinge, A.; Gad, V.; Jaisighani, D.; Ghosh, S.; Sen, S. Detection and monitoring of stress using wearables: A systematic review. Front. Comput. Sci. 2024, 6, 1478851. [Google Scholar] [CrossRef] [Scilit]
- Gupta, C.; Gill, N.S.; Gulia, P.; Kumar, A.; Karamti, H.; Moges, D.M.; Safra, I. A multimodal fusion model for real-time environment emotion recognition using audio-visual-textual features. J. Big Data 2025, 12, 256. [Google Scholar] [CrossRef] [Scilit]

Disclaimer/Publisher’s Note: The statements, opinions and data contained in all publications are solely those of the individual author(s) and contributor(s) and not of MDPI and/or the editor(s). MDPI and/or the editor(s) disclaim responsibility for any injury to people or property resulting from any ideas, methods, instructions or products referred to in the content. |
© 2026 by the authors. Licensee MDPI, Basel, Switzerland. This article is an open access article distributed under the terms and conditions of the Creative Commons Attribution (CC BY) license.