


Abstract
Grounded in the theoretical frameworks of safe haven and hedging asset theory, alongside wavelet-based time-frequency analysis, this study investigates the dynamic interconnectedness between three major cryptocurrencies and six global stock markets spanning both developed and emerging economies. Unlike prior wavelet studies that rely predominantly on graphical interpretation, this paper advances the literature by complementing graphical outputs with numerical results, offering a more rigorous and reproducible analytical foundation. Using daily price data from January 2018 to October 2024, the study applies both univariate and multivariate wavelet techniques to capture return co-movements across multiple time horizons. The univariate analysis reveals significant variance in stock returns concentrated at high frequencies, particularly over 2–4-day cycles, with pronounced fluctuations during the COVID-19 pandemic. In emerging markets such as Nigeria, additional volatility is attributed to political instability and macroeconomic crises. The multivariate analysis further demonstrates that observed co-movements between cryptocurrencies and stock markets are largely driven by interdependence rather than contagion. The paper’s findings are relevant to portfolio diversification strategies across both developed and emerging markets for investors combining stock and cryptocurrency assets.
1. Introduction
The world of cryptocurrencies has grown exponentially since the introduction of Bitcoin in 2009, reaching approximately $260 billion in total capitalisation by 2019 (Corbet et al., 2020). This rapid expansion can be attributed to several factors, including the adoption of cryptocurrencies by several countries as a medium of exchange and technological advancements in blockchain, which enhance security and transparency (Campbell-Verduyn, 2018). Market speculation has also attracted investors seeking to profit from price volatility. Additionally, cryptocurrencies offer decentralised financial systems, appealing to those seeking alternatives to traditional banking, especially amid global economic uncertainty. Economic instability and concerns about inflation have prompted some investors to consider cryptocurrencies as a hedge or safe haven against traditional market downturns. This theoretical proposition remains actively debated in the literature (Almeida & Gonçalves, 2023). These collective factors have attracted considerable interest from both investors and researchers, resulting in a growing body of literature focused on various financial issues related to cryptocurrencies, such as market efficiency and their correlation with other asset classes (Urquhart, 2018; Corbet et al., 2020).
The cryptocurrency market has faced several challenges since its inception, the most notable being the “Bitcoin Bubble.” Bitcoin experienced an extraordinary price surge that culminated in a dramatic bubble in 2017, rising from approximately $1000 at the beginning of the year to nearly $20,000 by December, driven by rampant speculation and growing investor interest (Higgins, 2017). This explosive growth attracted widespread media attention and a broad range of investors, including both seasoned and new market participants. However, it also underscored the inherent risks of cryptocurrency markets, as many investors were drawn in by hype rather than informed analysis. In early 2018, Bitcoin’s price dropped sharply by over 80% from its December 2017 peak, resulting in significant losses for those who invested at the height of the bubble (Bouri et al., 2021; Mensi et al., 2023). This episode raised important questions about the transmission of shocks between cryptocurrency and traditional financial markets—specifically, whether such co-movements reflect financial contagion or underlying interdependence—and underscores the need for a deeper understanding of the time-frequency dynamics linking these two asset classes.
The concepts of contagion and interdependence are often used interchangeably in the financial literature, although they describe fundamentally different transmission mechanisms. Following Forbes and Rigobon (2002), interdependence refers to the normal transmission of shocks across markets arising from economic, financial, trade, or informational linkages. Under interdependence, markets move together because they are connected through common fundamentals, and such co-movements persist during both tranquil and turbulent periods. By contrast, contagion occurs when the transmission of shocks between markets increases significantly during periods of crisis beyond what can be explained by normal economic linkages. Contagion, therefore, reflects a structural change in the degree of market integration, often driven by panic behaviour, information asymmetry, liquidity shortages, herding, or investor sentiment. In this context, a crisis originating in one market leads to an abnormal increase in correlations and volatility transmission to other markets. The distinction between contagion and interdependence is particularly relevant for cryptocurrency markets. As cryptocurrencies become increasingly integrated with global financial systems, co-movement with stock markets may arise from either growing financial integration (interdependence) or crisis-induced transmission mechanisms (contagion). Determining which of these mechanisms dominates is important for understanding the diversification benefits of cryptocurrencies and the stability of financial markets.
Most studies on cross-market shock transmission have focused on contagion effects across different stock markets during periods of financial crisis, investigating how shocks spread across markets, particularly from developed to emerging economies or within emerging market clusters (Bonga-Bonga & Mpoha, 2024; Batondo & Uwilingiye, 2022; N. Huang et al., 2019; Hassan et al., 2017; Bonga-Bonga, 2018; Rejeb & Boughrara, 2015; Rigobon, 2002). For example, Bonga-Bonga (2018) examines financial shock transmission between the South African equity market and other BRICS countries from 1996 to 2012, finding notable interdependence, particularly two-way shock transmission between South Africa and Brazil, using a multivariate VAR-DCC-GARCH model.
Building on this foundation, a growing strand of literature has extended the contagion framework to examine cross-transmission of shocks between cryptocurrency and stock markets (Li et al., 2023; Jana & Sahu, 2023; Özdemir, 2022; Bouri et al., 2021). Jana and Sahu (2023) show that volatility in cryptocurrency markets can significantly impact traditional stock markets, demonstrating contagion effects in which shocks in crypto prices lead to increased stock volatility. Özdemir (2022) finds that volatility spillovers among cryptocurrencies were more pronounced during periods of heightened uncertainty, such as the COVID-19 pandemic, while Li et al. (2023) highlight that the interdependence between cryptocurrencies and stock markets varies across different time frames, suggesting that market dynamics shift with external conditions. These studies collectively inform the theoretical distinction central to this paper, namely, whether observed co-movements between cryptocurrencies and stock markets constitute contagion or interdependence, and whether cryptocurrencies can fulfil the role of a safe haven or hedging instrument under such conditions.
While many studies on the dynamic relationship between cryptocurrency and stock markets rely on time domain analysis, focusing on methodologies such as DCC-GARCH models and cointegration techniques (Corbet et al., 2020; Caferra & Vidal-Tomas, 2021), very few have examined these dynamics in the time-frequency domain. Among the limited studies employing this approach, Jana and Sahu (2024) investigate the relationships between four cryptocurrencies and the Indian equity market using a wavelet framework, finding that crises such as the COVID-19 pandemic and the Russian invasion of Ukraine intensified volatility and strengthened the co-movement between these markets. Umar et al. (2020) similarly apply ADCC and wavelet coherence methods and find that correlations between cryptocurrencies and stock indices vary over time, with negative shocks exerting a stronger influence than positive ones. Importantly, both studies rely primarily on graphical outputs from wavelet coherence analysis, without supplementing these with numerical results—a limitation this paper directly addresses.
This paper makes three distinct contributions to the literature on the time-frequency relationship between cryptocurrency and stock markets. First, it investigates whether the observed co-movements between three major cryptocurrencies and six global stock markets—spanning both developed and emerging economies—reflect financial contagion or interdependence. Second, grounded in safe haven and hedging asset theory, it evaluates the potential roles of cryptocurrencies as safe havens or hedging instruments against stock market risk using a time-frequency domain approach, with explicit distinctions drawn between developed and emerging market contexts. Third, it extends the application of multivariate wavelet analysis by applying the Maximal Overlap Discrete Wavelet Transform (MODWT) to each market, thereby complementing the visual insights of wavelet coherence analysis with numerical results—an advancement over existing wavelet-based studies that rely predominantly on graphical interpretation alone.
The wavelet framework provides a robust approach to reconciling contagion, interdependence, hedging, and safe-haven theories by allowing relationships to be examined simultaneously across time and investment horizons. From the perspective of contagion theory, crisis-induced shock transmission is expected to appear predominantly at high frequencies, corresponding to short investment horizons. In contrast, interdependence reflects persistent linkages arising from economic and financial fundamentals. Such relationships are expected to manifest at lower frequencies corresponding to medium- and long-term investment horizons. The hedge and safe-haven properties of cryptocurrencies can also be evaluated within the time-frequency domain. Low or insignificant short-run coherence between cryptocurrencies and stock markets suggests that cryptocurrencies can act as diversifiers or hedging instruments during normal market conditions. Moreover, if coherence remains weak or negative during crisis episodes and across relevant frequencies, cryptocurrencies can be considered safe-haven assets. Conversely, strong coherence during periods of market stress indicates that cryptocurrencies move in step with stock markets, thereby reducing their ability to protect against market downturns. The distinction between developed and emerging markets further enriches this framework. Developed markets are generally characterised by greater financial integration, deeper capital markets, and stronger institutional structures (Bonga-Bonga & Mpoha, 2024). Consequently, cryptocurrencies may exhibit stronger long-run interdependence with developed equity markets. Emerging markets, however, are often more vulnerable to external shocks, capital flow reversals, and investor sentiment, implying that short-run contagion effects may be more pronounced. Examining these relationships across frequencies, therefore, allows a more nuanced assessment of whether cryptocurrencies function as hedges, safe havens, or channels of contagion within different market environments.
2. Literature Review
Numerous studies have explored the dynamic linkages between cryptocurrencies and stock markets, emphasising return and volatility spillovers. Aydoğan et al. (2024) applied the VAR-GARCH methodology to analyse the relationship between cryptocurrencies and stock indices in E7 and G7 countries, revealing unidirectional spillovers in E7 markets and bidirectional spillovers in G7 markets. Similarly, Balcilar et al. (2022) used quantile VAR to demonstrate stronger volatility spillovers in the tails of the return distribution, especially during economic disruptions such as the COVID-19 pandemic. Uzonwanne (2021) found that interactions between cryptocurrency and the stock market varied significantly across different financial market conditions.
Other studies using different methodological approaches further validate these findings. Kristjanpoller et al. (2020) applied MF-ADCCA and identified asymmetric multifractality between stock and cryptocurrency markets, while Jia et al. (2023) employed quantile regression to highlight asymmetric effects between Bitcoin, gold, and stock market returns in China. Moreover, Kumah and Odei-Mensah (2021) and Li et al. (2023) confirmed that digital currencies act as primary transmitters of risk across multiple frequencies.
The hedge and safe-haven properties of cryptocurrencies have been widely debated in the literature. Bouri et al. (2021) and Corbet et al. (2020) established that Bitcoin exhibits hedge and safe-haven properties, particularly during financial crises. However, the degree of these characteristics remains uncertain. Dyhrberg (2016) compared Bitcoin to gold, suggesting that it could serve as a hedge against certain asset classes. Wang et al. (2019) further demonstrated that Bitcoin serves as a haven during market downturns but lacks strong hedging capabilities.
Several studies highlight the conditional nature of these properties. Jeribi et al. (2021) applied NARDL to show that cryptocurrencies acted as safe havens for BRICS stock markets before and during the COVID-19 crisis. Similarly, Tan et al. (2023) discovered that the hedging and safe-haven potential of cryptocurrencies varied across different market environments, with Bitcoin and Litecoin serving as safe havens for Japan’s equity market but not for others. Furthermore, Goodell and Goutte (2021) argued that Tether was a reliable safe haven for global indices during the COVID-19 pandemic due to its stable value peg to the US dollar.
The role of cryptocurrencies as portfolio diversifiers has been examined extensively. Flori (2019) and Jeribi et al. (2022) noted that Bitcoin’s weak correlation with traditional asset classes makes it an attractive diversification tool. Fernandes et al. (2022) examined informational efficiency and price instability and concluded that cryptocurrencies offer potential benefits for diversifying liquidity risk. Hatemi-J et al. (2022) analysed different diversification strategies and found that adding Bitcoin to a portfolio increased return per unit of risk.
Conversely, some studies have challenged the benefits of cryptocurrency diversification. Goodell and Goutte (2021) found mild positive co-movement between cryptocurrencies and equities, suggesting limited diversification benefits. Similarly, Balcilar et al. (2022) concluded that cryptocurrencies did not serve as effective long- or short-run diversifiers for emerging stock markets. Demiralay and Bayraci (2021) further noted that while digital assets enhanced portfolio diversification during stable periods, their effectiveness declined during financial crises.
Among the limited studies employing time-frequency methodologies to examine the relationship between cryptocurrencies and stock markets, Jana and Sahu (2024) explore the dynamic interplay between four cryptocurrencies—Bitcoin, Ethereum, Dogecoin, and Cardano—and the Indian equity market. Using a wavelet approach on daily data from October 2017 to September 2023, they assess whether these digital assets can act as safe havens, hedges, or diversifiers. Their results indicate that events such as the pandemic and the Russian invasion of Ukraine increased volatility in both markets and that the correlation between stock and cryptocurrency returns intensifies during periods of financial distress. This outcome suggests that while cryptocurrencies may provide diversification or hedging benefits under normal market conditions, they are less effective during times of financial turmoil.
Similarly, Umar et al. (2020) investigate the dynamic connections between several major cryptocurrencies and stock market indices using ADCC and wavelet coherence methods. They find that correlations between these assets fluctuate over time, with negative shocks exerting a stronger impact than positive ones, thereby offering potential diversification opportunities for investors.
The existing literature provides compelling evidence of the interconnectedness between cryptocurrencies and stock markets, with mixed findings on their roles as hedges, safe havens, and diversification assets. However, none of these studies endeavoured to uncover whether this interconnectedness reflects financial contagion or interdependence between the two markets. Moreover, studies that apply wavelet analysis to the interconnectedness between cryptocurrencies and stock markets focus solely on visual interpretations of wavelet coherence results, without providing numerical interpretations. This paper addresses this shortcoming by complementing the visual insights from wavelet coherence analysis with numerical findings.
3. Methodology
Wavelet analysis has become a widely used method for examining localised power fluctuations in time series. A time series can be decomposed into the time–frequency domain to identify the primary modes of variability and their temporal variations. Wavelets can uncover links that are not readily apparent in aggregate data by breaking time series into distinct scales. Furthermore, scale-based estimators for variance and correlation can often be derived by exploiting properties of wavelet coefficients, and significant difference tests can be performed.
In this study, we conduct a comprehensive wavelet analysis, with the steps outlined in the next subsections. The study follows the methodology used in (Bonga-Bonga & Mpoha, 2024).
3.1. Maximal Overlap Discrete Wavelet Transforms (MODWT)
In practical applications, the discrete wavelet transform (DWT) can effectively analyse time series in the time-frequency domain. The foundation of wavelet analysis is the creation of two wavelets, one for the high-frequency components (mother wavelet) and one for the low-frequency components (father wavelet), and their integration throughout the whole 0 to 1 time range, as follows:
where is the factor for scaling and is the factor for translation. The following are the father wavelet smoothing coefficients and the mother wavelet detail coefficients:
Consequently, the wavelet expression for the sequence can be expressed as a linear combination of wavelet functions, as the following example illustrates (Sun et al., 2024):
The orthogonal component is given by and for where denotes the smoothing detail component and denotes the layer wavelet component (Sun et al., 2024).
Following Bonga-Bonga and Mpoha (2024), wavelet scales D1, D2, D3, D4, D5, D6, D7 and D8 indicate 2–4 days, 4–8 days, 8–16 days, 16–32 days, 32–64 days, 64–128 days, 128–256 days and 256–512 days, respectively. D1, D2, and D3 denote the short-term scale; D4, D5, D6, and D7 denote the medium term; and D8 denotes the long-term scale.
We use MODWT to analyse each market series’ multi-resolution characteristics throughout a range of time periods without losing any information.
3.2. Continuous Wavelet Transform (CWT)
The Morlet wavelet is used in this study as the basis function for the CWT. The method’s advantage is that it makes it easier to monitor the signal component at any desired frequency than DWT (see S. J. Huang & Hsieh, 2000).
The mother wavelet employed in CWT has two wavelet factors: the scale factor b, which modifies the frequency variation, and the shift factor a, which establishes the wavelet’s location in the time domain. According to Daubechies (1992), the equation that defines the mother wavelet is given by the equation below:
The equation below denotes a CWT for a time series :
The process involves converting the wavelet scale factor b and localising along the shift factor a to obtain the wavelet power spectrum, which represents the time series’ highest fluctuations in a particular time-frequency domain.
3.3. Wavelet Coherence (WTC)
To capture the bivariate connections (degree of interdependence) between markets, wavelet coherence is employed in this study. The cross wavelet of two time series, and , is defined as follows:
The * symbol denotes the complex conjugate. Cross wavelets can represent the correlation between two sequences in a specific time-frequency domain. These correlations, also known as square wavelet coherence coefficients, are as follows:
where S stands for a particular smoothing operator to guarantee that the cross-wavelet coherence is in the range of zero to one. A suitable definition of wavelet-squared coherence is the squared absolute value of the smoothed cross-wavelet power spectra corrected by the product of the smoothed individual wavelet power spectra of each selected signal (Bonga-Bonga & Mpoha, 2024).
The cross-wavelet power spectra, , draw attention to areas of the time-frequency space where the signals exhibit strong mutual strength.
Weak interdependence is identified if is close to zero; if is close to one, the opposite is true. To that end, by contrasting the size of low-frequency and high-frequency coherences, contagion can be examined further across markets. Consequently, contagion may have occurred if the latter increases significantly over a given period while the former does not (Yang et al., 2016).
4. Data, Estimation, Results, and Discussion
This work makes a substantial contribution by analysing the behaviour of crypto markets and developed and emerging stock markets using signal processing, specifically timescale and frequency-domain decomposition. For this, the CWT and MODWT were employed. While CWT gently converted the scales by displaying their variations at a given time, MODWT decomposed the series into variations over a set of scales.
4.1. Data
The study uses daily cryptocurrency prices and stock prices from January 2018 to October 2024. Due to limited historical data for cryptocurrencies, this data range was deemed feasible to provide the study with sufficient coverage of different crypto events, offering some insight into interdependence and contagion. The data was sourced from Yahoo Finance and Thomson Reuters. The different market data included in the study are presented in Appendix A, Table A1. Bitcoin (BTC), Ethereum (ETH), and Binance Coin (BNB) were selected because they are among the largest and most actively traded cryptocurrencies, representing different segments of the digital asset ecosystem. The stock markets were selected to represent both developed and emerging economies with varying levels of financial market maturity, investor composition, and exposure to global capital flows. The S&P 500 (United States), Shanghai Composite Index (China), and NIKKEI 225 (Japan) represent major developed and systemically important equity markets that play a significant role in global financial price discovery and capital allocation. In contrast, the BSE Sensex (India), the Nigerian Stock Exchange All Share Index (Nigeria), and the MSCI Vietnam Index (Vietnam) represent emerging markets characterised by varying levels of market development, economic structures, and integration into global financial markets.
Before the experiments were performed in the study, the daily crypto and stock prices were first transformed into daily returns using the equation given below:
where denotes the market return, is the price at time and is the previous price or price at time .
The descriptive statistics of the data used, along with the data’s stationarity, are presented in Table 1. Stationarity of the data was checked using the Augmented Dickey–Fuller (ADF) test. Although stationarity is not important for analysis, we performed the stationarity test to check the trend of the data used. The mean return for cryptocurrencies is significantly higher than that of both developed and emerging markets, mainly due to cryptocurrencies’ high volatility. The standard deviation also indicates the high volatility of cryptocurrencies. We also observe that the market return volatility, measured by standard deviation, is somewhat higher in Nigeria and Vietnam than in other markets, both of which are emerging markets. The high volatility in Nigeria can be attributed to the country’s political instability and the recent economic crisis. The high volatility in Vietnam’s market returns can be attributed to the country’s socio-economic issues, particularly rural and child poverty. The high kurtosis observed in both markets, therefore, suggests that extreme events occur more frequently than would be predicted under a normal distribution, highlighting the importance of employing wavelet-based methods capable of capturing nonlinear and time-varying market dynamics.
Table 1.
Descriptive statistics.
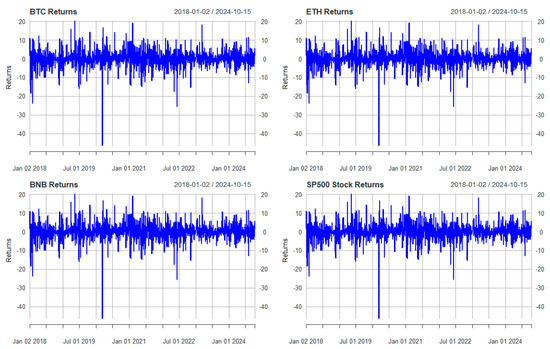
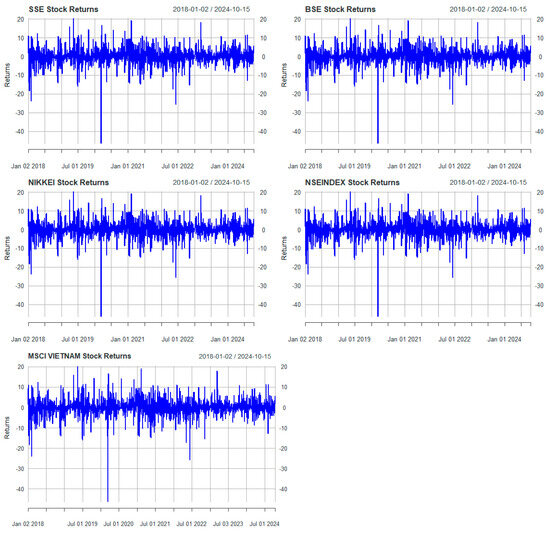
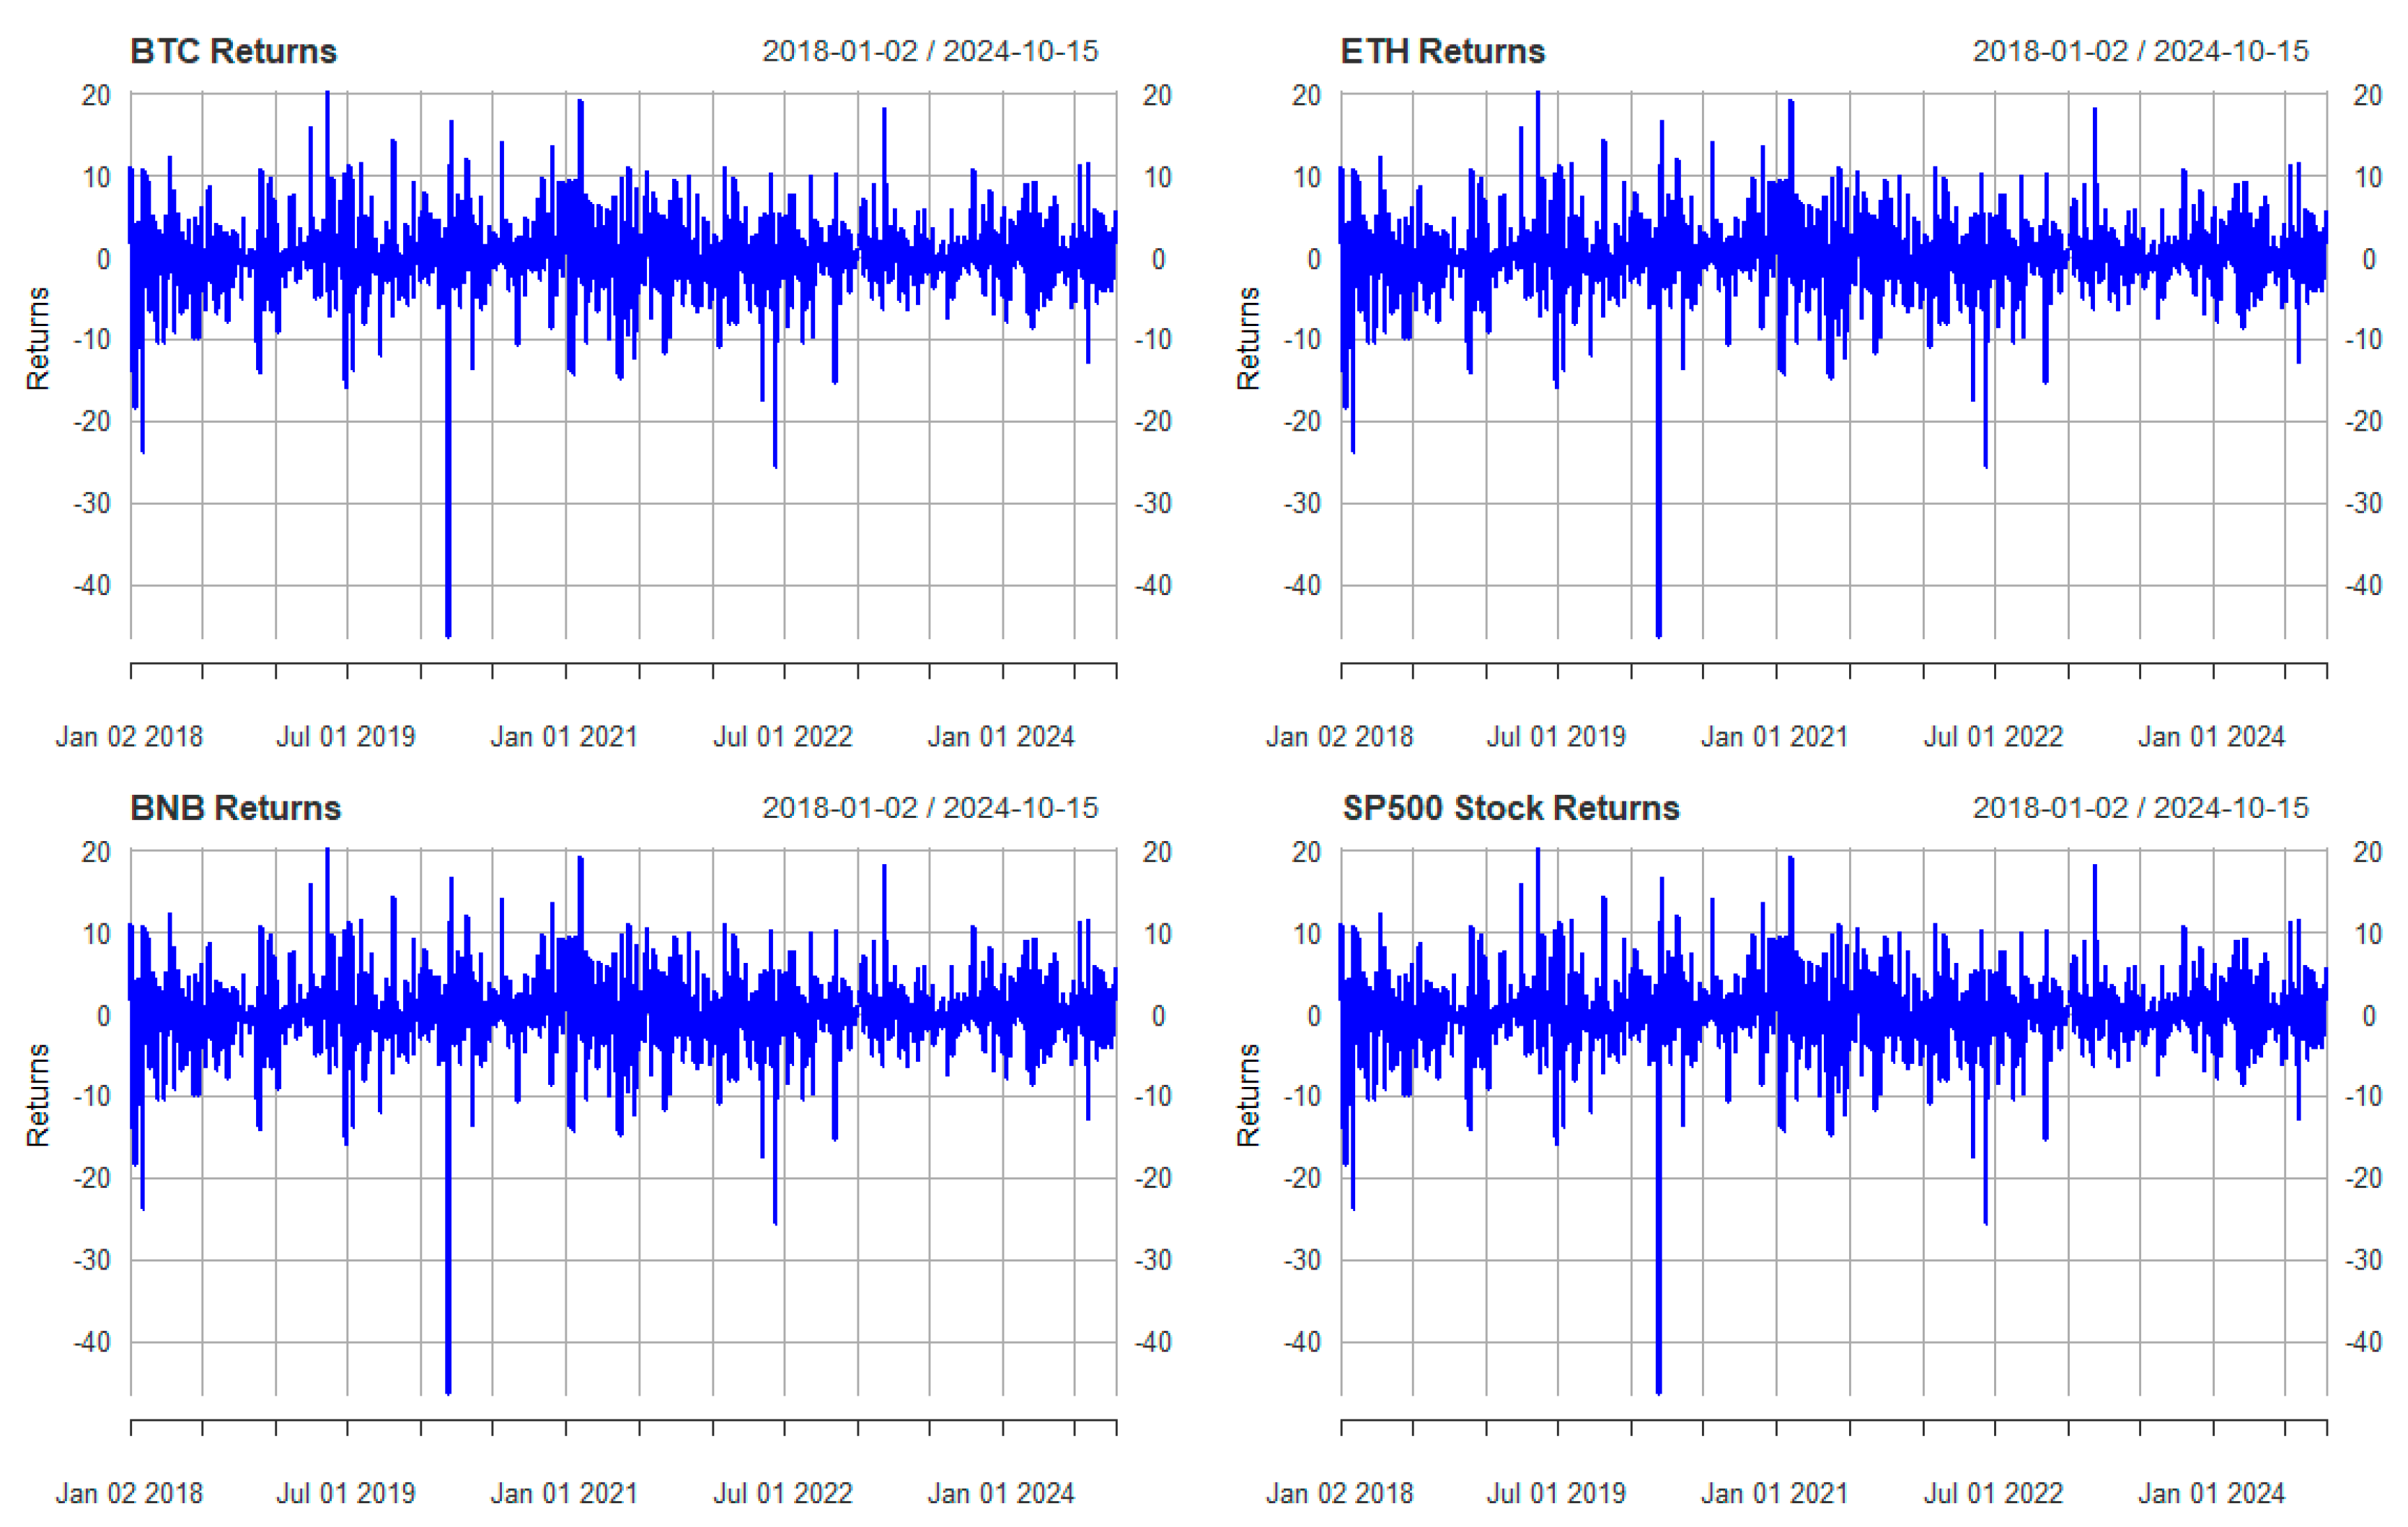
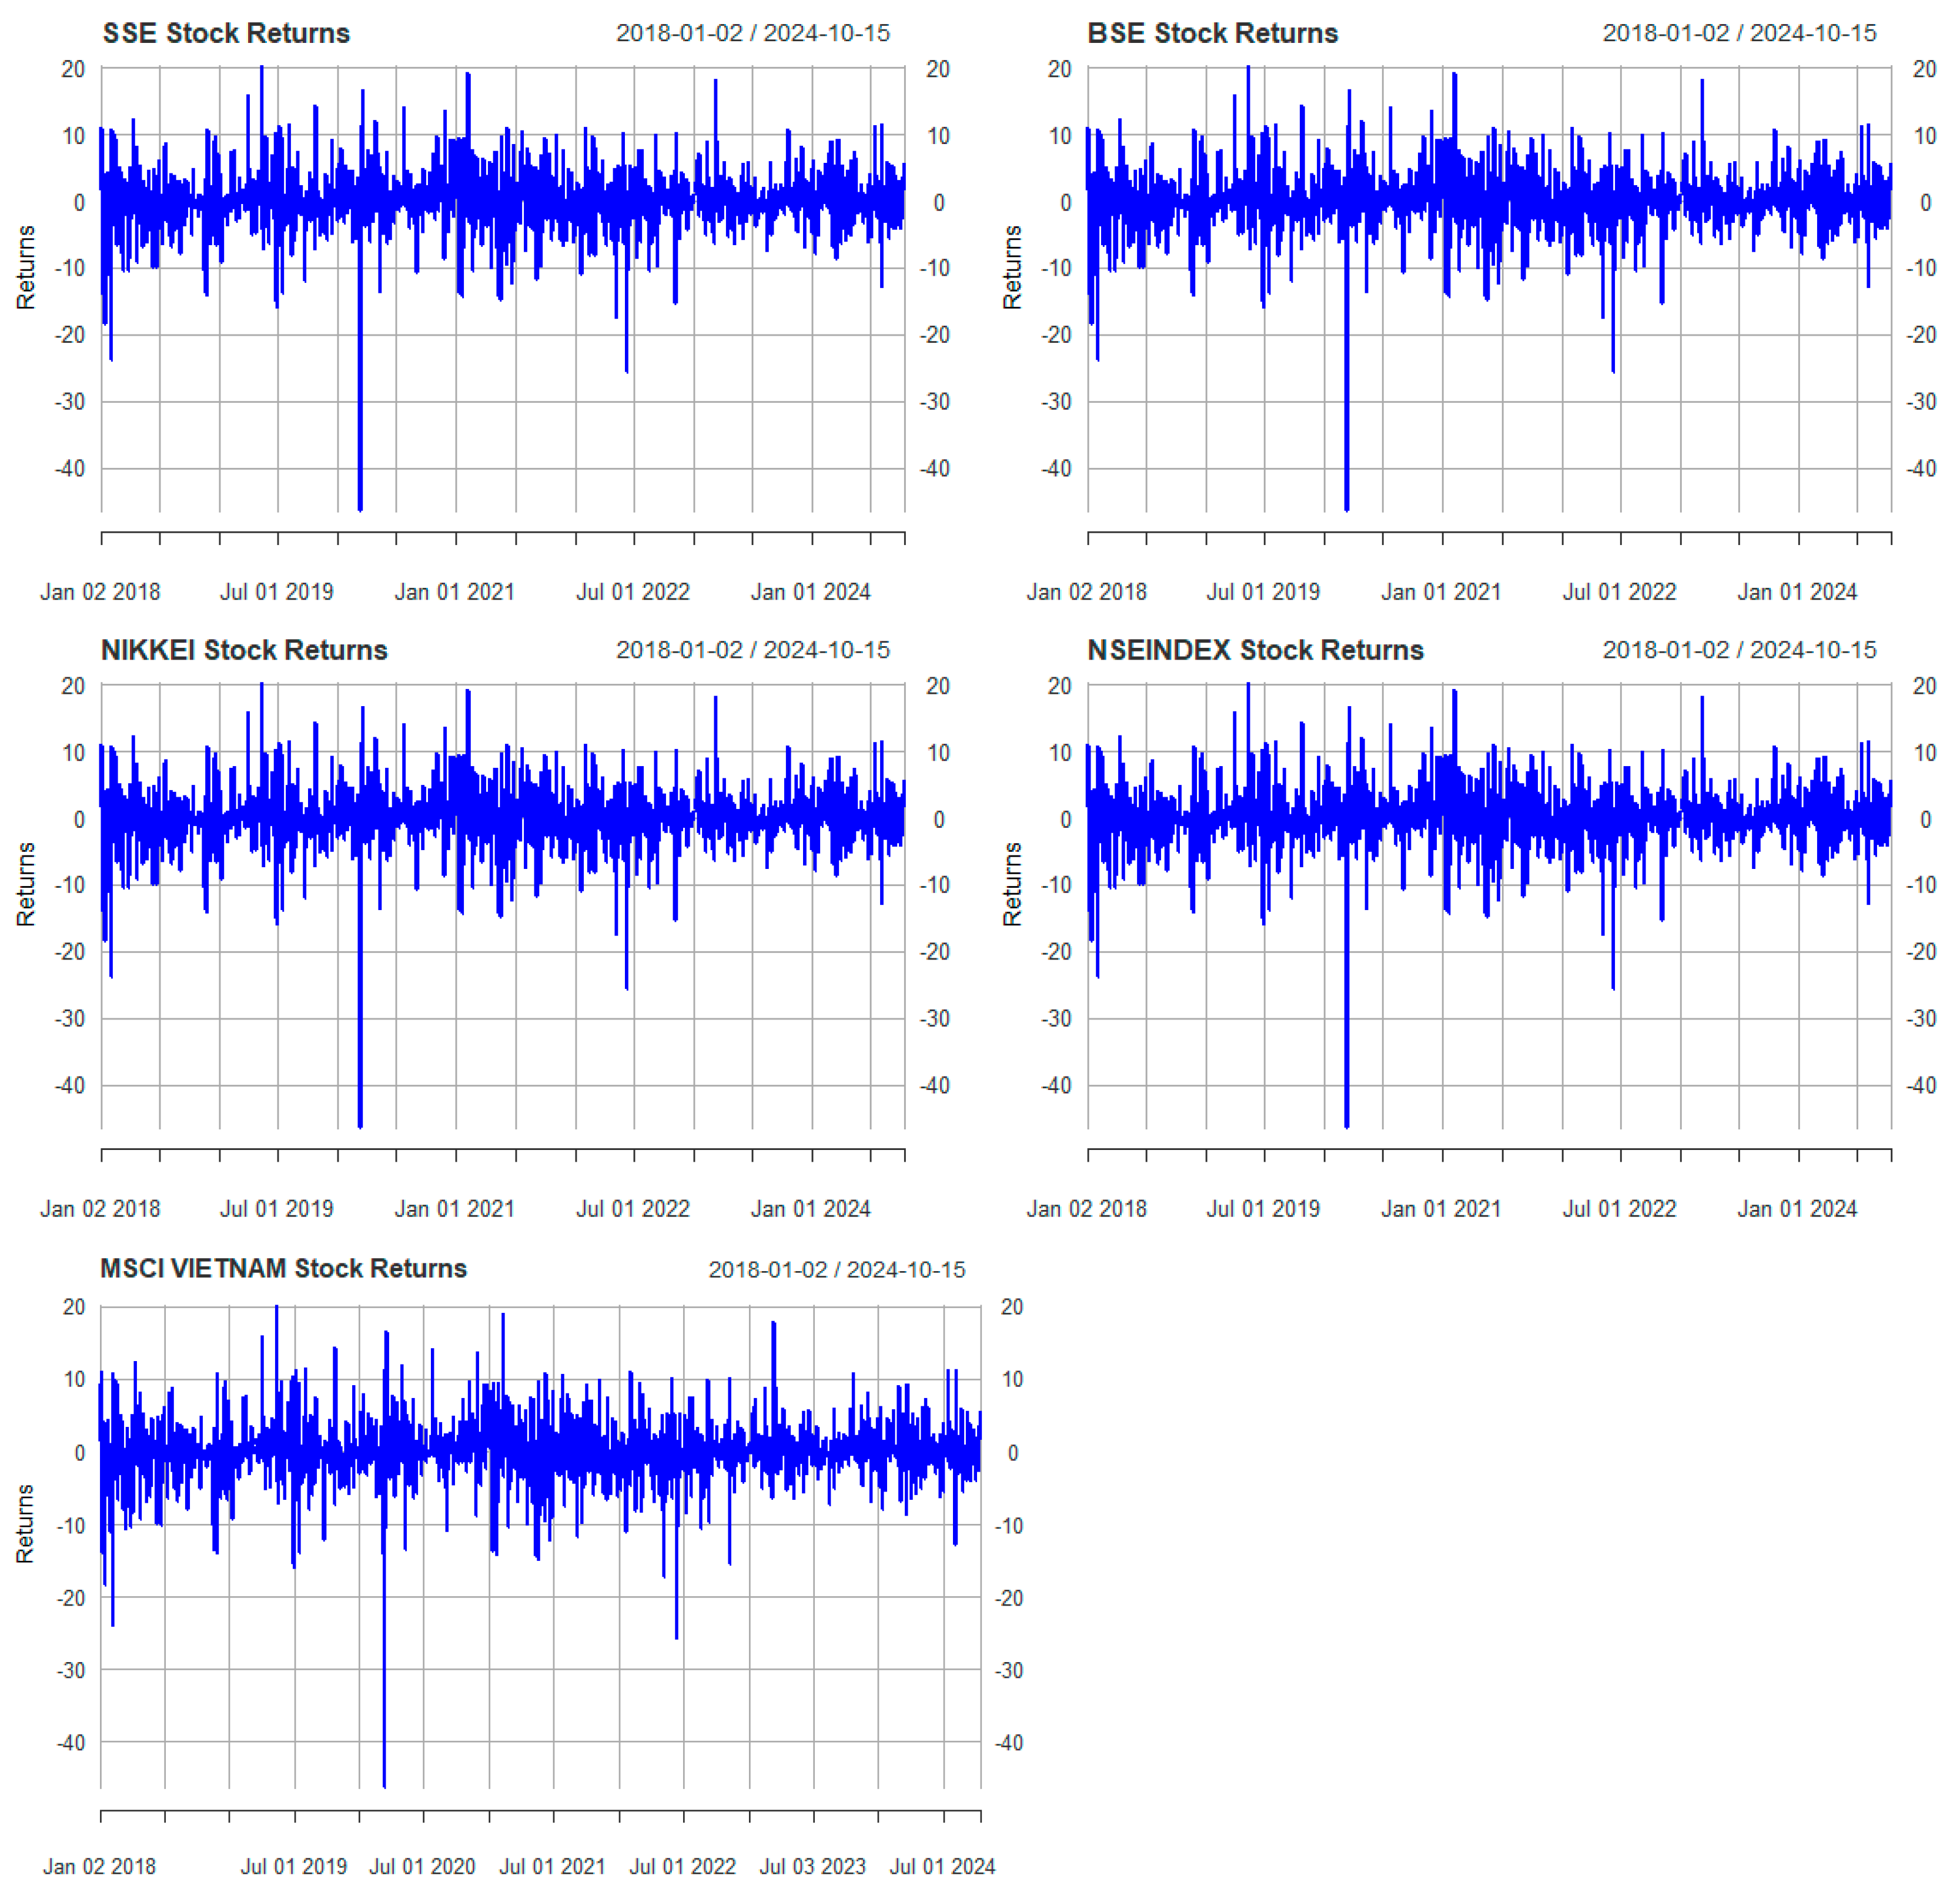
The skewness coefficients are negative for all returns, indicating left-skewed distributions. The kurtosis is quite high across all returns, all above 3, indicating a fat-tailed distribution. Figure 1 and Figure 2 present plots of market returns, which corroborate the market’s high volatility.
Figure 1.
Returns series.
Figure 2.
The MODWT wavelet decomposition of stock market returns.
4.2. Maximal Overlap Discrete Wavelet Transform (MODWT)
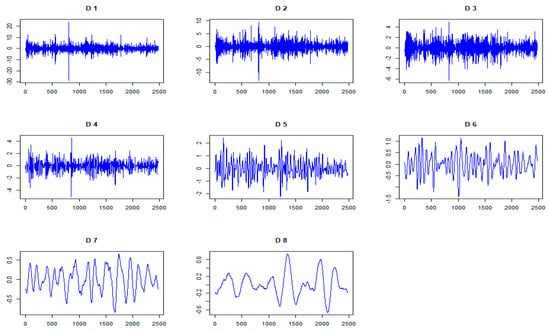
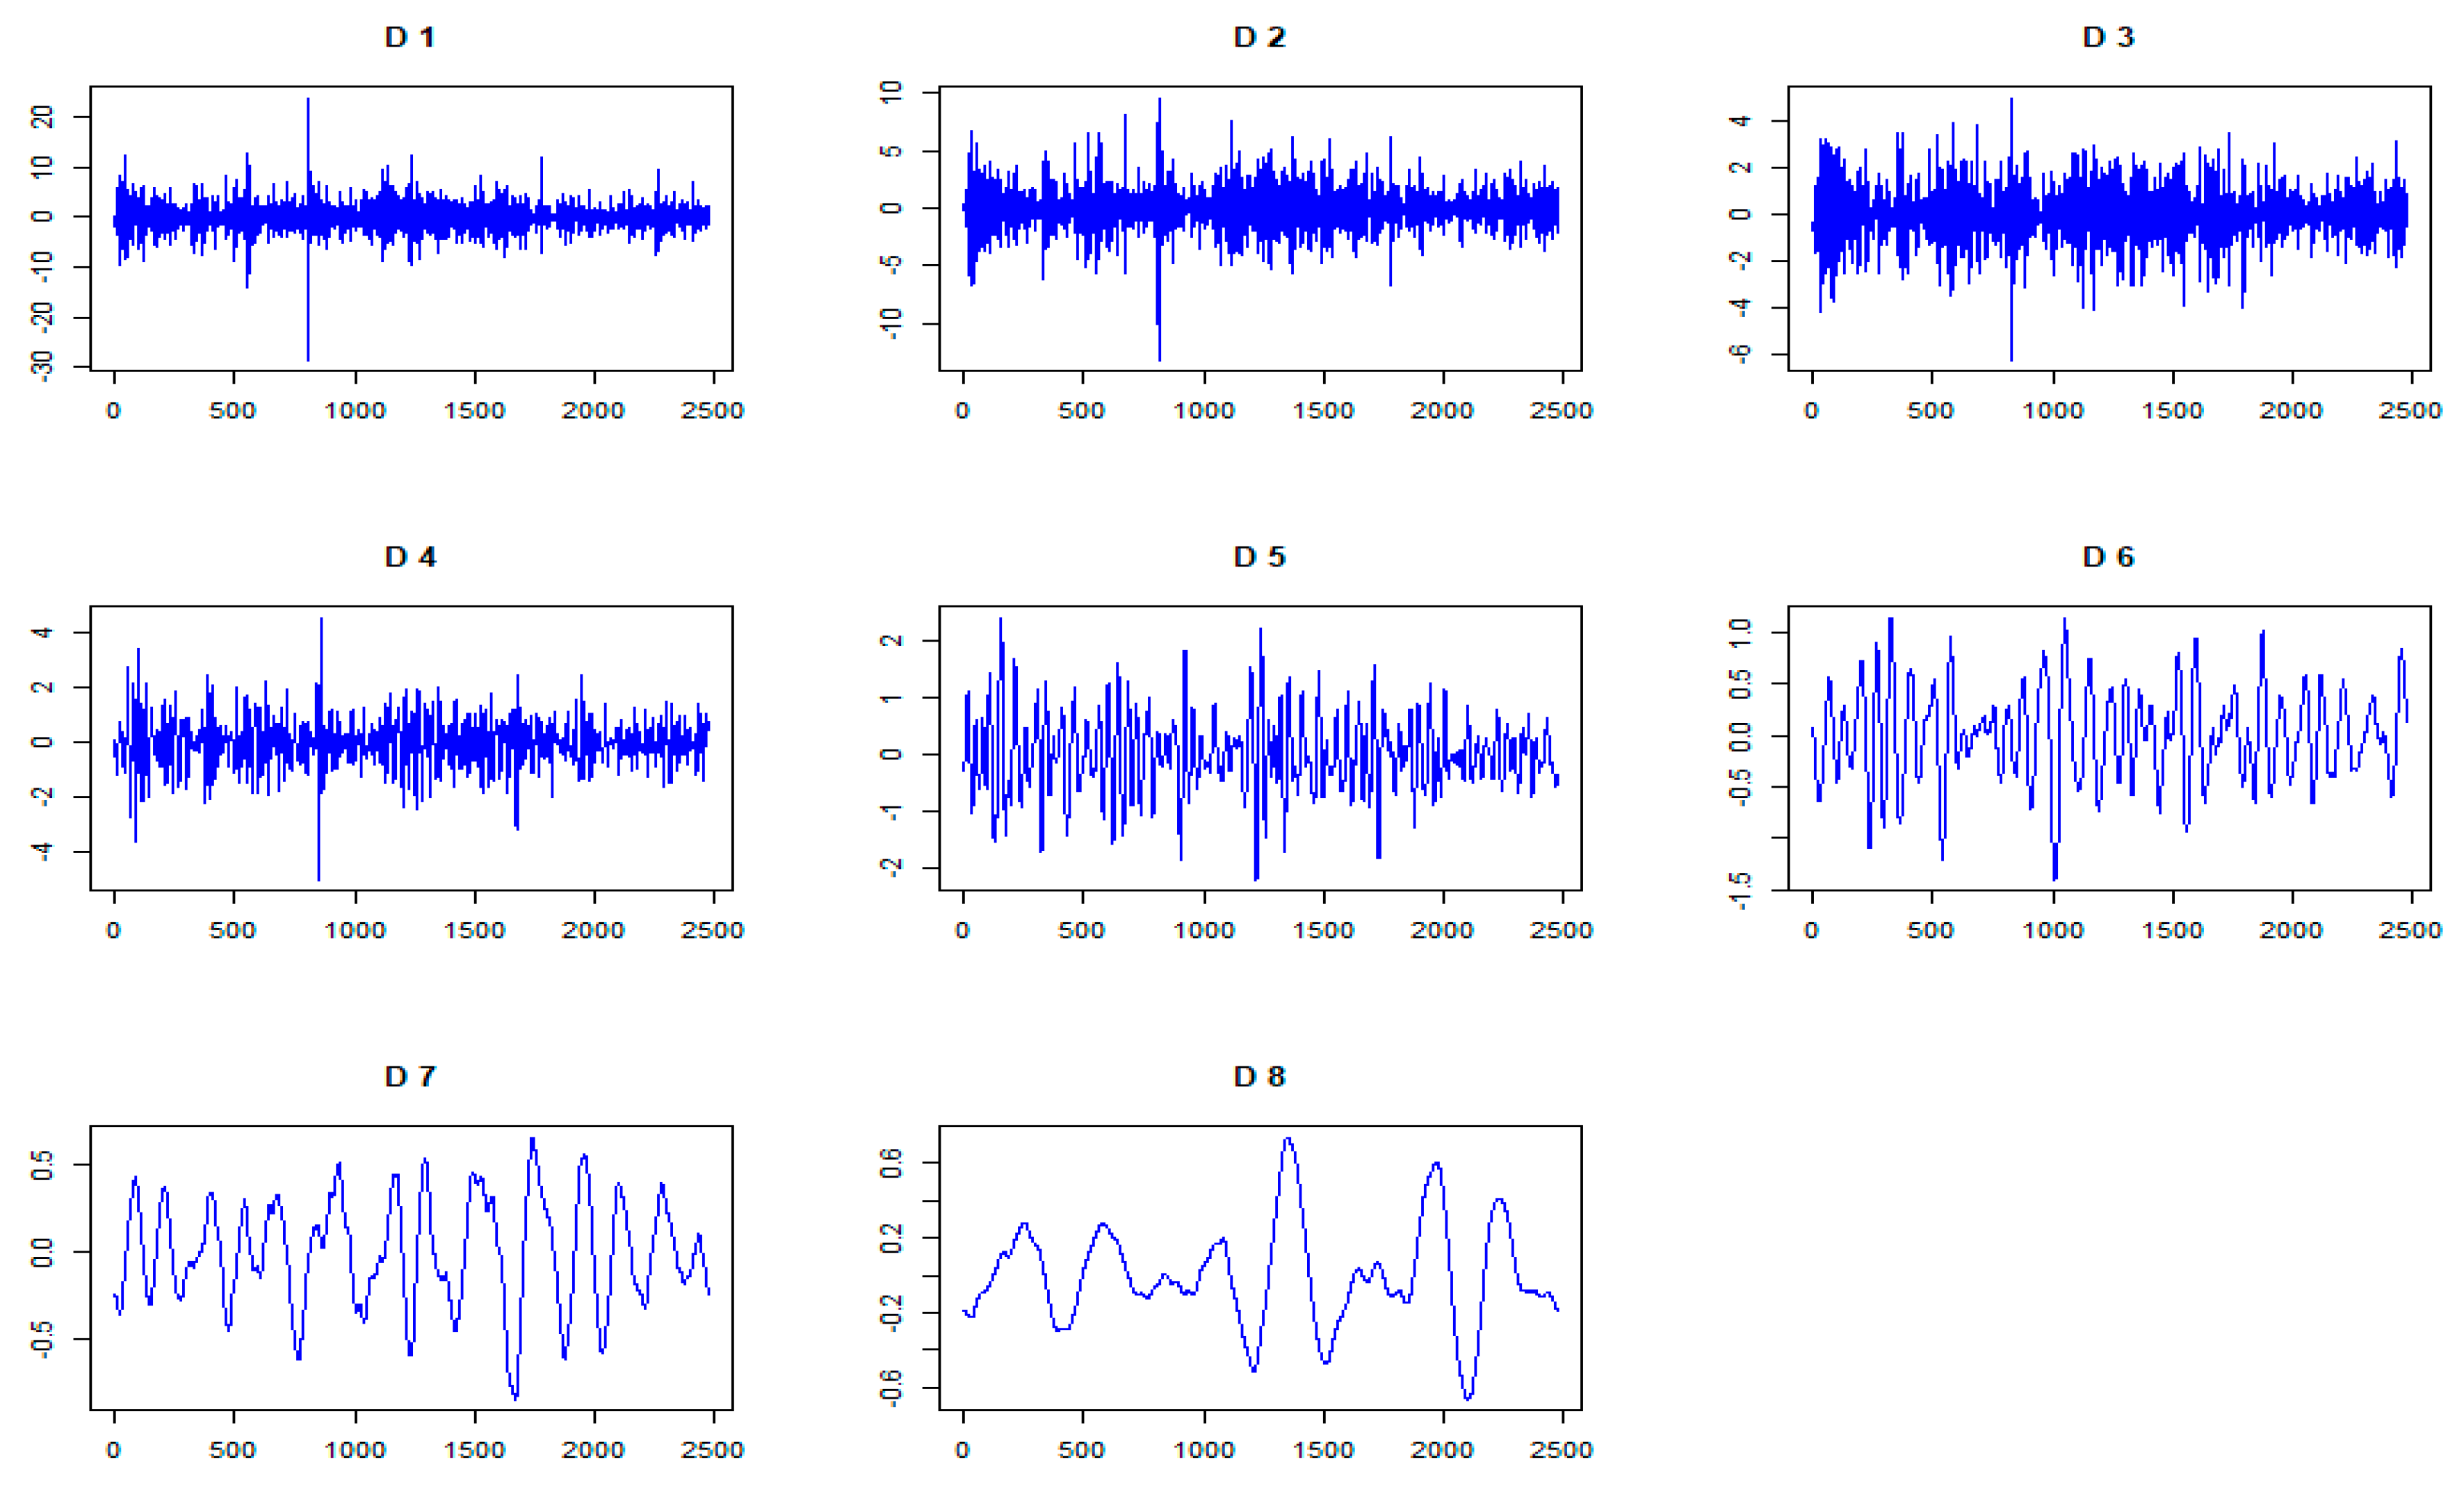
For each market series, the study decomposed the series at different frequencies using a maximal overlap wavelet transform with a length-8 (LA8) Daubechies Least Asymmetric filter and a level of decomposition equal to 8 (see Bonga-Bonga & Mpoha, 2024). As mentioned in the methodology section, the first four components (D1, D2, D3, and D4) exhibit short-term (high-frequency) variation driven by shocks that occur every 2, 4, 8, and 16 days, respectively. The medium-term variance is explained by the following three components (D5, D6, and D7), with frequencies of 32, 64, and 128 days, respectively. D8, on the other hand, shows long-term change at 256-day or more intervals.
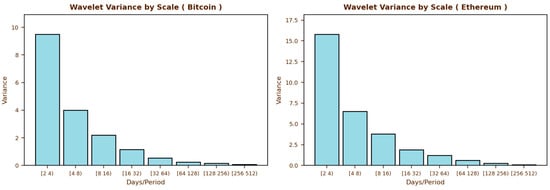
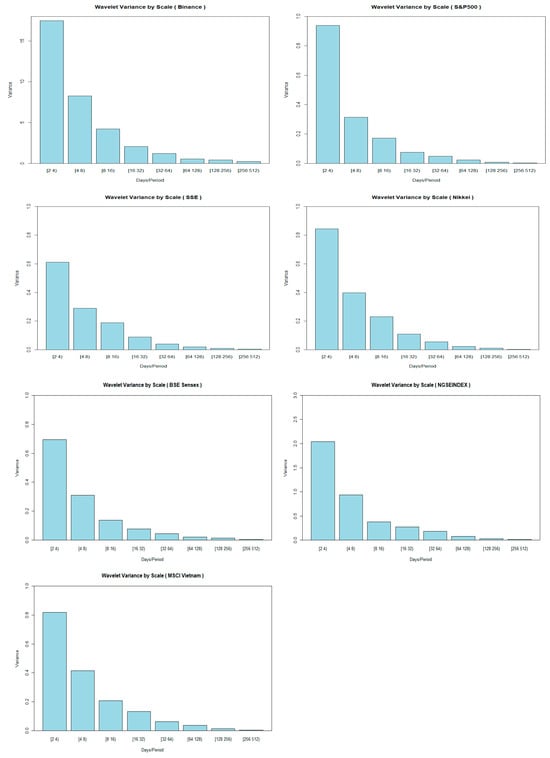
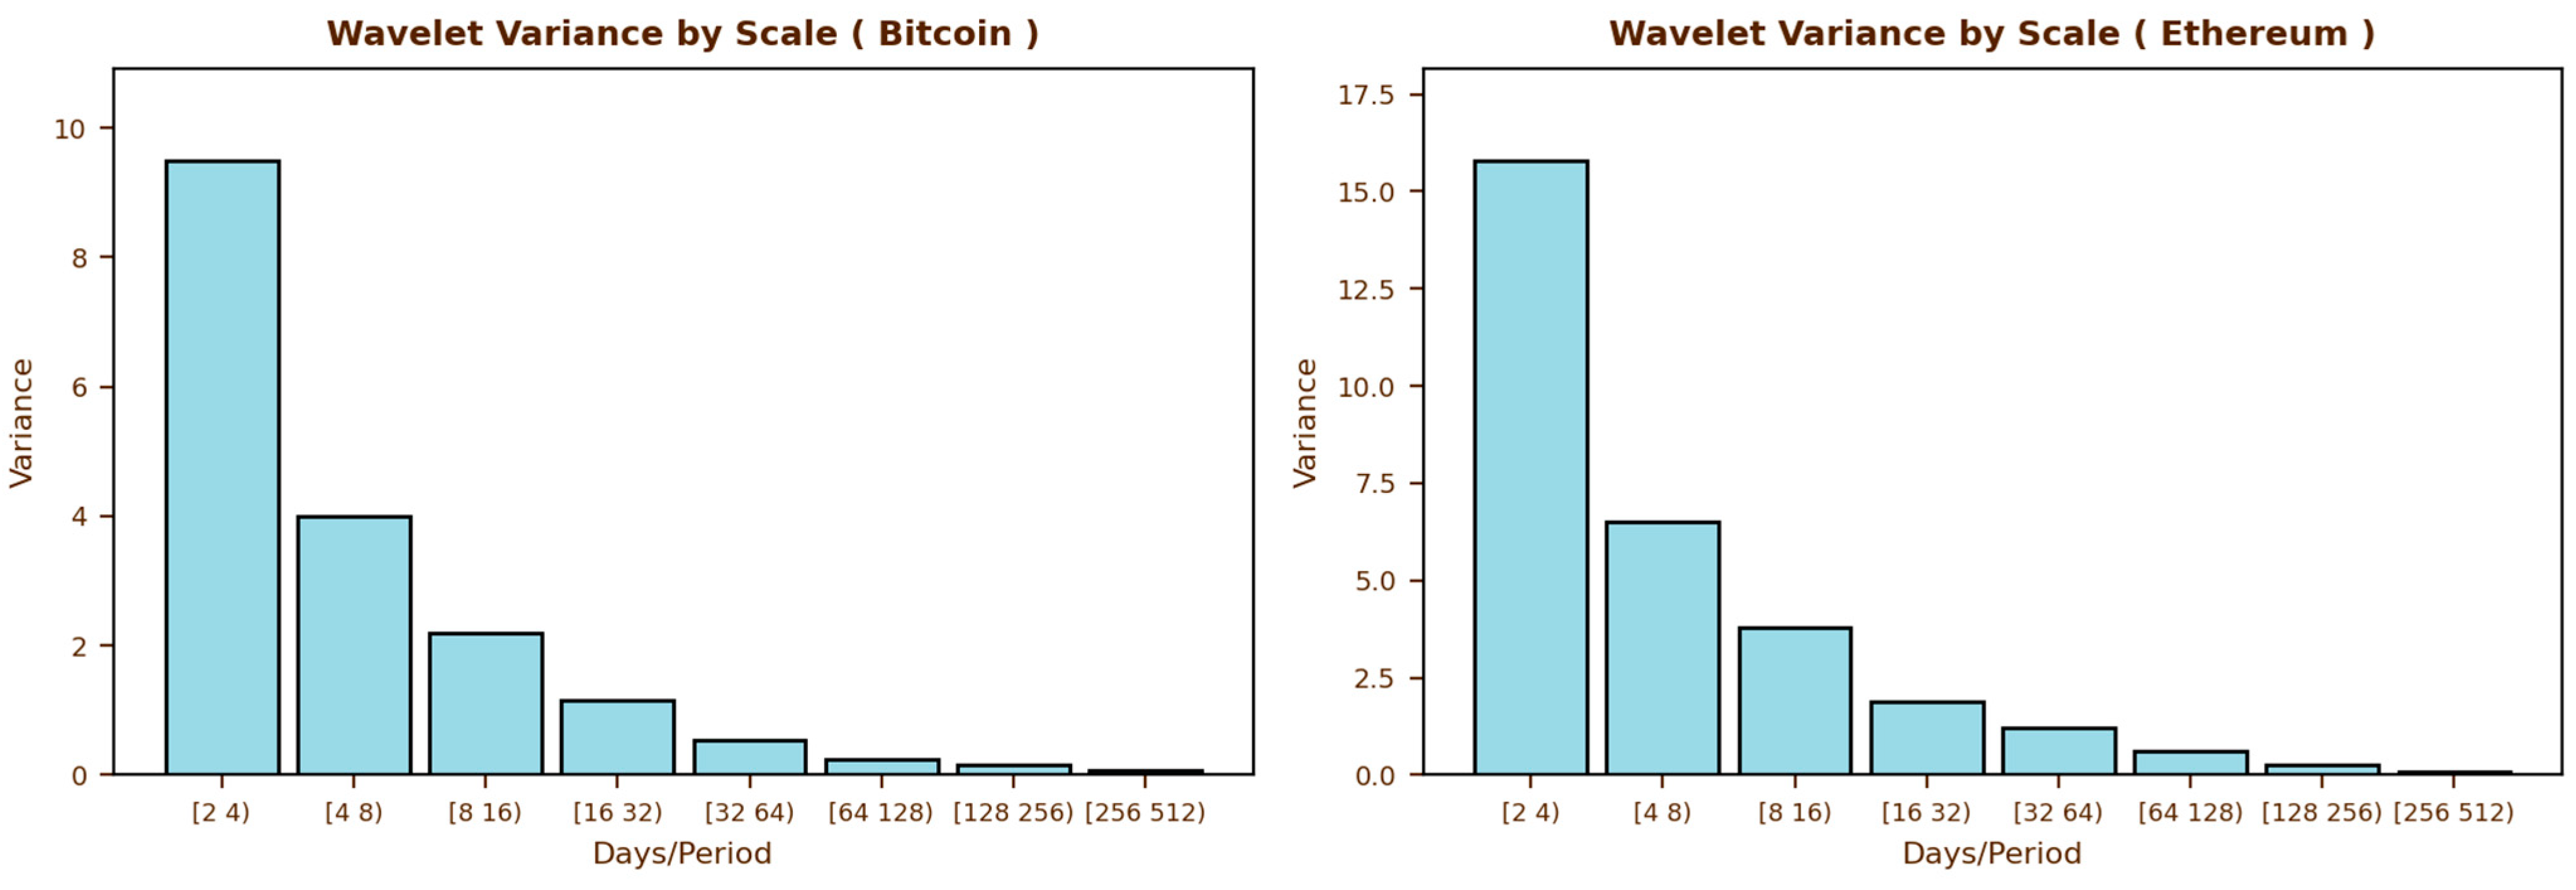
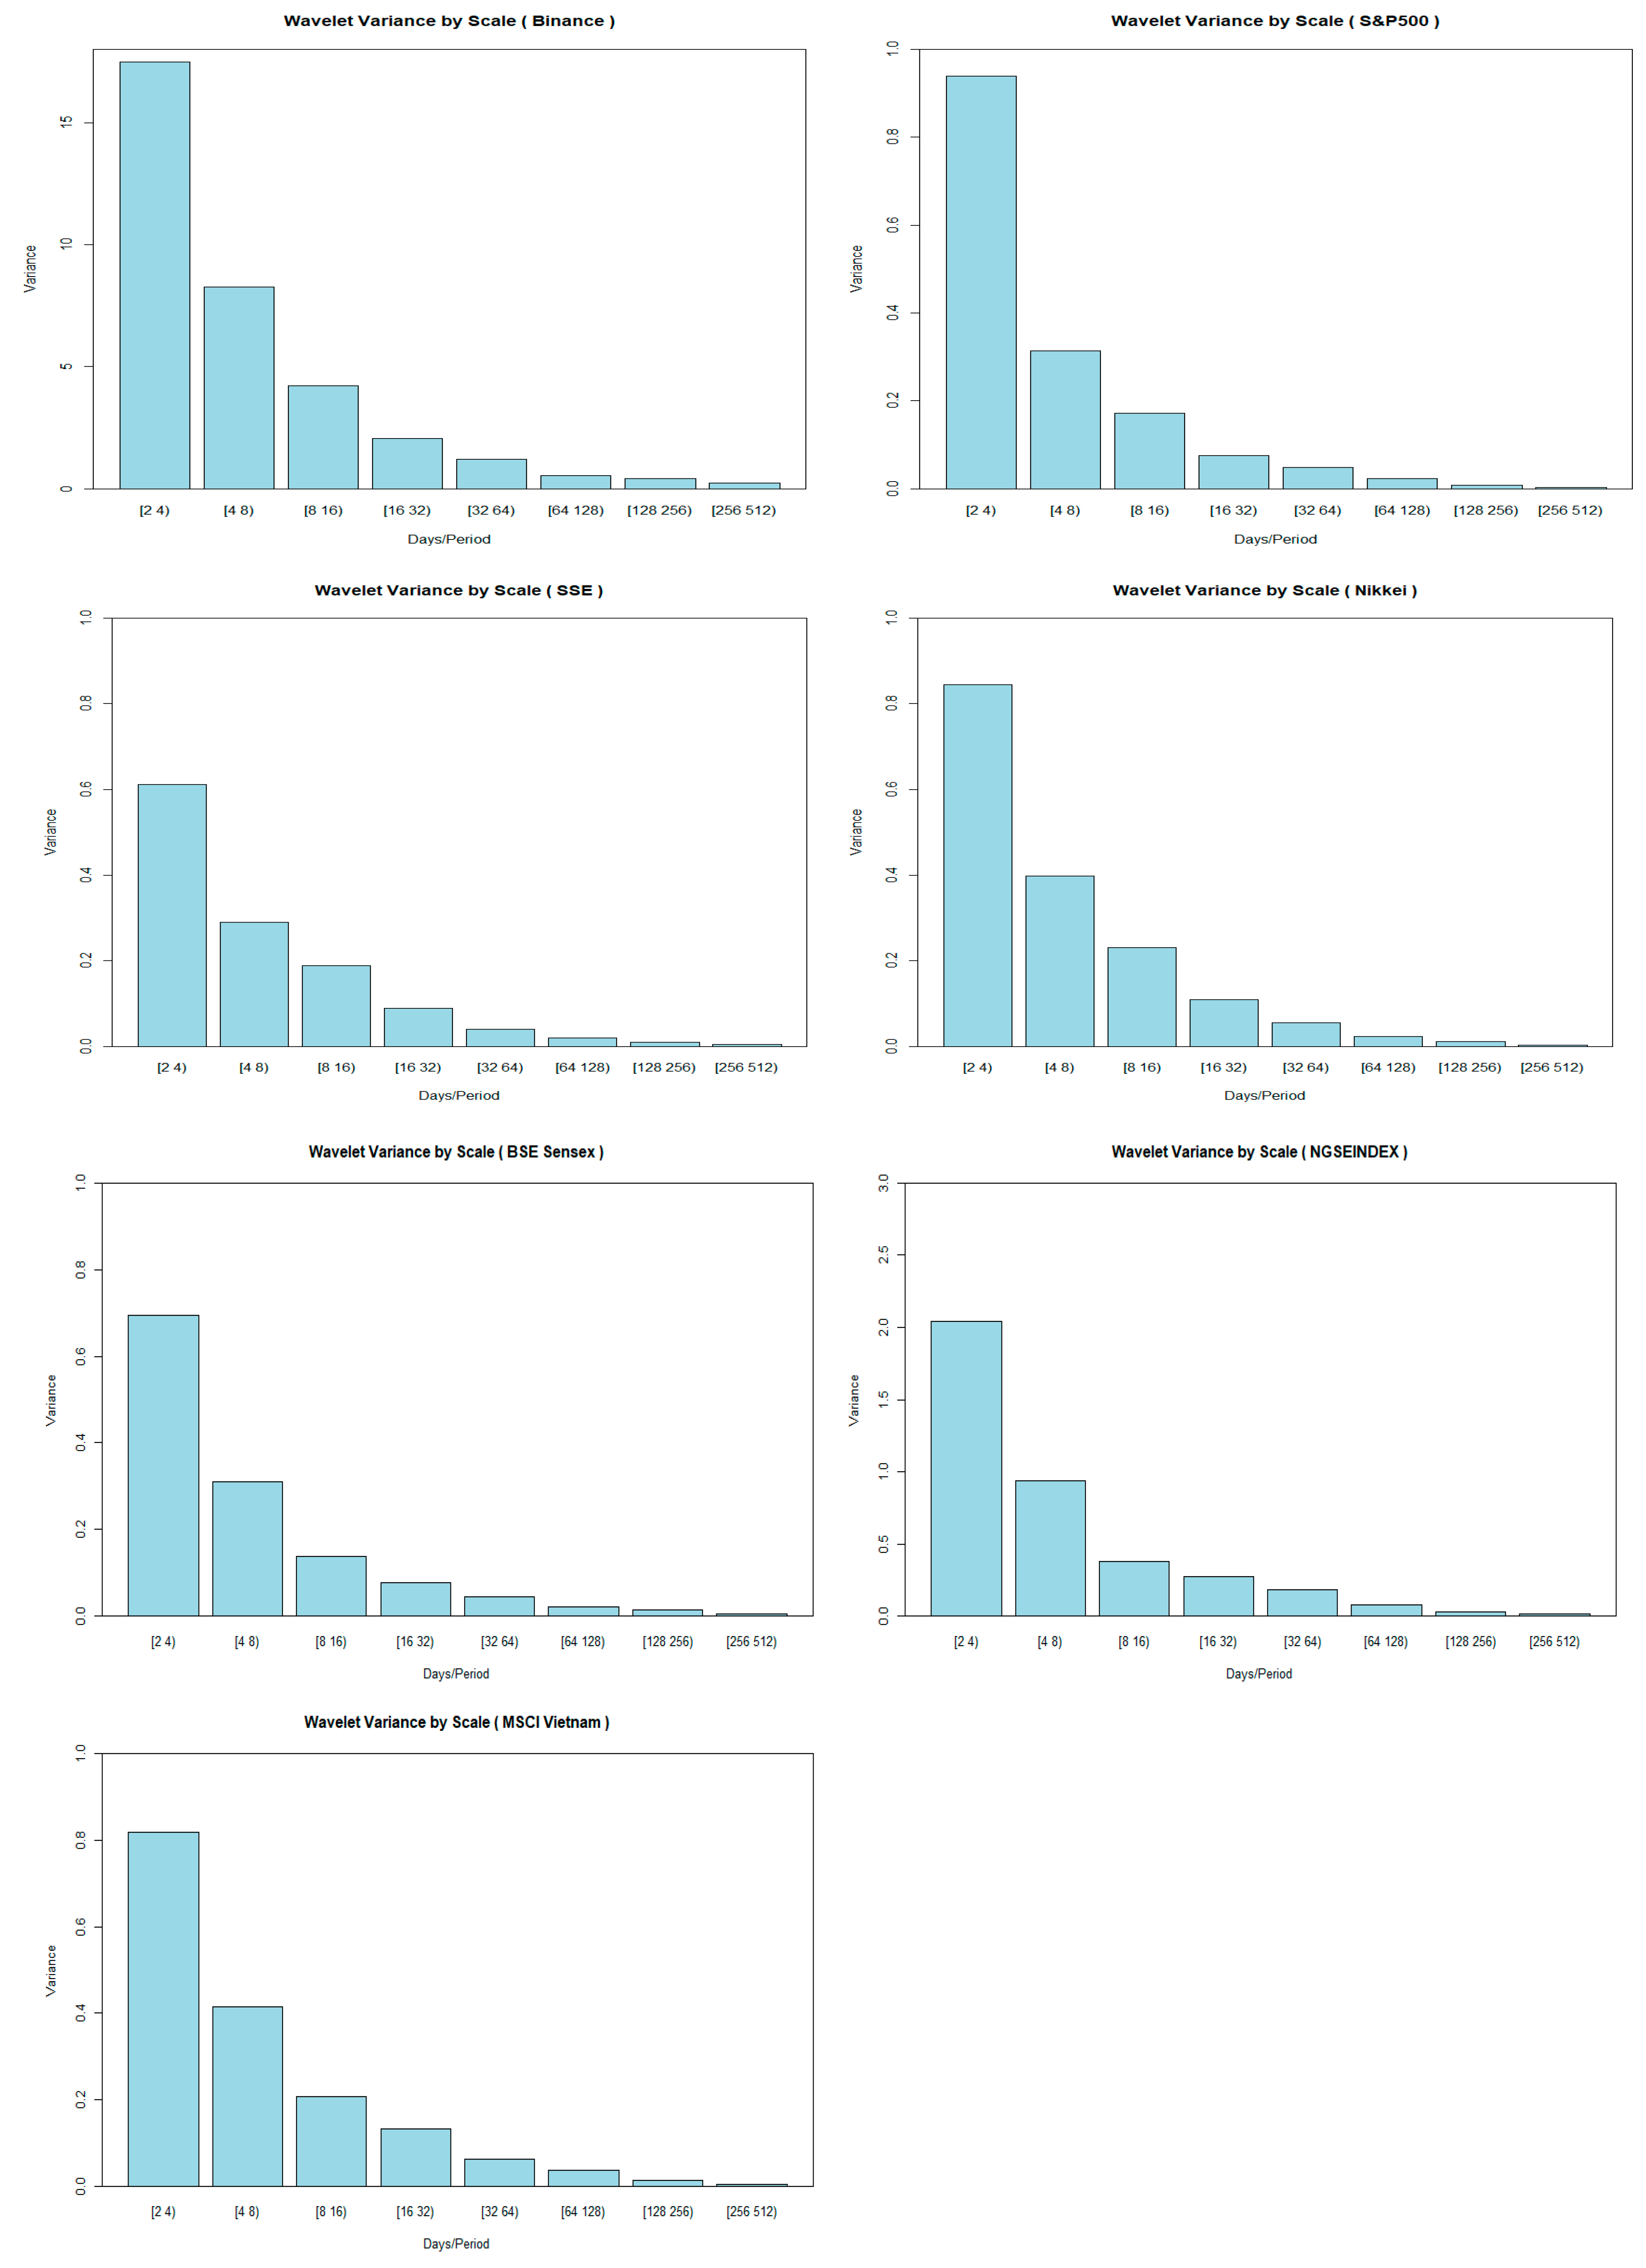
In Figure 2, we observe that the largest variance in market returns across all data in the investigation is explained by cycles of 2–4 days, according to wavelet decomposition results using the MODWT.
4.3. Continuous Wavelet Transform
The study used the Morlet wavelet in implementing CWT. Since MODWT cannot provide additional information on how volatility behaves over time across multiple time samples, the implementation of CWT aims to fill that gap.
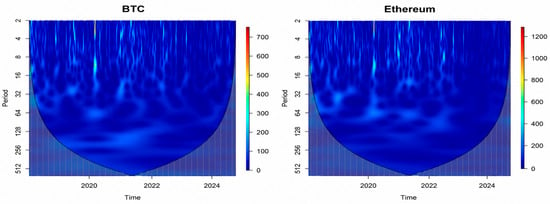
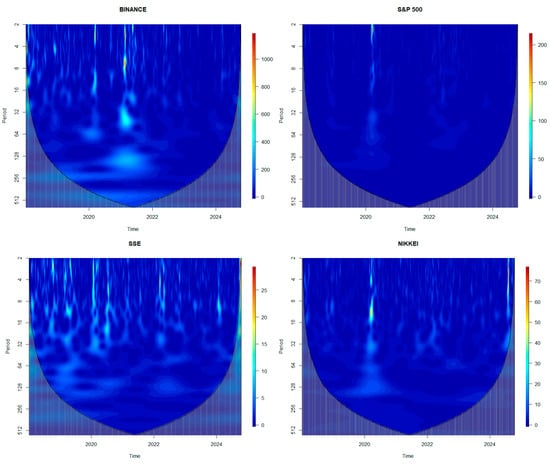
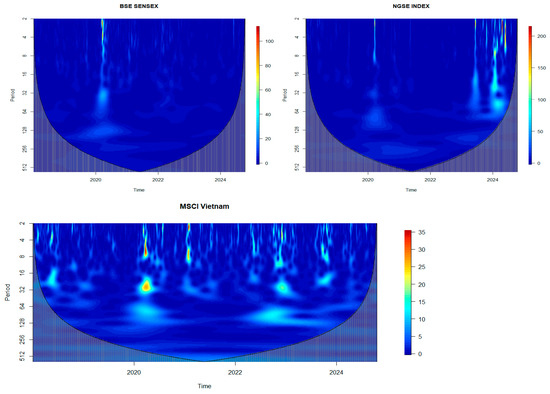
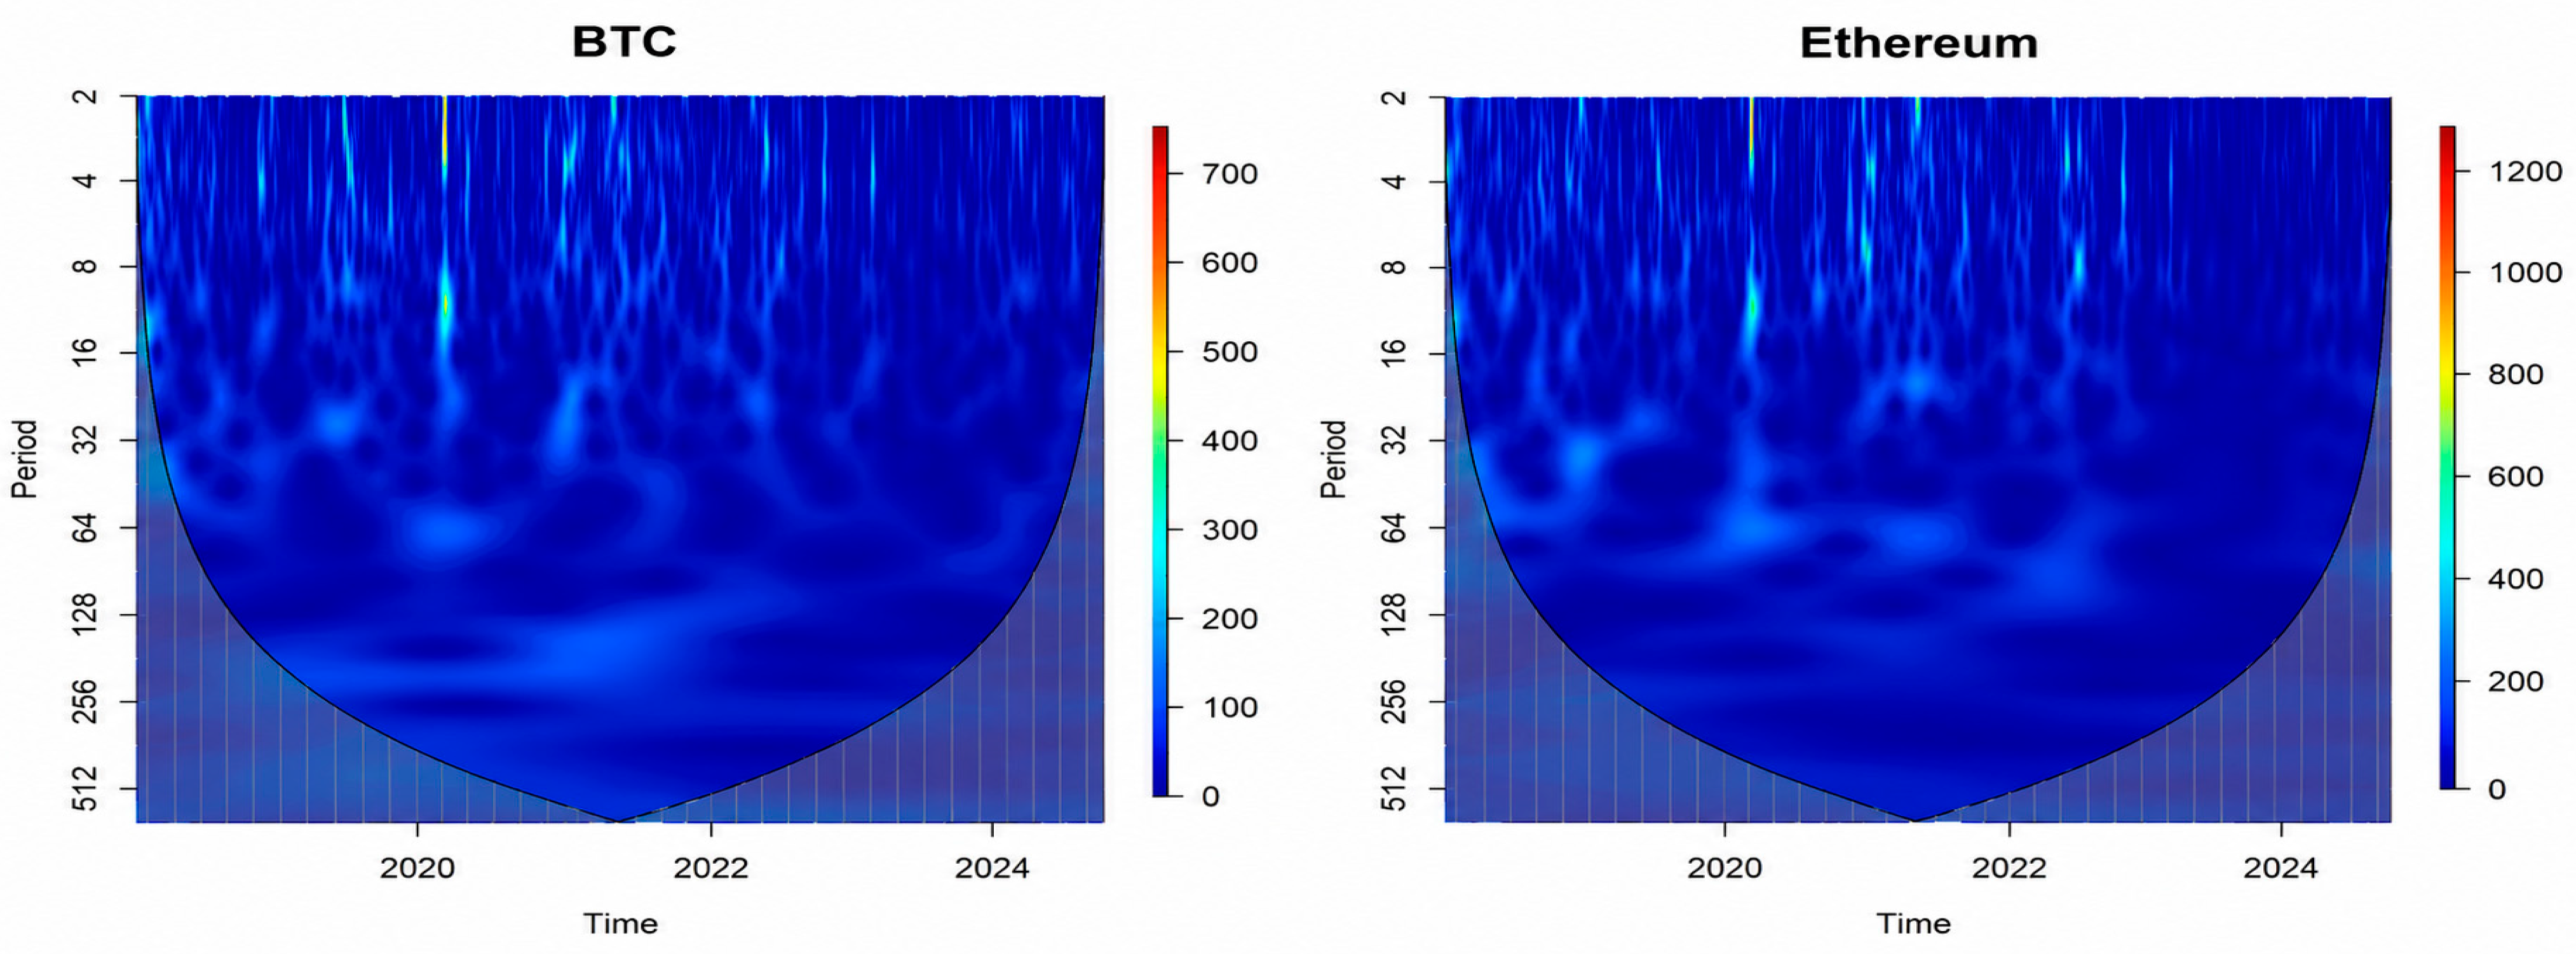
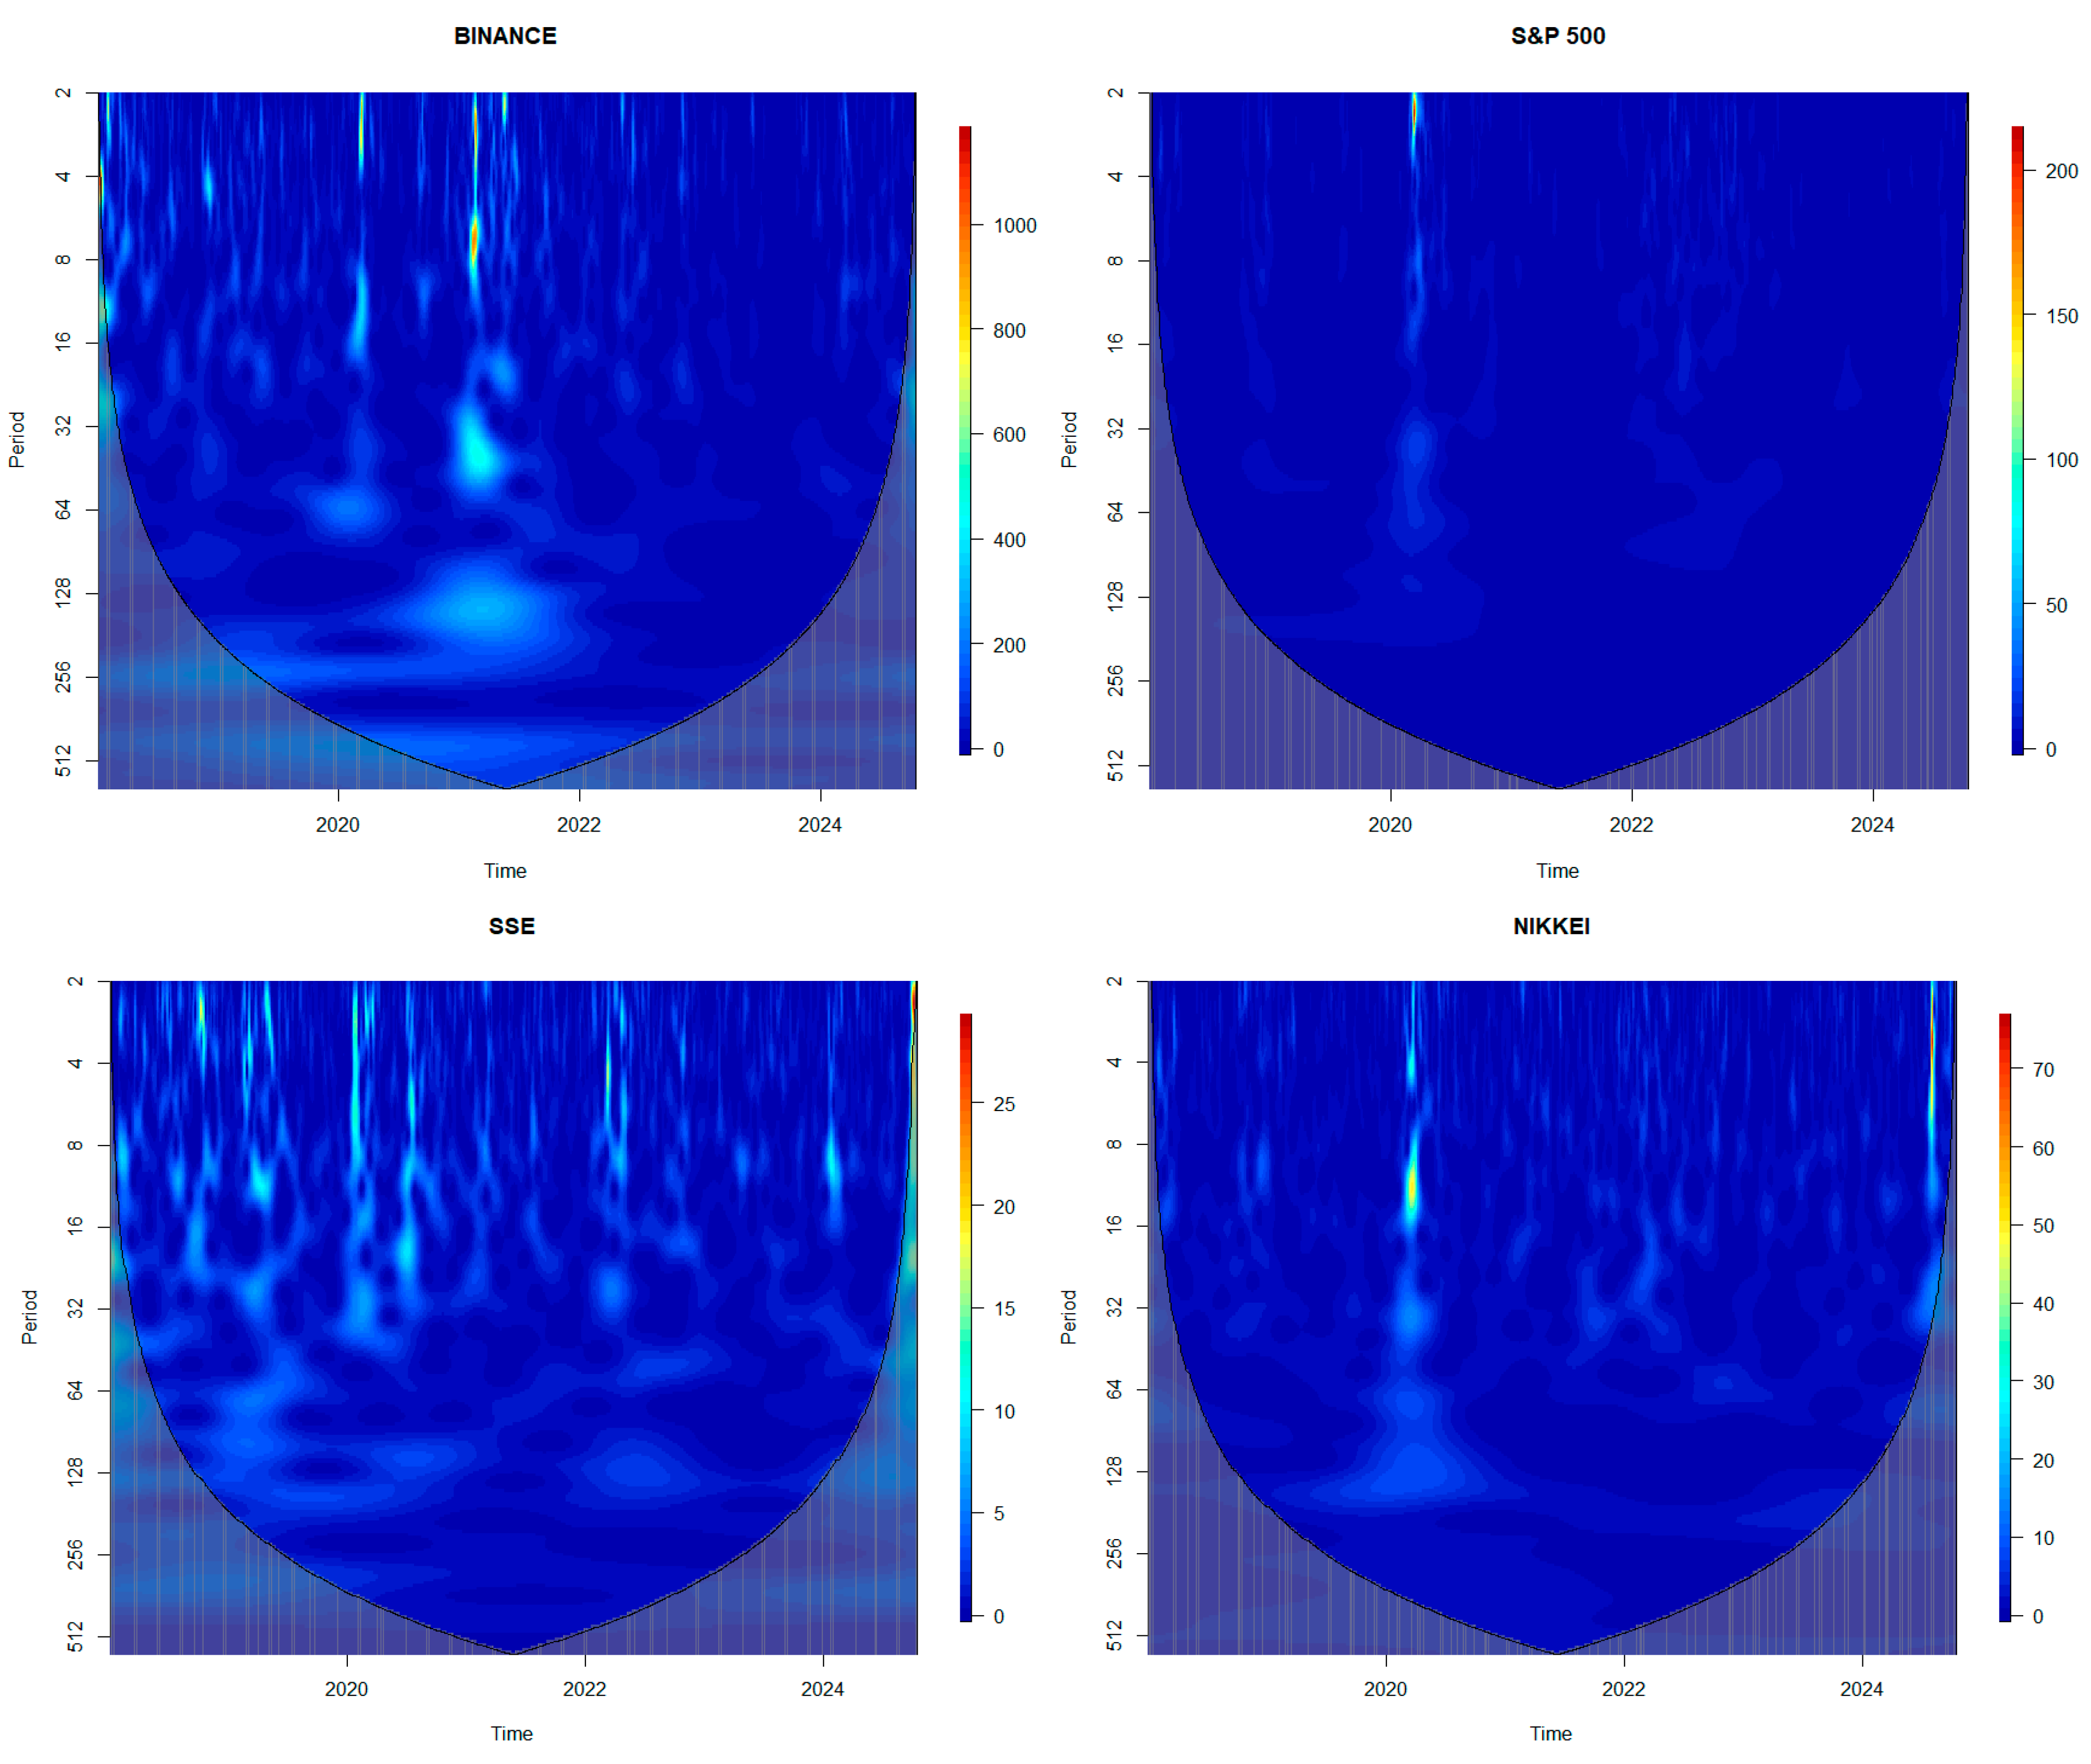
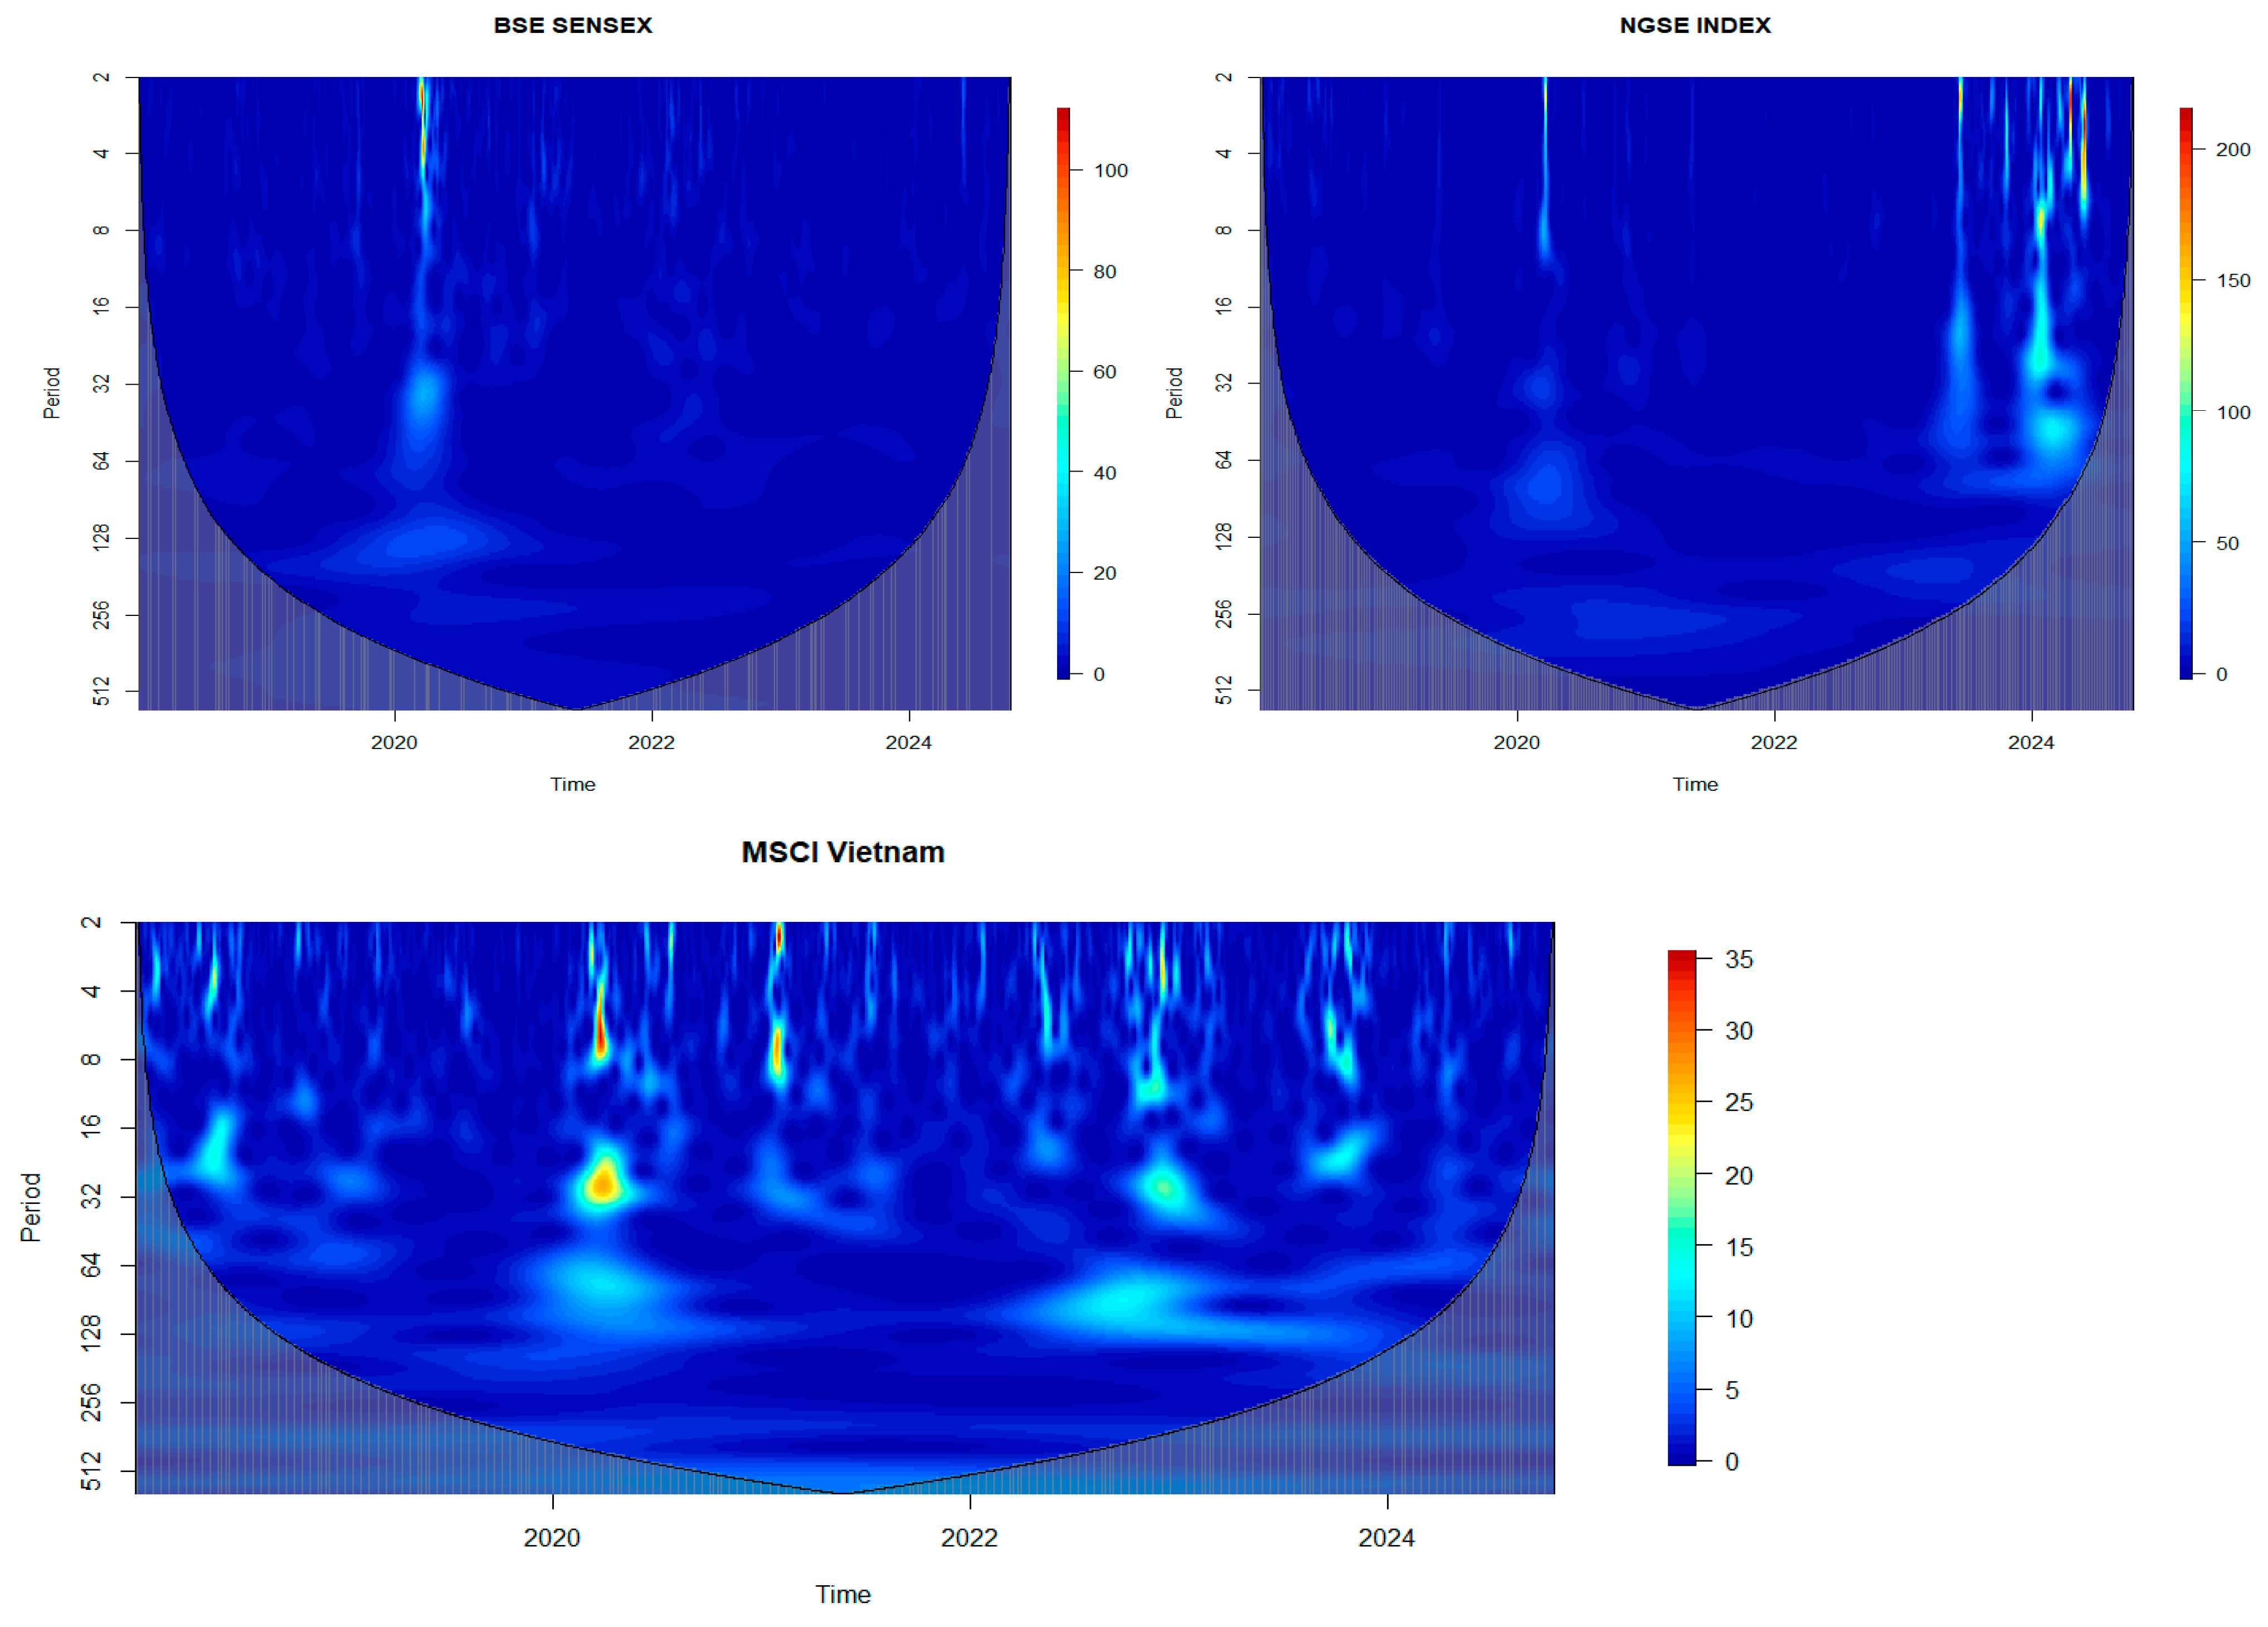
The results of the continuous wavelet transform are presented in Figure 3. The results basically replicate what we saw in the MODWT results: there is high volatility in market returns in the high-frequency regions, or in the short-term period. This high volatility is observed in 2020 and 2021 across all market returns, representing the period of the COVID-19 pandemic, and in 2021, which saw Bitcoin crash, causing the entire crypto market to fall. We observe very high volatility in Nigeria in 2024. We also observe high volatility in the Vietnam market returns, which could be due to global economic conditions, such as rising inflation and interest rates, that affect investor sentiment, as Vietnam is highly integrated into global supply chains.
Figure 3.
Continuous wavelet transform in market returns.
The insight we have gained from the CWT analysis will help us in our next section, where we analyse wavelet coherence. Wavelet coherence will shed light on the extent of shock spillovers between the source (crypto) and stock markets (developed and emerging), as well as on cause-and-effect relationships. These observations will help determine whether advanced cryptocurrencies and the stock market have experienced contagion or interdependence.
4.4. Wavelet Coherence
To investigate the interaction between cryptocurrencies and different stock markets, we used wavelet coherence. A potential challenge in examining the relationship between cryptocurrencies and stock markets arises from differences in trading calendars. Cryptocurrency markets operate continuously throughout the week, whereas stock markets are generally open only on weekdays. To ensure comparability between the two datasets, the cryptocurrency and stock market return series were aligned on common trading dates prior to estimating wavelet coherence. Specifically, in R, cryptocurrency observations corresponding to weekends and stock market holidays were removed, and only dates for which observations existed in both markets were retained via an inner join based on the calendar date. This approach ensured that each cryptocurrency return was matched with a contemporaneous stock market return.
While this procedure is commonly used in studies of cryptocurrencies and traditional financial assets, it may introduce estimation bias. Important information generated in cryptocurrency markets during weekends may only be incorporated into stock prices when equity markets reopen, potentially leading to an understatement of short-run spillovers and contagion effects. Consequently, the estimated short-term coherence between cryptocurrencies and stock markets should be interpreted with caution, as some delayed transmission effects may not be fully captured.
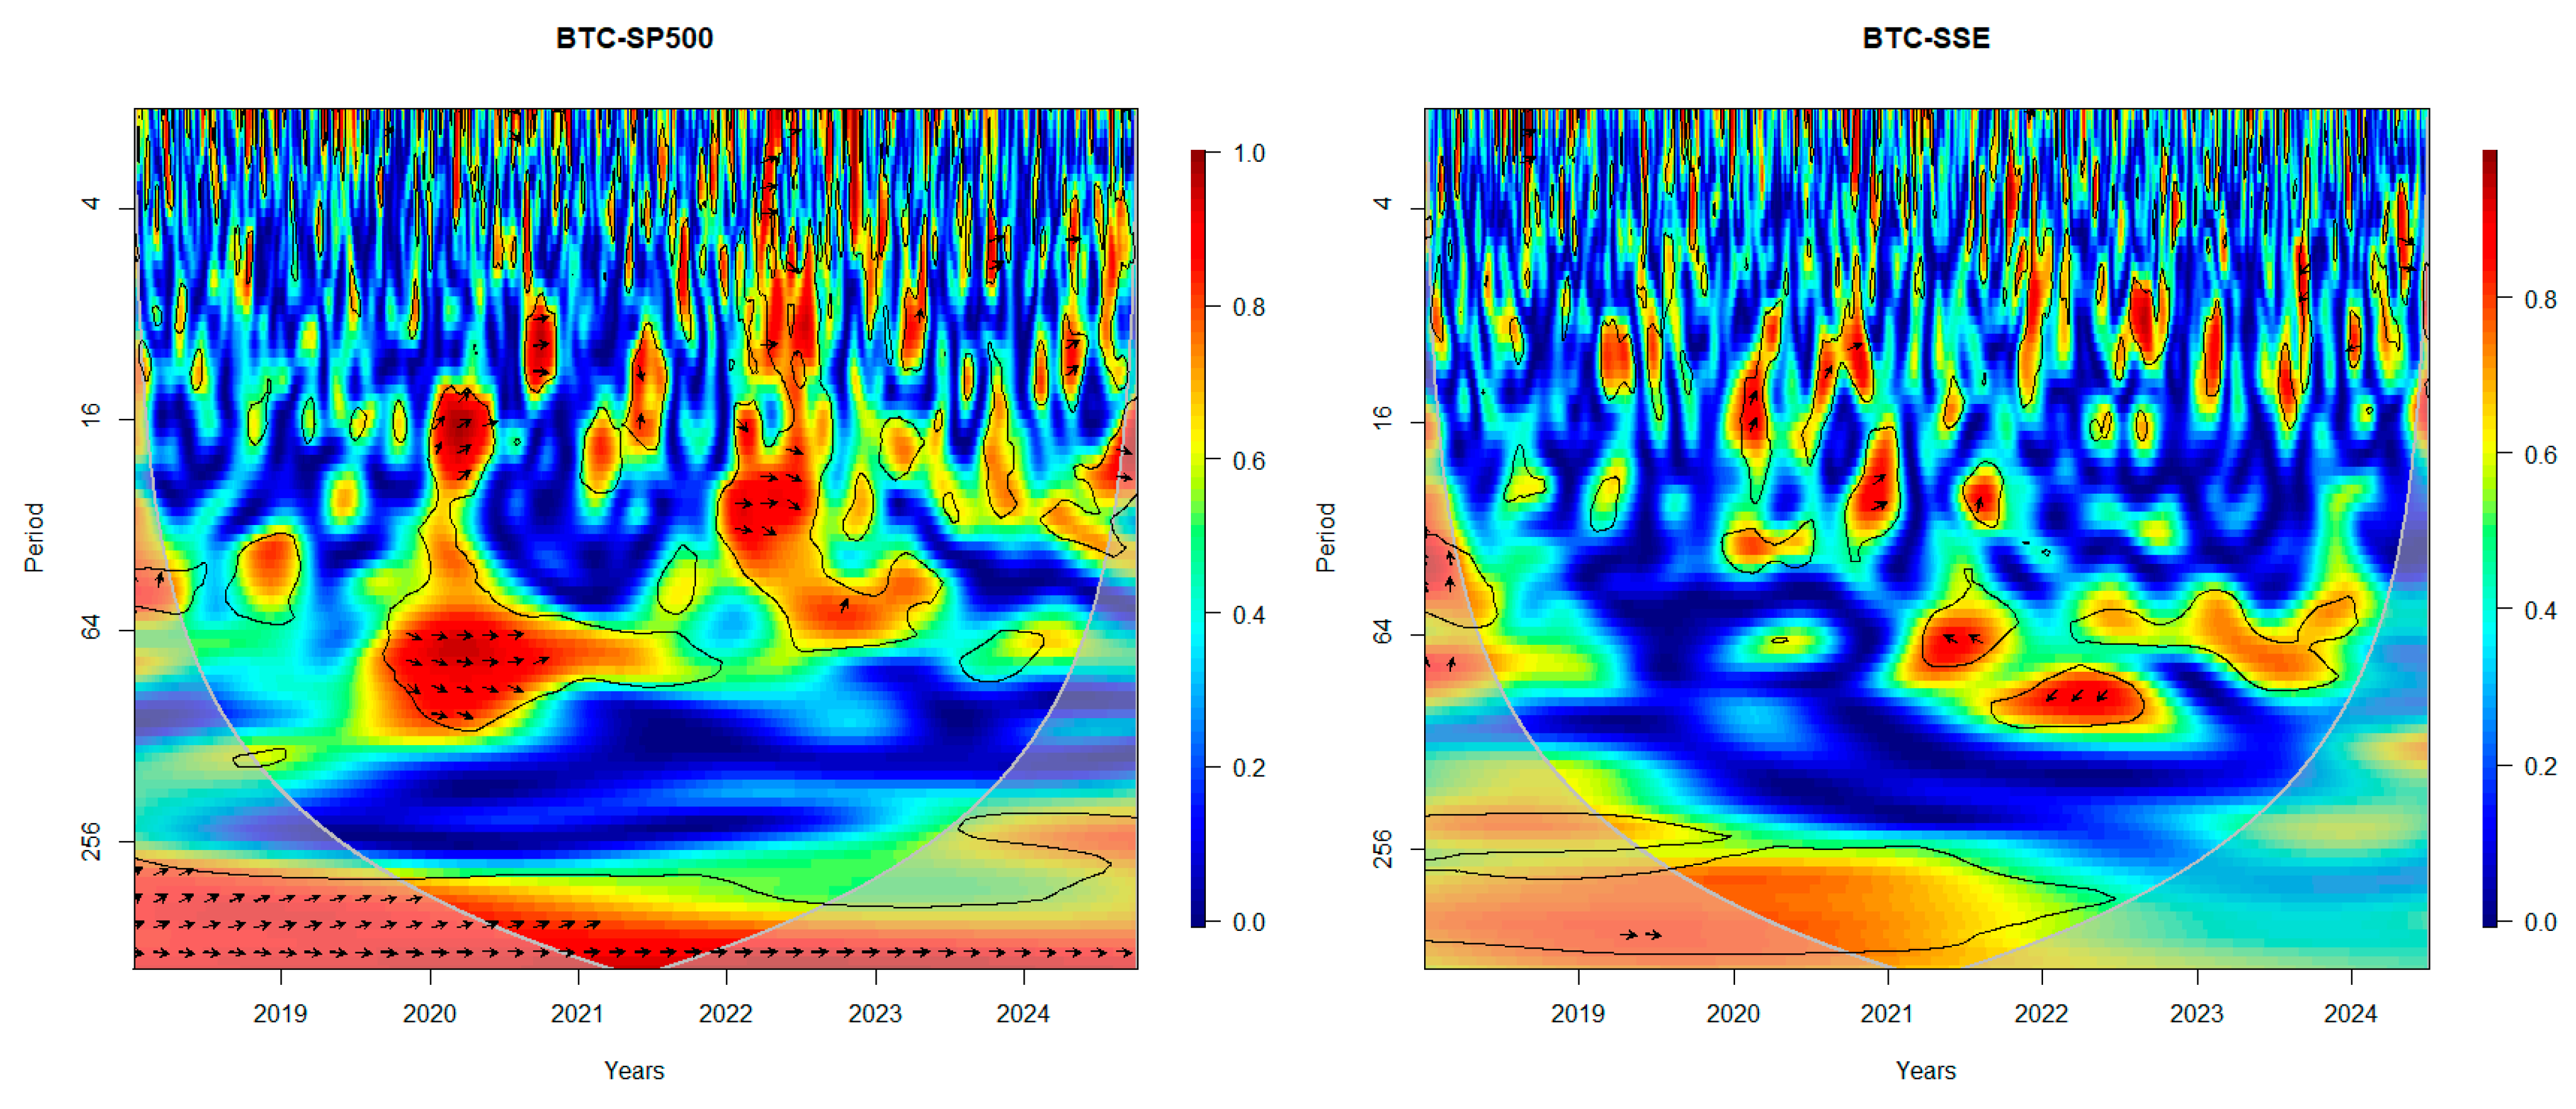
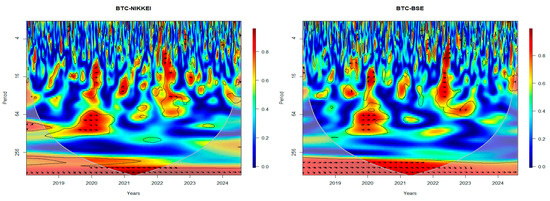
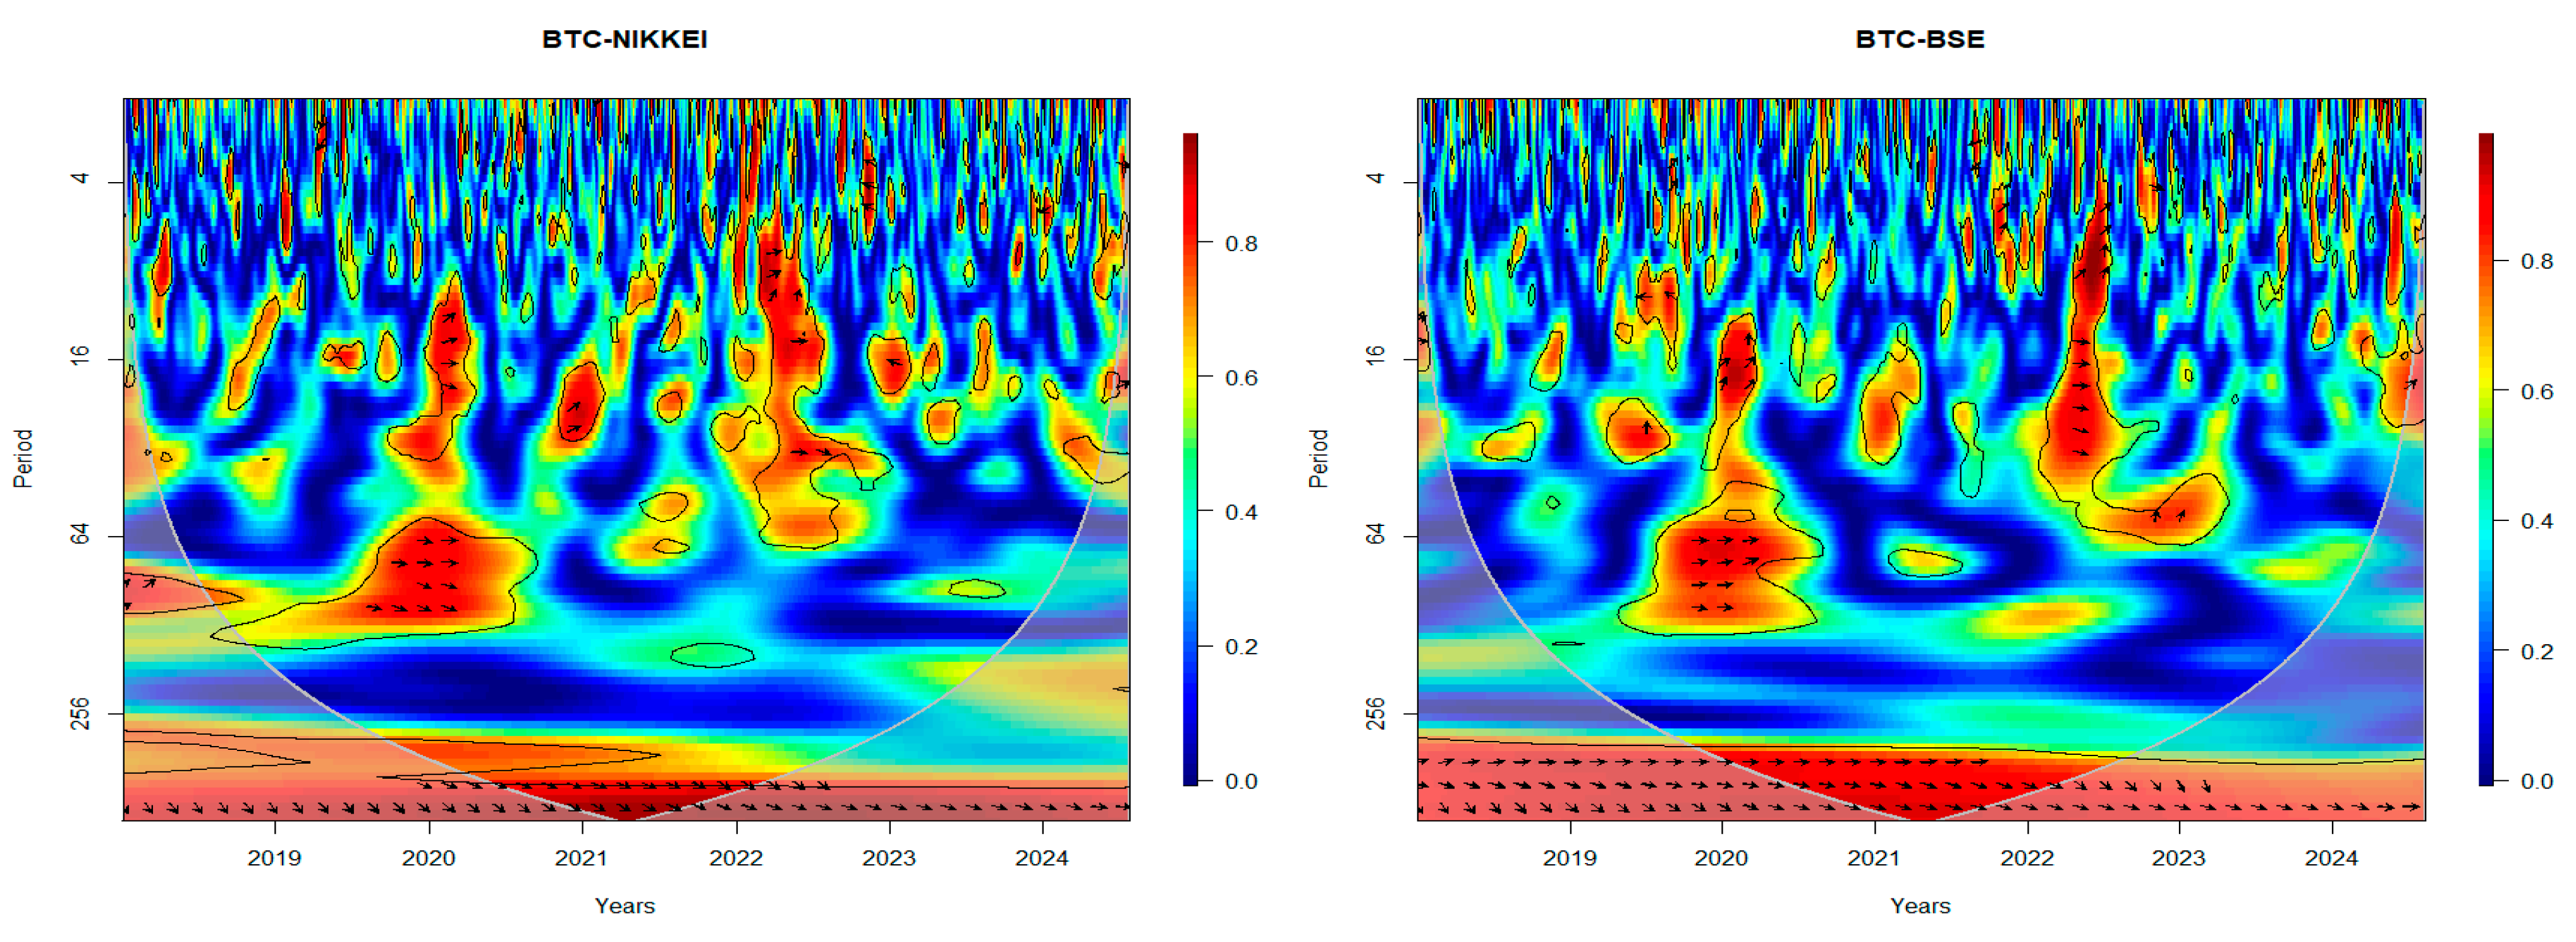
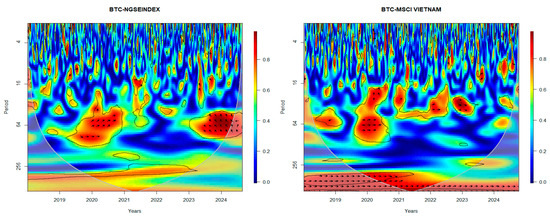
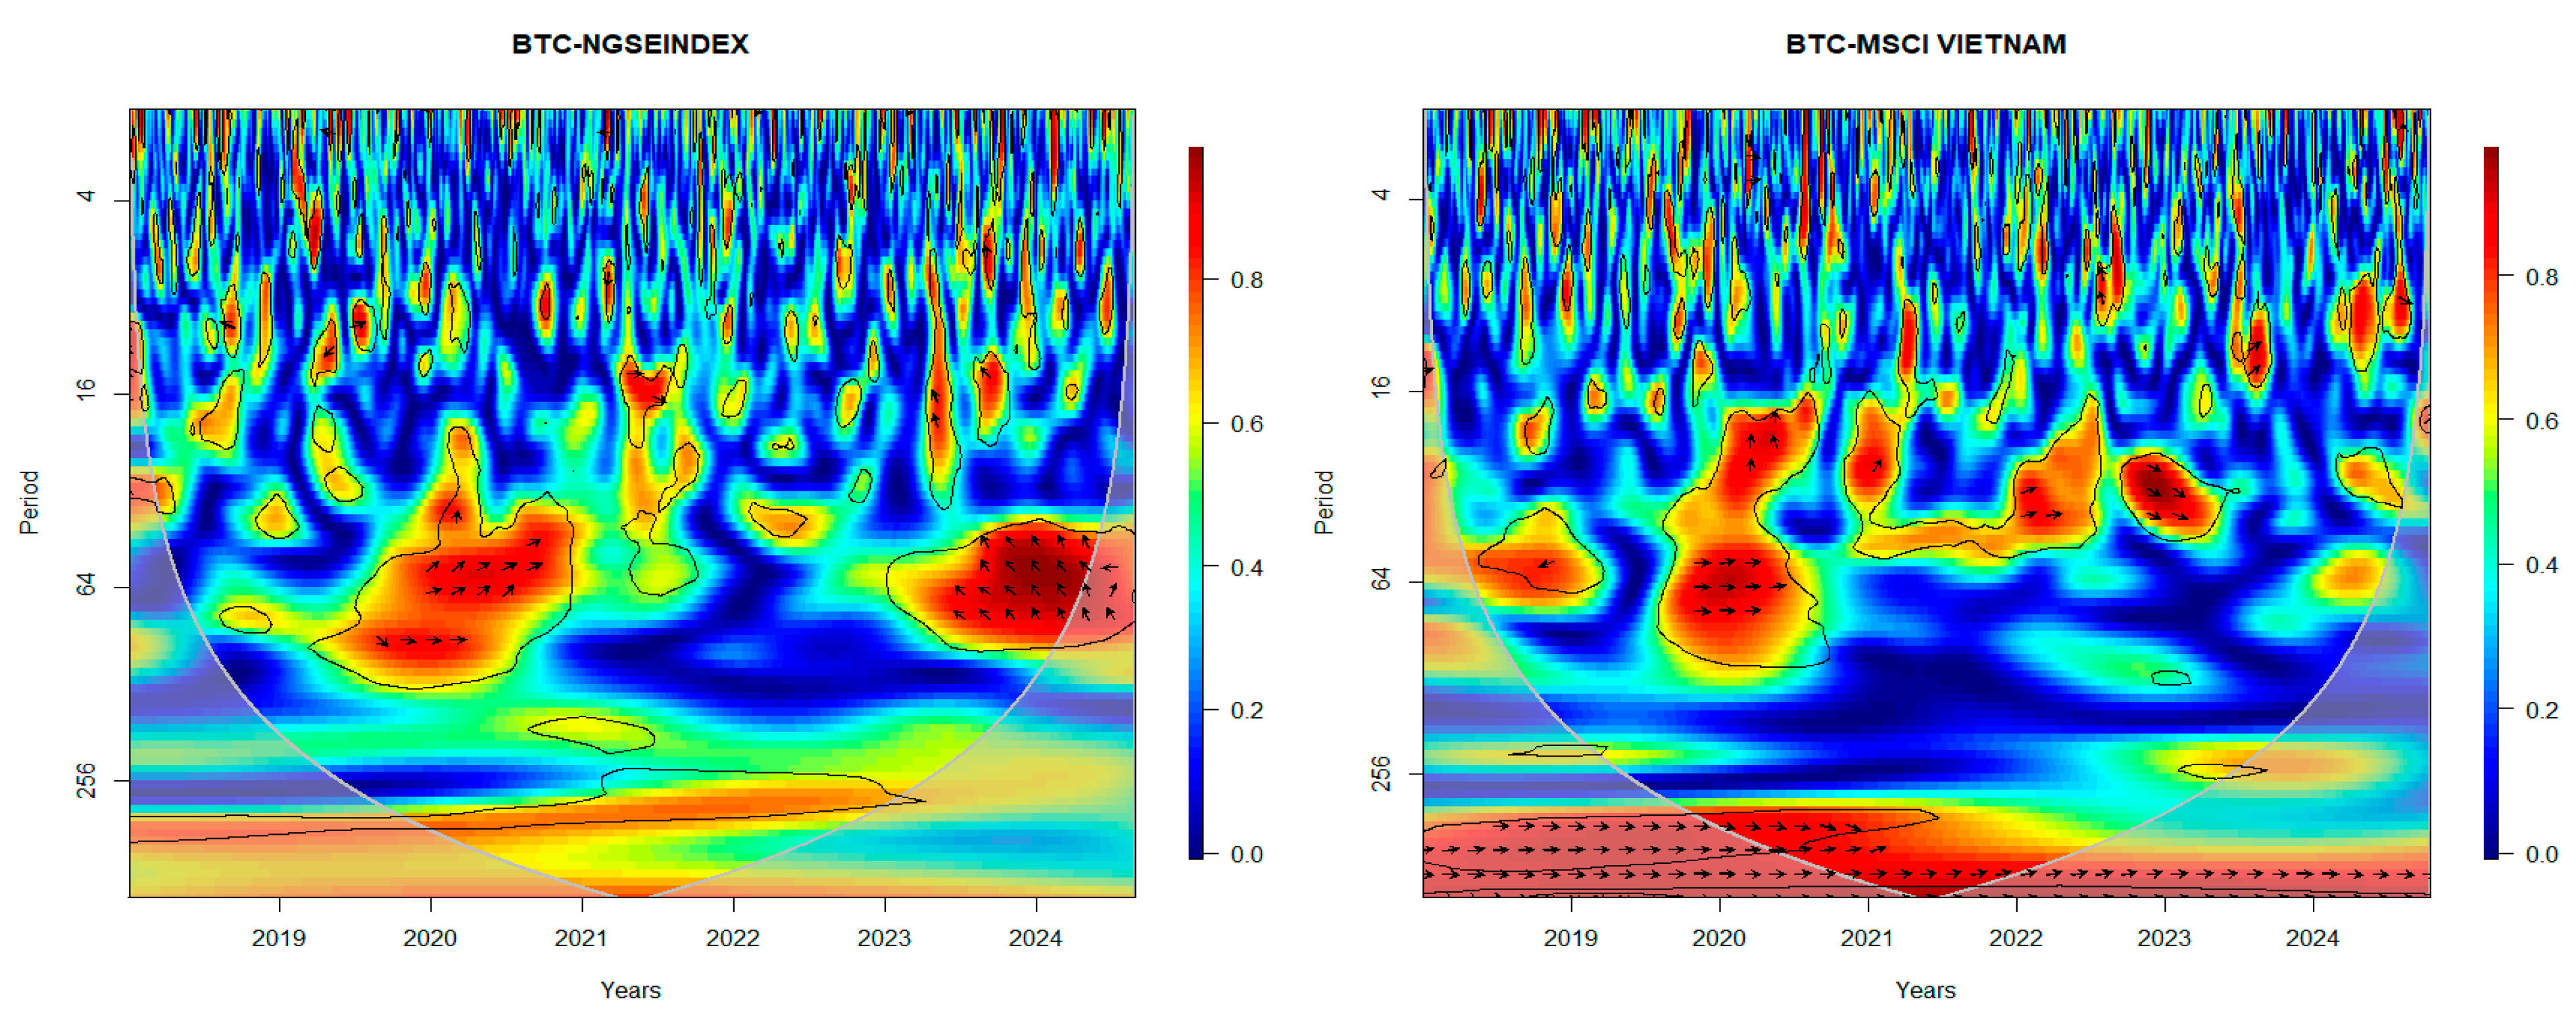
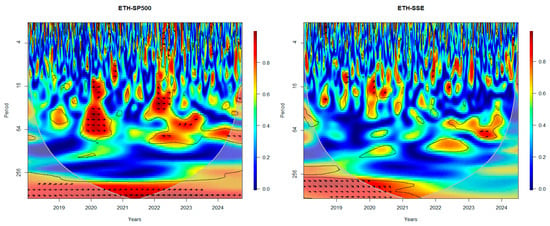
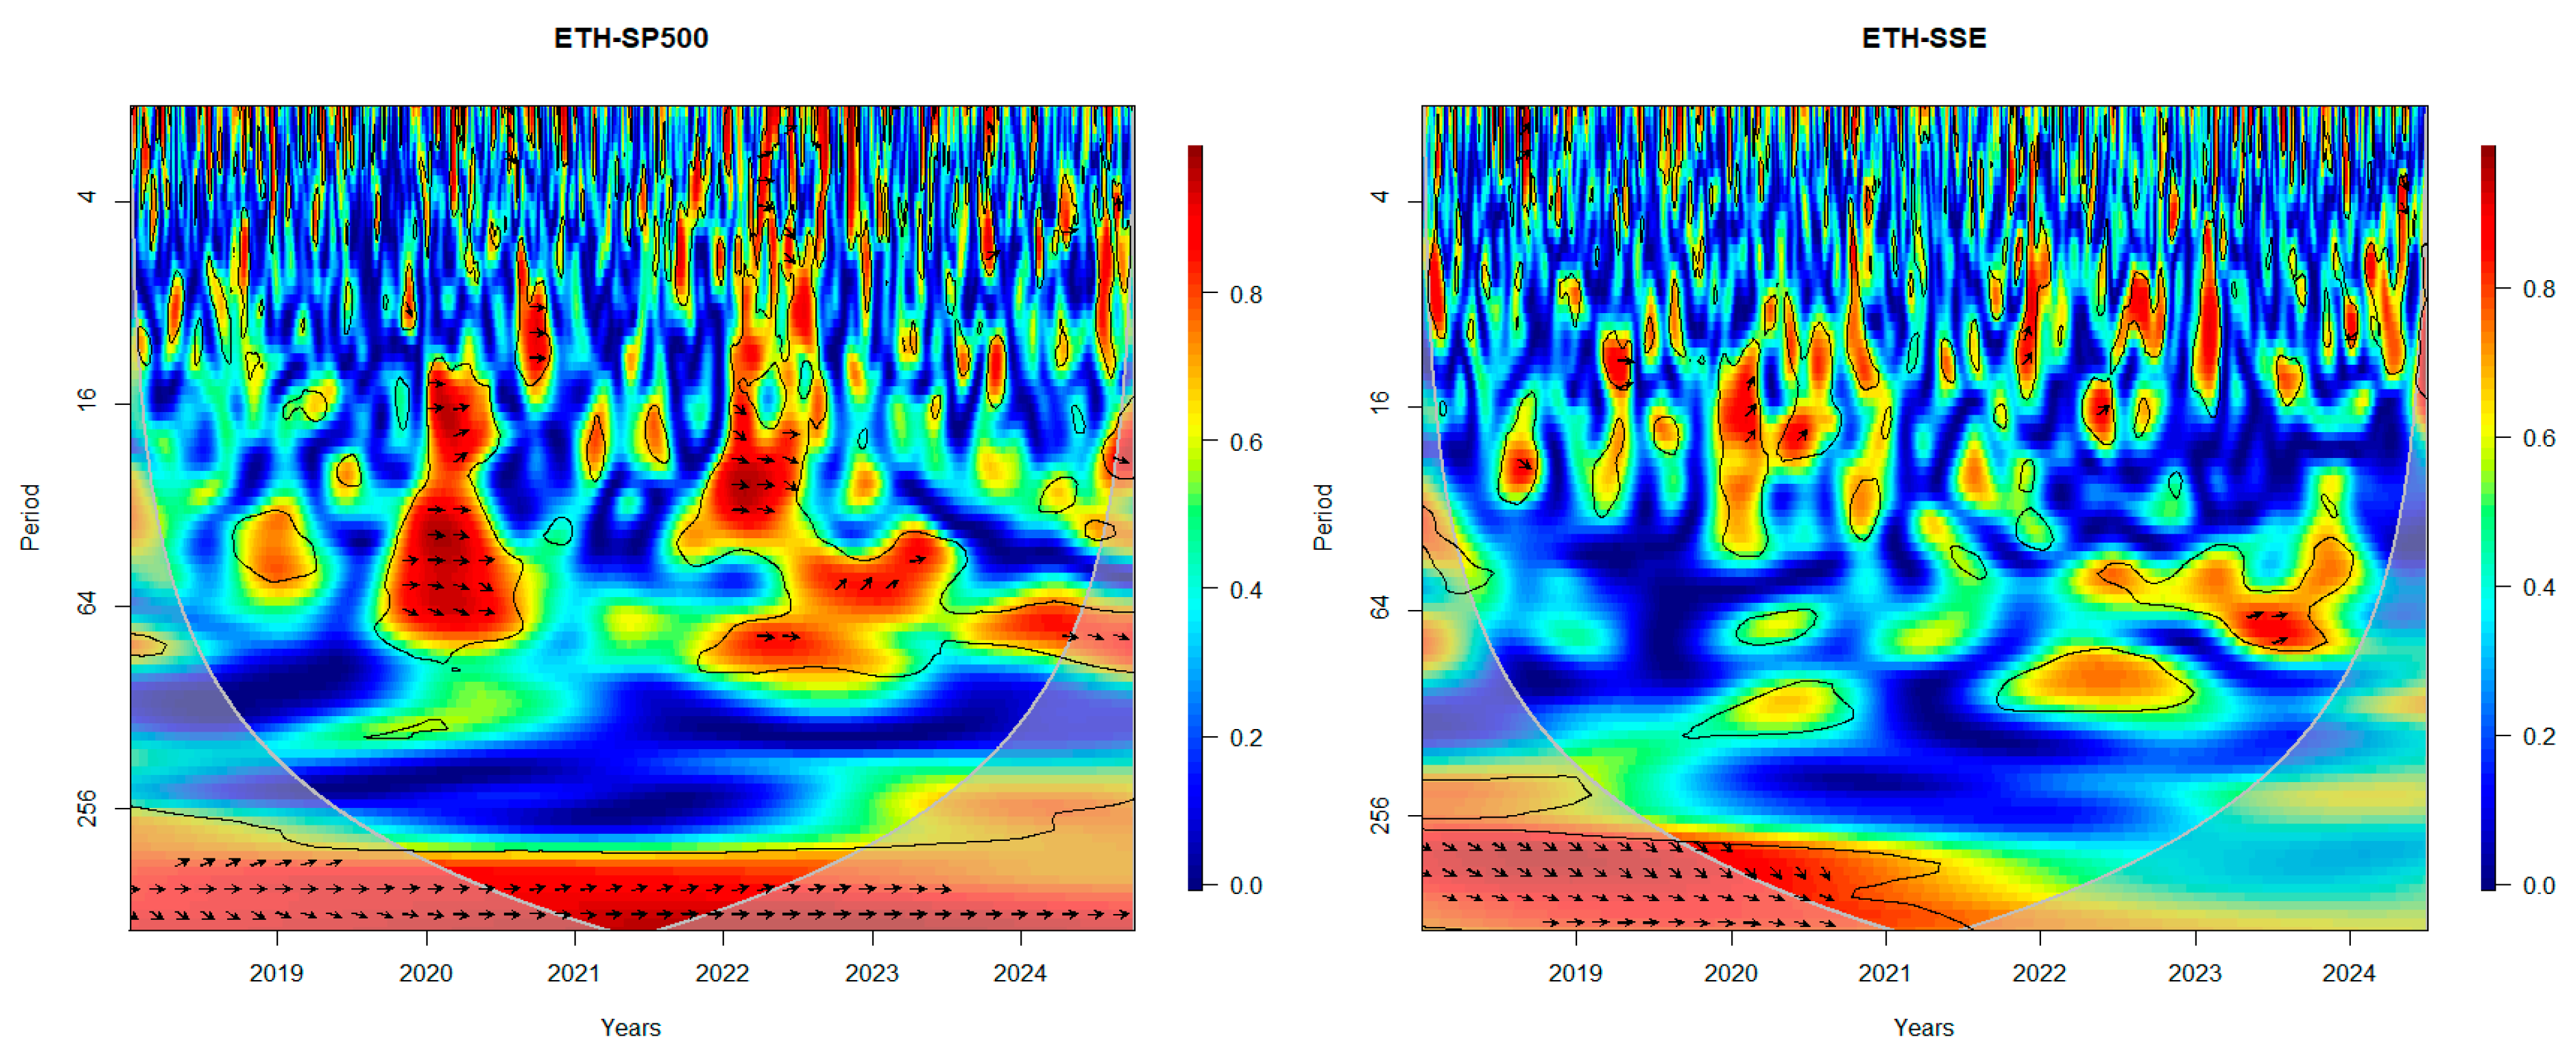
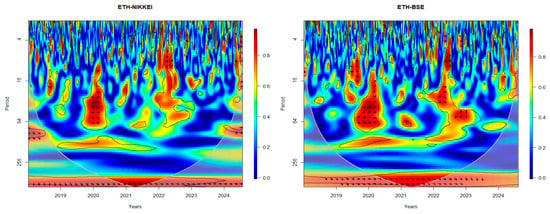
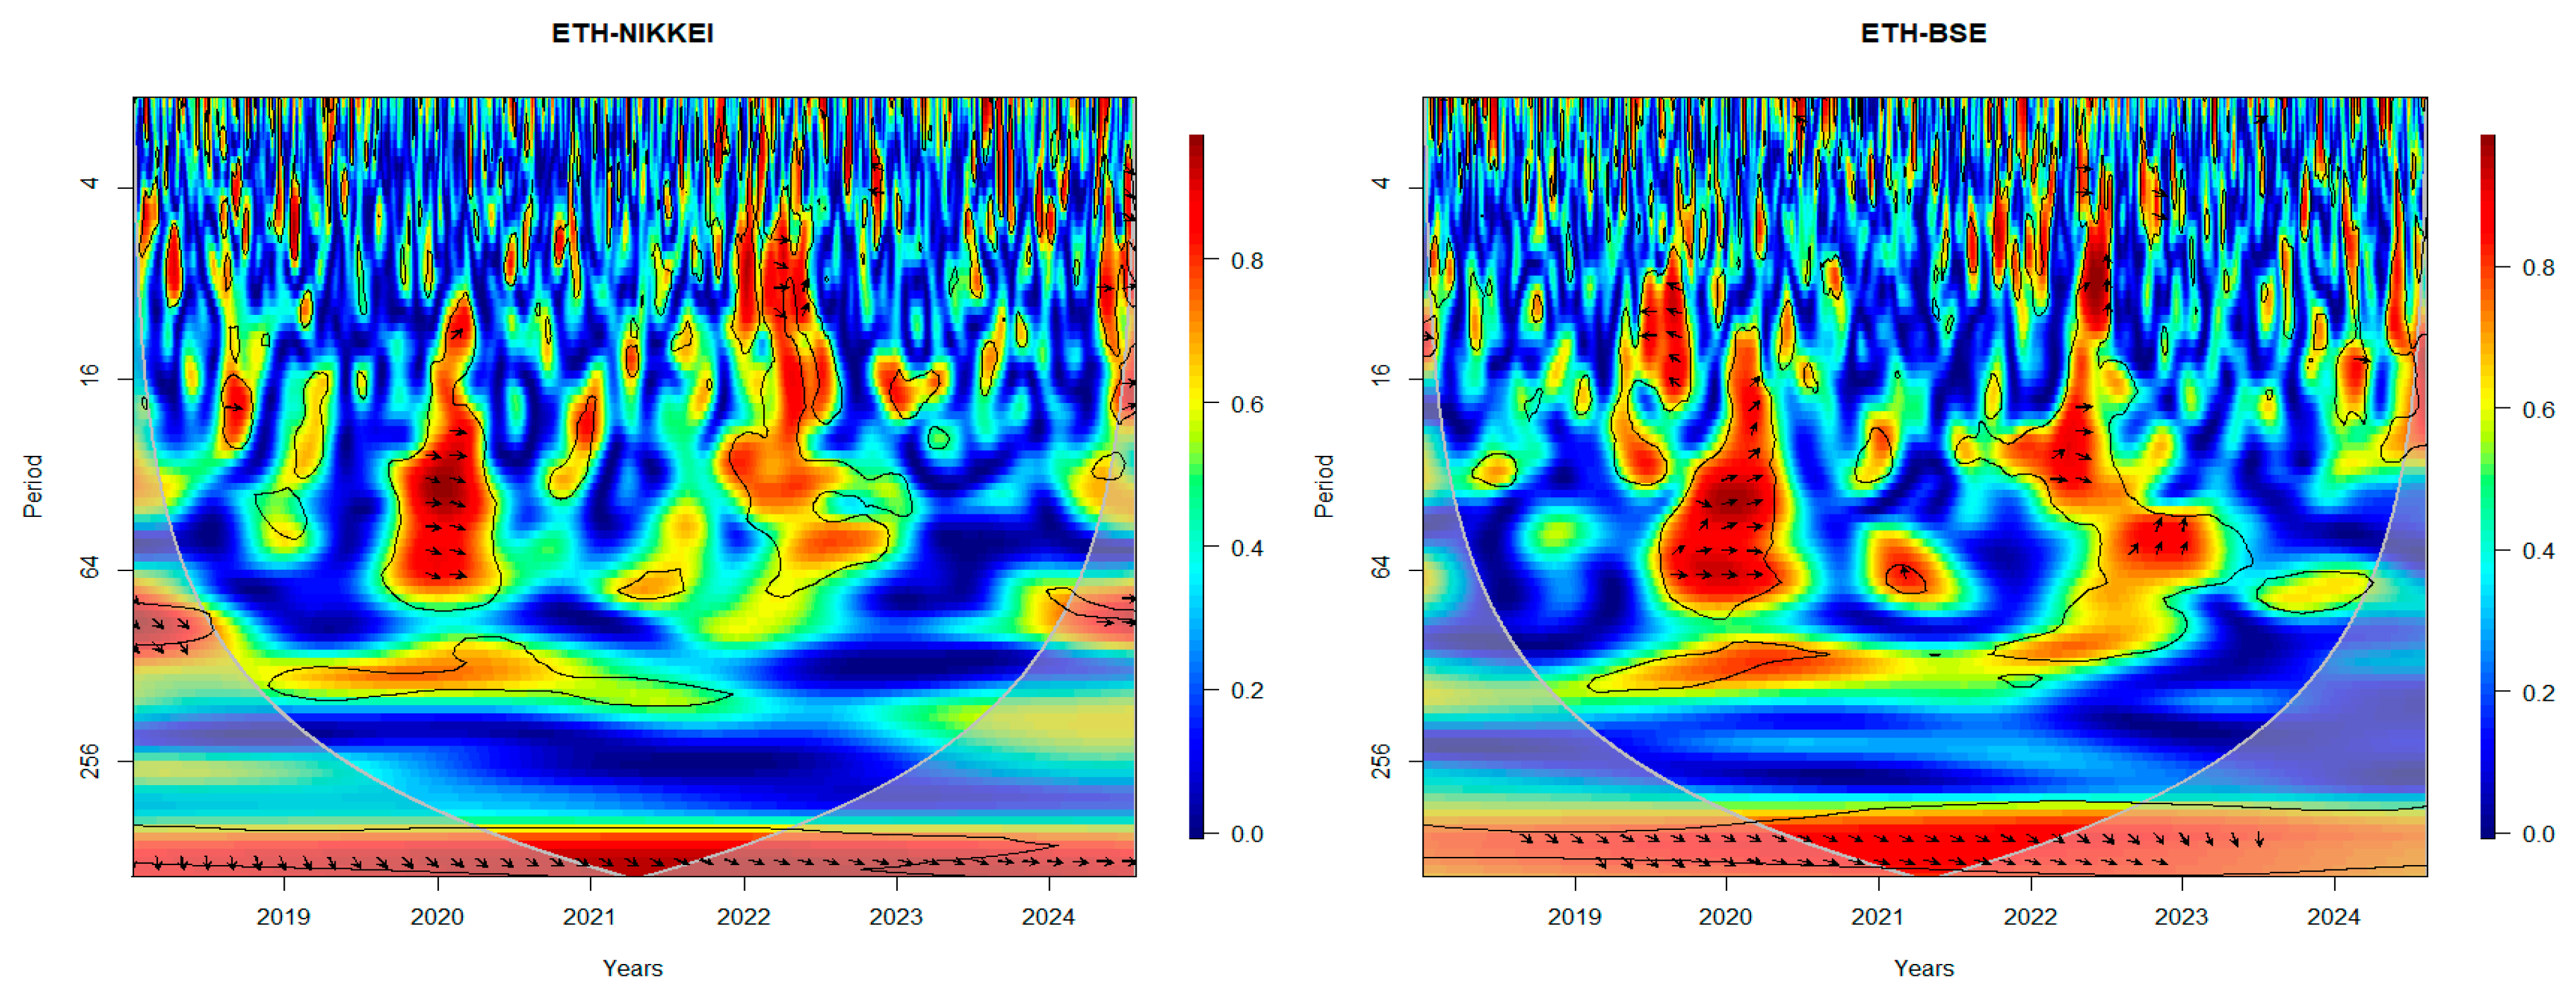
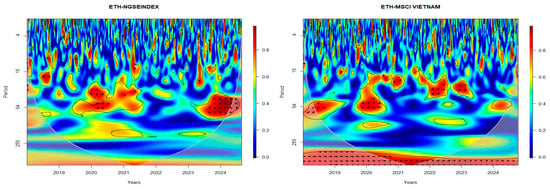
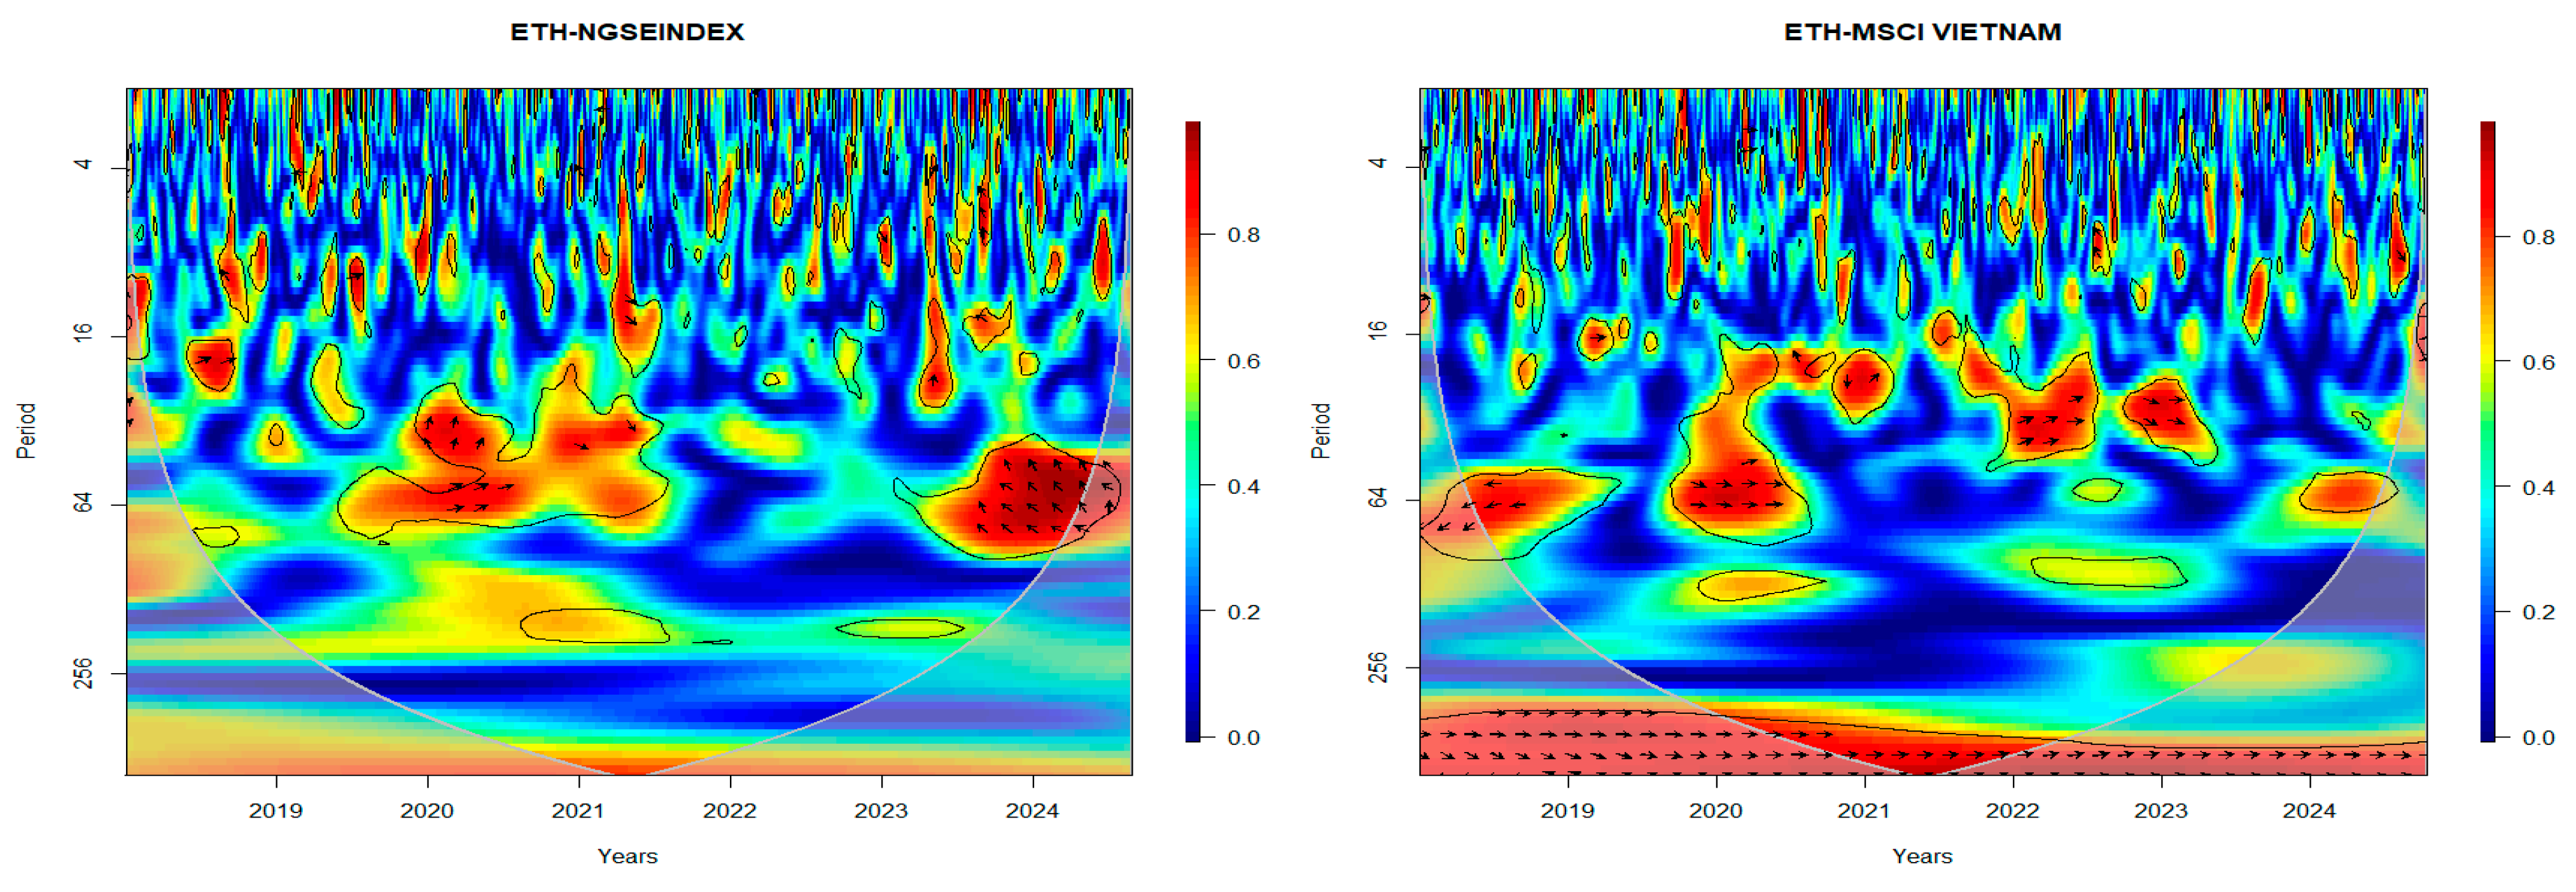
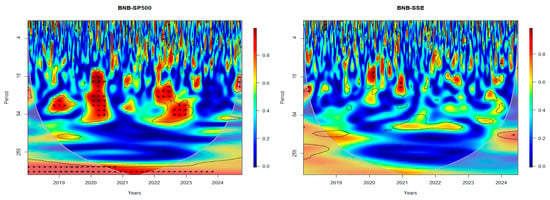
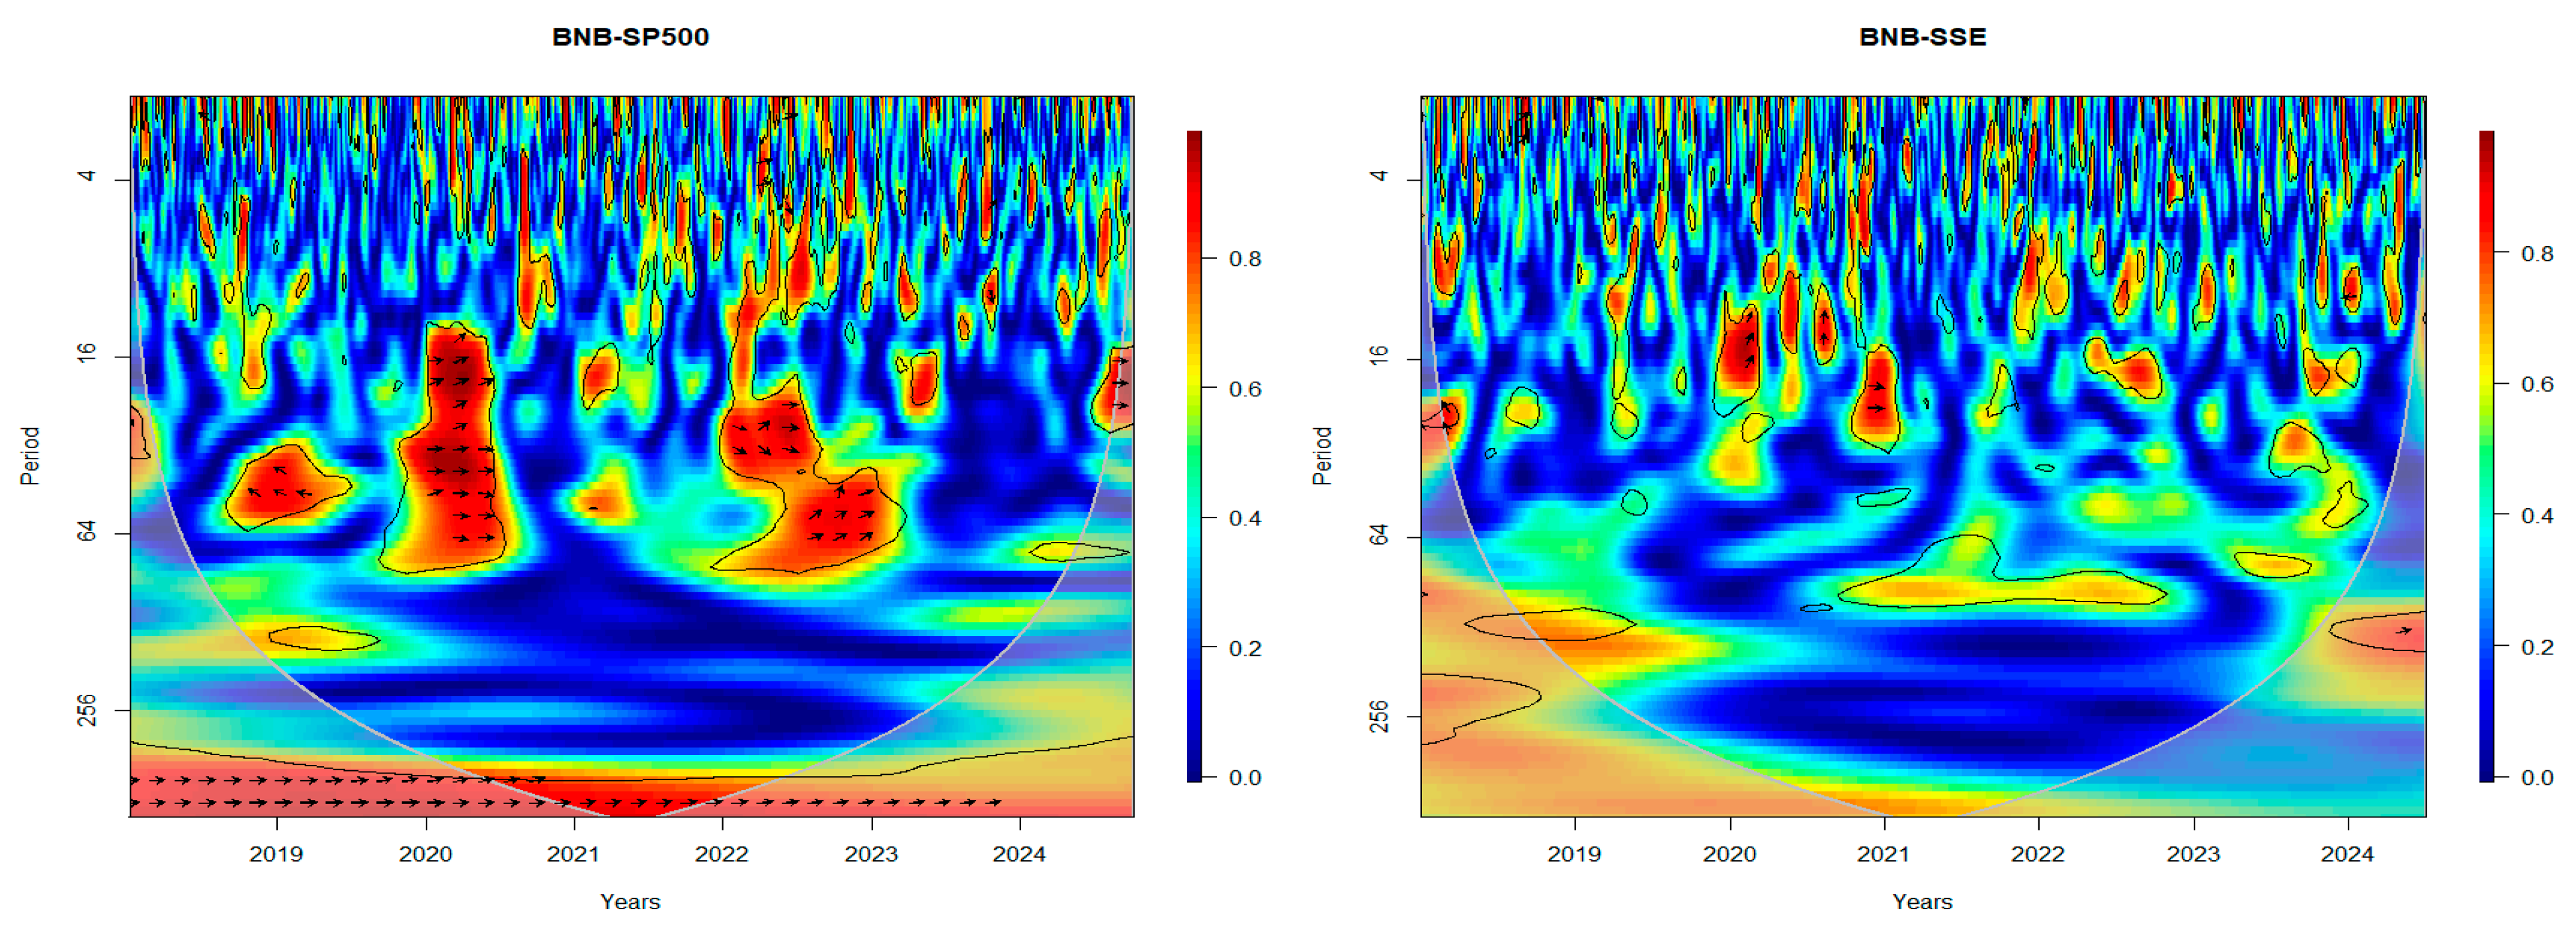
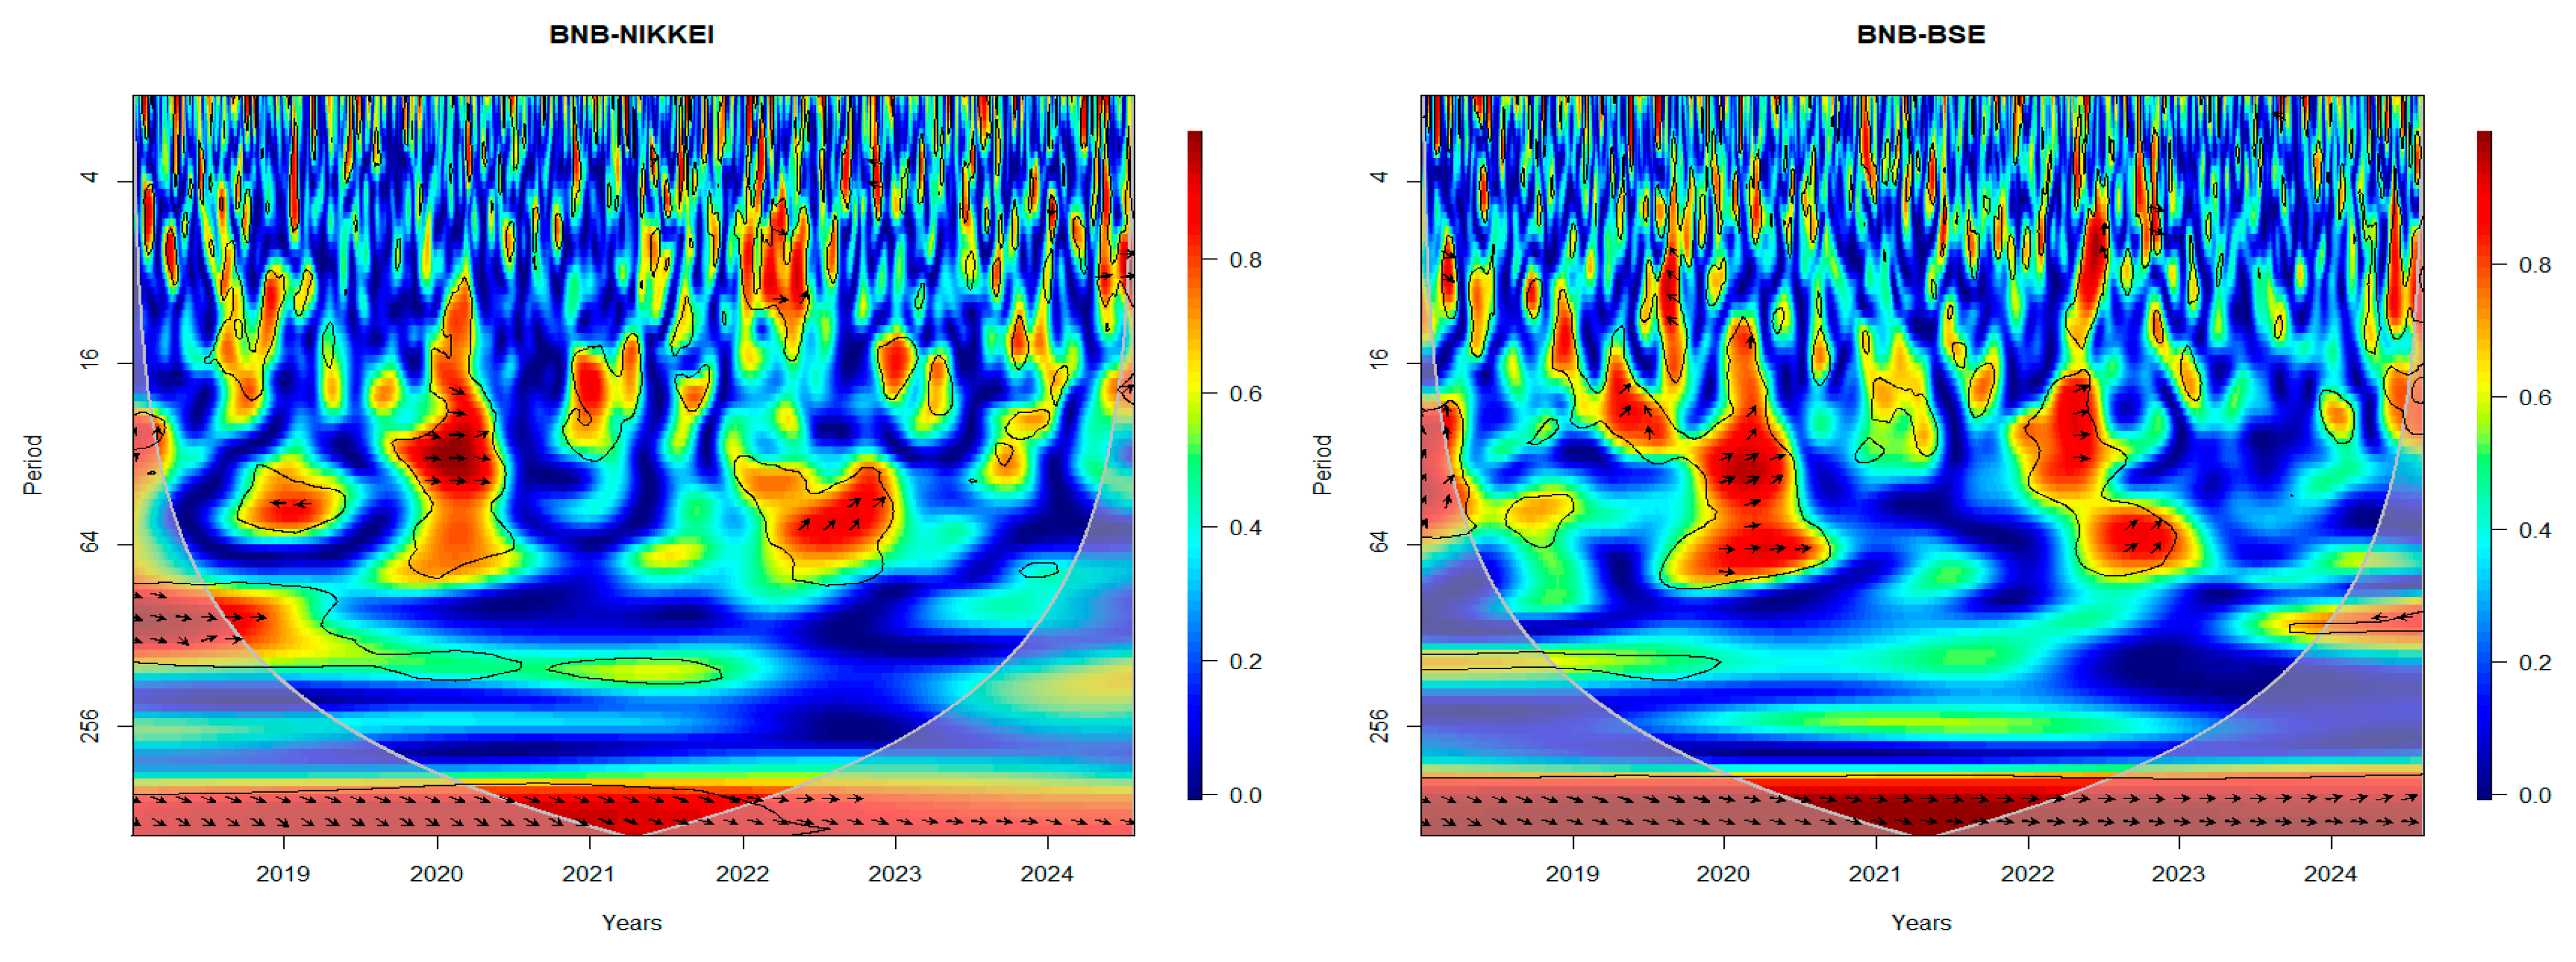
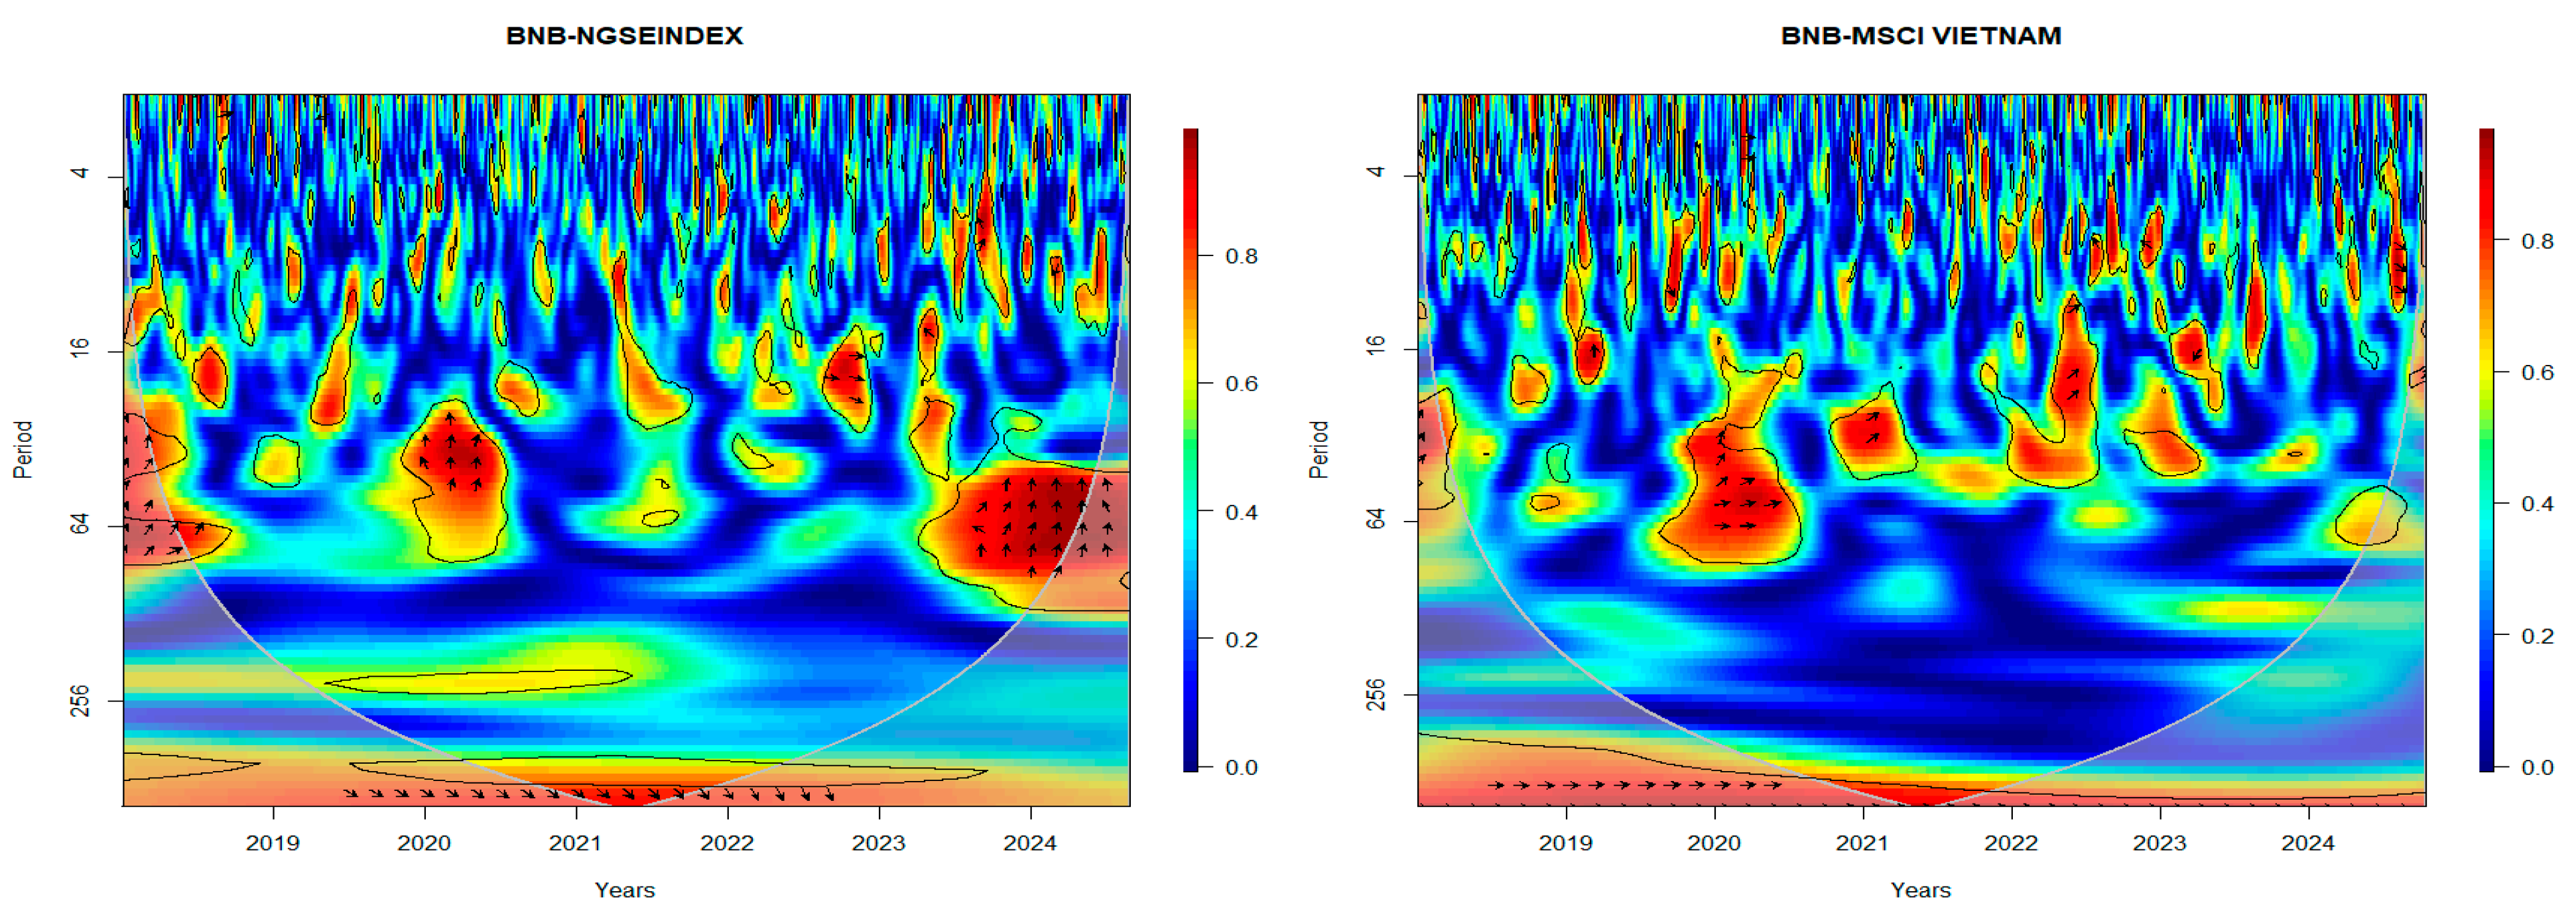
In Figure 4, Figure 5, Figure 6, Figure 7, Figure 8, Figure 9 and Figure 10, we present the wavelet coherence results for each pair (crypto and stock) to examine the interdependence and contagion among crypto and stocks of both developing and emerging markets. The colour bar on the right represents the strength of the correlation between the crypto market and a stock market return series. The red colour denotes a strong correlation or coherence, and the blue colour denotes a very weak correlation.
Figure 4.
Wavelet coherence between BTC and stock markets (S&P 500 and SSE).
Figure 5.
Wavelet coherence between BTC and stock markets (NIKKEI and BSE).
Figure 6.
Wavelet coherence between BTC and stock markets (NGSEINDEX and MSCI VIETNAM).
Figure 7.
Wavelet coherence between ETH and stock markets (S&P500 and SSE).
Figure 8.
Wavelet coherence between ETH and stock markets (NIKKEI and BSE).
Figure 9.
Wavelet coherence between ETH and stock markets (NGSEINDEX and MSCI VIETNAM).
Figure 10.
Wavelet coherence between BNB and stock markets (S&P500 and SSE).
From the plots (Figure 4, Figure 5 and Figure 6) between bitcoin (BTC) and the stock markets, we see temporary high correlations between bitcoin and the stocks (S&P500, NIKKEI, BSE and MSCI VIETNAM). This correlation can be largely attributed to the COVID-19 pandemic. There is a strong, long-term correlation between bitcoin and the four stocks, starting in 2018, and the correlation becomes even stronger between 2021 and 2022, the period during which bitcoin declined significantly. The strong long-term correlation between bitcoin and these stocks suggests an interdependence rather than contagion, though we observe temporary, strong short- to medium-term correlations. There is a temporary high correlation between Bitcoin and the Shanghai Composite Index in the low-frequency band (long term) in late 2019; this could be attributed to COVID-19. We can also observe a high correlation between Bitcoin and the Shanghai Composite Index in the medium term around 2022, and in this instance, the stock leads the crypto. This was the period when China’s growth slumped to one of its lowest levels. We also observe a medium-term correlation between Bitcoin and the Nigerian index around the COVID-19 pandemic (2019–20). Between 2023 and 2024, the Nigerian stock market appears to outperform bitcoin, which could be attributed to the country’s political instability and economic challenges.
The wavelet coherence plots (Figure 7, Figure 8 and Figure 9) between Ethereum (ETH) and the stock markets show that there is a temporary high co-movement between ETH and the stock markets (S&P500, NIKKEI, BSE and MSCI VIETNAM) in the short term (high frequency) to medium term. This is observed around 2020, which is the COVID-19 pandemic period, suggesting some contagion effect. However, we also observe persistent correlations among these markets at low frequencies. We see strong correlations in the low-frequency range between ETH and SSE from 2018 to late 2020, which was the peak COVID-19 period in China and also when ETH experienced a sharp decline. For the Nigerian index, we observe the same relationship between the index and bitcoin.
The wavelet coherence plots (Figure 10, Figure 11 and Figure 12) between Binance (BNB) and the stock markets (S&P500, NIKKEI, and BSE) exhibit the same behaviour we observed between these stock markets and ETH. We observe a temporary co-movement between ETH and the Vietnam index in the short- to medium-term in 2020, during the COVID-19 period. There is a strong long-term correlation between ETH and the Vietnam index from late 2018 to the middle of 2020. During this period, BNB experienced a security incident (2019) in which hackers stole millions of dollars, which impacted investor sentiment; it also coincided with the COVID-19 pandemic. The natural disasters that occurred in Japan in 2018 have caused temporary, medium-term correlations between NIKKEI and the three cryptocurrencies.
Figure 11.
Wavelet coherence between BNB and stock markets (NIKKEI and BSE).
Figure 12.
Wavelet coherence between BNB and stock markets (NGSEINDEX and MSCI VIETNAM).
At the beginning of this study, we first implemented the MODWT decomposition, which decomposed the different stock markets into different frequencies, and the results were presented in Section 4.2. In Figure 12, we present the results of the MODWT decomposition of the BTC series. From Figure 12, we observe that the long-term (low-frequency) signal is smoother than the short-term (high-frequency) signal.
For robustness analysis, we provide a numerical solution to support the wavelet analysis results, which are primarily based on graphical representations and visual inspection. To this end, we calculate short-term correlations between the three cryptocurrencies and the stock markets over the 2–4-day cycle, as well as long-term correlations over the 256–512-day cycle. These correlation values capture the short-term or high-frequency co-movements within the series. Then, we do a statistical test to evaluate the null hypothesis that the long-term and short-term correlation coefficients are similar. We used a one-sided t-test on the difference in correlation coefficients to determine whether the short- and long-term correlation coefficients are, in fact, statistically distinct (see Bonga-Bonga & Mpoha, 2024).
It is important to note that the LA8 Daubechies Least Asymmetric filter is employed to decompose the series, with the results provided in Figure 13. The filter is used because of its near-symmetry, which minimises phase distortion and provides a more accurate decomposition of financial time series. An eight-level decomposition is selected to capture market dynamics across a wide range of investment horizons, from short-term fluctuations (2–4 days) to long-term movements (256–512 days), thereby enabling a comprehensive assessment of market interactions at different frequencies. Furthermore, following Yang et al. (2016), the distinction between contagion and interdependence is based on the relative behaviour of wavelet coherence across frequencies. Contagion is inferred when coherence increases significantly during periods of market stress at high frequencies (short-term horizons), indicating crisis-induced shock transmission. In contrast, interdependence is identified when coherence persists predominantly at low frequencies (long-term horizons), reflecting stable and fundamental linkages between markets rather than temporary crisis-driven effects.
Figure 13.
Decomposition of Bitcoin at different frequencies using a Daubechies filter.
The results in Table 2, Table 3 and Table 4 provide important evidence on the time-frequency nature of the relationship between cryptocurrencies and stock markets. The weak and mostly insignificant short-term correlations in Table 2 suggest that cryptocurrencies and stock markets are not strongly connected at high frequencies. This implies that, over very short horizons, cryptocurrencies may still offer diversification benefits, particularly for short-term traders and speculative investors seeking to exploit temporary market segmentation.
Table 2.
Returns correlations between crypto and stocks from developed and emerging markets in the short term (D1).
Table 3.
Returns correlations between crypto and stocks from developed and emerging markets in the long term (D8).
Table 4.
Results of the t-statistic test of correlation differences between long- and short-term scale.
However, the strong, statistically significant long-term correlations reported in Table 3 indicate that the cryptocurrency and stock markets become more closely connected at lower frequencies. This finding suggests that the relationship between the two asset classes is mainly driven by long-run interdependence rather than short-lived contagion. For long-horizon investors, such as pension funds, institutional investors, and strategic portfolio managers, this reduces the ability of cryptocurrencies to serve as reliable long-term hedging assets against equity market risk.
The comparison between short- and long-term correlations in Table 4 further confirms this interpretation. Where long-term correlations exceed short-term correlations, the evidence suggests that cryptocurrencies may be useful for short-term diversification but less effective for long-term risk reduction. Therefore, investors with short holding periods may benefit from including cryptocurrencies in equity portfolios. In contrast, long-term investors should treat cryptocurrencies as increasingly integrated risk assets rather than independent safe-haven instruments.
5. Conclusions
In this study, we aimed to examine the behaviour of cryptocurrencies and stock indices across developed and emerging markets, focusing on spillover effects from cryptocurrencies to the selected markets. The primary goal of the study is to distinguish between pure contagion and interdependence in the context of shock spillovers and market co-movement. To investigate the relationship, the study performed univariate analysis using the MODWT to decompose the data into different frequency bands. The results of the MODWT analysis showed that the short-term (high-frequency) 2–4-day cycles accounted for the greatest variance. CWT was also used in the study for univariate analysis, and the findings supported those from MODWT: high volatility was observed in high-frequency regions. The high volatility was mostly observed during the COVID-19 pandemic and in periods when cryptocurrency prices fell significantly. We also observed volatility during periods of political instability and economic crises in emerging markets such as Nigeria.
Wavelet coherence was employed to capture the bivariate relationships between crypto and stock markets. The wavelet coherence results show continuous co-movement in the long term (low frequency) between cryptocurrencies and stock indices across markets. The study’s findings suggest that most of the observed co-movements are due to interdependence rather than contagion.
The findings of this study can be very useful for investors and asset managers in understanding the dynamics between crypto and stocks, which can help hedge equity investments. This is also useful for policymakers in understanding the overall impact of their decisions on the global economy.
Several limitations should be acknowledged when interpreting the findings of this study. First, the analysis focuses on three major cryptocurrencies—Bitcoin, Ethereum, and Binance Coin—which, although representative of a substantial proportion of the cryptocurrency market capitalisation, may not fully capture the behaviour of newer digital assets, stablecoins, or decentralised finance (DeFi) tokens. Second, the study relies on daily frequency data. While daily observations are appropriate for examining medium- and long-term market interactions, they may not capture intraday information transmission and ultra-short-run spillover effects that are increasingly relevant in highly liquid cryptocurrency markets.
Third, the sample period is constrained by the relatively short history of cryptocurrency markets, limiting the analysis of longer-term structural relationships. Finally, although wavelet analysis provides valuable insights into time-frequency dynamics, it does not explicitly model nonlinear regime changes or structural breaks that may arise during periods of extreme financial stress.
Future research may extend the present study by incorporating a broader range of digital assets, including stablecoins, DeFi tokens, and central bank digital currencies. Further investigations could also employ intraday or high-frequency data to explore the speed of information transmission between cryptocurrency and stock markets. Additionally, combining wavelet analysis with regime-switching, network connectedness, or time-varying parameter models may provide deeper insights into the evolution of contagion and interdependence across different market conditions.
Funding
This research received no external funding.
Institutional Review Board Statement
Not applicable.
Informed Consent Statement
Not applicable.
Data Availability Statement
The data presented in this study are available in [yahoo finance] at [https://finance.yahoo.com] (accessed on 3 Febraury 2026).
Conflicts of Interest
The author declares no conflicts of interest.
Appendix A
Table A1.
Market data.
References
- Almeida, J., & Gonçalves, T. C. (2023). A decade of cryptocurrency investment literature: A cluster-based systematic analysis. International Journal of Financial Studies, 11(2), 71. [Google Scholar] [CrossRef] [Scilit]
- Aydoğan, B., Vardar, G., & Taçoğlu, C. (2024). Volatility spillovers among G7, E7 stock markets and cryptocurrencies. Journal of Economic and Administrative Sciences, 40(2), 364–387. [Google Scholar]
- Balcilar, M., Ozdemir, H., & Agan, B. (2022). Effects of COVID-19 on cryptocurrency and emerging market connectedness: Empirical evidence from quantile, frequency, and lasso networks. Physica A: Statistical Mechanics and Its Applications, 604, 127885. [Google Scholar] [CrossRef] [Scilit]
- Batondo, M., & Uwilingiye, J. (2022). Comovement across BRICS and US stock markets: A multitime-scale wavelet analysis. International Journal of Financial Studies, 10(4), 27. [Google Scholar] [CrossRef] [Scilit]
- Bonga-Bonga, L. (2018). Uncovering equity market contagion among BRICS countries: An application of the multivariate GARCH model. The Quarterly Review of Economics and Finance, 67, 36–44. [Google Scholar] [CrossRef] [Scilit]
- Bonga-Bonga, L., & Mpoha, S. (2024). Spillover effects from China and the United States to key regional emerging markets: A dynamic analysis. International Review of Financial Analysis, 91, 103015. [Google Scholar] [CrossRef] [Scilit]
- Bouri, E., Cepni, O., Gabauer, D., & Gupta, R. (2021). Return connectedness across asset classes around the COVID-19 outbreak. International Review of Financial Analysis, 73, 101646. [Google Scholar] [CrossRef] [Scilit]
- Caferra, R., & Vidal-Tomas, D. (2021). Who raised from the abyss? A comparison between cryptocurrency and stock market dynamics during the COVID-19 pandemic. Finance Research Letters, 43, 101954. [Google Scholar] [CrossRef] [Scilit] [PubMed]
- Campbell-Verduyn, M. (2018). Towards a block age or blockages of global governance? In Bitcoin and beyond: Cryptocurrencies, blockchains, and global governance (pp. 178–197). Routledge. [Google Scholar]
- Corbet, S., Hou, Y. G., Hu, Y., Larkin, C., & Oxley, L. (2020). Any port in a storm: Cryptocurrency safe-havens during the COVID-19 pandemic. Economics Letters, 194, 109377. [Google Scholar] [CrossRef] [Scilit] [PubMed]
- Daubechies, I. (1992). Mathematical sciences: Wavelets and applications. NSF Award Number 9209327. Directorate for Mathematical and Physical Sciences, 92(9209327), 9327. [Google Scholar] [CrossRef] [Scilit]
- Demiralay, S., & Bayraci, S. (2021). Should stock investors include cryptocurrencies in their portfolios after all? Evidence from a conditional diversification benefits measure. International Journal of Finance & Economics, 26(4), 6188–6204. [Google Scholar] [CrossRef] [Scilit]
- Dyhrberg, A. H. (2016). Bitcoin, gold and the dollar—A GARCH volatility analysis. Finance Research Letters, 16, 85–92. [Google Scholar] [CrossRef] [Scilit]
- Fernandes, L. H., Bouri, E., Silva, J. W., Bejan, L., & de Araujo, F. H. (2022). The resilience of cryptocurrency market efficiency to COVID-19 shock. Physica A: Statistical Mechanics and its Applications, 607, 128218. [Google Scholar] [CrossRef] [Scilit] [PubMed]
- Flori, A. (2019). News and subjective beliefs: A Bayesian approach to Bitcoin investments. Research in International Business and Finance, 50, 336–356. [Google Scholar] [CrossRef] [Scilit]
- Forbes, K. J., & Rigobon, R. (2002). No contagion, only interdependence: Measuring stock market co-movements. Journal of Finance, 57(5), 2223–2261. [Google Scholar] [CrossRef] [Scilit]
- Goodell, J. W., & Goutte, S. (2021). Co-movement of COVID-19 and Bitcoin: Evidence from wavelet coherence analysis. Finance Research Letters, 38, 101625. [Google Scholar] [CrossRef] [Scilit] [PubMed]
- Hassan, I. B., Azali, M., Chin, L., & Azman-Saini, W. N. (2017). Macroeconomic linkages and international shock transmissions in East Asia: A global vector autoregressive approach. Cogent Economics & Finance, 5(1), 1370772. [Google Scholar] [CrossRef] [Scilit]
- Hatemi-J, A., Hajji, M. A., Bouri, E., & Gupta, R. (2022). The benefits of diversification between bitcoin, bonds, equities and the US dollar: A matter of portfolio construction. Asia-Pacific Journal of Operational Research, 39(4), 2040024. [Google Scholar]
- Higgins, S. (2017, December 29). From $900 to $20,000: Bitcoin’s historic 2017 price run revisited. CoinDesk. Available online: https://www.coindesk.com/markets/2017/12/29/from-900-to-20000-bitcoins-historic-2017-price-run-revisited/ (accessed on 17 October 2024).
- Huang, N., Huang, Z., & Wang, W. (2019). The dynamic extreme co-movement between the Chinese stock market and global stock markets. Emerging Markets Finance and Trade, 55(14), 3241–3257. [Google Scholar] [CrossRef] [Scilit]
- Huang, S. J., & Hsieh, C. T. (2000). Application of continuous wavelet transform for study of voltage flicker-generated signals. IEEE Transactions on Aerospace and Electronic Systems, 36(3), 925–993. [Google Scholar] [CrossRef] [Scilit] [PubMed]
- Jana, S., & Sahu, T. N. (2023). Is the cryptocurrency market a hedge against stock market risk? A Wavelet and GARCH approach. Economic Notes, 52(3), e12227. [Google Scholar] [CrossRef] [Scilit]
- Jana, S., & Sahu, T. N. (2024). A wavelet analysis of investing in cryptocurrencies in the Indian stock market. International Journal of Emerging Markets, 20, 3229–3251. [Google Scholar] [CrossRef] [Scilit]
- Jeribi, A., Fakhfekh, M., & Jarboui, A. (2022). Volatility dynamics and diversification benefits of Bitcoin under asymmetric and long memory effects. Global Business and Economics Review, 26(1), 65–83. [Google Scholar] [CrossRef] [Scilit]
- Jeribi, A., Jena, S. K., & Lahiani, A. (2021). Are cryptocurrencies a backstop for the stock market in a COVID-19-led financial crisis? Evidence from the NARDL approach. International Journal of Financial Studies, 9(3), 33. [Google Scholar] [CrossRef] [Scilit]
- Jia, Z., Tiwari, S., Zhou, J., Farooq, M., & Fareed, Z. (2023). Asymmetric nexus between Bitcoin, gold resources and stock market returns: Novel findings from quantile estimates. Resources Policy, 81, 103405. [Google Scholar] [CrossRef] [Scilit]
- Kristjanpoller, W., Bouri, E., & Takaishi, T. (2020). Cryptocurrencies and equity funds: Evidence from an asymmetric multifractal analysis. Physica A: Statistical Mechanics and Its Applications, 545, 123711. [Google Scholar] [CrossRef] [Scilit]
- Kumah, S. P., & Odei-Mensah, J. (2021). Are Cryptocurrencies and African stock markets integrated? The Quarterly Review of Economics and Finance, 81, 330–341. [Google Scholar] [CrossRef] [Scilit]
- Li, X., Gan, K., & Zhou, Q. (2023). Dynamic volatility connectedness among cryptocurrencies and China’s financial assets in standard times and during the COVID-19 pandemic. Finance Research Letters, 51, 103476. [Google Scholar] [CrossRef] [Scilit]
- Mensi, W., Maitra, D., Selmi, R., & Vo, X. V. (2023). Extreme dependencies and spillovers between gold and stock markets: Evidence from MENA countries. Financial Innovation, 9(1), 47. [Google Scholar] [CrossRef] [Scilit] [PubMed]
- Özdemir, O. (2022). Cue the volatility spillover in the cryptocurrency markets during the COVID-19 pandemic: Evidence from DCC-GARCH and wavelet analysis. Financial Innovation, 8, 12. [Google Scholar] [CrossRef] [Scilit] [PubMed]
- Rejeb, A. B., & Boughrara, A. (2015). Financial integration in emerging market economies: Effects on volatility transmission and contagion. Borsa Istanbul Review, 15(3), 161–179. [Google Scholar] [CrossRef] [Scilit]
- Rigobon, R. (2002). International financial contagion: Theory and evidence in evolution. Research Foundation of AIMR Publications. [Google Scholar]
- Sun, L., Wang, Z., Kong, S., & Xia, X. (2024). Correlation and spillover effects between the carbon market and China’s stock market: Evidence from wavelet and quantile coherency network analysis. International Review of Economics and Finance, 93, 1175–1196. [Google Scholar] [CrossRef] [Scilit]
- Tan, C. C., Ling, P. S., Sim, S. L., & Ming, K. L. Y. (2023). Hedge and safe-haven properties of Cryptocurrencies: Evidence in east asia-5 market. Cogent Economics & Finance, 11(1), 2183640. [Google Scholar] [CrossRef] [Scilit]
- Umar, M., Hung, N. T., Chen, S., Iqbal, A., & Jebran, K. (2020). Are stock markets and cryptocurrencies connected? The Singapore Economic Review, 1–16. [Google Scholar] [CrossRef] [Scilit]
- Urquhart, A. (2018). What causes the attention of Bitcoin? Economics Letters, 166, 40–44. [Google Scholar] [CrossRef] [Scilit]
- Uzonwanne, G. (2021). Volatility and return spillovers between stock markets and cryptocurrencies. The Quarterly Review of Economics and Finance, 82, 30–36. [Google Scholar] [CrossRef] [Scilit]
- Wang, G., Tang, Y., Xie, C., & Chen, S. (2019). Is bitcoin a safe haven or a hedging asset? Evidence from China. Journal of Management Science and Engineering, 4(3), 173–188. [Google Scholar] [CrossRef] [Scilit]
- Yang, L., Cai, X. J., Zhang, H., & Hamori, S. (2016). Interdependence of foreign exchange markets: A wavelet coherence analysis. Economic Modelling, 55, 6–14. [Google Scholar] [CrossRef] [Scilit]

Disclaimer/Publisher’s Note: The statements, opinions and data contained in all publications are solely those of the individual author(s) and contributor(s) and not of MDPI and/or the editor(s). MDPI and/or the editor(s) disclaim responsibility for any injury to people or property resulting from any ideas, methods, instructions or products referred to in the content. |
© 2026 by the author. Licensee MDPI, Basel, Switzerland. This article is an open access article distributed under the terms and conditions of the Creative Commons Attribution (CC BY) license.