


Abstract
Periods of geopolitical uncertainty have increasingly shaped the performance of global financial markets, yet the extent to which these risks influence the co-movement of asset markets in South Africa remains unclear. Although co-movement has emerged as a crucial factor for investors seeking portfolio diversification, existing studies present mixed findings, with some suggesting that geopolitical risk strengthens financial integration, defined as the extent to which markets move together in response to global shocks, while others find that it weakens these linkages by triggering market segmentation. Against this backdrop, this study examines the impact of geopolitical risk’s influence on the co-movement of South African asset markets, focusing on how shifts in global uncertainty interact with local market dynamics. Using time-series monthly data from December 2004 to January 2025, the study applies a dual-method approach. The multivariate generalised autoregressive conditional heteroskedasticity asymmetric dynamic conditional correlation (MGARCH-ADCC) model is first employed to estimate time-varying correlations across the equity, bond, and property markets. Thereafter, the autoregressive distributed lag (ARDL) model is used to assess both the short- and long-run effects of geopolitical risk on these co-movement patterns. The results indicate that geopolitical risk significantly increases co-movement between South African asset markets in both the short and long run, thereby diminishing the traditional benefits of diversification. These findings reinforce the view that market participants respond collectively to uncertainty rather than fundamentals. Overall, the study contributes to the empirical understanding of market integration under geopolitical stress and highlights the need for investors and policymakers to incorporate geopolitical risk indicators into investment and policy frameworks to strengthen market resilience.
JEL Classification:
G1; G11; C32
1. Introduction and Background to the Study
Financial markets have demonstrated their importance in modern economies, serving as vital instruments that foster economic growth and development across emerging and developed countries. A financial market can be defined as a marketplace where individuals, companies, and governments exchange financial instruments and assets like stocks, bonds, derivatives, and commodities via an exchange (CFI Teams, 2023). The South African financial market operates under a robust regulatory framework that promotes stability and efficiency in its operations (Swart & Lawack-Davids, 2010). The Johannesburg Stock Exchange (JSE), the country’s first stock exchange, was founded in 1887 to provide mining companies with a platform to raise capital following the discovery of gold (JSE, 2025a). This followed the establishment of the Egyptian Exchange in 1883, with the first exchange originating in Alexandria (Otaify, 2016). Within this context, the JSE is among the oldest stock exchanges on the African continent. Over time, it has evolved into Africa’s largest stock exchange and the world’s 16th largest (JSE, 2025b). According to Moodley et al. (2024), the JSE facilitates trading of various asset markets, including the equity market whereby stocks and equities are traded, the bond market that facilitates the issuing and trading of debt securities, the property market that focuses on buying and selling of real estate, the foreign exchange market where currencies are exchanged, and the commodities market where people can trade commodities such as gold, oil, and agricultural assets. These asset markets are important for enabling efficient asset allocation of capital while providing investors with the opportunity to diversify their portfolios and mitigate risks (Markowitz, 1952).
Despite this, the co-movement of asset markets in developing economies has emerged as a crucial factor for investors looking to diversify their portfolios and enhance their portfolio returns (Moodley et al., 2025). Ocran and Mlambo (2009) define co-movement as the correlation between two asset prices that cannot be fully explained by fundamental economic factors. It is particularly important because it undermines the core principles of risk management through a documented financial phenomenon known as correlation breakdown (Li et al., 2021), where correlations between asset returns surge at times of increased market volatility, resulting in movement in the same direction of previously uncorrelated assets (Loretan & English, 2000). Investors, therefore, forfeit the protective benefits that diversification is intended to provide when asset markets, which typically have distinct characteristics, begin moving in tandem due to shared or overlapping factors.
Therefore, the degree of co-movement among asset classes plays a pivotal role in effective portfolio management, and understanding these dynamics is vital for risk management and financial policy design. However, much of the existing literature focuses on developed economies, where co-movement dynamics have been shown to differ from those in emerging markets (P. Chen, 2018). This limits the direct applicability of findings to emerging economies such as South Africa. Consequently, academics have in recent years attempted to examine the key factors that drive asset market co-movement in emerging markets. Studies reveal that the issue of co-movement relates to how asset prices and returns jointly react to macroeconomic factors (Ocran & Mlambo, 2009), while other studies suggest that geopolitical risk (GPR) is an additional significant determinant (Jarina, 2023; Gamboa-Estrada & Romero-Chamorro, 2024; Lamine & Zribi, 2024). Moodley et al. (2025) further attribute co-movement to investor sentiment and changing market conditions.
The Corporate Governance Institute defines geopolitical risks as threats arising from events such as wars, political instability, sanctions, terrorism, or diplomatic tensions. These events disrupt global economic conditions as the tensions disrupt the normal course of international relations. Certain geopolitical changes can have heterogeneous effects across asset classes, enhancing the attractiveness of some investments while negatively impacting others, depending on the affected markets and investor perception (Zaremba et al., 2022; Baur & Smales, 2020). These effects can increase market uncertainty, though the impact varies across different geopolitical events. Caldara and Iacoviello (2022) found that spikes in geopolitical risk tend to lead to increased volatility and stronger links between markets, triggering simultaneous responses across multiple asset classes. This is particularly challenging for South Africa, given its persistent underlying economic and political risks. According to Morningstar Investment Management South Africa, South African investors are constantly seeking offshore exposure in hopes of diversifying their holdings. Geopolitics have become a complex mix of events, exogenous factors, and thematic risks with complexities posing a heightened risk to the global economy and the potential to lead to more frequent geopolitical surprises in the coming decade (Mercier, 2024). What this means is that geopolitical risks are a crucial factor for investors and decision-makers seeking to preserve portfolio stability and financial market performance.
Some studies suggest that geopolitical uncertainty may lead to shifting correlations and changes in market connectedness, potentially reflecting flight-to-safety behaviour as investors rebalance toward safer assets (Lai et al., 2023; Dong & Wen, 2023; Carney et al., 2024). In contrast, others argue that geopolitical risk and prior shocks tend to increase co-movement by elevating investor uncertainty (Andrews & Gonçalves, 2025; Papathanasiou & Koutsokostas, 2026). As a result, it is difficult for South African investors and policymakers to understand co-movement patterns, limiting their ability to make well-informed decisions regarding diversification and systemic risk mitigation, which increases their exposure to excess risk and loss. Moreover, there is conflicting evidence regarding the nature and direction of co-movement effects in the literature, as alluded to previously. These inconclusive findings limit investors’ and portfolio managers’ ability to develop sound financial strategies, as the lack of consensus on whether asset class relationships get stronger or weaker during turbulent times hampers decision-making.
Despite geopolitical risk being a major factor in determining the co-movement of asset markets, the literature presents conflicting findings. In both developed and emerging market settings, academics find that geopolitical risk drives asset market co-movement (Andrews & Gonçalves, 2025; Papathanasiou & Koutsokostas, 2026), whereas other academics find that geopolitical risk may lead to weaker co-movement or market segmentation in certain periods, particularly as investors rebalance portfolios toward safe-haven assets in a flight-to-safety response (Baur & Lucey, 2010; Baur & McDermott, 2010). However, in South Africa, there is no conclusive understanding regarding the impact of geopolitical risk on asset market co-movement, as limited studies exist. This highlights the practical significance of understanding this relationship as it exposes investors to uncertainty, as appropriate investment decisions and risk management strategies cannot be implemented in line with the state of geopolitical risk in South Africa. As such, there is a pressing need for empirical studies that clarify these dynamics within the unique setting of South Africa’s financial markets. On this basis, this study seeks to identify the dynamic co-movement patterns among South Africa’s asset markets and to evaluate how geopolitical risk influences these co-movements in both the short and the long run. To achieve these objectives, the multivariate generalised autoregressive conditional heteroskedasticity asymmetrical dynamic conditional correlation (MGARCH-ADCC) model is employed to generate the co-movement parameters, followed by application of the autoregressive distributed lag (ARDL) model to examine the influence of geopolitical risk on these parameters.
This study contributes in many ways to the empirical literature. Firstly, although limited research exists in South Africa and in other emerging markets on the influence of geopolitical risk on asset market co-movement, this study adds a valuable perspective to a relatively underexplored area. In addition, it broadens the empirical literature in emerging market settings like South Africa, which is concentrated on asset-market returns as opposed to asset-market co-movement. Consequently, it situates the influence of global geopolitical risk within the unique structural and institutional context of South Africa’s financial system. By combining a volatility-based (MGARCH-ADCC) and equilibrium-based (ARDL) framework over a period of 20 years, marked by major geopolitical shifts, the study also links uncertainty transmission to the dynamics of domestic asset market co-movement. Secondly, the study focuses on asset selection, portfolio rebalancing, and diversification strategies in light of geopolitical risk tensions. Therefore, it has significant practical contributions, as investors can use the findings to develop more targeted risk management and investment strategies to mitigate uncertainty and portfolio risk during periods of geopolitical instability. Thirdly, the study equips portfolio managers with empirical evidence on how South Africa’s asset-market returns respond to geopolitical risks, allowing for these findings to be incorporated within investors’ risk strategies.
The remainder of the research article is outlined as follows: The literature review section is presented in Section 2; Section 3 considers the methodology, including data collection and the empirical model description; Section 4 provides the empirical results; Section 5 provides the discussion of results; and Section 6 concludes the research article.
2. Literature Review
This literature review evaluates the impact of GRP on various asset markets, with a particular focus on equities, bonds, and property markets. It highlights the complex and evolving role of GRP in shaping global financial stability. The first subsection introduces key risk-return theories, including two co-movement theories that underpin this study. This is followed by a review of empirical evidence from both domestic and international literature on how GRP affects different asset classes. The subsequent section presents the contextual framework. Finally, the section concludes by synthesising the theoretical and empirical insights discussed.
2.1. Theoretical Considerations
This subsection presents an overview of the theoretical framework underpinning this study. The analysis draws primarily on two key theories of asset market co-movement. The first is the fundamental-based theory, which represents the traditional view rooted in the assumption of frictionless markets and rational investors. The second is the category-based theory, which falls under the broader class of friction-based and sentiment-driven theories of co-movement. Lastly, two additional key linked risk-return theories are also presented, namely the modern portfolio theory (MPT) and the capital asset pricing theory (CAPM).
2.1.1. Fundamental-Based Theory
The fundamental-based theory was formalised by Barberis et al. (2005) and is rooted in the assumption of efficient and frictionless markets where investors behave rationally. According to this view, asset prices move together (co-move) or react similarly because they respond to shared economic news that affects their fundamental values, such as changes in interest rates, inflation expectations, and GDP growth resulting from financial market conditions (Barberis et al., 2005). The theory posits that synchronised movements in expected cashflows lead to correlations in asset returns. Co-movement arises when information affecting risk aversion or interest rates simultaneously impacts the discount rates used to value multiple assets (Moodley et al., 2025).
This framework is relevant to the current study, as it provides a baseline for understanding asset co-movement in the absence of behavioural or geopolitical frictions. By contrasting this rational, fundamental-based view with alternative models, the study can better isolate the role of GRP in driving asset return correlations. While the fundamental-based theory explains co-movement largely through shared economic fundamentals and rational pricing, it falls short of accounting for situations where asset prices move together even when their underlying fundamentals remain unchanged. To bridge this gap, the category-based theory introduces a behavioural perspective, highlighting the role of investor psychology, sentiment, and categorisation tendencies in shaping asset co-movement.
2.1.2. Category-Based Theory
In contrast to the rational market view, the category-based theory, developed by Barberis et al. (2005), introduces a behavioural explanation to asset co-movement. Friction and sentiment-based theories challenge the assumption of investor rationality, arguing that market participants are influenced by behavioural biases, market frictions, and limits to arbitrage (Barberis et al., 2005). Within this framework, the category-based view posits that investors tend to categorise assets into broad categories and base portfolio decisions on these groupings instead of evaluating their fundamentals separately. Consequently, when investor sentiments about a particular category shift, all assets within these groups are traded simultaneously, resulting in excessive co-movement between those assets (Barberis et al., 2005).
This theory offers a framework for examining how GRP could shape investor sentiment, prompting broad re-categorisation of assets and synchronised trading behaviour, thereby potentially intensifying co-movement in asset returns.
2.1.3. Risk-Return Frameworks
Alongside co-movement theories, risk-return frameworks offer a structured approach to evaluating portfolio performance and investment decisions. By assessing both expected returns and associated risks, these frameworks account for correlations among asset classes and the potential influence of external shocks, including geopolitical events. Within this context, modern portfolio theory (MPT) and the capital asset pricing model (CAPM) serve as foundational tools, linking theoretical insights on diversification and systematic risk to practical portfolio construction and management.
Modern Portfolio Theory (MPT)
The modern portfolio theory (MPT), proposed by Markowitz (1952), laid the groundwork for modern investment thinking and continues to influence portfolio management practices today. It introduced a systematic, quantitative approach to portfolio construction, focusing on the trade-off between risk and return. Instead of selecting individual assets in isolation, the theory promotes diversification across multiple asset classes to improve the portfolio’s overall risk-return profile (Logue, 2023). Fundamentally, the MPT asserts that risk, measured by the standard deviation (volatility) of returns, can be lowered without sacrificing potential returns if assets are combined thoughtfully based on their correlations (Markowitz, 1952).
A key contribution of the theory is the concept of the efficient frontier, which represents the set of optimal portfolios that deliver the highest expected return for a given level of risk. This framework serves as a guide for investors, enabling them to choose portfolios that align with their specific risk tolerance. Complementing this is the capital market line (CML), which is central to the MPT framework and identifies the ideal portfolio by combining a risk-free asset with a well-diversified mix of risky assets.
The theory also highlights the critical role of asset co-movement in determining the effectiveness of diversification. When GRP increases correlations among asset classes such as equities, bonds, and property, the efficient frontier can become compressed, thereby weakening the benefits of diversification. This dynamic poses significant challenges for risk management, portfolio allocation, and achieving optimal investment performance. Consequently, understanding how geopolitical shocks influence asset co-movement becomes integral to applying the core principles of MPT in real-world portfolio strategies. Building on the foundational insights of MPT, the capital asset pricing model (CAPM) provides a complementary framework for linking systematic risk to expected returns.
Capital Asset Pricing Model (CAPM)
The capital asset pricing model (CAPM), developed by Sharpe (1964), Lintner (1965), Treynor (1961), and Mossin (1966), builds on Markowitz’s MPT by defining a clear link between an asset’s expected return and its exposure to systematic risk (Elbannan, 2015). While Markowitz focused on diversification, CAPM shows how much return investors should expect for taking on market-wide risk.
At the core of CAPM is this formula:
where E(Ri) is the expected return on an asset, Rf is the risk-free rate, E(Rm) is the expected return of the market portfolio, and βi measures the asset’s sensitivity to market movements. This relationship is visually represented by the security market line (SML), which maps the expected return of an asset against its beta. Assets above the SML are considered undervalued, while those below are overvalued.
E(Ri) = Rf + βi[E(Rm) − Rf],
CAPM rests on several assumptions: Investors are rational and risk-averse, markets operate without frictions, all participants share the same expectations, and borrowing or lending at the risk-free rate is accessible to everyone. Within this framework, it is assumed that investors hold combinations of a risk-free assets and the market portfolio, which is considered the optimal mix of risky assets.
In markets that are more exposed to geopolitical uncertainty, such as South Africa, disruptions may misalign assets from the SML, making it more challenging to accurately price risk. Given the influence of GRP on systematic uncertainty in South African markets, CAPM provides a useful lens through which to interpret deviations in asset pricing under geopolitical stress.
2.2. Empirical Review
Several studies support the view that asset market co-movements in South Africa may not be fully explained by traditional fundamentals. Instead, they appear to be driven by factors such as investor sentiment and behavioural responses to uncertainty—a dynamic that may be exacerbated by GRP. While not all studies explicitly investigate GRP, many highlight uncertainty or sentiment effects that may arise from such exogenous shocks, suggesting an indirect but plausible influence.
Ocran and Mlambo (2009) provide early evidence of excess co-movement between equity and bond returns in South Africa from 1995 to 2005. Their results show that, while bond returns displayed some responsiveness to macroeconomic fundamentals, equity returns were significantly influenced only by changes in money supply, although only at a 10% significance level. The authors attribute this disconnect from fundamentals to noise trading and herd behaviour, suggesting that investor decisions may have been guided more by sentiment and speculative trends rather than by objective economic data. This points to a financial environment where uncertainty, possibly triggered by exogenous shocks like geopolitical events, fuels irrational investor behaviour and, in turn, leads to synchronised movements in asset prices. However, the robustness of these conclusions is somewhat limited by data constraints, including non-normal distributions and a lack of comprehensive bond market indices.
Expanding the view across markets, Sakemoto (2018) employed a dynamic hierarchical factor model (DHFM) to assess equity-bond co-movements in both developed and emerging economies from 2001 to 2014. The study found that, in developed markets such as Germany and the Netherlands, over 80% of asset return variance was explained by common factors, reflecting strong co-movements. In contrast, emerging markets exhibited weaker integration, with idiosyncratic, country-specific factors playing a larger role. Notably, Sakemoto observed that co-movement patterns intensify during periods of market-wide uncertainty, as measured by the CBOE volatility index (VIX). This supports the flight-to-quality phenomenon, wherein rising risk perceptions prompt investors to reallocate capital, reinforcing the idea that uncertainty-induced sentiment shifts can drive co-movement. Although comprehensive, the study does not explore South Africa specifically, nor does it isolate the effects of geopolitical shocks, leaving a critical gap in the literature.
Moodley et al. (2025) investigated the effect of sentiment on multi-asset co-movement under bull and bear market conditions using regime-switching models and monthly data from 2007 to 2024. The findings revealed that investor sentiment has a regime-dependent and time-varying effect on co-movements. In bullish periods, sentiment heightened short-term co-movements between equities and bonds, as well as equities and gold. Conversely, in bearish regimes, negative sentiment drove long-term co-movements between various asset pairs, including bonds and property. While GRP was not explicitly modelled, the findings suggest that sentiment acts as a transmission channel through which external shocks (of which geopolitical events can arguably be considered one) may influence co-movement. Given that GRP is a known source of market uncertainty, it likely shapes investor sentiment and thus contributes to behavioural trading patterns and correlated asset movements.
Complementing these findings, Medhioub (2025) demonstrates in six MENA stock markets that geopolitical risks significantly influence herding behaviour. Using quantile regression and the cross-sectional absolute deviation of returns (CSAD) model, the study shows that high geopolitical risk can either amplify or reduce herding, depending on the country and market conditions, with stronger herding observed during bearish periods. These results suggest that exogenous shocks, such as geopolitical risks, can shape investor sentiment and collective trading behaviour, providing a conceptual parallel for South Africa, where GRP-induced uncertainty may similarly drive behavioural co-movements across asset classes.
Jarina (2023) took a more direct approach by examining the effect of GRP on cross-market co-movements in global stock markets and regional foreign exchange markets. Using daily data from 1995 to 2023 and employing a GDCCX-GARCH model along with a quantile regression-based co-exceedance framework, the study found that rising GRP tends to weaken extreme return co-exceedances and dynamic conditional correlations. This suggests a disintegration effect on financial markets, where heightened uncertainty decouples asset behaviours. The study also identified asset-specific responses to geopolitical shocks; for instance, gold exhibited safe haven properties, clean energy investments showed relative resilience, and crude oil prices spiked. However, while offering valuable global insights, the study does not focus on the South African context or explore how geopolitical uncertainty influences co-movements within South Africa’s asset markets, presenting a key empirical gap.
In a more recent study, Papathanasiou and Koutsokostas (2026) examined the co-movement of the aerospace defence sector and a broad spectrum of associated markets during geopolitical uncertainty. The additional markets consisted of the equity, commodity, and foreign-exchange markets in the United States (US). The indices used to proxy each market were the S&P 500 index, an industrial index (S&P 500 Industrials), a global equity index (MSCI world Index), treasury bonds, a commodity-energy index (crude oil), a commodity-precious metal index (gold), a commodity-industrial metal index (copper), a currency index (US dollar index), a volatility index (CBOE index), and the geopolitical risk index. Using a nuanced R-squared decomposition model for January 2010 to February 2025, the findings revealed that geopolitical risk enhances co-movement in US markets. For instance, the dynamic total connectedness exhibits temporal heterogeneity and is subject to fluctuations induced by specific economic events. Five discrete periods of surging connectedness are identified, time-aligned with the 2016 Brexit referendum/US presidential election, the 2018 US-China trade war, the 2020 COVID-19 pandemic, and the 2022 Russian-Ukrainian conflict. Despite the elevated connectedness during periods marked by geopolitical uncertainty, the aerospace defence sector is a prominent hedging factor when incorporated into a multi-asset security portfolio.
2.3. Research Hypothesis and Gap
The theoretical framework of the fundamental-based theory postulates that asset market co-movement is directly aligned with fundamental values such as geopolitical risk. This implies that asset market co-movement is influenced by geopolitical risk both in the short run and in the long run. Furthermore, the category-based theory introduces investors’ perception of the market when making calculated investment decisions, which, in turn, influences asset market co-movement. Therefore, based on theoretical understanding, geopolitical risk affects asset-market co-movement. This is supported by empirical literature such as a report from Moodley et al. (2024), which demonstrates that the South African asset market co-movement is dynamic and asymmetrical. Similarly, Andrews and Gonçalves (2025) and Papathanasiou and Koutsokostas (2026) find that, in developed markets, geopolitical risk has either a positive or a negative effect on asset market co-movement. Moreover, Moodley et al. (2024) demonstrated that South African asset market co-movement is dynamic and asymmetrical. On this basis, the following hypotheses are formulated:
H0.
South African asset market co-movement is dynamic and asymmetrical.
H1.
Geopolitical risk has a significant effect on South African asset market co-movement in the short run and long run.
Taken together, these studies point toward a plausible conceptual pathway in which heightened uncertainty, often driven by external shocks such as GRP, alters investor sentiment, leading to noise trading and herding behaviour that drives co-movement across asset markets. Although Moodley et al. (2025) examined the determinants of South African multi-asset market movement, the study focused only on investor sentiment, and not geopolitical risk. Consequently, empirical literature regarding the effect of geopolitical risk on South African asset-market co-movement is non-existent. This exposes a nuanced gap that could have significant adverse effects on investors if left unstudied, especially in emerging market settings like South Africa. To this extent, the study examines the effect of geopolitical risk on South African asset-market co-movement.
3. Methodology
This section first describes the data sources and sample properties underpinning the analysis (Section 3.1). It then details the econometric approach used to model the relationship between GRP and asset market co-movements (Section 3.2), within which the modelling of asymmetric risk transmission (Section 3.2.1) and the examination of the specific effects of geopolitical shocks (Section 3.2.2) form integral components of the overall analysis. This structured approach ensures that the empirical strategy is transparent and well-aligned with the study’s objectives.
3.1. Data and Sample Properties
This study uses monthly time-series data from December 2004 to January 2025, selected to accommodate the availability of both explanatory and control variables. The monthly frequency aligns with prior research (Moodley et al., 2024; Qabhobho et al., 2024) and corresponds with the reporting intervals of the geopolitical risk (GPR) index (Caldara & Iacoviello, 2022). JSE All Bond Index data is available from September 2003; however, due to significant gaps in the data from September 2003 to October 2004, the analysis begins in December 2004, to ensure consistency and avoid the risks associated with interpolating missing values. This adjusted starting point ensures data robustness and aligns with the availability of all required variables. Despite these constraints, the chosen frequency and period provide sufficient variation for robust analysis and are consistent with Moodley et al. (2024). The construction of the dependent, independent, and control variables is outlined below.
3.1.1. Dependent Variables
Within this dataset, three dependent variables are examined, representing South Africa’s equity, bond, and property markets, following Ocran and Mlambo (2009) and Moodley et al. (2024), who include these markets in their analyses of South African asset co-movements. Market proxies comprise the JSE All Share Index (ALSI) for equities, the JSE All Bond Index (ALBI) for bonds, and the FNB House Price Index for real estate, providing a comprehensive basis to assess asset price dynamics. Although proxies for the equity market and bond market are readily available, such is not the case for the property market. The proxy used to capture the property market in South Africa is the JSE All Property Market, but such data is only available from 2015. Therefore, the use of such an index will limit the estimation of the time-series analysis that requires a larger sample. Similarly, the ABSA Housing Price Index is also a commonly used proxy, but this index was discontinued in 2016, which further limits the study’s analysis. Consequently, in line with studies by R. Nhlapho and Muzindutsi (2020), Muzindutsi et al. (2023), and Moodley et al. (2024, 2025), the FNB House Price Index is used to proxy the South African property market.
It should be noted that prior studies commonly employ these proxies, supporting their suitability for this analysis (Mloyi & Vengesai, 2024; Nkomo & Moodley, 2025; Muzindutsi et al., 2023).
3.1.2. Independent Variable
The primary explanatory variable is the GPR index developed by Caldara and Iacoviello (2022) for each country, which quantifies global geopolitical tensions by tracking the frequency of relevant terms in leading international newspapers, capturing both actual and perceived events. Specifically, we focus on the geopolitical risk index of South Africa, as it captures the domestic tension with outside countries, which directly influences asset markets in South Africa. The index has been widely employed in macro-financial literature to study the transmission of geopolitical uncertainty to financial markets; for example, Bouri et al. (2020) demonstrate its effectiveness in analysing risk spillovers and investor behaviour during periods of heightened geopolitical tension. Its inclusion allows this study to evaluate how geopolitical risk drives co-movements across South African asset markets.
3.1.3. Control Variables
To isolate the effect of geopolitical risk and ensure the robustness of the analysis, a set of macroeconomic control variables is incorporated, including inflation as proxied by the consumer price index (CPI), money supply proxied by M2, short- and long-term interest rates proxied by the 91-day treasury bill rate and the 10-year government bond yield, respectively, and GDP per capita. Inflation accounts for price-level changes that can distort asset returns, while money supply captures liquidity conditions and central bank policy responses to geopolitical shocks. Both short- and long-term interest rates are included to capture the full spectrum of interest rate dynamics: short-term rates reflect immediate policy adjustments and borrowing costs, while long-term rates reflect market expectations of future economic conditions, both of which can be influenced by geopolitical uncertainty. Finally, GDP per capita is used instead of total GDP to better reflect individual economic well-being and its impact on asset market behaviour, ensuring a more accurate link between personal economic conditions and market movements. However, GDP is only available in quarterly observations. Following studies by Dlamini (2017), Moodley et al. (2022), and Moodley et al. (2025), this study uses EViews 14 to interpolate the data from quarterly to monthly observations. This was performed to ensure consistency among the dependent, independent, and control variables to ensure interpretability. The method used to convert the data from low-frequency to high-frequency data points was the quadratic interpolation method. The specific method is found to outperform other measures, such as linear interpolation, as it creates a smooth series that preserves the original data’s sum or average while modelling curvature (Kilian, 2006; Moodley et al., 2025).
These variables account for broader economic dynamics that may simultaneously influence financial markets, enabling a more accurate assessment of the impact of geopolitical shocks on asset market co-movements.
3.2. Empirical Models
To capture both the dynamic correlations and the short- and long-run relationships between geopolitical risk and South African asset markets, this study employs a dual-method approach, in line with Rajwani and Kumar (2016). Firstly, the MGARCH-ADCC model is applied to estimate time-varying correlations across multiple asset classes, providing insight into asymmetric risk transmission (Bollerslev, 1986). Secondly, the ARDL model is used to examine both short- and long-run interactions between geopolitical risk and asset market co-movement, accommodating mixed integration orders and enabling robust cointegration analysis.
3.2.1. Methodology for Measuring Asymmetric Risk Transmission
MGARCH-ADCC Model
This study applies the MGARCH-ADCC model created by Cappiello et al. (2006). It builds upon R. Engle’s (2002) DCC-GARCH framework by accounting for the influence of the ‘leverage effect’ or asymmetric effects on conditional correlations (J. Chen, 2015). This means it can distinguish between the impact of good and bad news and the correlation between asset returns (Katzke, 2013). The model is estimated in two steps. The first step is to standardise the residuals:
represents the standardised residuals, and corresponds with the conditional variances derived from the estimated univariate GARCH model. The second step extends R. Engle’s (2002) MGARCH-CCC model by employing these standardised residuals to estimate conditional covariances that vary over time:
The conditional variances obtained from the estimated univariate GARCH model are expressed as = , where is the individual variances, and , which forms a positive symmetric matrix with elements along the diagonal. The off-diagonal elements of the C-matrix represent the conditional correlations, which are assumed to change over time. Consequently, the dynamic conditional correlation structure can be described by the following equation:
where and represent the scalar coefficients, while represents the unconditional variance between the asset returns i and o. The scalar parameters and are estimated via the likelihood function. refers to the unconditional covariance calculated in the first step using the univariate GARCH models. The dynamic conditional correlation matrix, , capturing the correlation between the returns of the two asset classes i and o, is then determined as follows:
The diagonal matrix is denoted by , which consists of the square roots of the diagonal elements of . Therefore, . The corresponding entries within the bivariate framework are as follows:
Asymmetry in the conditional correlations can be incorporated into the MGARCH-DCC model. The following represents Cappiello et al.’s (2006) MGARCH-ADCC model:
, and ; if the asset market shocks are adverse, the latter yields the element-by-element Hadamard product of the residuals, where .
3.2.2. Methodology for Examining the Effect of Geopolitical Risk
ARDL Model
The ARDL model is selected to understand how geopolitical risk influences asset market co-movement in the short run and long run. The selection of the model follows that of R. N. Nhlapho (2023), who similarly utilised the ARDL framework to examine how asset market co-movement is influenced by country risk in the short run and long run. The ARDL approach was developed by Pesaran and Smith (1999) and is particularly suitable for this study, given the mixed order of integration I(0) or I(1) among the variables and its ability to produce consistent and unbiased long-run estimates even in small samples (Pesaran et al., 2001). Unlike conventional cointegration techniques such as the Johansen VAR approach, the ARDL model accommodates variables with different lag structures, providing flexibility when modelling financial time-series data with heterogeneous adjustment speeds. The general ARDL (p, q) model is specified as follows:
where is the dependent variable denoting asset market correlations, measured respectively for the equity (ALSI), bond (ALBI), and property (FNB House Price Index) markets. refers to geopolitical risk, and is a vector of control variables, including inflation, money supply (M3), short-term and long-term interest rates, and GDP per capita. is the stochastic error term.
Optimal lag lengths are determined using the Schwarz information criterion (SIC) to balance model fit and parsimony, as suggested by Lütkepohl (2005). The existence of a long-run relationship is tested using the ARDL bounds testing procedure, which compares the computed F-statistic against the critical bounds provided by Pesaran et al. (2001).
If cointegration is confirmed, the ARDL model is re-parameterised into an error correction model (ECM), as follows:
where represents the speed of adjustment to long-run equilibrium; this value is expected to be negative and, when statistically significant, confirms a stable long-run relationship (Pesaran et al., 2001). , and denote the long-run coefficients, measuring the equilibrium relationship among asset market correlation, geopolitical risk, and macroeconomic controls. The differenced terms () represent short-run dynamics, reflecting how immediate shocks in geopolitical risk and macroeconomic factors influence co-movement. is the white-noise disturbance term.
The magnitude of || indicates the proportion of disequilibrium corrected each month, thereby quantifying how rapidly markets revert to long-run equilibrium following a geopolitical disturbance.
To ensure model reliability, diagnostic tests for serial correlation, heteroskedasticity, functional form, and normality are conducted. Model stability is evaluated using CUSUM and CUSUMSQ tests. Furthermore, given the potential for parameter instability due to major global events, the Bai-Perron multiple structural break test is employed as a robustness check to detect and control for potential breaks within the sample period.
This framework enables a comprehensive decomposition of the influence of geopolitical risk into short-run transmission channels, where markets react to new information through immediate volatility adjustments, and long-run equilibrium effects, where persistent shifts in global risk sentiment reshape inter-asset correlations. Applying this framework across the equity, bond, and property markets provides an integrated understanding of how geopolitical shocks propagate through South Africa’s financial system.
4. Empirical Results
4.1. Preliminary Tests
4.1.1. Graphical Representations
Presented in Figure 1 are graphical representations of South African asset market returns. These plots illustrate constant means over the sample period, confirming the stationarity of the series, particularly in the equities and bonds markets. Additionally, the returns display time-varying variance that follows an autoregressive pattern, leading to volatility clustering across all markets. The plots emphasise specific periods as riskier, marked by increased return volatility. Notably, the riskier periods align with the global financial crisis and the COVID-19 global pandemic (Andreou & Ghysels, 2002). The equities market experienced extreme volatility during both of these crises, the bonds market saw heightened volatility mainly during the pandemic, and the property market was most affected during the financial crisis.
Figure 1.
South African market proxy returns Source: authors’ own estimation (2025).
4.1.2. Descriptive Statistics
Table 1 below presents the descriptive statistics, the results from the unit root and stationarity tests, and the ARCH tests for various South African asset markets. Panel A reveals that the equity market proxy records both the highest and lowest returns over the sample period, indicating significant fluctuations. Its standard deviation is also the highest among all asset markets. These findings align with the notion that equities are typically viewed as more volatile, given their exposure, as opposed to hedging instruments like bonds and property. These results align with the findings of Moodley et al. (2024), who reported that the property market recorded the lowest maximum and highest minimum values, suggesting greater stability in returns. This perspective is further reinforced by Akinsomi et al. (2017), who similarly characterised property as the most stable asset, attributing this to limited risk exposure and consistent appreciation. Despite the high volatility observed in our sample, the equity market still delivers the highest returns, consistent with the risk-return trade-off predicted by economic theory.
Table 1.
Descriptive statistics, unit root/stationarity, and ARCH-LM test results.
The property market exhibits the lowest maximum and highest minimum values among the asset classes, highlighting its relative stability and resulting in a lower standard deviation. This stability can be attributed to property market securities’ role as safer stores of value; and as such, they are particularly attractive to risk-averse investors during geopolitical or macroeconomic shocks (Campbell et al., 2020). All three asset markets show positive maximum values and negative minimum values, reflecting the natural fluctuations of returns. The skewness values show that, while the equity and bond markets are negatively skewed, reflecting a greater likelihood of extreme losses, the property market displays positive skewness, suggesting the presence of larger positive returns. This highlights the uneven nature of return distributions across different asset classes. The kurtosis values for all series are above three, confirming that the distributions are leptokurtic, with sharper peaks and fatter tails than the normal distribution. This means that large return movements occur more frequently, pointing to volatility clustering and heightened shocks. In line with these findings, the Jarque-Bera test strongly rejects the null hypothesis of normality for all series, as the p-values are statistically significant at the 1% level.
Panel B of Table 1 presents the results of the unit root and stationarity tests for the asset markets. All three asset markets show statistically significant results at a 1% significance level using the augmented Dickey-Fuller (ADF) test, with t-statistics more negative than the critical values. This leads to the rejection of the null hypothesis, indicating that the asset market series do not contain a unit root and are stationary (alternative hypothesis). In line with this, the Kwiatkowski-Phillips-Schmidt-Shin (KPSS) test, developed by Kwiatkowski et al. (1992), demonstrates LM statistics that are much smaller than the critical values, leading to failure to reject the null hypothesis that the asset market series is stationary. These findings from the ADF and KPSS tests suggest that the asset market return series are integrated at order I(0). As a result, these returns can be used at their existing levels as input for the MGARCH-ADCC model, as they satisfy the stationarity condition required for GARCH models.
As a secondary pre-diagnostic step, ARCH-LM tests, developed R. F. Engle (1982), were conducted on all series, including both independent and control variables, to assess the presence of conditional heteroskedasticity, a necessary condition for estimating GARCH models. As expected, the control variables—inflation, money supply, and short-term interest rates—did not exhibit ARCH effects, consistent with their smoother dynamics and their role in the mean equation rather than the variance equation. In contrast, the asset return series shows significant ARCH effects, with the exception of the bond proxy. Since the GARCH framework, including its multivariate ADCC extension, fundamentally relies on the presence of conditional heteroskedasticity, the absence of ARCH effects in the All-Bond Index series violated a key assumption necessary for modelling time-varying co-movements. Consequently, the proxy was excluded from the MGARCH-ADCC analysis, and GARCH-family models were applied exclusively to the equity (JSE All Share Index) and property (FNB Housing Index) markets to capture their conditional volatility and dynamic correlation behaviour.
4.2. Empirical Model Results
4.2.1. GARCH Results
GARCH Model Selection
Following the ARCH-LM tests, the next step in the model estimation process is to determine the appropriate univariate GARCH specification. This is crucial for obtaining the residuals, which are subsequently standardised and used in the MGARCH-ADCC model estimation. Table 2 presents the univariate GARCH specifications for the equity and property markets. To select the most suitable model for the specification, Schwarz’s information criterion (SIC) is employed, as it is known to effectively balance model fit and complexity, particularly when dealing with models that have multiple parameters. Furthermore, the study considers three different estimation techniques: normal, student’s T, and generalised error distribution (GED). The results suggested different univariate models for each asset market: an EGARCH (1,1) model for the equity market and a GJR-GARCH (1,1) model for the property market.
Table 2.
Univariate GARCH model specification.
Univariate GARCH Model Results
Table 3 presents the univariate GARCH estimation according to the specified model. Panel A displays the mean equation, while Panel B outlines the variance equation. The intercept (μ) in the mean equation represents the expected return when both total risk and the return from the previous period are zero. For both equity and property, the intercept is insignificant, indicating that the average return is not determined by past shocks or previous returns (Bodie et al., 2019). The serial correlation parameter (ϕ) is negative and insignificant for equity, suggesting that past returns do not explain current returns in this market. By contrast, (ϕ) is positive and highly significant for property, implying that past returns play an important role in determining current returns. Similarly, the GARCH term (ζ) is insignificant for equity but positive and significant for property, indicating that past shocks contribute to explaining future returns in the property market but not in the equity market. The risk premium parameter (υ) is insignificant across both markets, which implies no measurable compensation for bearing risk in these mean equations.
Table 3.
Univariate GARCH model results.
Panel B, which is the variance equation, shows that the ARCH term (ω) is positive and significant for both equity and property, confirming that recent shocks affect current volatility. The GARCH term (ϑ) is also positive and significant for both asset classes, indicating that volatility is persistent and that past volatility helps to explain current volatility. The leverage parameter (γ) is negative and significant for equity, providing evidence of leverage effects, where negative shocks increase volatility more than positive shocks of the same magnitude. For the property market, the leverage term is negative but insignificant, suggesting that asymmetry in the volatility response is weak or absent.
Finally, Panel C presents the ARCH-LM diagnostic test, which is insignificant at the 1% level for both models. This confirms the non-existence of ARCH effects in the return series and justifies the robustness of the model.
MGARCH-ADCC Model Results
After establishing the appropriate univariate GARCH specifications, the squared residuals were extracted and subsequently employed in the estimation of the MGARCH-ADCC model. The estimation procedure followed the same approach applied to the univariate models, ensuring consistency in the methodological framework.
In Table 4, the coefficients θ1 and θ2 capture, respectively, the effects of past shocks and dynamic conditional correlations on current correlations. The results show that θ1 is negative and statistically significant. These are interesting findings, as they suggest that past negative shocks tend to decrease co-movement of the equity-property market. Although nuanced, this does not come as a shock, as it further highlights the hedging characteristics of the South African property market. These findings align with Akinsomi et al. (2017) and Alsadan et al. (2025), who found that the inclusion of property market securities in a mixed-asset portfolio will generate higher risk-adjusted returns, whereas R. N. Nhlapho (2023) found that property market securities affect hedging characteristics. However, θ2 is positive and statistically significant, suggesting that, once correlations stabilise, they display persistence over time. This implies that, while markets initially absorb shocks and partially decouple, their long-run co-movement remains strong, meaning that shocks such as those stemming from GPR can have enduring effects on the asset market.
Table 4.
ADCC-EGARCH (1.1) model results.
The asymmetry coefficient, θ3, is statistically insignificant, implying that leverage effects are not present in this market pair. This means that negative shocks, such as geopolitical crises, do not generate disproportionately higher correlations relative to positive shocks. Such findings stand in contrast to Muguto (2022), as well as Kenourgios et al. (2011), where asymmetry effects are often detected. This divergence highlights a potential contribution of the study, as it shows that South Africa’s asset markets may behave differently in the face of adverse shocks. Importantly, the stability condition (θ1 + θ2 < 1) is satisfied for the equity-property market, thereby affirming the suitability of the MGARCH-ADCC model in capturing the dynamics of co-movement within this context.
4.2.2. ARDL Results
The next step involved assessing the impact of geopolitical risk on the co-movement of South African asset classes. Consequently, the dependent variable was derived from the ADCC model in the form of time-varying correlation, which was then regressed against geopolitical risk and the selected control variables.
Bounds Cointegration Results
Table 5 below presents the bounds test results for the ARDL specification by Pesaran et al. (2001). The computed F-statistic of 5.672 exceeds the upper bound of the critical value at the 1% significance level (3.990). This allows for rejection of the null hypothesis of no level relationship, confirming the existence of cointegration among the variables. In practical terms, this indicates that asset market co-movement in South Africa is anchored in a long-run equilibrium jointly shaped by geopolitical risk and macroeconomic fundamentals such as inflation, GDP, interest rates, and money supply. The confirmation of cointegration validates the ARDL framework employed in this study, as it permits the joint estimation of both short-run dynamics and long-run adjustments.
Table 5.
Bounds test results.
Short-Run and Long-Run Results
Panel A of Table 6 presents the long-run estimates. The coefficient on the geopolitical risk index is positive and significant at a 10% level, indicating that geopolitical risk is associated with greater co-movement between the equity and property markets over the long term. This suggests that persistent uncertainty and external shocks become embedded in the financial system, reinforcing integration across the market. Inflation has a negative and significant coefficient, showing that rising inflation dampens co-movement, likely because it erodes real returns and increases market segmentation. Lagged GDP growth is negative and strongly significant, reflecting the stabilising role of real economic performance in reducing synchronisation across markets. Long-term interest rates also exert a negative effect, suggesting that higher long-term yields weaken co-movement as investors diversify portfolios and reprice risk. By contrast, short-term interest rates are positive and significant, underscoring the importance of monetary policy and short-term funding conditions in amplifying co-movement. Lagged money supply growth (M2) is weakly positive, suggesting that liquidity expansions increase correlations across asset classes. Taken together, the long-run results indicate that, while geopolitical risk and monetary factors contribute to greater co-movement, macroeconomic fundamentals, namely inflation, GDP, and long-term rates, tend to offset this by reducing synchronisation.
Table 6.
ARDL (1,1,0,3,0,0,1) output.
Panel B reports the short-run dynamics. Changes in geopolitical risk are highly significant and positive, confirming that shocks have an immediate and pronounced effect on co-movement of the equity and property markets. Short-run GDP growth has a negative coefficient, suggesting a dampening effect on co-movement, while the one-period lag remains negative and marginally significant. However, the two-period lag reverses this effect, indicating that economic growth shocks can initially reduce but subsequently reinforce co-movement. Short-run changes in money supply are weakly negative, pointing to a modest reduction in co-movement. The error correction term is negative and highly significant, which confirms the existence of a stable long-run equilibrium. Its magnitude suggests that approximately 27% of disequilibrium is corrected each period, indicating a moderate adjustment speed towards equilibrium. Overall, the short-run results highlight the dominance of geopolitical risk as the primary driver of co-movement, while GDP and monetary factors exert weaker and more lag-dependent influences.
ARDL Model Diagnostics and Stability Tests
Panel C of Table 6 reports the diagnostic statistics. The LM test for serial correlation and the heteroskedasticity test reveal no evidence of autocorrelation or heteroskedasticity, respectively. These results confirm that the ARDL model is appropriately specified and robust for this analysis. To further validate the model specification, the stability of the estimated parameters was assessed using the CUSUM (cumulative sum of recursive residuals) test developed by Page (1961). The CUSUM test is particularly valuable for detecting structural changes, as it monitors the cumulative sum of recursive residuals over time.
The results illustrated in Figure 2 show that the CUSUM line remains within the 5% significance boundaries across the sample period 2006 to 2024. This outcome implies that the null hypothesis of parameter stability cannot be rejected, thereby confirming that the estimated coefficients are stable throughout the period under review.
Figure 2.
CUSM test. Source: authors’ own estimation (2025).
4.2.3. Robustness Tests
In order to validate the results of the manuscript, a continuous wavelet and a phase angle wavelet were used to assess equity-property market correlations. In Figure 3, the vertical axis represents the investment periods, while the horizontal axis shows the sample period (2004 to 2025). The curved line indicates the 5% significance level, estimated using Monte Carlo simulations. Areas outside this line are considered statistically insignificant at the 95% confidence level. It is evident from the wavelet coherence plot of the equity-property market pair that there are blue areas at the top and red areas at the bottom, right-hand side, and left-hand side of the plot. Moreover, throughout the sample period, the identified colours are alternating. These findings suggest that the correlations of the equity-property market pairs are dynamic and changing over the sample period, which confirms the findings from the MGARCH-ADCC model. Similarly, it is evident that the wavelet plot is dominated by the red areas during the sample period, which suggests that the correlations between the equity and property markets are at low levels. This confirms the hedging properties of the property market, which further supports the nuanced findings of theta 1 from the MGARCH-ADCC model. Collectively, the robustness of the findings is further amplified.
Figure 3.
Continuous wavelet transform (CWT) and phase angle wavelet Source: Authors’ own estimation (2025).
5. Discussion of Results
The findings provide evidence that geopolitical risk heightens asset market co-movement in South Africa in both the short and the long run. This section situates these results within the broader literature, highlighting key alignments with and divergences from international and domestic studies.
The MGARCH-ADCC results show that past shocks reduce current correlations between South African equity and property markets, indicating short-term resilience. However, the positive and significant persistence parameter demonstrates that, once co-movement stabilises, it remains embedded over time, suggesting that geopolitical shocks, though initially absorbed, have lasting effects on asset return co-movement. Jarina (2023) reports a similar pattern, where short-term flight-to-safety behaviour is followed by persistent co-movement as uncertainty becomes embedded in pricing. The ARDL results confirm that geopolitical risk increases co-movement in the short run. However, in the long run, it is important that the interpretation is exercised with caution, as it is only significant at a 10% level. Therefore, while the immediate impact of geopolitical risk is robust, its persistent long-term influence on equilibrium is statistically marginal.
This suggests that while short-term shocks trigger immediate spikes in correlation, long-term effects reflect structural integration of uncertainty. This aligns with Moodley et al. (2025), who link investor sentiment to co-movement under varying market conditions. Geopolitical shocks amplify uncertainty, prompting synchronous portfolio rebalancing consistent with the category-based theory (Barberis et al., 2005). Earlier evidence from Ocran and Mlambo (2009) and Boako and Alagidede (2017) also indicates a behavioural, rather than fundamental basis for co-movement, reinforcing the view that uncertainty-driven linkages intensified from 2004 to 2025 amid major global shocks such as the global financial crisis, the COVID-19 pandemic, and the Russia-Ukraine conflict.
The asymmetry coefficient in the MGARCH-ADCC model is insignificant, indicating that negative shocks do not disproportionately amplify correlations. This contrasts with developed markets, where flight-to-safety channels often strengthen co-movement after negative shocks (Jarina, 2023). In South Africa, weaker safe-haven markets lead to more uniform capital movement across asset classes, consistent with Beirne and Gieck (2014) and Panazan and Gheorghe (2024), who found that emerging markets exhibit more uniform co-movement during periods of geopolitical uncertainty, causing contagion.
Long-run ARDL estimates further show that inflation, GDP growth, and long-term interest rates are negatively associated with co-movement. Strong macroeconomic performance appears to moderate the transmission of geopolitical shocks by differentiating asset returns and reducing correlations, consistent with Fendoglu et al. (2025) and Aslam and Newaz (2025), who found that stronger fundamentals help markets absorb external shocks.
6. Conclusions and Implications
This study set out to examine the relationship between geopolitical risk (GPR) and asset market co-movement in South Africa from December 2004 to January 2025. The main objectives were to identify dynamic co-movement patterns among the country’s equity, bond, and property markets and to assess how geopolitical risk influences these co-movements in both the short run and the long run. However, the bond series did not exhibit ARCH effects, a necessary condition for modelling time-varying conditional correlations within the MGARCH-ADCC framework, and was therefore excluded from the final estimation to ensure methodological validity. Two research questions guided the investigation of these objectives: (1) How does the current South African dynamic asset-market co-movement respond to past shocks in dynamic co-movement, and (2) What effect does geopolitical risk have on South African asset market co-movement? To address these questions effectively, this study employed a dual-method approach that integrated the MGARCH-ADCC model to estimate time-varying correlations among asset markets and the ARDL model to examine both short- and long-run relationships between GPR and asset market co-movement.
The empirical findings revealed that past shocks reduce current correlations between equity and property markets, indicating a self-correcting and resilient market structure, while the persistence parameter confirmed that co-movement is time-varying and exhibits lasting interdependence. Furthermore, the results indicated that changes in GPR strongly increase co-movement in the short run, but in the long run, this effect is statistically marginal, underscoring the sensitivity of South African asset markets to global uncertainty in the short run.
Given these findings, several key implications emerge for theory, policy, and practice. From a practical perspective, the results highlight that GPR diminishes the scope for diversification by strengthening the correlation between asset markets. When geopolitical tensions rise, co-movement between asset markets also increases, and the traditional risk-reduction benefits of holding mixed-asset portfolios decline, leading to higher overall portfolio volatility. This aligns with Krishnan et al. (2009), who argue that increases in asset correlations reduce diversification benefits for investors and elevate market volatility. In this regard, investors and portfolio managers in South Africa must continuously monitor geopolitical developments and integrate geopolitical indicators, such as the Caldara and Iacoviello (2022) GPR index, into their investment and risk management frameworks. The long-run persistence effect observed in this study suggests that geopolitical uncertainty can have lasting implications for asset markets. Failure to account for this could lead to increased portfolio volatility and reduced efficiency along the risk-return frontier, as diversification becomes less effective during periods of heightened global tension (Panazan & Gheorghe, 2024; Fendoglu et al., 2025). Therefore, keeping track of geopolitical developments is essential for ensuring portfolio resilience in South Africa’s investment environment.
From a theoretical standpoint, the results affirm that geopolitical factors drive asset market co-movement, operating through shifts in investor sentiment and the category-based theory of Barberis et al. (2005), which leads market participants to react similarly across asset classes. From a policy perspective, the findings highlight that geopolitical stability is integral to financial stability. Persistent geopolitical tensions can distort pricing mechanisms, discourage foreign investment, and elevate the cost of capital, as emphasised by Carney et al. (2024). Policymakers should therefore prioritise the management of geopolitical relations to maintain market confidence and financial resilience. Economically, if geopolitical tensions continue to intensify, investors may become reluctant to invest in South Africa, leading to reduced capital inflows, lower GDP growth, and constrained fiscal performance. As Nasouri (2025) notes, geopolitical instability undermines investment activity in emerging economies by eroding market confidence. Therefore, geopolitical stability must be treated as an economic policy variable, as it directly influences both market performance and economic growth.
Empirically, this study contributes to the growing body of literature in South Africa on market integration and geopolitical uncertainty by introducing a dual-modelling framework that combines the MGARCH-ADCC and ARDL approaches. Moreover, this study provides new evidence that the property market exhibits higher volatility than equities, suggesting that even traditionally stable asset classes are increasingly sensitive to external geopolitical shocks. This finding challenges conventional assumptions about asset stability and broadens empirical understanding of how different markets respond to global uncertainty.
While this study offers valuable insights, it is not without limitations. The analysis was confined to the equity, bond, and property markets, excluding other potential asset classes such as commodities, foreign exchange, or derivatives. Notably, the bond proxy was ultimately excluded, as discussed earlier, due to the absence of ARCH effects, a necessary condition for GARCH estimation. Nevertheless, the remaining asset classes provided sufficient coverage to address the study’s primary objectives. Future research could extend this framework to incorporate additional asset classes, offering a more comprehensive understanding of financial interlinkages.
Furthermore, as this study focused exclusively on South Africa, future research may benefit from adopting a comparative perspective by examining similar dynamics across other emerging markets. Such cross-country analyses could help determine whether geopolitical risks exert uniform or divergent effects depending on the structural characteristics of each economy.
Author Contributions
Conceptualisation, F.M.; methodology, M.S.; software, M.S.; validation, F.M.; formal analysis, M.S.; investigation, M.S.; resources, F.M.; data curation, F.M.; writing—original draft preparation, M.S.; writing—review and editing, F.M. and M.S.; visualisation, F.M.; supervision, F.M.; project administration, F.M. All authors have read and agreed to the published version of the manuscript.
Funding
This research received no external funding.
Institutional Review Board Statement
Not applicable.
Informed Consent Statement
Not applicable.
Data Availability Statement
The data presented in this study is available on request from the corresponding author due to a paid subscription, which limits the dissemination of data.
Acknowledgments
We are grateful to the National Research Foundation (NRF) for funding the dissertation (grant number PMDS240723250811) from which this research article is derived.
Conflicts of Interest
The authors declare no conflicts of interest.
References
- Akinsomi, O., Balcilar, M., Demirer, R., & Gupta, R. (2017). The effect of gold market speculation on REIT returns in South Africa: A behavioral perspective. Journal of Economics and Finance, 41(4), 774–793. [Google Scholar] [CrossRef] [Scilit]
- Alsadan, A., Alalmaee, H., Zehri, C., & Youssef, W. A. B. (2025). Geopolitical shocks and financial fragmentation: Impact on housing, bond, and stock markets. Review of Development Finance, 15(1), 69–97. [Google Scholar]
- Andreou, E., & Ghysels, E. (2002). Detecting multiple breaks in financial market volatility dynamics. Journal of Applied Econometrics, 17(5), 579–600. [Google Scholar] [CrossRef] [Scilit]
- Andrews, S., & Gonçalves, A. S. (2025). From bonds to dividend strips: Decomposing the equity premia term structure. Kenan Institute of Private Enterprise Research Paper Forthcoming. Available online: https://ssrn.com/abstract=3706414 (accessed on 3 March 2026).
- Aslam, A., & Newaz, M. K. (2025). Geopolitical risk and bond market dynamics: Assessing the impact of threats and realized events. The Quarterly Review of Economics and Finance, 103, 102032. [Google Scholar] [CrossRef] [Scilit]
- Barberis, N., Shleifer, A., & Wurgler, J. (2005). Comovement. Journal of Financial Economics, 75(2), 283–317. [Google Scholar] [CrossRef] [Scilit]
- Baur, D. G., & Lucey, B. M. (2010). Is gold a hedge or a safe haven? An analysis of stocks, bonds and gold. Financial Review, 45(2), 217–229. [Google Scholar] [CrossRef] [Scilit]
- Baur, D. G., & McDermott, T. K. (2010). Is gold a safe haven? International evidence. Journal of Banking & Finance, 34(8), 1886–1898. [Google Scholar] [CrossRef] [Scilit]
- Baur, D. G., & Smales, L. A. (2020). Hedging geopolitical risk with precious metals. Journal of Banking & Finance, 117, 105823. [Google Scholar] [CrossRef] [Scilit]
- Beirne, J., & Gieck, J. (2014). Interdependence and contagion in global asset markets. Review of International Economics, 22(4), 639–659. [Google Scholar] [CrossRef] [Scilit]
- Boako, G., & Alagidede, P. (2017). Co-movement of Africa’s equity markets: Regional and global analysis in the frequency–time domains. Physica A: Statistical Mechanics and Its Applications, 468, 359–380. [Google Scholar] [CrossRef] [Scilit]
- Bodie, Z., Kane, A., & Marcus, A. (2019). Essentials of investments (11th ed.). McGraw Hill. [Google Scholar]
- Bollerslev, T. (1986). Generalized autoregressive conditional heteroskedasticity. Journal of Econometrics, 31(3), 307–327. [Google Scholar] [CrossRef] [Scilit]
- Bouri, E., Shahzad, S. J. H., Roubaud, D., Kristoufek, L., & Lucey, B. (2020). Bitcoin, gold, and commodities as safe havens for stocks: New insight through wavelet analysis. The Quarterly Review of Economics and Finance, 77, 156–164. [Google Scholar] [CrossRef] [Scilit]
- Caldara, D., & Iacoviello, M. (2022). Measuring geopolitical risk. American Economic Review, 112(4), 1194–1225. [Google Scholar] [CrossRef] [Scilit]
- Campbell, J. Y., Pflueger, C., & Viceira, L. M. (2020). Macroeconomic drivers of bond and equity risks. Journal of Political Economy, 128(8), 3148–3185. [Google Scholar] [CrossRef] [Scilit]
- Cappiello, L., Engle, R. F., & Sheppard, K. (2006). Asymmetric dynamics in the correlations of global equity and bond returns. Journal of Financial Econometrics, 4(4), 537–572. [Google Scholar] [CrossRef] [Scilit]
- Carney, R. W., El Ghoul, S., Guedhami, O., & Wang, H. (2024). Geopolitical risk and the cost of capital in emerging economies. Emerging Markets Review, 61, 101149. [Google Scholar] [CrossRef] [Scilit]
- CFI Teams. (2023). Financial markets. Corporate Finance Institute. Available online: https://corporatefinanceinstitute.com/resources/career-map/sell-side/capital-markets/financial-markets/ (accessed on 25 April 2025).
- Chen, J. (2015). Bayesian estimation of multivariate conditional correlation GARCH models and their application [Master’s thesis, University of Helsinki]. [Google Scholar]
- Chen, P. (2018). Understanding international stock market comovements: A comparison of developed and emerging markets. International Review of Economics & Finance, 56, 451–464. [Google Scholar] [CrossRef] [Scilit]
- Dlamini, C. S. (2017). The relationship between macroeconomic indicators and stock returns: Evidence from the JSE sectoral indices [Unpublished Master’s dissertation, University of the Witwatersrand, South Africa]. [Google Scholar]
- Dong, F., & Wen, Y. (2023). Flight to safety or liquidity? Dissecting liquidity shortages in the financial crisis. Journal of Money, Credit and Banking, 57(5), 1299–1334. [Google Scholar] [CrossRef] [Scilit]
- Elbannan, M. A. (2015). The capital asset pricing model: An overview of the theory. International Journal of Economics and Finance, 7(1), 216–288. [Google Scholar] [CrossRef] [Scilit]
- Engle, R. (2002). Dynamic conditional correlation: A simple class of multivariate generalized autoregressive conditional heteroskedasticity models. Journal of Business & Economic Statistics, 20(3), 339–350. [Google Scholar] [CrossRef] [Scilit]
- Engle, R. F. (1982). Autoregressive conditional heteroscedasticity with estimates of the variance of United Kingdom inflation. Econometrica: Journal of the Econometric Society, 50(4), 987–1007. [Google Scholar] [CrossRef] [Scilit]
- Fendoglu, S., Suntheim, F., & Qureshi, M. S. (2025). How rising geopolitical risks weigh on asset prices. IMF Blog. Available online: https://www.imf.org/en/Blogs/Articles/2025/04/14/how-rising-geopolitical-risks-weigh-on-asset-prices (accessed on 12 March 2025).
- Gamboa-Estrada, F., & Romero-Chamorro, J. V. (2024). Geopolitical risk and emerging market sovereign risk premia. Banco de la Republica Colombia. [Google Scholar]
- Jarina, V. (2023, August 1). Geopolitical risk and financial markets: Trends, co-movements and effects. Cuni.cz. 94p. Available online: https://dspace.cuni.cz/bitstream/handle/20.500.11956/186182/120458593.pdf?sequence=1&isAllowed=y (accessed on 4 June 2025).
- JSE (Johannesburg Stock Exchange). (2025a). Company overview & history. History | Explore the Legacy of JSE Group. Available online: https://group.jse.co.za/group-overview/history (accessed on 11 April 2025).
- JSE (Johannesburg Stock Exchange). (2025b). Connecting investors to African opportunities. JSE Group | Connecting Investors to African Opportunities. Available online: https://group.jse.co.za/ (accessed on 11 April 2025).
- Katzke, N. (2013). South African sector return correlations: Using DCC and ADCC multivariate GARCH techniques to uncover the underlying dynamics. Working Papers 17/2013. Stellenbosch University. [Google Scholar]
- Kenourgios, D., Samitas, A., & Paltalidis, N. (2011). Financial crises and stock market contagion in a multivariate time-varying asymmetric framework. Journal of International Financial Markets, Institutions and Money, 21(1), 92–106. [Google Scholar] [CrossRef] [Scilit]
- Kilian, L. (2006). New introduction to multiple time series analysis, by Helmut Lütkepohl, Springer, 2005. Econometric Theory, 22(5), 961–967. [Google Scholar] [CrossRef] [Scilit]
- Krishnan, C. N. V., Petkova, R., & Ritchken, P. (2009). Correlation risk. Journal of Empirical Finance, 16(3), 353–367. [Google Scholar] [CrossRef] [Scilit]
- Kwiatkowski, D., Phillips, P. C. B., Schmidt, P., & Shin, Y. (1992). Testing the null hypothesis of stationarity against the alternative of a unit root. Journal of Econometrics, 54(1–3), 159–178. [Google Scholar] [CrossRef] [Scilit]
- Lai, F., Li, S., Lv, L., & Zhu, S. (2023). Do global geopolitical risks affect connectedness of global stock market contagion network? Evidence from quantile-on-quantile regression. Frontiers in Physics, 11, 1124092. [Google Scholar] [CrossRef] [Scilit]
- Lamine, A., & Zribi, S. (2024). Do geopolitical risks affect stock market returns and volatilities: An analysis based on the TVP-VAR model. European Journal of Government and Economics, 13(2), 240–261. [Google Scholar] [CrossRef] [Scilit]
- Li, D., Cerezetti, F., & Cheruvelil, R. (2021). Correlation breakdowns, spread positions, and CCP margin models 1. Available online: https://ssrn.com/abstract=3775828 (accessed on 3 March 2026).
- Lintner, J. (1965). Security prices, risk, and maximal gains from diversification. The Journal of Finance, 20(4), 587–615. [Google Scholar]
- Logue, A. C. (2023). Harry Markowitz and modern portfolio theory. Encyclopedia Britannica Preuzeto sa. Available online: https://www.britannica.com/money/modern-portfolio-theory-explained (accessed on 7 December 2025).
- Loretan, M., & English, W. B. (2000). Evaluating changes in correlations during periods of high market volatility. BIS Quarterly Review, 2(1), 29–36. [Google Scholar]
- Lütkepohl, H. (2005). Stable vector autoregressive processes. In New introduction to multiple time series analysis (pp. 13–68). Springer Berlin Heidelberg. [Google Scholar]
- Markowitz, H. (1952). Portfolio selection. The Journal of Finance, 7(1), 77–91. [Google Scholar] [PubMed]
- Medhioub, I. (2025). Impact of geopolitical risks on herding behavior in some MENA stock markets. Journal of Risk and Financial Management, 18(2), 85. [Google Scholar] [CrossRef] [Scilit]
- Mercier, M.-F. (2024). The importance of geopolitics. Occasional bulletin of economic notes series. OBEN24/01. Available online: https://www.resbank.co.za/en/home/publications/publication-detail-pages/occasional-bulletin-of-economic-notes/2024/the-importance-of-geopolitics (accessed on 27 November 2025).
- Mloyi, K., & Vengesai, E. (2024). The impact of global risk aversion and domestic macroeconomic factors on the dynamic conditional correlations of South African financial markets. Cogent Economics & Finance, 12(1), 2431543. [Google Scholar] [CrossRef] [Scilit]
- Moodley, F., Ferreira-Schenk, S., & Matlhaku, K. (2024). Time–frequency co-movement of South African asset markets: Evidence from an MGARCH-ADCC wavelet analysis. Journal of Risk and Financial Management, 17(10), 471. [Google Scholar] [CrossRef] [Scilit]
- Moodley, F., Ferreira-Schenk, S., & Matlhaku, K. (2025). Determinants of South African asset market co-movement: Evidence from investor sentiment and changing market conditions. Risks, 13(1), 14. [Google Scholar] [CrossRef] [Scilit]
- Moodley, F., Nzimande, N., & Muzindutsi, P. F. (2022). Stock returns indices and changing macroeconomic conditions: Evidence from the Johannesburg securities exchange. The Journal of Accounting and Management, 12(3), 127–134. [Google Scholar]
- Mossin, J. (1966). Equilibrium in a capital asset market. Econometrica: Journal of the Econometric Society, 12(1), 768–783. [Google Scholar] [CrossRef] [Scilit]
- Muguto, L. (2022). Analysis of stock return volatility and its response to investor sentiment: An examination of emerging and developed markets [Unpublished Ph.D. dissertation, University of KwaZulu-Natal]. [Google Scholar]
- Muzindutsi, P.-F., Apau, R., Muguto, L., & Muguto, H. T. (2023). The impact of investor sentiment on housing prices and the property stock index volatility in South Africa. Real Estate Management and Valuation, 31(2), 1–17. [Google Scholar] [CrossRef] [Scilit]
- Nasouri, A. (2025). The impact of geopolitical risks on equity markets and financial stress: A comparative analysis of emerging and advanced economies. International Journal of Economics and Business Administration, 13(1), 30–41. [Google Scholar] [CrossRef] [Scilit]
- Nhlapho, R., & Muzindutsi, P. F. (2020). The impact of disaggregated country risk on the South African equity and bond market. International Journal of Economics and Finance Studies, 12(1), 189–203. [Google Scholar] [CrossRef] [Scilit]
- Nhlapho, R. N. (2023). Country risk components and financial asset markets interdependence: Evidence from South Africa [Unpublished Ph.D. dissertation, University of KwaZulu-Natal]. [Google Scholar]
- Nkomo, T., & Moodley, F. (2025). Do geopolitical risk and market conditions drive JSE sector returns? Management and Economics Review, 10(2), 324–341. [Google Scholar] [CrossRef] [Scilit]
- Ocran, M. K., & Mlambo, C. (2009). Excess co-movement in asset prices: The case of South Africa. Studies in Economics and Econometrics, 33(1), 25–39. [Google Scholar] [CrossRef] [Scilit]
- Otaify, M. (2016). Egyptian stock exchange: Analysis of performance & activity. Available online: https://ssrn.com/abstract=3599555 (accessed on 3 March 2026).
- Page, E. S. (1961). Cumulative sum charts. Technometrics, 3(1), 1–9. [Google Scholar] [CrossRef]
- Panazan, O., & Gheorghe, C. (2024). Impact of Geopolitical risk on G7 financial markets: A comparative wavelet analysis between 2014 and 2022. Mathematics, 12(3), 370. [Google Scholar] [CrossRef] [Scilit]
- Papathanasiou, S., & Koutsokostas, D. (2026). Geopolitical risk and the aerospace & defense sector: Implications for risk management and portfolio optimization. Defence and Peace Economics, 1–34. [Google Scholar] [CrossRef] [Scilit]
- Pesaran, M. H., Shin, Y., & Smith, R. J. (2001). Bounds testing approaches to the analysis of level relationships. Journal of Applied Econometrics, 16(3), 289–326. [Google Scholar] [CrossRef] [Scilit]
- Pesaran, M. H., Shin, Y., & Smith, R. P. (1999). Pooled mean group estimation of dynamic heterogeneous panels. Journal of the American statistical Association, 94(446), 621–634. [Google Scholar] [CrossRef]
- Qabhobho, T., Mishi, S., Kleynhans, E. P., Vengesai, E., & Mtimka, O. (2024). External shocks’ effects on the co-movements of currency and stock returns in three Southern African development community states. South African Journal of Economic and Management Sciences, 27(1), 5103. [Google Scholar] [CrossRef] [Scilit]
- Rajwani, S., & Kumar, D. (2016). Asymmetric dynamic conditional correlation approach to financial contagion: A study of Asian markets. Global Business Review, 17(6), 1339–1356. [Google Scholar] [CrossRef] [Scilit]
- Sakemoto, R. (2018). Co-movement between equity and bond markets. International Review of Economics & Finance, 53, 25–38. [Google Scholar] [CrossRef] [Scilit]
- Sharpe, W. F. (1964). Capital asset prices: A theory of market equilibrium under conditions of risk. The Journal of Finance, 19(3), 425–442. [Google Scholar]
- Swart, L., & Lawack-Davids, V. A. (2010). Understanding the South African financial markets: An overview of the regulators [Ph.D. thesis, Nelson Mandela Metropolitan University]. Available online: https://hdl.handle.net/10520/EJC85380 (accessed on 7 April 2025).
- Treynor, J. L. (1961). Market value, time, and risk. Available online: https://ssrn.com/abstract=2600356 (accessed on 3 March 2026).
- Zaremba, A., Cakici, N., Demir, E., & Long, H. (2022). When bad news is good news: Geopolitical risk and the cross-section of emerging market stock returns. Journal of Financial Stability, 58, 100964. [Google Scholar] [CrossRef] [Scilit]
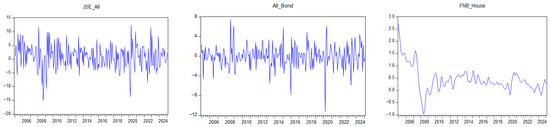
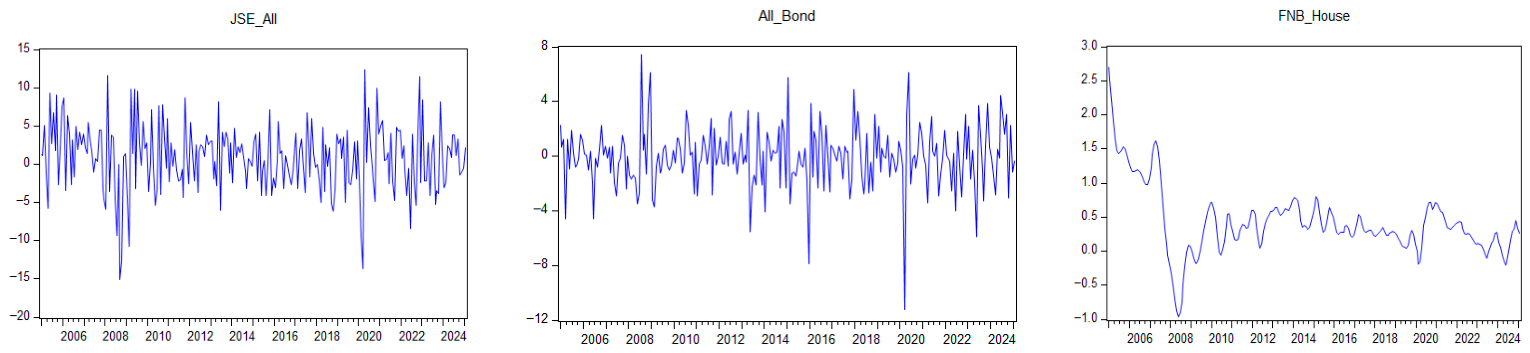
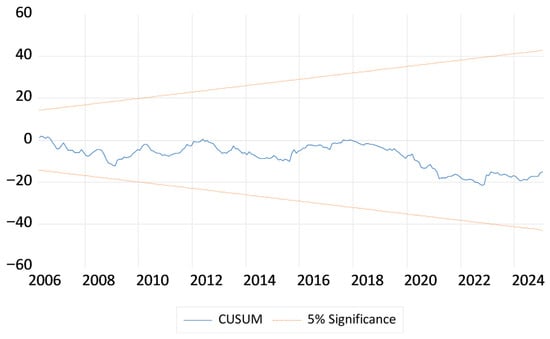
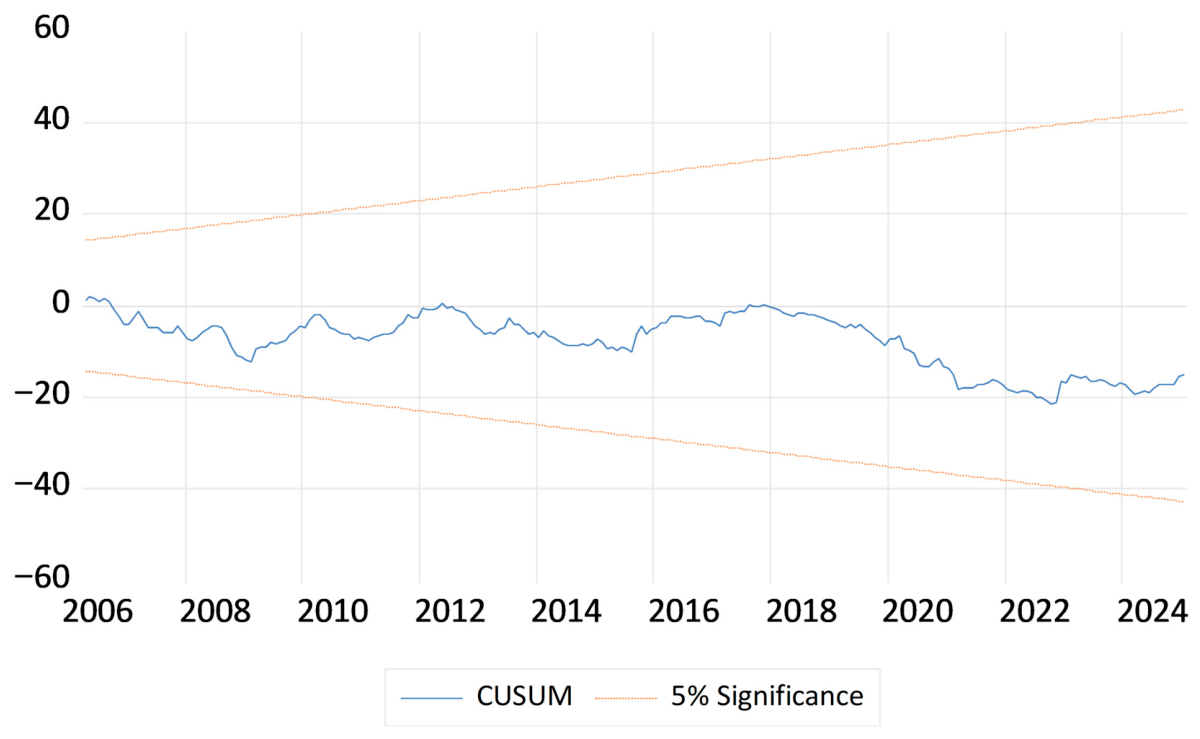
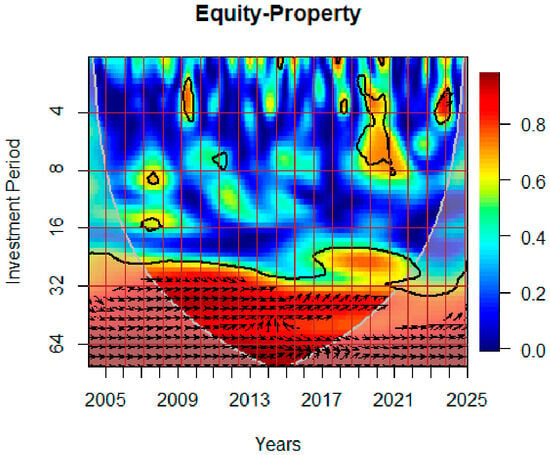
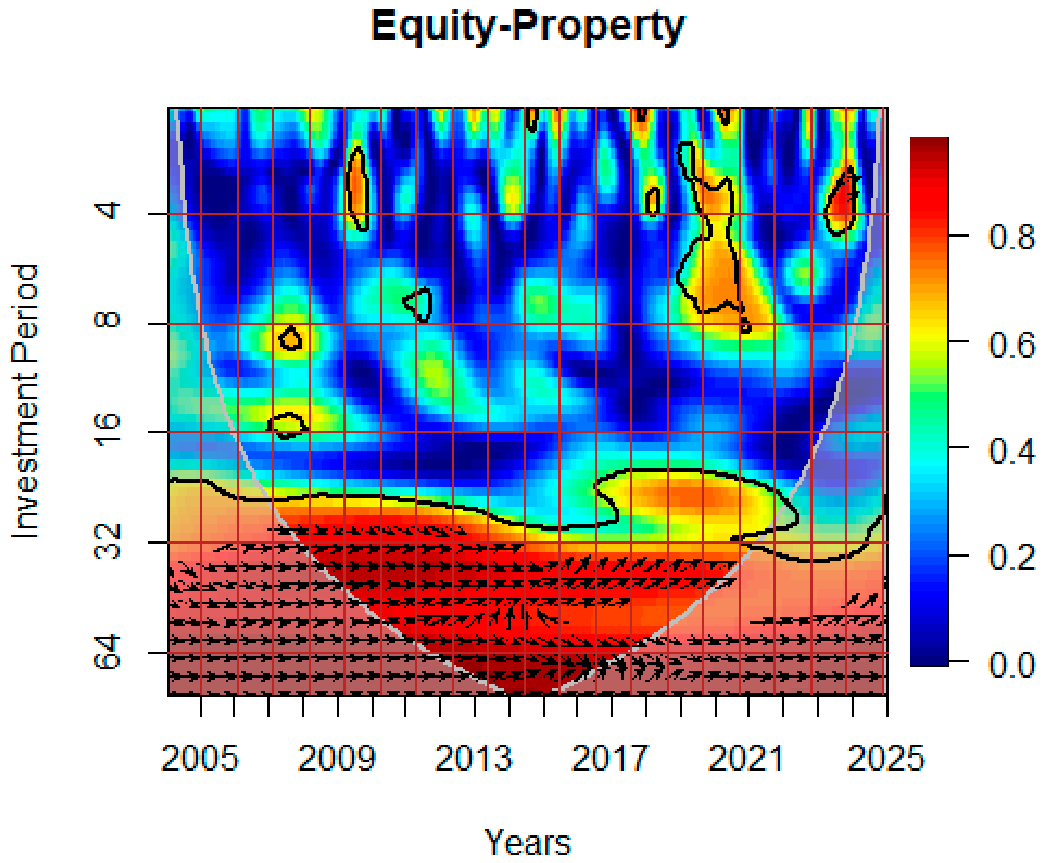

Disclaimer/Publisher’s Note: The statements, opinions and data contained in all publications are solely those of the individual author(s) and contributor(s) and not of MDPI and/or the editor(s). MDPI and/or the editor(s) disclaim responsibility for any injury to people or property resulting from any ideas, methods, instructions or products referred to in the content. |
© 2026 by the authors. Licensee MDPI, Basel, Switzerland. This article is an open access article distributed under the terms and conditions of the Creative Commons Attribution (CC BY) license.