


Abstract
Small penetrator probes have been proposed regularly as low(er) cost landing elements, particularly for network science. This study reviews such a concept with regard to its soil penetration capability with numerical and experimental investigations. A reference micro Mars lander (MML) is considered to deliver a 10 kg payload to the Martian surface. It decelerates the penetrator probe with a mechanical decelerator to 40–60 m/s before impact. The remaining kinetic energy is distributed to the soil and an internal load limiter on impact, which restricts the maximum g-load acting on the payload. A semi-empirical force–displacement law and a discrete element method simulation were used to describe penetration behavior. Major impact force constituents are the velocity-dependent, drag-like displacement of the soil particles and the compaction of soil along the penetration path. Based on the simulation results, a test penetrator was designed and tested by impacting it on different soil conditions with a maximum impact velocity of 10 m/s. Cohesive Mars soil simulant, non-cohesive quartz sand, and stones of various sizes were used to assess different impact conditions. The comparison of test and simulation data identifies their respective capabilities and limitations. Recommendations for use and findings for further research are deduced therefrom.
1. Introduction
Mars penetrator probes have often been studied and developed with varying readiness levels. Only two have actually been realized and flown. During the 1990s, the U.S. American Deep Space 2 mission (DS2) [1] and the Russian Mars 96 mission [2] tried to land on Mars with penetrators, but both failed [3,4]. DS2 could not establish communication with the lander after impact [3], while Mars 96 failed to leave Earth due to an upper-stage malfunction of the Proton launch vehicle [4]. The development and impact testing of the DS2 probe are described in detail by several publications. Lorenz et al. [5] describe the results of impact tests conducted during the development of the DS2 micro-probe mission. They provide acceleration-data plots from those tests and data tables indicating penetration depth for different soil targets. The DS2 impact velocity is on the order of , significantly larger than the landing velocity of the studied microlander. Lorenz et al. [6] also highlight less-studied effects of the impact on the target soil material, including mechanical compaction, comminution, and fracturing.
Another actual mission with a penetrator experiment was NASA’s InSight mission with the Heat Flow and Physical Properties Package (HP3), described by Spohn et al. [7]. The HP3 instrument consisted of an actuated, percussively penetrating element, the mole, using an internal hammering mechanism, yielding a step-wise penetration with a penetration rate in the order of a few centimeters per minute. It was intended to carry thermal sensors along its tether to a depth of to . The penetration dynamics were modeled by Poganski et al. [8] and Lichtenheldt et al. [9] using a discrete element model (DEM) to assess densification and displacement of granular soil around the penetrating body. The type of mission is not directly comparable to the microlander study described in this article, but the simulation methods have similarities. Besides this, the InSight mission provided the most detailed assessment of the upper few meters of the surface layer at this site, which is also relevant for impacting penetrators, as will be discussed later in this manuscript.
The most recent and successfully conducted test involving an impacting probe into a celestial body’s surface was the Double Asteroid Redirection Test [10] in 2022 as part of the Asteroid Impact & Deflection Assessment (AIDA) mission. This mission planned a destructive collision between an asteroid and spacecraft and did not intend to land it on the surface. It is therefore not comparable to the MML study. Nonetheless, the involved impact dynamics were studied by Jutzi and Michel [11]. The associated simulations used a smooth particle hydrodynamics code to model the asteroid’s geotechnical properties. Of particular interest in this simulation was the expected impulse transfer between the asteroid and the spacecraft, with an impact velocity of several kilometers per second.
Other European studies exist, such as the MetNet (Mars Network) study [12]. It is a Finnish study proposing a multi-stage aerobraking lander in combination with a penetrator, with the goal of establishing multiple meteorological-measurement points across the Martian surface. The ESA NetLander study [13] does not use a penetrator, but proposes a network of small probes for various measurements on the Martian surface, to answer questions about the atmosphere and geological structure of the planet. An overview of this history and the future is discussed by Lorenz [14]. The simplicity of such probes, which avoid the need for propulsion and landing GNC (guidance, navigation and control), remains attractive for small and low-cost vehicles to spread network scientific nodes onto the Martian surface or planetary surfaces in general. The role of low-cost landing elements is again recently highlighted in NASA’s Mars exploration program [15]. Hence, different projects exist that are currently working on penetrator projects. In Spain, researchers concentrate on payload deployment for a network of atmospheric sensors [16]. Researchers in China simulated and tested a penetrator similar to the one described here, although for a Lunar application. Luo et al. [17,18] provide the most recent study of a penetrator body carrying a scientific payload with load protection. Penetrator size and impact velocity are comparable to the body investigated in our study, with impact velocities of during tests and 100– for the simulation. Free-fall tests from a crane are described and acceleration data time series are shown. The development of a lunar-soil model for simulation purposes is elaborated. Ahrens et al. [19] describe another mission concept for a penetrator probe in a Lunar exploration context. A Japanese project uses an inflatable decelerator [20].
Different methods describe the penetration behavior generally in terms of forces and displacements. Several models are analytic or semi-empirical, while many have their origin in research on military applications involving ground-penetrating ammunition. The spherical expansion theory (SET) [21] is used to describe the penetration dynamics of projectiles into soil. The works of Luo et al. [18] are based on that theory as are the works of Forrestal et al. [22]. However, SET is meant for velocities beyond ∼ [21] and therefore is unsuitable for this study. Some approaches [23] are unsuitable because they use different target materials or impact velocities. Luo et al. [17] simulate the penetration based on the FEM-smoothed particle hydrodynamics method. Some models [24] are not physics-based but use mathematical functions to approximate experimental data to fit a force–penetration relation. Yosef et al. [25] provide a rigorous overview of different modeling approaches to simulate soil-to-structure interaction under impact loads. The methods are compared with regard to their relative strengths and weaknesses, although not specific to spaceflight applications.
1.1. Design Reference Mission and Penetrator Configuration
The MML employs a mechanical umbrella-like decelerator [26] in combination with a load limiter for the payload. Using this method, sufficient velocity reduction for the highly integrated payload for measuring the atmosphere or the soil can be achieved. The goal is to safely land a payload with maximum impact loads on the payload of around 200–300 g on the Martian surface.
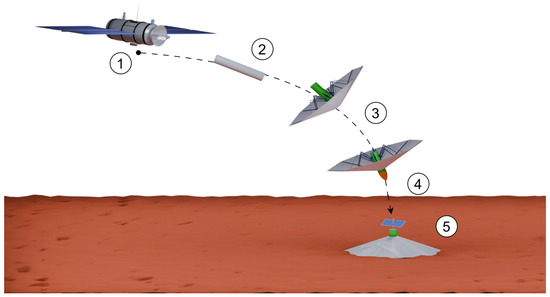
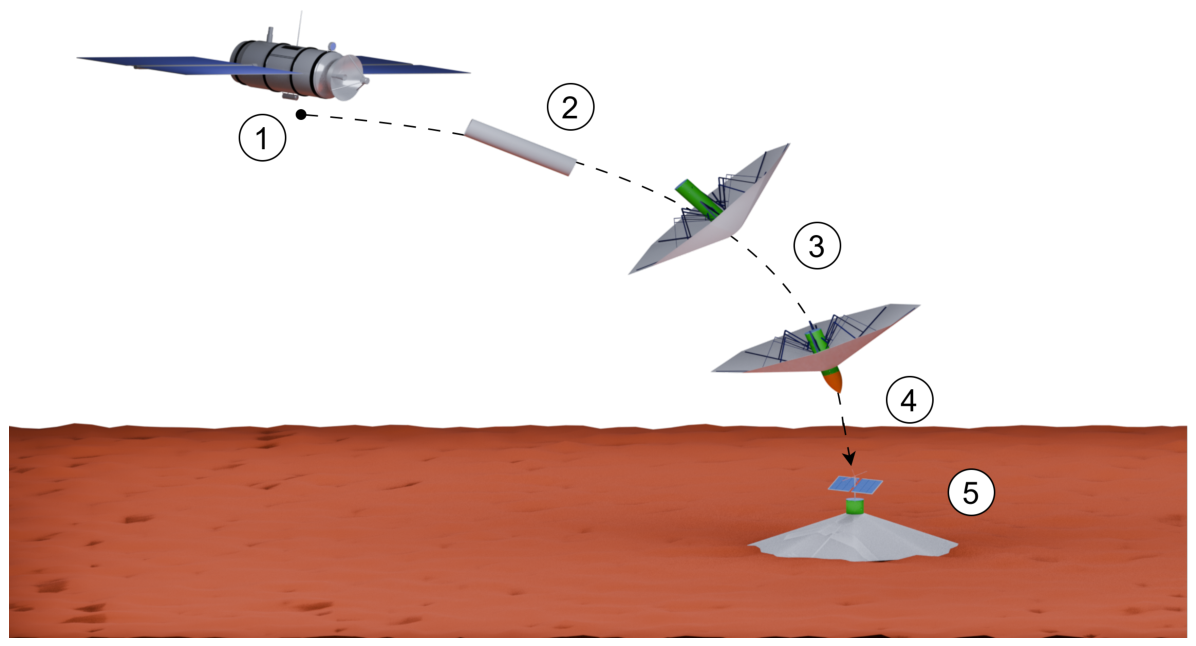
The concept of operation (ConOps) is shown in Figure 1. During the interplanetary transfer to Mars, the lander is separated from the spacecraft (1). The aerodynamic decelerator is deployed before entering the Martian atmosphere for the ballistic descent (2). It has no active flight controls. Before impacting the surface (subsonic configuration), an ablative cap is ejected from the nose of the penetrator. Then the penetrator is deployed for impact (4), which is beneficial for the aerodynamic behavior. While impacting at up to , depending on the mass of the penetrator, the velocity is reduced to zero (5). However, it does not penetrate the surface completely. It is accepted that the primary structure of the lander will take damage, because the payload is protected by the load limiter. This way, the g-load on the payload is predictable and limited. This approach offers reduced complexity for a more robust and reliable landing system compared with historic missions.
Figure 1.
Concept of operations of the micro Mars lander concept.
After impact, communication and power systems can be deployed, enabling scientific measurements for several months (6). If the penetrator penetrates too deeply, the payload cannot operate and communicate as intended. Thus, the correct prediction of the penetration depth in the soil is mission-critical. In this paper the authors want to focus on the impact simulation and tests. The preliminary assumption for the mass budget is total, of which are reserved for the payload. This is based on the mass budget of the Mobile Asteroid Surface Scout (MASCOT) [27]. Trajectory analysis predicts an impact velocity range of .
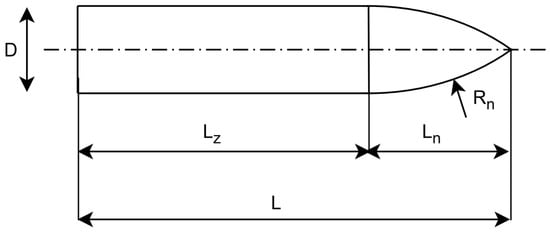
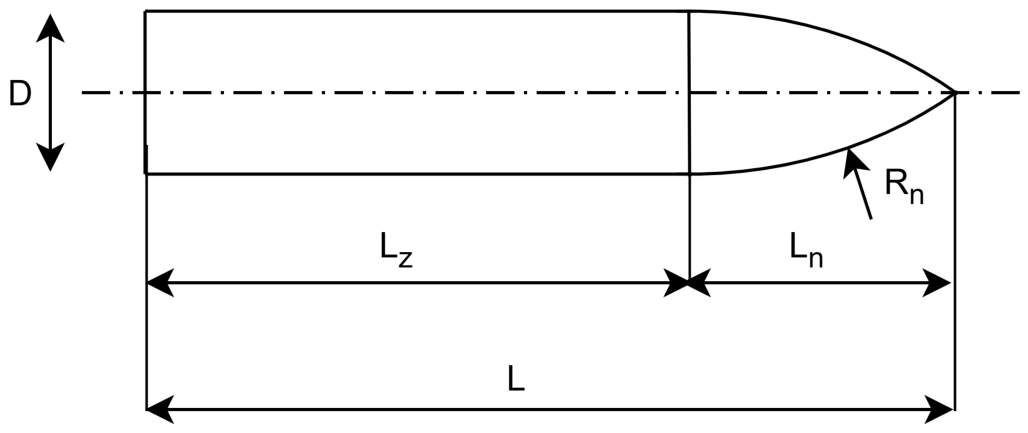
The conceptualized penetrating body features an ogive nose shape (Figure 2) with dimensions given in Table 1. The subscripts n and z denote dimensions referring to the nose and shaft of the penetrator respectively. Size and shape have been identically used in the numerical and experimental investigations.
Figure 2.
Dimensions used to describe the dimensions of the penetrator. The values are shown in Table 1. The nose has the shape of a tangent ogive.
Table 1.
Parameters and their values of the outer dimensions of the penetrator. The assignment of parameters is shown in Figure 2.
The terrain reference considers a landform with wind-deposited sand and regolith, such as that selected for NASA’s InSight mission. For InSight, a penetrable terrain was selected for the mission’s HP3 experiment [28]. The post-mission scientific analysis based on the seismic instrument and HP3 experiment described the near-surface structure of the first meters of depth and provides geotechnical properties potentially suitable for the studied MML impacting penetrator probes. Golombek et al. [29] provide an overview of the landforms around the InSight landing site with its rock-size-frequency distribution. Furthermore, it reconstructs a cross-section of the shallow surface underneath that site, showing an upper layer of approximately depth with fine-grained regolith and embedded rocks. Spohn et al. [28] describe the types of the initial layers and estimate associated soil mechanical properties. Identified parameters are the material’s bulk density, ranging between (duricrust, lower value) and (sand/gravel mixture), cohesionless, sandy material and duricrust with a cohesion range estimated between and at internal friction angles between 30° and 40°. The detailed resolution of those initial layers was achieved by combined analysis of seismic data together with HP3 hammering activity as an active seismic source and is reported by Delage et al. [30].
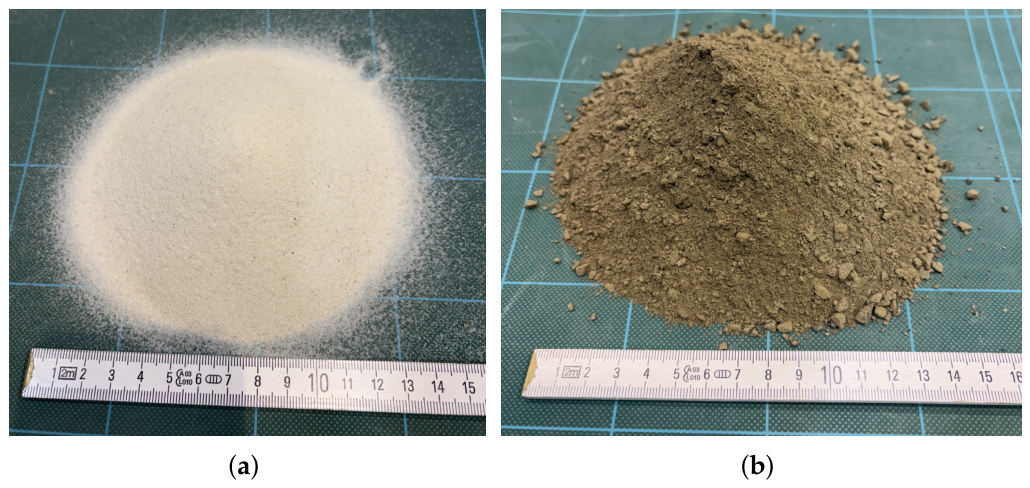
For experimental purposes, two types of sand were used: quartz sand WF 34 and Syar sand, whose properties are shown in Table 2 and Figure 3. WF 34 is a fine quartz sand and is almost cohesionless. It is produced by Quarzwerke GmbH. Syar, named after the company that produced it, is a high-cohesion sand/gravel mixture, produced by crushing basaltic sand and dust from Lake Herman, SD, USA.
Table 2.
Properties of the quartz sand WF 34 and Syar, partially by Wippermann et al. [31]. * all particles equal or less than the stated value contribute 50% (D50) or 10% (D10) of the total weight.
Figure 3.
WF 34 (quartz sand) (a) and Syar (b). The particles of the Syar sand are heterogeneous and compressible, while the quartz sand is homogeneous. It does not deform easily under pressure.
These two materials were originally selected for HP3-testing to represent the expected range of soil mechanical properties at the InSight landing site. They cover a relevant range of the actual InSight site soil properties, except the very high duricrust cohesion. The sands WF 34 and Syar are still available in sufficient quantities for impact testing. Mars Mojave Simulant (MMS; <2 mm fraction) was used as a third reference during HP3 development. Its properties balance the targeted geotechnical environment and are therefore considered as the best representation or compromise to study impactor dynamics under Martian conditions.
These materials have been well documented in the frame of the HP3 development [31]. Table 2 re-states the important properties in the context of this study. Additional data on the MMS material is given by Peters et al. [32].
1.2. Study Workflow and Objectives
The goal of this study is to better understand the impact dynamics of the penetrator in combination with a payload protected by a load limiter. The penetration dynamics with its motion states shall be represented by time series data and as a surrogate model to become usable as input for further analysis and sizing for the outlined penetrator mission concept.
A discrete element model study has been implemented in parallel with a body shape as shown in Figure 2 and with parameters from Table 1. The input parameters, impact conditions, and the simulation results are given in Section 2. This method is computationally expensive but provides deep insight into the interaction between the granular media and the penetrating body.
A simplified single-degree-of-freedom (DOF) model that is mechanically equivalent and physics-based has been adapted. Its differential equation integrates the main contributors to the force–displacement relation, which are the impact-velocity-dependent displacement of soil, causing a drag-like force, and the increasing compaction of the soil underneath the penetrating body. This model is described in Section 2.2. This model is computationally comparatively easy and usable in conjunction with descent- and landing-trajectory calculations and associated Monte-Carlo analysis, which is not part of this study.
The high-fidelity DEM simulation data is used to identify the parameters of the surrogate model. The procedure, data correlation and limits of applicability of the surrogate model are given in Section 2.1.
A test penetrator was designed for the Earth laboratory environment, using cohesive and non-cohesive soil. Additionally, the tests provided data on how the penetrator behaves in case stones of various sizes are located on the impact site. The test set-up and test data are given in Section 3.
Test data is used to qualitatively check and benchmark (in Section 4) the numerical data and to identify soil–structure interactions and “real world” phenomena beyond the predictability of the numerical models. It is regarded as complementary insight into the penetrator’s dynamics.
Section 5 summarizes the findings and discusses the discrepancies and resultant findings for further research and/or model refinements.
2. Modeling and Simulation
2.1. DEM Simulation of the Penetration Dynamics
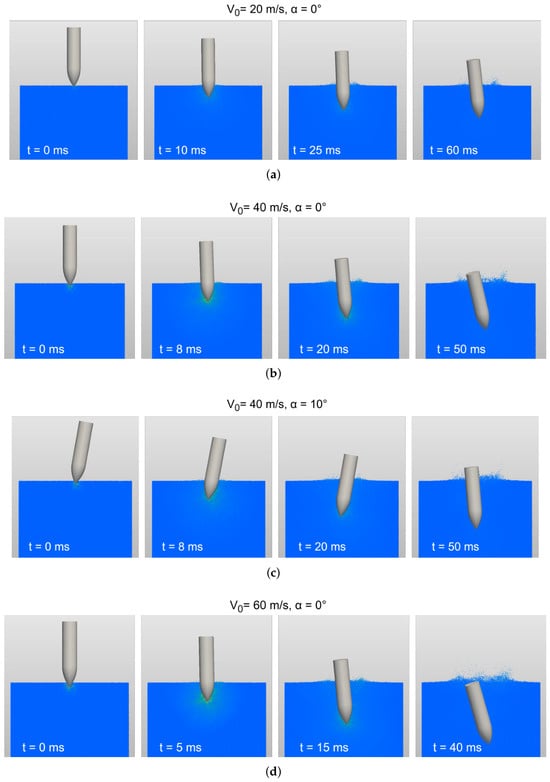
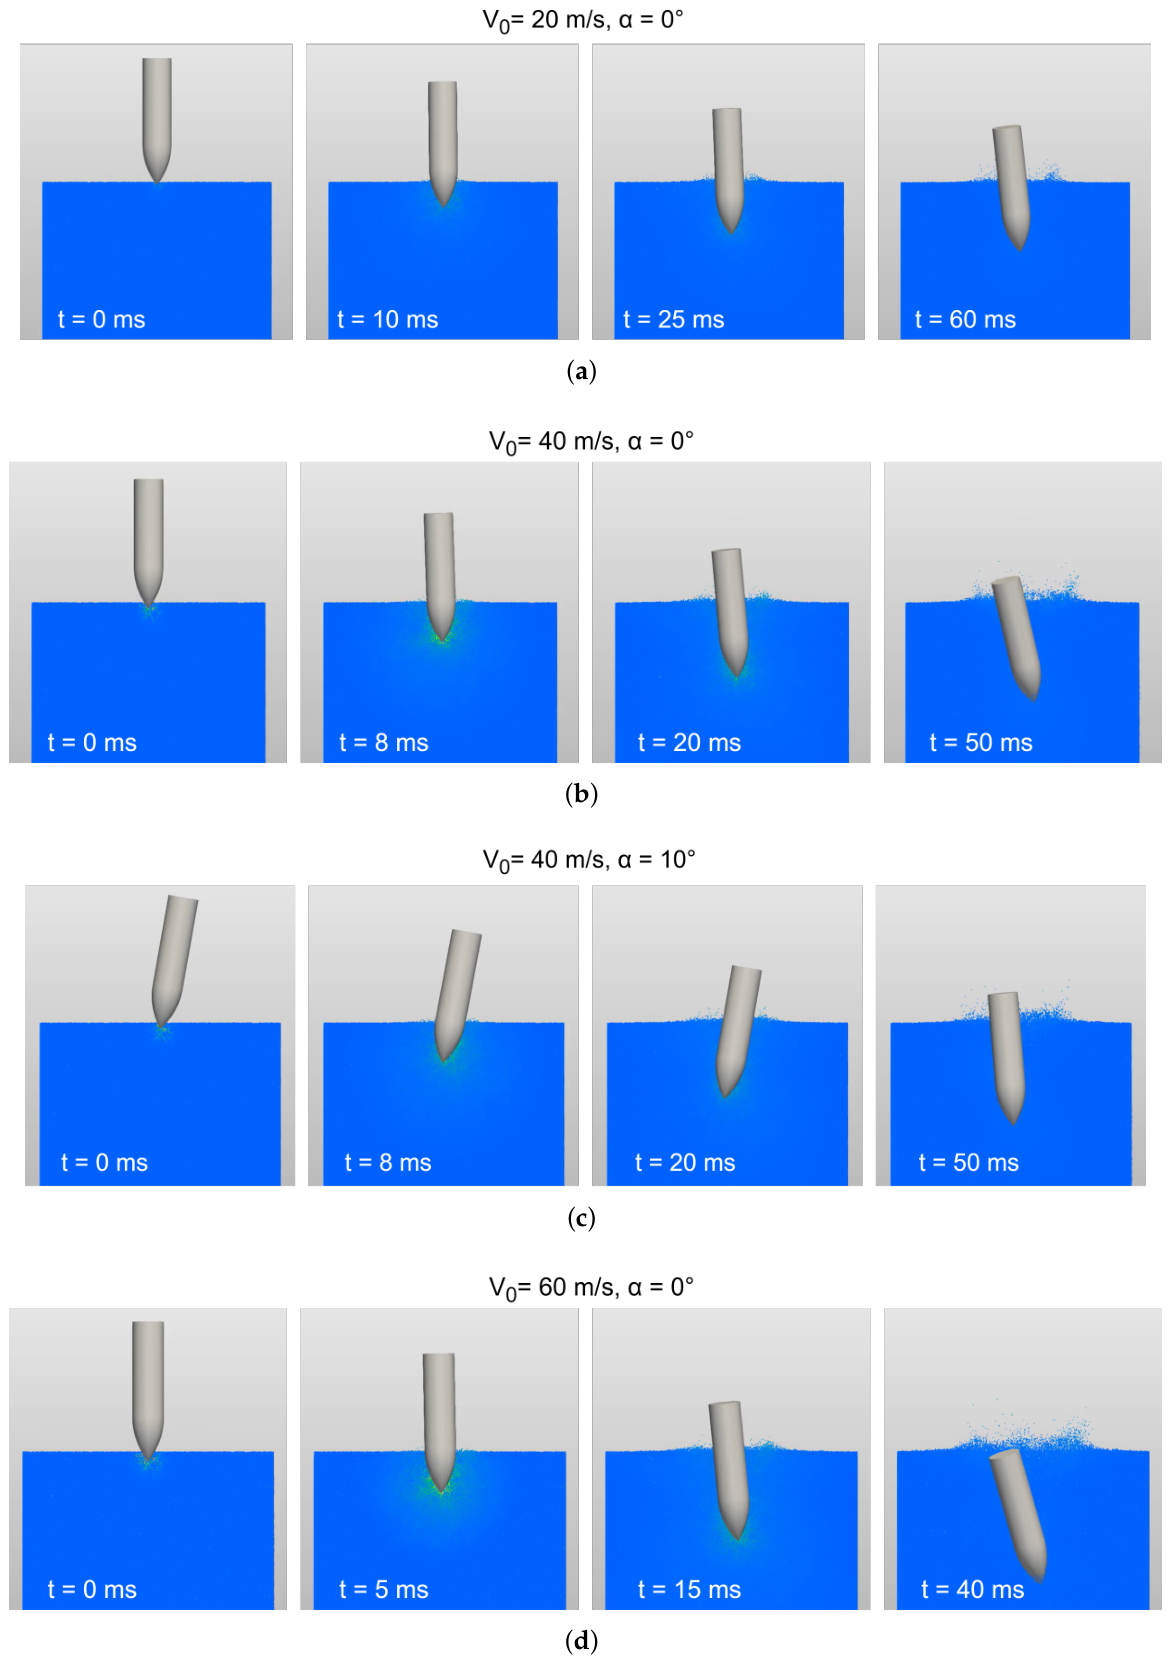
A discrete element method (DEM) simulation was done using LIGGGHTS [33] to estimate the penetration dynamics and to calibrate the simplified 1DOF-model. This simulation examines the dynamics for a penetrator with impact velocities of , , and . The DEM setup simulates 1 million spherical particles with sizes varying between approximately and . The DEM simulation parameters given in Table 3 represent dry, granular Mars soil simulant and are numerically calibrated via a shear cell test to represent Mojave Mars Simulant. The macroscopic parameters are given in Table 3 and refer (closely) to values determined and described in Poganski et al. [8] for a comparable type of Mars soil simulant. The DEM-simulated grain size distribution however does not consider dusty and fine material below ; hence, its void ratio is not representative of the real MMS material. The penetrator dimensions stay the same as shown in Table 1. The penetrator body is considered as a single, rigid body with a mass of . It does not consider an internal, movable payload compartment with energy absorbers. A series of pictures from the simulation for impact velocities of , , and is shown in Figure 4.
Table 3.
Coefficients of the soil used in the discrete element method simulation.
Figure 4.
Frames taken from the animation of the discrete element method impact simulation with (a) = 20 m/s and = 0°; (b) = 40 m/s and = 0°; (b) = 40 m/s and = 0°; (d) = 60 m/s and = 0°.
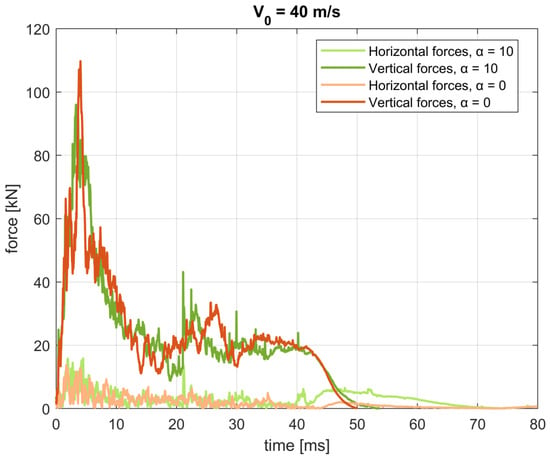
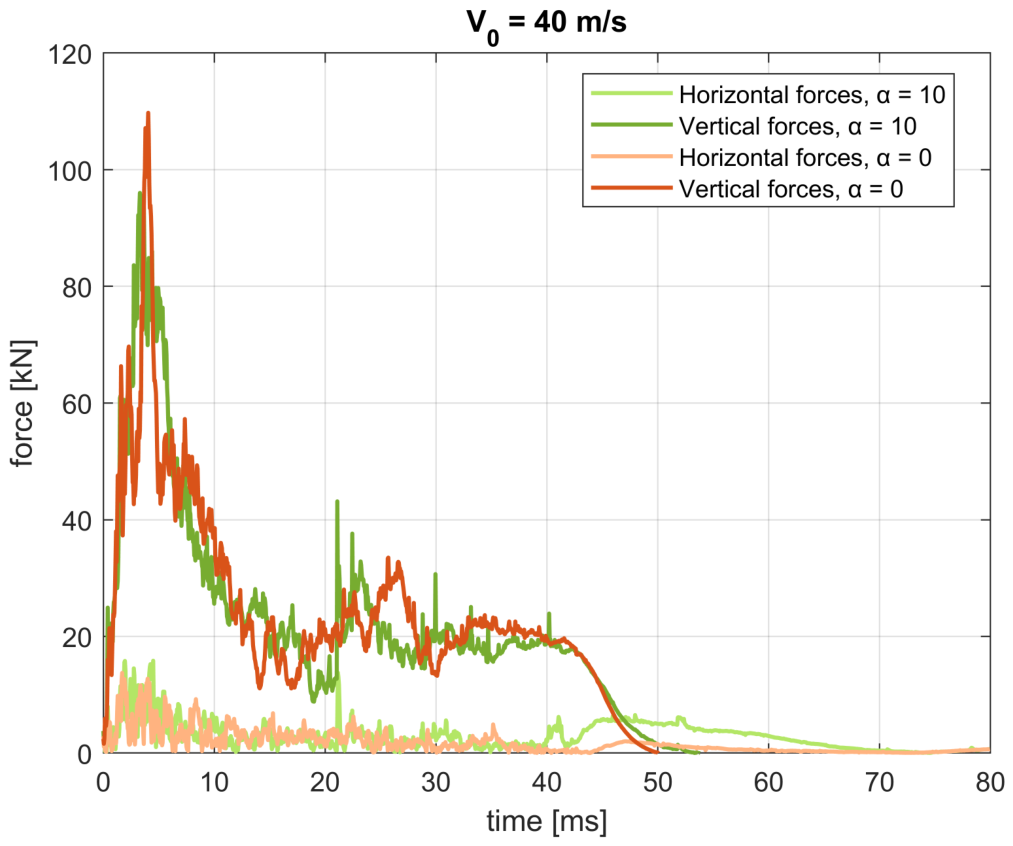
Furthermore, a comparison between the horizontal and vertical forces of the impact cases (b) and (c) from Figure 4 is displayed in Figure 5. The lateral and vertical directions refer to the global axis system. It shows that the horizontal forces are similar for vertical impacts and impacts with a small angle of attack. The angle of attack is defined as the angle between the global vertical direction and the longitudinal axis of the penetrator. Only toward the end of the penetration process are the lateral forces of the oblique impact higher than those of the vertical impact, because the oblique impact forces the penetrator into a vertical position, which exerts lateral forces. The maximum horizontal load was and for and respectively.
Figure 5.
A comparison of the vertical and horizontal force response between an angle of attack of 0° and 10° with = 40 m/s.
2.2. Simplified 1DOF-Numerical Model of the Penetration Dynamics
The soil mechanics of the numerical simulation are described by a modified algorithm originally developed by the Bendix Corporation [34] for computing the blunt footpad-to-soil interaction of a landing system, resulting in a semi-empirical model. This model was adapted and simplified by Witte et al. for use in multi-body vehicle touchdown dynamics and is used here to model the penetrator dynamics outside its original application. This model only considers forces in the vertical direction. Lateral forces act in the horizontal plane, while the vertical direction is perpendicular to the ground surface. As a simplification, it was assumed that the penetrator impacts vertically and that other horizontal forces can be neglected. Different configurations with load-limiters absorbing the load in multiple directions would be possible, but would make the penetrator too complex for the purpose of this project, which aims for a low-cost landing system. Non-vertical impacts were therefore not implemented.
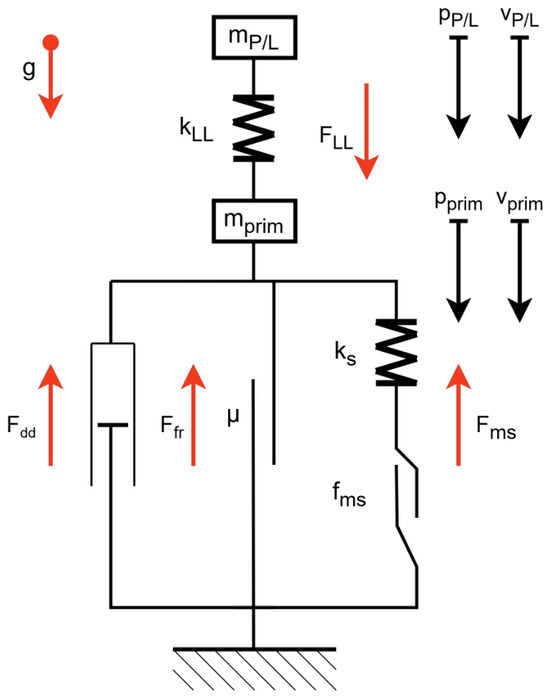
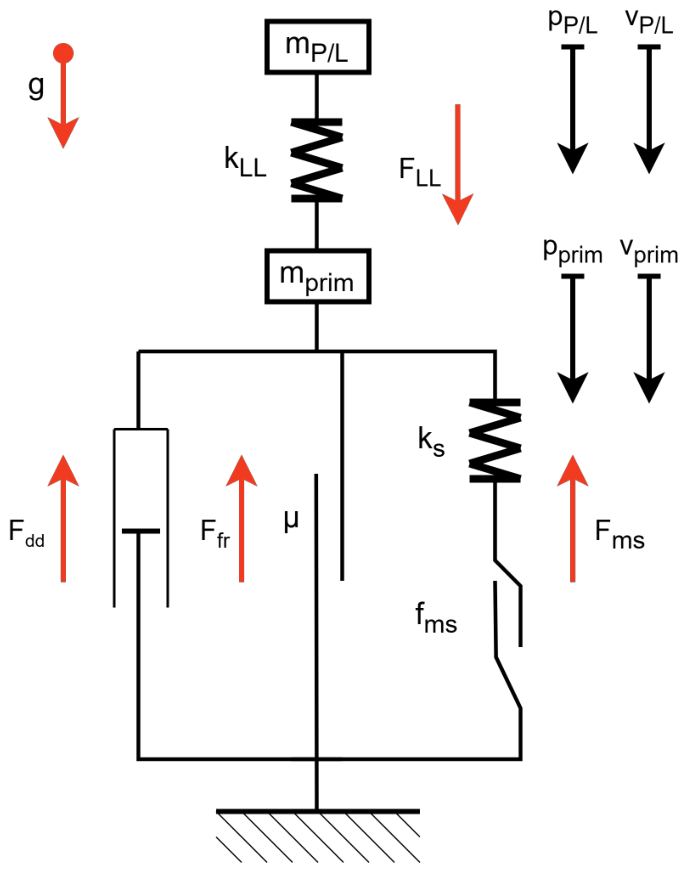
Figure 6 depicts the force model of the numerical simulation. Red arrows describe the forces acting on the primary structure and are identified with the subscript . The subscript identifies variables associated with the payload. It depicts the forces when the penetrator is moving into the soil. The payload moves downwards as well. g is the local gravitational acceleration acting on both of the masses, with for Earth and for Mars. p and v denote the displacement and velocity of the masses respectively.
Figure 6.
Force model of the semi-empirical penetration simulation.
is the bearing capacity of the ground and has two cases:
or
is the stiffness of the plastic soil deformation defined by the velocity , the elastic modulus of the soil , the radius r of the penetrator, and the dimensionless mechanical strength coefficient :
behaves like a unidirectional spring. is the stiffness of the compressed soil and is defined by the Poisson ratio of the soil, and radius r of the penetrator:
Both springs and are serially connected. The cases are caused by the increased bearing capacity when the penetrator compacts the soil, which is shown in Figure 7a. The conditions are listed in Table 4. It results in a sawtooth-like diagram of the mechanical strength relative to the penetration depth. It is computed by integrating , which is itself defined by the product of or with the velocity .
The load limiter behaves like a compressible spring and is described in Figure 7b. First, it compresses elastically (1) under the load of by the deceleration of the payload with the mass and the position . The stiffness during this phase is denoted by . The load limiter deforms permanently by the length of if the force exceeds the force limit . The load force plateaus (2). The elastic part of the load limiter springs back (3) when the movement of the payload and there the force stops. But the plastically deformed share of the limiter remains. If the payload moves again, the limiter behaves elastically as before (4). Thus, the maximum force acting on the payload is defined by the load limiter, but only until the whole load limiter is crushed. The simulation was computed with the ode23 [35] solver of MATLAB 2024a, which is an explicit Runge–Kutta method to solve ordinary differential equations.
Figure 7.
(a) elastic-plastic force law and (b) force–displacement behavior of the load limiter (cases are shown in Table 4). Both are modified schematics by Witte et al. [36].
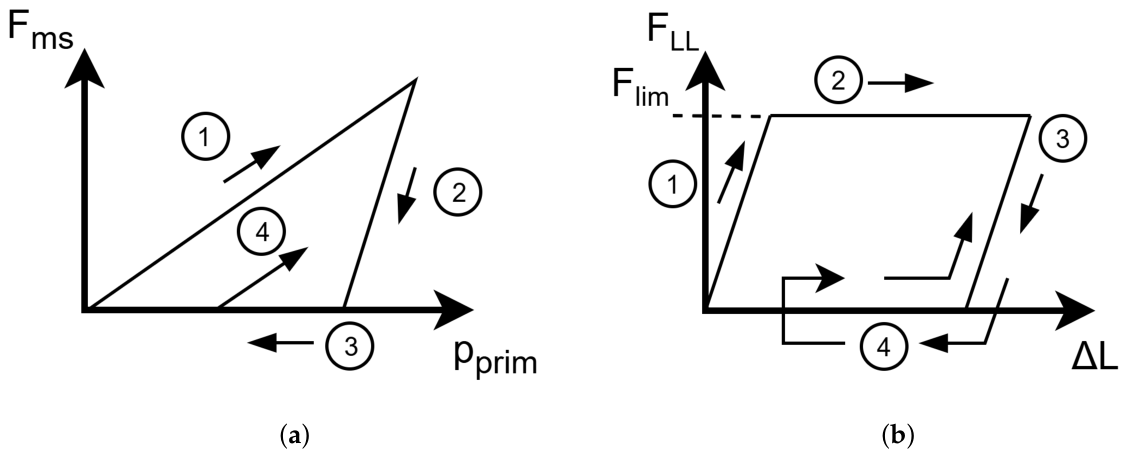
Table 4.
Cases of by Witte et al. [36] applying to the force–displacement behavior in Figure 7a.
2.3. Parameter Identification and Simulation
First, the parameters and are identified for a best fit of the numerical simulations to the DEM simulations regarding the force response and penetration depth. No load limiter nor payload is simulated in either case.
The iteration process to produce the and values for , and can be described as follows:
- and were used as starting values;
- Based on the results of the starting values, is changed to reproduce the peak force values of the DEM data;
- is changed iteratively until it reproduces the height of the plateau after the peak and the fall-off of the plateau compared to the force response;
- Both values were refined to fit the displacement over time curve to the DEM simulation.
This process resulted in the values of and .
The selected soil is regarded as representative of Martian soil for determining and in ongoing studies. It is acknowledged that further soils need to be studied to establish a broader range of parameters. We clarified this in the manuscript in the simulation chapter and highlighted this aspect in the findings/conclusions section.
- Dry, granular soil with cohesion and internal friction angle in the order of the reference MMS-soil simulant material;
- Impact velocity regime between and ;
- Martian gravity;
- Off-normal inclination angle of .
Sources of uncertainty are the relative density of the material and the derivation from calibrated discrete element simulation rather than directly from representative test data.
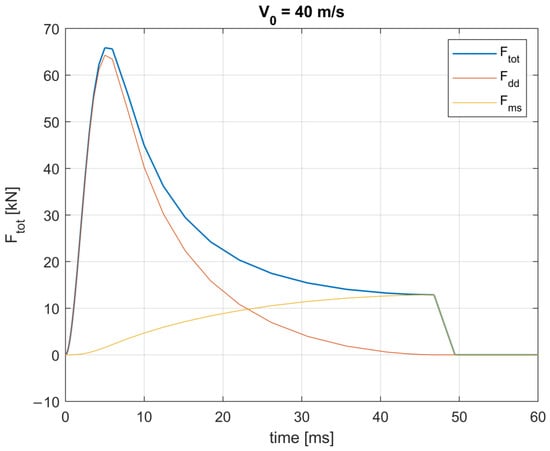
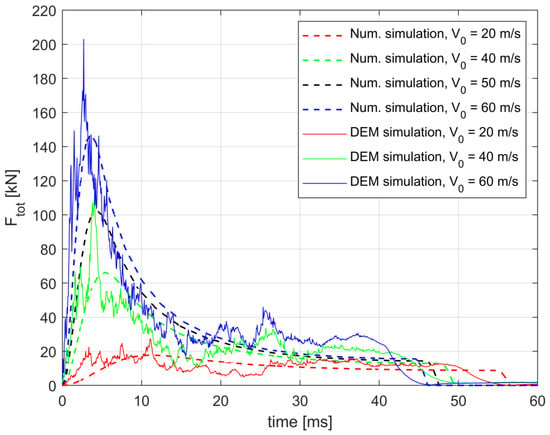
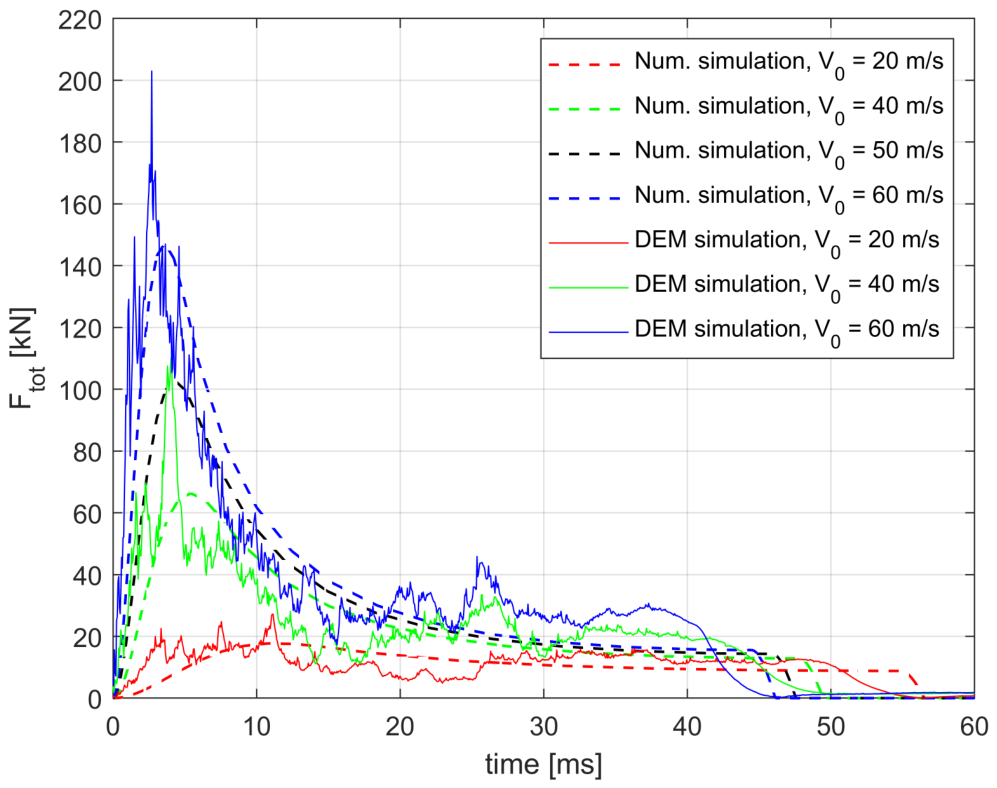
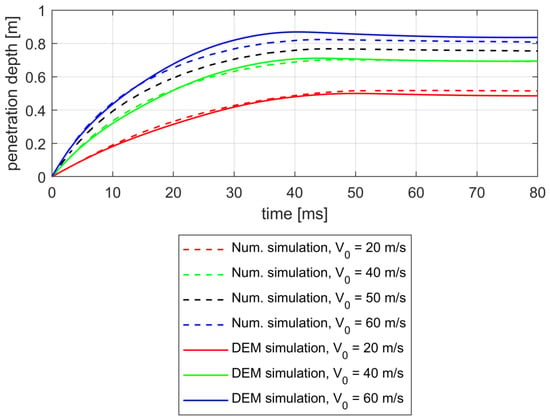
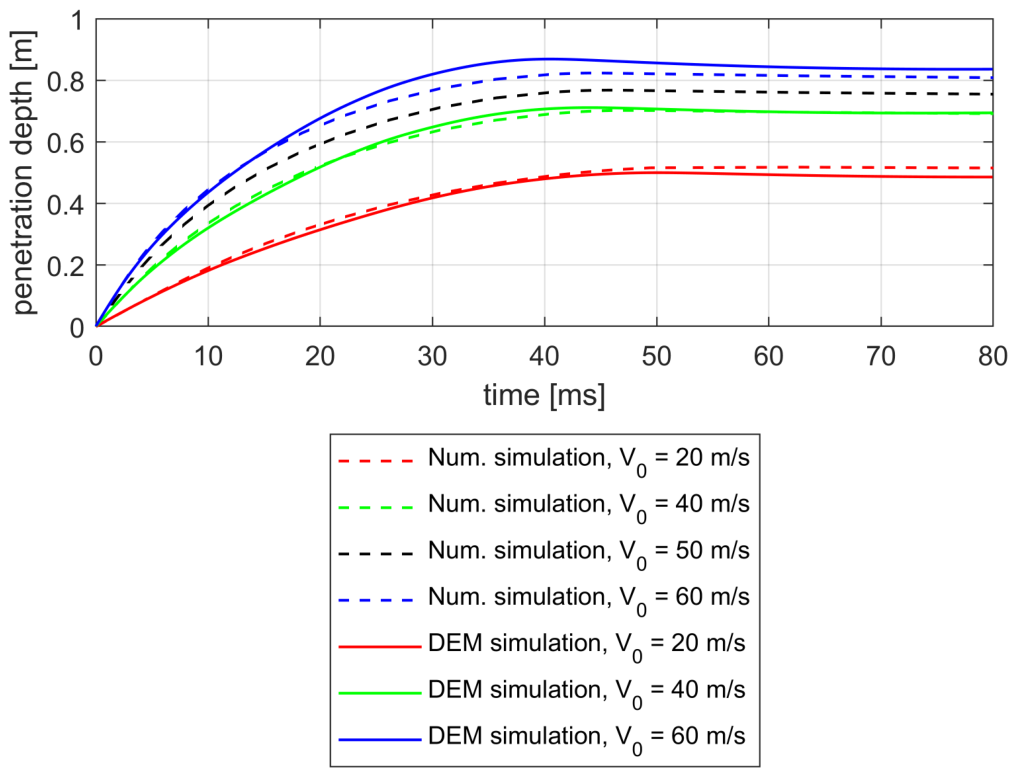
from the numerical simulation can be broken down into the components and as shown in Figure 8 for an impact velocity of with the and values found earlier in this chapter. The numerical simulation is compared with the DEM simulation in Figure 9 and Figure 10.
Figure 8.
Breakup of the total Force into the displacement drag and mechanical strength according to the numerical simulation. The penetrator impacts with a velocity of = 40 m/s.
Figure 9.
The magnitude of the force acting on the penetrator over time during the penetration process by the discrete element method simulation and numerical simulation.
Figure 10.
The displacement of penetrator over time during the penetration process by the discrete element method and numerical simulation.
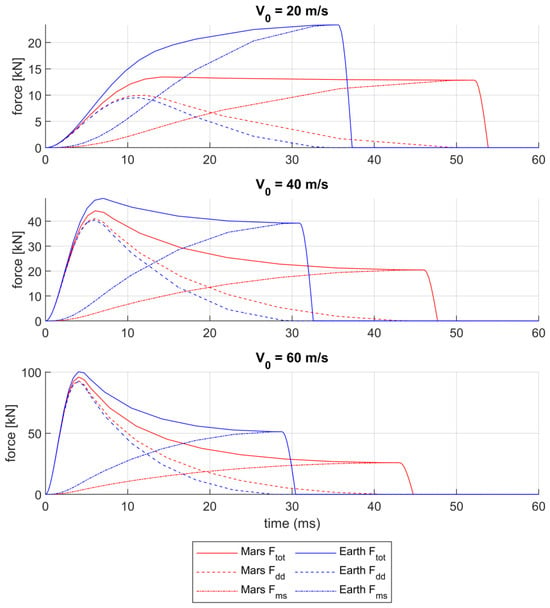
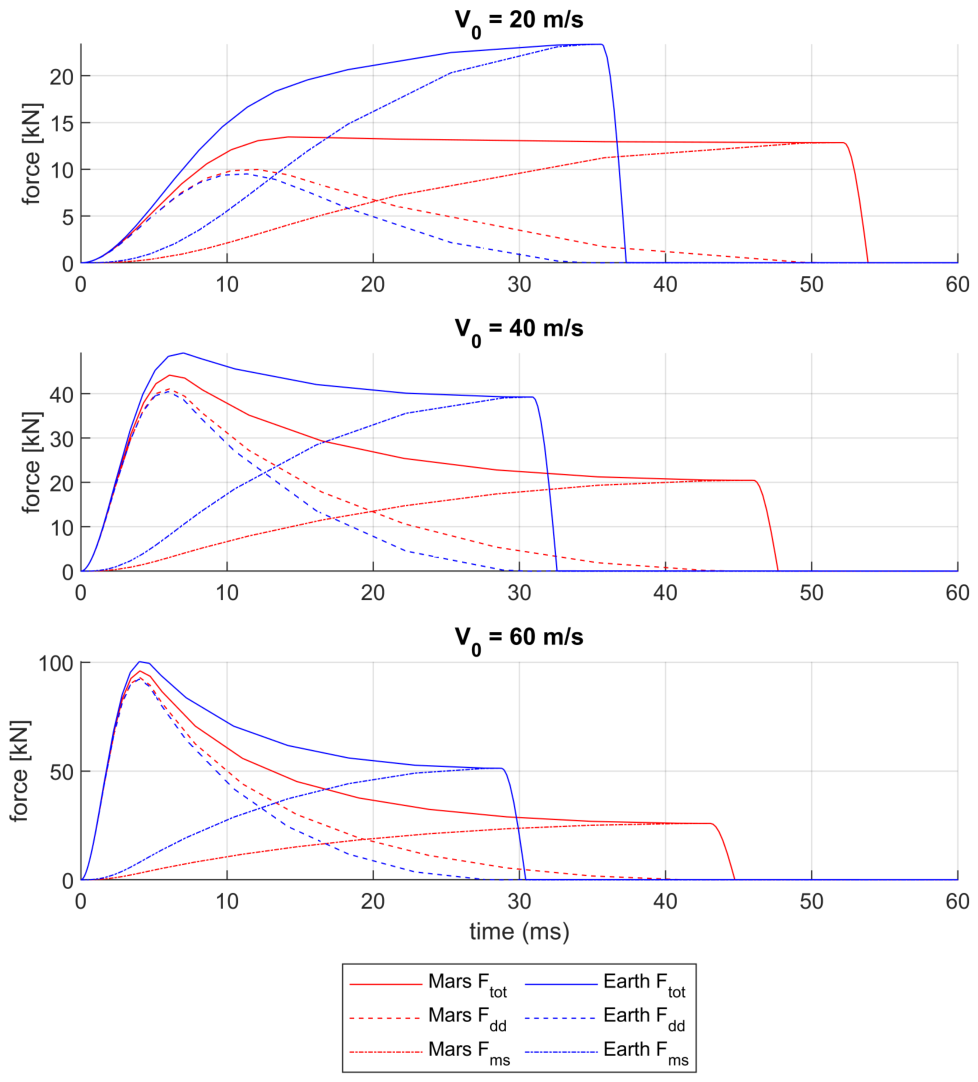
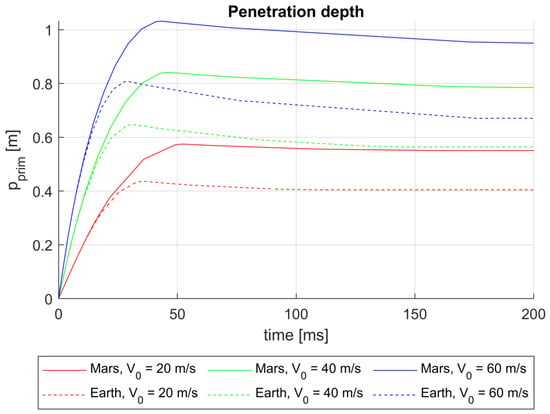
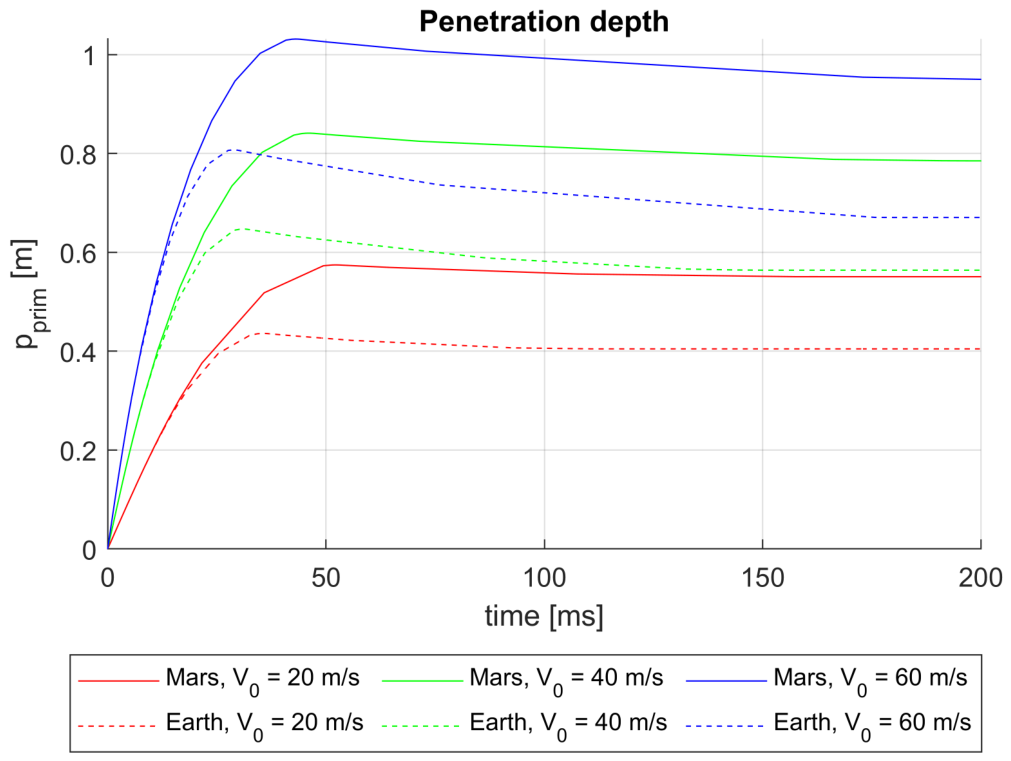
Additionally, the effects of gravity on the penetration dynamics have been investigated. Six impacts were simulated with impact velocities of , , and with Mars and Earth gravity each. Other impact conditions stayed the same as before. The force response is displayed in Figure 11 and the displacement in Figure 12.
Figure 11.
A comparison of the effects of Mars and Earth gravity on , and for impact velocities of 20 m/s, 40 m/s, and 60 m/s.
Figure 12.
A comparison of the effects of Mars and Earth gravity on penetration depth for impact velocities of 20 m/s, 40 m/s, and 60 m/s.
The subplots for and show a similar behavior. First, results in a peak, mainly consisting of the displacement drag, followed by a plateau and a steep drop-off. The peak is caused by the displacement drag acting on the penetrator, which is quadratically dependent on the velocity. The plateau of mainly consists of , caused by the mechanical strength of the ground, which is gravity-dependent as seen in Equation (4). When the velocity is lower, the dispersion drag does not produce a global peak, as seen for . The peak of then corresponds with the peak of . The velocity is not high enough to cause a peak from the dispersion drag.
The effect of gravity can also be observed in the displacement plot. The penetration depth is larger for Mars gravity. This can be explained by the dependency of on gravity (see Equation (4)), leading to a greater penetration. The penetration process from impact to standstill takes longer under Mars gravity.
3. Experimental Investigation
3.1. Test Set-Up
The objective of these tests was to measure the penetration dynamics as a function of the impact velocity (with focus on low velocities of 50 ± 10 m/s), different soil parameters, and rock coverage.
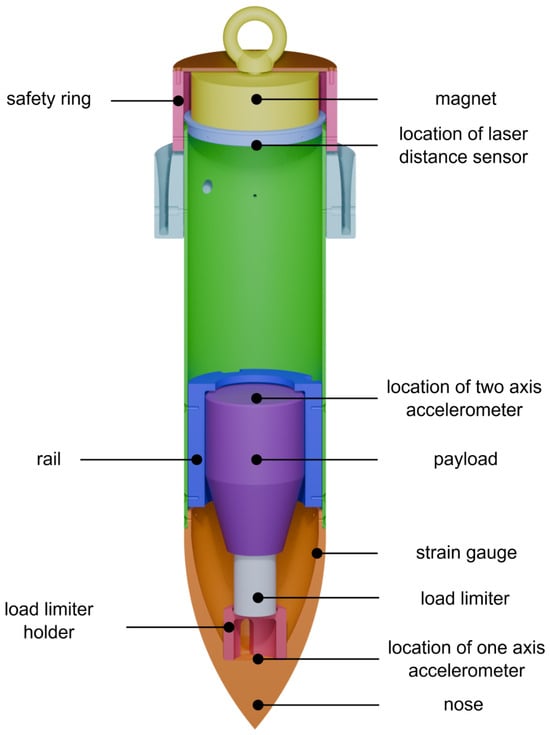
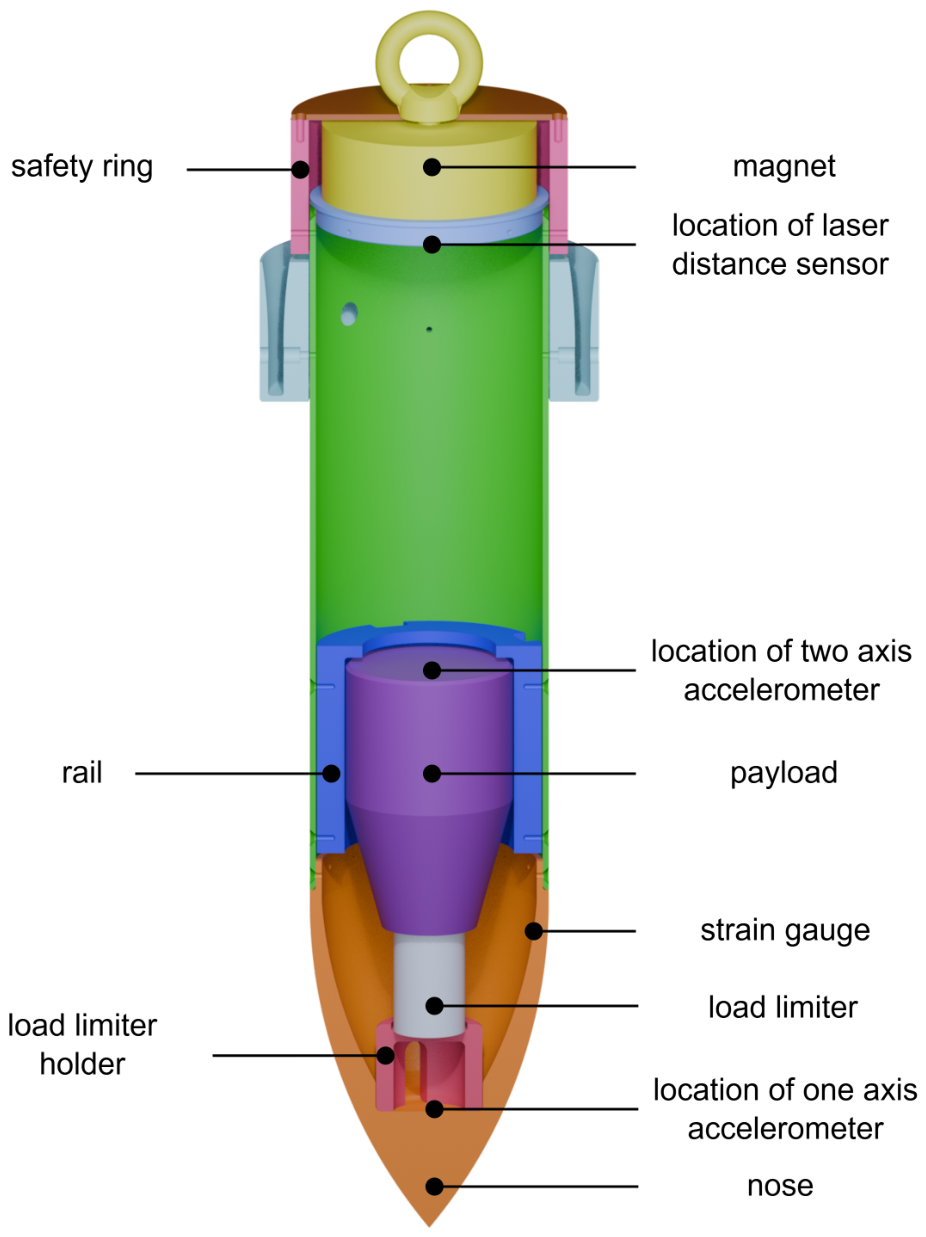
The test penetrator was constructed with the same outer dimensions as in the DEM simulation, as seen in Table 1. A rendering of the CAD model is shown in Figure 13. The structure and payload are heavier than the DEM version to accommodate the laboratory test setup. The primary structure and the payload have a mass of = 33.2 kg and = 22.2 kg, respectively.
Figure 13.
Cross-section view of the test penetrator.
Several sensors are attached to the penetrator. The nose accelerometer is placed inside the penetrator’s nose. A one-axis sensor was chosen because the available space does not allow for a two- or three-axis accelerometer. The load limiter holder is hollow to allow the accelerometer to be placed along its longitudinal axis. The load limiter sits on the holder with a load limit of 6.24 kN or 3.31 kN. Both limiters have a length of 98 mm. The payload sits on the load limiter. A two-axis accelerometer is attached to the payload. It is encased by a plastic railing to guide its position during impact. A guard limits its motion at the top. An aluminum cylinder is attached to the nose. A steel lid is attached to the top end of the penetrator, where an electromagnet can be attached. For safety precautions, removable bolts can provide a form fit between the safety ring and the lid. The penetrator can be dropped by the magnet when the bolts are removed. Below the lid is a laser distance sensor attached. It measures the position of the payload.
Two types of sand were used: quartz sand WF 34 and Syar sand, whose properties are shown in Table 2. WF 34 is a fine quartz sand and is almost cohesionless [31]. It is produced by Quarzwerke GmbH. Syar, named after the company that produced it, is a high-cohesion sand produced by crushing basaltic sand and dust from Lake Herman, South Dakota, USA [31]. Since the actual soil properties on Mars are not exactly known and can vary depending on the actual landing site, different sands were employed to accommodate for different scenarios.
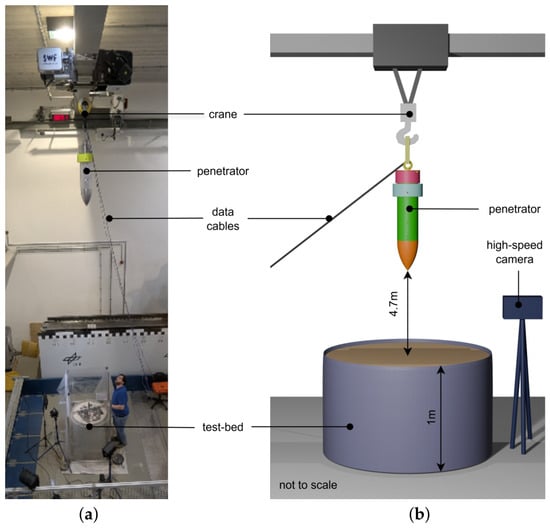
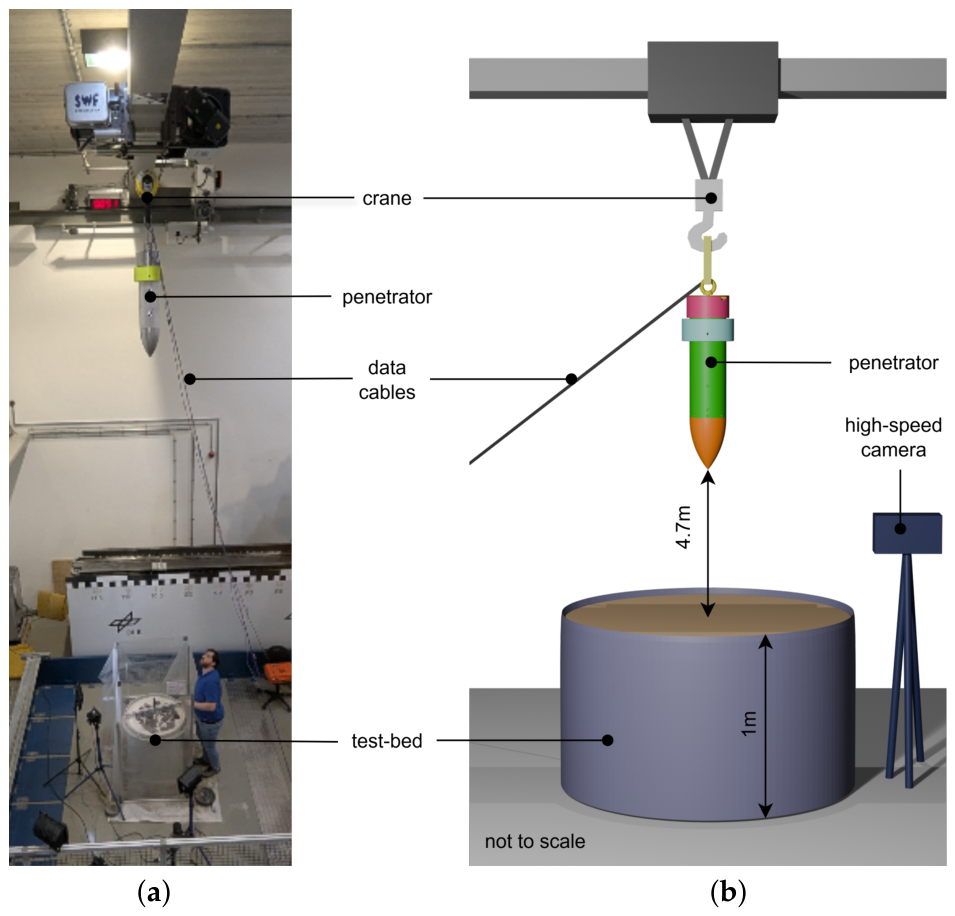
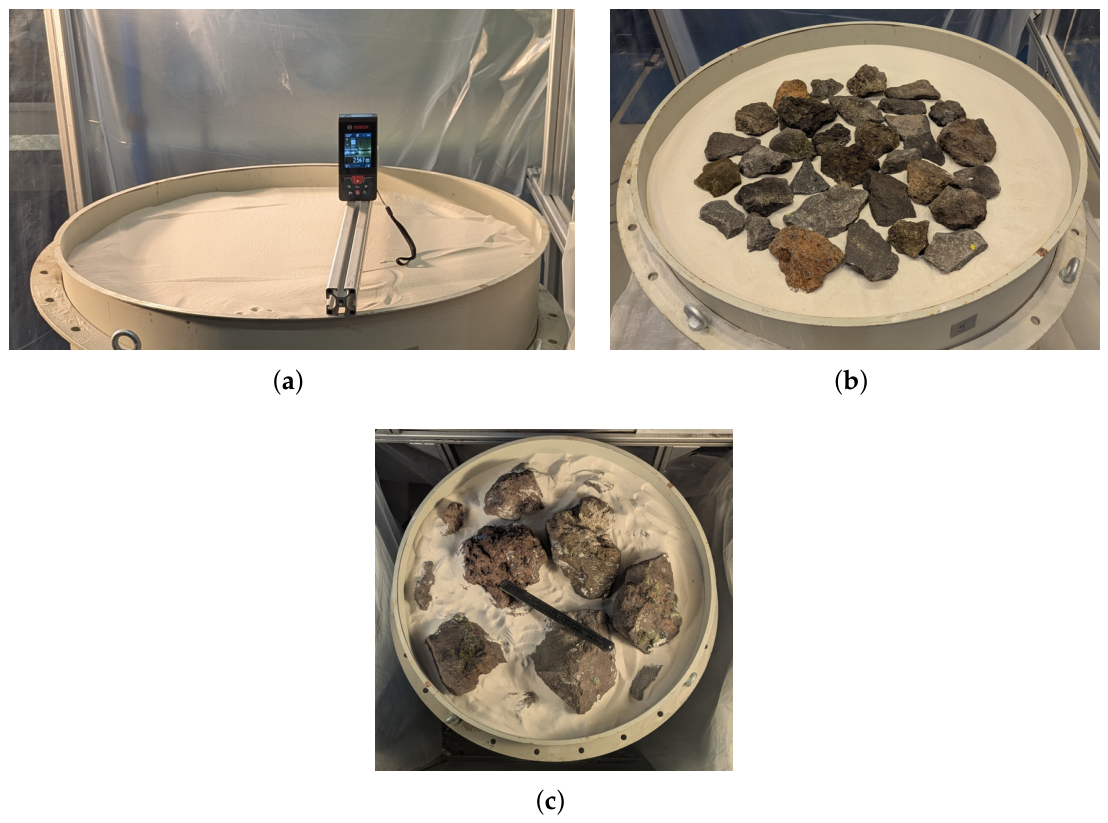
The tests were done in the Landing and Mobility Test Facility (LAMA) of the Institute of Space Systems in Bremen, Germany. The implemented and planned test-setup are shown in Figure 14a and b, respectively. The penetrator is anchored to an overhead crane via an electromagnet. The penetrator then drops from a height of up to 4.7 m on a sand bed. This height refers to the distance between the sand surface and the nose tip. With this drop height, the maximum impact velocity is 9.6 m/s. The sand is contained in a cylindrical container with a diameter of 0.8 m and a depth of 1 m. An overview of the tests can be seen in Table 5.
Figure 14.
Implemented (a) and planned test setup (b).
Table 5.
Summary of test conditions and results.
Before each test the sand bed was raked smoothly. Every drop was recorded by a high-speed camera and a conventional camera. The penetration depth was measured by first measuring the level of the sand bed relative to the container. To determine the penetration depth, the length of the penetrator sticking out of the sand was measured. Since it always settled at an angle, the lowest and highest sides of the top of the penetrator were measured. The average was used to calculate the depth in reference to the pre-drop sand level. During most tests, unless otherwise stated, the sand was removed and then refilled into the container again to prevent the soil from compacting.
The refilling process of the penetration test bed after each test can be described as follows:
- A sand vacuum transports the sand to a temporary container;
- The sand is then transported via the vacuum from the temporary container back to the test bed;
- The next test is done immediately afterward;
- Repeat.
Tests were conducted to address concerns about repeatability regarding the soil compaction and are discussed in Section 3.2.2 and Section 3.2.4. The force response of these tests was highly similar, confirming the repeatability. Further repetitions to investigate statistical deviations were considered outside the scope of this study.
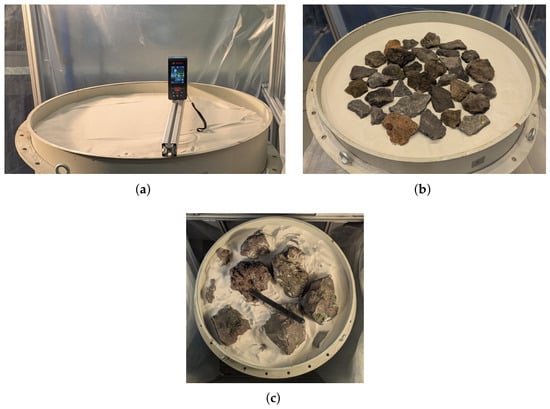
Additionally, tests with stone coverage in the sand were performed as shown in Figure 15b,c. During test #4 a single layer of penetrator-radius-sized stones was used. These stones were loosely laid onto the test bed. During tests #5 and #11, two layers were used with slightly larger stones. One layer was just barely covered by sand, while the upper layer lay loosely on the sand again. This was done to create an even tougher penetration target. For test #13 and #14, stones of a size similar to the penetrator’s diameter were used.
Figure 15.
Test-bed setup variants. (a) WF 34 without any stones and measuring setup for the drop height. (b) WF 34 with a single layer of penetrator-radius stones. (c) Penetrator-diameter-sized stones.
3.2. Test Results
An overview of the test conditions and penetration results is shown in Table 5. More data and information about the particular tests are described in the following chapters. Each test is marked with a hashtag followed by an ID as a unique serial number. Tests #3 and #4 for quartz and tests #7 and #8 for Syar sand have the same test conditions as the repeatability tests described in Section 3.2.2 and Section 3.2.4.
3.2.1. Influence of Impact Velocity on Non-Cohesive Soil
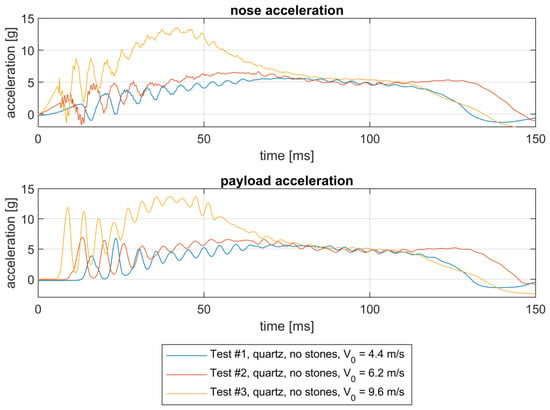
First, tests were performed with impact velocities of ∼ (#1), ∼ (#2), and ∼ (#3) using quartz sand without any stones to assess repeatability of the setup and impact conditions. Tests #1 and #2 performed similarly with maximum loads of around 6 g for both the payload and the nose accelerometer, as seen in Figure 16. Test #3 has a maximum load of 13 g for both sensors. Both accelerometers measure in the vertical direction. Positive g-values indicate a deceleration. All three tests show negative acceleration of the nose sensor, suggesting an acceleration into the ground direction. This seems unreasonable, since no apparent forces could accelerate the penetrator, apart from gravity. This could be explained by the excitation of the structure during impact, inducing vibrations. A similar phenomenon was reported by other researchers [18,24]. It is also possible that the connection of the acceleration sensor to the penetrator was not stable, leading to vibrations. The load limiter was not deformed because the forces acting on it were lower than its crush force.
Figure 16.
Acceleration data of test #1, #2, and #3. Quartz soil without any stones was used.
3.2.2. Repeatability of Tests on Non-Cohesive Soil
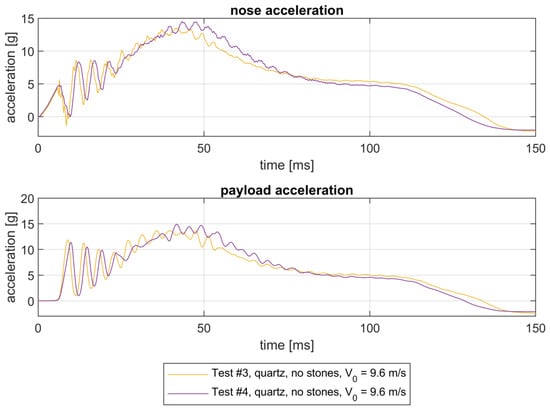
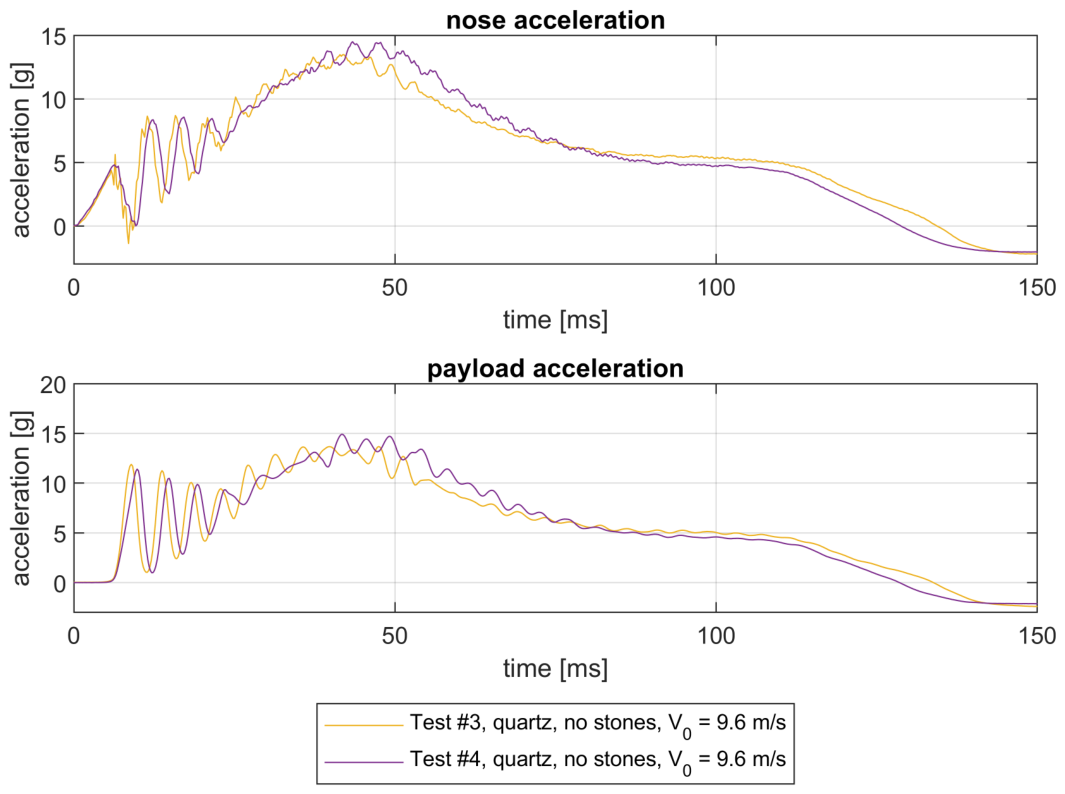
In Figure 17 the acceleration data of the payload and nose for tests #3 and #4 are shown. The penetrator impacted with a velocity of around into the quartz sand. No stones were used. It is clear that the tests performed very similarly. Both have an initial maximum g-load of around 13 g, for both the payload and nose, indicating that the load limit was not reached.
Figure 17.
Acceleration data of tests #3 and #4.
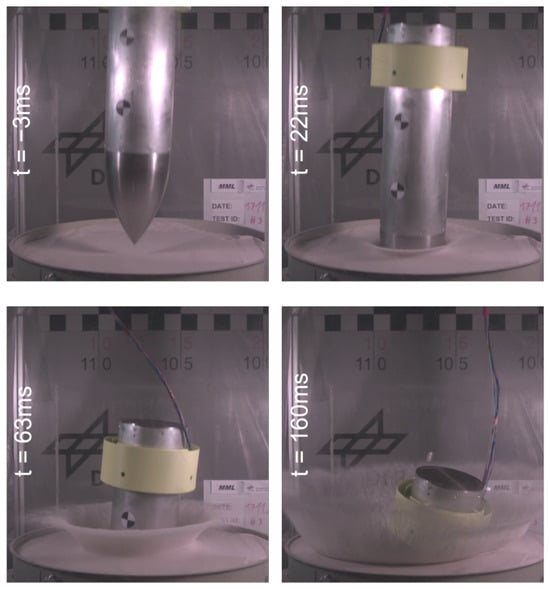
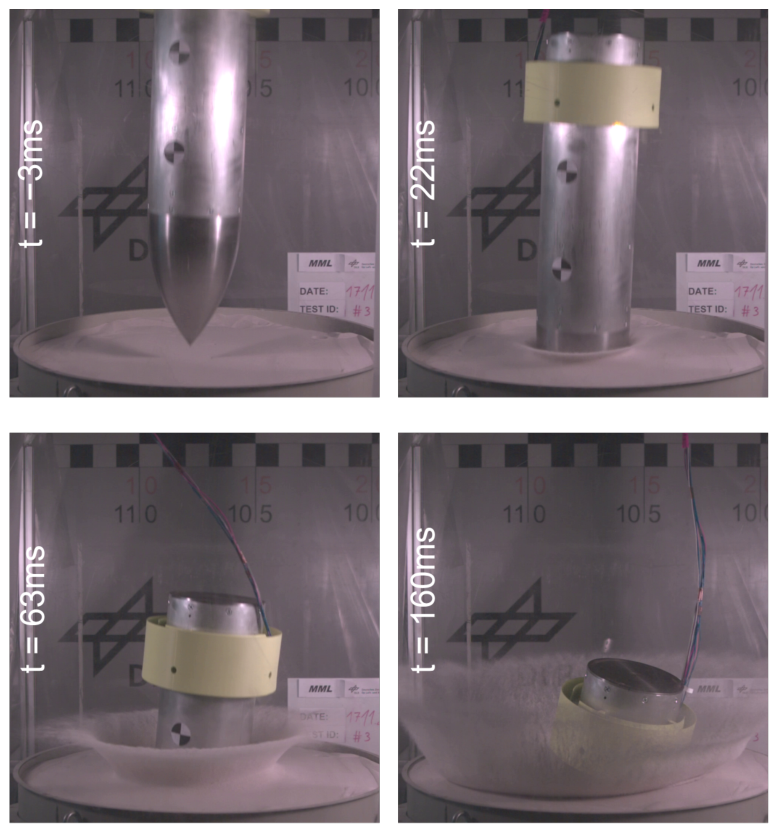
Figure 18 shows screenshots from the high-speed camera of test #3. While the penetrator dives into the soil, a circular wave of sand is pushed upward and to the side. The sand level rises because the penetrator displaces the sand, and it is incompressible. The angle of the penetrator does not change at first; only when it comes to a halt does it fall slightly to the side.
Figure 18.
Screenshots taken from the high-speed video of test #3. The impact begins at t = 0 ms with ≈ 9.6 m/s.
3.2.3. Effect of Stone-Layers on Non-Cohesive Soil
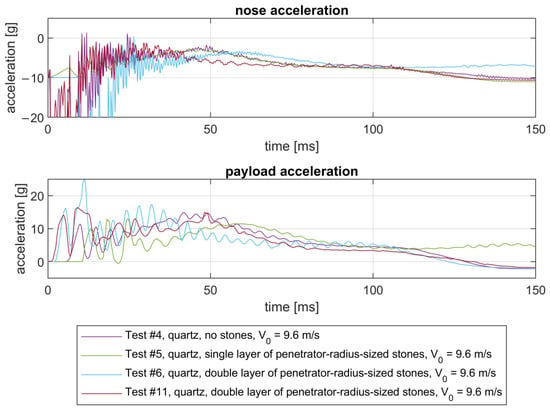
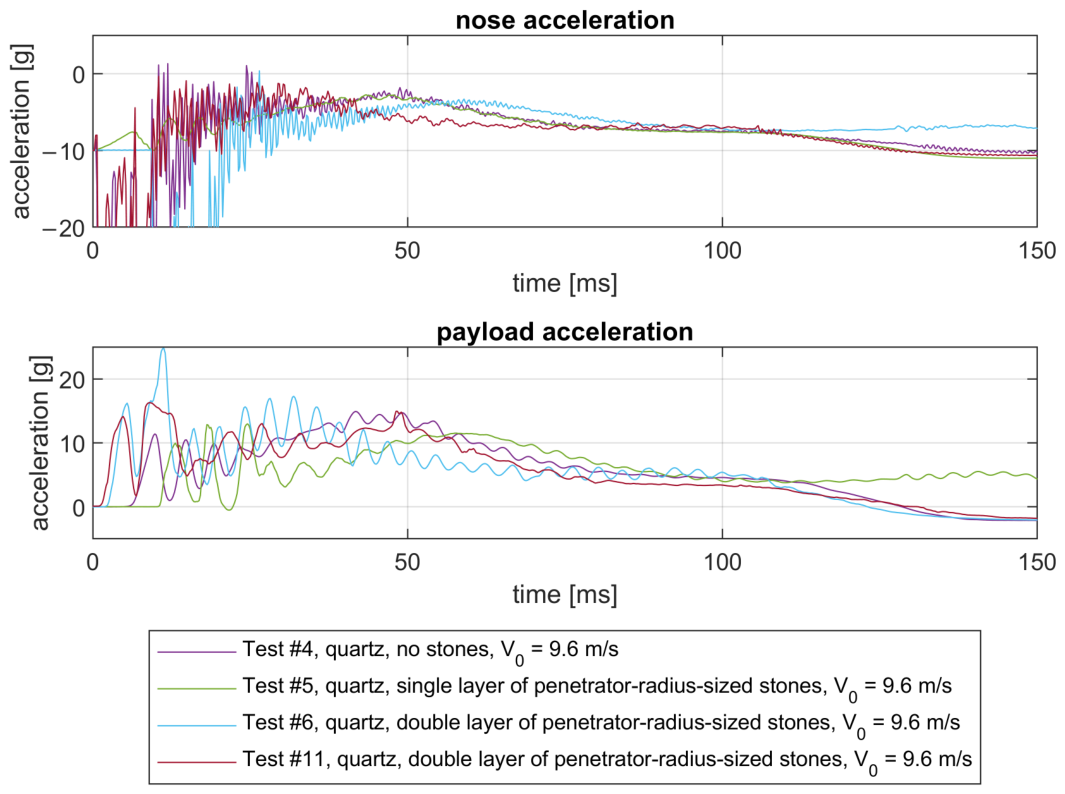
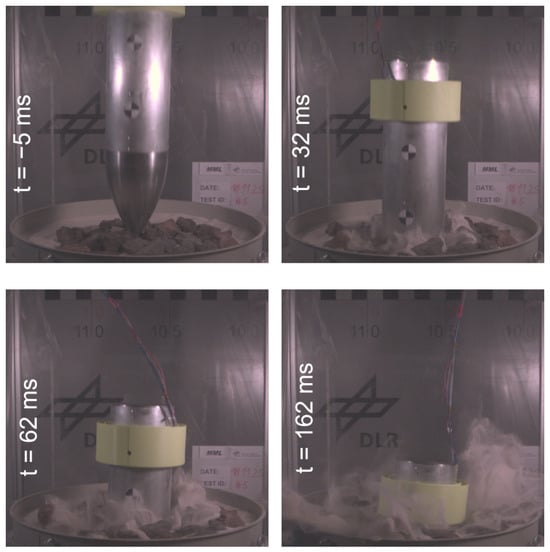
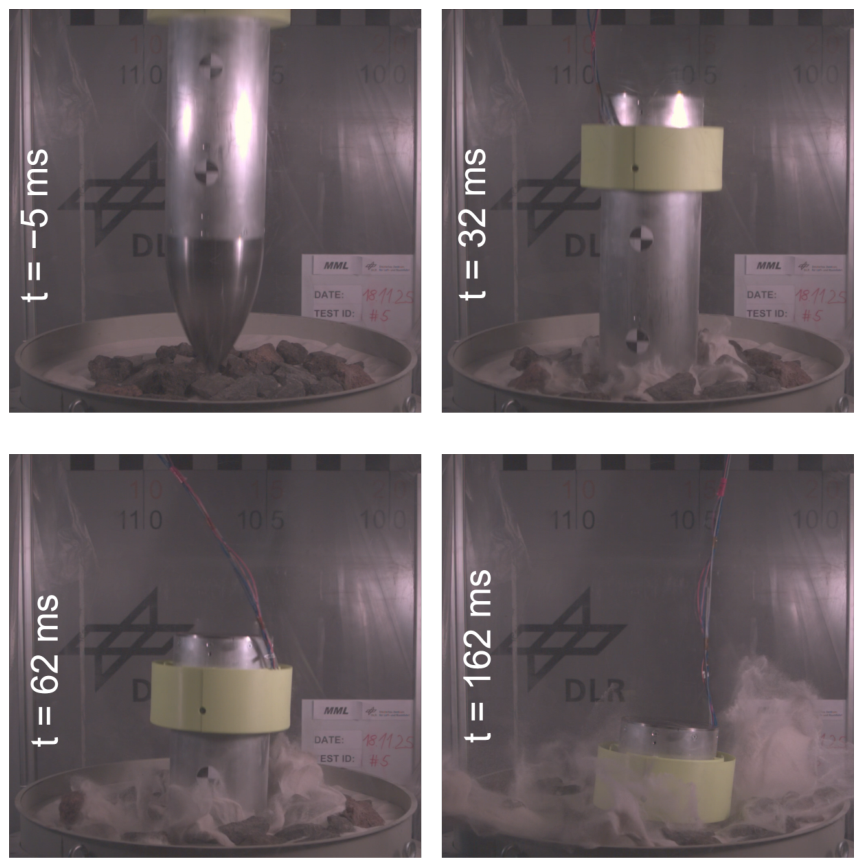
In Figure 19 the stone layer tests (#5, #6, and #11) are compared to a stone-free test (#4). While test #5 used a single layer of half-penetrator-diameter stones, tests #6 and #11 used a double layer of the same stones. These tests are identical to test the repeatability. The initial acceleration acting on the nose accelerometer is large for tests #5, #6, and #11. Again, the initial acceleration for those tests is negative. Causes for this have been hypothesized previously. When the excitation subsides, the acceleration patterns for all three stone-layer tests are similar to #4. The penetration depth for test #5 is even deeper than for the stone-free test #4, suggesting that these stones are not an obstacle for the penetrator. Even with the double layer of stones, the penetration depth is only slightly reduced. Frames from the high-speed video of test #5 are shown in Figure 20.
Figure 19.
Acceleration data of tests #4, #5, #6, and #11. Test #11 is repetition of Test #6.
Figure 20.
Screenshots taken from the high-speed video of test #5. The impact begins at t = 0 ms with ≈ 9.6 m/s.
3.2.4. Repeatability of Tests on Cohesive Soil with Loose Compaction
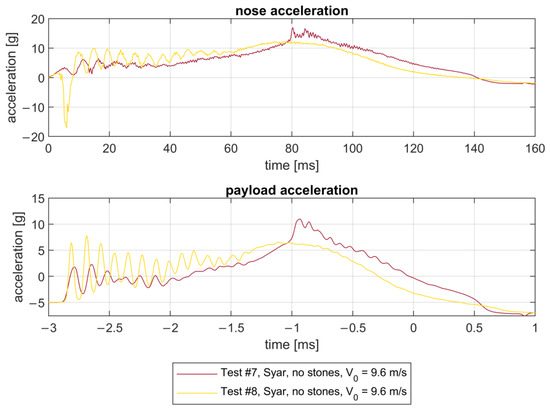
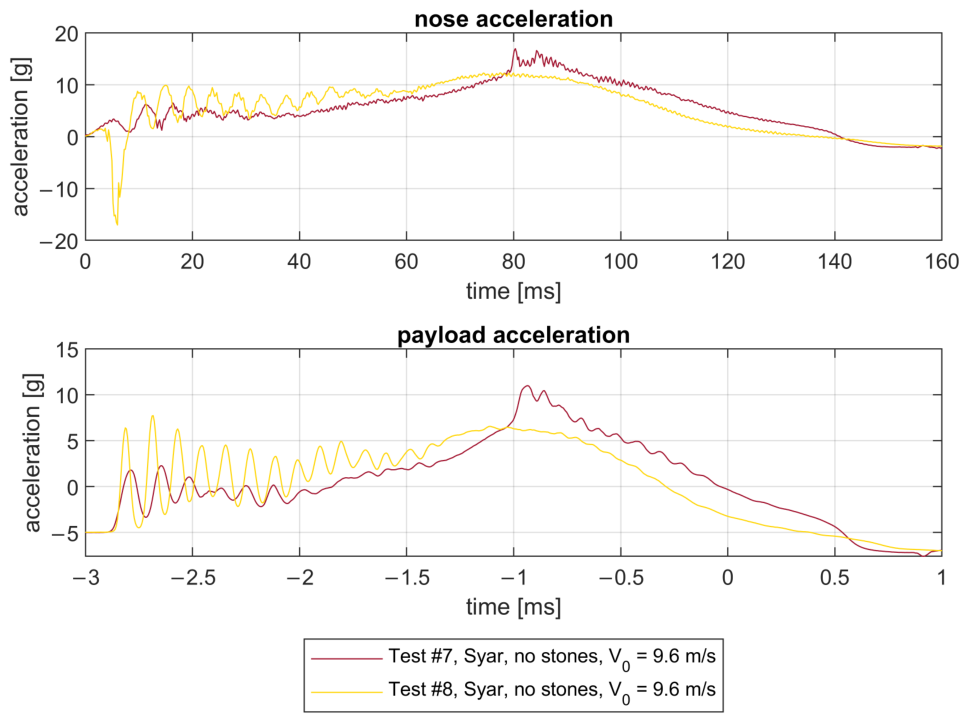
Syar sand is used for tests #7 and #8, without any stones. The soil is only loosely compacted by the filling process and its own weight. The acceleration data is shown in Figure 21. The measurements during both tests are similar, confirming the repeatability of the tests with Syar sand.
Figure 21.
Acceleration data of test #7 and #8.
3.2.5. Effect of Compaction on Cohesive Soil
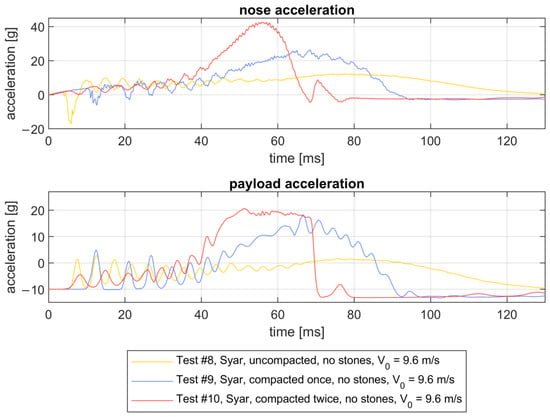
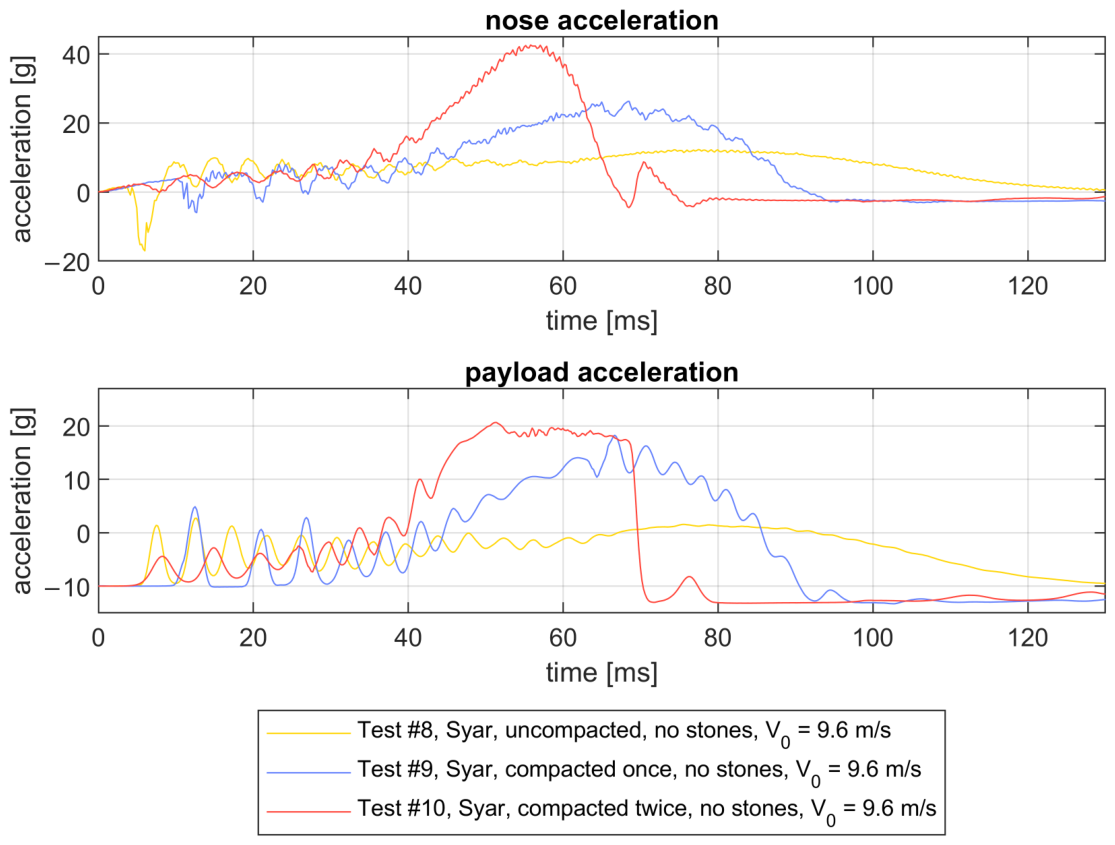
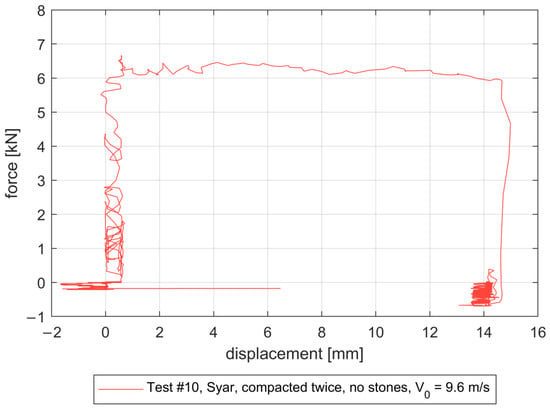
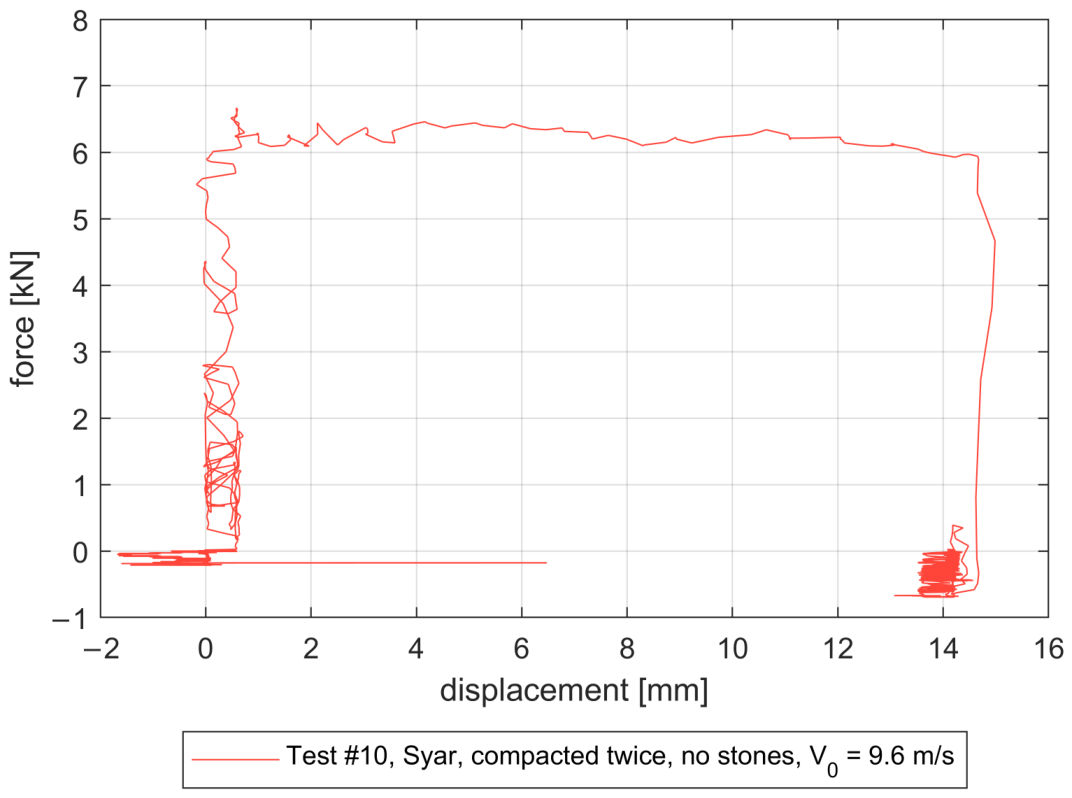
Syar sand was used for tests #9 and #10 as well. For the following tests, the container was not emptied and then refilled again. Instead, the compacted sand was intentionally left inside to force a crushing of the load limiter. As seen in Figure 22, this results in increasing loads for tests #9 and #10, since the soil compaction intensifies with each test. The data from test #8 is shown here again for comparison. Vibrations can also be seen at the beginning of the tests. Test #10 is interesting because it is the first test with a deformation of the load limiter. It can be clearly seen in the payload acceleration that the g-load reaches a limit of around 29 g or . Figure 23 shows the force displacement behavior of the payload, which is similar to the ideal behavior as shown in Figure 7.
Figure 22.
Acceleration data of tests #8, #9 and #10.
Figure 23.
Force–displacement diagram of the load limiter during test #10.
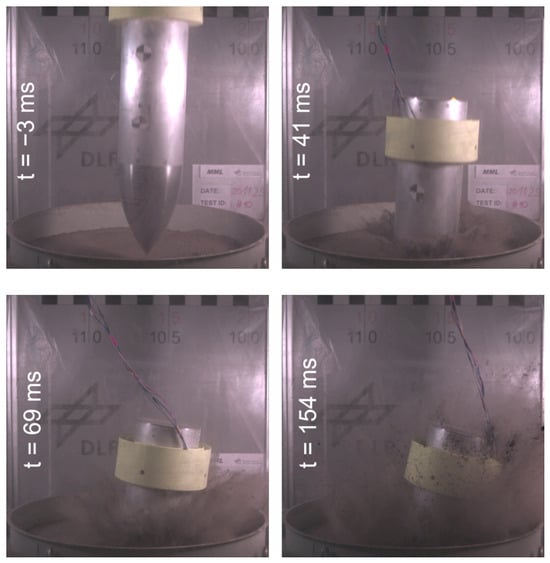
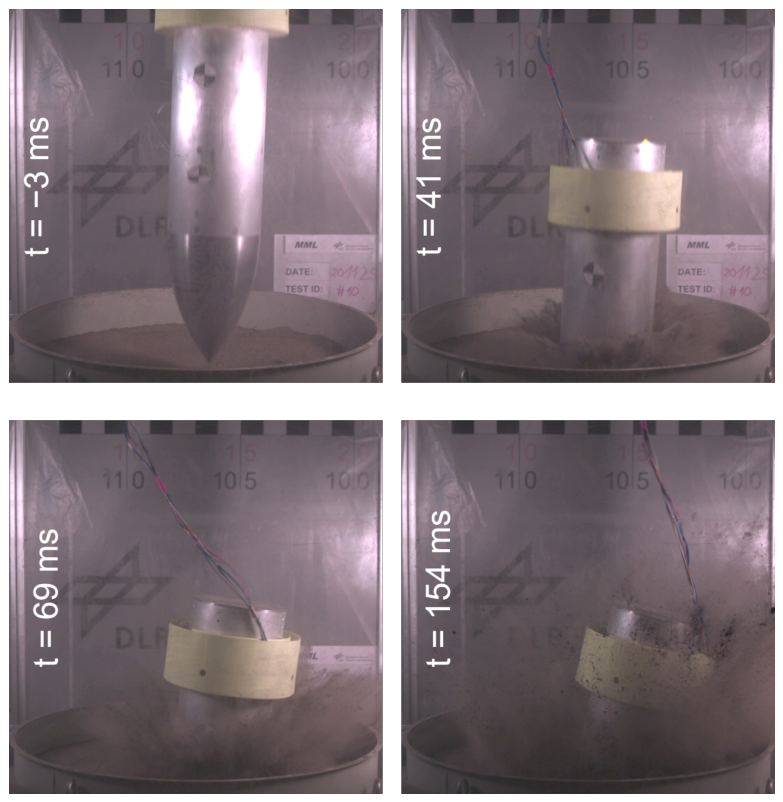
Screenshots from the high-speed camera of test #10 can be seen in Figure 24. Similar to test #3, sand is pushed upwards and to the side. But the Syar sand does not form a clean wave like the quartz sand. Also, the sand level does not change after impact because the Syar sand is compressed.
Figure 24.
Screenshots taken from the high-speed video of test #10. The impact begins at t = 0 ms with 9.6 m/s.
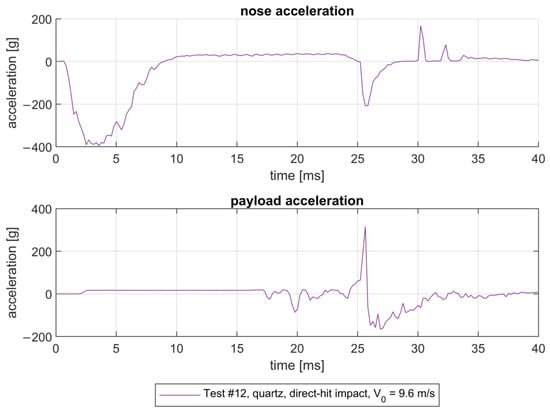
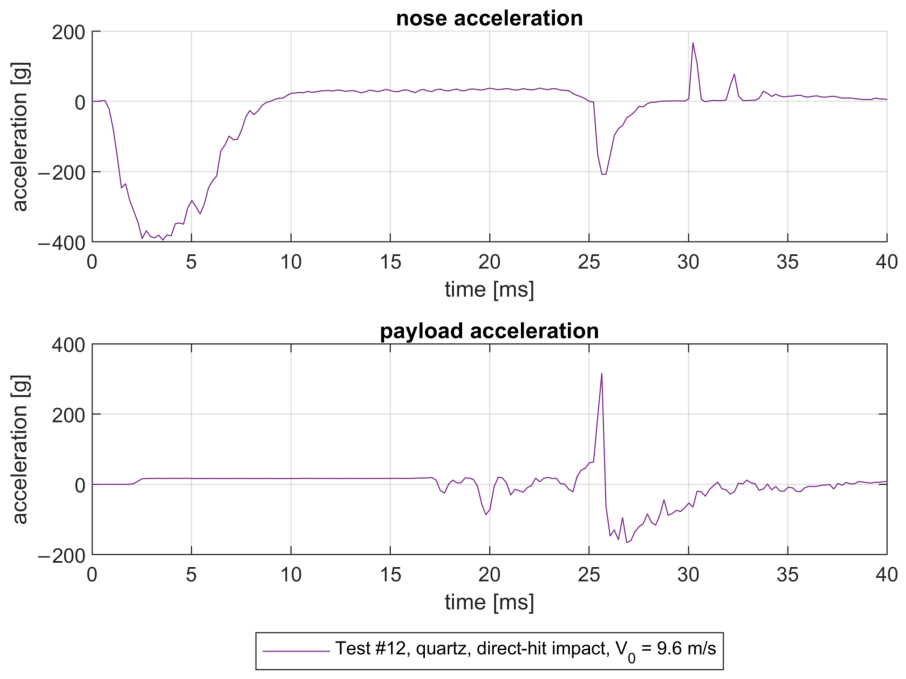
For test #12 larger stones, similar in diameter to the penetrator, were used. The acceleration data is shown in Figure 25. The stone was pushed into the sand and broke into two pieces but did not penetrate the sand significantly and fell to the side. This led to great forces acting on both the penetrator and the payload. It is clearly visible when the load limiter begins to deform in the diagram, but the signal is then probably distorted by vibrations, as is the nose accelerometer signal. When the load limiter was completely crushed, the payload probably impinged on the load limiter (holder), resulting in another acceleration peak for the nose accelerometer caused by vibrations. At the same time, a peak of the acceleration occurred for the payload. The signal for the nose accelerometer is distorted again.
Figure 25.
Acceleration data of test #12.
3.2.6. Off-Center Stone Impact Tests
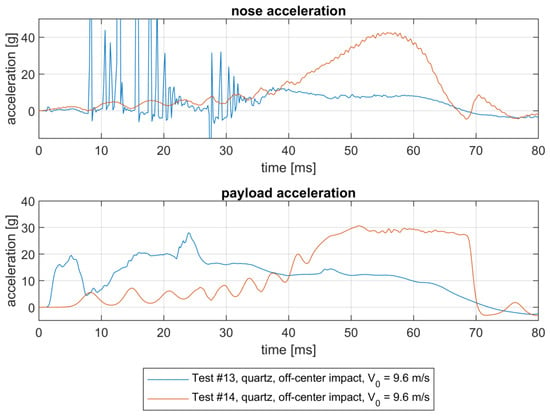
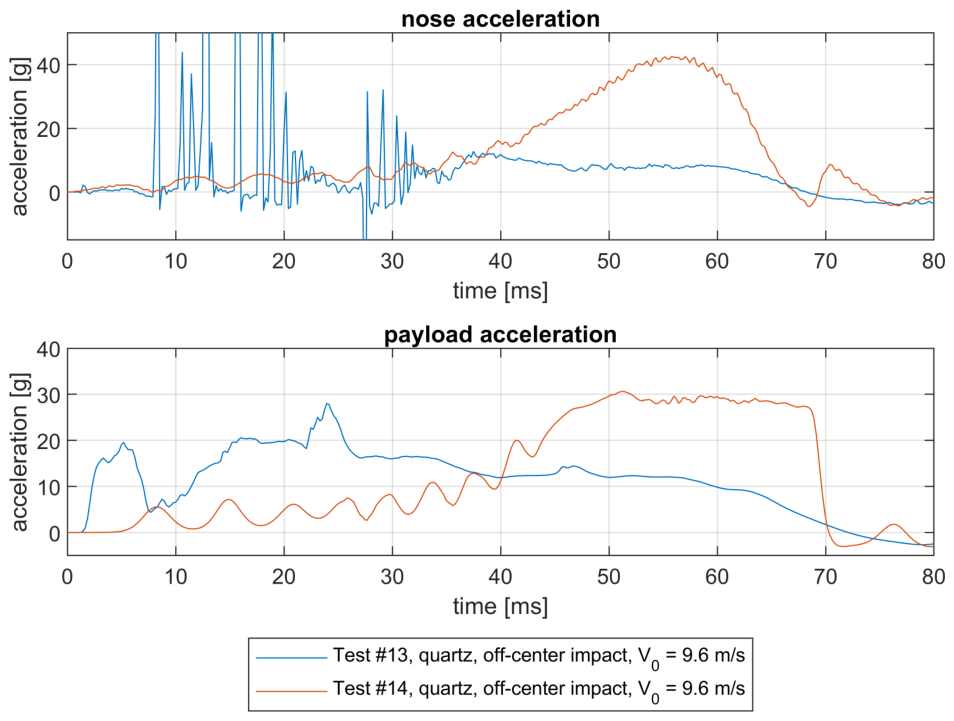
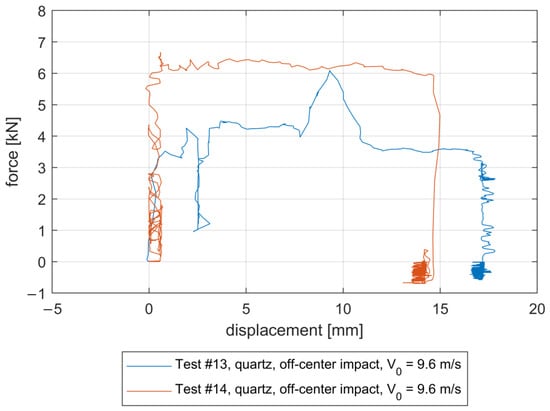
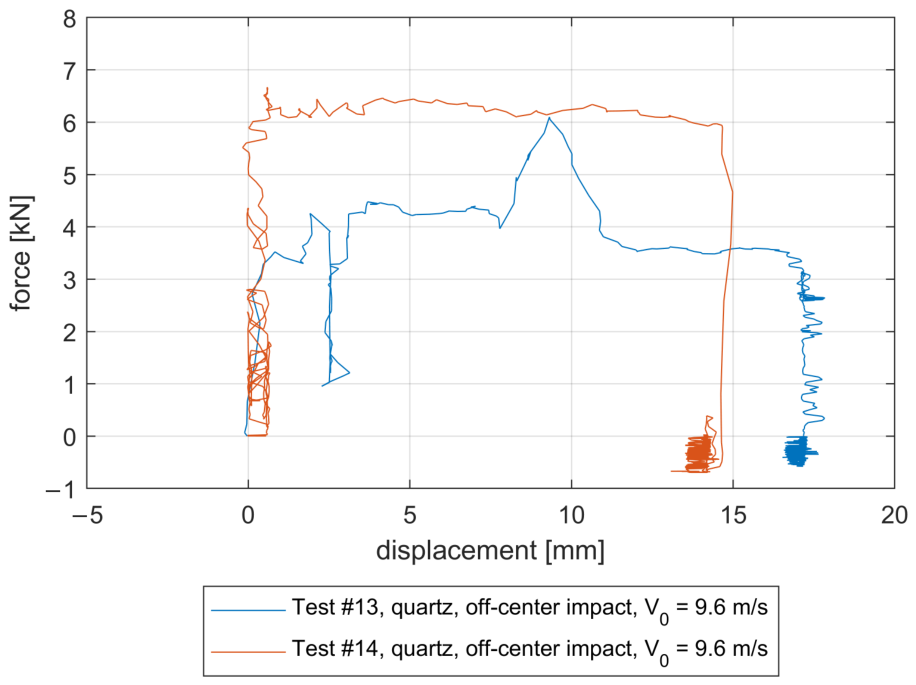
For tests #13 and #14, two different load limiters were employed with a load limit of and . The impact velocity was roughly . Multiple penetrator-diameter-sized stones and a few penetrator-radius stones were arranged concentrically around the impact point on the quartz sand. The acceleration data is shown in Figure 26 and the displacement of the load limiter in Figure 27.
Figure 26.
Acceleration data of test #13 and #14.
Figure 27.
Force–displacement diagram of the load limiter during tests #13 and #14.
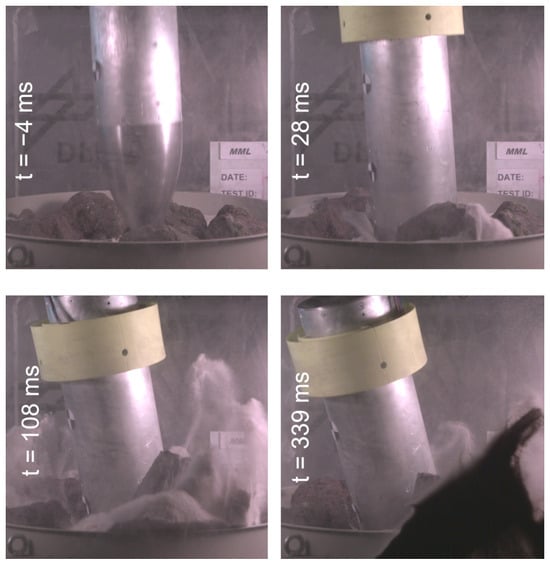
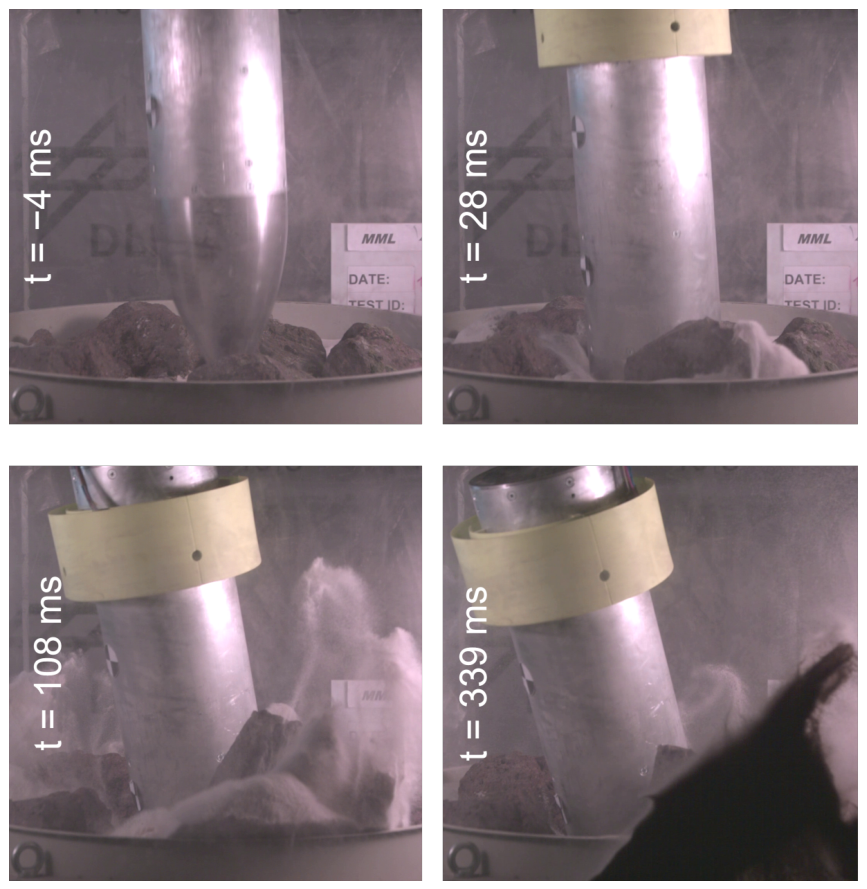
The impact point was cleared, but three diameter-sized stones were arranged roughly away from the point. This way it was ensured that the penetrator penetrates the soil but still has to push away at least one stone, depending on where the actual impact takes place. During both tests the stones closest to the impact point were moved significantly. This can be seen in the screenshots of the high-speed camera in Figure 28. Nonetheless, the penetrator could still penetrate the soil with a penetration depth of for #13 and for test #14.
Figure 28.
Screenshots taken from the high-speed video of test #13. The impact begins at t = 0 ms with 9.6 m/s.
The load limiter of test #14 behaves similarly to the ideal behavior as seen in Figure 7. The load limiter of test #13 has a force peak of around , but otherwise behaves ideally as well. A lateral load through stone impact could have caused a larger load than ideally possible, since the payload is not isolated by these kinds of forces.
4. Comparison of Test and Simulation Data
The environmental conditions with regard to gravity and the limitations of the achievable impact velocity in the laboratory differ in a way that a direct validation of the DEM-simulated Mars results by test data is not meaningful. As the kinetic energy at surface contact is lower while the potential energy at unit depth is higher, the peak and depth values and the temporal behavior deviate.
Qualitatively, the tests still confirm the dynamical behavior of the impacting body seen in the DEM simulation and the 1DOF-model. The force response consists of a general peak followed by a plateau and the final decay in both simulations, e.g., Figure 16 and Figure 21. Even though the boundary conditions are different, mainly impact velocity, gravity and soil conditions, this behavior can be observed in all simulations and tests using quartz sand.
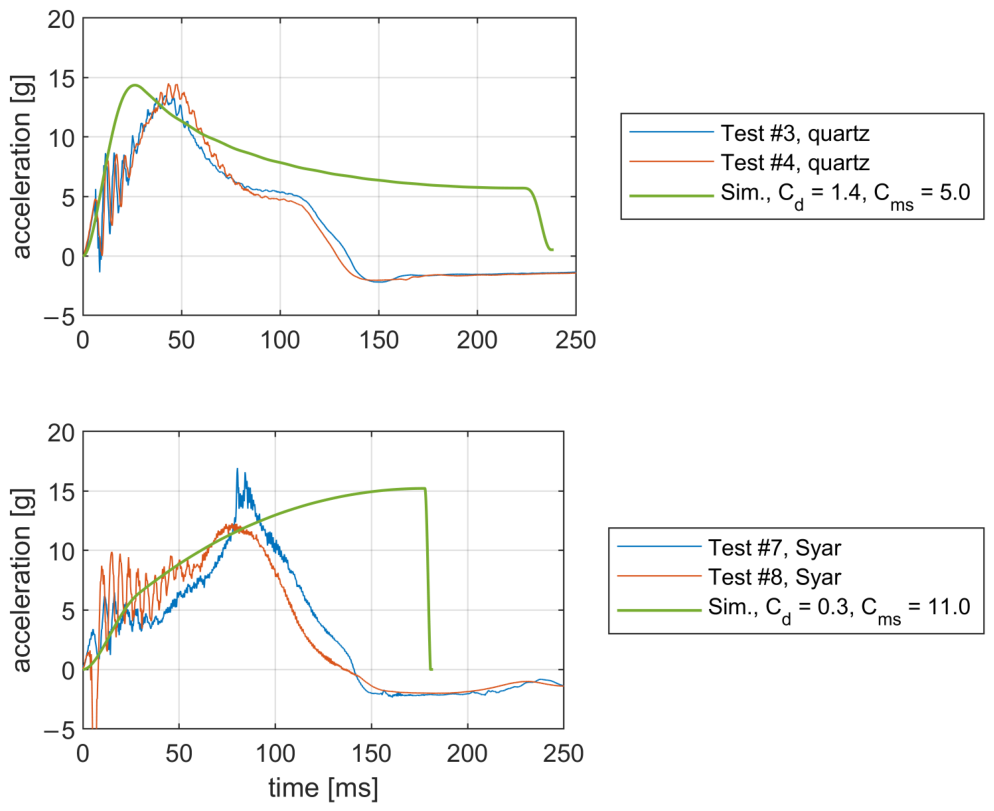
The parameters and can be compared to assess their sensitivity with regard to the different conditions. Therefore, experimentally obtained acceleration data of impacts into quartz and Syar soil are used to identify the and parameters applicable to the soil conditions, Earth gravity and low impact velocity. These are shown in Table 6 with the values obtained for the Martian environment in Section 1.1.
Table 6.
Simulation parameters and identified from test data (Earth gravity, ) and DEM numerical data (Mars gravity, –).
The displacement drag parameter remains in the same order of magnitude even across the large impact velocity range, different gravity, and soil parameters. It therefore can be attributed to an ogive-shaped impactor in contact with a granular medium while being relatively invariant across the velocity and environmental range of conditions.
The mechanical strength parameter shows, however, a significant difference between the different impact environments. The value for the higher-speed impact is larger by a factor of ∼8 to 17. The level of detail of this investigation, however, does not allow to further attribute this down attribution of gravity, impact velocity, and soil conditions.
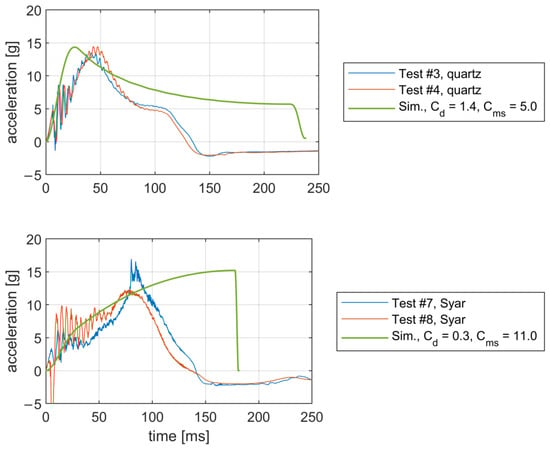
The comparison between test and simulation of the impact into the quartz sand in Figure 29 confirms again that the peak force is determined by the displacement drag. The penetration time until the penetrator comes to a full stop is, however, largely overestimated by the simulation.
Figure 29.
Simulated and measured acceleration profiles for Syar and quartz sand.
Contrarily, the impact acceleration into the cohesive soil Syar is dominated by the compaction of soil, indicated by the larger - and lower -value compared to the quartz sand. The decreasing flank of the measured acceleration and peak are not well predicted by the simulation.
The discrepancy between test and simulation in the duration until the penetrator body comes to a rest indicates a -error, although the initial kinetic energies have been identical. This is explained by the circumstance that even in a controlled lab environment with stone-free, granular soil (tests #3, #4, #7, #8) the penetrator body starts to rotate out of its vertical alignment (visible in all associated video image sequences), thus increasing the penetrator’s vertical projected Area (Equations (3) and (4)), which is not accounted for in the 1DOF model. Such angular excursion is also seen in the DEM simulation, but this effect is comparatively low given its higher kinetic energy.
5. Discussion/Conclusions
A Mars penetrator probe design has been taken as reference for a simulation and test campaign about its penetrator dynamics. The results of these campaigns are not meant to mature or qualify the reference design. They indicate the areas of improvement of those test and simulation campaigns for further studies.
For future research, the model requires a qualitative refinement to consider the pre-compaction of the soil with depth and therefore a nonlinear increase of bearing capacity along probe penetration, meaning that the parameter is a function of the penetration depth instead of being a constant value. This applies likewise to the increase of bulk density with depth. Impacts on stones of the size near or at the diameter of the penetrator body show a large reduction in penetration capability compared to pure soil due to the added displacement energy required. The penetration fails when hitting a rock comparable with the penetrator’s diameter.
An open point for continuing research is whether the penetrator’s diameter discriminates the penetrability and non-penetrability of terrain characterized by a certain stone-size-frequency distribution. Confirmation of such a relationship would be crucial to assess landing success probabilities on certain terrains. With regard to the predictability of this observation, the semi-empirical 1DOF simulation model is not able to consider this by default due to its limitation to homogeneous soil conditions. Such phenomena can, however, be implemented as part of a DEM simulation.
Another open point for continuing research is that the parameters and are functions of the soil mechanical parameters. Derivation of a mathematical relation requires a more comprehensive study with a greater variety of soil mechanical parameter, such as its cohesion, friction angle and packing density.
A clear limitation in the used test set-up is its too-low impact velocity. This leaves open if a higher impact kinetic energy into the cohesive soil and the resultant higher impulse transfer would have led to a higher overburden force to overcome the cohesive forces. An open question for further research is therefore to clarify if a higher impact energy leads to a higher displacement drag due to acceleration of loose particles that have overcome their intra-particle cohesion, showing a kind of liquefaction.
Low initial penetration velocity (<10 m/s) makes the penetrating body susceptible to comparatively large directional excursion, because the penetrating power is too low. This indicates the need to define a minimum impact velocity.
As a concluding remark, the idea of using small penetrator probes as a less complex, low-cost alternative to soft landing vehicles relies largely on the energy absorption capability of the planetary terrain. Unlike ammunition-type of penetrators, which normally need to have knowledge of their terrain- or target-specific minimum penetration depth, an exploration-type of penetrator needs to know this for constrained min-max-bandwidth. The inherent uncertainty of knowledge about the particular sub-surface terrain properties remains therefore a major driver for mission risk despite large required test and simulation efforts to address the open questions stated above.
Author Contributions
Conceptualization, L.W.; methodology, V.F.; software, V.F.; validation, V.F.; formal analysis, V.F.; investigation, V.F., S.S. and T.W.; resources, V.F.; data curation, V.F.; writing—original draft preparation, V.F.; writing—review and editing, T.R., I.S.Ö., A.S. and L.W.; visualization, V.F.; supervision, L.W.; project administration, L.W. All authors have read and agreed to the published version of the manuscript.
Funding
This research received no external funding.
Data Availability Statement
The raw data supporting the conclusions of this article will be made available by the authors on request.
Acknowledgments
The DEM analysis part of this study was consulted by Alice Hager, Arno Mayrhofer and Christoph Kloss of DCS Computing, whose support is thankfully acknowledged.
Conflicts of Interest
The authors declare no conflicts of interest.
Abbreviations
The following abbreviations are used in this manuscript:
| AIDA | Asteroid Impact & Deflection Assessment |
| ConOps | Concept of Operations |
| DEM | Discrete Element Method |
| DLR | Deutsches Zentrum für Luft- und Raumfahrt (German Aerospace Center) |
| DOF | Degree of Freedom |
| GNC | Guidance, Navigation and Control |
| HP3 | Heat Flow and Physical Properties Package |
| LAMA | Landing and Mobility Test Facility |
| MASCOT | Mobile Asteroid Surface Scout |
| MMS | Mojave Mars Simulant |
| MetNet | Mars Network |
| MML | Micro Mars Lander |
References
- Smrekar, S.; Catling, D.; Lorenz, R.; Magalhães, J.; Moersch, J.; Morgan, P.; Murray, B.; Presley, M.; Yen, A.; Zent, A.; et al. Deep Space 2: The Mars Microprobe Mission. J. Geophys. Res. Planets 1999, 104, 27013–27030. [Google Scholar] [CrossRef] [Scilit]
- Zakharov, A.V. The Mars-94 and Mars-96 missions. Phil. Trans. R. Soc. A 1994, 349, 295–307. [Google Scholar] [CrossRef] [Scilit]
- Albee, A.; Battel, S.; Brace, R.; Burdick, G.; Casani, J.; Lavell, J.; Leising, C.; MacPherson, D.; Burr, P.; Dipprey, D. Report on the Loss of the Mars Polar Lander and Deep Space 2 Missions. JPL Special Review Board Report, JPL D-18709, Jet Propulsion Laboratory, California Institute of Technology, Pasadena, CA, 2000. Available online: https://ntrs.nasa.gov/citations/20000061966 (accessed on 20 January 2026).
- Biswal, M.K.; Annavarapu, R.N. Mars Missions Failure Report Assortment: Review and Conspectus. In Proceedings of the AIAA Propulsion and Energy 2020 Forum, Online, 24–28 August 2020. [Google Scholar] [CrossRef] [Scilit]
- Lorenz, R.D.; Moersch, J.E.; Stone, J.A.; Morgan, A.R.; Smrekar, S.E. Penetration tests on the DS-2 Mars microprobes: Penetration depth and impact accelerometry. Planet. Space Sci. 2000, 48, 419–436. [Google Scholar] [CrossRef] [Scilit]
- Lorenz, R.D.; Shandera, E.S. Target effects during penetrator emplacement: Heating, triboelectric charging, and mechanical disruption. Planet. Space Sci. 2002, 50, 163–179. [Google Scholar] [CrossRef] [Scilit]
- Spohn, T.; Grott, M.; Smrekar, S.E.; Knollenberg, J.; Hudson, L.T.; Krause, C.; Müller, N.; Jänchen, J.; Börner, A.; Wippermann, T.; et al. The Heat Flow and Physical Properties Package (HP3) for the InSight Mission. Space Sci. Rev. 2018, 214, 96. [Google Scholar] [CrossRef] [Scilit]
- Poganski, J.; Schweiger, H.F.; Kargl, G.; Kömle, N.I. DEM Modelling of a Dynamic Penetration Process on Mars as a Part of the NASA InSight Mission. Procedia Eng. 2017, 175, 43–50. [Google Scholar] [CrossRef] [Scilit]
- Lichtenheldt, R.; Schäfer, B.; Krömer, O. Hammering beneath the surface of Mars—Modeling and simulation of the impact-driven locomotion of the HP3-Mole by coupling enhanced multi-body dynamics and discrete element method. In Proceedings of the 58th Ilmenau Scientific Colloquium, Ilmenau, Germany, 8–12 September 2014; Available online: https://elib.dlr.de/90649/ (accessed on 11 August 2026).
- Cheng, A.F.; Michel, P.; Jutzi, M.; Rivkin, A.S.; Stickle, A.; Barnouin, O.; Ernst, C.; Atchison, J.; Pravec, P.; Richardson, D.C. Asteroid Impact & Deflection Assessment mission: Kinetic impactor. Planet. Space Sci. 2016, 121, 27–35. [Google Scholar] [CrossRef] [Scilit]
- Jutzi, M.; Michel, P. Hypervelocity impacts on asteroids and momentum transfer I. Numerical simulations using porous targets. Icarus 2014, 229, 247–253. [Google Scholar] [CrossRef] [Scilit]
- Harri, A.-M.; Makkonen, P.; Polkko, J.; Lappalainen, H.; Pellinen, R.; Vorontsov, V.; Polyakov, A.; Ivankov, A.; Linkin, V.; Gotlib, V.; et al. MetNet—The Next Generation Lander for Martian Atmospheric Science. In Proceedings of the 54th International Astronautical Congress of the International Astronautical Federation (IAF), the International Academy of Astronautics (IAA), and the International Institute of Space Law (IISL), Bremen, Germany, 29 September–3 October 2003; pp. 3603–3609. [Google Scholar] [CrossRef] [Scilit]
- Harri, A.-M.; Marsal, O.; Lognonne, P.; Leppelmeier, G.W.; Spohn, T.; Glassmeier, K.-H.; Angrilli, F.; Banerdt, W.B.; Barriot, J.P.; Bertaux, J.-L.; et al. Network science landers for Mars. Adv. Space Res. 1999, 23, 1915–1924. [Google Scholar] [CrossRef] [Scilit]
- Lorenz, R.D. Planetary penetrators: Their origins, history and future. Adv. Space Res. 2011, 48, 403–431. [Google Scholar] [CrossRef] [Scilit]
- NASA. Expanding the Horizons of Mars Science, A Plan for a Sustainable Science Program at Mars. NASA, 2024. Available online: https://assets.science.nasa.gov/content/dam/science/psd/solar-system/mars/campaigns/mars-future-plan/20241204_Mars_Future_Plan_Final_Print.pdf (accessed on 23 March 2026).
- Gonzalo, A. The Thermal Subsystem of Mars Connect: Miniature Probes for a Meteorological Network on the Mars Surface. In Proceedings of the 54th International Conference on Environmental Systems, Prague, Czechia, 13–17 July 2025. [Google Scholar] [CrossRef] [Scilit]
- Luo, H.; Liu, Z.; Fan, C.; Li, Y. Numerical simulation and experimental study of high-speed impact penetrator for lunar subsurface. Acta Astronaut. 2025, 233, 250–265. [Google Scholar] [CrossRef] [Scilit]
- Luo, H.; Li, Y.; Fan, C.; Wu, X.; Liu, G. Design and experimental research on buffer protection of high-g penetrator for deep space exploration. Acta Astronaut. 2021, 189, 63–78. [Google Scholar] [CrossRef] [Scilit]
- Ahrens, C.J.; Paige, A.D.; Eubanks, M.T.; Blase, P.W.; Mesick, E.K.; Zimmerman, W.; Petro, N.; Hayne, O.P.; Price, S. Small Penetrator Instrument Concept for the Advancement of Lunar Surface Science. Planet. Sci. J. 2021, 2, 38. [Google Scholar] [CrossRef] [Scilit]
- Yamada, K.; Nagata, Y.; Goto, K.; Tanaka, S.; Tomiki, A.; Toyota, H.; Kimura, S.; Nakao, T.; Shiraishi, H. Conceptual Design of Compact EDL System Using Inflatable Aeroshell and Penetrator Technology for Mars Landing Exploration. In Proceedings of the 22nd International Planetary Probe Workshop (IPPW-2025), Stuttgart, Germany, 25 June 2025; Available online: https://drive.google.com/drive/folders/1Po7-aLFmDwd9cByjNXgNTJg3Txi7Hp2B (accessed on 19 January 2026).
- Buchely, M.; Marañon, A. Spherical Cavity Expansion Approach for the Study of Rigid-Penetrator’s Impact Problems. Appl. Mech. 2020, 1, 20–46. [Google Scholar] [CrossRef] [Scilit]
- Forrestal, M.J.; Luk, V.K. Penetration into soil targets. Int. J. Impact Eng. 1992, 12, 427–444. [Google Scholar] [CrossRef] [Scilit]
- Ahmed, M.; AlQadhi, S.; Mallick, J.; Desmukh, M.N.; Hang, H.T. Advances in Projectile Penetration Mechanism in Soil Media. Appl. Sci. 2020, 10, 6810. [Google Scholar] [CrossRef] [Scilit]
- Young, C.W. Penetration Equations; Applied Research Associates, Inc.: Albuquerque, NM, USA, 1997; Available online: https://digital.library.unt.edu/ark:/67531/metadc697639/m2/1/high_res_d/562498.pdf (accessed on 19 January 2026).
- Yosef, T.Y.; Fang, C.; Faller, R.K.; Kim, S.; Alomari, Q.A.; Atash Bahar, M.; Kumar, G.S. A Review of Soil Constitutive Models for Simulating Dynamic Soil–Structure Interaction Processes Under Impact Loading. Geotechnics 2025, 5, 40. [Google Scholar] [CrossRef] [Scilit]
- Förste, S.; Reimer, T.; Sakraker, I.; Witte, L.; Fasoulas, S. Development of a deployable decelerator concept for small Mars landers. In Proceedings of the 2nd International Conference on Flight Vehicles, Heilbronn, Germany, 19–23 June 2022; Available online: https://elib.dlr.de/189735/ (accessed on 23 March 2026).
- Ho, T.-M.; Baturkin, V.; Grimm, C.; Grundmann, J.T.; Hobbie, C.; Ksenik, E.; Lange, C.; Sasaki, K.; Schlotterer, M.; Talapina, M.; et al. MASCOT—The Mobile Asteroid Surface Scout Onboard the Hayabusa2 Mission. Space Sci. Rev. 2016, 208, 339–374. [Google Scholar] [CrossRef] [Scilit]
- Spohn, T.; Hudson, T.L.; Marteau, E.; Golombek, M.; Grott, M.; Wippermann, T.; Ali, K.S.; Schmelzbach, C.; Kedar, S.; Hurst, K.; et al. The InSight HP3 Penetrator (Mole) on Mars: Soil Properties Derived from the Penetration Attempts and Related Activities. Space Sci. Rev. 2022, 218, 72. [Google Scholar] [CrossRef] [Scilit] [PubMed]
- Golombek, M.; Warner, N.H.; Grant, J.A.; Hauber, E.; Ansan, V.; Weitz, C.M.; Williams, N.; Charalambous, C.; Wilson, S.A.; DeMott, A.; et al. Geology of the InSight landing site on Mars. Nat. Commun. 2020, 11, 1. [Google Scholar] [CrossRef] [Scilit] [PubMed]
- Delage, P.; Caicedo, B.; Golombek, M.; Spohn, T.; Schmelzbach, C.; Brinkman, N.; Marteau, E.; Murdoch, N.; Warner, N.; Ansan, V.; et al. Investigating the Martian soil at the InSight landing site. Soils Rocks 2024, 47, e2024005023. [Google Scholar] [CrossRef] [Scilit]
- Wippermann, T.; Hudson, T.L.; Spohn, T.; Witte, L.; Scharringhausen, M.; Tsakyridis, G.; Fittock, M.; Krömer, O.; Hense, S.; Grott, M.; et al. Penetration and performance testing of the HP3 Mole for the InSight Mars mission. Planet. Space Sci. 2020, 181, 104780. [Google Scholar] [CrossRef] [Scilit]
- Peters, G.H.; Abbey, W.; Bearman, G.H.; Mungas, G.S.; Smith, J.A.; Anderson, R.C.; Douglas, S.; Beegle, L.W. Mojave Mars simulant—Characterization of a new geologic Mars analog. Icarus 2008, 197, 470–479. [Google Scholar] [CrossRef] [Scilit]
- Kloss, C.; Goniva, C.; Hager, A.; Amberger, S.; Pirker, S. Models, algorithms and validation for opensource DEM and CFD-DEM. Prog. Comput. Fluid Dyn. 2012, 12, 140–152. [Google Scholar] [CrossRef] [Scilit]
- Beoduke (LM) Soil Mechanics Study. NASA CR 92208. 1968. Available online: https://ntrs.nasa.gov/api/citations/19680021852/downloads/19680021852.pdf (accessed on 24 March 2026).
- The MathWorks Inc. MATLAB, Version: 24.2.0 (R2024b); The MathWorks Inc.: Natick, MA, USA, 2024. Available online: https://www.mathworks.com (accessed on 24 March 2026).
- Witte, L.; Buchwald, R.; Schröder, S. Touch-down Dynamics and Terrain Interaction of Planetary Landing Systems. In Proceedings of the Global Lunar Conference (GLUC-2010.15.C13), Beijing, China, 31 May–3 June 2010; Available online: https://elib.dlr.de/88463/ (accessed on 20 December 2024).

Disclaimer/Publisher’s Note: The statements, opinions and data contained in all publications are solely those of the individual author(s) and contributor(s) and not of MDPI and/or the editor(s). MDPI and/or the editor(s) disclaim responsibility for any injury to people or property resulting from any ideas, methods, instructions or products referred to in the content. |
© 2026 by the authors. Licensee MDPI, Basel, Switzerland. This article is an open access article distributed under the terms and conditions of the Creative Commons Attribution (CC BY) license.