


Abstract
Traffic reallocation is usually framed as moving flights toward apparent spare airport capacity, yet the same move can redirect demand through different runways and shared corridors. We tested whether the local capacity response to a fixed reallocation remains invariant to this resource-chain composition. Using a discrete-event model of the Beijing Capital, Beijing Daxing and Tianjin Binhai airports, we crossed seven airport allocations with five prespecified composition levels. At a model-success threshold of 0.90, increasing Beijing Capital’s share by five percentage points produced a finite-search response of flights under the lower-pressure composition but under the higher-pressure composition. The propagated interaction interval was flights. The reversal was consistent across three independent seed families, and 95% paired-bootstrap percentile intervals excluded zero for both outer compositions. None of 100 prespecified pressure-label controls met the certain-tail criterion, while seven control intervals overlapped the observed band. These are reference-tail proportions, not a randomization p-value. Runway and corridor relief each restored all seven failing operating-state boundary cases. These results show that reallocation acts on a coupled airport–resource system whose response depends on the complete chains carried by demand. These findings are model-conditional finite-search results under expert-bounded perturbations, not an official capacity determination or a calibrated estimate of operational reliability.
1. Introduction
Moving flights from a congested airport to a nearby airport with apparent spare capacity seems to create headroom. In a dense terminal area, however, the receiving traffic does not consume airport capacity in isolation. It also requests particular runways, transfer points and shared corridors. A reallocation that relieves one airport may therefore load a more restrictive part of the surrounding network. The practical question is not simply where flights are assigned but which complete resource chains those flights bring with them.
That distinction matters for capacity assessment. Effective Chinese guidance establishes a typical-busy-day baseline, preserves its spatial–temporal profile under demand variation and judges capacity through simulation and delay acceptability. A 2024 consultation draft extends that discussion to airport groups and representative traffic-share combinations [1,2]. Yet, neither document states which resource-chain composition should accompany reallocation. The same total can therefore traverse different runways and corridors. We test whether the capacity response is invariant to that unresolved choice using the guidance as a methodological anchor rather than an official determination.
Airport-capacity research already shows that feasible throughput depends on runway use, traffic sequence, terminal-fix constraints and queue state rather than on infrastructure alone [3,4,5,6]. Metroplex studies extend this view across airport boundaries through shared routes, coupled queues and propagated congestion [7,8,9,10,11,12]. Recent work also examines airspace-slot coordination, airport-group expansion and execution under changing capacity conditions [13,14,15,16,17,18,19,20]. Demand-management models can reschedule, route or allocate traffic against a capacity representation [21,22,23], and directional-flow studies show that equal totals can load different parts of the airspace [4,24]. Yet, most analyses evaluate one specified mapping from demand to resources. They do not directly ask whether the effect of an airport-share change survives an independent change in the complete runway–corridor chains carried by demand.
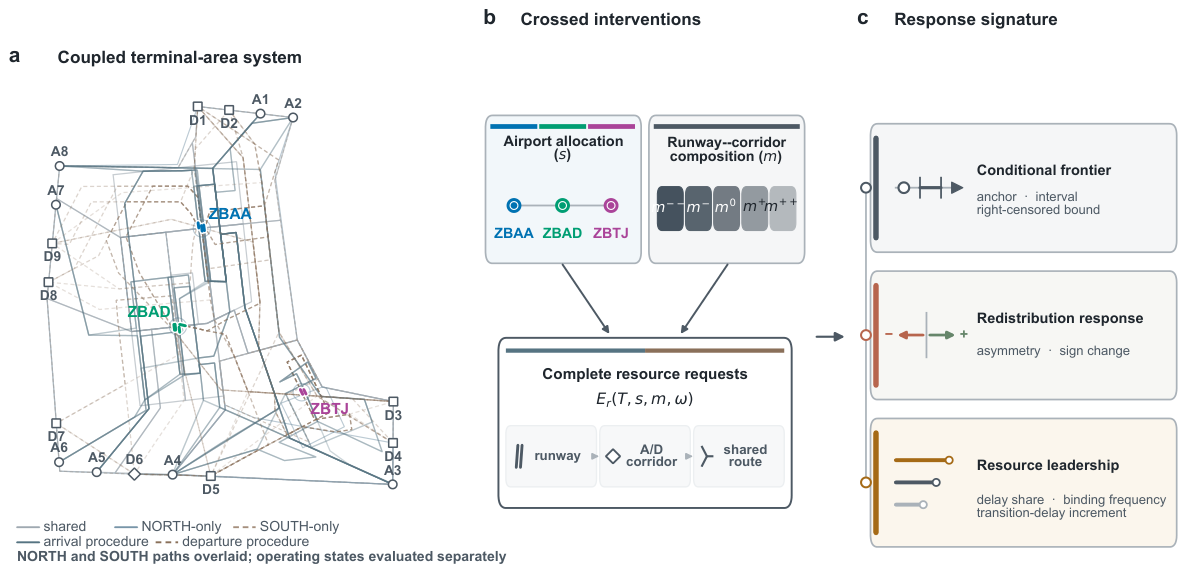
To isolate this missing dimension, we crossed seven airport allocations with five common-rule composition levels in a coupled model of the Beijing Capital, Beijing Daxing and Tianjin Binhai airports (Figure 1). The allocation intervention reweights airport-specific demand populations. The composition intervention reassigns supported paired runway–corridor categories while preserving declared margins and treatment dose. A rule-preserving discrete-event model then evaluates local passing-to-failing transitions under two fixed operating states. The estimand is a response-invariance question: does the same airport-share change retain its direction and magnitude as the resource-chain composition changes?
Figure 1.
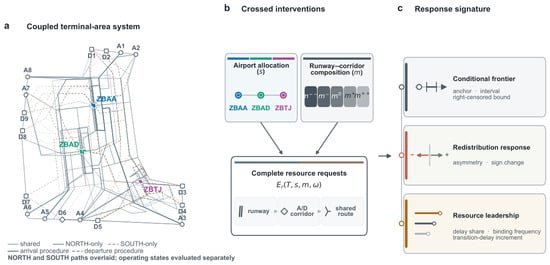
Airport reallocation acts through a coupled runway–corridor network. (a) Schematic of the three-airport terminal system, including runways, transfer corridors, arrival and departure routes, and the NORTH and SOUTH operating states. The panel uses one common display transform and is an orientation schematic, not a georeferenced operational chart. (b) Airport allocation s and demand composition m jointly determine the resource requests placed on runways and shared corridors. (c) Responses are evaluated through local conditional transitions, redistribution contrasts and resource diagnostics. Blue, teal and purple identify ZBAA, ZBAD and ZBTJ, respectively; solid blue-grey, solid grey and dashed brown lines identify shared, NORTH-only and SOUTH-only procedures.
Within the evaluated model, the response was not invariant. Equal share changes were asymmetric, and one Beijing Capital response was strictly negative at one end of the composition range but strictly positive at the other. Finer search brackets, three independent seed families, 100 score-neutralized controls and direct resource perturbations separated this interaction from the expected average ordering of the capacity-aware composition axis. The central contribution is not that a deliberately higher-pressure composition performs worse on average. Rather, it is that the response to a fixed airport-share intervention depends on the complete resource chains carried by demand, with both runway and corridor constraints able to control boundary feasibility. All claims remain local to one engineering baseline, the evaluated search range and the specified model rules; they are not official capacity values or calibrated predictions of an operating day.
2. Materials and Methods
The experiment separates two interventions that are often conflated: where demand is allocated and which complete runway–corridor chains it uses. It asks whether a fixed airport-share change retains the same capacity response when composition changes. Every scenario was evaluated using the same network model, and the outcome is finite-search evidence rather than a claim of physical capacity.
2.1. Coupled Terminal Network and Response Estimand
Let denote the airports and the resources in a coupled terminal network. Let denote the two required operating states. The resource set contains airport-local runways and transfer corridors that may be shared by several airports. Total demand T, airport-allocation vector s, complete resource-chain composition m and operating state determine the no-wait request stream at each resource r. The stream records which resources are requested and when; it is not treated as an estimated statistical mediator.
For airport i, let be full-day mean constraint delay and the mean over its declared peak window. State-level feasibility is
where and denote the declared full-day and peak-window delay limits, respectively. and the theoretical joint conditional frontier is
Because the generated scenarios need not be globally nested or monotone in T, the experiment does not claim to observe directly. Instead, it reports a passing lower anchor, a local passing-to-failing interval or a right-censored lower bound. The estimand is the share-induced change in this model-conditional target and the invariance of that finite-search response across composition levels.
2.2. Beijing–Tianjin Case and Baseline Demand
The case network comprises Beijing Capital (ZBAA), Beijing Daxing (ZBAD) and Tianjin Binhai (ZBTJ) airports under fixed NORTH and SOUTH operating states. Departures requested a runway followed by a transfer corridor; arrivals used the reverse order. Figure 1a shows the corresponding runway–route–corridor topology. The operating states are overlaid only for orientation and were evaluated separately. Exact topology and operational identifiers are retained in the full reproduction package; the schematic suppresses them for legibility. Sector entries serve only as hotspot diagnostics and do not control capacity in the simulator.
The upstream assessment used the Summer 2023 (S23) seasonal schedule under routine instrument flight rules (IFR) operations without adverse-weather restrictions. NORTH and SOUTH contained 2665 and 2664 records; we retained their 2664 common units—1128 at ZBAA, 990 at ZBAD and 546 at ZBTJ—with complete resource chains. These are schedule-based units, not matched physical flights. Scaling preserved 934 strata and existing route templates. This input is a representative seasonal capacity-assessment schedule, not a log of one realized operating day. It therefore has neither a unique operating date nor an observed delay-residual series; the analysis tests a model-based capacity response rather than trajectory reproduction or day-specific reliability.
2.3. Separately Controlled Allocation and Composition Interventions
With , each demand total was , where denotes rounding to the nearest integer with exact half-values rounded upward. The design included the baseline shares and six local counterfactuals. In each counterfactual, one airport gained or lost five percentage points while the other two absorbed the change in proportion to their baseline shares. These are directional contrasts, not a continuous dose–response curve or transfers of identified flights.
Within each share-specific population, five composition levels reassigned complete paired categories inside the baseline schedule support; preserved the baseline. Before simulation, corridor pressure in state and natural hour h was scored as
where is the no-wait request count and the natural-hour quota. Standardized paired-state scores directed moves toward lower pressure for relief compositions and toward higher pressure for concentration compositions. No release time, simulated delay, binding event, feasibility label or search result entered the score. The ordering of the axis was therefore designed; it was not a result. The scientific contrast is the heterogeneity of a fixed share response along that common axis.
At , the inner and outer levels moved 133 (4.99% paired-category half-) and 266 (9.98%) units, respectively. The same prespecified construction rule was applied within every share-specific population. Equal m therefore denotes the same algorithm and dose, not identical realized resource-request vectors. Joint three-airport projection preserved fixed margins, complete category support and shared-corridor limits. Supplementary Methods S1 and S2 provide the integerization, tie-breaking, projection and constraint checks.
2.4. Rule-Preserving Discrete-Event Model
An integer-second discrete-event model propagated delay through each unit’s ordered resource chain. It represented 24 resolved runway departure-release dependencies and 34 state-specific transfer points with stable first-come, first-served (FCFS) queues. Left-closed, right-open natural-hour quotas admitted 20 movements at ordinary A points, 24 at A4 and 30 at D points. When a window was full, release was postponed instead of imposing a uniform headway. A4 denotes a state-specific shared transfer corridor used by demand from more than one airport. The 20/24/30 values were provided jointly by three shift supervisors at the Beijing terminal control centre, North China Air Traffic Management Bureau. All were active senior air traffic controllers with experience in terminal control and flow management, and all had served as invited experts in airport capacity assessments. They reconciled the values with the controller-validated 2025–2026 simulation model and resource-quota tables for the representative all-NORTH configuration, including its AirTOP v2.3.29B54 implementation (Transoft Solutions Inc., Vancouver, BC, Canada; https://www.transoftsolutions.com/emea/aviation/software/airport-airspace-fast-time-simulation/airtop-overview/, accessed on 26 August 2026). AirTOP was used only to cross-check the operational input records; it did not generate the simulation results reported in this study. This configuration was used because it is the prevailing routine configuration of the Beijing–Tianjin three-airport system. The values matched the configuration tables, and the same experts confirmed during manuscript preparation that they had not changed. Such presets normally remain stable unless the airspace or route structure changes materially. They are case inputs rather than universal capacities, outcome-fitted parameters or external validation of the present model. They represent routine IFR capacity-assessment conditions. Adverse weather, degraded equipment and other abnormal restrictions define a different operational-capacity problem and are outside the estimand. Unresolved spatial rules were excluded rather than imputed. These inputs are scenario constraints, not universal resource classes or official capacity declarations (Supplementary Methods S3). Stable FCFS is the documented queue discipline; it is not claimed to reproduce every tactical sequencing decision made by controllers.
2.5. Feasibility Thresholds and Finite Transition Search
We set s for full-day mean constraint delay, following the effective Civil Aviation Administration of China (CAAC) guidance AP-93-TM-2017-01 for airport slot capacity assessment [1]. The additional s peak-window safeguard was also specified before the experiment. Its scale was informed by the 2024 consultation draft criterion that mean delay within a natural hour should not exceed 15 min. Our declared peak windows are longer than that natural-hour statistic, and the draft is not an effective standard [2]. The combined rule is therefore a conservative study-specific feasibility screen, not an official CAAC capacity determination or a fitted delay target.
For queried totals , we recorded
For the queried set, is the exact local transition region between the highest passing total and the nearest higher failing total. It is not a confidence interval. In journal-facing tables, figures and contrasts, we report the same two observed endpoints as the closed conservative endpoint envelope . The closing bracket preserves the failing endpoint in the display and does not imply that passed. The prespecified core search covered –1.40 and refined each passing-to-failing transition to at most 0.01 in the multiplier (approximately 27 flights). All six deterministic cells that remained right-censored after the core search were subsequently queried under the unchanged generator and feasibility rules over –1.80; no other deterministic cell was extended, and no cell was selected according to the direction or magnitude of its response. Treatment–baseline contrasts propagated both endpoints, and a censored endpoint supported only a one-sided bound.
The stochastic layer added keyed, zero-centered triangular perturbations to airport-hour readiness, individual readiness and inter-resource duration. The central envelope used half-widths of 600 s, 300 s and 10%, respectively; narrower and wider envelopes were sentinels. Queried probabilities began with 100 repetitions and increased by 50 to at most 200 only when the prespecified Wilson-interval rule required it. The same replicate set supported . Because no observed residual series was available for calibration, these probabilities measure expert-bounded model sensitivity rather than operational reliability (Supplementary Methods S4 and S5).
2.6. Targeted Confirmation, Neutral Controls and Mechanism Probes
The targeted confirmation concerned ZBAA percentage points at the two outer compositions. Each queried probability used three independent seed families with 500 paired repetitions per family. Common random numbers paired a baseline and ZBAA within each family. We formed one binary baseline-minus-treatment difference for each pair and resampled these paired differences with replacement separately within each family, holding every family at 500 pairs. Each of 10,000 bootstrap statistics was the equally weighted mean of the three resampled family means. The reported 95% interval is the empirical percentile interval from the ordered bootstrap statistics, not a basic or BCa interval. We also reported the pooled contrast and all three family means. The bootstrap summarizes Monte Carlo stability; it does not turn a finite-search interval into a physical-capacity confidence interval.
To test whether pressure labeling alone mechanically produced the observed interaction, 100 neutral controls permuted the exact category-level pressure scores within fixed strata. Each control preserved the score multiset, support and move budget. Each permutation was reused across the compared shares, totals and composition doses, and failed or censored controls would have been retained without replacement. The resulting reference-tail proportions are descriptive controls, not randomization p-values.
Mechanism probes covered seven prespecified cells: five with original local pass-and-fail anchors and two right-censored cells with the original feasible anchor only. At each eligible anchor, we applied corridor tightening , corridor relief , 10% runway-separation relief with half-up integer-second rounding, and joint runway–corridor relief. The doses are diagnostic interventions rather than equivalent physical investments. An A4-specific matched resource comparator used a pre-outcome deterministic nearest match among ordinary A resources on request count, request share, load-to-quota ratio, requesting-chain count and path exposure. A4 was compared with the matched ordinary-A intervention without using feasibility outcomes for the match (Supplementary Methods S7–S9).
2.7. Resource Diagnosis and Reproducibility
Controlled runways and corridors were compared using three diagnostics: delay share at , binding frequency and the aggregate transition-delay increment
Here, is the total constraint delay attributed to resource r at demand total T.
Relative to the same-allocation , leader change required the same new resource to lead at least two diagnostics. No resource, including A4, was preselected. The increment is neither a derivative nor a per-flight effect.
Independently calculated runway cases, quota-boundary tests, delay-conservation checks and zero-perturbation comparisons were used to assess internal consistency. Demand generation preserved the specified totals and rejected invalid inputs without imputation. The primary crossed experiment used 21,161 simulation runs. Separate confirmation, neutral-control, mechanism and censoring analyses used a further 173,154 runs under the configurations and seeds reported here.
The reported computations used CPython 3.10.13 (Python Software Foundation, Beaverton, OR, USA; https://www.python.org/, accessed on 26 August 2026), as documented in Supplementary Method S10. The standalone Supplementary Software, which reruns eight boundary cases and reconstructs the reported response intervals without requiring the full experiment, was independently verified with Python 3.11 on Windows. The complete archive contains the research FlightPlan, paired mother population, real identifiers, selected topology, source code, model specifications, seeds and result tables. It is publicly available on Zenodo version 1.0.2 at https://doi.org/10.5281/zenodo.22070271 [25]. Data and documentation use CC BY 4.0, and the source code uses the MIT License. The archive does not provide external operational validation (Supplementary Method S10).
2.8. Experimental Design
The main experiment crossed seven airport allocations with five composition levels under NORTH and SOUTH, yielding 35 deterministic cells. The stochastic core retained all seven allocations at , and , yielding 21 central-envelope cells. All three probability thresholds were estimated from the same repetitions; was the central display level, not a post hoc selection. A same-composition response compared the same algorithmic intervention level within each share-specific population and did not assume identical realized request vectors.
The targeted confirmation, controls and mechanism probes addressed distinct threats to interpretation. The three-family paired experiment tested whether the ZBAA sign pattern survived Monte Carlo variation. Neutral score permutations asked whether pressure labels alone could generate an interaction of similar magnitude. Resource relief and tightening tested whether runway and corridor controls changed boundary feasibility, while the matched A4 comparison distinguished the selected shared corridor from a similarly exposed ordinary A resource. Six targeted searches closed the previously right-censored deterministic brackets. A static reclassification of stored probability outcomes then tested sensitivity to the daily and peak delay thresholds without rerunning the simulator.
All outcomes from the prespecified core experiment, including adverse signs, empirical probability inversions, absent leadership changes and failed feasibility states, were retained. Core search ranges, repetition counts, pairings, and mechanism denominators were fixed before core execution. After the core search exposed exactly six right-censored deterministic cells, the common extension range and stopping rule were fixed before any extension query. Every censored cell was extended, with no selection by response direction or magnitude. This study did not randomize real traffic or estimate a population-average causal effect. Its contrasts are controlled interventions within the specified model and baseline schedule support.
3. Results
The crossed response surface departed from a simple spare-capacity story in two ways: equal reallocations were not mirror images, and the ZBAA response changed sign with composition. Independent seed families, neutral composition controls and direct resource interventions then tested that reversal. Targeted extension closed the original censoring gaps, and stored outcomes quantified sensitivity to alternative delay thresholds.
3.1. Composition Changes the Local Transition, but Not by a Constant Amount
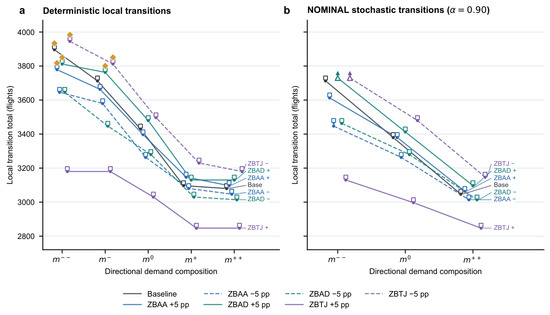
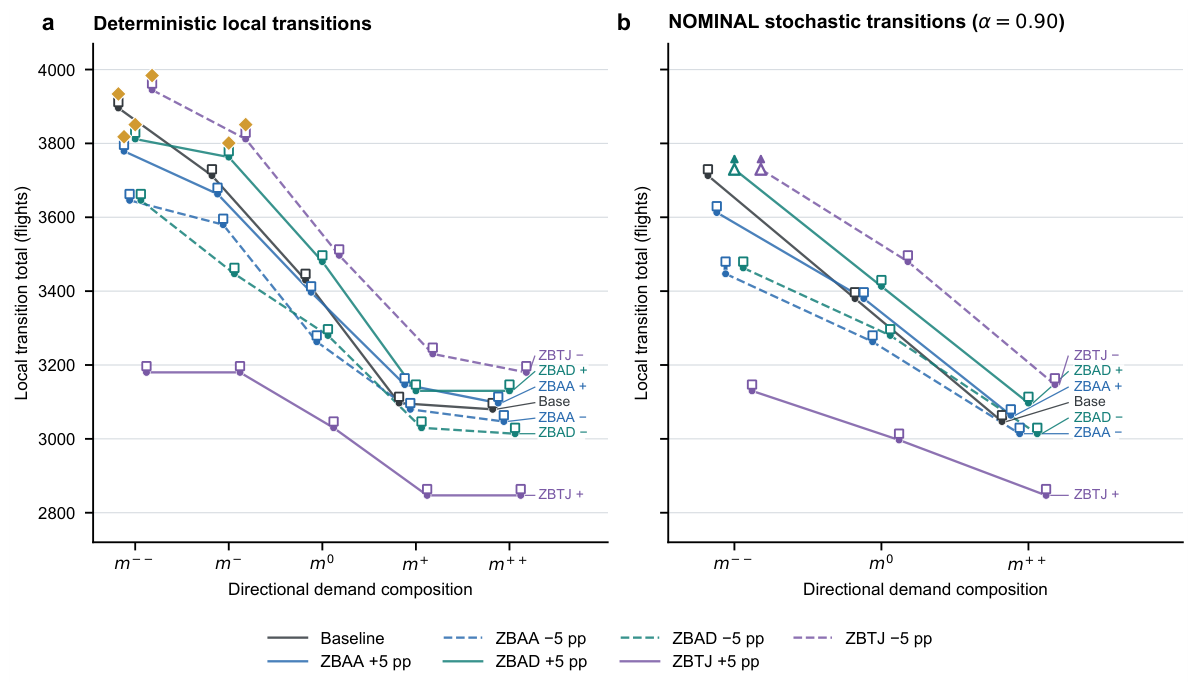
At baseline shares, the lower endpoints of the completed deterministic local transition brackets were 3896 flights at , 3430 at and 3080 at (Figure 2a). The bracket, , was obtained only through the targeted extension; the original core search provided the right-censored feasible anchor of 3730 flights.
Figure 2.
Airport shares and runway–corridor composition jointly reshape the reported local transitions. (a) Deterministic local passing-to-failing transition intervals across seven airport allocations and five composition levels. (b) Corresponding stochastic intervals at for the three core composition levels. Circles and squares denote lower and upper transition endpoints. Gold diamonds mark the six brackets completed by the targeted extension. Triangles and arrows retain stochastic right-censoring. Both NORTH and SOUTH must pass. Closed line segments retain the observed passing and failing endpoints as conservative display envelopes for the exact queried transition regions . All values are finite-search, model-conditional quantities.
At the central stochastic display level , the corresponding lower anchors were 3713, 3380 and 3047 flights (Figure 2b), giving a 666-flight outer lower-anchor difference. Across the seven airport allocations, this stochastic outer difference ranged from 283 to 666 flights, a 383-flight range. These are differences between finite-search lower anchors, not exact physical-capacity gaps. Because the composition axis was ranked beforehand by no-wait request-to-quota pressure, poorer average performance at its high-pressure end was expected by design. What was not imposed was the allocation-dependent variation in that difference or the direction of any share-response contrast.
3.2. Equal Share Changes Are Not Mirror Images
At baseline composition, equal five-percentage-point increases and decreases did not produce opposite responses of equal magnitude (Figure 3a). Increasing ZBTJ share reduced the reported local transition by 366–400 flights, whereas decreasing it raised the transition by 83–117 flights. Increasing ZBAD produced a positive interval of 16–50 flights, while decreasing it produced a negative interval of to flights. For ZBAA, the -point interval of to 17 flights included zero, whereas the -point interval was strictly negative at to flights. These propagated search intervals describe the specified local interventions; they are not general airport-size effects.
3.3. The ZBAA Response Changes Sign Across Compositions
The targeted search resolved the previously right-censored ZBAA contrast. At = 0.90, the finite-search response to a five-percentage-point increase in the ZBAA share was flights under , at and under (Figure 3b). Endpoint-wise interval propagation of the two outer finite-search response brackets yields the conservative interaction interval
This interval propagates finite-search brackets and is not a confidence interval.
The same direction change appeared in paired stochastic outcomes. At the low-pressure diagnostic total of flights, the baseline-minus-treatment success probability difference was 0.1707, with a stratified paired-bootstrap 95% percentile interval of . At the high-pressure diagnostic total of flights, the difference was , with an interval of . All three independent seed families agreed in direction: 0.146, 0.198 and 0.168 under , and , and under (Figure 3c). The sign pattern therefore did not depend on a single random-number realization.
Figure 3.
Equal share changes are asymmetric, and the ZBAA response changes direction with composition. (a) Five-percentage-point share responses at , reported as conservative endpoint envelopes. (b) At , the ZBAA -point response changes from negative at to positive at ; horizontal bars propagate local transition brackets. (c) Paired baseline-minus-treatment success probability differences for three independent seed families and the pooled stratified bootstrap. Open circles denote seed-family means; the filled marker and interval denote the pooled mean and stratified paired-bootstrap 95% percentile interval at flights for and flights for . Positive values mean the ZBAA increase lowers success; negative values mean it raises success. Closed brackets in panels (a,b) retain both observed endpoints; the upper endpoint is the first queried failing total, not a passing value.
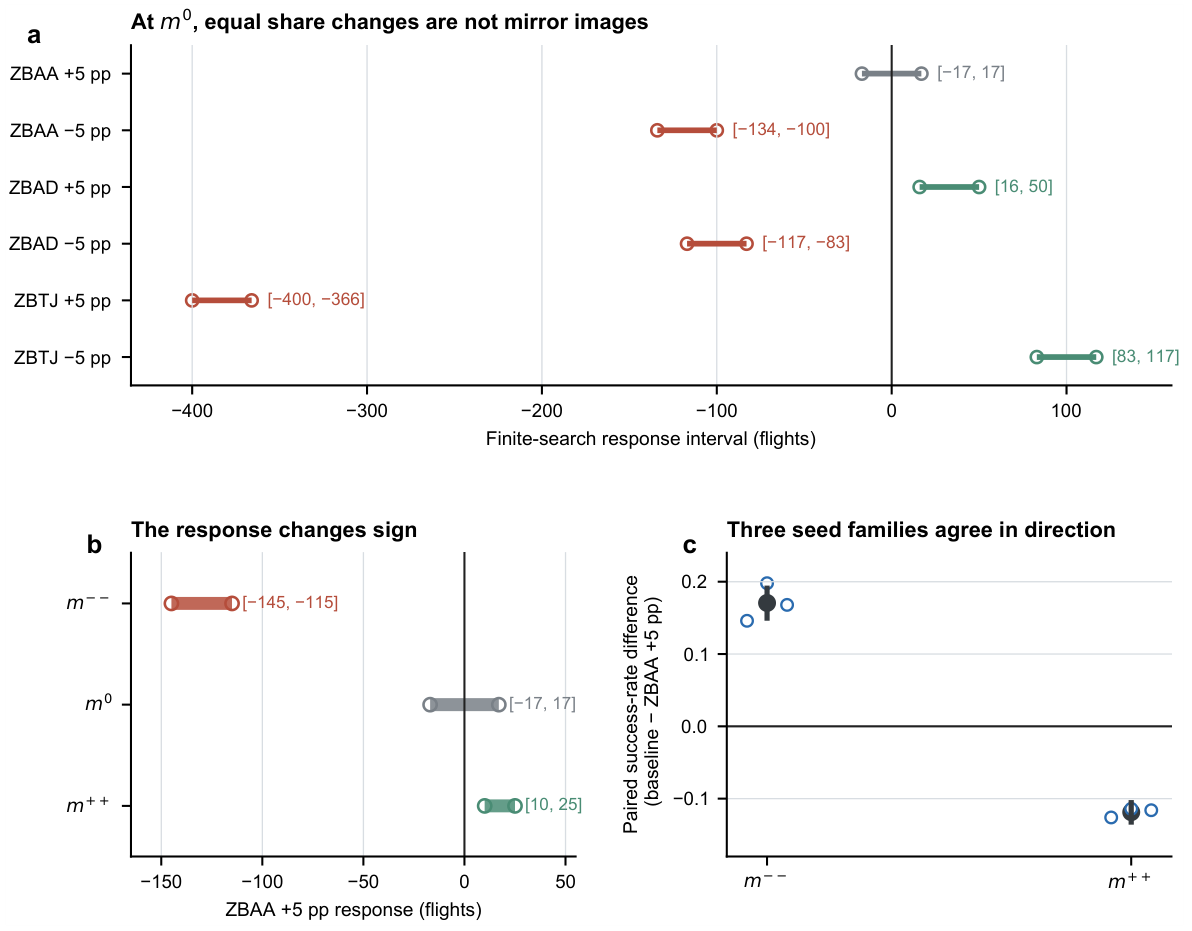
Table 1 summarizes the targeted search responses and pooled paired contrasts.
Table 1.
Targeted confirmation of the ZBAA -percentage-point response at . Search responses are closed conservative endpoint envelopes obtained by propagating baseline and treatment transition endpoints; the upper endpoint in each underlying bracket is the first queried failing total. Probability differences are baseline minus treatment at the listed total T. Family-specific means are reported in the Results section and Figure 3c; this table reports the pooled paired contrasts.
3.4. Neutral-Control Interaction Distribution
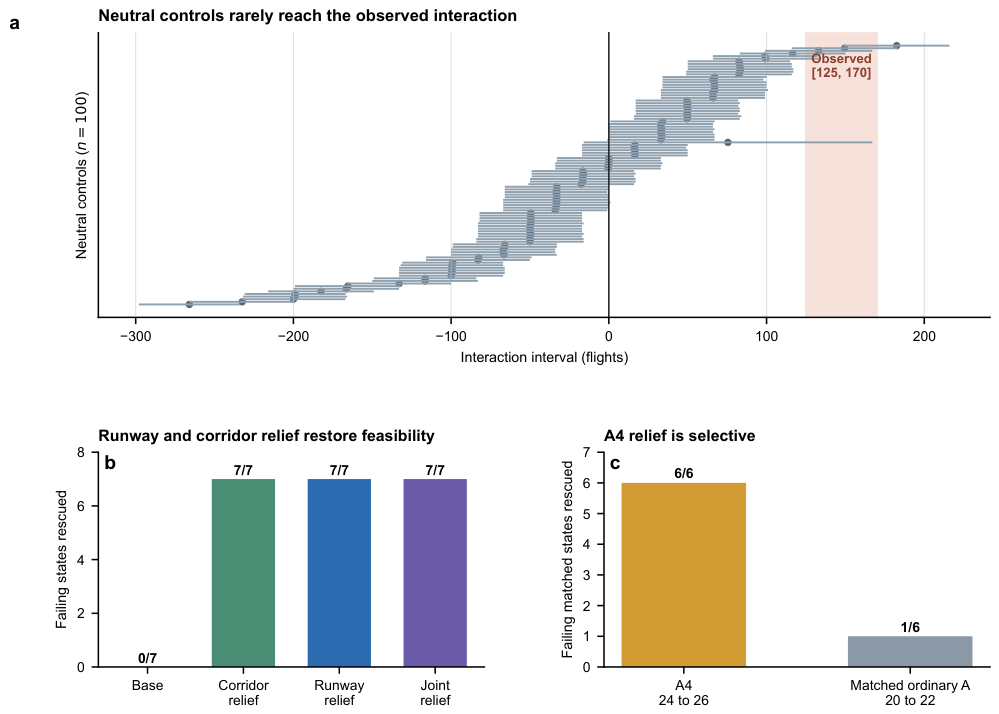
All 100 neutral pressure-label controls produced finite interaction intervals. None met the certain-tail criterion for the observed -flight band, while seven met the possible-tail criterion by overlap (Figure 4a). We report these outcomes as 0/100 certain-tail and 7/100 possible-tail proportions from score-neutralized composition labels, not as a randomization test of real traffic or a p-value. Across the 100 controls, the lower endpoints had a median of flights and 5th/95th percentiles of /66 flights; the corresponding upper-endpoint summaries were 17 and /133.85 flights (Supplementary Table S11). These distributional summaries make the separation from the observed band visible without assigning a null-randomization interpretation to the controls.
Figure 4.
Neutral controls and direct interventions distinguish the interaction from label construction and show coupled resource control.(a) Interaction intervals from 100 score-neutralized controls relative to the observed -flight band. A control was classified as certain-tail when its lower endpoint was at least 170 flights and as possible-tail when its upper endpoint was at least 125 flights; the counts were 0 and 7, respectively. Endpoint medians and 5th/95th percentiles are reported in Supplementary Table S11. (b) Rescue outcomes for the seven operating-state failures observed at the failing anchors of the five complete two-anchor cells. The two one-sided cells contributed only feasible-anchor tightening tests and are not included in this seven-state rescue denominator. (c) A4 relief versus pre-outcome matched ordinary-A relief; eight comparisons were defined and six baseline states failed. Counts are state-level diagnostic outcomes under the specified model, not field estimates of infrastructure benefits.
3.5. Runway and Corridor Interventions Both Control Boundary Feasibility
Direct mechanism probes implicated the coupled resource chain rather than a single universal bottleneck. Across the seven observed failing operating-state boundary cases, corridor relief, runway relief and their joint application each restored feasibility in 7/7 cases (Figure 4b). Conversely, corridor tightening made all 10 operating states at the five complete feasible anchors fail and made 3 of 4 states at the two one-sided feasible anchors fail. The corridor and runway doses are not physically commensurate, so these counts establish qualitative control, not an effect-size ranking between infrastructure actions.
A4 supplied a more selective secondary mechanism. In the six baseline states that actually failed among the eight pre-outcome matched comparisons, raising the A4 hourly quota from 24 to 26 restored feasibility in 6/6. Raising the matched ordinary-A quota from 20 to 22 restored only 1/6 (Figure 4c). This comparison strengthens the evidence that A4 can matter in selected boundary states, but it does not make A4 the common cause of the ZBAA interaction. The all-resource leader diagnosis is retained in Supplementary Figure S4. The prespecified diagnostic used the original anchors: 28 high-pressure comparisons were displayed, 16 additional low-pressure comparisons were evaluable, and 12 comparisons lacked an original higher failing anchor. Thus, 44/56 comparisons were evaluable and 8/44 met the generic two-of-three leader-change rule; all eight occurred among the displayed 28. A runway remained the binding-frequency leader in every such comparison. The later censoring extension closed six parent-cell search gaps but did not retrospectively replace the prespecified diagnostic anchors.
3.6. Targeted Extension Closes the Six Original Censoring Gaps
All six deterministic cells that had remained feasible at were bracketed before under the unchanged feasibility rule (Supplementary Figure S5 and Table S9). Their local passing-to-failing brackets were 3896–3912, 3779–3796, 3812–3829, 3763–3779, 3945–3962 and 3812–3829 flights. No generator-domain truncation, technical failure or non-monotone transition occurred. The extension converts the former right-censored reports into local brackets; it does not prove that the entire demand–performance relationship is globally monotone.
3.7. Capacity Classification Is Threshold-Sensitive
We reclassified 151 unique stored stochastic probability points over three daily delay thresholds (360, 480 and 600 s) and three peak-delay thresholds (720, 900 and 1080 s). The resulting 1359 point–threshold classifications produced markedly different feasible sets (Supplementary Figure S6). At the study rule of 480/900 s, 67 points passed, 48 failed and 36 remained interval-ambiguous. Across the full grid, pass counts ranged from 7 to 146 and fail counts from 2 to 135. A 720 s peak condition dominated the classification regardless of the daily threshold. By contrast, a 1080 s peak condition admitted most points when the daily threshold was 480 or 600 s. The reported response is therefore conditional on an explicit regulatory-anchored screen, not a threshold-free capacity law.
4. Discussion
Moving demand between airports is often framed as transferring load from a congested facility to one with spare capacity. The model experiments show why that description is incomplete in a coupled terminal area. The intervention also changes which runway–corridor chains carry that demand through the surrounding network. Once those two dimensions were separated in the experiment, the response to a fixed airport-share change was neither symmetric nor composition-invariant.
4.1. The Relevant Unit Is the Airport–Resource System
Airport-capacity envelopes are known to depend on traffic mix, runway configuration and service rules [3,5]. Metroplex studies further show that neighboring airports interact through shared airspace and propagated congestion [9,10,11,12]. Our result links these strands at the intervention itself. An airport allocation is not merely a vector of airport shares; it also carries a distribution of complete resource requests. Spare capacity at a receiving airport is useful only if those requests can pass through the coupled network without activating a tighter constraint.
The sign-changing ZBAA contrast is therefore more informative than the expected decline from the low- to high-pressure end of the composition axis. The axis was deliberately ordered with pre-simulation request-to-quota information, so its mean ordering is not a discovery. The response reversal, however, was not encoded by that score. It retained the same sign pattern across three independent seed families and a stratified paired bootstrap. The 100 score-neutralized controls and direct runway–corridor interventions addressed alternative construction and mechanism explanations. Together, these checks weigh against a purely circular “high pressure causes lower capacity” reading. The finding instead concerns how the same share intervention changes response along a fixed common-rule axis.
4.2. What the Mechanism Evidence Establishes
The intervention tests support coupled control but not a unique universal bottleneck. Corridor relief and runway relief each rescued all seven failing operating-state boundary cases, while corridor tightening destroyed feasibility at nearly every tested feasible state. Because the runway and corridor doses are expressed in different operational units, the experiment does not rank their infrastructure value. Rather, it establishes that changing either part of the chain can move a local feasibility boundary.
A4 has a narrower role. Its quota relief rescued six failing matched states, whereas comparable relief at a pre-outcome matched ordinary-A resource rescued one. This is stronger evidence than simply observing A4 near a failed local transition. Still, A4 was not the sole or universal mechanism: only selected comparisons showed A4 delay leadership, and a runway remained the binding-frequency leader. These diagnostics measure different aspects of the same queueing process: binding frequency counts direct release constraints, whereas delay share and transition-delay increment accumulate the burden after activation. A corridor can therefore bind fewer events yet retain affected traffic long enough to lead cumulative delay. This reconciles selective A4 delay leadership with runway leadership in binding frequency. The supported interpretation is a coupled runway–corridor mechanism with an A4-specific secondary pathway in selected states.
4.3. Relationship to Capacity-Assessment Guidance
Capacity assessment and day-specific calibration answer different questions. AP-93-TM-2017-01 uses a typical-busy-day baseline, profile-preserving demand variation, simulation and an acceptable average-delay criterion [1]. The representative S23 schedule and 480 s threshold anchor this study to that framework. The unresolved question is which resource-chain composition accompanies reallocation and whether the response is stable to that choice. The 2024 consultation draft moves toward airport-group and representative-share considerations. This development reinforces the practical relevance of the question, but it does not make the present model an official group-capacity assessment [2].
The assessment target is routine capacity under the declared IFR conditions and in the absence of adverse-weather restrictions. Severe weather, equipment degradation and exceptional restrictions define a different estimand; their exclusion sets the application domain rather than implying failed routine-capacity calibration.
This distinction also explains the status of the 900 s peak safeguard and the stochastic layer. The peak rule prevents acceptable daily averages from hiding concentrated delay, and the sensitivity grid shows that it materially affects classification. The random perturbations then test whether the response survives a declared disturbance envelope. Neither component was calibrated from observed residuals, so neither supports a claim about day-specific reliability. They strengthen a model-based capacity-response experiment rather than convert it into operational validation.
4.4. Implications for Multi-Airport Assessment
An allocation study should report more than one capacity value under one assumed traffic mix. At minimum, it should expose the airport-share response over plausible resource-chain compositions, retain local transition brackets and censoring, and state the delay thresholds on which feasibility depends. This turns a seemingly intrinsic airport effect into a conditional response surface that can be checked against operational assumptions.
The practical lesson is not that the ZBAA direction found here should be implemented. Rather, it is that a reallocation recommendation based only on apparent airport headroom can produce an opposite model-estimated response when its runway and corridor exposure changes. Screening candidate reallocations through the coupled resource network is therefore a prudent intermediate screen before an operational trial or official capacity determination.
4.5. Limits and Transportability
The evidence has a deliberately narrow empirical scope. Demand support came from one representative S23 schedule-based assessment baseline under routine IFR operations without adverse-weather restrictions, not from a dated record of realized trajectories. Because observed delay residuals were not part of that input, the stochastic probabilities are not calibrated reliability estimates. The share interventions were local -percentage-point changes under two fixed operating states and a specified fast model, with no comparison against an external simulator or live operations. The six extended cells provide local brackets before ; they do not establish a globally monotone frontier.
These limits constrain transportability, not the internal question answered by the crossed experiment. The next empirical test should repeat the same response-invariance design on multiple dated operating days with matched trajectories and observed delay residuals. It should also use independently defined composition strata and other coupled terminal systems. Agreement across those settings would be needed before the model-interventional pattern could be discussed as a broader operational regularity.
5. Conclusions
Multi-airport reallocation acts on a coupled airport–resource system. In the three-airport model, increasing the ZBAA share by five percentage points produced a finite-search response of flights under the lower-pressure composition but under the higher-pressure composition. The propagated interaction interval was flights. Independent seed families, neutral composition controls and direct resource interventions supported the interpretation that the response depends on the complete runway–corridor chains carried by demand. Both runway and corridor interventions controlled the tested boundary states; A4 supplied a selective secondary mechanism rather than a universal bottleneck.
Capacity assessment should therefore test the stability of an airport-share response across plausible resource-chain compositions instead of treating airports as independent capacity pools. The result is conditional on the baseline schedule support, operating states, thresholds and specified model. It is not an official capacity estimate, an external simulator validation or a calibrated model of live operations. Its contribution is the response-invariance test itself. The test identifies when an apparently simple traffic redistribution changes meaning once the surrounding resource network is taken into account.
Supplementary Materials
The following supporting information can be downloaded at https://www.mdpi.com/article/10.3390/aerospace13090766/s1: Supplementary Methods S1–S10: demand support, scaling and the crossed intervention; pre-control pressure and joint composition projection; controlled-resource model; feasibility estimand and finite-search reporting; stochastic sensitivity and probability decision rule; all-resource leadership diagnostic; paired confirmation and neutral controls; resource interventions and the A4 matched comparator; censoring closure and threshold sensitivity; and computational reproducibility. Table S1: Airport-share vectors for the seven allocation settings; Table S2: Composition levels and baseline-scale move budgets; Table S3: Composition-treatment dose and structural request exposure at the common reference total across the seven airport allocations; Table S4: Mechanisms represented in the simulator and the boundary of their interpretation; Table S5: Pooled probability records defining the revised ZBAA five-percentage-point finite-search responses at ; Table S6: Prespecified LOW/HIGH stochastic-sensitivity sentinels at the baseline-allocation deterministic anchors; Table S7: Fixed-total diagnostics for the ZBAA five-percentage-point response under the two outer composition levels; Table S8: Complete 56-cell mechanism-evaluability matrix; Table S9: Targeted deterministic extension of the six cells that were right-censored at the original boundary; Table S10: De-identified state-specific runway-release separation matrix used by the simulator; Table S11: Distributional summary of 100 finite neutral-control interaction intervals; Figure S1: The allocation response remains composition-dependent across levels; Figure S2: Wider disturbances reduce reported joint success; Figure S3: Censoring and local empirical probability inversions were retained; Figure S4: All-resource leadership diagnostic at the original prespecified anchors; Figure S5: Targeted extension closes the six original deterministic censoring gaps; Figure S6: Feasibility classification depends on the declared daily and peak delay limits; Supplementary Data; and Supplementary Software.
Author Contributions
Conceptualization, M.D. and C.L.; methodology, C.L. and B.J.; software, C.L. and Y.H.; validation, C.L., Y.P. and B.J.; formal analysis, C.L.; investigation, M.D. and Y.P.; resources, M.D.; data curation, Y.H.; visualization, Y.H.; writing—original draft preparation, M.D., C.L. and Y.H.; writing—review and editing, M.D., C.L., M.H., Z.Z., Y.P. and B.J.; supervision, M.H., Z.Z. and B.J.; project administration, M.D., M.H. and Z.Z.; funding acquisition, M.H. All authors have read and agreed to the published version of the manuscript.
Funding
This research was funded by the National Natural Science Foundation of China, grant number 52472345; the Key Program of the National Natural Science Foundation of China, grant number 52532010; the National Key R&D Program of China, grant number 2022YFB2602401; and the Interdisciplinary Innovation Fund for Doctoral Students of Nanjing University of Aeronautics and Astronautics, grant number KXKCXJJ202404.
Institutional Review Board Statement
Not applicable. This study involved no human participants or animals.
Informed Consent Statement
Not applicable.
Data Availability Statement
The source tables, reconstruction index, research inputs, selected topology, source code, model specifications, seeds, complete result tables and standalone Supplementary Software are publicly available in Zenodo version 1.0.2 at https://doi.org/10.5281/zenodo.22070271 [25]. The record includes the principal reproduction package and the standalone Supplementary Software. Data and documentation use CC BY 4.0, and the source code uses the MIT License. The archive supports model-conditional computational reproducibility, not day-specific trajectory validation, calibrated operational reliability or an official capacity determination.
Acknowledgments
ChatGPT was used for language editing.
Conflicts of Interest
Author Du Maowei was employed by the Capital Airports Holdings Co., Ltd., Beijing. The remaining authors declare that the research was conducted in the absence of any commercial or financial relationships that could be construed as a potential conflict of interest.
References
- Civil Aviation Administration of China. Technical Specification for Airport Slot Capacity Assessment. Technical Report AP-93-TM-2017-01, Civil Aviation Administration of China, 2017. Effective Regulatory Guidance; Chinese Title: Jichang Shike Rongliang Pinggu Jishu Guifan. Available online: https://www.caac.gov.cn/XXGK/XXGK/GFXWJ/201705/t20170510_44023.html (accessed on 22 August 2026).
- Civil Aviation Administration of China. Technical Specification for Airport Capacity Assessment: Consultation Draft. Technical Report, Civil Aviation Administration of China, 2024. Public Consultation Draft Released 26 March 2024; Not Cited as an Effective Mandatory Standard. Available online: https://www.caac.gov.cn/PHONE/HDJL/YJZJ/202403/t20240326_223314.html (accessed on 22 August 2026).
- Gilbo, E.P. Airport capacity: Representation, estimation, optimization. IEEE Trans. Control Syst. Technol. 1993, 1, 144–154. [Google Scholar] [CrossRef]
- Gilbo, E.P. Optimizing airport capacity utilization in air traffic flow management subject to constraints at arrival and departure fixes. IEEE Trans. Control Syst. Technol. 1997, 5, 490–503. [Google Scholar] [CrossRef] [Scilit]
- Bertsimas, D.; Frankovich, M.; Odoni, A. Optimal Selection of Airport Runway Configurations. Oper. Res. 2011, 59, 1407–1419. [Google Scholar] [CrossRef] [Scilit]
- Jacquillat, A.; Odoni, A.R.; Webster, M.D. Dynamic Control of Runway Configurations and of Arrival and Departure Service Rates at JFK Airport Under Stochastic Queue Conditions. Transp. Sci. 2017, 51, 155–176. [Google Scholar] [CrossRef] [Scilit]
- Janić, M.; Tošić, V. Terminal airspace capacity model. Transp. Res. Part A General 1982, 16, 253–260. [Google Scholar] [CrossRef] [Scilit]
- McClain, E.; Clarke, J.P. Generic Metroplex Airspace Comparison for Shared Resource Configurations. In Proceedings of the 10th AIAA Aviation Technology, Integration, and Operations Conference, Fort Worth, TX, USA, 13–15 September 2010. [Google Scholar] [CrossRef] [Scilit]
- Atkins, S.; Capozzi, B.; Hinkey, J.; Idris, H.; Kaiser, K. Investigating the Nature of and Methods for Managing Metroplex Operations; Technical Report NASA/CR-2011-216413; NASA Ames Research Center: Moffett Field, CA, USA, 2011.
- Donaldson, A.D.; Hansman, R.J. Improvement of Terminal Area Capacity in the New York Airspace; Technical Report ICAT-2011-4; MIT International Center for Air Transportation: Cambridge, MA, USA, 2011. [Google Scholar]
- Pyrgiotis, N.; Malone, K.M.; Odoni, A. Modelling delay propagation within an airport network. Transp. Res. Part C Emerg. Technol. 2013, 27, 60–75. [Google Scholar] [CrossRef] [Scilit]
- Zhao, X.; Wang, Y.; Li, L.; Delahaye, D. A Queuing Network Model of a Multi-Airport System Based on Point-Wise Stationary Approximation. Aerospace 2022, 9, 390. [Google Scholar] [CrossRef] [Scilit]
- Wang, Y.; Liu, C.; Wang, H.; Duong, V. Slot allocation for a multiple-airport system considering airspace capacity and flying time uncertainty. Transp. Res. Part C Emerg. Technol. 2023, 153, 104185. [Google Scholar] [CrossRef] [Scilit]
- Liu, S.; Wang, S.; Hu, M.; Yang, L.; Liu, L.; Wang, Y. Allocating New Slots in a Multi-Airport System Based on Capacity Expansion. Aerospace 2024, 11, 1000. [Google Scholar] [CrossRef] [Scilit]
- Yang, L.; Wang, Y.; Liu, S.; Wang, M.; Wang, S.; Ren, Y. Multi-Airport Capacity Decoupling Analysis Using Hybrid and Integrated Surface–Airspace Traffic Modeling. Aerospace 2025, 12, 237. [Google Scholar] [CrossRef] [Scilit]
- Liu, S.; Wang, S.; Hu, M.; Yang, L. Slot Optimization Based on Coupled Airspace Capacity of Multi-Airport System. Appl. Sci. 2025, 15, 6759. [Google Scholar] [CrossRef] [Scilit]
- Liu, F.; Hu, M.; Zhang, Q.; Yang, L. Slot Allocation for a Multi-Airport System Considering Slot Execution Uncertainty. Aerospace 2025, 12, 282. [Google Scholar] [CrossRef] [Scilit]
- Ren, J.; Qu, S.; Wang, L.; Liu, C.; Ma, L.; Sun, Z. A Flight Slot Optimization Model for Beijing–Tianjin–Hebei Airport Cluster Considering Capacity Fluctuation Factor. Aerospace 2025, 12, 336. [Google Scholar] [CrossRef] [Scilit]
- Peng, Y.; Wan, Z.; Jiang, B.; Ran, L. Bi-Level Scheduling for Beijing–Tianjin-Airport Cluster Departures. Aerospace 2026, 13, 190. [Google Scholar] [CrossRef] [Scilit]
- Jiang, H.; Zeng, W.; Zhou, H.; Lu, Y.; Chen, Y.; Wei, W. Demand and Capacity Management of Runway Systems: A Review. Aerospace 2026, 13, 560. [Google Scholar] [CrossRef] [Scilit]
- Jacquillat, A.; Odoni, A.R. An Integrated Scheduling and Operations Approach to Airport Congestion Mitigation. Oper. Res. 2015, 63, 1390–1410. [Google Scholar] [CrossRef] [Scilit]
- Jacquillat, A.; Odoni, A.R. A roadmap toward airport demand and capacity management. Transp. Res. Part A Policy Pract. 2018, 114, 168–185. [Google Scholar] [CrossRef] [Scilit]
- He, P.; Pan, W. Collaborative optimization model and algorithm for airport capacity and traffic flow allocation. PLoS ONE 2024, 19, e0298540. [Google Scholar] [CrossRef] [Scilit]
- Klein, A.; Cook, L.; Wood, B. Directional Demand, Capacity and Queuing Delay in En-Route Airspace. In Proceedings of the 9th AIAA Aviation Technology, Integration, and Operations Conference, Hilton Head, SC, USA, 21–23 September 2009. [Google Scholar] [CrossRef] [Scilit]
- Du, M.; Li, C.; Hu, Y.; Hu, M.; Zhao, Z.; Peng, Y.; Jiang, B. Reproduction Package for Runway–Corridor Composition Shapes Capacity Responses to Multi-Airport Demand Reallocation, version 1.0.2; Published 24 August 2026; Data and Documentation: CC BY 4.0; Software: MIT License; Zenodo: Geneva, Switzerland, 2026.

Disclaimer/Publisher’s Note: The statements, opinions and data contained in all publications are solely those of the individual author(s) and contributor(s) and not of MDPI and/or the editor(s). MDPI and/or the editor(s) disclaim responsibility for any injury to people or property resulting from any ideas, methods, instructions or products referred to in the content. |
© 2026 by the authors. Licensee MDPI, Basel, Switzerland. This article is an open access article distributed under the terms and conditions of the Creative Commons Attribution (CC BY) license.