


Abstract
This paper develops new empirical relationships to estimate FAA/EASA- and MIL-3013B-rules-compliant landing-field performance of multi-engine transport aircraft. Widely cited textbooks date from an era when inferior tire and braking capability limited aircraft performance. Today, the use of overly pessimistic conceptual design-level performance estimates may lead concept-design teams to advocate for unnecessary engineering solutions (for example, more complex flaps) to solve “problems” which do not actually exist. Moreover, today’s aircraft designer is likely to face customer-imposed wet and/or contaminated runway performance requirements, where the classic books only discussed dry-weather operations. Taken together, the design community needs a collection of revised empirical equations to estimate landing distances for dry and wet runways. The empirical relationships published here are based upon modern flight-manual data augmented by a calibrated physics-based numerical simulation applied to a wide range of possible vehicle configurations. They offer improved accuracy, compared to earlier methods. The new method, when applied to FAA rules for aircraft operating on dry runways, predicts the substantially shorter “real-world” certified landing distances attainable by modern aircraft.
1. Introduction
“What goes up, must come down.” A successful fixed-wing aircraft must safely operate to and from “real world” runways in all sorts of weather while transporting a meaningful payload over a required distance. In practice, landing performance usually drives the aerodynamic configuration. In addition, pilots must operate their aircraft in compliance with established military or civilian regulatory standards to ensure safe flight.
Exact calculations may be made for the landing distance from a prescribed height above ground to a complete stop for defined piloting techniques if documented aerodynamic, propulsion, tire traction, and braking capability data exists. These calculations consider a sequence of motions beginning with (1) a “stabilized” (quasi-steady) final approach, followed by (2) a dynamic “landing flare” and touchdown made as the aircraft passes a defined “touchdown” point some distance from the runway threshold, (3) a de-rotation procedure to have all wheels on the ground, and finally (4) braked, deceleration to a complete stop. These calculations are sufficiently non-linear and decision tree-based, so a piecewise or time-step integration approach is needed. Since the lack of detailed aerodynamic or propulsion data often prevents such detailed simulations at the concept-design level, configurators must rely upon simpler, empirical methods.
Inaccurate field performance estimations made at the concept-design level have wide-ranging implications. For example, overly optimistic landing performance predictions lead the design team to choose simpler high-lift systems than are actually needed. When such an error becomes evident during flight test, the design team may be forced to re-engineer the flaps with a significant cost and schedule impact. Conversely, overly pessimistic landing performance predictions lead the design team to incorporate larger wings or more complex high-lift systems than needed. The consequences of inaccuracy motivate the need for accurate predictive methods.
The life cycle consequences of overly optimistic concept design-level field-performance estimates on operations are manifest. When production aircraft are flown using certified performance data, they operate with established confidence levels to ensure safe flight. However, an aircraft designed with overly optimistic landing capability may find itself “weight-restricted” into more airports than expected. Because aircraft can and do trade weight for field performance, an aircraft with a longer-than-expected certified landing distance may be required to offload considerable payload to safely operate on many desirable runways, especially in wet conditions.
Section 2 will present a broad, historical overview which finds a lack of consistency in the formulation of empirical methods. Closer examination reveals that many legacy methods are incomplete (for example, focusing only on the landing ground roll –only one contributor to the certified landing distance) or landings at speeds unlikely to be found in any modern or historical flight manual.
Section 3 of the paper describes the evolving regulatory basis controlling aircraft operations. The design community needs equations suitable for 14 CFR § 25- or CS-25-certified civilian transport category aircraft, as well as MIL-STD-3013B rules for multi-engine military aircraft. Because aircraft certification is largely “grandfathered” to the basis in effect at the date of initial design, engineers must consider the history of the relevant certification standards so that they may better interpret certified flight manual speeds and distances.
The historical details found in Section 2 and Section 3 are vital to a proper understanding of field-performance because aircraft flight manuals are typically governed by the certification basis in effect at the date of design, rather than the date of manufacture.
To assess legacy design methods, engineers must consider two separate issues: First, is the method reasonably accurate given the possible regulatory bases in effect at the date of its formulation? Second, is a given method accurate enough to apply on a modern, “clean-sheet” design operated to contemporary regulatory standards?
To highlight the motivation for this work, consider the empirical relationships found in Lan and Roskam [1]. In theory, they should be of excellent quality as they codify an empirical fit of flight-manual data first proposed by Loftin [2]. They hold that the FAA minimum “factored” landing-field length for dispatch (LDA) is estimated to be:
which implies an unfactored total landing distance over a 50 ft obstacle (LDR) of
where LDA and LDR are given in feet, and Vref is given in knots.
Based on their reputation, early editions of my own Aircraft Performance and Sizing text [3,4] reiterated the Lan and Roskam formulation [1]. Raymers’s famous texts [5,6] equally reference Loftin.
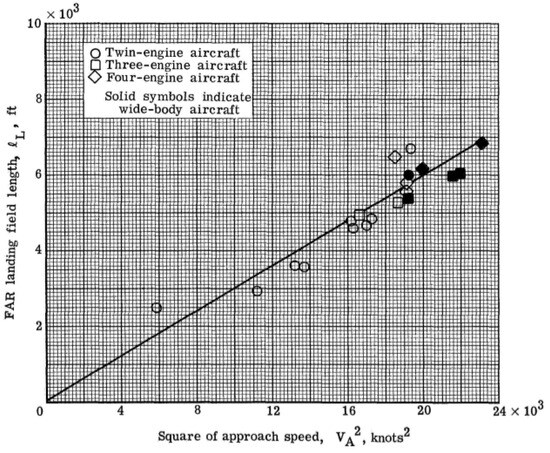
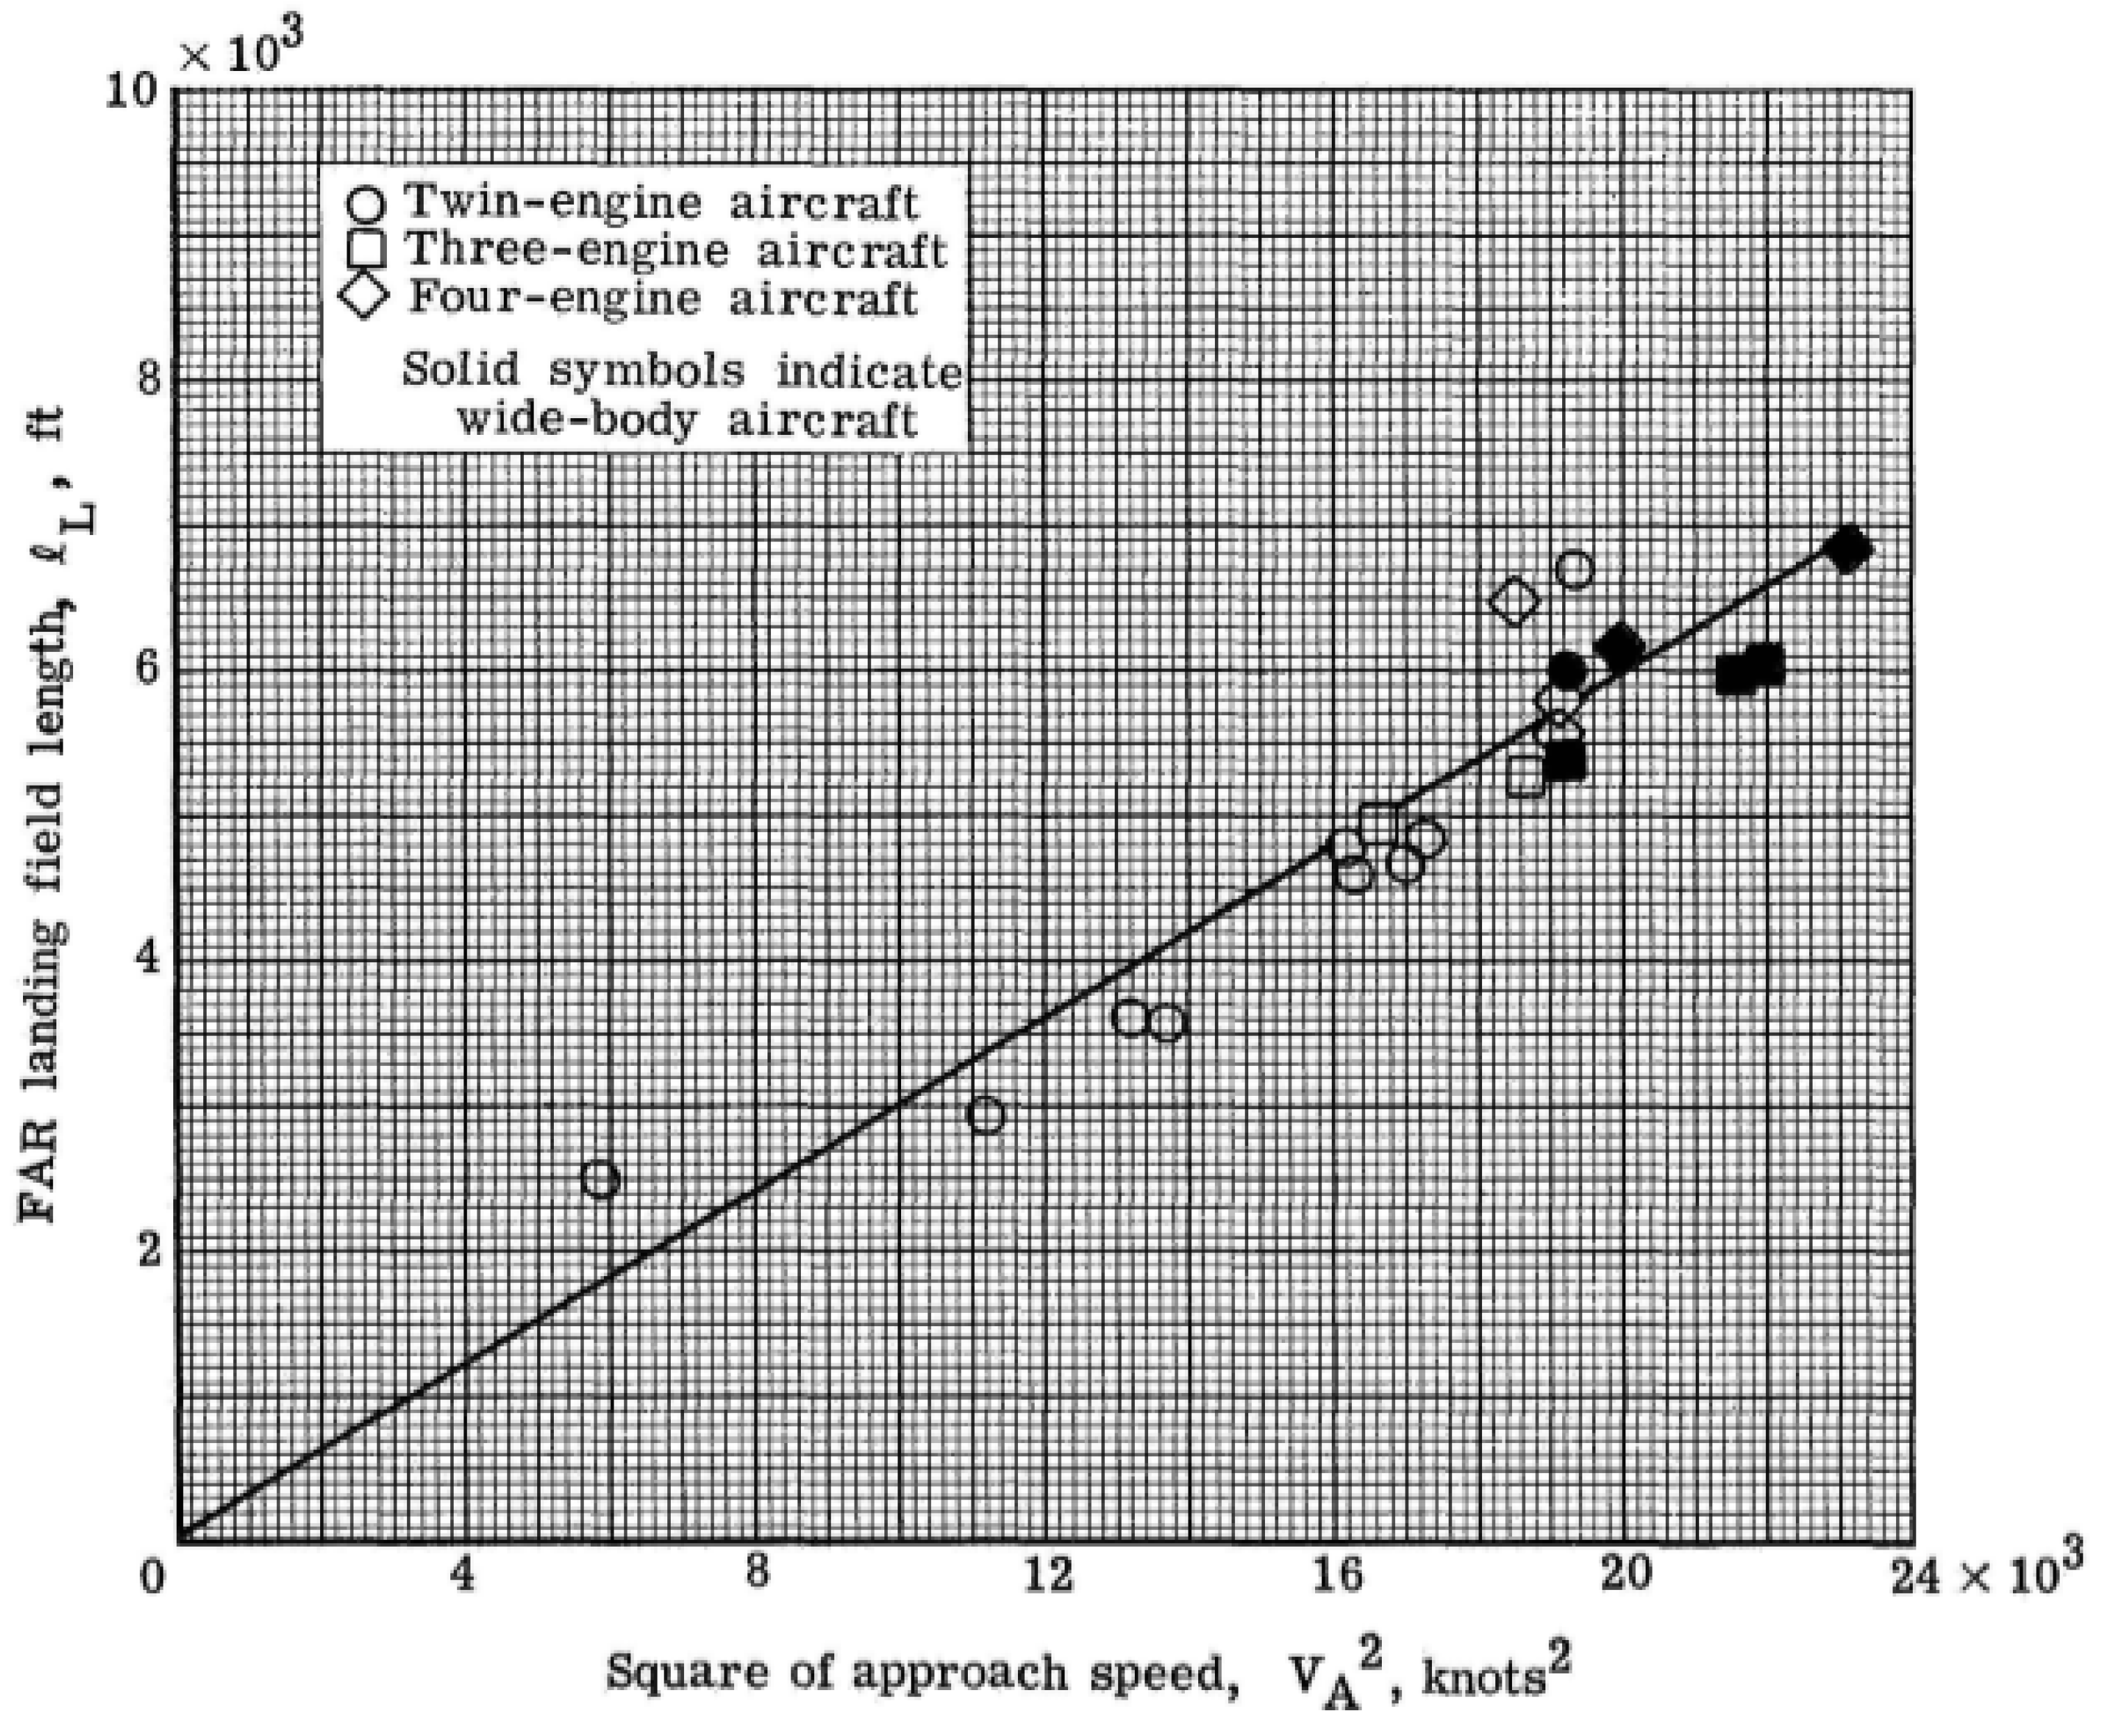
Upon closer inspection, a weakness in Loftin’s formulation becomes apparent. He developed his statistical basis from only 20 data points based on 14 different aircraft; see Figure 1. On a positive note, Loftin used FAA-certified flight-manual data to develop his regression. He used data from the following airliners: the B707, DC-8, and VC-10 (four-engine, 14 CFR § 4b SR-422-certified); the B727 (three-engine, 14 CFR § 4b-certified); the DC-9 and B737-200 (two-engine, 14 CFR § 25-certified); and the B747-100, L1011, and DC-10-10 (three and four-engine 14 CFR § 25-certified wide-body airliners). Loftin also included data from select 14 CFR § 4b- and 14 CFR § 25-certified business jets: the Lockheed JetStar, Learjet 24, Falcon 30, Gulfstream II, and Citation 500. On a negative note, Loftin limited his basis data to select, heavy landing weights and overly constrained his sample size, restricting himself to sea-level, standard-day data. Loftin should have been able to extract at least a half-dozen data points per aircraft type. In addition, visual inspection of the line does not support a strong correlation factor (R2 < 0.9). In hindsight, the Lan and Roskam method could have been more accurate had they derived it from a larger data set.
Figure 1.
Empirical basis data for Lan and Roskam’s Landing-Distance Equation. Reproduced from Loftin, Ref. [2]. Public Domain.
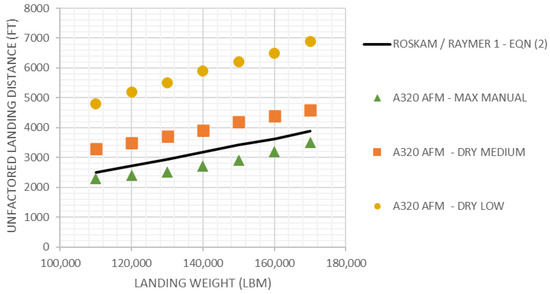
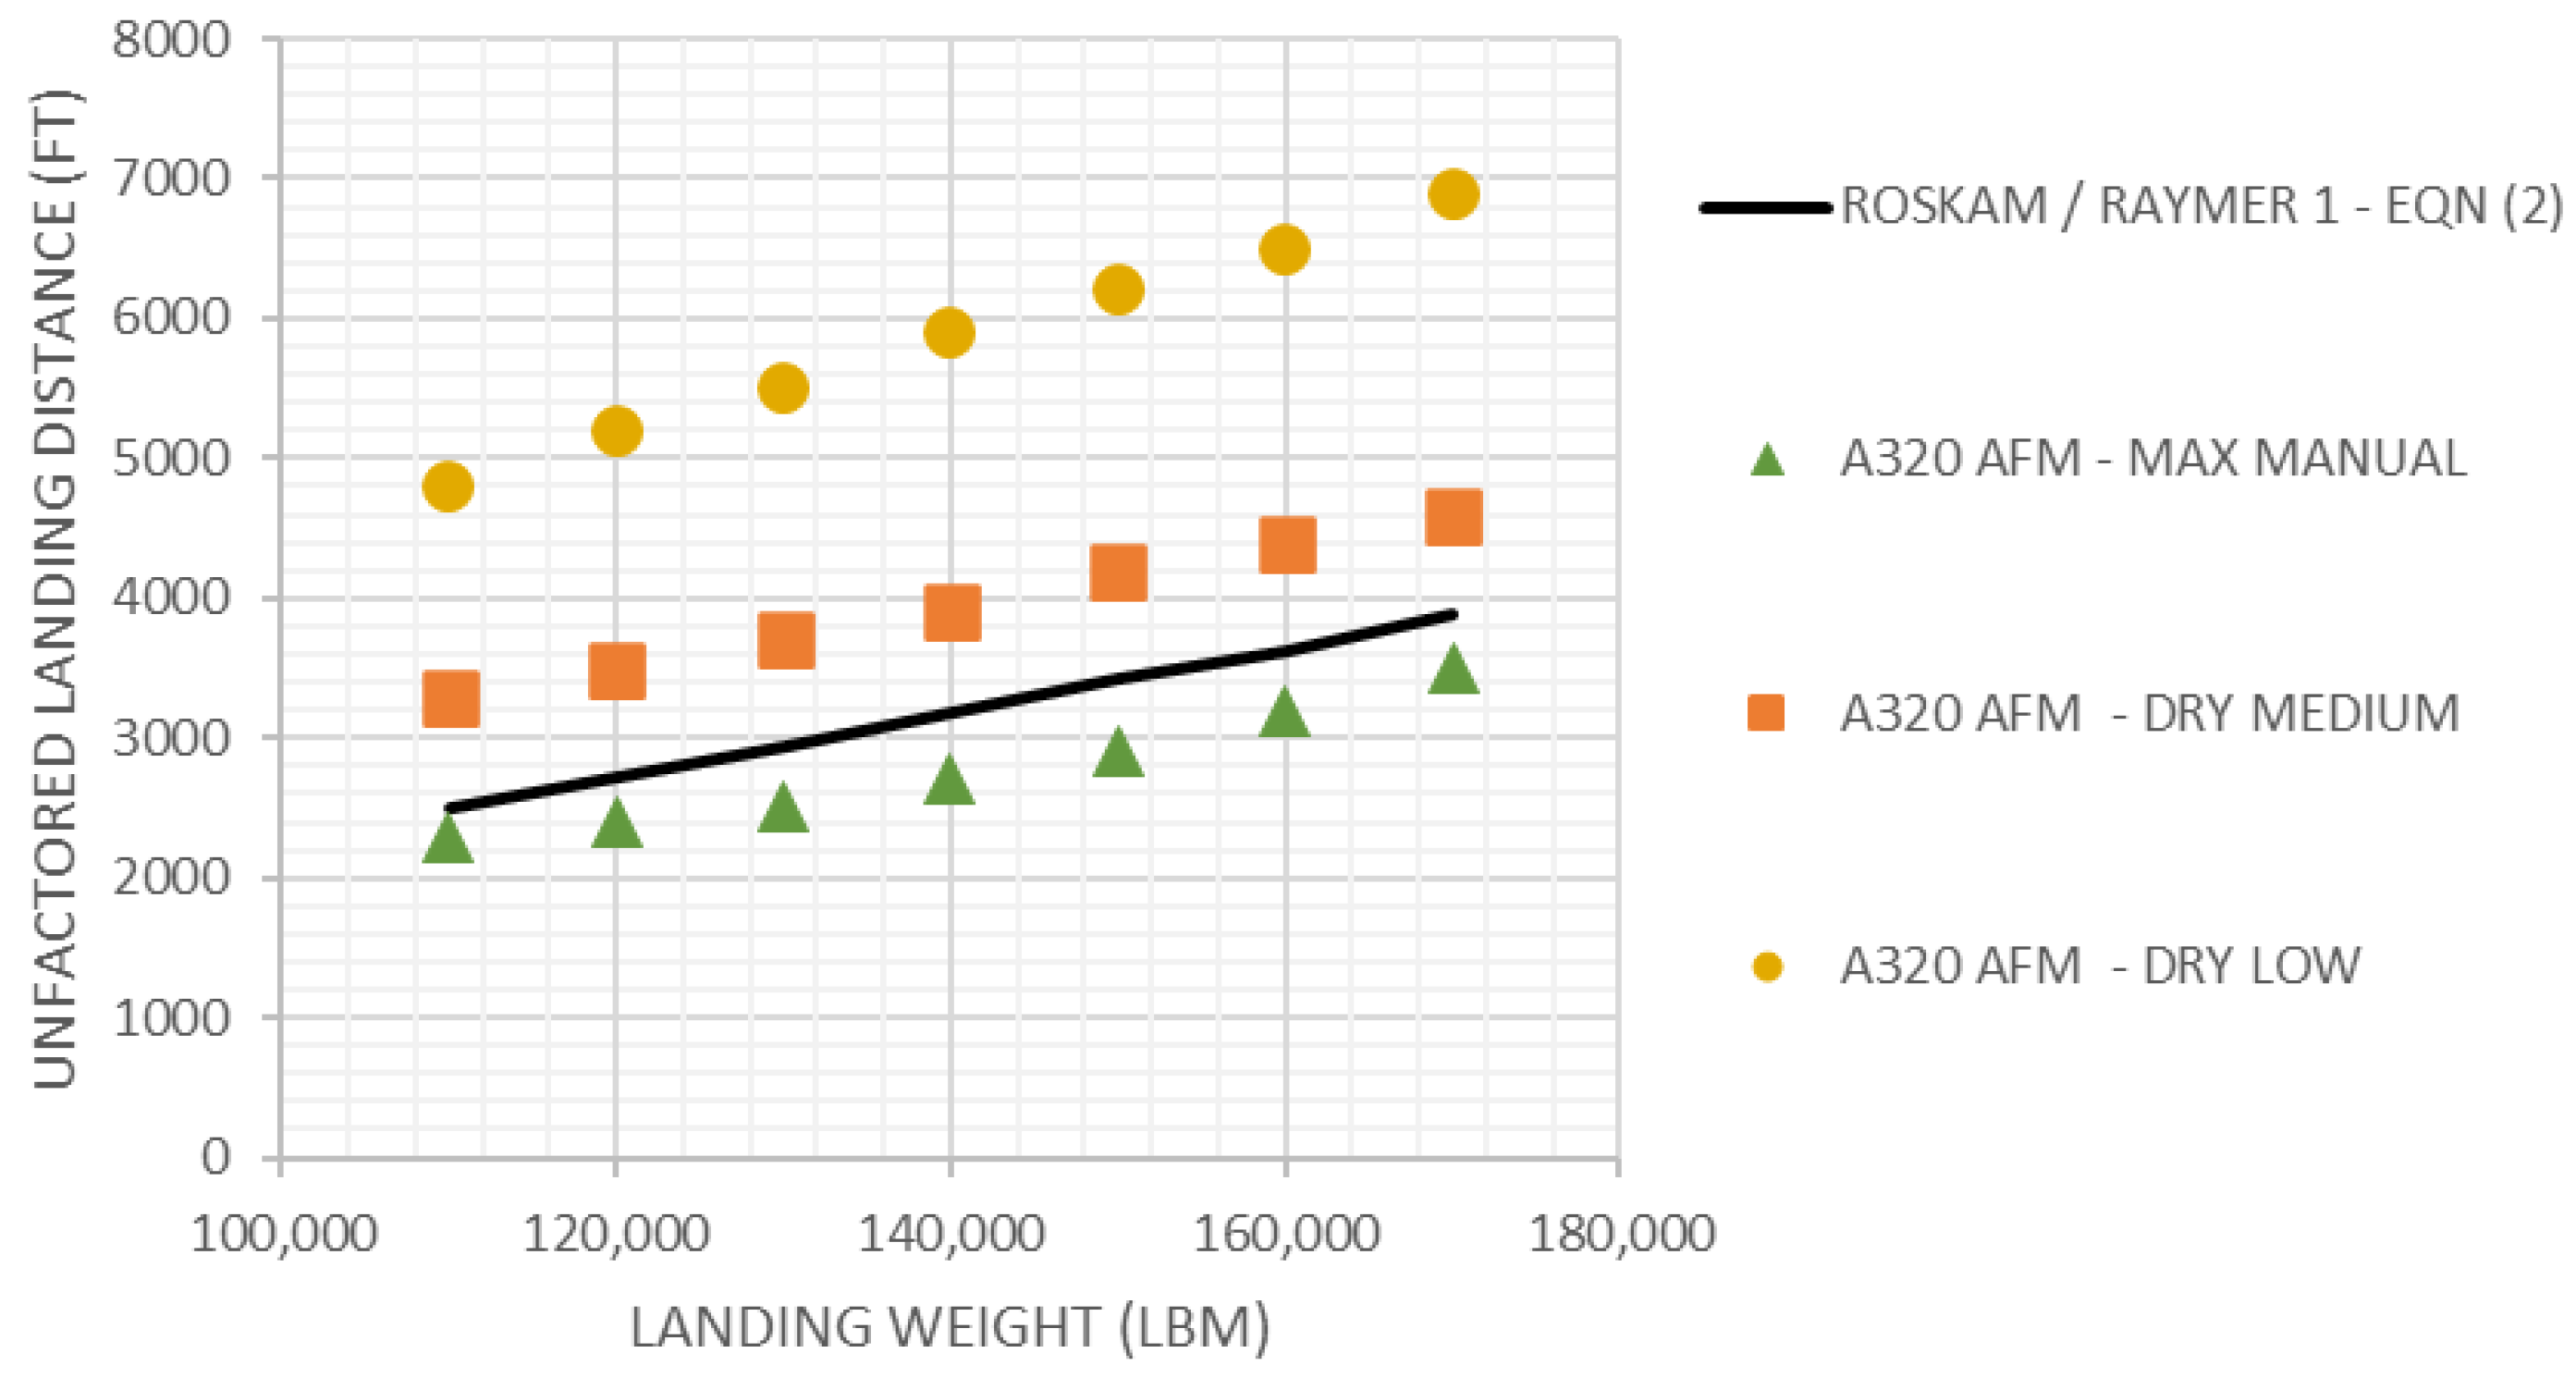
Figure 2 helps assess whether Lan and Roskam’s method is reasonably accurate for application to a modern commercial design. Comparing its predictions to values found in the Airbus A320 flight manual [7], we see that Lan and Roskam’s method qualitatively captures the weight dependency of the A320 but lacks critical, quantitative precision. It can lead a designer astray since real-world dispatch may use the more optimistic MAX MANUAL braking distance to schedule a weight limit for landing on a short runway. If operations require LDR not to exceed 3000 ft, the AFM permits operations as heavy as 155,000 lbm, while the Lan and Roskam equation implies that the aircraft could not weigh more than 130,000 lbm.
Figure 2.
Comparison of Lan and Roskam’s empirical method to FAA certified “unfactored” sea-level, standard-day flight manual dry-weather data for the A320. CONF FULL (CLmax~2.67) and carbon brakes. Source data from Refs. [1,5,6,7].
Thus, we see that a widely respected conceptual-design method was based solely on very limited empirical data. When modern engineers apply it to estimate aircraft conforming to the current regulatory basis, it predicts unnecessarily pessimistic distances. The need for improved semi-empirical methods cannot be overstated.
Section 4 uses calibrated numerical simulations to help define new, improved empirical equations. Since wet-weather field performance is a critical operational constraint for many aircraft, empirical equations should consider operations in both the dry and the wet. Given the varying certification basis, the paper will define wet and dry empirical relationships, based on current civilian and military operational standards. Where publicly available data exists (recent 14 CFR § 25 certified aircraft dry-weather distances), aircraft flight manual (AFM) sourced speeds and distances will augment numerical simulations of widely variant hypothetical configurations. In the absence of publicly available data, a statistical reduction of numerical simulations of widely variant hypothetical configurations where speeds, timings, procedures and braking capability have been adjusted from the calibrated dry-weather simulation to conform with the relevant certification procedures support new empirical equations.
2. Prior Art
For more than 100 years, field performance requirements have anchored “airworthiness.” According to 1920 French law, all “touring” aircraft were required to be able to take off and land within 250 m (820 ft), with the expectation of less than 12 knots of headwind [8]. Commercial aircraft could expect a 300 m (984 ft) runway for dispatch, but retained an expectation for safe, engine-inoperative emergency landings on 250 m (820 ft) fields. Reliable compliance with these regulations had to be demonstrated before the government would issue an airworthiness certificate.
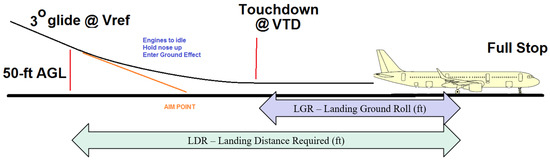
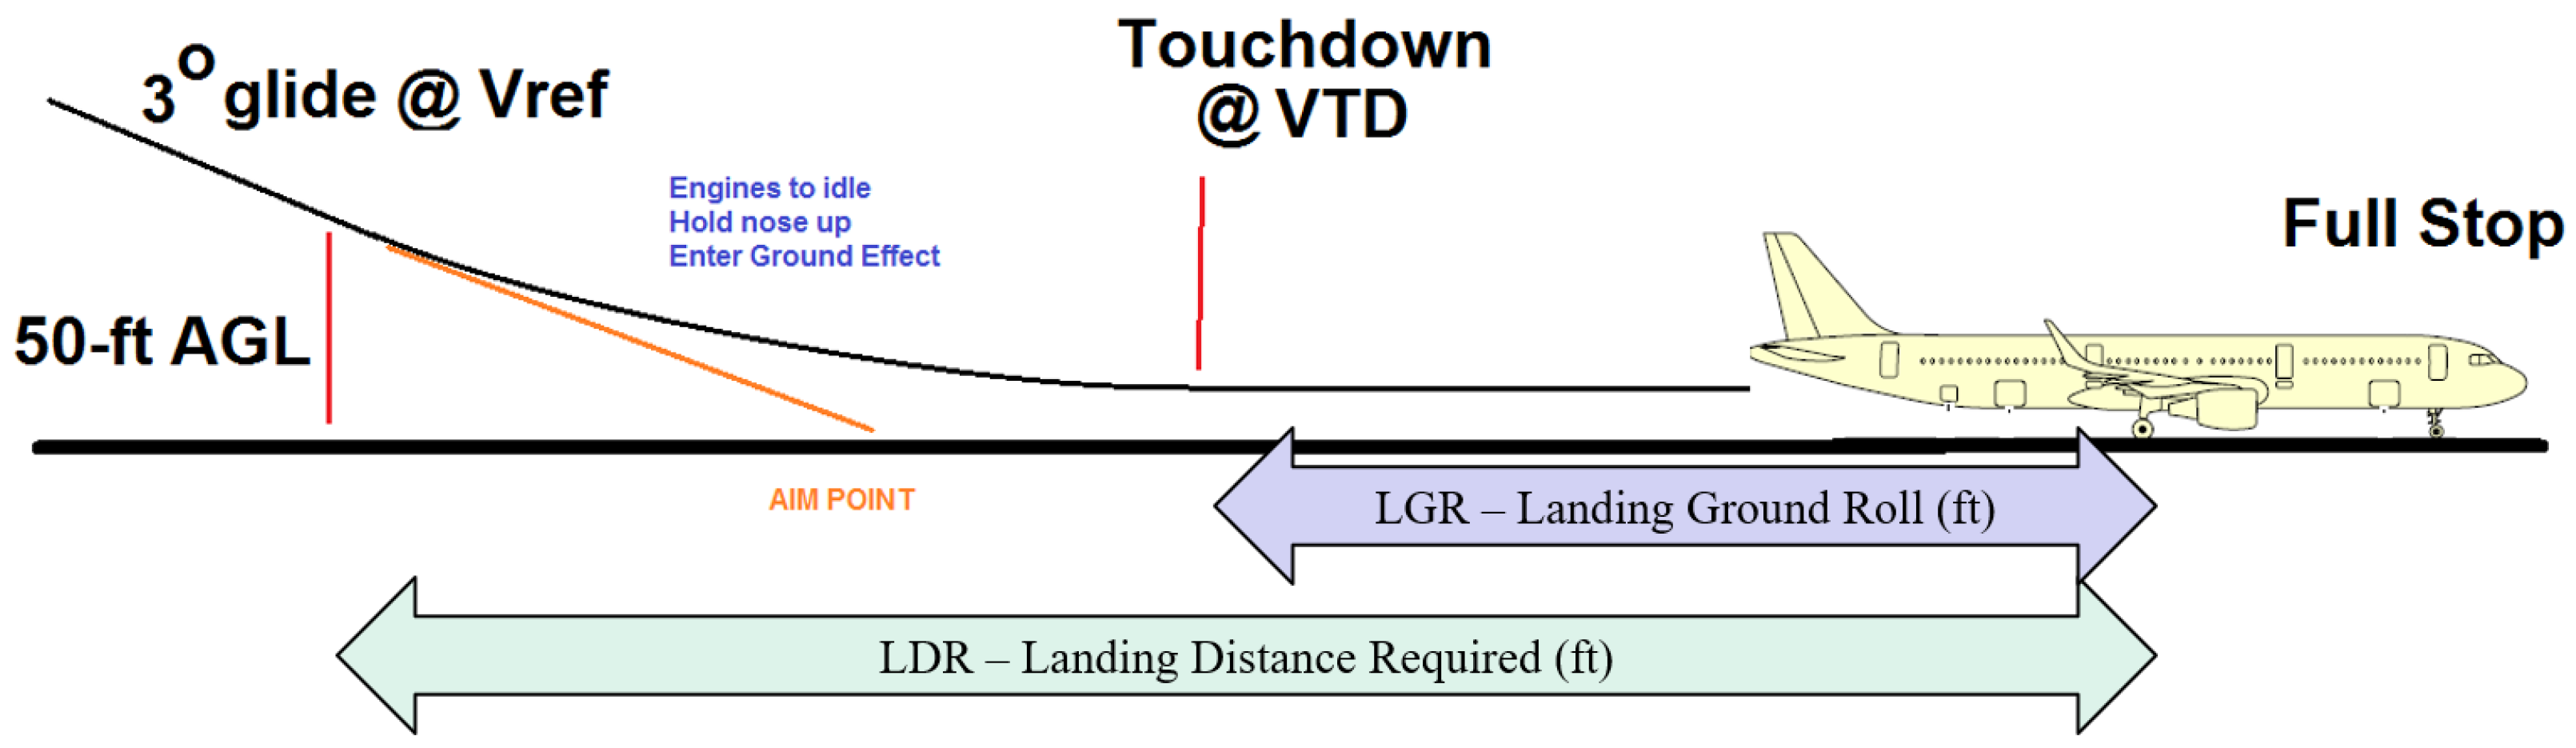
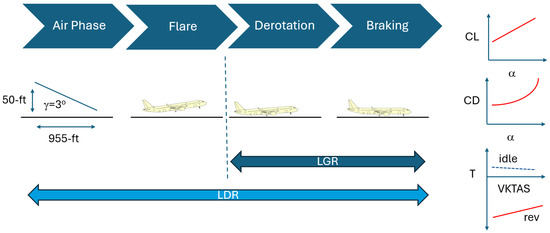
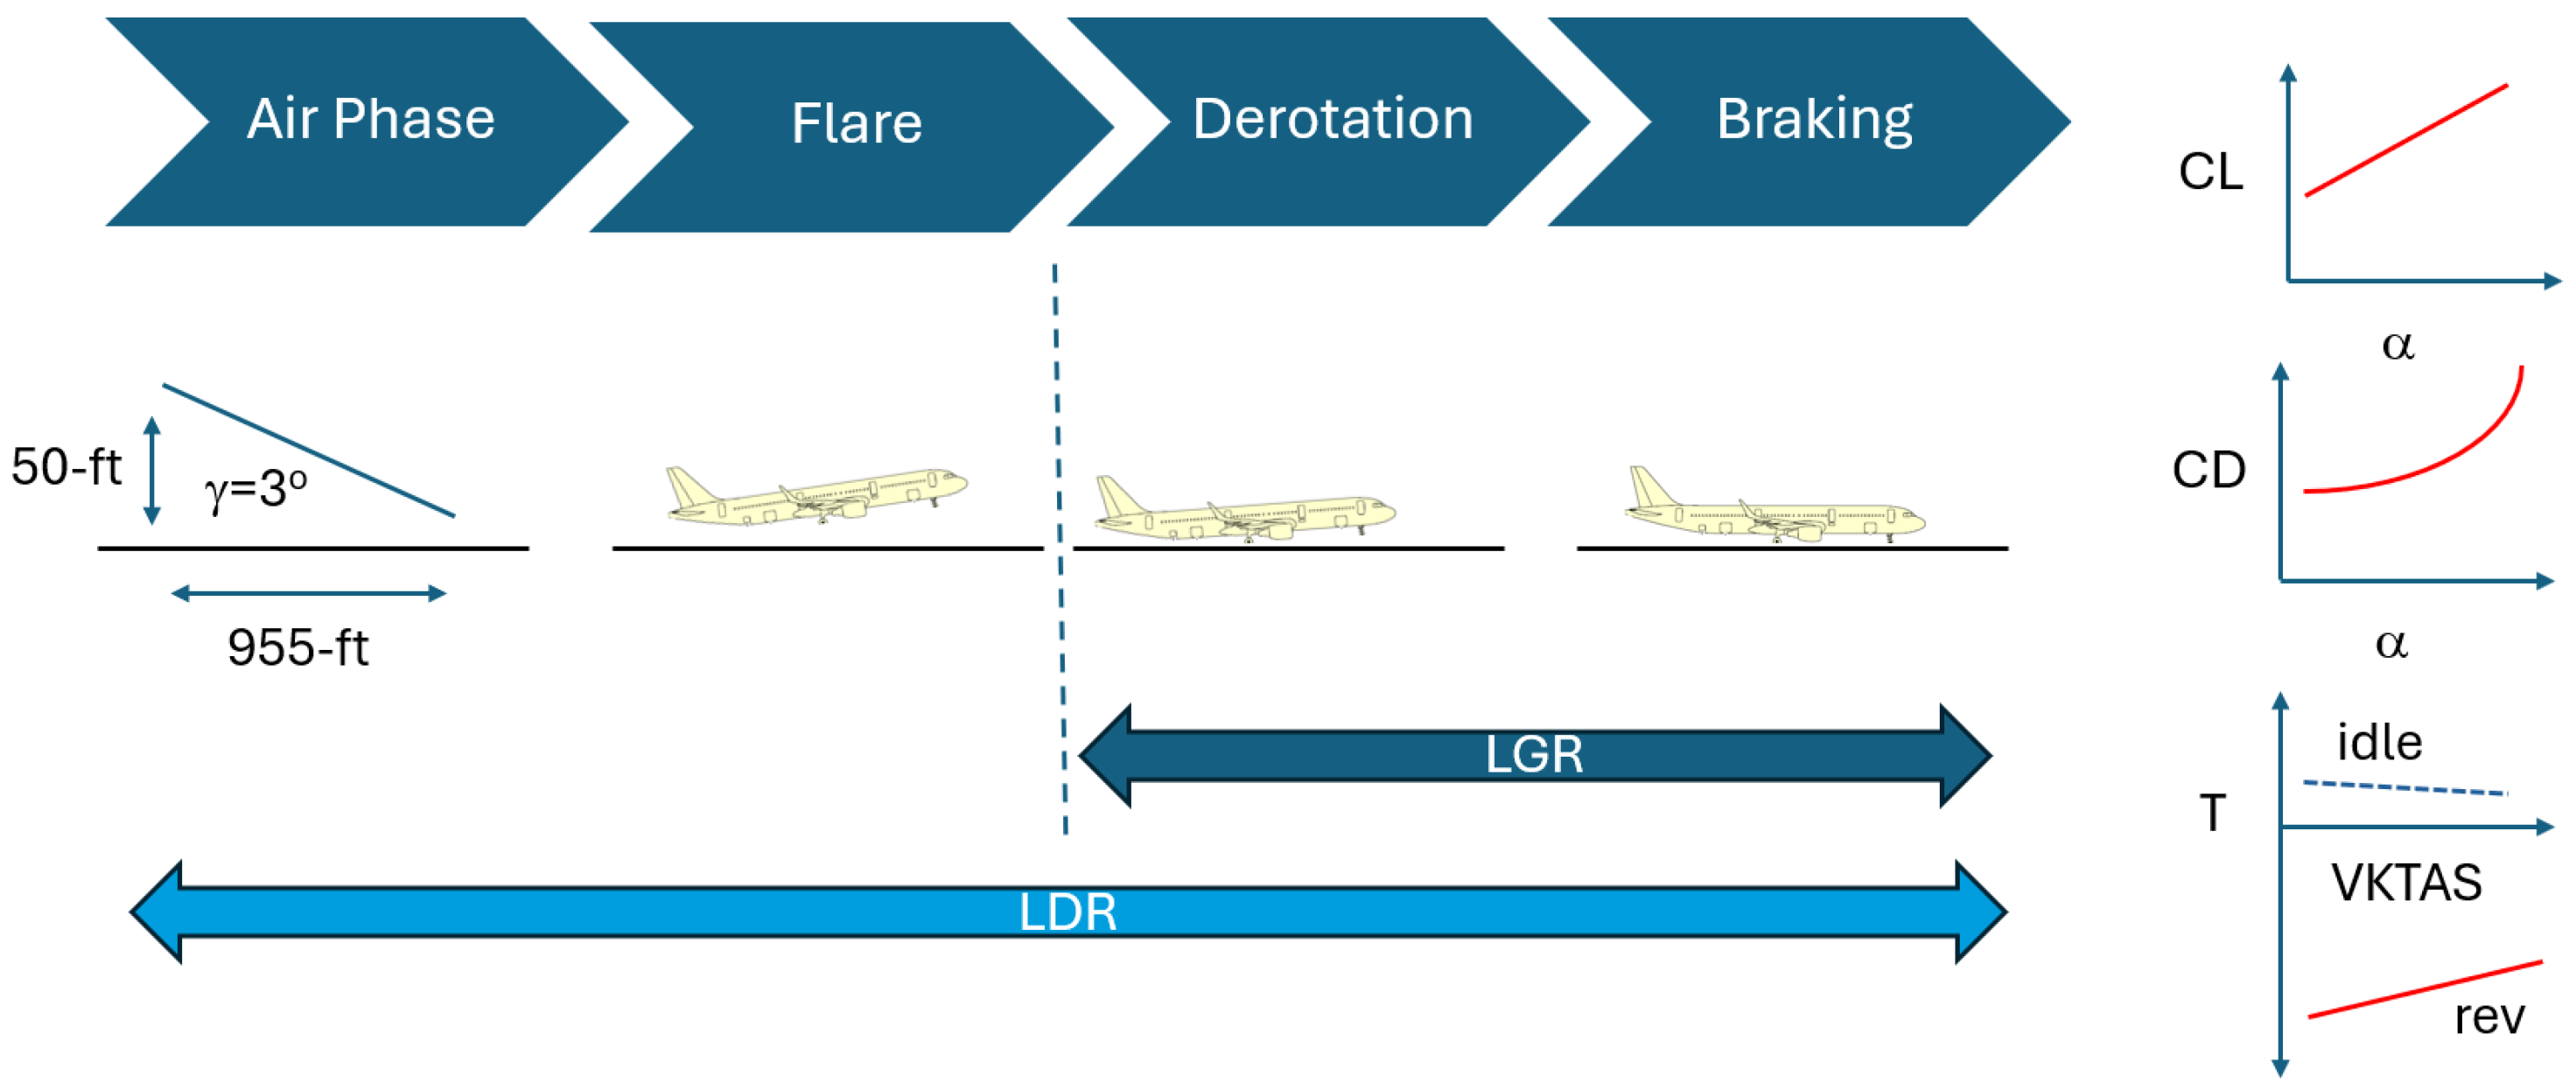
In 1928, Louis Breguet authored a seminal-methods paper supporting the prediction of landing distances; it may be found in a translation as NACA TM-507 [9]. Here, Breguet established foundational principles for landing flight mechanics considering three distinct maneuvers: (1) a stable descent in the air, (2) a dynamic flight procedure to “level off” near the ground, and (3) a deceleration to a stop performed after contact with the ground. As aircraft are expected to alight at some distance past the physical beginning of the airfield, it is customary to track the total landing distance, LDR, the sum of the distance traveled beginning with the aircraft crossing the physical start of the runway at a reference altitude to a complete stop, as well as the landing ground roll, LGR, the distance traveled between initial ground contact and the final stop. This paradigm is used to this day; see Figure 3.
Figure 3.
Segmented formulation of final approach, flare, touchdown, and landing rollout originally introduced by Breguet and used in all subsequent analysis.
A second 1928 report from the U.K. Aeronautical Research Committee proves equally influential [10]. Here, Rolles and Stevens developed a semi-empirical method to produce estimates of field performance to support operational studies [10]. Their basic idea was to develop an analytical estimate of the sensitivity of landing distances to airport winds, barometric pressure, and temperature and to use the analytical model to first “collapse” a limited collection of flight test-acquired data to a nominal still-winds, sea-level standard day condition and then “expand” the data to produce planning tables with estimated performance across a wide variety of expected conditions. In the modern era, Kimberlin teaches this approach, though with considerable refinement [11]. The nuanced process to develop the certified performance found in a flight manual remains highly proprietary, with little exposure in the open literature.
A survey of textbooks written during the first half of the twentieth century finds the subject of landing-field performance estimation largely ignored. K.D. Wood’s 1935 Technical Aerodynamics treatise provides no quantitative advice to compute the landing distance but stated that “it is commonly specified … that the airplane shall land and come to a full stop with … some distance … after having cleared an obstacle of 50-ft height” [12]. He specifically advised against a “careful solution” of the total landing distance required (LDR) because it would be a “complicated calculation” subject to uncertainty in pilot procedure. Neither Warner’s 1936 [13], Jones’ 1939 [14], Millikan’s 1945 [15], nor Sherwood’s 1946 [16] aircraft performance texts provided methods to estimate landing distances.
Beginning in 1938, the United States Code of Federal Regulations (CFR) formally codified civil aircraft guidelines, which were formerly scattered across various government bulletins. The 1938 rules stipulated that for passenger-carrying aircraft the “landing speed with power off, in standard calm air at sea level, shall not exceed … 65 miles per hour for airplanes of 20,000 pounds standard weight or less, 70 miles per hour for airplanes of 30,000 pounds standard weight or more” [17]. The 1940 revisions are recognizable to the modern engineer: they define the certified landing distance to be “the horizontal distance required to land and come to a complete stop from a point at a height 50 feet above the landing surface [beginning at an] airspeed not less than 130 percent of stalling speed” [18]. In 1942, the government further revised the CFR to impose a 1.67 factor of safety on landing: dispatch prohibits flight to an airport if the published LDR exceeds 60% of the actual runway length [19].
The 1940s also saw the U.S. military codify rules to certify aircraft performance. These standards reveal a divergence between military and civilian regulations. In this time period, MIL rules encouraged operations with a reduced stall safety margin. U.S, Army Air Force Specification R-1815-A, from 1945, stipulates the powered approach to be flown at 115% the landing-flap stall speed [20]. MIL-5011A, from 1951, superseded this standard and called for published landing-performance distances to be based upon a 50 ft obstacle and a final approach flown at “at least” 120% the landing-flap power-off stall speed arriving to a runway permitting braking at μ = 0.30 [21].
Dwinnell [22], in 1949, provided an analytical formulation to estimate LGR assuming both wheel braking (μ dependent on runway surface conditions) and aerodynamic drag. His work uses an “arbitrarily assumed” touchdown at 120% the landing flaps-free air stall speed. He also applied braking, where μ acts upon the entire aircraft weight (i.e., that there is no residual lift after touchdown) and neglects any residual thrust (either forward or reverse) from the propulsion system. He does not correlate his predictions against any flight test data. Dwinnell’s formulation is broadly consistent with MIL-5011 [21].
Perkins and Hage [23], in 1949, authored the earliest American text to provide a quantitative method to predict the landing distance over a 50 ft obstacle, LDR, and the landing ground roll, LGR. Like Breguet [9], they consider the total landing distance to be the sum of “air-phase” and “ground-run” distances. Unlike Breguet’s three-phase paradigm, they believe that “reasonable accuracy” may be obtained if the air-phase comprises the distance traversed by a constant angle “glide” and the ground-run comprises a constant-rate deceleration. They also state that the flare distance “does not warrant a detailed calculation” [23]. They also claim, without further evidence, that these predicted distances “agree well with experimental data” [23].
Perkins and Hage also reiterate the need to apply the civilian CFR 60%/1.67-factored distance rule as a general maxim for dispatch planning [19,23]. They also follow the civilian CFR, which stipulates a final approach speed of 130% landing-flap stall speed [18]. Their method proposes touchdown at 115% landing-flap stall speed, followed immediately with a 7 ft/s2 (0.22 gee) deceleration. After considerable algebra, they arrive at the following formula for sea-level, standard-day landing performance:
where W is the landing weight in lbm, Sref is the wing reference area in ft2, and CLmax is the maximum lift coefficient of the aircraft with landing flaps extended.
Corning’s 1960 [24] text presents a more complex formula involving the three-element procedure postulated by Breguet. Like Perkins and Hage [23], he begins the landing-distance computation when the aircraft crosses the 50 ft obstacle height at 130% of the landing-flap stall speed. Unlike Perkins and Hage, he introduces a term to represent deceleration from the final approach speed to touchdown. Corning does not correlate his formula with any flight-manual data.
Nicolai’s 1975 aircraft design text [25] broadly follows Breguet’s procedure. Like Corning, he estimates the air-phase distance as the distance covered during a power-off deceleration from final approach speed to touchdown. Unlike Corning, he also adds an additional term representing the distance traversed after touchdown while the aircraft de-rotates to an attitude appropriate for heavy braking. Nicolai suggests touchdown at 115% the final approach stall speed, a 3 s transition, and a dry-runway braking μ of 0.4–0.6. Nicolai does not correlate his formula with flight-manual data.
Torenbeek [26] describes a quantitative model strongly reminiscent of Corning. Unlike Corning, he provides only vague advice and does not actually show an end-to-end worked example.
As noted in the Introduction, Lan and Roskam [1] present a statistical method based on Loftin’s collection of “FAR Landing Field Length” data from various certified aircraft [2]. They state that their method is appropriate for FAA 14 CFR § 25-certified aircraft which fly the final approach at 130% the landing-flap stall speed. Because touchdown speed is not explicitly specified in 14 CFR § 25, they recommend assuming a touchdown at 115% the landing-flap stall speed used in Perkins and Hage.
In addition to this simple statistical method, Lan and Roskam also present an “accurate method” and “approximate, analytical method” based on integrating the equations of motion [1]. In these methods, they consider the landing maneuver to comprise many more segments than other authors: (1) a stabilized final approach at Vref where the aircraft crosses the 50 ft obstacle; (2) a decelerating descent from the 50 ft “screen height” to a “flare height”; (3) a landing transition or flare maneuver, where the pilot elevates the nose and the aircraft continues to lose speed; (4) touchdown with the nose wheel elevated; and (5) a braking maneuver with “all-wheels-on-the-ground.” While their technique is sound, they do not show an end-to-end worked example in comparison with AFM data.
Yechout [27] qualitatively describes Breguet’s procedure but provides only a single quantitative equation to predict the landing ground roll. He suggests a touchdown speed of 115% landing-flap stall speed and a braking coefficient, μ~0.5. Yechout does not correlate his formula with AFM data.
Pamadi [28] introduces another element into the procedure. Under this paradigm, the air-phase distance comprises two elements (the 954 ft implied by the geometry of the obstacle height and approach glide slope and a flare, transition distance), while the ground-roll comprises heavy braking. Pamadi states that the approach speed is “usually equal to” 130% the landing-flap stall speed and remains silent on a suggested braking μ. In terms of parameters consistent with the rest of this paper, Pamadi’s formula assuming μ~0.5 is as follows:
Anderson [29] introduces a four-element procedure sharing the air-phase elements with Pamadi [28] and the transition plus deceleration ground-phase elements with Nicolai [25]. He suggests a final approach speed of 130% landing-flap stall speed for civilian and 120% landing-flap stall speed for military aircraft, a nZ = 1.2 gee pull up in the flare, a touchdown speed of 115% landing-flap stall speed for civilian and 110% landing-flap stall speed for military aircraft, and a dry braking μ~0.4. Anderson does not correlate his formula with flight-manual data.
Raymer’s aircraft design texts [5,6] present two methods; they are unchanged from edition to edition. First, he cites Loftin’s flight-manual data set [2] (and implicitly condoning Roskam [1]), holding that a “reasonable first-guess of the total landing distances in feet, including obstacle clearance, is approximately 0.3 times the square of the approach speed in knots” [5]. He also presents a second method to estimate the unfactored total landing distance, which, for an airliner on a 3° approach glideslope near sea level, is as follows:
Raymer does not correlate his “more precise” method with AFM data.
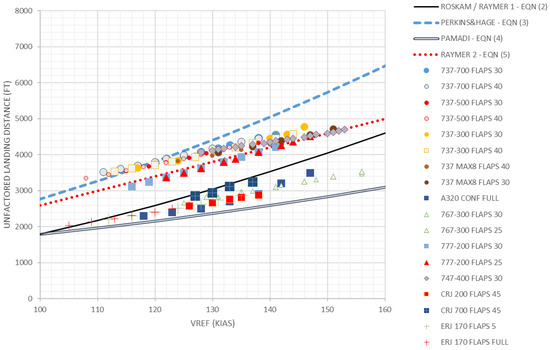
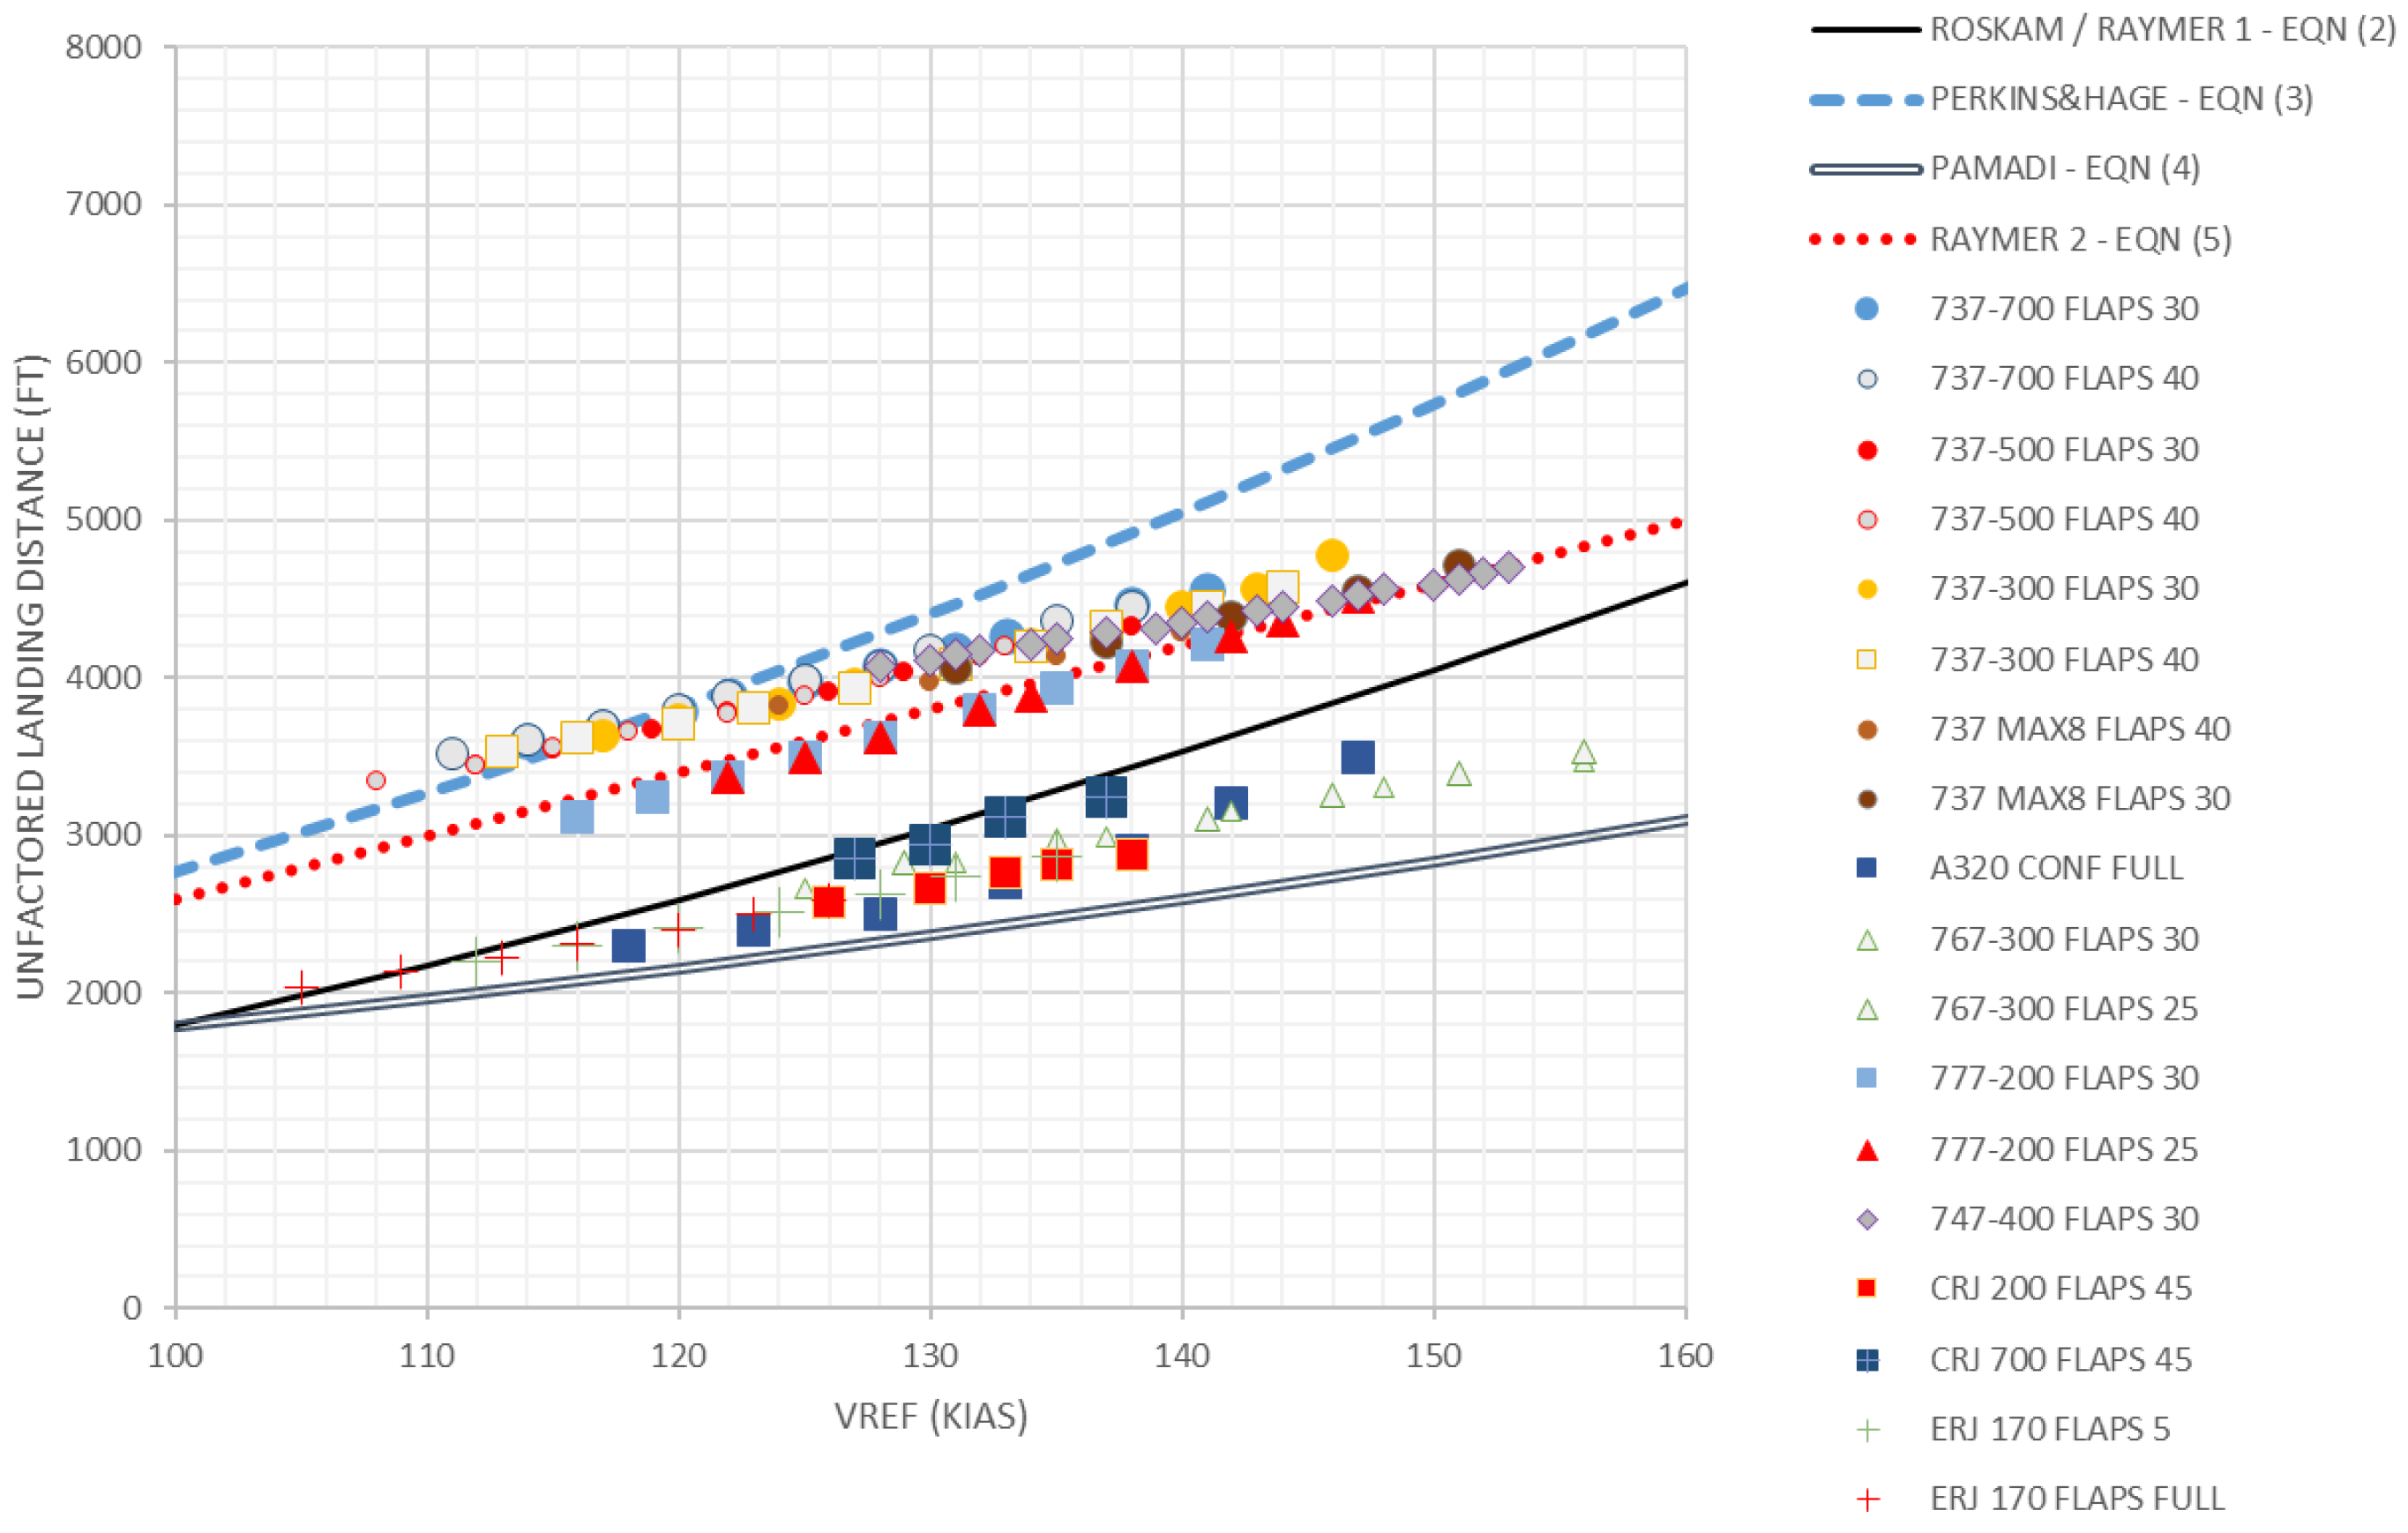
Consider how well these methods function when applied to estimate the dry-weather performance of modern, FAA-certified civilian aircraft. Figure 4 helps assess the quality of the legacy predictive methods as applied to published “advisory” landing distance and Vref speed information extracted from the FAA-approved flight manuals of eleven current aircraft. All of the data represents landing performance near sea level (Pressure Altitude < 2000 ft) with a dry runway on standard-day conditions. In accordance with FAA rules, I take no credit for reverse thrust. For all published landing-flap settings, I extracted all relevant information for speeds and distances at eight to ten distinct landing weights. In total, this empirical basis comprises ~180 data points. This basis includes the following in-service aircraft: the B737-300 [30], B737-500 [30], B737-700 [31], B737 MAX8 (pre-grounding) [32], B747-400 [33], B767-300 [34], B777-200 [35], A320 [7], CRJ 200 [36], CRJ 700 [37], and ERJ 170 [38].
Figure 4.
Correlation of final approach speed (Vref) to flight manual-published still-wind, sea-level, standard-day landing distances for FAA-certified aircraft compared to various empirical methods: Lan and Roskam from Ref. [1], Perkins and Hage from Ref. [23], Pamadi from Ref. [28], and Raymer from Refs. [5,6]. Source data from Refs. [7,30,31,32,33,34,35,36,37,38].
The FAA certified all of these aircraft to modern rules, which differ from those regulations in effect when prior authors devised their respective equations. Several trends emerge: First, there seem to be three families of correlation. The A320, CRJ200, CRJ700, ERJ-170, and B767-300 cluster together, having significantly shorter landing distances than the others. The B777-200 forms a distinctive second cluster of points approximately 1000 ft longer than the primary grouping. Finally, all generations of the B737, along with the B747-400, form a final cluster with longer distances and distinctly shallower LDR vs. Vref slope.
Among the legacy equations, neither the popular Lan and Roskam/Raymer’s Method 1, Equation (2), nor the old Perkins and Hage method, Equation (3), seems to capture the slope of the distance vs. final approach speed correlation found in actual flight-manual data. Their steeper LDR vs. Vref correlation reflects that these methods must presume a weaker deceleration capability than demonstrated in certification. Raymer’s Method 2, Equation (4), seems to match B777 data fairly well but proves optimistic regarding the B737, while being substantially pessimistic for the A320, CRJ, ERJ, and B767-300. Pamadi, Equation (5), is the most optimistic of all; its use would lead a design team astray.
Perhaps K.D. Wood had it right in 1935, that an accurate quantitative prediction of landing distance is an exercise in futility given the variation piloting techniques [12]. I cannot ignore his viewpoint, as my own earlier study, examining uncertainty propagation arising from pilot timings as applied to an A320 model, documented substantial (up to 1000 ft) variation in LDR [39]. Given the general dearth of scholarly papers on this subject and the pressing need for students and industry to have a more relevant follow-on to Lan and Roskam, this paper develops a new generalized empirical predictive method applicable to a wide range of aerodynamic designs informed by the certified landing-distance capability of the A320, CRJ, ERJ, and B767-300.
3. Differences in the Regulatory Basis for Modern FAA and MIL-3013B Rules’ Landing Distances
This section comprises an overview of the regulatory basis for certified landing distances that control the values found in civilian or military flight manuals. Pilots and dispatchers use these distances to schedule operations. As noted in Section 2, the certifying agency observes a limited number of flights where test pilots demonstrate capability. The actual contents in the manual derive from an “expansion model” anchored to this test data.
3.1. Top-Level Differences Between MIL vs. Civilian Regulations
Military and civilian rules which govern scheduled landing performance differ. Subtle nuances differentiate 14 CFR § 25 military operations from one another [40]. This paper uses only the most modern 14 CFR § 25 [41]/CS-25 [42] and MIL-STD-3013B [43] rule sets. Civilian regulations focus on commercial reliability and safety for aircraft not intended for operation near their capability limits. Conversely, military rules emphasize operations at the edge of safe capability. Compared to civilian rules, military rules may have greater margins of safety. Thus, an otherwise identical aircraft operated according to FAA standards may have substantially different scheduled performance to that operated under MIL 3013B rules. Consequently, the design community needs distinctly different empirical field performance prediction methods depending upon the choice of operating standard.
3.2. FAA Transport Category Aircraft Regulations
A series of intertwined landing regulations govern the scheduled performance of an FAA-certified aircraft. Recall that the FAA has amended the landing regulations many times; older books likely refer to obsolete regulations.
Regulation 14 CFR § 25.125 (2025) [41] defines the certified, unfactored landing distance (LDR) as the horizontal distance from the point at which the main gear of the airplane is 50 ft above the threshold of the runway to the position of the nose gear when the airplane is brought to a complete stop. Thus, the landing distance (LDR) comprises two segments: (1) the airborne distance from 50 ft to touchdown, and (2) the ground distance from touchdown to stop.
The FAA expects the aircraft to cross the threshold at a stabilized final approach speed (Vref) governed by the following relation:
Vref = max (123% Vs, VMCL)
Regulation 14 CFR § 25.149 (2025) [41] controls VMCL, the minimum airspeed where aerodynamics can oppose an engine failure with deployed landing flaps and gear with the engines set to “go-around” power. FAA AC 25-7D requires the airframe manufacturer to flight-test demonstrate compliance showing flight at VMCL where “constant heading is maintained without exceeding a 5-degree bank angle” [44].
Regulation 14 CFR § 25.119 (2025) [41] limits the maximum landing weight so that the pilot can “balk” the landing before touchdown and achieve a steady climb gradient > 3.2% at Vref with landing flaps and gear deployed.
Regulation 14 CFR § 25.121 (2025) [41] limits the maximum landing weight so that the aircraft with one-engine inoperative can execute a go-around in the initial approach configurations. Once the pilot extends the gear and selects touchdown flaps, he commits to landing. A minimum climb capability (>2.7% for a four-engine aircraft) must be attainable with the flaps in the penultimate (not the final approach) setting and the pilot flying the scheduled initial approach speed.
FAA documents AC-25-7D [44], SAFO 06012 [45], and FAA Order 6850.2B [46] provide additional insight. For example, the FAA expects that piloting techniques used to develop certified distances are attainable “in service by crews of average skill, using methods or devices that are safe and reliable, and include allowances for any time delays in the execution of the procedures that may reasonably be expected in service” [44]. This guideline ensures that an aircraft flight manual contains performance values that are “representative of that which can reasonably be expected to be achieved in operational service” [44]. Positioning of threshold and visual approach slope indicator (VASI) lights define a touchdown aim point 980 ft downrange from the threshold [46].
The FAA forbids the use of reverse thrust in determining the certified landing distance. Regulation 14 CFR § 25.125 (2025) [41] states that engineers cannot take credit when “any device is used that depends on the operation of any engine … if the landing distance would be noticeably increased when a landing is made with that engine inoperative”. Regulators construe this wording to disallow any use of reverse thrust because an engine may fail at any time during landing rollout [44].
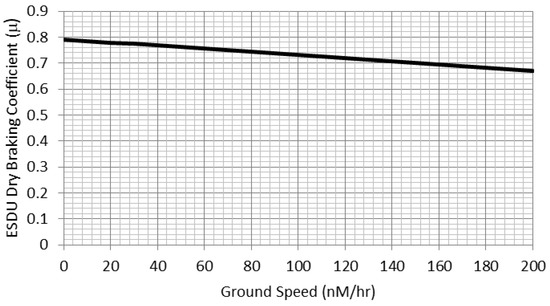
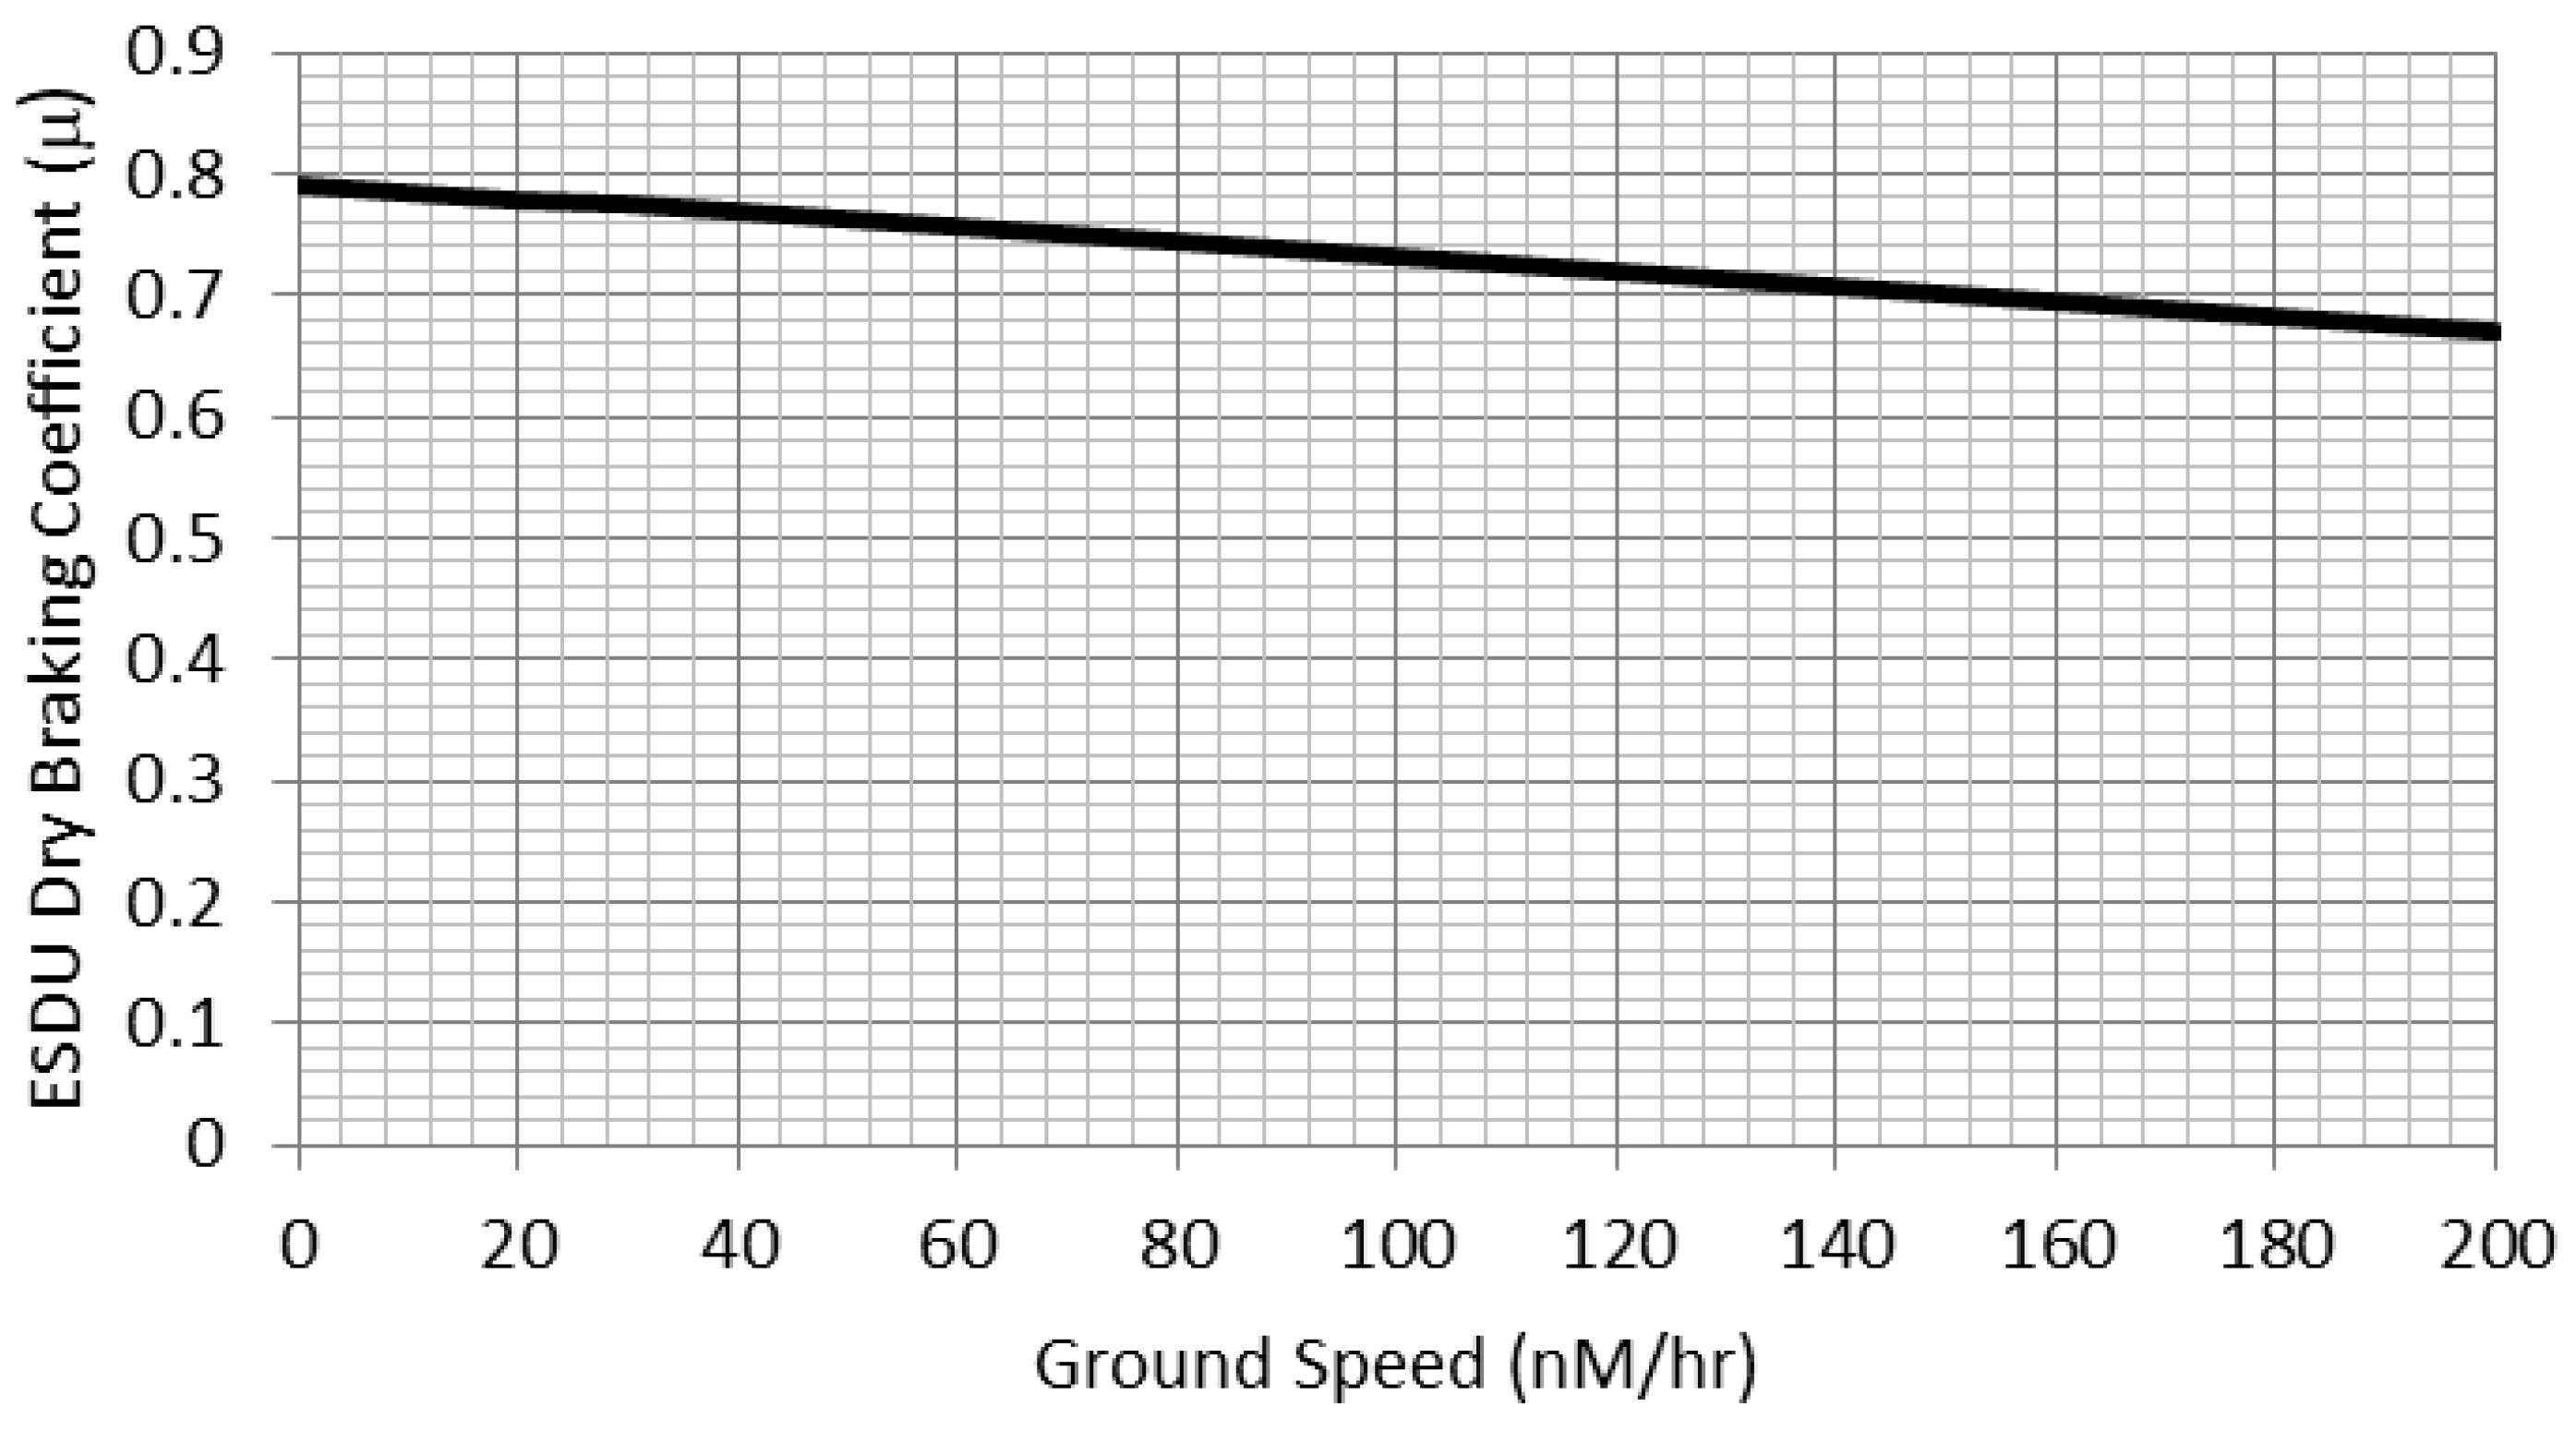
Functionally, in both the wet and the dry, the FAA permits credited braking performance to be performed using either nominal or ESDU traction levels; see Figure 5 [41,47]. If actual test data can document better stopping power than that implied by any default coefficient, the FAA will not force the manufacturer to use the pessimistic default values for stopping friction. Thus, recent FAA-certified aircraft that publish exceptionally short stopping distances demonstrate μ >> 0.4 in operational test.
Figure 5.
Speed-dependent braking performance in the dry, following ESDU 70126. Source data from Ref. [47].
Regulations 14 CFR § 121.195 (2025) [48] and SAFO 06012 [45] provide a pessimistic “cushion” between the minimum allowable runway length and the certified LDR [41]. The FAA restricts dispatch of an aircraft if its performance at its expected landing weight “(allowing for normal consumption of fuel …), would allow a full stop landing at the intended destination airport within 60 percent of the effective length” of the destination runway” [47].
Commercial transport aircraft designers must be cognizant that
- The FAA does not normally certify landing in the wet. Conversely, the EASA certifies landing distances on dry, wet and contaminated runways.
- In AC-25-7D and AC-91-79A, the FAA stipulates that estimated wet runway landing distances are 1.67 times the certified dry distance [44,49].
- The EASA requires extensive flight test validation to certify wet runway performance [42].
- Neither the FAA nor the EASA will certify landing distances with reverse thrust.
In the United States, regulation 14 CFR § 121.195 (2025) [48] permits scheduled operations to shorter runways provided that dispatch loads sufficient additional fuel to fly from the intended destination to an alternate airport that meets the entirety of the regulation. Following FAA directive SaFO 06012 [45], operators may multiply the unfactored landing distance by a 115% factor to determine compliance with the shorter primary runway.
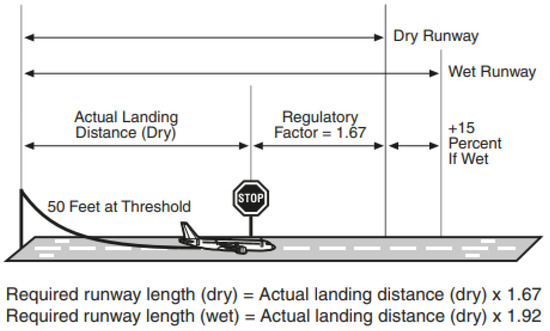
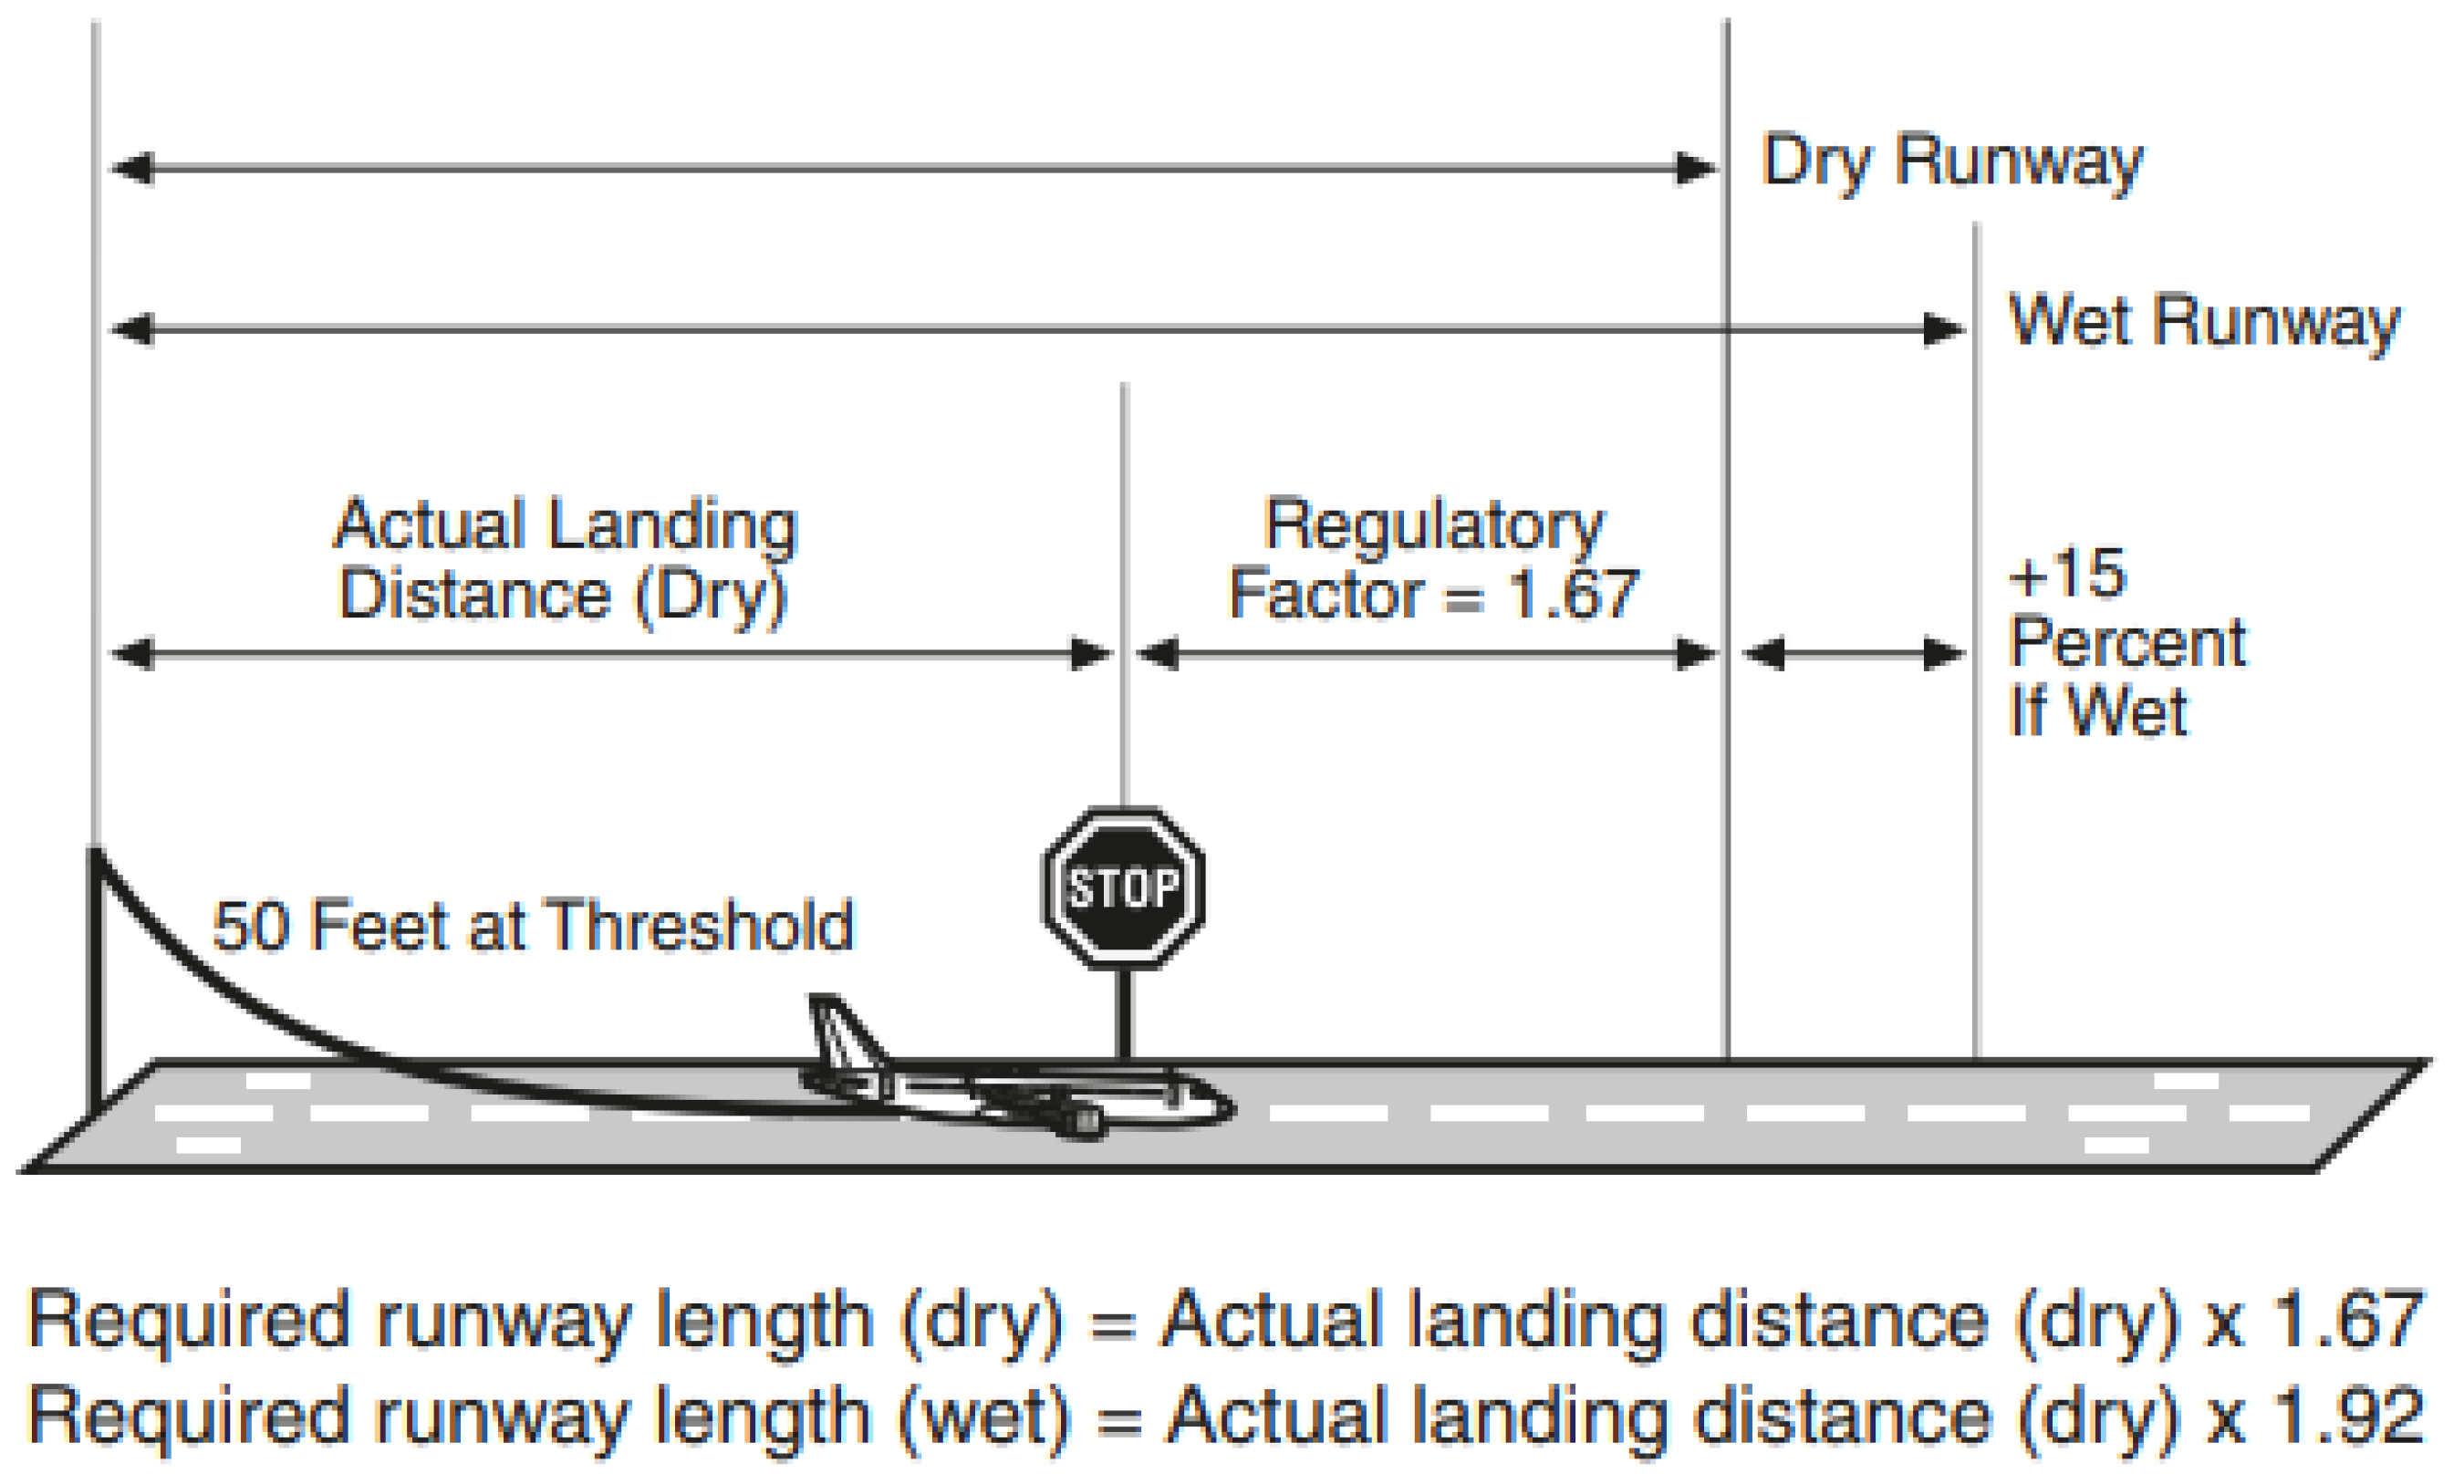
Similarly, the FAA allows dispatch to use either the “actual” wet landing distance so long as these distances do not fall below 167% of the “actual” dry landing distance or 115% of the 167% dry weather-factored landing distances for operations into wet runways; see 14 CFR § 121.195 (2025) [48] and refer to Figure 6 for further clarification.
Figure 6.
FAA double-factored rule to estimate the minimum required runway length for safe arrivals. Directly reproduced from Public domain document; Ref. [49].
When dispatch planners consider what constitutes a viable landing runway, they must consider the arrival airport’s declared landing distance available (LDA) in context with the published landing distance required. The default value for basic 14 CFR § 121.195 (2025) [48] compliance in the dry is as follows:
Meanwhile, the 14 CFR § 121.195 (2025) [48] short-runway rule, following SAFO 06012, is as follows [45]:
And the wet runway rule, following 14 CFR § 121.195, [48] as clarified by AC-91-79A, requires [49]
in the absence of certified wet-weather performance data.
SAFO 06012 [45] permits commercial aircraft like the B737 to operate on short runways like Runway 8 at KBUR (LDA = 5802 ft), Runway 22R at KMDW (LDA = 4629 ft), or Runway 15/33 at KDCA (LDA = 5204 ft). In the United States, a B737 flying with a full payload and typical reserves will have a still-winds unfactored dry runway LDR = ~4000 ft. It is legal to land at a dry runway no shorter than 4596 ft provided the aircraft has reserve fuel to fly to a designated alternate airport with LDA > 6680 ft. In the wet, the legal limit at the primary airport extends to require LDA > 7682 ft. Thus, an operator planning an arrival into KDCA in the dry might declare the long runway at KIAD (LDA = 11,500 ft) as an alternate if they plan to use crosswind runway 15/33. In the wet, dispatch limits the 737 to use Runway 1/19 (LDA = 6869 ft) and offset its payload to limit its arrival weight so that LDR < 3577 ft. Frequent flyers into DCA will be well acquainted with the weight restrictions and runway capacity restrictions that accompany inclement weather.
3.3. MIL-3013B Rules’ Speeds and Distances
MIL and FAA rules for landing-field length are broadly similar [40,41,43,48]. Each begins with the aircraft 50 ft above ground level, with plan touchdown ~1000 ft downwind of the threshold, and ends with the aircraft stopped. They differ in the nuance of the scheduled final approach speed, the allowable braking traction, and whether credit may be taken for reverse thrust.
Regarding permissible arrival runways, MIL-3013B rules are more straightforward than FAA rules: the arrival runway must be no shorter than the official published landing distance from 50 ft AGL to stop (LDR) based on weight, temperature, altitude, anti-ice-system status, runway traction (RCR), slope, and winds [43]. In other words,
MIL-STD-1797A defines the stall speed, Vs., as the greater of (1) the speed of steady, straight flight at CLmax; (2) the speed of unprovoked pitching, rolling, or yawing; and (3) the speed of intolerable buffet [49]. The FAA allows considerably more discretion with the definition of a stall, see FAA AC 25-7D § 8.1.3 [44].
MIL-STD-3013B rules define the landing flaps-powered approach speed as follows:
where VMCL is the minimum control airspeed with landing flaps [42].
Vpa = max (120% Vs, 105% VMCL)
When determining minimum control speed, MIL standard procedures prove “more stringent” than the corresponding civilian regulations [50]. Thus, compared to 14 CFR § 25, MIL-STD-3013B grants slightly less stall speed margins at landing and noticeably more control margins. This is consistent with the expectation that U.S. military transport aircraft operate in an environment where engine failures due to foreign-object-debris ingestion or small-arms fire are more likely than civilian aircraft.
One major difference between FAA rules and MIL rules concerns the use of reverse thrust. As noted above, the FAA forbids the use of reverse thrust to calculate the certified LDR even though pilots often use it. Conversely, MIL rules explicitly permit credit for reverse thrust. Aircraft like the Lockheed C-130-J have distinct published landing distances based on whether the pilot uses two or four engines in reverse thrust [51].
A second issue concerns operations on wet and contaminated runways. Both CS-25 and MIL-STD-3013B require the manufacturer to certify landing procedures and distance estimates for operations in severe weather [42,43]. The U.S. military characterizes braking traction in terms of the Runway Condition Reading, RCR [43]. The International Civil Aviation Organization (ICAO) specifies both qualitative and quantitative estimates consistent with the U.S. military [52]. This metric varies from RCR = 23, representing a standard hard-surface runway in the dry, to RCR = 7, which represents a wet, icy runway; see Table 1 and Table 2.
Table 1.
MIL-STD runway characteristics. Data from Ref. [42].
Table 2.
ICAO qualitative and quantitative braking capability. Data from Refs. [52,53].
MIL-STD-3013B specifies default rolling resistance and braking capability used in the “expansion” process to prepare certified landing distances [42]. The coefficient, μ, is the ratio of the total retardation force of the wheels (either inherent in the tires and bearings, or due to the brakes) over the weight on wheels (the aircraft weight less aerodynamic lift). The FAA provides somewhat contradictory advice, where 14 CFR § 25.109 [41] provides an elaborate wet-weather friction model which incorporates tire pressure, speed, and anti-skid system efficiency estimate for modeling a rejected take-off but remains silent with its utility in landing-distance estimation. The braking capability implied by this model is far superior to even RCR = 23 “dry-weather” values. Because real-world airport operations regularly measure runway traction but only broadly categorize their results to dispatch using the ICAO Qualitative or RCR nomenclature shown in Table 2, there is little reason to include an enhanced wet-weather model in a simplified concept-design model.
4. “Calibrated” Numerical Simulation
This section comprises an overview of the kinematic simulations used to develop additional basis data to support clean-sheet vehicle design. This custom-written point-mass time step-integrating simulation follows the regulatory basis described above in Section 3. It is an evolved version of a procedure described in author Takahashi’s book [4] and his earlier conference papers, specifically Takahashi, Wood, and Bays [54]. Civilian and military regulations specify key aircraft speeds in terms of KEAS. Kinematic models need to integrate ground distances in terms of ground speed. For this study, which restricts itself to sea-level, standard-day performance in the absence of winds, I conflate KEAS~KTAS.
4.1. Overall Description of the Landing Simulation
The simulation computes the total landing distance required (LDR), the distance from a point where the aircraft is 50 ft above the airfield level until it reaches a complete stop. It also computes the landing ground roll (LGR), the distance to stop from the point where the tires first contact the runway; see Figure 7. Conceptually, this simulation follows the steps proposed by Breguet [9] and expanded upon by Lan and Roskam [1].
Figure 7.
Four-phase kinematic model implemented in the numerical simulation used to prepare the revised empirical data.
The time-step-integrating simulation decomposes landing into four segments:
It begins with stabilized, descending flight at the scheduled final approach speed (Vref for FAA aircraft; Vpa for MIL aircraft) 50 ft above the airfield and a descent flight path angle of −3°. Compute the first portion of distance covered in the air phase of landing using simple geometry:
The second portion accounts for the flare before the wheels contact the ground: the pilot retards the engine thrust to idle and elevates the nose to arrest the sink rate as the aircraft enters ground effect for that perfectly smooth touchdown. The pilot may not exceed the tail strike angle of attack in this procedure. The deceleration period comprises the time to cover flight to the “aim point,” shown in Equation (14) to be ~955 ft down range from the threshold plus additional time and distance accrued during the flare maneuver (6 s, as determined by reverse engineering-certified A320 performance), after Ref. [54].
The imbalance between aerodynamic and propulsive forces controls the deceleration rate. The touchdown speed in knots is a byproduct of the deceleration speed and the time:
where the drag coefficient is the following function of the lift coefficient:
And the correlation between angle-of-attack and the lift coefficient including finite-wing effects is as follows:
ARe is the effective aspect ratio, including a ground-effect correction based upon the height above ground, AGL:
The simulation begins by inferring the relevant CL and α from the final approach speed conforming to the applicable regulatory basis (Vref or Vpa). Flight idle thrust, TIDLE, is derived from experience with other high-bypass ratio engines, it is a negligible ~1% of take-off thrust with some airspeed-dependent lapse.
Once the wheels touch down, the plane needs to de-rotate so that all wheels are firmly in contact with the runway. This de-rotation process takes ~4 s, as determined by reverse engineering-certified A320 performance, after Ref. [39]. Braking action is a function of the weight on wheels, the traction of the tires, and the effectiveness of the wheel brakes. After de-rotation, lift dump spoilers can become effective, reducing CL0. The simulation numerically integrates the following kinematics using a trapezoidal integration method with a 0.1 s time step from touchdown until the vehicle comes to a complete stop:
and
where the initial velocity is that inferred at touchdown, above, as in Equation (17):
The point mass kinematics may be discretized as follows:
where at each time step,
FAA-certified distances use only the retarding forces developed by the wheel brakes to stop. MIL 3013 distances include credit for a reverse-thrust system which develops −50% of take-off thrust to assist the wheel brakes [43].
For maximum-effort dry-weather braking, previous work with the A320 indicates that its certified distances utilize the sort of braking capability implied by ESDU 71026 [47]; refer back to Figure 6. For wet-weather distances, the simulation uses μ = 0.25, as associated with RCR = 15 [43].
4.2. Additional Statistical Data to Develop and/or Augment Landing-Distance Estimates
To augment the available flight-manual data, I use the simulation to predict 50 ft to stop distances for a full-factorial design space trade of hypothetical tube-and-wing aircraft, with flapped wings embodying a wide range of possible configurations:
- W/S from 200 lbf/ft2 to 50 lbf/ft2 at landing.
- AR from 5 to 10 (FAA), and 4 to 10 (MIL).
- CLmax of 2.0, 2.5, and 3.0.
- CL0 in the air, gear out = 0.7; on the ground, deployed spoilers = 0.3.
- CD0 = 0.0550; CD0 with deployed spoilers = 0.0800.
- Landing flare time = 6 s (empirically determined to match A320 AFM),
- De-rotation time = 4 s (empirically determined to match A320 AFM).
- Wheel-braking coefficients:
- FAA dry: μ follows ESDU 71026 [47] (determined to match A320 AFM);
- MIL dry: μ = 0.38 follows RCR = 23 [43];
- FAA/MIL wet: μ = 0.25 following RCR = 15 [43].
- Reverse thrust: None (FAA), 50% of take-off thrust (MIL).
When given A320-type values, the simulation closely matches its scheduled performance; refer back to Figure 1.
4.3. Analysis of Statistical Data to Develop Improved FAA Landing-Distance Estimates
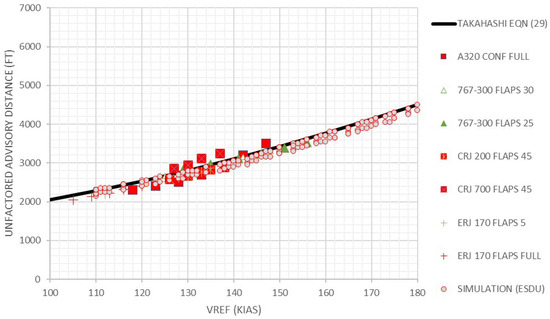
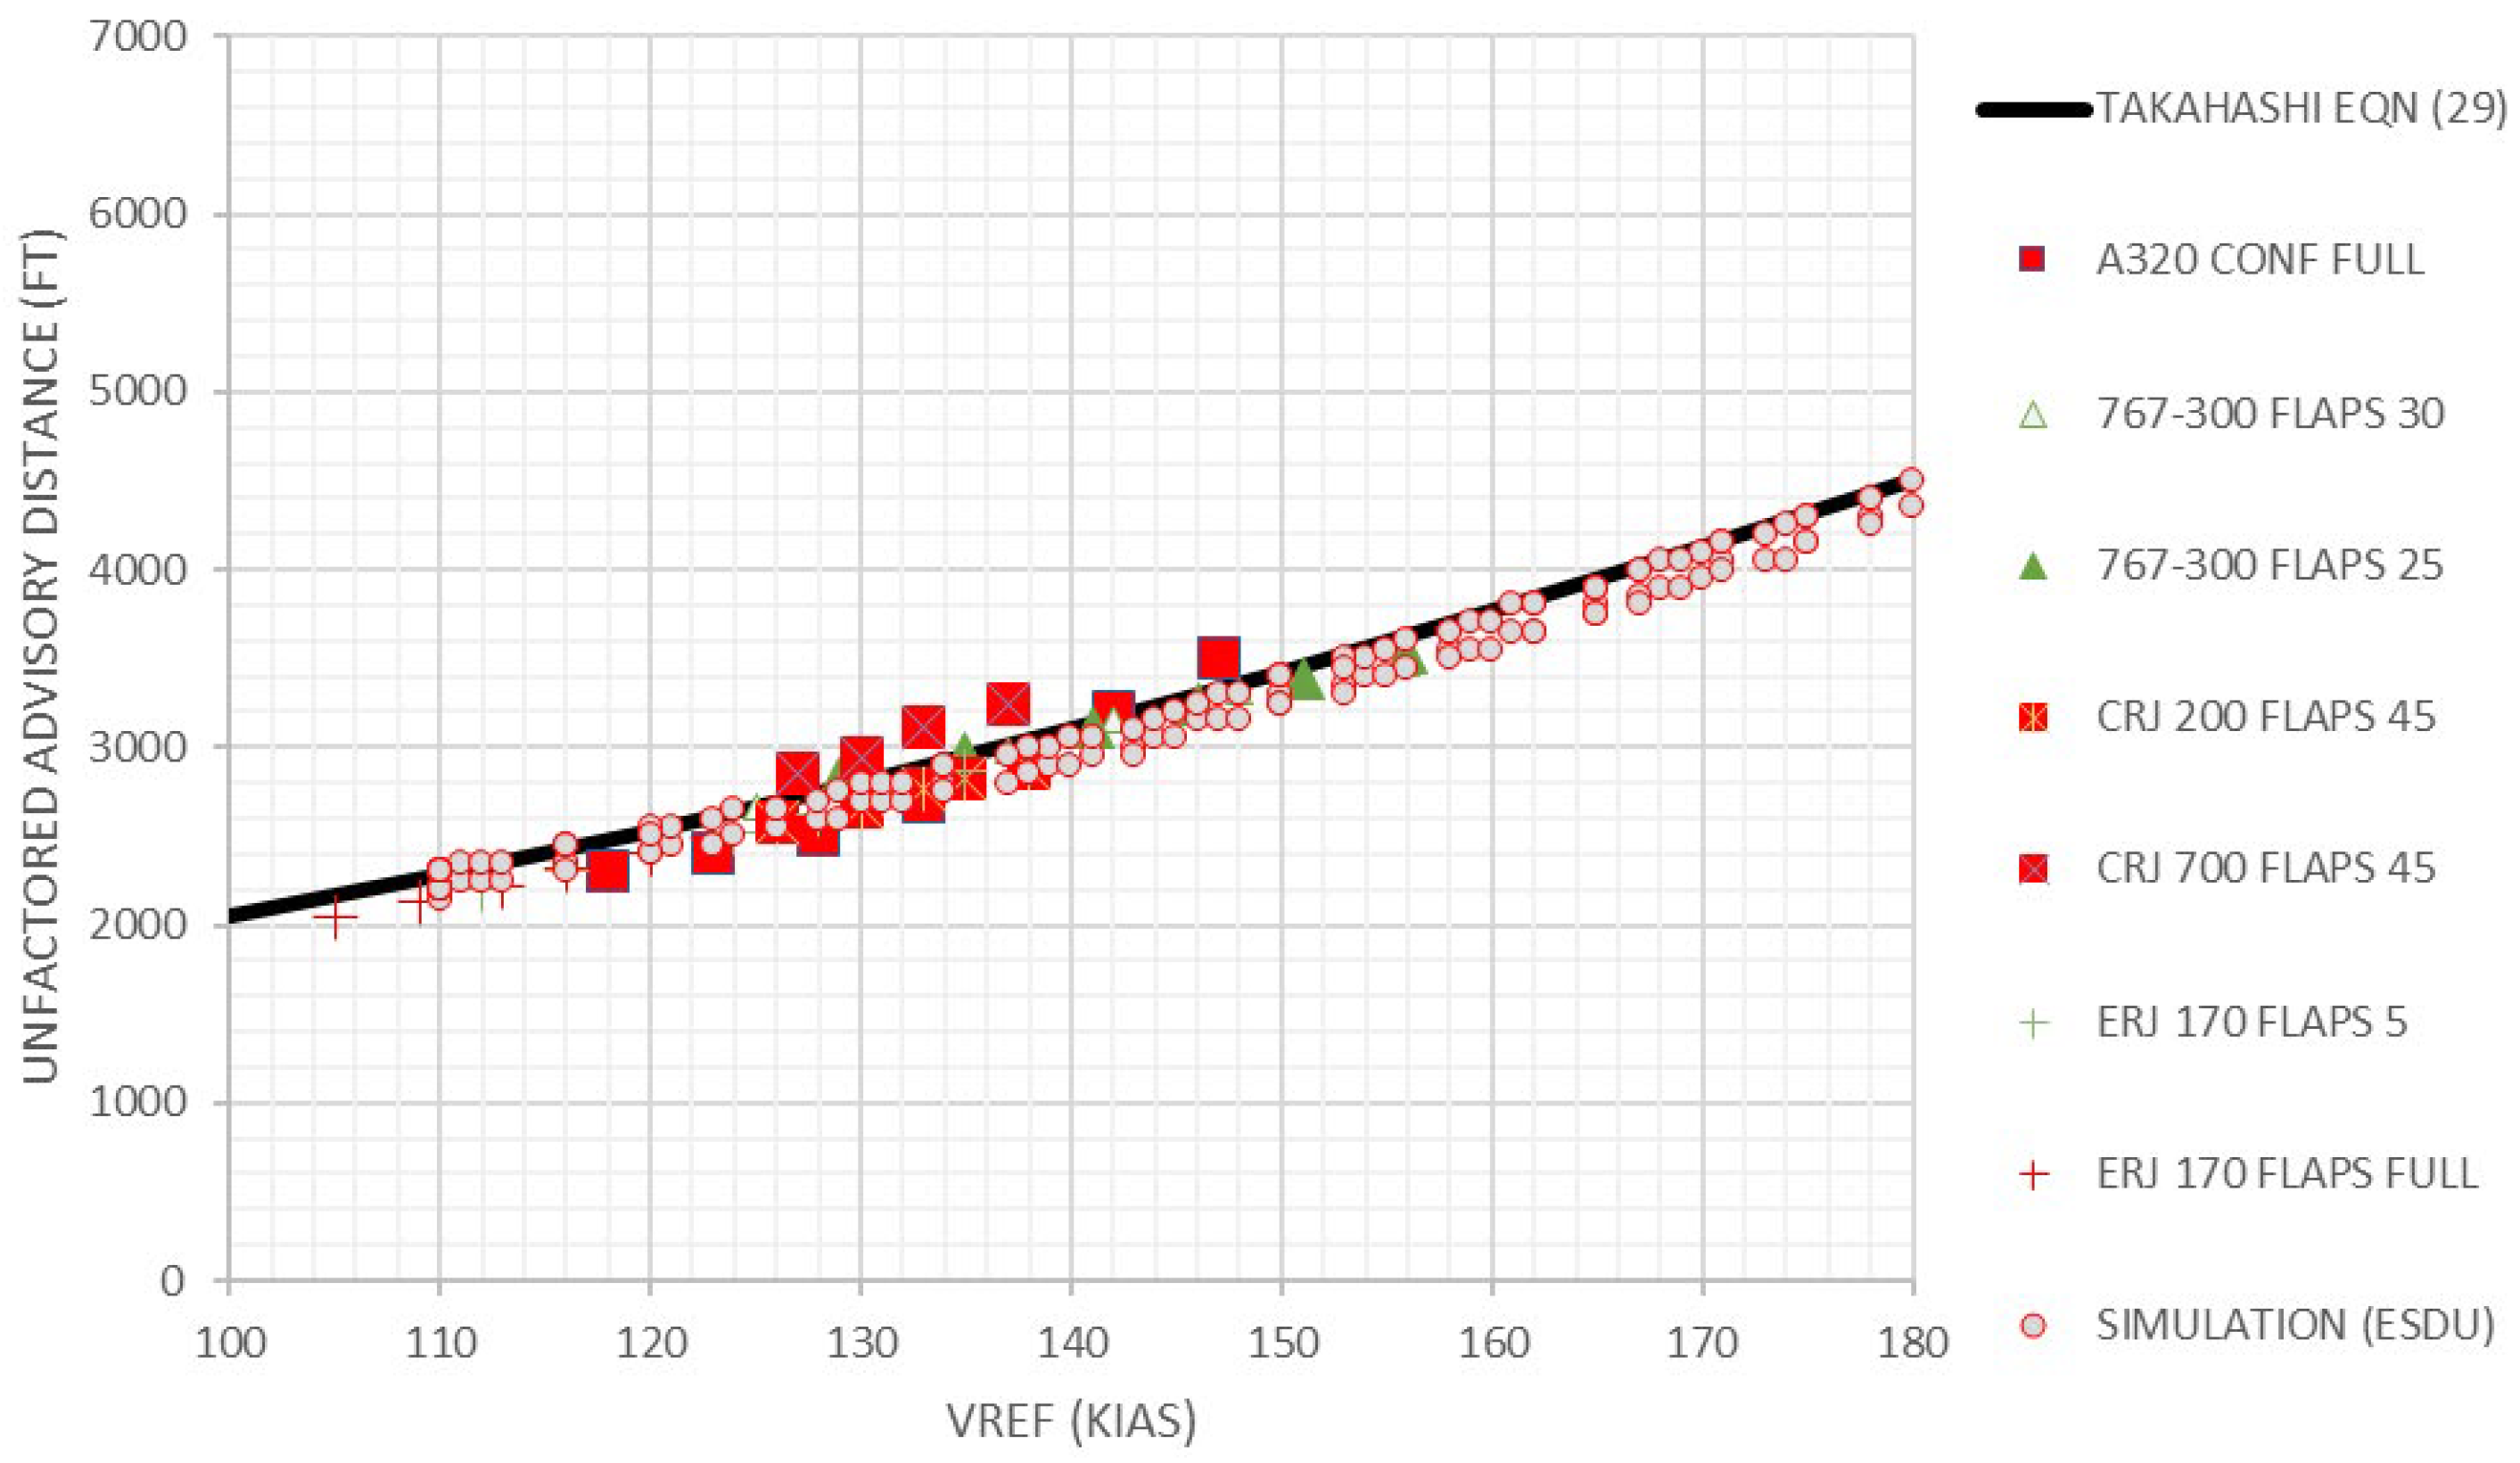
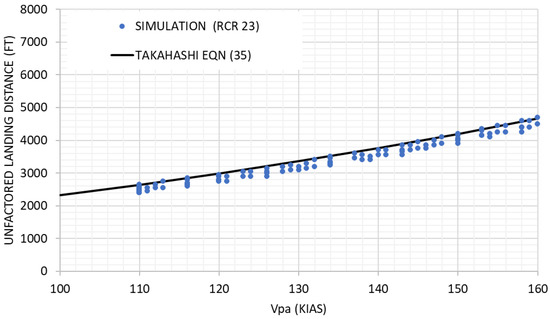
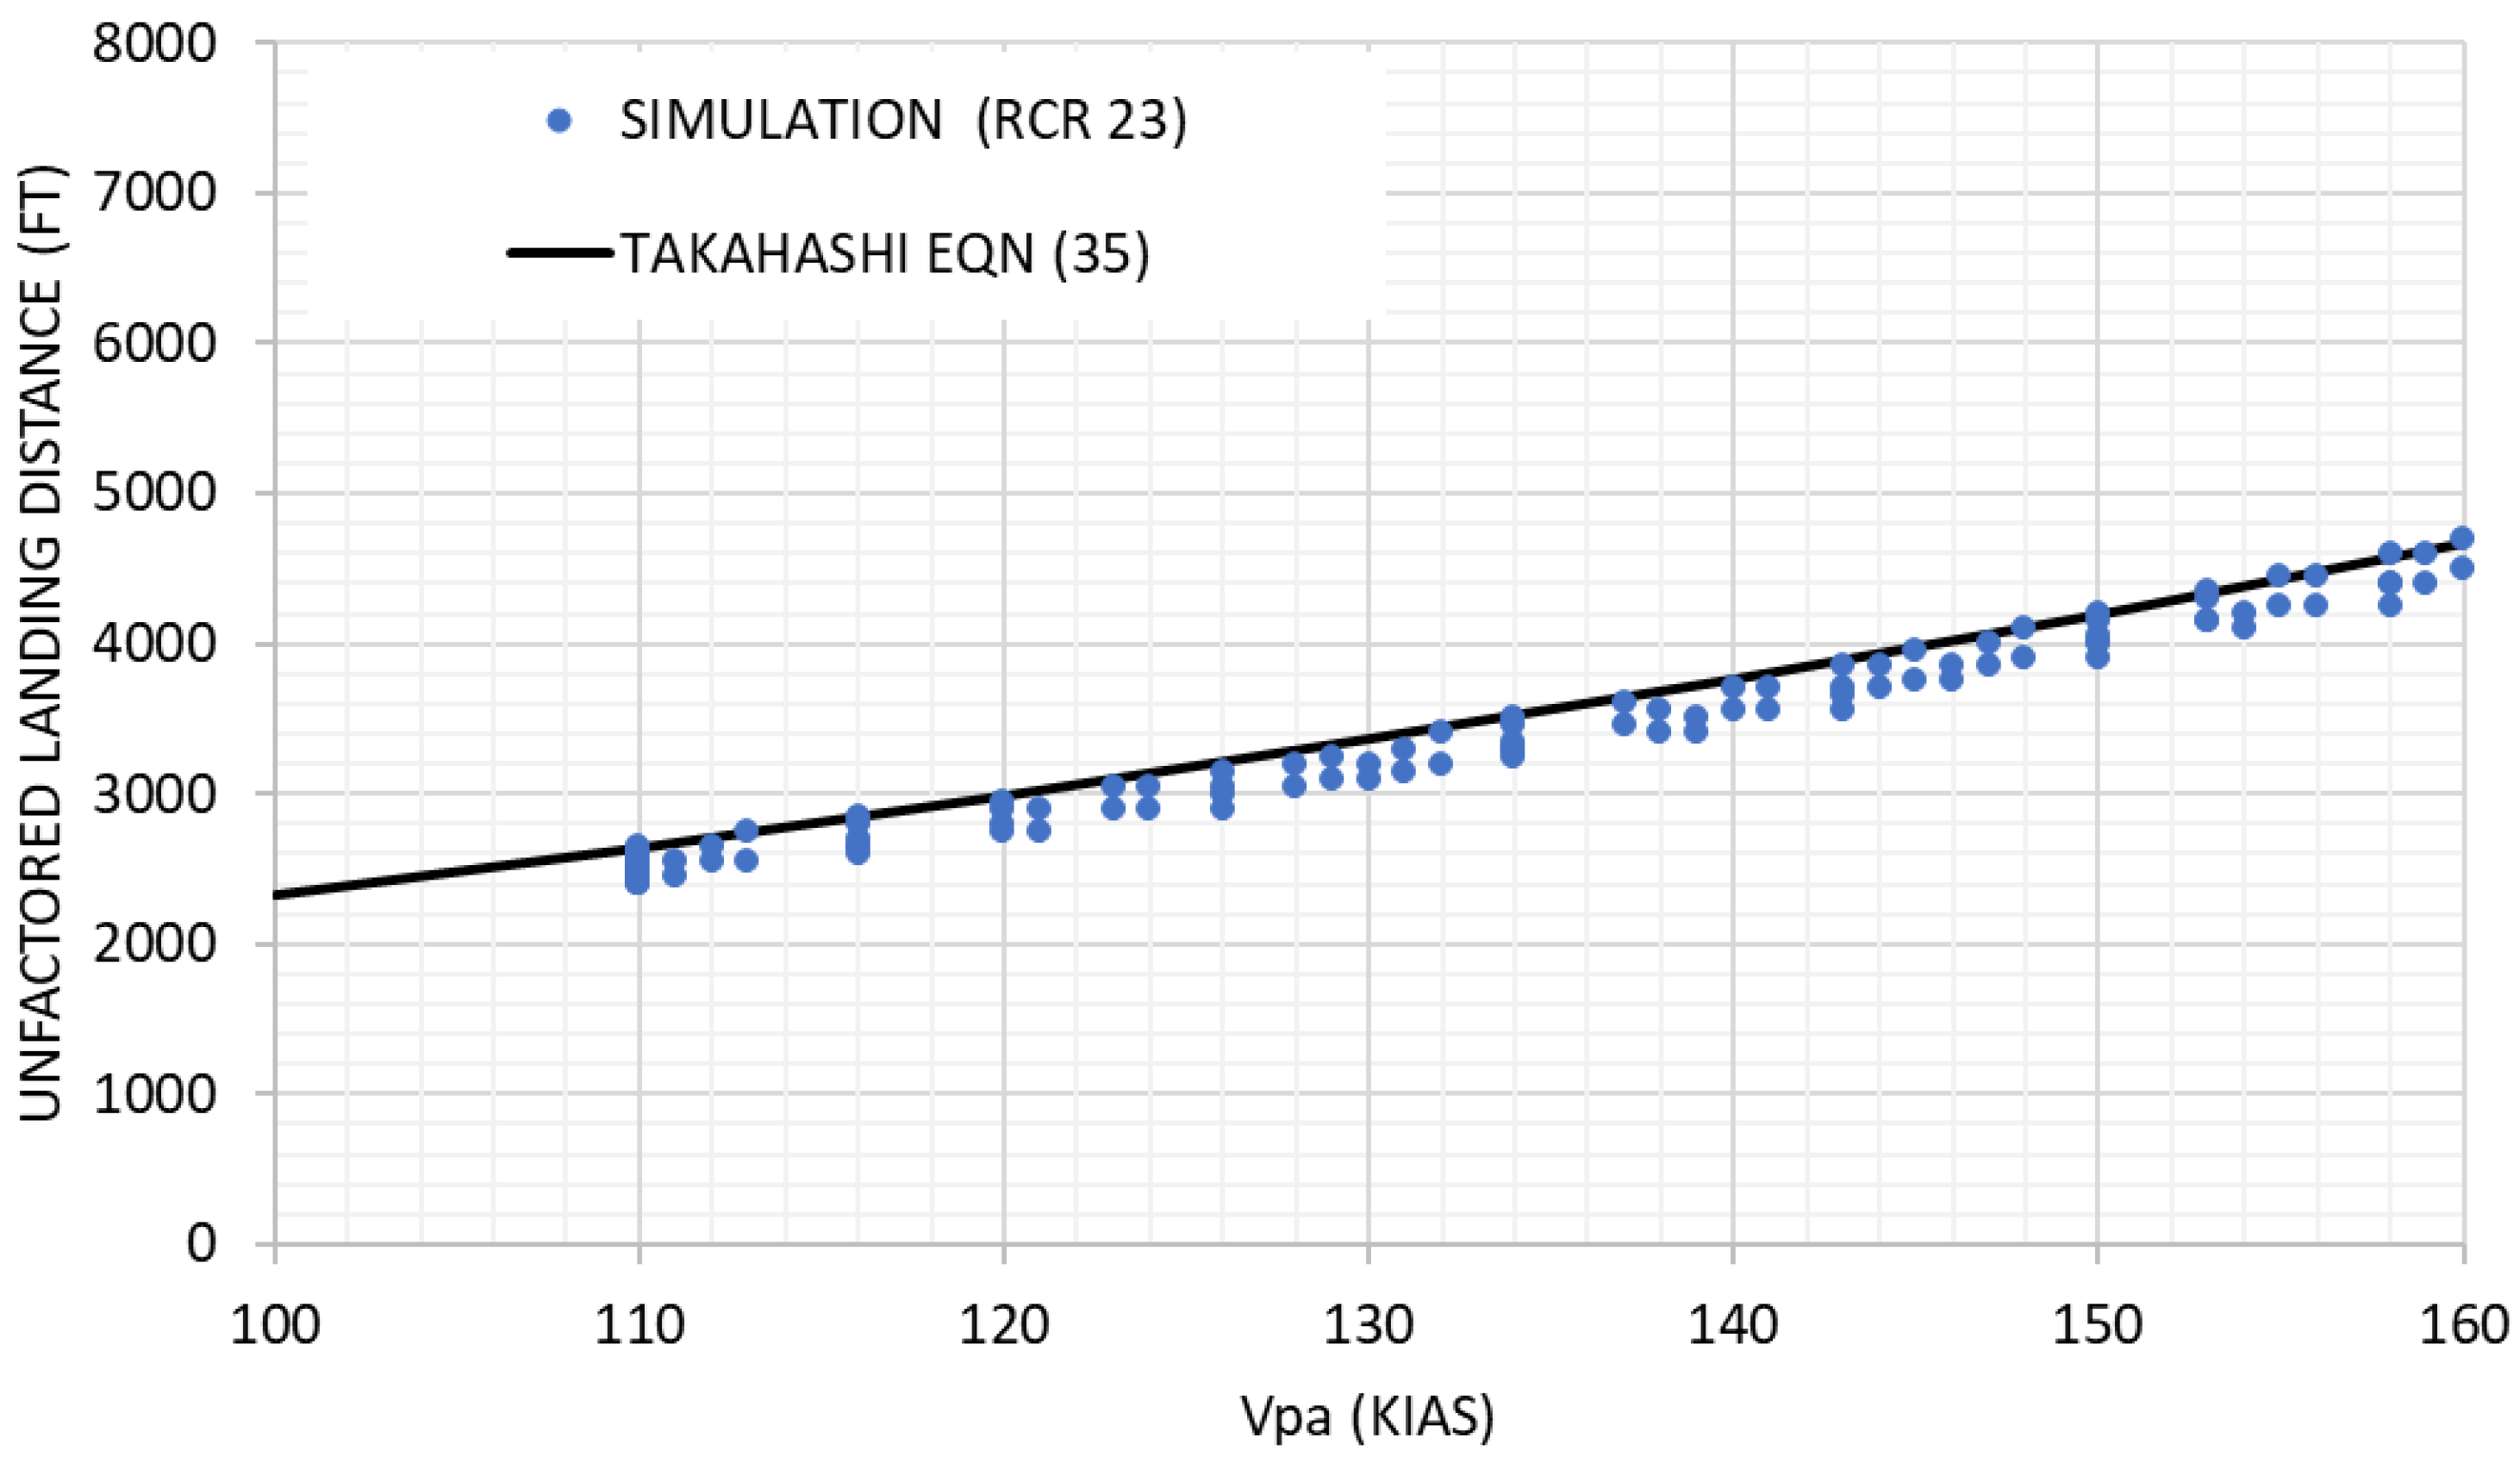
Figure 8 demonstrates how the 186 simulation runs following FAA rules and presuming ESDU 71026 braking traction, with timings calibrated to best match the A320 AFM, nicely overlaying the flight manual performance of the A320, B767-300, CRJ 200, CRJ 700, and ERJ 170 for landing at sea level under standard-day conditions.
Figure 8.
Revised empirical equation in comparison with simulation and certified flight-manual data for sea-level, standard-day landing in the dry.
For safety-of-flight reasons, aircraft flight manuals do not present “mean” performance estimates; this work develops an equation to intentionally produce an empirical equation with a 90% confidence that the actual simulated performance will exceed the simplified equation. Using this basis, the 90% confidence “conservative fit” of the FAA rules’ dry-weather simulation leads to the following equation, with an RMS error of 116 ft:
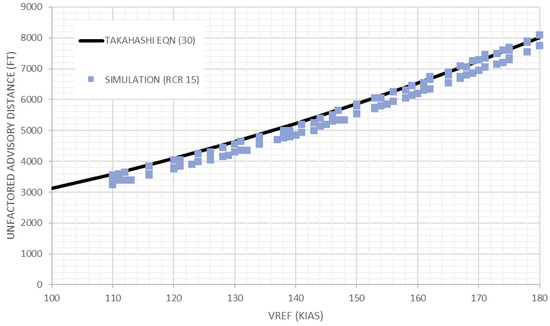
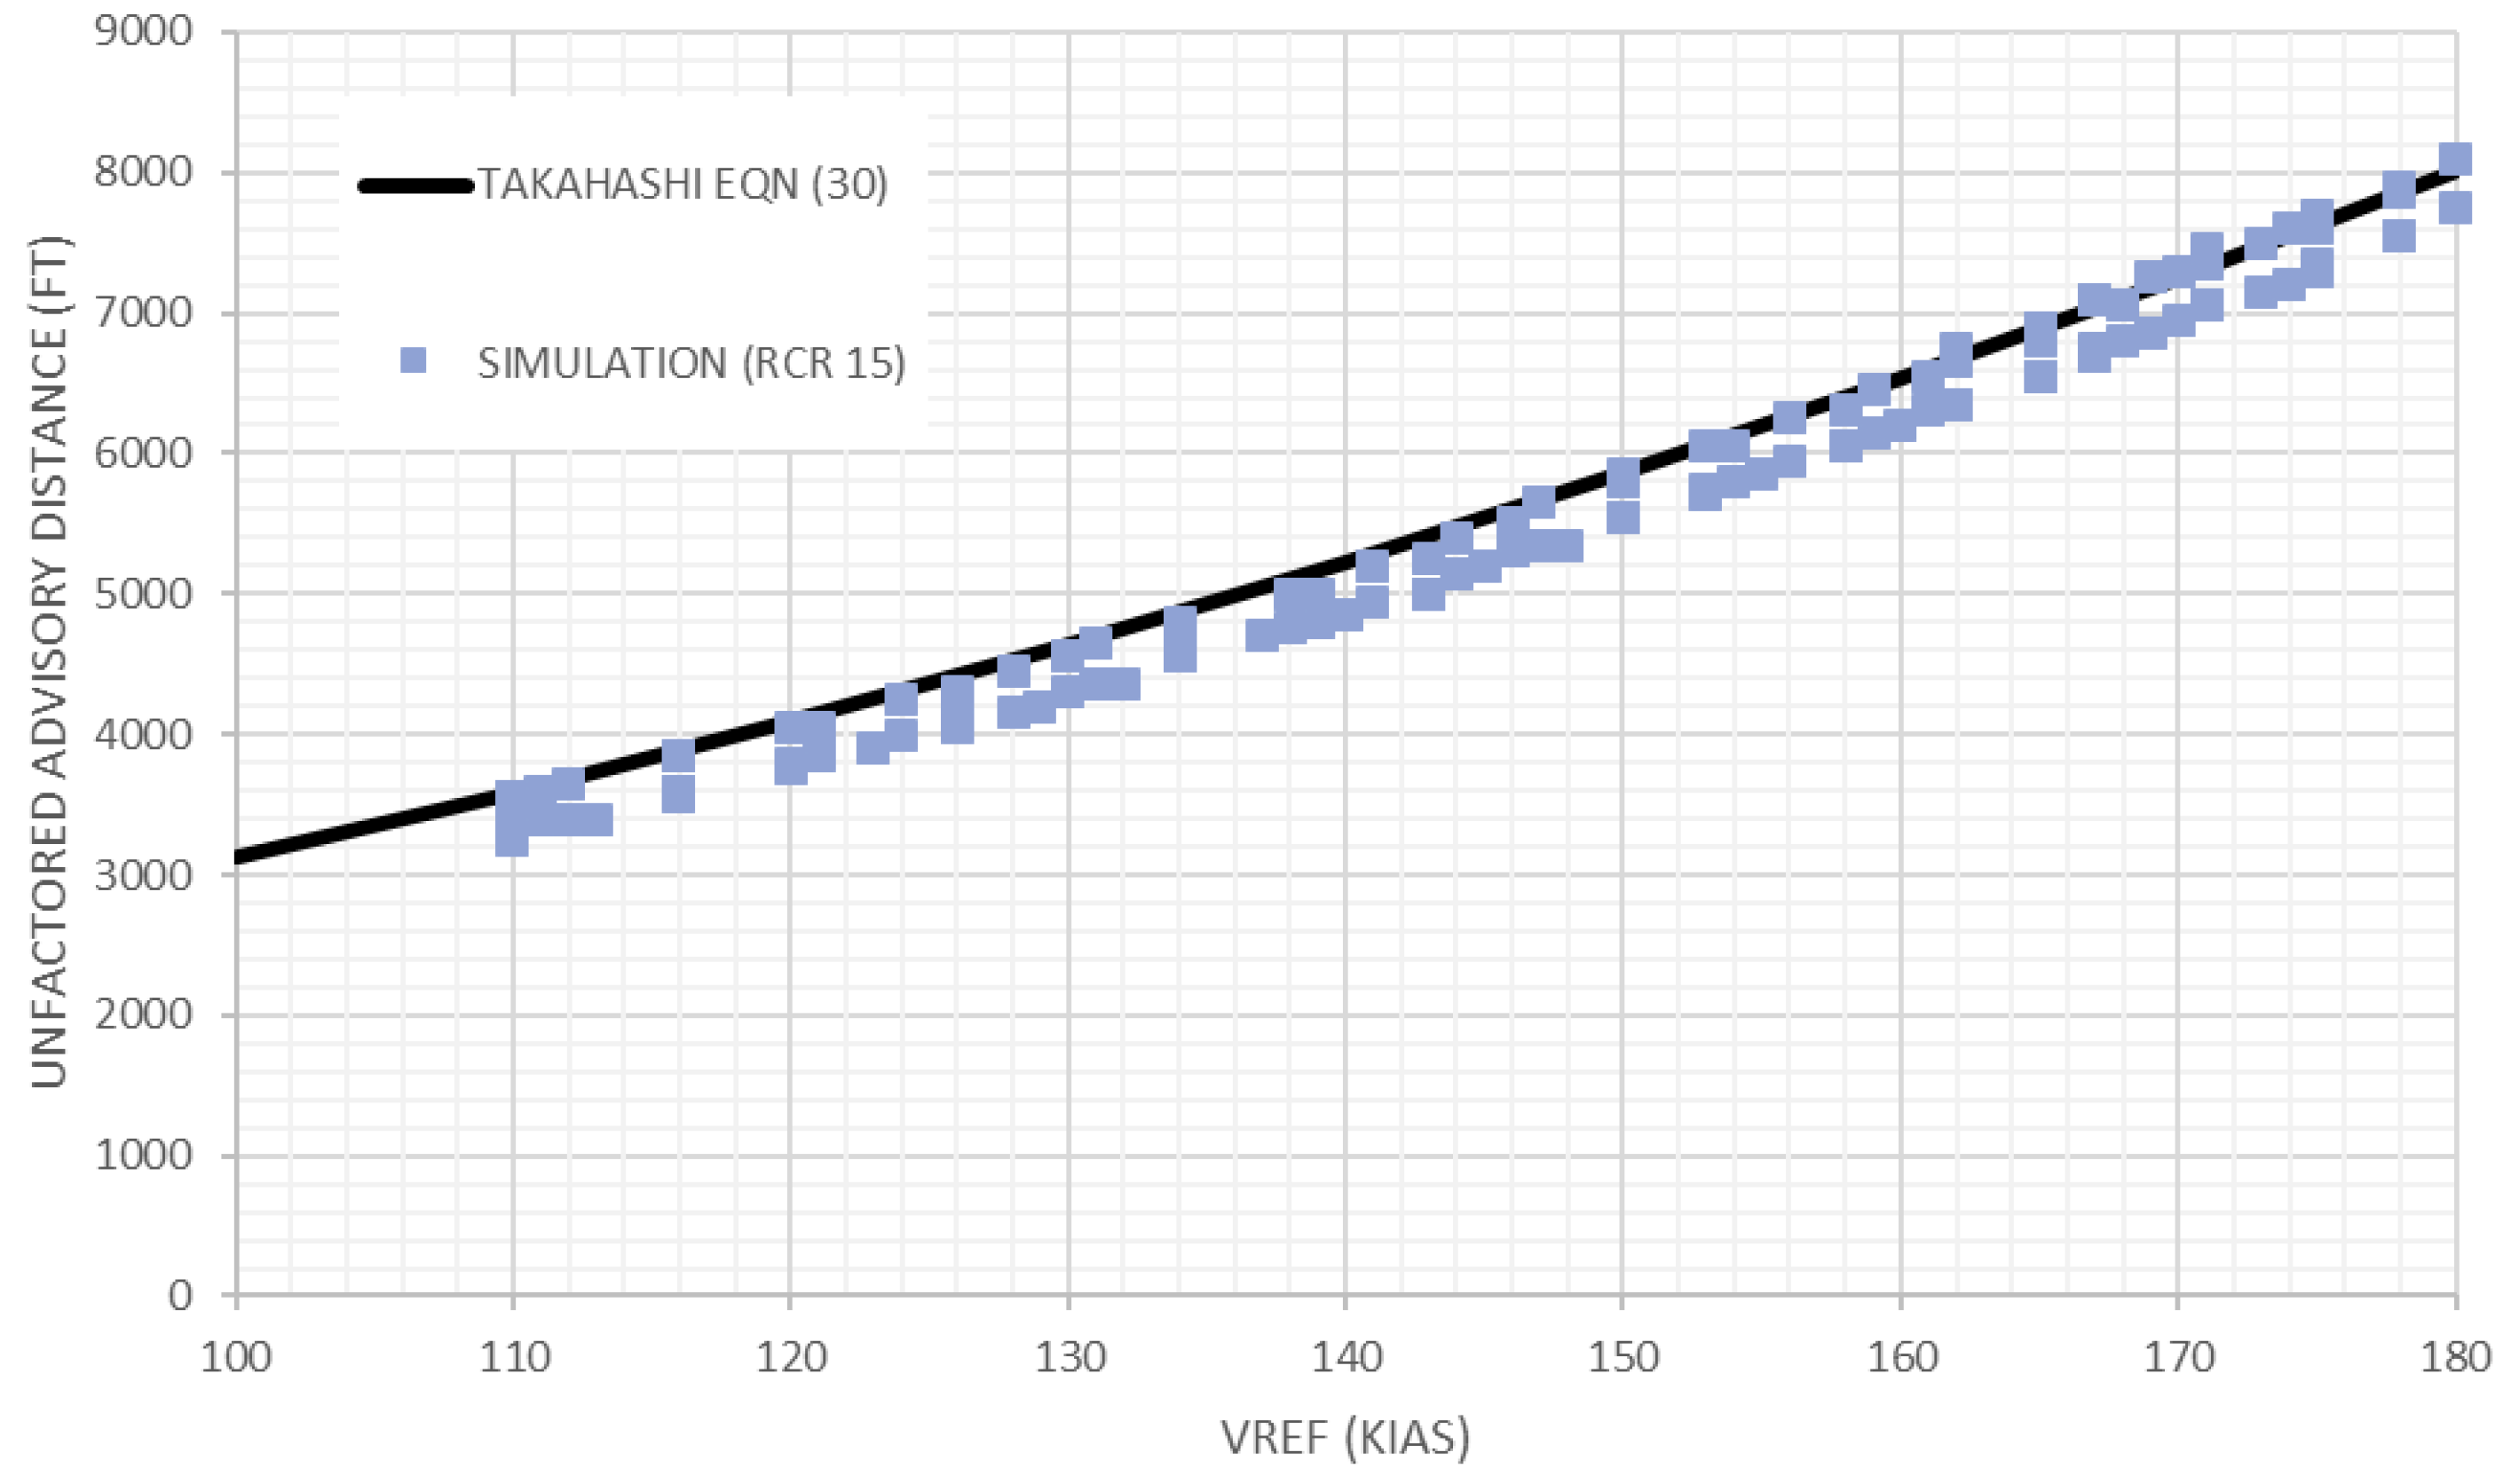
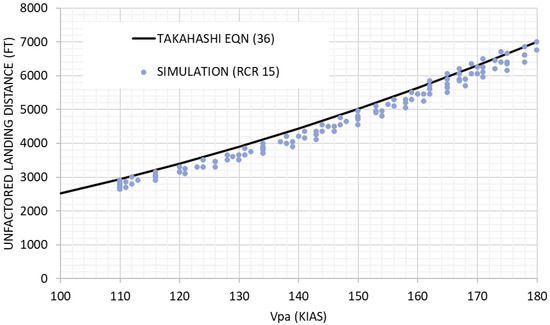
To develop an empirical fit for wet-weather performance, we repeat the process but now utilize an RCR = 15 tire traction model where the braking action is limited to μ = 0.25 [31]. A statistical set of 168 samples represents a full-factorial survey with varied wing loading, maximum lift coefficient, spoiler effectiveness, and lift slope; see Figure 9 (overleaf). Using this basis, the 90% confidence value “conservative fit” substantiates the following equation with an RMS error of 248 ft:
Figure 9.
Revised empirical equation compared to numerical simulations for sea-level, standard-day landing in the wet.
A traditional quadratic curve fit can approximate the dry- and wet-weather simulations to a high degree of accuracy: R2 = 0.9947 for the dry and R2 = 0.9939 for the wet.
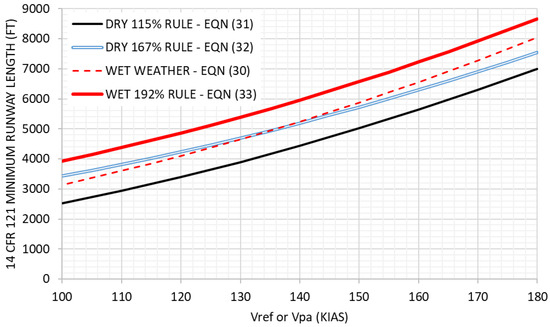
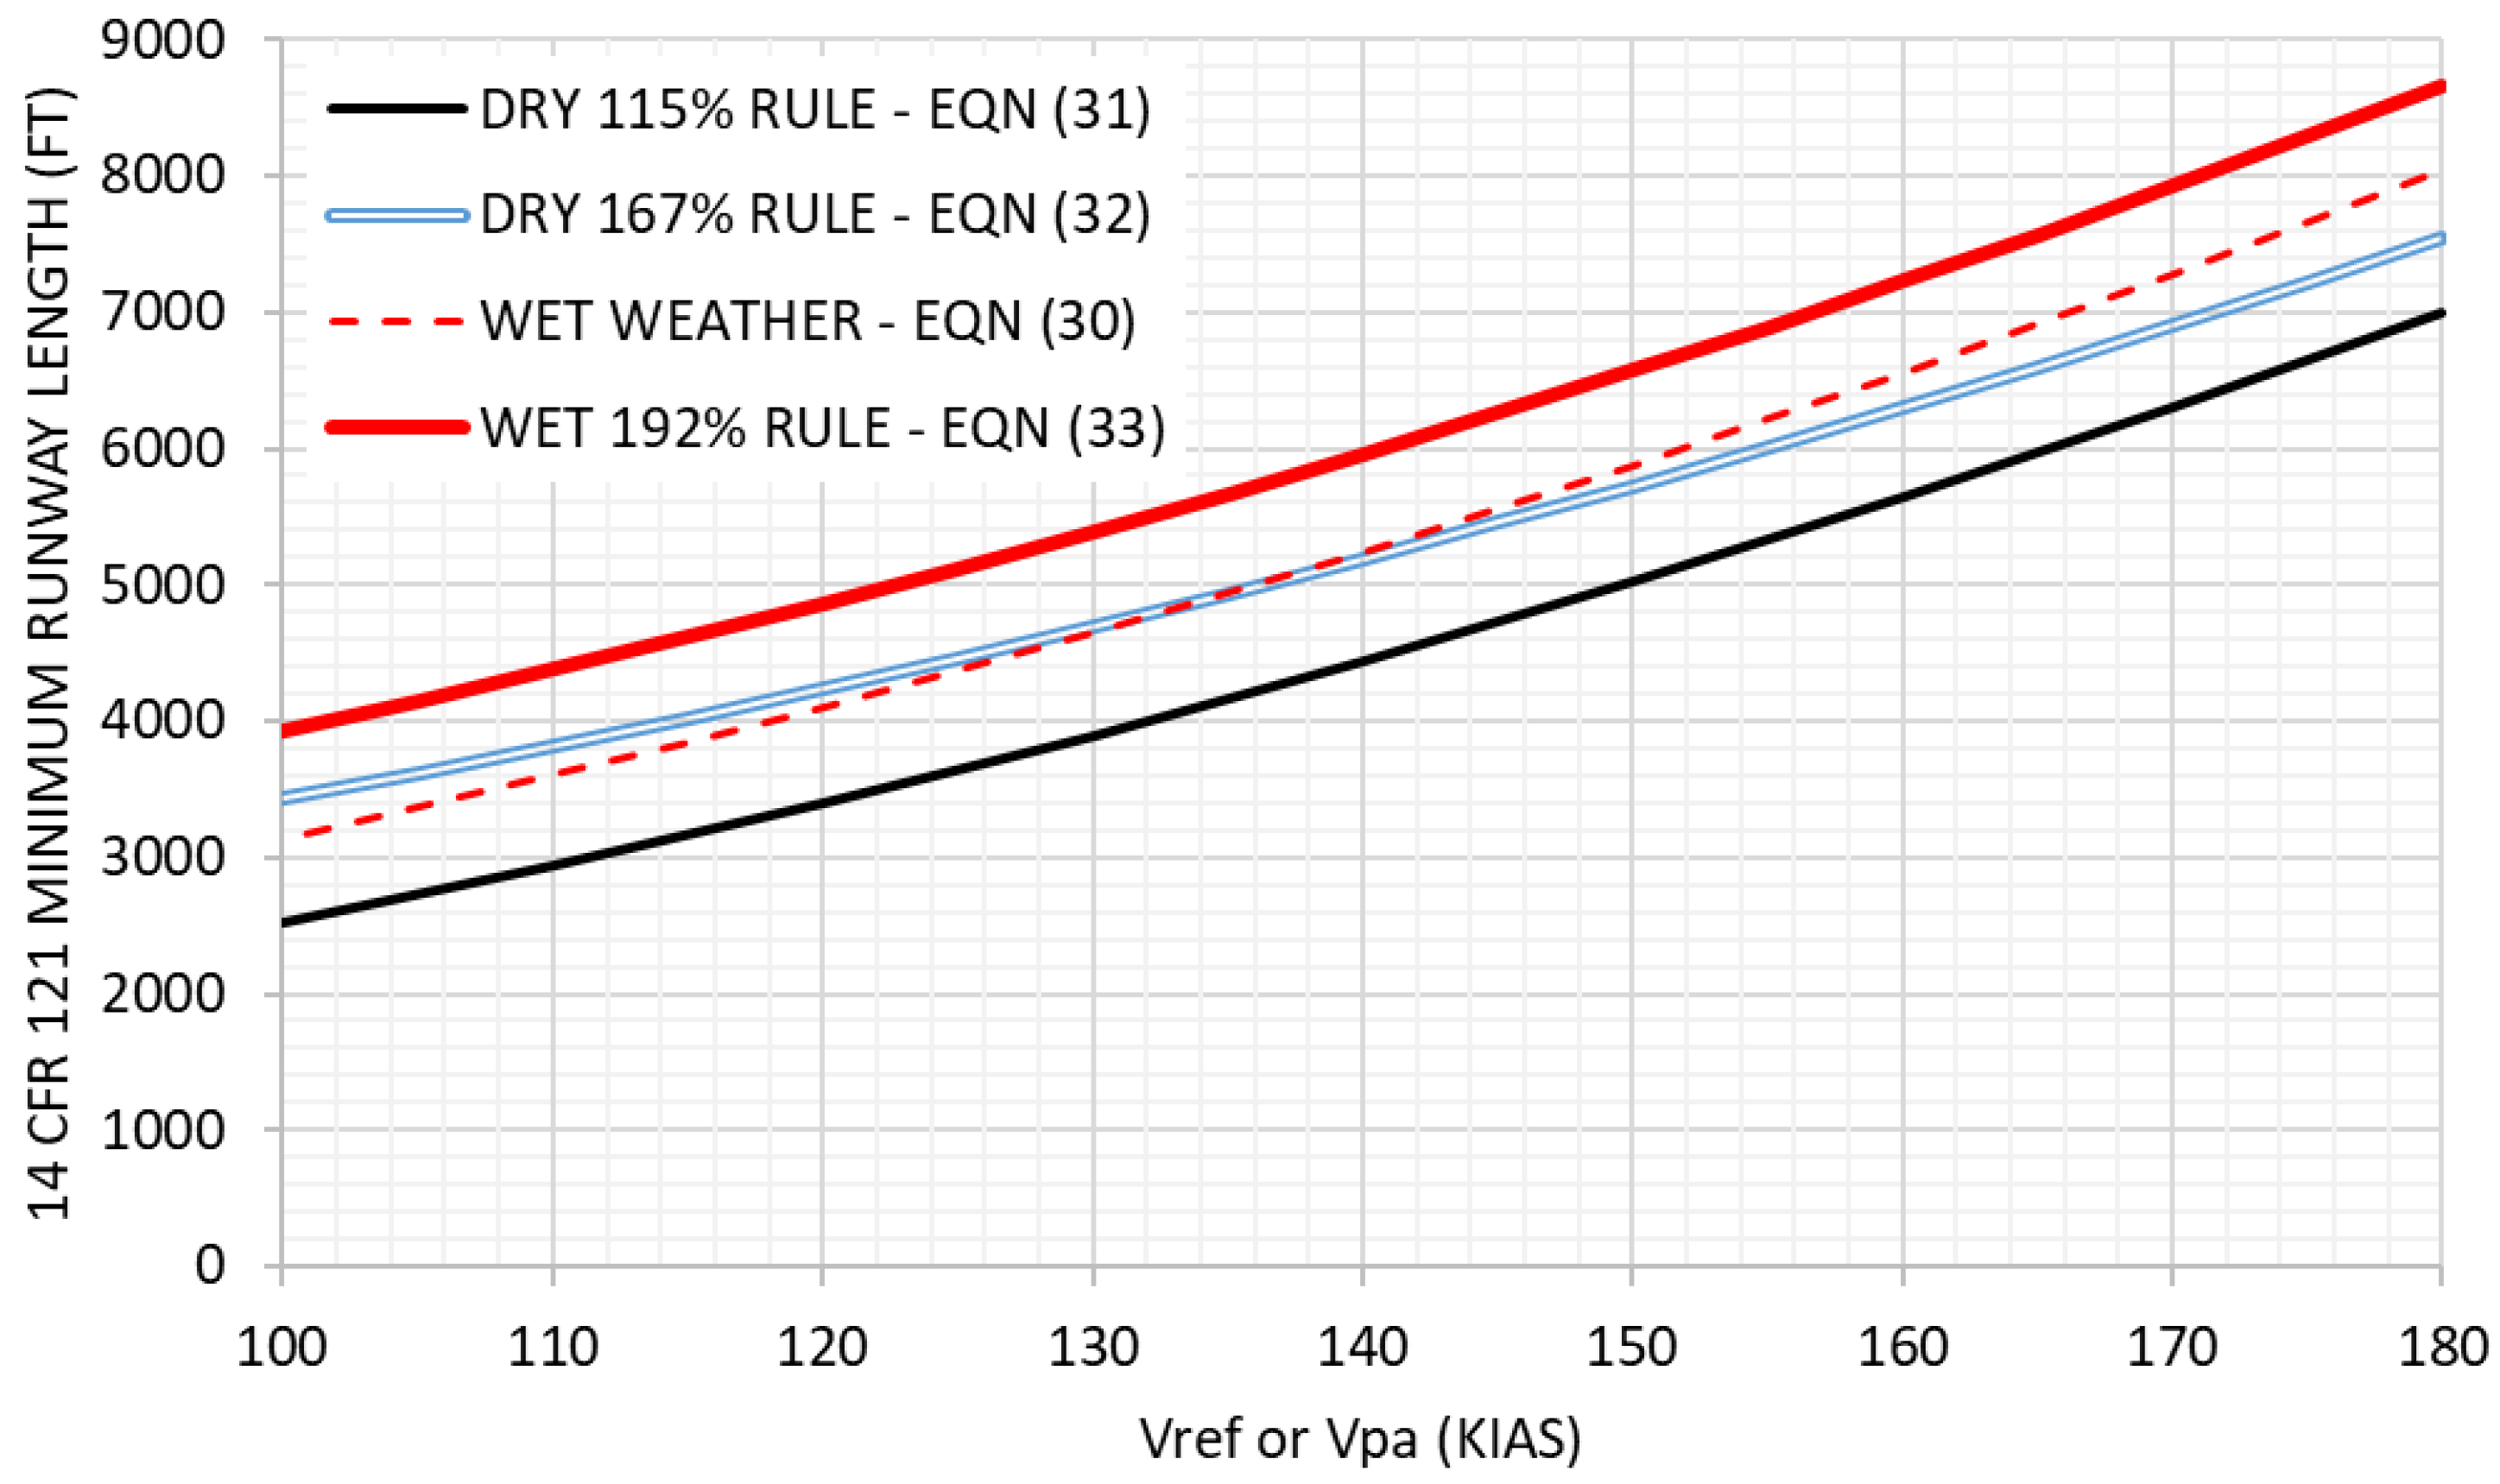
For concept design, the landing distance available (LDA) for the design mission short runway must fall under either the 115% SaFO factored rule, the 167% 14 CFR § 121.195(b) rule, the 14 CFR § 121.195(d) “actual” wet runway rule, or the 115% of 14 CFR § 121.195(b) “factored dry” wet runway rule, as clarified by AC 91-79A. In other words,
Putting these together, Figure 10 provides the concept-design team’s estimate of the final approach speed suitable for FAA-certified operations. For example, an LDA = 5000 ft airport requires Vref < 150 knots for 115% rule dry landings yet restricts Vref < 135 knots for actual μ = 0.25 wet landings. The use of the 192% rule to estimate wet runway performance would drive the team to consider an unnecessarily challenging goal to have Vref < 122 knots. This reiterates an industry practice where FAA-certified aircraft voluntarily seek formal recognition of demonstrated wet-weather landing performance.
Figure 10.
Comparison of revised empirical equations for field performance-constrained design.
4.4. Analysis of Statistical Data to Develop B-737 Family FAA Landing-Distance Estimates
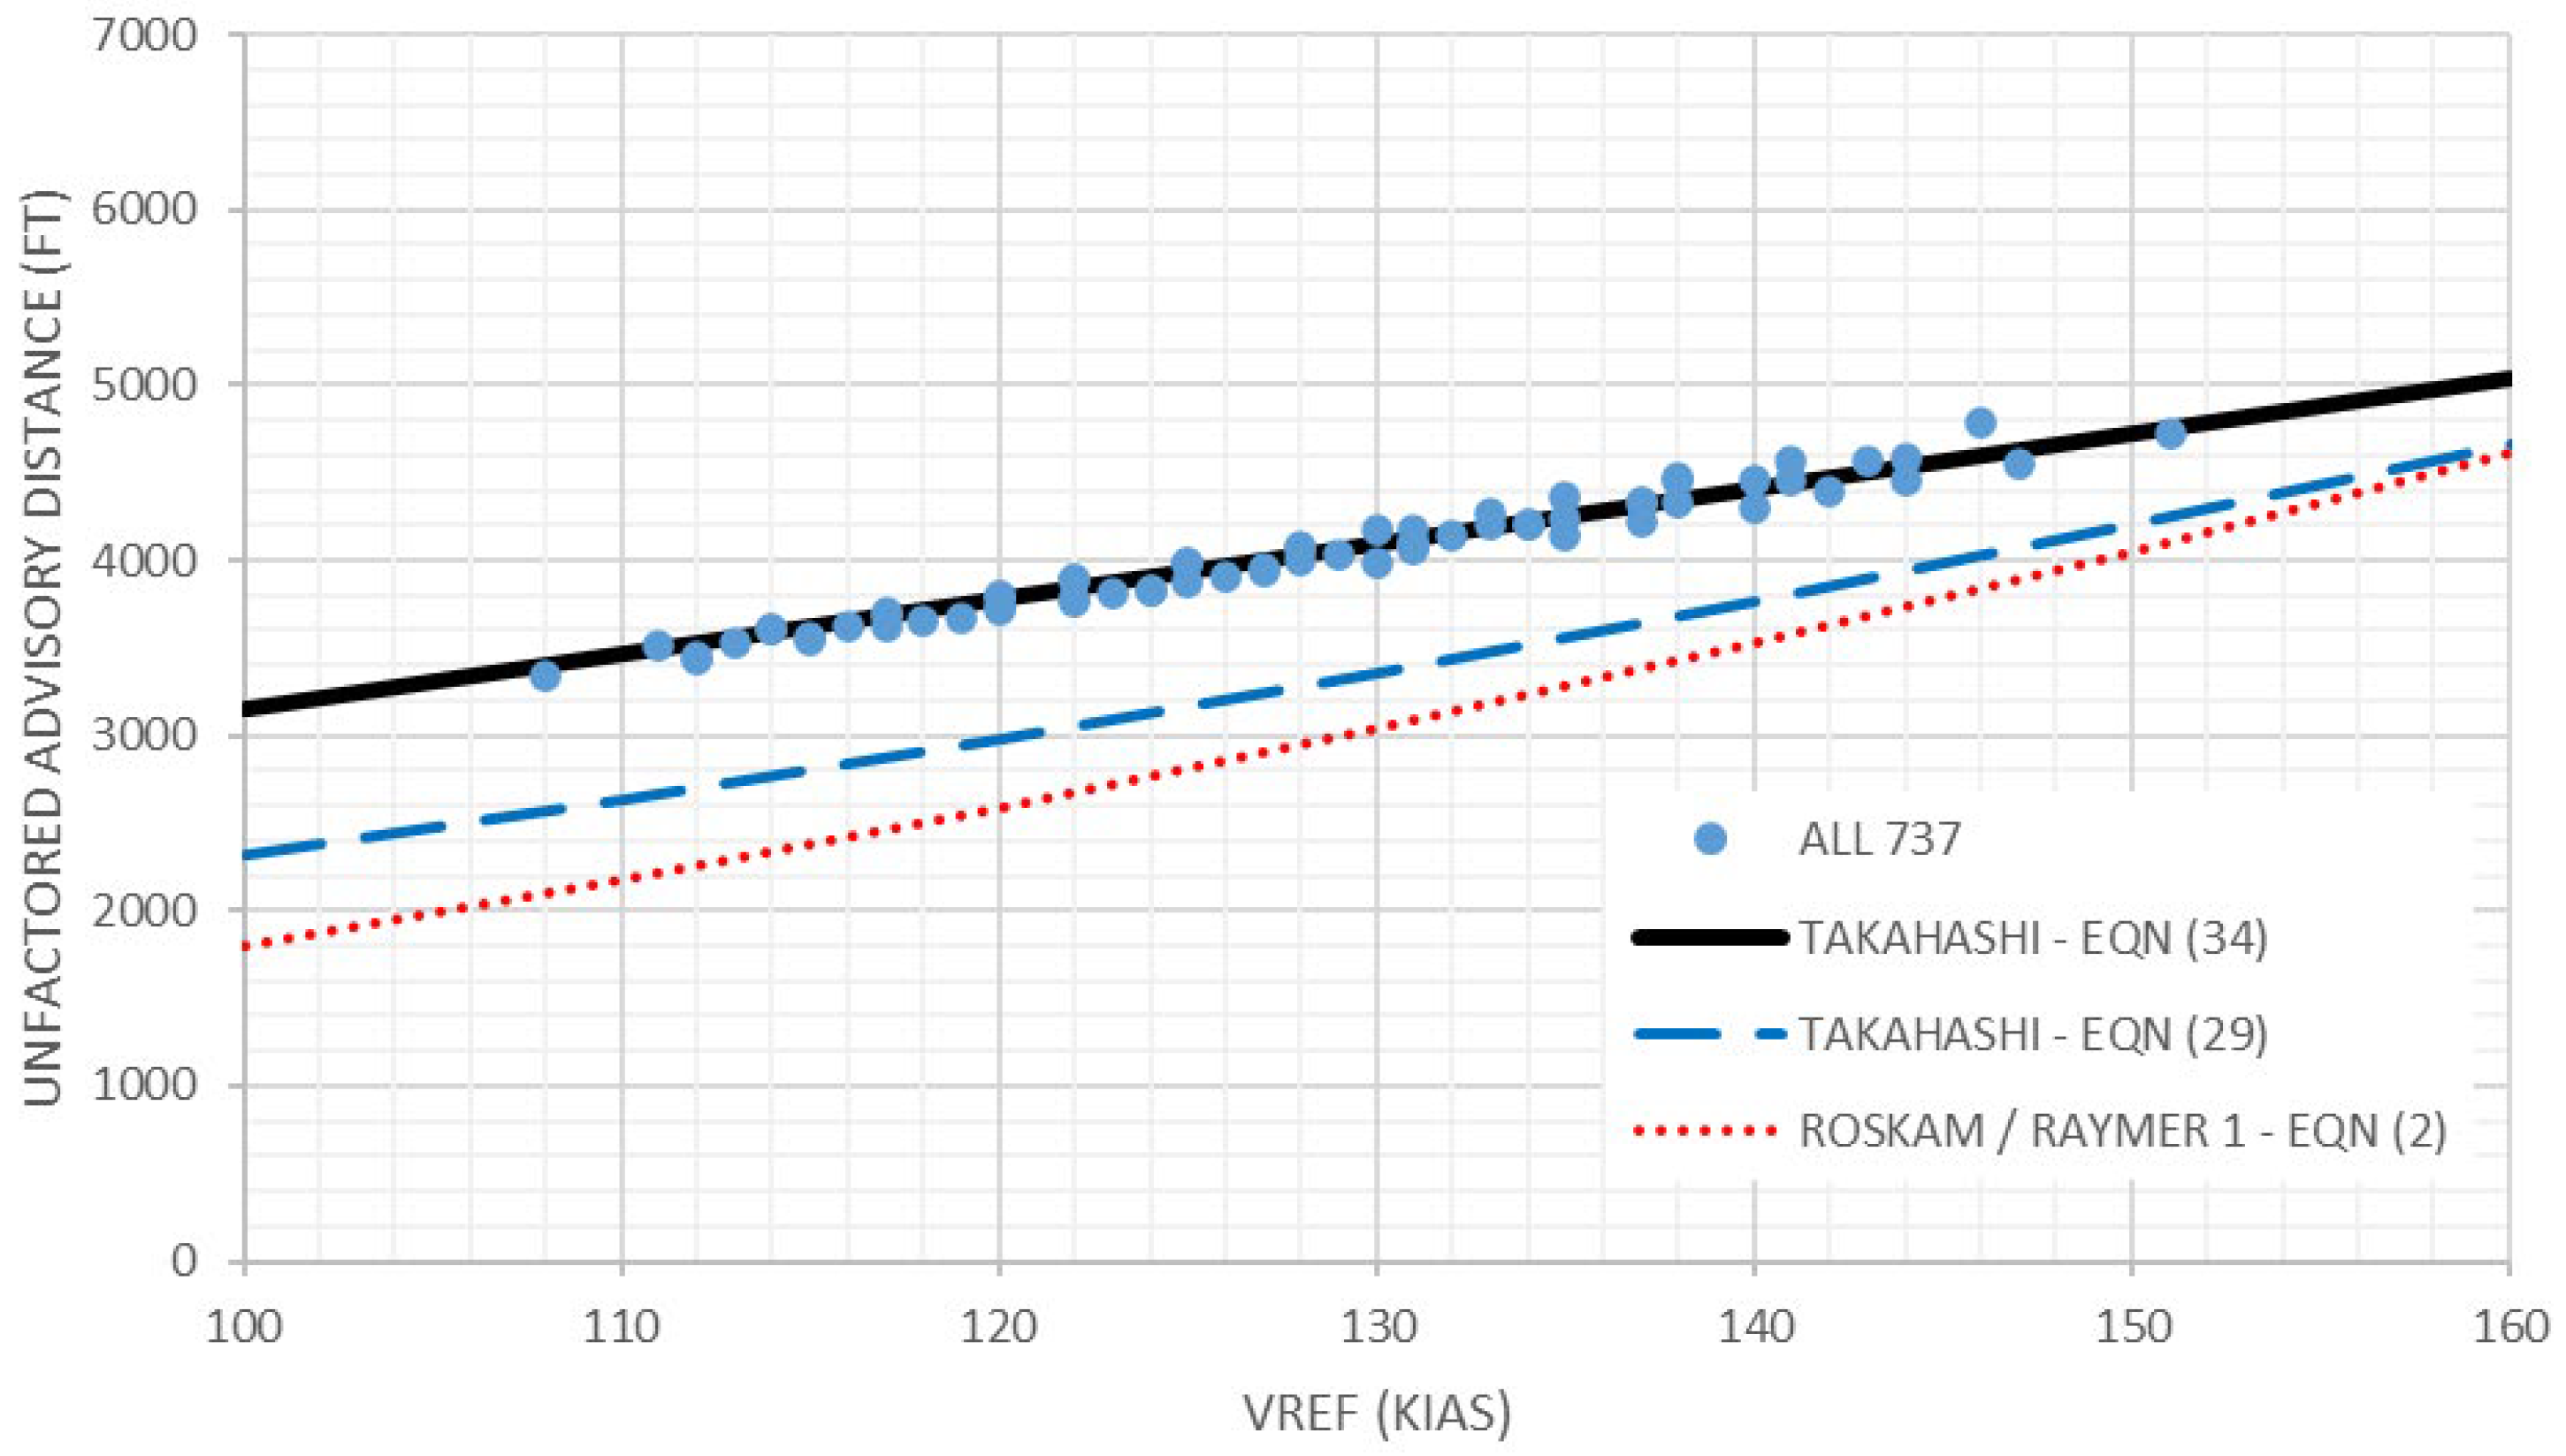
Figure 11 plots LDR as a function of the Vref speed for the entire B737 family, which is the 737-300, 737-500, 737-700, and 737-MAX8. The certified flight-manual data does not exhibit the quadratic trend found in Roskam’s equation (Equation (2) and the dotted red line). Recall that the since the 79 points extracted from the AFM already include a “best conservative fit” from actual flight test data, an empirical model should not incorporate any further intentional systematic bias. Thus, a linear fit with R2 = 0.999 and an RMS error of 66 ft may approximate B737 performance:
Compared to the Airbus, CRJ 200, CRJ 700, ERJ 170, B767-300, and simulation data, the 737 family has a similar overall “slope” of LDR with respect to increasing Vref speed but with a substantial offset; please compare the solid black line (Equation (34)) to the dashed blue line (Equation (29)). This is likely due to a combination of competitive braking deceleration coupled with a long air-phase distance arising from some sort of aircraft dynamics which must occur during flare and de-rotation.
Figure 11.
Boeing 737’s certified landing distances compared to Equation (34), Roskam, Equation (2), and the General Revised Empirical Equation, Equation (29), for sea-level, standard-day landing in the dry.
4.5. Analysis of Statistical Data to Develop MIL 3013 Landing-Distance Estimates
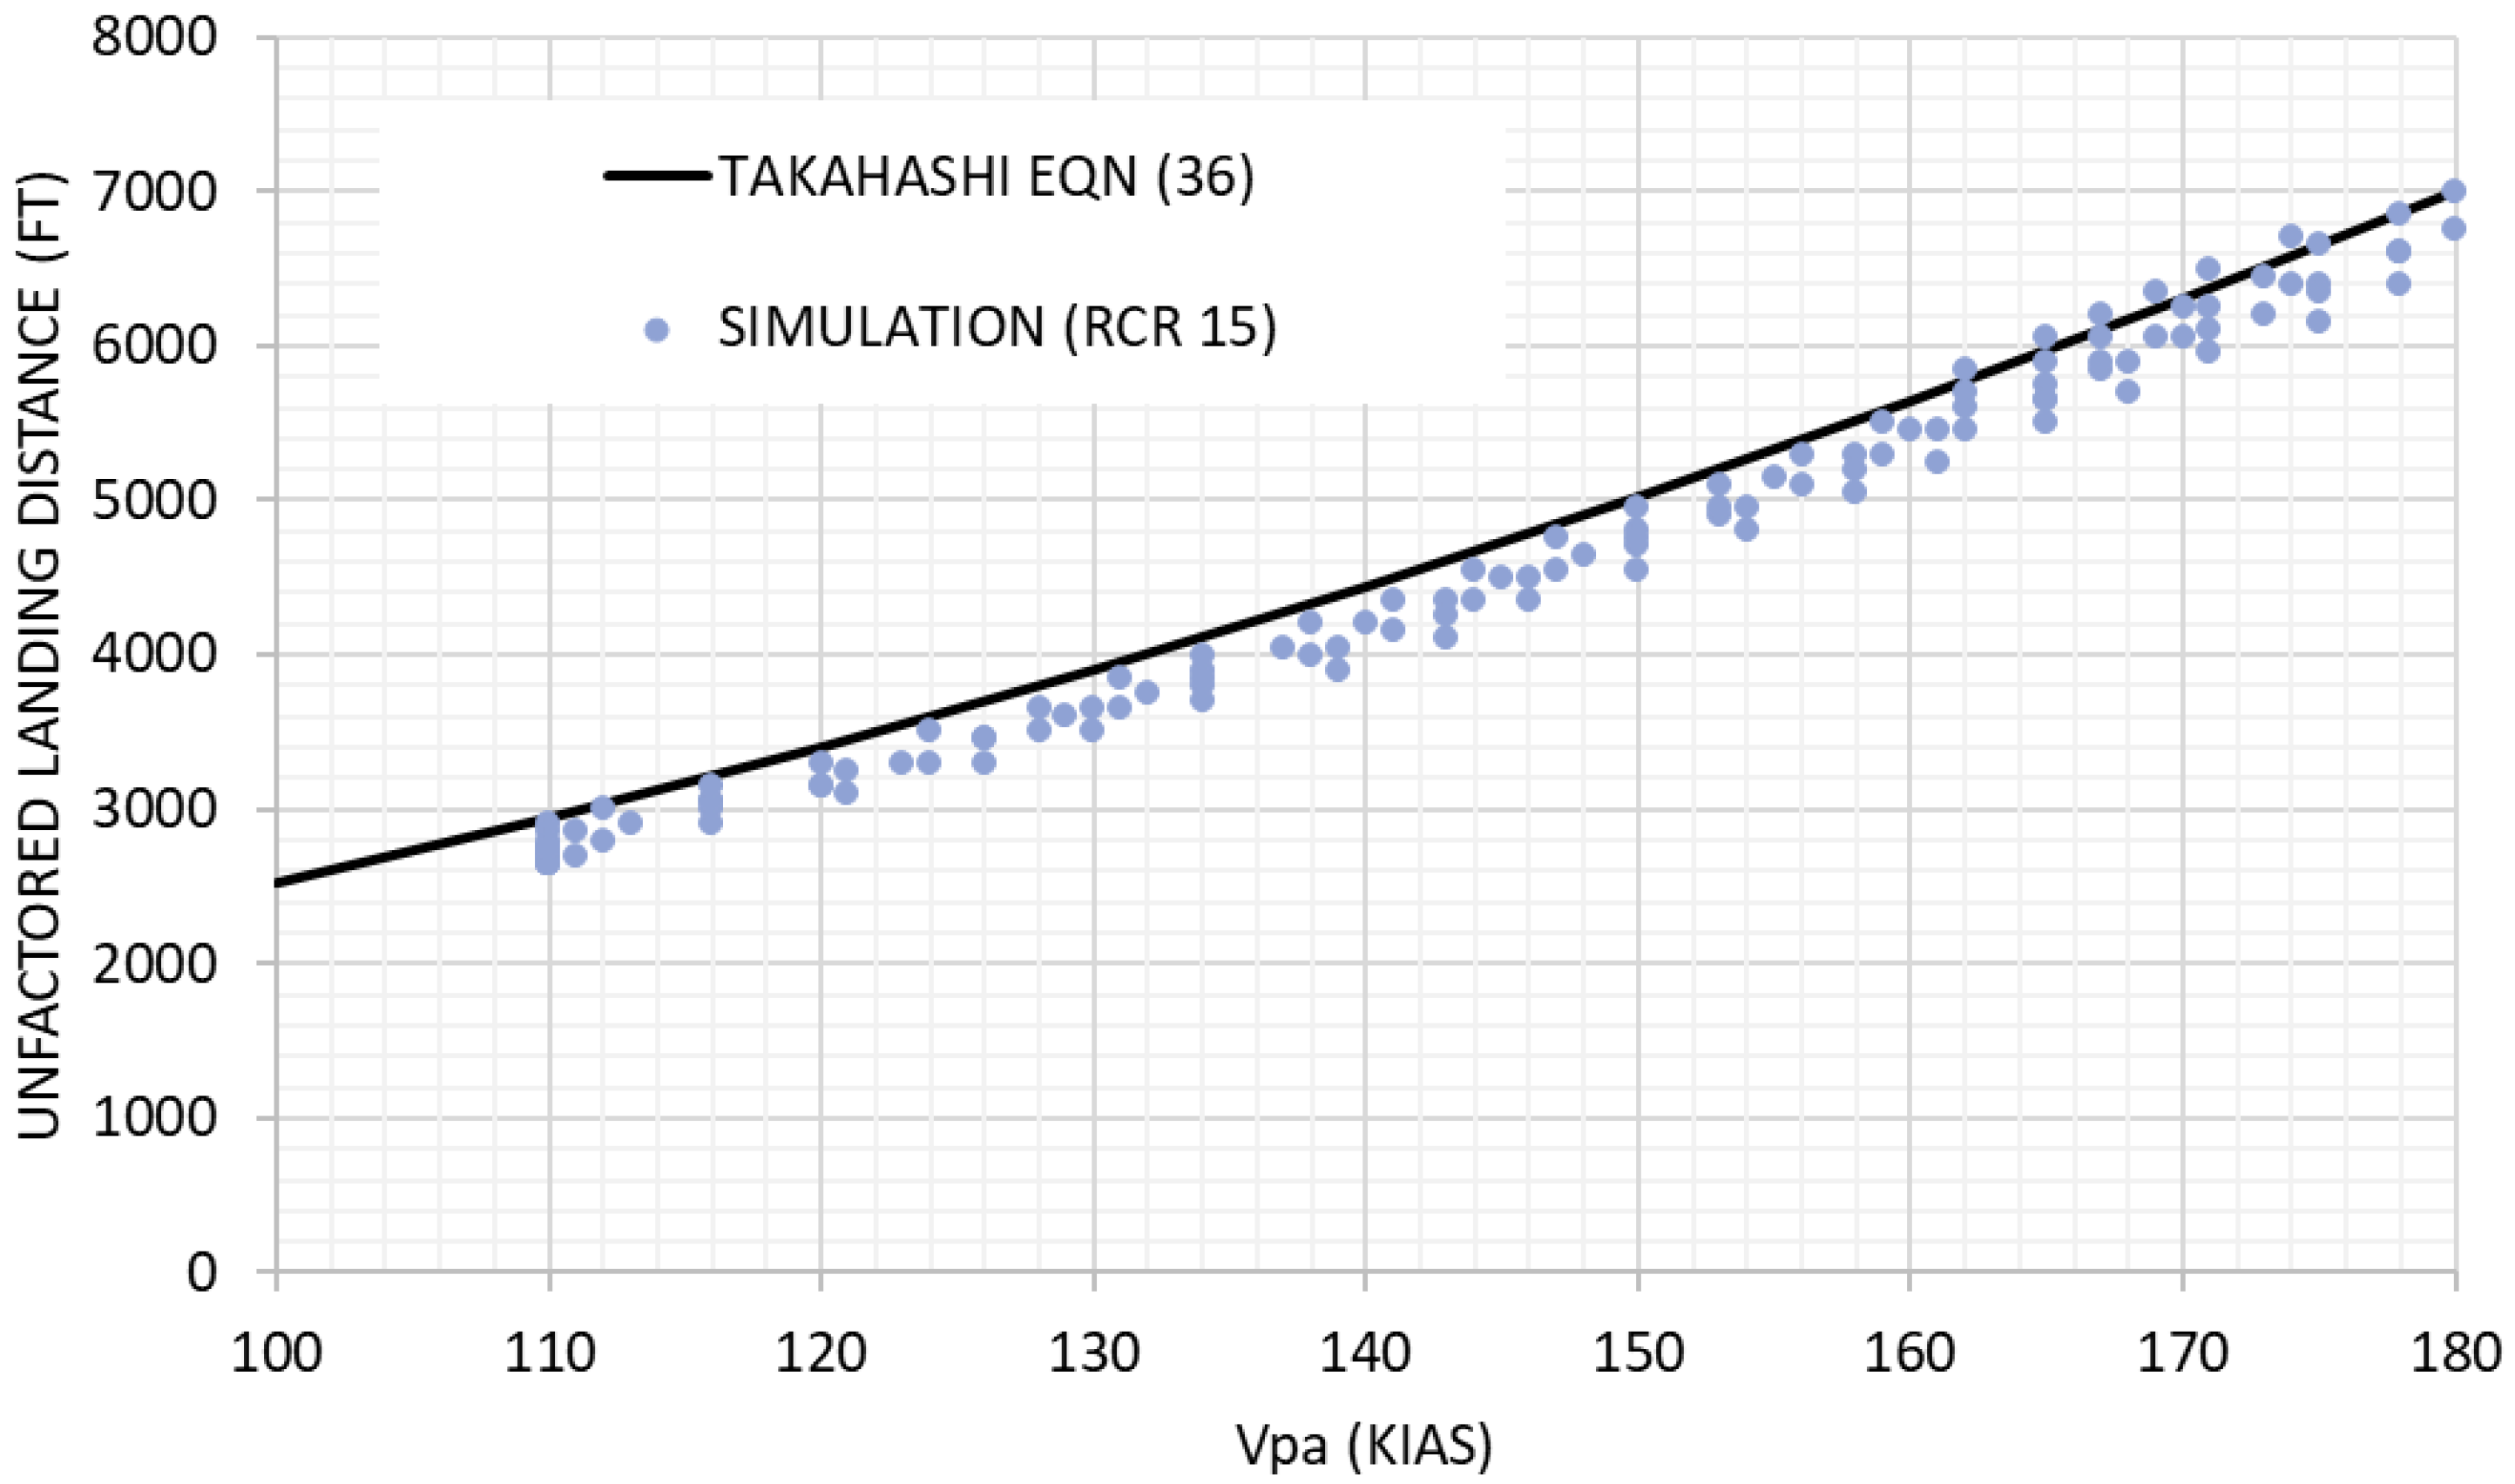
Following MIL-STD-3013B rules, the following data sets form the basis of two new empirical equations; see Figure 12 and Figure 13. Each equation is based on a “best conservative fit” of 186 additional simulation runs implied by the full-factorial parameter space described in Section 4.2. I formulate the novel equation to intentionally produce 90% confidence that the actual simulated performance will exceed the prediction. A traditional curve fit could approximate the simulation with a quadratic equation to a high degree of accuracy; R2 = 0.9945.
Figure 12.
Statistical model of landing distance from 50 ft AGL for MIL-3013B rules’ dry runway (μ = 0.38 braking and 50% reverse thrust) operations at sea level, standard day.
Figure 13.
Statistical model of landing distance from 50 ft AGL for MIL-3013B rules’ wet runway (μ = 0.25 braking and 50% reverse thrust) operations at sea level, standard day.
For dry (μ = 0.38) operations, the 90% confidence value “conservative fit” leads to the following equation with an RMS error of 168 ft:
Meanwhile, wet (μ = 0.25) operations, with reduced traction, lead to longer predicted distances. The 90% confidence value “conservative fit” has an RMS error of 259 ft:
5. Summary and Conclusions
This paper develops a collection of new empirical relationships to estimate the FAA/EASA and MIL-3013B rules’ compliant landing-field performance of multi-engine transport aircraft in wet and dry conditions.
This paper identifies issues with the legacy empirical landing performance estimation methods found in books by authors like Lan and Roskam [1], and Raymer [5,6]. Loftin based his widely used method on an extremely limited statistical analysis (20 data points) of now obsolete aircraft [2]. As such, these methods were never particularly accurate predictors of aircraft which existed at the time of data collection.
Since modern commercial and military certification standards have continued to evolve, this paper has shown that the legacy methods now codify obsolete operating standards regarding final approach speeds, piloting techniques, and braking capabilities. Consequently, legacy methods need to be revised for application to modern, “clean-sheet” designs flown to contemporary regulatory standards.
Today’s aircraft designer is likely to face customers who impose wet and/or contaminated runway performance requirements. Since the classic books only discussed dry-weather operations, designers presently rely upon the FAA’s 192% rule to estimate wet-weather landing performance. This paper has demonstrated the extreme pessimism inherent to this approach. Reliance upon a classic equation and the FAA-factored rule is likely to lead a design team to advocate unnecessary engineering solutions (for example, more complex flaps) to solve “problems” which do not actually exist.
Taken together, the design community needs a collection of revised empirical equations to estimate landing distances for dry and wet runways. The novel relationships presented here are based upon a hybrid approach where a calibrated physics-based numerical simulation representing a broad range of possible configurations that future aircraft designers may consider augments a collection of certified AFM data.
Collectively, they offer improved accuracy compared to earlier methods. Although limited to estimate performance under sea-level, standard-day, still-winds conditions, these models embody the industry concept of a “best conservative fit” (90% confidence). Including their intentional systematic bias, they have an RMS error that should not exceed ~260 ft from the simulation. The new method, when applied to FAA rules for aircraft operating on dry and wet runways, predicts the substantially shorter “real-world” certified landing distances attainable by modern aircraft.
Funding
This research received no external funding.
Data Availability Statement
The original contributions presented in the study are included in the article, further inquiries can be directed to the corresponding author.
Acknowledgments
This work expands upon Takahashi’s earlier work published as Takahashi, T.T., “Revisiting Roskam’s Empirical Predictions for Landing Distance,” AIAA 2021-2447, in Proceedings of the 2021 AIAA AVIATION Conference, VIRTUAL EVENT, 2021; Ref. [55]; Takahashi, T.T., “Revisiting Roskam’s Empirical Predictions for Takeoff and Landing to Support MIL 3013 Multi-Engine Aircraft Design”, accepted paper for proceedings of the 2026 AIAA Aviation Conference, USA, June 2026; Ref. [56]. Figure 1 and Figure 6 were directly reproduced from relevant U.S. Government documents, which, under U.S. law, are in the Public Domain.
Conflicts of Interest
The author declares no conflicts of interest.
Abbreviations
The following abbreviations are used in this manuscript:
| Nomenclature | |
| AFM | Aircraft flight manual certified by the regulatory authority |
| AEO | All engines operating |
| AGL | Height above ground level (ft) |
| CFR | Code of Federal Regulations (the U.S. government regulatory library) |
| EASA | European Union Aviation Safety Agency |
| FAA | Federal Aviation Administration (a U.S. government agency) |
| OEI | One-engine-inoperative (the most critical engine for controllability and performance) |
| RCR | Runway Condition Reading (proxy for braking traction, μ) |
| Distances | |
| LDR | Total landing distance from 50 ft AGL to stop (ft) |
| LGR | Landing ground roll from wheel contact to stop (ft) |
| LDA | Landing distance available—a “declared distance” associated with a specific airport runway |
| Aerodynamic Parameters | |
| α | Angle of attack (deg) |
| CD | Drag coefficient |
| CD0 | Zero-lift drag coefficient |
| CL | Lift coefficient |
| CL0 | Zero-angle-of-attack lift coefficient |
| AR | Geometric aspect ratio |
| ARe | Effective aspect ratio |
| Speeds | |
| Vref, Vpa | Scheduled final approach speed, landing flaps deployed (FAA vs. MIL nomenclature) |
| VMCL | Minimum control speed—airborne—in the landing-flap configuration |
| Vs | Stall airspeed—where CL = CLmax |
References
- Lan, C.T.E.; Roskam, J. Airplane Aerodynamics & Performance; DAR Corporation: Lawrence, KS, USA, 2003. [Google Scholar]
- Loftin, L.K., Jr. Subsonic Aircraft: Evolution and the Matching of Size to Performance; NASA RP-1060; NASA: Washington, DC, USA, 1980.
- Takahashi, T.T. Aircraft Performance and Sizing, Vol. I: Fundamentals of Aircraft Performance; Momentum Press: New York, NY, USA, 2016. [Google Scholar]
- Takahashi, T.T. Aircraft Performance and Sizing, Vol. II: Applied Aerodynamic Design; Momentum Press: New York, NY, USA, 2016. [Google Scholar]
- Raymer, D.P. Aircraft Design: A Conceptual Approach, 1st ed.; AIAA: Reston, VA, USA, 1999. [Google Scholar]
- Raymer, D.P. Aircraft Design: A Conceptual Approach, 6th ed.; AIAA: Reston, VA, USA, 2018. [Google Scholar]
- A320 Model: 320-212 Flight Manua; AI/EV-O 10000; Airbus: Toulouse, France, 1990.
- Regulations Governing the Issuance of Certificates of Airworthiness of Aircraft in France; NACA TN-155; NACA: Washington, DC, USA, 1923.
- Breguet, L. Landing and Braking of Airplanes; NACA TM-507; NACA: Washington, DC, USA, 1929.
- Rolles, B.H.; Stevens, H.L. The Effect of Wind, Weight and Atmospheric Conditions Including Semi-Tropical Conditions on the Distance to Take-Off and Land an Aircraft; ARC R&M 1172; Aeronautical Research Committee: London, UK, 1928. [Google Scholar]
- Kimberlin, R.D. Flight Testing of Fixed-Wing Aircraft, 1st ed.; AIAA: Reston, VA, USA, 2003. [Google Scholar]
- Wood, K.D. Technical Aerodynamics, 1st ed.; McGraw-Hill: New York, NY, USA, 1935. [Google Scholar]
- Warrner, E.P. Airplane Design: Performance, 2nd ed.; McGraw-Hill: New York, NY, USA, 1936. [Google Scholar]
- Jones, B. Elements of Practical Aerodynamics, 2nd ed.; Wiley & Sons: New York, NY, USA, 1939. [Google Scholar]
- Millikan, C.B. Aerodynamics of the Airplane; Wiley & Sons: New York, NY, USA, 1941. [Google Scholar]
- Sherwood, A.W. Aerodynamics, 1st ed.; McGraw-Hill: New York, NY, USA, 1946. [Google Scholar]
- 14 CFR § 4; Civil Aviation: Airplane Airworthiness. United States Government Printing Office: Washington, DC, USA, 1938.
- 14 CFR § 4; Civil Aviation: Airplane Airworthiness. United States Government Printing Office: Washington, DC, USA, 1940.
- 14 CFR § 4; Civil Aviation: Airplane Airworthiness. United States Government Printing Office: Washington, DC, USA, 1942.
- Army Air Forces Specification R-1815-A; Stability and Control Characteristics of Airplanes. Department of the Army: Washington, DC, USA, 1945.
- MIL-C-5011A; Military Specification: Charts, Standard Aircraft Characteristics and Performance, Piloted Aircraft. Departments of the Army, the Navy and the Air Force: Washington, DC, USA, 1951.
- Dwinell, J.H. Principles of Aerodynamics, 1st ed.; McGraw-Hill: New York, NY, USA, 1949. [Google Scholar]
- Perkins, C.D.; Hage, R.E. Airplane Performance, Stability and Control, 1st ed.; Wiley & Sons: New York, NY, USA, 1949. [Google Scholar]
- Corning, G. Supersonic and Subsonic Airplane Design, 3rd ed.; Braun-Brumfield: Ann Arbor, MI, USA, 1960. [Google Scholar]
- Nicolai, L.M. Fundamentals of Aircraft Design, 1st ed.; METS: San Jose, CA, USA, 1975; ASIN: B00C3D7ENI. [Google Scholar]
- Torenbeek, E. Synthesis of Subsonic Aircraft Design, 1st ed.; Delft University Press: Delft, The Netherlands, 1982. [Google Scholar]
- Yechout, T. Introduction to Aircraft Flight Mechanics, 2nd ed.; AIAA: Reston, VA, USA, 2014. [Google Scholar]
- Pamadi, B.N. Performance, Stability, Dynamics and Control of Airplanes; AIAA: Reston, VA, USA, 1998. [Google Scholar]
- Anderson, J.D. Aircraft Performance and Design; WCB/McGraw-Hill: Boston, MA, USA, 1999. [Google Scholar]
- 737CL-300/400/500 Flight Crew Training Manual; Document FCT 737 CL (TM), Rev. 10; The Boeing Company: Seattle, WA, USA, 2011.
- 737-800 Flight Crew Operations Manual; Document D6-27370-8AS-RYR(AS), Rev. 30; The Boeing Company: Seattle, WA, USA, 2019.
- 737-8 Flight Crew Operations Manual; Document MN-FLT-OH-201, Rev. 0; The Boeing Company: Seattle, WA, USA, 2021.
- 747-400 Airplane Operations Manual; Document PMDG 747-400/400F AOM, Rev. 25FEB06; The Boeing Company: Seattle, WA, USA, 2006.
- 767-300 Flight Crew Operations Manual; Document D6-32T001-44MAE, Rev. 27; The Boeing Company: Seattle, WA, USA, 2016.
- 777-200 Continental Airlines 777 Flight Manual; Rev. 05/01/02; Continental Airlines, After the Boeing Company: Seattle, WA, USA, 2002.
- Model CL-600-2B19 Flight Crew Operating Manual; CSP A-013-013A, Rev. 63; Bombardier: Toronto, ON, Canada, 2015.
- Model CL-600-2C10 Airplane Flight Manual; CSP B-012-061, Rev. 17; Bombardier: Toronto, ON, Canada, 2016.
- Embraer 170 Pilot Operating Handbook; Rev 8; Embraer: São Paulo, Brazil, 2008.
- Takahashi, T.T.; Wood, D.L.; Bays, L.V. An Introduction to the Impact of Pilot Techniques Upon “Certified” Field Performance. In Proceedings of the 2017 AIAA SciTech Conference, Grapevine, TX, USA, 9–13 January 2017. AIAA 2017-0007. [Google Scholar] [CrossRef] [Scilit]
- Lorenzo, W.P.; Takahashi, T.T. Can We Fly it? Yes, We Can: A Comparative Study of Military Airworthiness and Flight Operations. In Proceedings of the 2024 AIAA Aviation Conference, Las Vegas, NV, USA, 29 July–2 August 2024. AIAA 2024-2213. [Google Scholar] [CrossRef] [Scilit]
- 14 CFR § 25; Airworthiness Standards: Transport Category Airplanes. United States Government Printing Office: Washington, DC, USA, 2025.
- Easy Access Rules for Large Aeroplanes (CS-25); Amendment 27; European Aviation Safety Agency: Brussels, Belgium, 2023.
- MIL STD-3013B; Department of Defense Standard Practice: Glossary of Definitions, Ground Rules, and Mission Profiles to Define Air Vehicle Performance Capability. Department of Defense: Washington, DC, USA, 2008.
- Advisory Circular: Flight Test Guide for Certification of Transport Category Airplanes; AC 25-7D; Federal Aviation Administration: Washington, DC, USA, 2018.
- Landing Performance Assessments at Time of Arrival (Turbojets); SaFO 06012; Federal Aviation Administration: Washington, DC, USA, 2006.
- Visual Guidance Lights; FAA ORDER JO 6850.2B; Federal Aviation Administration: Washington, DC, USA, 2010.
- Frictional and Retarding Forces on Aircraft Types—Part II: Estimation of Braking Force (Amendment D); ESDU Pamphlet 71026; Engineering Sciences Data Unit: London, UK, 1995.
- 14 CFR § 121; Operating Requirements: Domestic, Flag, and Supplemental Operations. United States Government Printing Office: Washington, DC, USA, 2025.
- “Mitigating the Risks of a Runway Overrun Upon Landing,” Advisory Circular AC-91-79A; U.S. Department of Transportation: Washington, DC, USA, 2016.
- MIL STD-1797A; Department of Defense Interface Standard: Flying Qualities of Piloted Aircraft; Notice 3. Department of Defense: Washington, DC, USA, 2004.
- Chalk, C.R.; Neal, T.P.; Harris, T.M.; Pritchard, F.E.; Woodcock, R.J. Background Information and User Guide for MIL-F-8785B(ASG) “Military Specification—Flying Qualities of Piloted Airplanes”; AFFDL TR6972; Defense Technical Information Center: Fort Belvoir, VA, USA, 1969. [Google Scholar]
- Flight Manual: USAF Series C-130J (LONG) Aircraft; TO 1C-130(C)J-1-1; Change 1; Department of Defense: Washington, DC, USA, 2012.
- Industry Best Practices Manual for Timely and Accurate Reporting of Runway Surface Conditions by ATS/AIS to Flight Crew; ICAO FS-07IBP; International Civil Aviation Organization: Montréal, QC, Canada, 2013.
- Roginski, M. Manufacturer’s Perspective-Runway Friction and Aircraft Performance. In Proceedings of the ICAO/ALACPA Seminar of Airport Pavements, Panama City, FL, USA, 10–14 September 2012. [Google Scholar]
- Takahashi, T.T. Revisiting Roskam’s Empirical Predictions for Landing Distance. In Proceedings of the 2021 AIAA AVIATION Conference, Virtual Event, 2–6 August 2021. AIAA 2021-2447. [Google Scholar] [CrossRef] [Scilit]
- Takahashi, T.T. Revisiting Roskam’s Empirical Predictions for Takeoff & Landing to Support MIL 3013 Multi-Engine Aircraft Design. In Proceedings of the 2026 AIAA Aviation Conference, San Diego, CA, USA, 8–12 June 2026. [Google Scholar]

Disclaimer/Publisher’s Note: The statements, opinions and data contained in all publications are solely those of the individual author(s) and contributor(s) and not of MDPI and/or the editor(s). MDPI and/or the editor(s) disclaim responsibility for any injury to people or property resulting from any ideas, methods, instructions or products referred to in the content. |
© 2026 by the author. Licensee MDPI, Basel, Switzerland. This article is an open access article distributed under the terms and conditions of the Creative Commons Attribution (CC BY) license.