


Abstract
The dielectric elastomer is a category of electroactive polymer capable of having large deformation under electric excitation and vice versa. They show great potential for the proper maneuvering of small-scale aerial vehicles due to low density and fast actuation, and the successful design demands a proper prediction of their overall dynamic characteristics. However, these characteristics cannot be accurately predicted from lower-order material approximation and/or one specific elastomer shape under a specific flow velocity, pretension, and relaxation. In this research, a comprehensive modal and aerodynamic analysis for the VHB 4910 dielectric elastomer membrane of three different shapes is computationally investigated under different electric excitations, pretensions, and flow velocities using the higher-order Ogden model. A finite element model and a two-way, fully coupled fluid–structure interaction model are developed to obtain vibration and aerodynamic characteristics, respectively, for different membrane shapes. It is found that the variation in electric excitation, pretension, and air velocity is influential in altering the overall dynamics of the membrane and is unique to specific shapes. The rectangular membrane shows a higher vibration frequency for the fundamental mode, whereas the circular membrane provides higher frequencies in higher modes. Increased relaxation for a membrane prestretch higher than the moderate range of stretch ratio ( = 3) demonstrates a slight increase in lift coefficient within a small range of angle of attack, followed by a decrease after exceeding that range. Both the rectangular and elliptical membranes show more flexibility to delay the stall compared to the circular membrane. The circular membrane is observed to have more potential for enhancing the aerodynamic performance and altering the flow field within a certain range of electric excitation and pretension. Computational results are compared with published experimental results to validate the corresponding models.
1. Introduction
Among the various types of smart materials, dielectric elastomers (DEs) fall into the category of electroactive polymers that can change shape in response to electric excitation and vice versa. These electromechanical characteristics made DEs unique for various applications, including energy conversion, artificial anatomical systems, control of small-scale aerial structures, actuation of mechanisms, shape memory alloys, artificial/biological insect wings, and many more [1,2,3,4]. For small aerial structures, the aerodynamic environment is often unpredictable, requiring proper control of maneuverability. However, the small size of vehicles makes packaging separate control mechanisms challenging. To overcome this challenge, DEs are found promising for rapid adaptation to changes in environmental conditions due to their unique electromechanical characteristics. The deformation of an aerial structure composed of DE materials due to aerodynamic loading and the deformation of the surrounding fluid due to change in shape of the structure affect each other, altering the structure’s aeroelastic characteristics [5,6]. Hence, a comprehensive understanding of the coupled interaction between the flexible structure and the aerodynamic environment is crucial to exploring the associated dynamics for the robust design of small-scale aerial structures further.
Proper identification of parameters that influence the mutual dynamics between DEs and the aerodynamic environment is crucial for deeper analysis. Membrane pretension is one such parameter affecting both the vibration and aerodynamic characteristics. The pretension can be altered by changing the stretch ratio and the relaxation induced by electric excitation [7,8]. Usually, the ideal aerodynamic environment considered for small-scale aerial structures is associated with a low Reynolds number (Re) [9] and the relevant wing material requires sufficient flexibility for such an environment to enhance aerodynamic efficiency. Lang et al. [10] experimentally investigated the aerodynamic characteristics of flapping wings composed of different materials and found that the lift can be improved for wings composed of higher elastic modulus; however, this comes at the cost of increased power.
In search of suitable DE materials for pliant wing structures, the VHB 4910 membrane has been proposed by several researchers [4,5,11,12]. The VHB 4910 membrane characteristics can be captured with reasonable accuracy by comparing the membrane’s behavior to a hyperelastic material [13,14,15] due to its capability of undergoing large strain. However, the use of lower-order models cannot often predict the dynamic characteristics of the membrane properly, especially if the pretension is relatively high. The simplest, lower-order model is the Neo-Hookean model [13] which is unable to predict the large-strain behavior of the membrane with reasonable accuracy when the strain ranges more than 20%. An alternative and more accurate model is the higher-order Ogden model [14,16] for large strain applications, which is versatile and a good fit to use with the relevant constitutive relationships for hyperelastic materials. One of the greatest benefits of using the Ogden model [14] is that it can handle a strain as large as 700% to predict results with reasonable accuracy. With the Ogden model, the DE membrane behavior can be approximated closely by treating it as an incompressible material [17].
When correlated with wind tunnel experiments [6,18], the computational simulation of vibration and aerodynamic behavior of DE wings can be a significant advantage by providing a wide range of data. Pulok and Chakravarty [6] investigated the aerodynamic characteristics of a circular membrane by conducting wind tunnel tests; however, the test did not consider the effect of electric excitation. This demands the necessity of conducting comprehensive fluid–structure interaction (FSI) [9,19,20] simulations. Genç et al. [21] conducted an experimental study on FSI analysis for flexible membrane wings over a range of angles of attack (AoAs) for various Re. Recent research studies provide information regarding the nonlinear vibration of continuous systems such as composite panels embedded with NiTi-based shape memory alloy wire ropes. Putranto et al. [22] showed that NiTi shape memory alloys had a great potential as nonlinear damping elements without substantially affecting the system’s natural frequencies. Liang et al. [23] investigated the dynamic behavior of a hollow fiber membrane for different lengths and air velocities using an FSI model and analyzed the relevant flow characteristics under air-induced conditions. These studies indicate that a valid FSI analysis can provide important insight into the proper prediction of the dynamics of pliant wings.
The aeroelastic characteristics of the wing play an important role in determining the overall performance of the structure subjected to fluid flows, especially if the wing structure is pliant [5,24,25]. The maneuverability and stability of the wing structure can be influenced to a greater extent if the relevant aeroelastic properties are tunable. Yeh and Chiang [26] developed a bat-inspired two degrees-of-freedom flapping mechanism capable of capturing fundamental wing folding motions to investigate the effect of wing elasticity on aerodynamics. This ensured reliable motion transmission and allowed a systematic investigation of wing flexibility regarding aerodynamic performance.
In the majority of previous research, dynamic response studies of DE membranes were conducted for only one specific shape and/or without any source of relaxation. For those studies, the lower-order Neo-Hookean model was used, which was not suitable enough to capture the proper mechanics of the membranes. For most of the studies, only one velocity was considered to explore the aerodynamic behavior of the membrane subjected to only a single stretch ratio. Such studies provide decent information within the relevant contexts; however, they still leave a gap to observe the difference in the trend of change in the dynamics of DE membranes for different shapes subjected to different stretch ratios, fluid flow velocities, and intensities of relaxation. By conducting a comprehensive dynamic study of DE membranes with such variations in parameters, important information can be extracted to determine which parameter needs to be prioritized or which parameter and/or membrane shape has more influence for specific design requirements of small aerial structures.
This research is the first comprehensive study on the vibration and aerodynamic response of DE membranes of various shapes subjected to various pretensions, relaxations, and fluid flow velocities. From this research, fruitful information about respective trends in the response of different shapes of DE membranes to changes in parameters can be obtained. This can be used for selecting the most optimized membrane shape to meet the specific design and flow control requirements of small-scale aerial structures. Also, this research uses the Ogden hyperelastic material model, a two-parameter model that is more suitable for capturing the proper mechanics of flexible membranes at moderate or higher stretch ratios compared to the simplest Neo-Hookean model. Finally, some wind tunnel facilities are limited to using a certain range of AoA while conducting FSI experiments, which restricts the detailed interaction between the membrane and the fluid to be visualized. The two-way FSI model proposed in this research can be used to overcome this limitation and explore the aerodynamic characteristics further.
Therefore, in this research, a comprehensive dynamic analysis of three different shapes of DE membranes subjected to different air flow velocities, electric excitations, and pretensions is performed to study their vibration characteristic, aerodynamic behavior, and aeroelastic nature using the higher-order Ogden model. A finite element (FE) analysis is performed to evaluate the modal characteristics of the DE membranes. For the aerodynamic and aeroelastic analysis, a fully coupled FSI simulation is conducted for all the shapes of the membranes under varying aerodynamic loads. The computational results are compared with experimental results published in the literature to validate the FE and FSI models, and a convergence study is also performed.
2. Materials and Methods
Three different shapes of the VHB 4910 (3M Company, St. Paul, MN, USA) DE membranes—rectangular, elliptical, and circular—are considered for vibration, aerodynamic, and aeroelastic characteristics through computational simulation, as shown in Figure 1. Each of the VHB 4910 membranes has an initial thickness of 1 mm [6,27,28] before pretension and maintains the same surface area under all pretension conditions. The pretension is applied by stretching the membrane biaxially, maintaining a uniform stretch ratio , defined specifically as and along in-plane X and Y directions, respectively, as shown in Figure 1. The Z axis is normal to the membrane surface, and the stretch ratio in that direction is specified as .
Figure 1.
Different geometric shapes of the VHB 4910 membranes: (a) rectangle; (b) ellipse; and (c) circle.
For vibration analysis, an FE model is developed in the commercially available software package, COMSOL Multiphysics (Version 6.2), which is solved for natural frequencies of free vibration for the first four modes of the prestressed membranes of various shapes under different electric excitations. For the aerodynamic and aeroelastic analysis, the fully coupled FSI model is developed in COMSOL Multiphysics and solved for lift and drag coefficients, aerodynamic efficiency, and aerodynamic load-induced deformations of the membranes at different fluid flow velocities, electric excitations, and stretch ratios.
2.1. Material Model for DE Membranes
Due to the capability of undergoing large strains, the DE membrane is characterized by using a hyperelastic material model [13,14,15]. The Ogden hyperelastic model [14,15,16] is used for vibration, aerodynamic and aeroelastic analysis to overcome the limitation of the Neo-Hookean hyperelastic model [6,13], which is based only on the uniaxial tension test data. The strain energy density function for the Ogden [14,15,16] model is defined as follows:
where , , and are stretch ratios along X, Y, and Z directions, respectively, with reference to Figure 1, and and are the material constants determined empirically from uniaxial and constrained tension tests for the Ogden model. Nearly incompressible behavior is considered for the VHB 4910 membrane defined by the Ogden model in the FE and FSI analyses. The aerodynamic loading on the membrane is considered quasi-static without any time-dependent characteristics, and hence, it is assumed that the membrane gets sufficient time to relax and is not subjected to any cyclic or fatigue loading. Therefore, the effect of viscoelasticity in the VHB 4910 membrane is ignored. The shear modulus of the membrane , defined by the Ogden model is represented by the following equation:
In Equation (2), when 1 and 2, it recovers the simplest Neo-Hookean model [6,14]. When electric excitation is applied to the membrane in addition to mechanical stretch, the membrane undergoes relaxation, a softening effect induced by the compressive stress generated by the electric excitation, also known as Maxwell stress [27]. In the reported experimental studies, electric excitation can be implemented by using conductive electrodes on the upper and lower surfaces of the membrane in the form of carbon grease [5,29]. The net stresses on the membrane, and in the X and Y directions, respectively, are combinations of the tensile stress from the mechanical pretension and the compressive Maxwell stress from electric excitation and are estimated from Equations (3) and (4) [7] written as:
where is the permittivity and is the true electric field. is defined as the ratio of the electric voltage, , and the thickness of the membrane after pretension, , defined as [7] where is the thickness of the membrane in the undeformed state, having a value of 1 mm [6,27,28]. The parameters of the Ogden hyperelastic model mentioned in Equation (2) are listed in Table 1 [30]. Table 2 represents the numerical values of and for the stretch ratios 2, 3, 4.5, and 4.9 and for electric voltages 0 kV, 3.6 kV, and 4.5 kV with 4.02866 10−11 F/m. Table 3 lists the physical properties of the VHB 4910 membranes [6] considered in this analysis.
Table 1.
The Ogden model parameters [30] for the VHB 4910 DE membrane.
Table 2.
Membrane stresses at different voltages based on the Ogden model.
Table 3.
Properties of the VHB 4910 DE membrane.
2.2. Model Development for the Vibration Analysis
A computational 3D FE model of free vibration for each shape of the membrane in COMSOL Multiphysics (Version 6.2) is developed by using the eigenfrequency solver from the structural mechanics module. Each shape of the membrane is modeled as a 3D pliant structure with the appropriate stress values mentioned in Table 2 for various electric excitations given by Equations (3) and (4) based on the Ogden model. The nonlinear geometric effect is considered to solve the FE model of vibration for the first four modes. For all shapes of the membranes, fixed boundary conditions (BCs) are used in the membrane edges as listed in Table 4 below. Although fully fixed BCs may not completely represent the realistic flexible wing configurations, they are assigned from the perspective of the actual wind tunnel testing setup, where the membrane edges are secured by a rigid frame or holder integrated to the wind tunnel as used in prior studies [6,29].
Table 4.
Boundary conditions for the FE model of vibration of VHB 4910 membranes.
2.3. Model Development for the Aerodynamic and Aeroelastic Analysis
2.3.1. Development of the Fluid–Structure Interaction Model
For the aerodynamic and aeroelastic analysis, a two-way, fully coupled, 3D FSI model is developed in COMSOL Multiphysics (Version 6.2) composed of the solid DE membrane used as the structural FE model, and the air surrounding the membrane used as the computational fluid dynamics (CFD) model [31]. Both the FE and the CFD domains are described in Figure 2, with the FE domain embedded into the CFD domain. Three different air flow velocities, 5 m/s, 10 m/s, and 13.4 m/s, are used as the input velocities for the membrane corresponding to the low-Re condition [6] which is suitable for small-scale aerial structures.
Figure 2.
The air domain enclosing the membrane in the fluid–structure interaction model.
In FSI modeling, the influence of the CFD domain size is significant because the selection of the appropriate domain size provides the user with stability of the computational simulation, accurate results, and an efficient use of the computational memory. If the domain is improperly sized, then it might affect the flow development and corresponding velocity and pressure distribution, which might induce unexpected changes in simulation results. In this research, the length, width, and height of the CFD domain are selected according to the CFD study guidelines [32]. The inlet of the domain is recommended to be far enough from the object to ensure uniform flow conditions, typically 10 to 15 times the length of the object. The outlet is usually located approximately 20 times the length of the object to allow for wake development and suppress the reverse flow. The width of the domain needs to be at least 20 times the length of the object. The FSI analysis in this research uses different values of AoA, which increases the blockage of the domain requiring an increase in the domain size to allow for wider wake regions. In addition, for FSI analysis, if the solid undergoes large deformation, the domain needs to be relatively large to accommodate the fluid motion well, avoid mesh distortion, and prevent artificial boundary constraints from affecting structural deformation. Considering all these conditions, for all the membrane shapes, the 3D air domain is created with a length, width, and height of 7 m, 5 m, and 5 m, respectively, where the largest dimension is aligned with the flow direction along the X axis as shown in Figure 1. These dimensions of the CFD domain have made it large enough compared to the solid membrane to capture the proper flow physics [32].
In CFD and FSI analyses, the blockage effect indicates the change in fluid flow behavior due to the presence of a structure within the domain. For CFD domains, when the blockage is caused by an object occupying a certain part of the cross-sectional area of the CFD domain, the fluid flow behavior is restricted, resulting in a possible increase in velocity and a change in pressure, unlike the free stream velocity. In FSI simulation, this is even more significant as the deformation of the pliant object enhances the blockage effect relevant to a coupled interaction between the fluid and the structure, affecting the deformation of each other, or in other words, altering the flow field.
To minimize the blockage effect, the CFD domain should be sufficiently large. This is because, due to continuity, flow will accelerate around the blocked area, leading to higher velocity near the structure. Also, a high blockage ratio can lead to an overestimation of results, including drag forces compared to open-field conditions resulting in erroneous structural stress. A measure of the blockage effect is the blockage ratio, which is the ratio of the projected area of the structure to the total cross-sectional area of the computational domain. A typical guideline for having an efficient FSI simulation is to keep the blockage ratio below 3 to 5%. Using a lower blockage ratio reduces the acceleration of the flow around the body, which helps provide better accuracy in the computational simulation. In this research, the maximum blockage ratio is related to the circular membrane because the largest value of the membrane characteristic length, pertains to the circular membrane. Following that, the corresponding blockage ratio is far below the suggested above-mentioned blockage ratio according to the guideline.
A laminar flow model is considered in this analysis due to the low-Re condition of the aerodynamic environment relevant to small aerial structures. For such an environment, the Re is typically below 5 × 10⁵, and several researchers assumed the flow as mostly laminar in their research, including Pulok and Chakravarty [6]. This is because the flow over a tensed membrane can be considered approximately like the flow over a smooth flat plate for which the critical Re is used as 5 × 10⁵ indicating that the transition from laminar to turbulent flow begins at that Re. When the Re in such flows is lower than the critical Re, it typically represents a fluid flow characteristic that involves a relatively thicker boundary layer for treating the flow as mostly laminar.
According to the above discussion, the chord-based Re for each geometric configuration of the membranes is defined as , where is the characteristic length of the membrane aligned parallel to the air flow velocity, is the air flow velocity, is the density of the air, and is the dynamic viscosity of the air. The largest velocity considered in this research is 13.4 m/s, and the largest chord length considered parallel to the flow direction is 0.12 m for the circular membrane. The largest Re for each geometric configuration based on the largest velocity of 13.4 m/s provides Re = 72,612, Re = 87,134, and Re = 108,918 for the rectangular, elliptical, and circular membrane with values of 0.08 m, 0.096 m, and 0.12 m, respectively, obtained from Figure 1. According to the data, the Re is still far below the critical Re to consider the flow mostly laminar.
Figure 3 shows the 2D orientation of the DE membrane in the fluid domain, with the direction of related to the AoA, . The physical properties of air constituting the CFD domain are listed in Table 5 by considering the atmospheric conditions surrounding the membrane [6].
Figure 3.
The direction of airflow velocity over the membrane.
Table 5.
Properties of the air domain.
2.3.2. Boundary Conditions
The BCs are assigned appropriately for both the FE and the CFD domains. For the FE model of the solid membrane enclosed by the CFD domain, the same BCs that are listed in Table 4 are used. For the CFD model, both velocity and pressure BCs are applied according to the flow physics corresponding to the external flow over the membrane and are listed in Table 6. In Table 6, , , and represent the velocity components of air along the X, Y, and Z directions, respectively, in relation to Figure 2 and Figure 3. The inlet BC is assigned as a velocity BC for the ADHLIEA plane in Figure 2 normal to the inlet velocity, and the pressure BC is assigned in the downstream direction of the flow for the BCGKJFB plane. The side BCs are assigned by considering the CFD domain far enough from the enclosed membrane, and hence, the velocities along the side boundaries of the CFD domain are considered unaffected by the fluid–solid interaction. Therefore, the inlet BCs are also used as the side BCs for the CFD domain surfaces parallel to the XY and XZ planes, as shown in Figure 2 and listed in Table 6. For the inner wall, which is the membrane surface at the mid-plane of the CFD domain parallel to the XY plane in Figure 2, the no-slip BC is applied.
Table 6.
Boundary conditions for the fluid domain.
2.3.3. Mesh Formation
To mesh the computational model of the membrane for both vibration and aerodynamic analysis, a similar meshing technique is used. For the FE model of vibration of the membrane, a user-controlled mesh configuration is used in COMSOL Multiphysics (Version 6.2). 2D, free triangular elements are used for meshing the membrane domain due to their versatility and capability of handling curved geometry, with the maximum element size of 0.004 m. Figure 4 shows the meshed FE domain of the circular membrane.
Figure 4.
The converged mesh of the circular membrane (solid domain).
For the FSI analysis, a user-controlled mesh is used again for the entire domain, combining the FE and CFD domains, which are calibrated for fluid dynamics. Aside from the aforementioned meshing technique of the FE domain comprising the membrane, the maximum element size considered for the free triangular element for the CFD domain is 0.2 m, and the minimum element size is 0.003 m. The maximum element growth rate considered is 1.05 to ensure a gradual transition from the smallest to the largest element in the entire domain. After using the free triangular elements in the mid-plane of the CFD domain (EFGHE plane in Figure 2), the 2D surface mesh was swept through the entire CFD domain and distributed symmetrically with respect to the mid-plane, maintaining an element ratio of 200. The number of boundary layers for the FSI analysis is determined by the automatic mesh algorithm. The meshed CFD domain in its finest element size is depicted in Figure 5.
Figure 5.
The converged mesh of the air (fluid) domain.
2.4. Governing Equations for the Computational FSI Model
The FSI model couples the fluid domain with the solid domain, where the fluid is represented by the air and the solid domain is represented by the membrane submerged within the air. The corresponding governing equations for the computational model are discussed in the subsequent sections.
2.4.1. Solid Domain
The solid membrane domain is governed by Newton’s second law, as shown below [23]:
where is the density of the membrane, is the acceleration vector, is the stress tensor, and is the force vector per unit volume.
2.4.2. Fluid Domain
For the fluid domain, the air is considered as an incompressible Newtonian fluid, and the corresponding field variables of the air domain are associated with the continuity equation and the momentum equations given by Equation (6) and Equations (7)–(9), respectively, as shown below:
where , , and are independent displacement variables along the global X, Y, and Z directions, respectively; , , and are velocity components of air along X, Y, and Z directions, respectively; is time; is pressure; and , , and are the accelerations due to gravity along the X, Y, and Z directions, respectively.
2.5. Experimental Research from Literature
2.5.1. Vibration Testing Setup
According to a survey of the literature, some experimental studies have been conducted to investigate the structural dynamics of the flexible membranes of specific geometric shapes. For the free vibration analysis, the experimental setup used by Pulok and Chakravarty [6] is described in Figure 6. They used a closed-loop vibration testing system composed of a Data Physics GW-V20 PA 100E SignalForce shaker (Data Physics Corporation, San Jose, CA, USA) which induced a suitable vibratory force to the membrane contained by a rigid frame securely attached to the top of the shaker head. The shaker is used together with the SignalStar Vector vibration controller (Data Physics Corporation, San Jose, CA, USA), a voltage amplifier (Data Physics Corporation, San Jose, CA, USA), and an accelerometer (Dytran Instruments, Chatsworth, CA, USA) with a precision of sensing 19.69 mV/g. The electric excitation on the membrane is applied by a separate transformer capable of providing a high voltage with a low current. A digital image correlation system composed of two high-speed cameras from Photron (Photron, San Diego, CA, USA) along with the relevant data acquisition system is utilized to capture the images of the vibrating membranes. These images are processed further to measure the out-of-plane displacements of the membranes using the VIC-3D software (Version 7.2.4), and ultimately, the vibration frequencies were obtained from the Fast Fourier Transform of the membrane displacements.
Figure 6.
The experimental setup for the free vibration analysis of the membrane.
2.5.2. Wind Tunnel Experimental Research
A wind tunnel experiment was conducted by Pulok and Chakravarty [6] where they investigated the dynamic performance of a circular membrane under aerodynamic loading. A schematic of such a wind tunnel is described in Figure 7, composed of a variable-speed fan drawing air into the wind tunnel. To ensure the characteristics of laminar airflow through the test section, a honeycomb flow straightener is used in the wind tunnel. A detailed internal view of the test section of the wind tunnel, including the model positioning system and pistol-grip sting balance, is depicted in Figure 7. The purpose of using the sting balance and the model positioning system is to evaluate the aerodynamic forces on the membrane and to regulate the AoA, respectively. It is worth noting that the effect of electric excitation on the aerodynamic performance of the DE membrane was not studied by Pulok and Chakravarty [6] in their wind tunnel experiment. This is also one of the inspirations for the authors to explore the membrane dynamics further by conducting a robust, two-way, fully coupled FSI simulation using electric excitation.
Figure 7.
A schematic of the wind tunnel system used by Pulok and Chakravarty [6] in their experimental study, including the model positing system and the sting balance.
3. Model Validation
3.1. Experimental Validation of the Finite Element Model
To validate the FE model of free vibration analysis, the computational results are compared with the experimental results. Figure 8a shows a comparison of the fundamental natural frequencies (first mode frequency) of free vibration of an elliptical DE membrane obtained from the FE analysis and that from the experimental research conducted by Hays et al. [29] for 0 kV electric excitation and a stretch ratio of 3. The elliptical DE membrane has a 1 mm initial thickness, a semi-major axis of 0.1 m, and a semi-minor axis of 0.05 m, where the membrane was secured within a rigid frame maintaining a fixed BC at the edge. From Figure 8a, the FE frequency based on the Ogden model closely approximates the experimental finding as it maintains a percentage deviation of 3.74%, thereby justifying that the computational FE model of vibration provides results with reasonable accuracy.
Figure 8.
A comparison of the natural frequency of free vibration obtained from the experiment and the finite element analysis for (a) the elliptical DE membrane with 3 and 0 kV electric excitation and (b) the circular DE membrane with 2, 2.02, and 0 kV electric excitation.
Figure 8b represents the FE and experimental natural frequencies of free vibration of a circular DE membrane having a radius of 0.05 m and an initial thickness of 1 mm, with 2, 2.02, and 0 kV electric excitation for the first three modes. The experimental research was conducted by Ojo et al. [18] by securing the tensed circular membrane within a rigid frame so that the fixed BC at the edge could be used, similar to the experimental study conducted by Hays et al. [29]. From Figure 8b, the FE frequencies obtained from the Ogden model assumption closely match the corresponding experimental frequencies. The maximum percent deviation between the experimental frequency and the FE frequency is found to be 8.69%, indicating that the computational frequencies are in reasonable agreement with the experimental frequencies.
3.2. Experimental Validation of the Fluid–Structure Interaction Model
A comparison between the aerodynamic coefficients obtained from the wind tunnel experiment conducted by Pulok and Chakravarty [6] and a two-way, coupled FSI simulation for a circular membrane of radius 0.05 m with 1.35 and 2.01 for a Re of 91,367 ( 15 m/s for 0.09 m) without any applied voltage is depicted in Figure 9. Figure 9a compares the experimental coefficient of lift, for the circular membrane to that obtained from the FSI simulation varying with the AoA. From Figure 9a, a good agreement is observed between the experimental and simulated results, where the maximum deviation was found to be 10.8% for 15 AoA. Figure 9b, on the other hand, shows how the experimental coefficient of drag, aligns with the simulated coefficient of drag leaving the maximum deviation of 7.69% for 10 AoA.
Figure 9.
The variation in the (a) coefficient of lift and (b) the coefficient of drag with angle of attack for a circular membrane having 1.35, 2.01, and 0 kV electric excitation obtained from experimental research and fluid–structure interaction simulation for a Re of 91,367 ( 15 m/s).
In the experimental setup used by Pulok and Chakravarty [6], the membrane secured by the rigid frame had a diameter of 0.09 m, and the rigid frame had a radial width of 0.005 m. After applying the pretension, the membrane was attached to the rigid frame using the precoated adhesive on one surface of the membrane. This means that the total membrane area considered in the wind tunnel experiment includes the membrane area inside the rigid frame and the membrane area covering the surface of the rigid ring. This provides a total surface area of 0.00785 m2, where 0.10 m is the combined diameter of the circular surface that includes the circle diameter of 0.09 m within the frame and two radial widths of 0.005 m. However, according to the computational modeling approach used by Pulok and Chakravarty [6], the area considered is 0.00636 m2. This provides a [(0.00785 0.00636)/0.00785] 100 or approximately 19% change in the surface area, which is reflected in the deviation between the experimental and computational lift and drag coefficients in the study of Pulok and Chakravarty [6]. In addition, the lift and drag coefficients are governed by the deformation of the membrane under aerodynamic loading, known as aeroelastic deformation. In the experimental setup of Pulok and Chakravarty [6], since part of the area of the membrane close to its boundary was securely attached to the rigid ring, it limited the aeroelastic deformation of the membrane around that part of the area, affecting the experimental and computational lift and drag coefficients. Following that, the maximum deviations between the experimental and computational coefficients of the lift and drag from the study of Pulok and Chakravarty [6] for a circular membrane were found to be 12.9% for 24.5 AoA and 28.62% for 15 AoA, respectively. It is worth noting that for experimental and values, the maximum AoA considered was 30 due to the limitation of the wind tunnel setup used by Pulok and Chakravarty [6].
To provide more insight into the aerodynamic characteristics of the VHB 4910 membranes in the presence of electric excitation, experimental values from the study of Hays et al. [29] are compared to those obtained from the FSI analysis in the current research depicted in Figure 10. Hays et al. [29] presented the variation in experimental with AoA for an elliptical membrane with an initial thickness of 1 mm, which was subjected to 3 and different electric excitations at a Re of 63,000. This Re corresponds to a fluid flow velocity of 10 m/s based on the chord length of the elliptical membrane used by Hays et al. [29]. Figure 10 provides the corresponding correlation between the experimental and computational values of the elliptical membrane with a varying AoA for a 4.5 kV electric voltage, which represents an electric field of 40.5 MV/m. A good agreement is found between the experimental and computational results providing the maximum deviation of 4.81%. It is worth noting that the comparison in Figure 10 starts from 10 AoA because the experimental data was reported that way by Hays et al. [29], and the correlation is shown up to 15 AoA since the experimental stall angle is found around 14.5 after which the lift started decreasing. The value of the experimental stall angle compares reasonably well with the computational stall angle of approximately 14.
Figure 10.
The variation in the coefficient of lift with angle of attack for an elliptical membrane having 3 and 4.5 kV electric excitation obtained from the experimental research and fluid–structure interaction simulation for a Re of 63,000 ( 10 m/s).
4. Results and Discussion
4.1. Vibration Analysis
4.1.1. Grid Independence Study for Vibration Analysis
To ensure that the computational results are reliable, a grid-independent study for the free vibration analysis of the membrane is performed to see how the results fluctuate with the increase in the number of mesh elements. Figure 11 indicates a variation in the natural frequency of free vibration for different shapes of DE membranes for different modes of vibration subjected to different stretch ratios and electric voltages obtained from the FE analysis. As seen in Figure 11, all the frequency curves eventually level off with an increase in the number of mesh elements, indicating that the solutions have achieved convergence. The frequencies are found to be fully converged at 466, 456, and 630 mesh elements for the rectangular, elliptical, and circular membranes, respectively.
Figure 11.
The variation in the natural frequency of free vibration of different shapes of membranes with the number of mesh elements for different modes subjected to 3 and 4.5, and electric excitations of 3.6 kV and 4.5 kV.
4.1.2. Natural Frequencies and Mode Shapes
Table 7 and Table 8 represent the fundamental natural frequencies, i.e., frequencies for the first mode and frequencies of the subsequent three modes, respectively, of free vibration of three shapes of the membranes for 2, 3, and 4.5 with different electric excitations obtained from the FE analysis. As seen in both Table 7 and Table 8, for a specific value of the stretch ratio, as the voltage increases, the natural frequency decreases. This is expected because with an increasing applied voltage, the effect of relaxation becomes more dominant resulting in a decrease in the overall tension of the membrane, or in other words, a reduced stiffness of the membrane, thus decreasing the frequencies.
Table 7.
Fundamental frequencies (frequencies for the first mode) of the free vibration for three different shapes of the membranes with 2, 3, and 4.5 and electric excitations of 0 kV, 3.6 kV, and 4.5 kV.
Table 8.
The second, third, and fourth mode frequencies of the free vibration for three different shapes of membranes with 2, 3, and 4.5 and electric excitations of 0 kV, 3.6 kV, and 4.5 kV.
An interesting phenomenon is observed for the fundamental frequencies listed in Table 7 where, for a specific prestretch and relaxation, the rectangular membrane demonstrates the highest frequency, and the circular membrane shows the lowest frequency of vibration. However, for higher modes, the frequencies mentioned in Table 8 show that the circular membrane provides higher frequencies compared to the rectangular and elliptical membranes. Hence, it can be concluded that the rectangular membrane has the potential to remain stiffer in the lowest mode of vibration with broader scopes to delay the resonance and with greater resistance to aeroelastic instability.
The mode shapes for the first four modes of free vibration for all three shapes of the membranes are depicted in Figure 12.
Figure 12.
The mode shapes for the first four modes of free vibration for different shapes of membranes.
4.2. Aerodynamic Analysis
4.2.1. Grid Independence Study for Aerodynamic Analysis
Like the vibration analysis before, a grid independence study is also conducted for the aerodynamic analysis to see how the results fluctuate with the increase in the number of mesh elements. Figure 13a,b represent the variations in the coefficient of lift, and the coefficient of drag, , respectively, with the number of mesh elements for the rectangular membrane subjected to different stretch ratios and electric voltages for 10 and 25 AoA with an air flow velocity of 13.4 m/s. From both figures, although the results show some initial fluctuations, eventually the curves have leveled with the increased number of mesh elements, and the solution has ultimately achieved convergence. It is worth noting that the and values are converged at different numbers of mesh elements for different variations in parameters.
Figure 13.
The variation in the (a) coefficient of lift and (b) the coefficient of drag with the number of mesh elements for the rectangular membrane with 3 and 4.5, angles of attack of 10 and 25, and electric excitations of 3.6 kV and 4.5 kV at an air flow velocity of 13.4 m/s.
4.2.2. Effect of Prestretch
The effect of prestretch on the coefficient of lift with varying AoA is explained in Figure 14a for a circular membrane subjected to an electric excitation of 4.5 kV and an airflow velocity of 13.4 m/s. Four different values are considered to correlate the variations of with the AoA. As seen in Figure 14a, with a constant relaxation of 4.5 kV for all values of , decreases as increases. Similar characteristics are observed for the rectangular and the elliptical membranes as well. The reason behind this behavior can be attributed to the continuous reduction in membrane elasticity due to the increase in the stretch. There are two different physics to note here that governs the mechanics of the membrane at the same time; one is the induced tensile stress due to prestretch, and the other is the compressive stress created by the electric excitation. The combination of these stresses acting in opposite directions provides a net tension in the membrane. This net membrane tension increases with increased values of and with that, the membrane continues to lose its flexibility. As seen in Figure 14a, the notable difference in is observed once reaches a value of 3 or higher, and the AoA approximates around 8 or higher. This behavior is identified as similar to the experimental study conducted by Maqsood and Go [8] for the latex square membranes of various sizes for an air velocity of 15 m/s. In addition, it can be conjectured that 3 or higher can provide notable tension in the membrane after which significant changes in the aerodynamic characteristics of the membrane can be expected, and hence, 3 or higher can be categorized as a moderate stretch ratio.
Figure 14.
The variation in the coefficient of lift with angle of attack for (a) the circular membrane with 2, 3, 4.5, and 4.9 and an electric excitation of 4.5 kV at an air velocity of 13.4 m/s and (b) all three shapes of the membranes with 4.5 and an electric excitation of 0 kV at an air velocity of 10 m/s.
Figure 14b signifies the effect of prestretch as well as the individual aerodynamic characteristics of the membranes out of the three shapes without any electric excitation, for an air velocity of 10 m/s with 4.5. As seen in Figure 14b, the lift curve for the circular membrane is approximately associated with a stall angle of 39. However, that characteristic is different for the other two shapes of the membranes. For both rectangular and elliptical membranes, the stall is delayed to some extent unlike the circular membrane and is not apparent, thereby providing slightly more leeway to regulate the corresponding aerodynamic behaviors.
From the above analysis, prestretch in flexible membranes is not just found as an ordinary parameter to prevent the membrane from sagging; it is observed as a critical parameter to tune its aeroelastic characteristics. Pretension has a direct influence on altering the coupling between the fluid flow and membrane deformation, which regulates the mechanism of changing the shape of the membrane under aerodynamic loads, consequently controlling its compliance. When the prestretch is low, large deflection is expected in the membrane, leading to a higher camber and a delayed stall as can be seen from Figure 14b for rectangular and elliptic membranes. However, at the same time, it also increases the tendency of fluttering. On the other hand, if the pretension is high, the membrane wing behaves as a rigid airfoil which improves stability but reduces its capacity of adaptation to the aerodynamic environment. Thus, an optimized but proper tension in a pliant membrane assists it in forming a suitable shape to favorably control the flow separation and thus, improves the potential of having an increased lift-to-drag ratio compared to rigid wings. The capability of a properly tensioned membrane to adapt to the surrounding flow field allows it to sustain higher ranges of AoA before stalling compared to rigid wings.
4.2.3. Effect of Relaxation
The effect of electric excitation on the tensed membrane is reflected in its relaxation, which reduces the overall tension in the membrane. This is due to the compressive Maxwell stress along the thickness direction of the membrane resulting in an expansion of it, thereby reducing the overall tension. The higher the electric excitation for the membrane at a specific stretch ratio, the greater the relaxation is.
Figure 15 presents the variation of with AoA for the circular membrane for electric excitations of 0 kV, 3.6 kV, and 4.5 kV with 3 and 4.5 for an air flow velocity of 13.4 m/s. As seen in Figure 15, the variation in the electric voltage does not reveal a significant change in for 3, even with the highest excitation of 4.5 kV. However, if is increased to 4.5 from 3, a significant change is observed in for 4.5 kV. The 4.5 kV case with 4.5 provides slightly higher values of until the AoA reaches 7 compared to 0 kV and 3.6 kV, and after that, a decreased value of is observed. Before reaching the AoA of 7, the 4.5 kV case shows approximately 25% increase in compared to the 0 kV case. The stall angles can be approximated as 40 for both 0 kV and 3.6 kV cases with 4.5. However, for the 4.5 kV case, the stall is not apparent, or more precisely, it reflects a benign pattern in the vicinity of the stall. This behavior is well aligned with the experimental study conducted by Maqsood and Go [8], where they estimated for the tensed square-shaped Nylon membrane with dimensions of 15 cm by 15 cm exposed to a flow velocity of 15 m/s subjected to a 1 cm relaxation. Similar characteristics are observed for rectangular and elliptical membranes. For the rectangular membrane, the increase in before 7 AoA for the 4.5 kV case is found to be 15%, unlike the circular membrane, and is observed as 4% for the elliptical membrane at an AoA of approximately 15. Thus, it can be concluded that the elliptical shape is more suitable to maintain the enhanced lift characteristics for a broader range of AoA compared to the rectangular and circular membranes.
Figure 15.
The variation in the coefficient of lift with angle of attack for the circular membrane with 3 and 4.5 and electric excitations of 0 kV, 3.6 kV, and 4.5 kV at an air flow velocity of 13.4 m/s.
The characteristic of varying with AoA for the circular membrane, is described in Figure 16 for different voltages and 13.4 m/s air flow velocity with 3 and 4.5. Like Figure 15, Figure 16 also shows that does not vary significantly with changes in electric voltages for 3; however, for 4.5, a notable difference in is observed for the 4.5 kV case. For 4.5, shows higher values for the 4.5 kV voltage compared to the 0 kV case of up to around 6 AoA, and after that shows a decrease for the remaining range of AoA. With increased relaxation for 4.5 kV, the circular membrane shows up to a 16% increase in the coefficient of drag before 6 AoA.
Figure 16.
The variation in the coefficient of drag with angle of attack for the circular membrane with 3 and 4.5 and electric excitations of 0 kV, 3.6 kV, and 4.5 kV at an air flow velocity of 13.4 m/s.
A similar trend of variation of is found with AoA for rectangular and elliptical membranes. However, for the elliptical membrane, is found to show an increased value for the 4.5 kV case compared to the 3.6 kV case for the entire range of the AoA. This finding is very well aligned with the experimental results obtained by Hays et al. [29] for a VHB 4910 elliptical membrane having an initial thickness of 1 mm, which is subjected to 3.6 kV electric excitation at 3 for an air flow velocity of 10 m/s corresponding to a Re of 63,000.
Induction of relaxation on pliant membranes through electric voltage serves as a mechanism to change the shape of the membrane by altering the overall tension. Like the role of mechanical pretension as discussed in the previous section, the electric voltage can also be used to tune the aeroelastic characteristics of the membranes and enhance the aerodynamic performance. In addition to this, the application of electric voltage makes the membrane wing behave like a soft actuator, enabling shape-morphing during its operation or flight in the appropriate aerodynamic environment. Comparing the effect of pretension and electric voltage side by side, it can be concluded that the pretension has a relatively more dominating effect on the membrane as it sets the initial stiffness directly; therefore, its primary role is to bring stability in the membrane and find the proper shape under aerodynamic loading. On the other hand, the effect of relaxation is relatively less dominating as it works towards a gradual reduction in stress from the high loading state of the membrane. This is justified by the analysis of Figure 15 and Figure 16, where the membrane was under moderate tension for both 3 and 4.5 but waited relatively longer to show significant changes in and for each case of until the relaxation intensity was amplified to 4.5 kV. This makes it certain that a suitable combination of pretension and relaxation can bring significant changes in the compliance of membrane wings and, therefore, can assist in achieving optimized aerodynamic performance.
Table 9 represents the peak coefficients of lift and drag and stall characteristics for all shapes of the membranes for an air velocity of 13.4 m/s with varying from 3 to 4.9 along the row from left to right, and the electric voltage ranging from 0 kV to 4.5 kV vertically from top to bottom. With the increase in voltage, relaxation also increases, affecting the stall characteristics of the membranes. As seen in Table 9, for rectangular and elliptical membranes, the stall angle is not apparent, and it is delayed for all values of and for all electric voltages. The circular membrane shows an increasing trend of the stall angle with an increase in electric voltage, and once reaches 4.5 and higher, with 4.5 kV excitation, the stall pattern shows the same trend as the rectangular and elliptical membranes. This indicates that a higher relaxation after a moderate stretch ratio can delay stall for flexible membranes.
Table 9.
The peak coefficient of lift, the peak coefficient of drag, and the stall characteristics for different shapes of membranes for 3, 4.5, and 4.9 and electric excitations of 0 kV, 3.6 kV, and 4.5 kV at an air velocity of 13.4 m/s (NA-Not apparent).
As increases row-wise in Table 9, increased membrane tension is generally assumed. However, there is a condition under which the membrane gets more relaxed even if is increased. This is because, as relaxation increases, the term , i.e., Maxwell stress, in Equations (3) and (4) also increases reducing the overall membrane tension. Following that, the 0 kV case provides increased membrane tension as increases from left to right in Table 9 but the 4.5 kV case shows decreased tension. Hence, even though the stall angle is found as 42 for 3 with 4.5 kV electric voltage for the circular membrane, eventually, the stall is delayed further with an increase in from 3 to 4.9 but subjected to the same 4.5 kV electric excitation because of an increased and more dominating relaxation effect.
4.2.4. Aerodynamic Efficiency
Although, for some specific applications, more lift force is desired for pliant wings operated within low-Re environments, usually, in the majority of cases, the aerodynamic efficiency [33] has relatively more importance than the lift force itself from the design point of view. For any flight, the lift force plays a critical role; however, enhancing the lift-to-drag ratio, alternatively known as the aerodynamic efficiency expressed by Equation (10) below, is the primary goal for the efficient design of small-scale aerial structures composed of flexible wings. Hence, a comparison of the aerodynamic efficiency for all the shapes of the membranes for different air velocities, electric excitations, and stretch ratios is analyzed in the subsequent sections.
Figure 17 describes the variation in aerodynamic efficiency with AoA for the rectangular membrane at 3 for 0 kV and 4.5 kV electric excitations subjected to three different air flow velocities. From Figure 17, the aerodynamic efficiency is enhanced significantly until 11 AoA with an increase in the air flow velocity, and the peak efficiency is recorded at an AoA of around 2.5. However, an increase in electric voltage to 4.5 kV from 0 kV enhances the peak aerodynamic efficiency by around 4.3%. This trend is also observed by Hays et al. [5,29] in their experimental study of a stressed elliptical membrane of 1 mm initial thickness for 3 for an airflow velocity of 10 m/s as the voltage increased from 0 kV to 3.6 kV. From the computational analysis, out of the three membrane shapes, the elliptical membrane is found to show the highest aerodynamic efficiency, and the circular membrane is observed to have the lowest aerodynamic efficiency for all the conditions used in Figure 17.
Figure 17.
The variation in the aerodynamic efficiency for the rectangular membrane with angle of attack for 3, electric excitations of 0 kV and 4.5 kV, and air flow velocities of 5 m/s, 10 m/s, and 13.4 m/s.
Instead of 3, the use of 4.5 reveals interesting characteristics regarding the aerodynamic efficiency of the rectangular membrane for the same electric excitation of 4.5 kV which can be correlated to the nondimensional parameter Re. Although Figure 17 shows improved peak aerodynamic efficiency for increased Re as a direct function of velocity for 3 and 4.5 kV voltage, Figure 18 reveals a drop in peak aerodynamic efficiency for 4.5 and 4.5 kV voltage when air velocity jumps to 13.4 m/s (Re = 72,612 for chord length of 0.08 m) from 10 m/s (Re = 54,188 for chord length of 0.08 m) at the AoA of 2.5. Also, 4.5 with 4.5 kV voltage shows a lower peak aerodynamic efficiency for 13.4 m/s (Re = 72,612 for chord length of 0.08 m) air velocity compared to 3 with the 4.5 kV voltage. These observations from Figure 17 and Figure 18 indicate that an increase in Re does not always provide a boost in aerodynamic efficiency, and for the same Re, it might be lower for the same membrane under a certain combination of pretention and relaxation.
Figure 18.
The variation in the aerodynamic efficiency for the rectangular membrane with angle of attack for 3 and 4.5, electric excitation of 4.5 kV, and air flow velocities of 5 m/s, 10 m/s, and 13.4 m/s.
The Re is expressed as the ratio of inertia force and viscous force, and with the increase in air velocity, the inertia force becomes higher compared to the viscous force, thereby increasing the Re. Due to the increased inertia force, in general, higher Re tends to improve the aerodynamic efficiency by thinning the boundary layer and delaying the flow separation. However, if the membrane becomes soft enough for a certain combination of pretension and relaxation, the increased Re might lead to decreased aerodynamic efficiency. Although an increase in creates an increased membrane stiffness initially, a high level of relaxation, such as 4.5 kV, combined with the increased value of increases the compressive Maxwell stress, in Equations (3) and (4) at a much faster rate. This counterbalances a relatively large portion of the increased tensile stress in the membrane coming from the higher value of and results in lower overall membrane tension. Or in other words, with 4.5 and 4.5 kV voltage, the membrane becomes more relaxed compared to 3 with a 4.5 kV case. Hence, the camber effect of the membrane becomes more dominant to provide more deformation, and eventually, a thicker shape of the membrane which ultimately creates larger pressure drag, thereby reducing the aerodynamic efficiency. Following that, with a 50% increase in from 3 to 4.5 for an air flow velocity of 13.4 m/s and 4.5 kV voltage, the peak lift coefficient increases by 12% for the rectangular membrane. However, at the same time, the peak drag coefficient is also increased by more than 28%, reducing the overall aerodynamic efficiency for the same Re of 72,612. For this change in , the circular membrane is found to show the highest peak aerodynamic efficiency, and the rectangular membrane is found to show the lowest peak aerodynamic efficiency out of the three shapes of the membranes for the same electric excitation and air flow velocity. This justifies one of the objectives of this research to explore the individual potential of providing the aerodynamic efficiency among the three shapes of the membranes under different values of pretension and levels of relaxation.
Table 10 provides a summary of the percentage change in the peak aerodynamic efficiency of different shapes of the membranes with a change in electric excitations for different air flow velocities and stretch ratios of 3 and 4.5. From Table 10, the circular membrane shows no negative percentage change in aerodynamic efficiency compared to the rectangular and elliptical membranes for both 3 and 4.5, indicating a tendency to offer an enhancement in aerodynamic efficiency with a certain increase in electric voltage and air flow velocity. Similar behavior is found for the elliptical membrane of 3; however, when increases from 3 to 4.5, the percentage change in peak aerodynamic efficiency shows a gradual reduction with a change in electric excitation from 0 kV to 4.5 kV for all air flow velocities. The rectangular membrane shows the highest decrease in aerodynamic efficiency for 4.5 and an air flow velocity of 13.4 m/s for a change in electric excitation from 0 kV to 4.5 kV. As seen in Table 10, the circular membrane provides a nearly steady change in aerodynamic efficiency with changes in electric excitation, air flow velocity, and pretension; therefore, it can be considered more suitable to achieve better aerodynamic performance within a specified range of applied pretension and relaxation.
Table 10.
The percentage change in peak aerodynamic efficiency with a change in electric excitation for different membrane shapes at 3 and 4.5, and air flow velocities of 5 m/s, 10 m/s, and 13.4 m/s.
4.2.5. Aeroelastic Analysis
The aeroelastic behavior of the three shapes of the DE membranes is investigated for different air flow velocities and electric excitations. Table 11 shows the aeroelastic characteristics of the membranes in terms of the peak out-of-plane deformations for different air flow velocities and electric excitations for 3. As seen in Table 11, as expected, with the increase in relaxation for a certain air flow velocity, the peak deformation of the membrane increases. This is because, with a higher voltage or increased relaxation, the overall tension in the membrane is reduced, making the membrane increasingly flexible. The deformation becomes higher with an increased air flow velocity because of the enhanced lift force due to the increased velocity. From Table 11, it is apparent that the rectangular membrane is subjected to the least deformation, and the circular membrane undergoes the largest deformation for a certain air flow velocity and relaxation. From this analysis, the circular membrane is observed to have more potential to change its shape under aerodynamic loading due to its increased flexibility and thus can have more impact in altering the flow field and/or affecting the passive flow control. Figure 19 shows the contour plots of the out-of-plane deformations for all shapes of the membranes subjected to 3, air flow velocity of 13.4 m/s, 40 AoA, and an electric excitation of 4.5 kV, revealing that the peak out-of-plane deformation occurs near the center for all three shapes of the membranes.
Table 11.
The maximum out-of-plane deformation for different shapes of the membranes for 3, electric excitations of 0 kV, 3.6 kV, and 4.5 kV, and air flow velocities of 5 m/s, 10 m/s, and 13.4 m/s.
Figure 19.
Contour plots of the out-of-plane deformations of the (a) rectangular, (b) elliptical, and (c) circular membrane for 3, 4.5 kV electric voltage, 40 angle of attack, and 13.4 m/s air flow velocity.
To provide more insight into the physics of the relevant aeroelastic analysis discussed before in terms of membrane deformation and a nondimensional parameter, the Weber number (We) is considered which compares the aerodynamic load on the membrane with the membrane elasticity. In other words, the We can be expressed as the nondimensional aerodynamic loading on the membrane given by Equation (11) below:
where is the modulus of elasticity of the membrane and is the membrane thickness before the aeroelastic deformation. The out-of-plane deformation of the membrane due to the aerodynamic loading causes the membrane to appear with a cambered geometry. The We is a measure of the camber of the flexible membrane, which refers to the curvature or ballooning of the membrane in the out-of-plane direction. From the previously discussed aeroelastic analysis, with reference to Table 11, the deformation of the membrane increases with the increase in velocity, as a higher velocity results in higher aerodynamic loading normal to the membrane surface. Due to the increased aerodynamic loading, the membrane stretches further by adopting a higher camber. Ultimately, at one stage, the membrane tension balances the aerodynamic load, resulting in an equilibrium shape of the membrane. This behavior of the membrane is justified by consulting the trend of variation in the We in Table 12. Table 12 represents the We at 3 for all the shapes of the membranes subjected to the different electric excitations and fluid flow velocities for 40 AoA. From Table 12, an increase in the We is noticed as the velocity is increased from 5 m/s to 13.4 m/s, which is similarly observed for all shapes of the membranes.
Table 12.
The Weber number for different shapes of the membranes at 3; electric excitations of 0 kV, 3.6 kV, and 4.5 kV; and air flow velocities of 5 m/s, 10 m/s, and 13.4 m/s at 40 angle of attack.
When the electric excitation is enhanced from 0 kV to 4.5 kV, due to increased relaxation, the membrane provides reduced resistance against the out-of-plane deformation, resulting in a higher membrane deformation. Since the We is treated as an indirect measure of the membrane camber, Table 12 can be consulted to conclude that the highest and lowest deformations pertain to the circular and rectangular membranes due to the highest and lowest values of the We, respectively, for all conditions. The We increases from top to bottom of Table 12 with the increase in air flow velocity and from left to right with the increase in electric excitation. This justifies that the aerodynamic loading on the membrane dominates the membrane’s structural tension or stiffness as the We increases. Following this, as the We characterizes the maximum camber of the flexible membrane, it can be used as a nondimensional parameter to directly capture the membrane’s aeroelastic behavior for a certain aerodynamic environment.
4.2.6. Interaction Between Prestretch, Relaxation, and Aeroelastic Response
In the previous sections, the effect of pretension, the effect of relaxation, and the aeroelastic analysis of different shapes of the membranes are discussed when subjected to different fluid flow velocities. However, to fulfill the research objectives, make them more informative, and interpret the associated physics, a discussion pertaining to the interaction between pretension, electric excitation, and aeroelastic behavior is necessary, the perspective of which is highlighted in the following paragraphs for efficient and robust design of small-scale aerial structures.
The effect of pretension in the membrane is directly and fundamentally related to the stability of the membrane and the corresponding aeroelastic tailoring of the structure. Based on the overall dynamics of the membranes presented in this research, it can be surmised that the electroactive membrane wing has great potential to enhance/regulate the aerodynamic load, which depends on the applied pretension of the membrane as it is related to the wing actuation. It is common to apply bi-axial pretension to flexible membranes, and it is often treated as a measure of the overall, uniform stiffness of the membrane. The application of moderate pretension increases the natural frequencies of the membrane, helps prevent large deflections, and improves resistance to aeroelastic instability. Proper regulation of the pretension allows for controlling the curvature of the membrane to maintain its proper shape as required for aerodynamic performance. If the tension in the membrane is insufficient, then it offers reduced stiffness and becomes prone to excessive deformation, vortex-induced resonance, flutter, and various other types of problems. This stiffness can be controlled by selecting a specific geometric shape of the membrane, offering a high aspect ratio. However, for an already selected membrane with applied pretension, the stiffness can be regulated by external relaxation.
Relaxation in the membrane can be provided by inducing compressive stress, which is often created by an electric voltage leading to a softer membrane, reduced stiffness, and lower resistance to deformation. Or, in other words, the electric excitation can actively tune the structural stiffness of the membrane. With applied voltage, as the membrane relaxes, the frequency of vibration decreases which allows for regulation of the aeroelastic response of the membrane. Consequently, during relaxation, the membrane’s shape and tension can be actively adjusted to suppress flutter or optimize aerodynamic loads.
Within the scope of this research, the effect of relaxation is observed as influential when the membrane is subjected to a moderate or higher pretension. For a pretension up to 3, improved lift, drag, and aerodynamic efficiency are observed from computational and experimental analyses with an increased velocity for different shapes of the membranes with moderate relaxation. However, when 3, with a higher relaxation effect, significant differences in the dynamics of various shapes of the membranes are observed including vibration response, aerodynamic efficiency, and stall characteristics. The optimal aerodynamic efficiency for a specific shape of the membrane requires different pretensions to be applied along with different levels of relaxation to see what combination of pretension and electric excitation provides sufficient stiffness in the membrane for that purpose.
Depending on the aerodynamic environment, the flexibility of the membrane assists in passively changing its shape to obtain an optimized aerodynamic performance by regulating the camber. Increased camber offers a better scope of flow control over the membrane surface with the potential for improved aerodynamic efficiency. However, when selecting a specific shape of the membrane for designing a small aerial structure, the limit of having an increased camber must be considered since, after a certain increase in camber, the lift is not enhanced anymore and the possibility of a larger drag arises. This is because excessive flexibility of the membrane wing disrupts the formation of the proper aerodynamic shape necessary for positive lift. If the pretension in the membrane is very high, such as 5, then an application of 4.5 kV relaxation will create too much compressive stress according to Equations (3) and (4), diminishing the net tension to a level that will no longer have the required stiffness to consider the membrane as a pliant wing. Hence, there is an optimum range of pretension and electric excitation to be applied in a flexible membrane wing for the successful design of a small-scale aerial structure operating within a low-Re regime.
In summary, the application of relaxation on the membrane needs to be carefully balanced with the initial pretension to optimize or control its aeroelastic nature, as the interactions between these factors have a direct influence on shifting the boundary of unstable aeroelastic behavior. It is worth noting that an improper combination of membrane pretension and relaxation will impact the membrane stiffness required to obtain a desired aerodynamic performance and thus limit the options for appropriate aeroelastic tailoring of the membrane wing.
5. Conclusions
In this research, the structural dynamic and aerodynamic characteristics of the VHB 4910 membrane of three different geometric shapes are computationally investigated for different air flow velocities, stretch ratios, and electric excitations. For the structural dynamic analysis, a computational finite element model is developed to estimate the natural frequencies of vibration using the Ogden hyperelastic model approximation. Following that, for the aerodynamic analysis, a two-way, fully coupled computational fluid–structure interaction model is developed to analyze the effect of stretch ratios, relaxation, aerodynamic efficiency, and elastic deformation. The simulation results are compared with experimental results published in the literature to validate the computational models. The following conclusions can be drawn from this research:
- The Ogden hyperelastic model is capable of capturing the natural frequency of membrane vibration accurately.
- The rectangular membrane shows a higher frequency in the first mode, has the potential to delay the resonance, and offers greater resistance to aeroelastic instability. This characteristics are observed in the circular membrane in higher modes.
- A stretch ratio of three or higher is considered a moderate stretch ratio for the dynamic analysis of flexible membranes.
- Increased relaxation with a moderate stretch ratio enhances the coefficient of lift to a narrow range of angle of attack but decreases the value after that.
- An elliptical membrane offers a broader range of angle of attack compared to rectangular and circular shapes, within which increased lift and drag coefficients are observed with increased relaxation.
- The rectangular and elliptical membranes provide more flexibility to regulate the stall than the circular membrane with a higher relaxation at a certain stretch ratio.
- For a moderate stretch ratio with different velocities and increased relaxation, the elliptical membrane shows the highest aerodynamic efficiency. When the moderate stretch ratio is exceeded, the circular membrane exhibits superior aerodynamic efficiency.
- The circular membrane can have more influence in altering the flow field and/or affecting the passive flow control due to its greater flexibility in changing its shape.
This research provides a comprehensive analysis of the structural dynamic and aerodynamic behavior of dielectric elastomer membranes of various shapes subject to different pretensions, relaxations, and fluid flow velocities. This helps develop a preliminary but solid foundation to further explore the effect of changing the governing parameters of the overall dynamics of the membranes towards an efficient design of small-scale aerial vehicles. The research is currently limited to a steady, low Reynolds number analysis and excludes the viscoelastic behavior of the membranes, as it is beyond the scope of this research. Hence, future work will incorporate aerodynamic analysis with a high Reynolds number associated with the turbulence and the effect of viscoelasticity to have further insights into analyzing the dynamic characteristics of flexible membranes. The focus of future work should emphasize experimental research to correlate the simulations involving the unsteady aerodynamic effects and viscoelastic behavior of hyperelastic materials to predict the performance of small-scale aerial structures inclusively and with more reliability leading to an efficient design.
Author Contributions
Conceptualization, P.S.; methodology, P.S. and B.F.; software, P.S. and B.F.; validation, P.S. and B.F.; formal analysis, P.S., B.F. and M.S.R.; investigation, P.S. and B.F.; resources, P.S.; data curation, P.S. and B.F.; writing—original draft preparation, P.S., B.F. and M.S.R.; writing—review and editing, P.S., B.F. and M.S.R.; visualization, P.S. and M.S.R.; supervision, P.S.; project administration, P.S.; funding acquisition, P.S. All authors have read and agreed to the published version of the manuscript.
Funding
The authors acknowledge partial support for this research from Embry-Riddle Aeronautical University, including funding provided through the Faculty Research Development Program (FRDP), the Faculty Innovative Research in Science and Technology (FIRST) Program, and the Undergraduate Research Institute (URI).
Data Availability Statement
The data presented in this study are available on request from the corresponding author, as certain simulation modules are part of ongoing research and are not yet suitable for public dissemination.
Acknowledgments
The authors acknowledge the financial and technical support from Embry-Riddle Aeronautical University to accomplish the study.
Conflicts of Interest
The authors declare no conflicts of interest. The funders had no role in the design of the study; in the collection, analyses, or interpretation of data; in the writing of the manuscript; or in the decision to publish the results.
Nomenclature
The following symbols are used in this manuscript:
| coefficient of lift | |
| coefficient of drag | |
| true electric field | |
| modulus of elasticity of the membrane | |
| chord length of the membrane aligned parallel to the airflow velocity | |
| number of terms to be used in the hyperelastic model | |
| pressure | |
| air flow velocity | |
| electric voltage | |
| strain energy density function | |
| acceleration vector | |
| distance between the neutral axis and the centroidal axis | |
| linear displacement along the X axis, Y axis, and Z axis | |
| natural frequency in Hz | |
| force vector per unit volume | |
| acceleration due to gravity along X axis, Y axis, and Z axis | |
| thickness of the membrane before aeroelastic deformation | |
| index representing an integer | |
| time | |
| thickness of the membrane after pretension is applied | |
| thickness of the membrane in the undeformed state | |
| velocity component along X axis, Y axis, Z axis | |
| x, | independent displacement variables along the X axis, Y axis, and Z axis |
| material constant for the hyperelastic model | |
| angle of attack | |
| permittivity | |
| angular displacement of the X axis, Y axis, and Z axis | |
| stretch ratio | |
| material constant for the hyperelastic model | |
| shear modulus of dielectric elastomer | |
| dynamic viscosity of air | |
| density of air, membrane | |
| stress on the membrane along the X axis and Y axis | |
| stress tensor |
References
- Hajiesmaili, E.; Clarke, D.R. Dielectric elastomer actuators. J. Appl. Phys. 2021, 129, 151102. [Google Scholar] [CrossRef] [Scilit]
- Zhang, Q.; Yu, W.; Zhao, J.; Meng, C.; Guo, S. A Review of the Applications and Challenges of Dielectric Elastomer Actuators in Soft Robotics. Machines 2025, 13, 101. [Google Scholar] [CrossRef] [Scilit]
- Lu, T.; Ma, C.; Wang, T. Mechanics of dielectric elastomer structures: A review. Extrem. Mech. Lett. 2020, 38, 100752. [Google Scholar] [CrossRef] [Scilit]
- Cooley, C.G.; Lowe, R.L. Nonlinear vibration of dielectric elastomer membranes with axial inertia effects. Int. J. Mech. Sci. 2023, 248, 108205. [Google Scholar] [CrossRef] [Scilit]
- Hays, M.R.; Morton, J.; Dickinson, B.; Chakravarty, U.K.; Oates, W.S. Aerodynamic control of micro air vehicle wings using electroactive membranes. J. Intell. Mater. Syst. Struct. 2013, 24, 862–878. [Google Scholar] [CrossRef] [Scilit]
- Pulok, M.K.H.; Chakravarty, U.K. Modal Characterization, Aerodynamics, and Gust Response of an Electroactive Membrane. AIAA J. 2022, 60, 3194–3205. [Google Scholar] [CrossRef] [Scilit]
- Zhu, J.; Cai, S.; Suo, Z. Resonant behavior of a membrane of a dielectric elastomer. Int. J. Solids Struct. 2010, 47, 3254–3262. [Google Scholar] [CrossRef] [Scilit]
- Maqsood, A.; Go, T.H. Aerodynamic characteristics of a flexible membrane micro air vehicle. Aircr. Eng. Aerosp. Technol. 2015, 87, 30–37. [Google Scholar] [CrossRef] [Scilit]
- Kang, W.; Hu, S.; Chen, B.; Yao, W. Modal Phase Study on Lift Enhancement of a Locally Flexible Membrane Airfoil Using Dynamic Mode Decomposition. Aerospace 2025, 12, 313. [Google Scholar] [CrossRef] [Scilit]
- Lang, X.; Song, B.; Yang, W.; Yang, X. Effect of Wing Membrane Material on the Aerodynamic Performance of Flexible Flapping Wing. Appl. Sci. 2022, 12, 4501. [Google Scholar] [CrossRef] [Scilit]
- Zhao, D.; Du, H.; Xiao, A.; Cao, G.; Lian, Z.; Liu, J. Vibration study of dielectric elastomer conical structure based on fractional viscoelasticity. Sci. Rep. 2025, 15, 11445. [Google Scholar] [CrossRef] [Scilit]
- Gu, G.; Lai, Z. Finite element analysis of dielectric elastomer membranes using shell elements. J. Renew. Sustain. Energy 2018, 10, 044704. [Google Scholar] [CrossRef] [Scilit]
- Kossa, A.; Valentine, M.T.; McMeeking, R.M. Analysis of the compressible, isotropic, neo-Hookean hyperelastic model. Meccanica 2023, 58, 217–232. [Google Scholar] [CrossRef] [Scilit]
- Mihai, L.A.; Chin, L.; Janmey, P.A.; Goriely, A. A comparison of hyperelastic constitutive models applicable to brain and fat tissues. J. R. Soc. Interface 2015, 12, 20150486. [Google Scholar] [CrossRef] [Scilit]
- Liang, H.; Zhao, Y.; Du, B.; Li, S.; Zhang, X.; Chen, X. Characterizing the dielectric elastomer’s complete mechanical behavior through an electromechanical coupling method. Extrem. Mech. Lett. 2024, 71, 102204. [Google Scholar] [CrossRef] [Scilit]
- Park, S.-Y.; Kareem, A.B.; Mustapha, T.A.; Joo, W.-J.; Hur, J.-W. Hyperelastic and Stacked Ensemble-Driven Predictive Modeling of PEMFC Gaskets Under Thermal and Chemical Aging. Materials 2024, 17, 5675. [Google Scholar] [CrossRef] [Scilit] [PubMed]
- Simón-Portillo, F.J.; Abellán-López, D.; Arán, F.; da Silva, L.F.M.; Sánchez-Lozano, M. Methodology for the mechanical characterisation of hyperelastic adhesives. Experimental validation on joints of different thicknesses. Polym. Test. 2023, 129, 108286. [Google Scholar] [CrossRef] [Scilit]
- Ojo, O.; Pulok, M.K.H.; Su, J.; Chakravarty, U.K. An Investigation on the Aerodynamics, Vibrations, and Control of an Electroactive Membrane. In Proceedings of the ASME 2022 International Mechanical Engineering Congress and Exposition, Columbus, OH, USA, 30 October–3 November 2022. [Google Scholar]
- Hu, S.; Kang, W.; Wang, Y. Fluid-structural interaction of dielectric elastic membrane airfoil. In Proceedings of the 2023 2nd International Symposium on Aerospace Engineering and Systems (ISAES), Nanjing, China, 19–21 May 2023; pp. 120–124. [Google Scholar]
- Lin, Z.-H.; Li, X.-J.; Jin, Z.-J.; Qian, J.-Y. Fluid-Structure Interaction Analysis on Membrane Behavior of a Microfluidic Passive Valve. Membranes 2020, 10, 300. [Google Scholar] [CrossRef] [Scilit]
- Genç, M.S.; Demir, H.; Özden, M.; Bodur, T.M. Experimental analysis of fluid-structure interaction in flexible wings at low Reynolds number flows. Aircr. Eng. Aerosp. Technol. 2021, 93, 1060–1075. [Google Scholar] [CrossRef] [Scilit]
- Putranto, T.; Yulianto, T.; Sujiatanti, S.H.; Setyawan, D.; Zakki, A.F.; Muis Alie, M.Z.; Wibowo, W. Numerical Analysis of Composite Stiffened NiTiNOL-Steel Wire Ropes and Panels Undergoing Nonlinear Vibrations. Modelling 2025, 6, 77. [Google Scholar] [CrossRef] [Scilit]
- Liang, C.; Chen, J.; Li, N.; Dong, Y.; Zhong, T.; Zeng, S.; Dong, C. Vibration Characteristic Analysis of Hollow Fiber Membrane for Air Dehumidification Using Fluid-Structure Interaction. Membranes 2023, 13, 233. [Google Scholar] [CrossRef] [Scilit]
- Li, G.; Jaiman, R.K.; Lei, B.; Liu, H. Aeroelastic characteristics of flexible membrane wings with ceiling effect. Phys. Fluids 2024, 36, 035148. [Google Scholar] [CrossRef] [Scilit]
- Tong, X.; Zhu, X.; Zhou, Z.; Sun, J.; Zhang, J.; Wang, Q. Study on the Aeroelastic Characteristics of a Large-Span Joined-Wing Solar-Powered UAV. Aerospace 2025, 12, 892. [Google Scholar] [CrossRef] [Scilit]
- Yeh, S.-I.; Chiang, C.-H. The Influence of Wing Membrane Elasticity on Aerodynamics in a Bat-Inspired Flapping Robot. Biomimetics 2025, 10, 161. [Google Scholar] [CrossRef] [Scilit]
- Sahu, R.K.; Saini, A.; Ahmad, D.; Patra, K.; Szpunar, J. Estimation and validation of maxwell stress of planar dielectric elastomer actuators. J. Mech. Sci. Technol. 2016, 30, 429–436. [Google Scholar] [CrossRef] [Scilit]
- Dong, L.; Grissom, M.D.; Safwat, T.; Prasad, M.G.; Fisher, F.T. Resonant frequency tuning of electroactive polymer membranes via an applied bias voltage. Smart Mater. Struct. 2018, 27, 114005. [Google Scholar] [CrossRef] [Scilit]
- Hays, M.R.; Hart, A.; Guettler, A.; Ukeiley, L.; Oates, W.S. Fluid–structural dynamic characterization of an electroactive membrane wing. J. Intell. Mater. Syst. Struct. 2016, 27, 1510–1522. [Google Scholar] [CrossRef] [Scilit]
- Gao, Z.; Tuncer, A.; Cuitiño, A.M. Modeling and simulation of the coupled mechanical–electrical response of soft solids. Int. J. Plast. 2011, 27, 1459–1470. [Google Scholar] [CrossRef] [Scilit]
- Rozov, V.; Volmering, A.; Hermanutz, A.; Hornung, M.; Breitsamter, C. CFD-Based Aeroelastic Sensitivity Study of a Low-Speed Flutter Demonstrator. Aerospace 2019, 6, 30. [Google Scholar] [CrossRef] [Scilit]
- Anderson, D.; Tannehill, J.C.; Pletcher, R.H. Computational Fluid Mechanics and Heat Transfer, 3rd ed.; CRC Press: Boca Raton, FL, USA, 2013. [Google Scholar]
- Kretov, A.; Tiniakov, D. Evaluation of the Mass and Aerodynamic Efficiency of a High Aspect Ratio Wing for Prospective Passenger Aircraft. Aerospace 2022, 9, 497. [Google Scholar] [CrossRef] [Scilit]
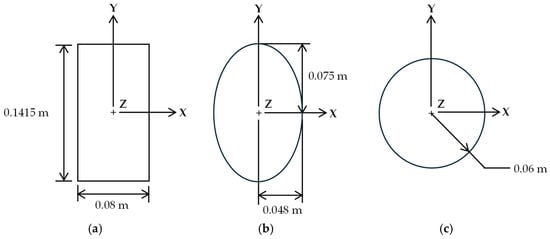
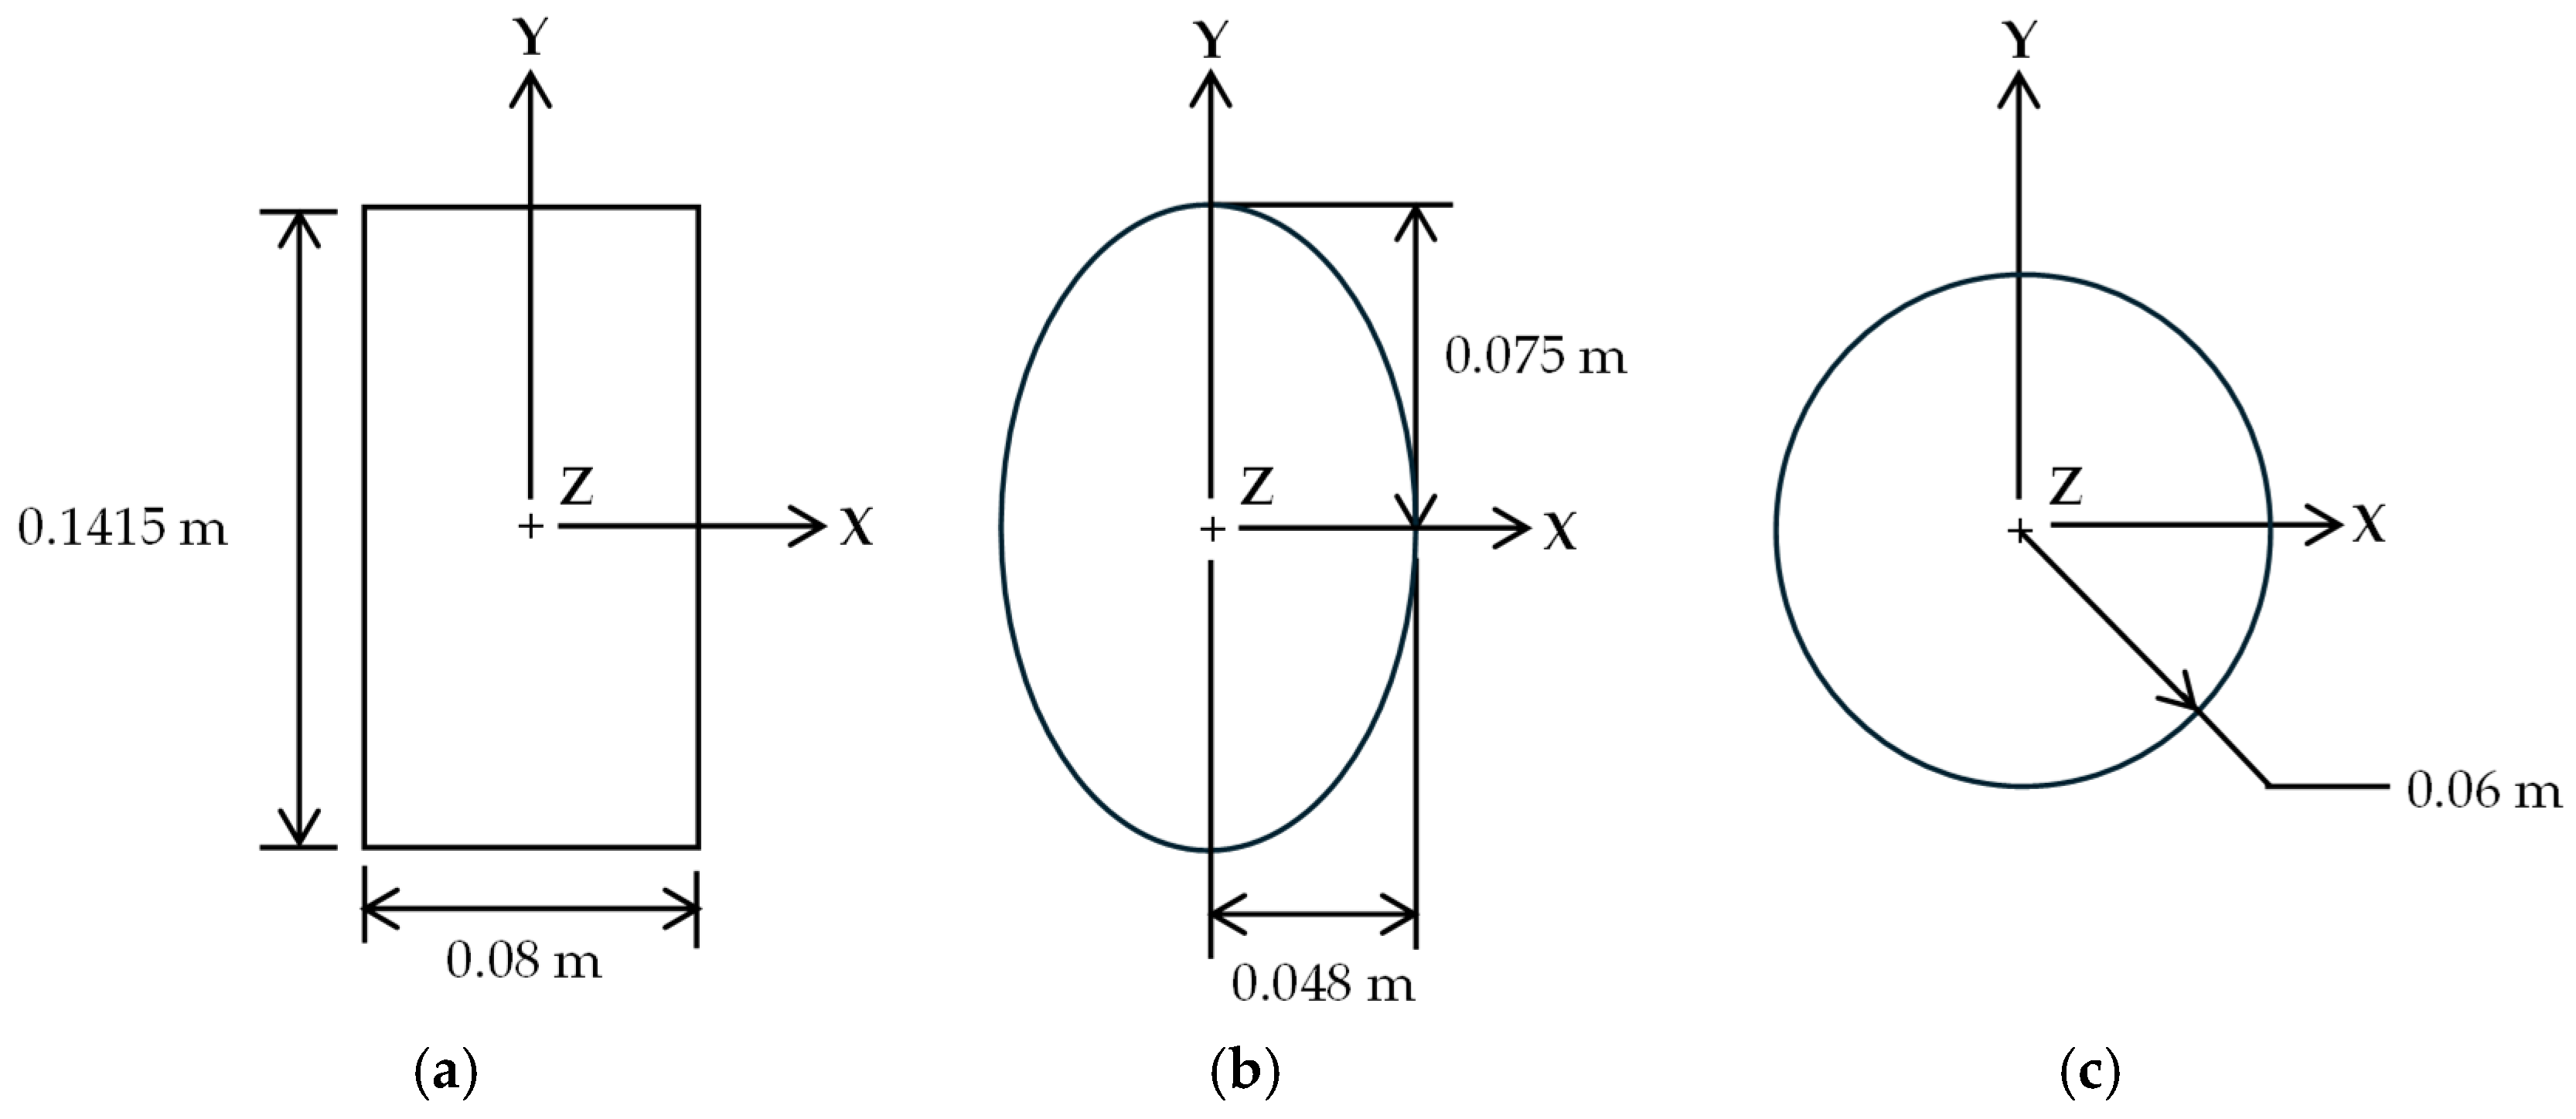
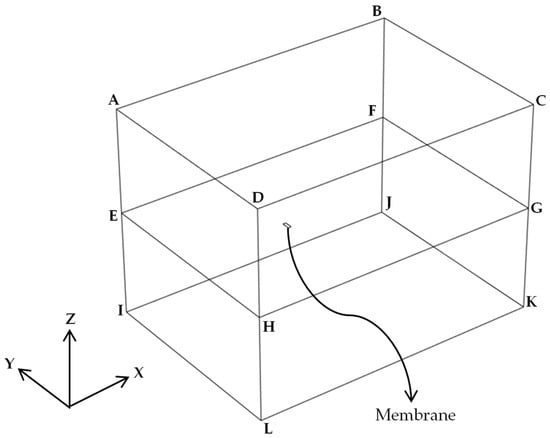
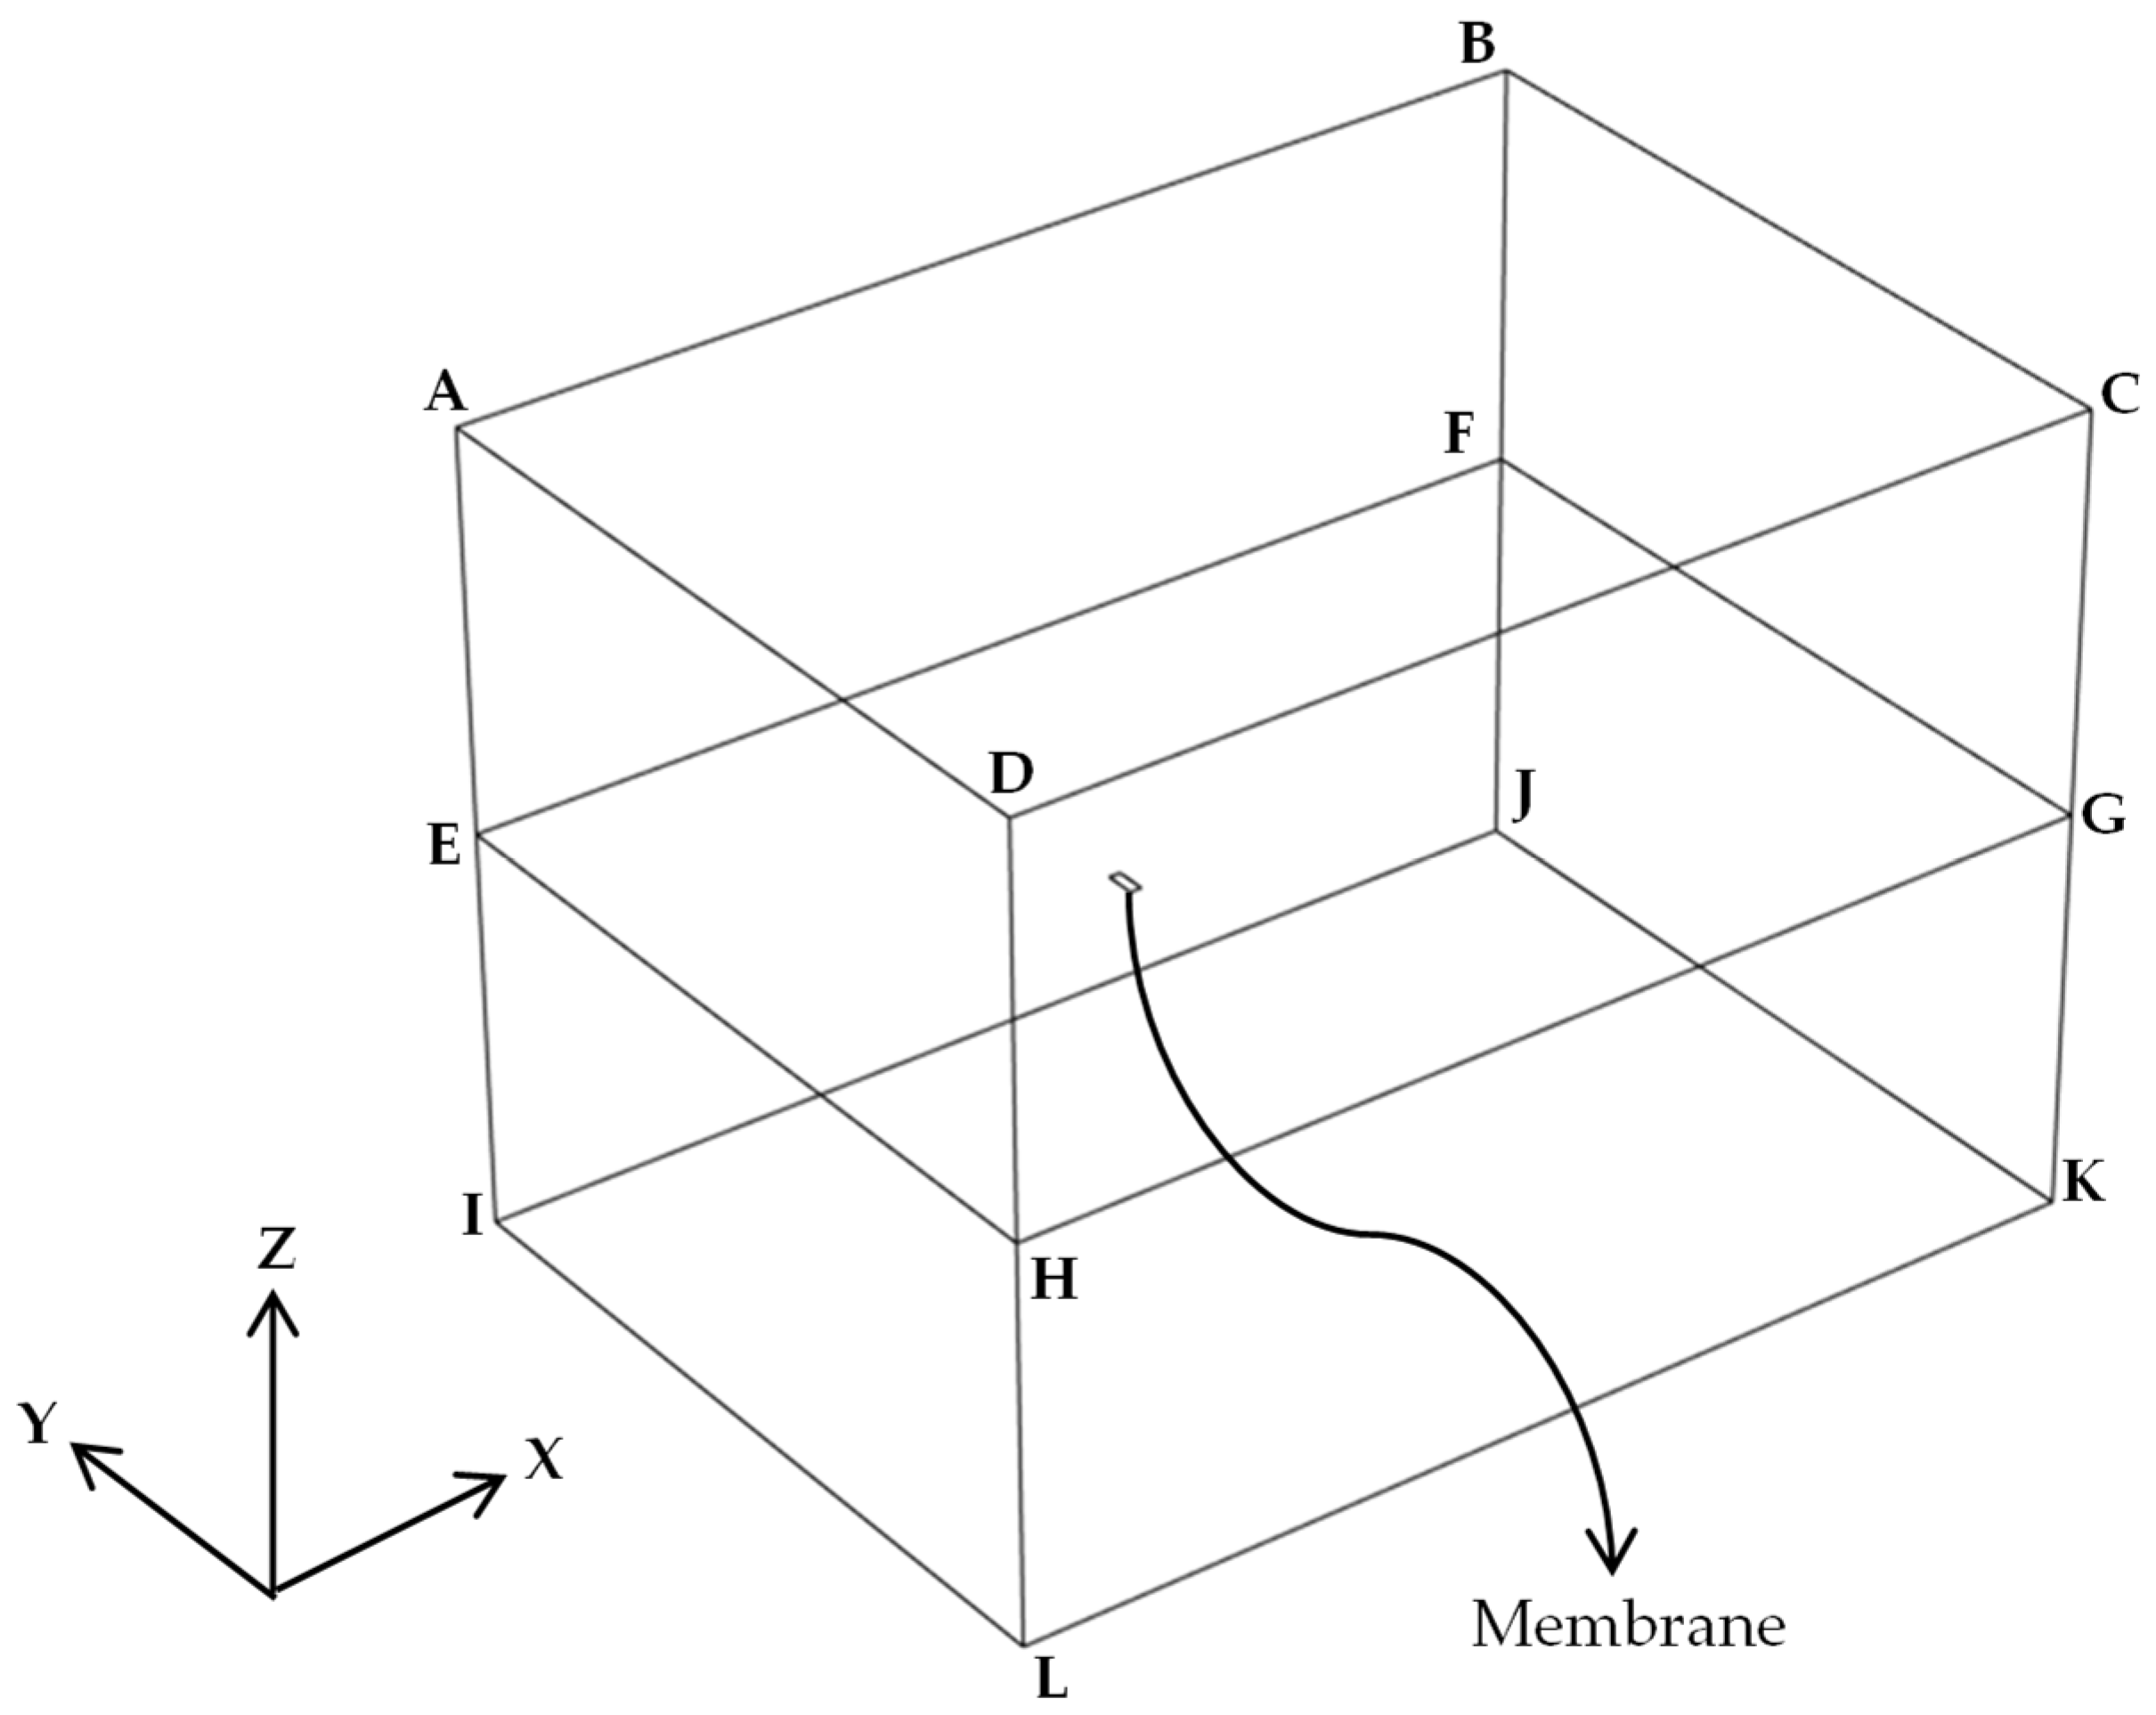
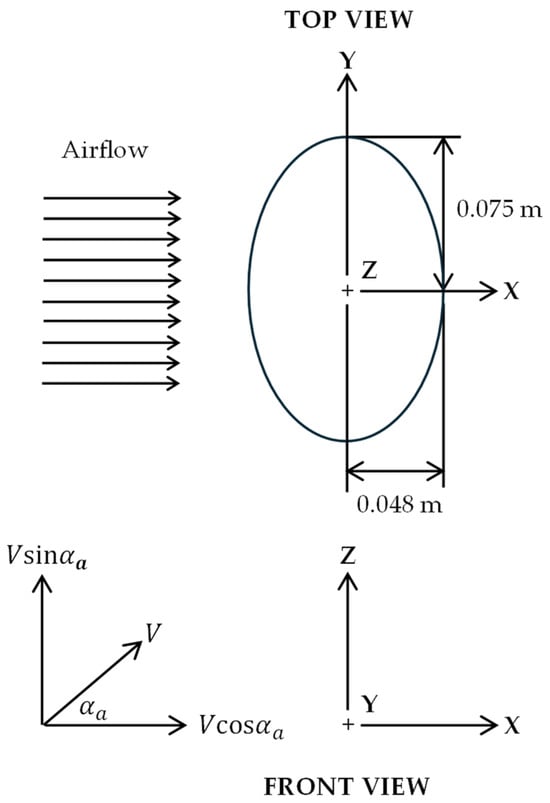
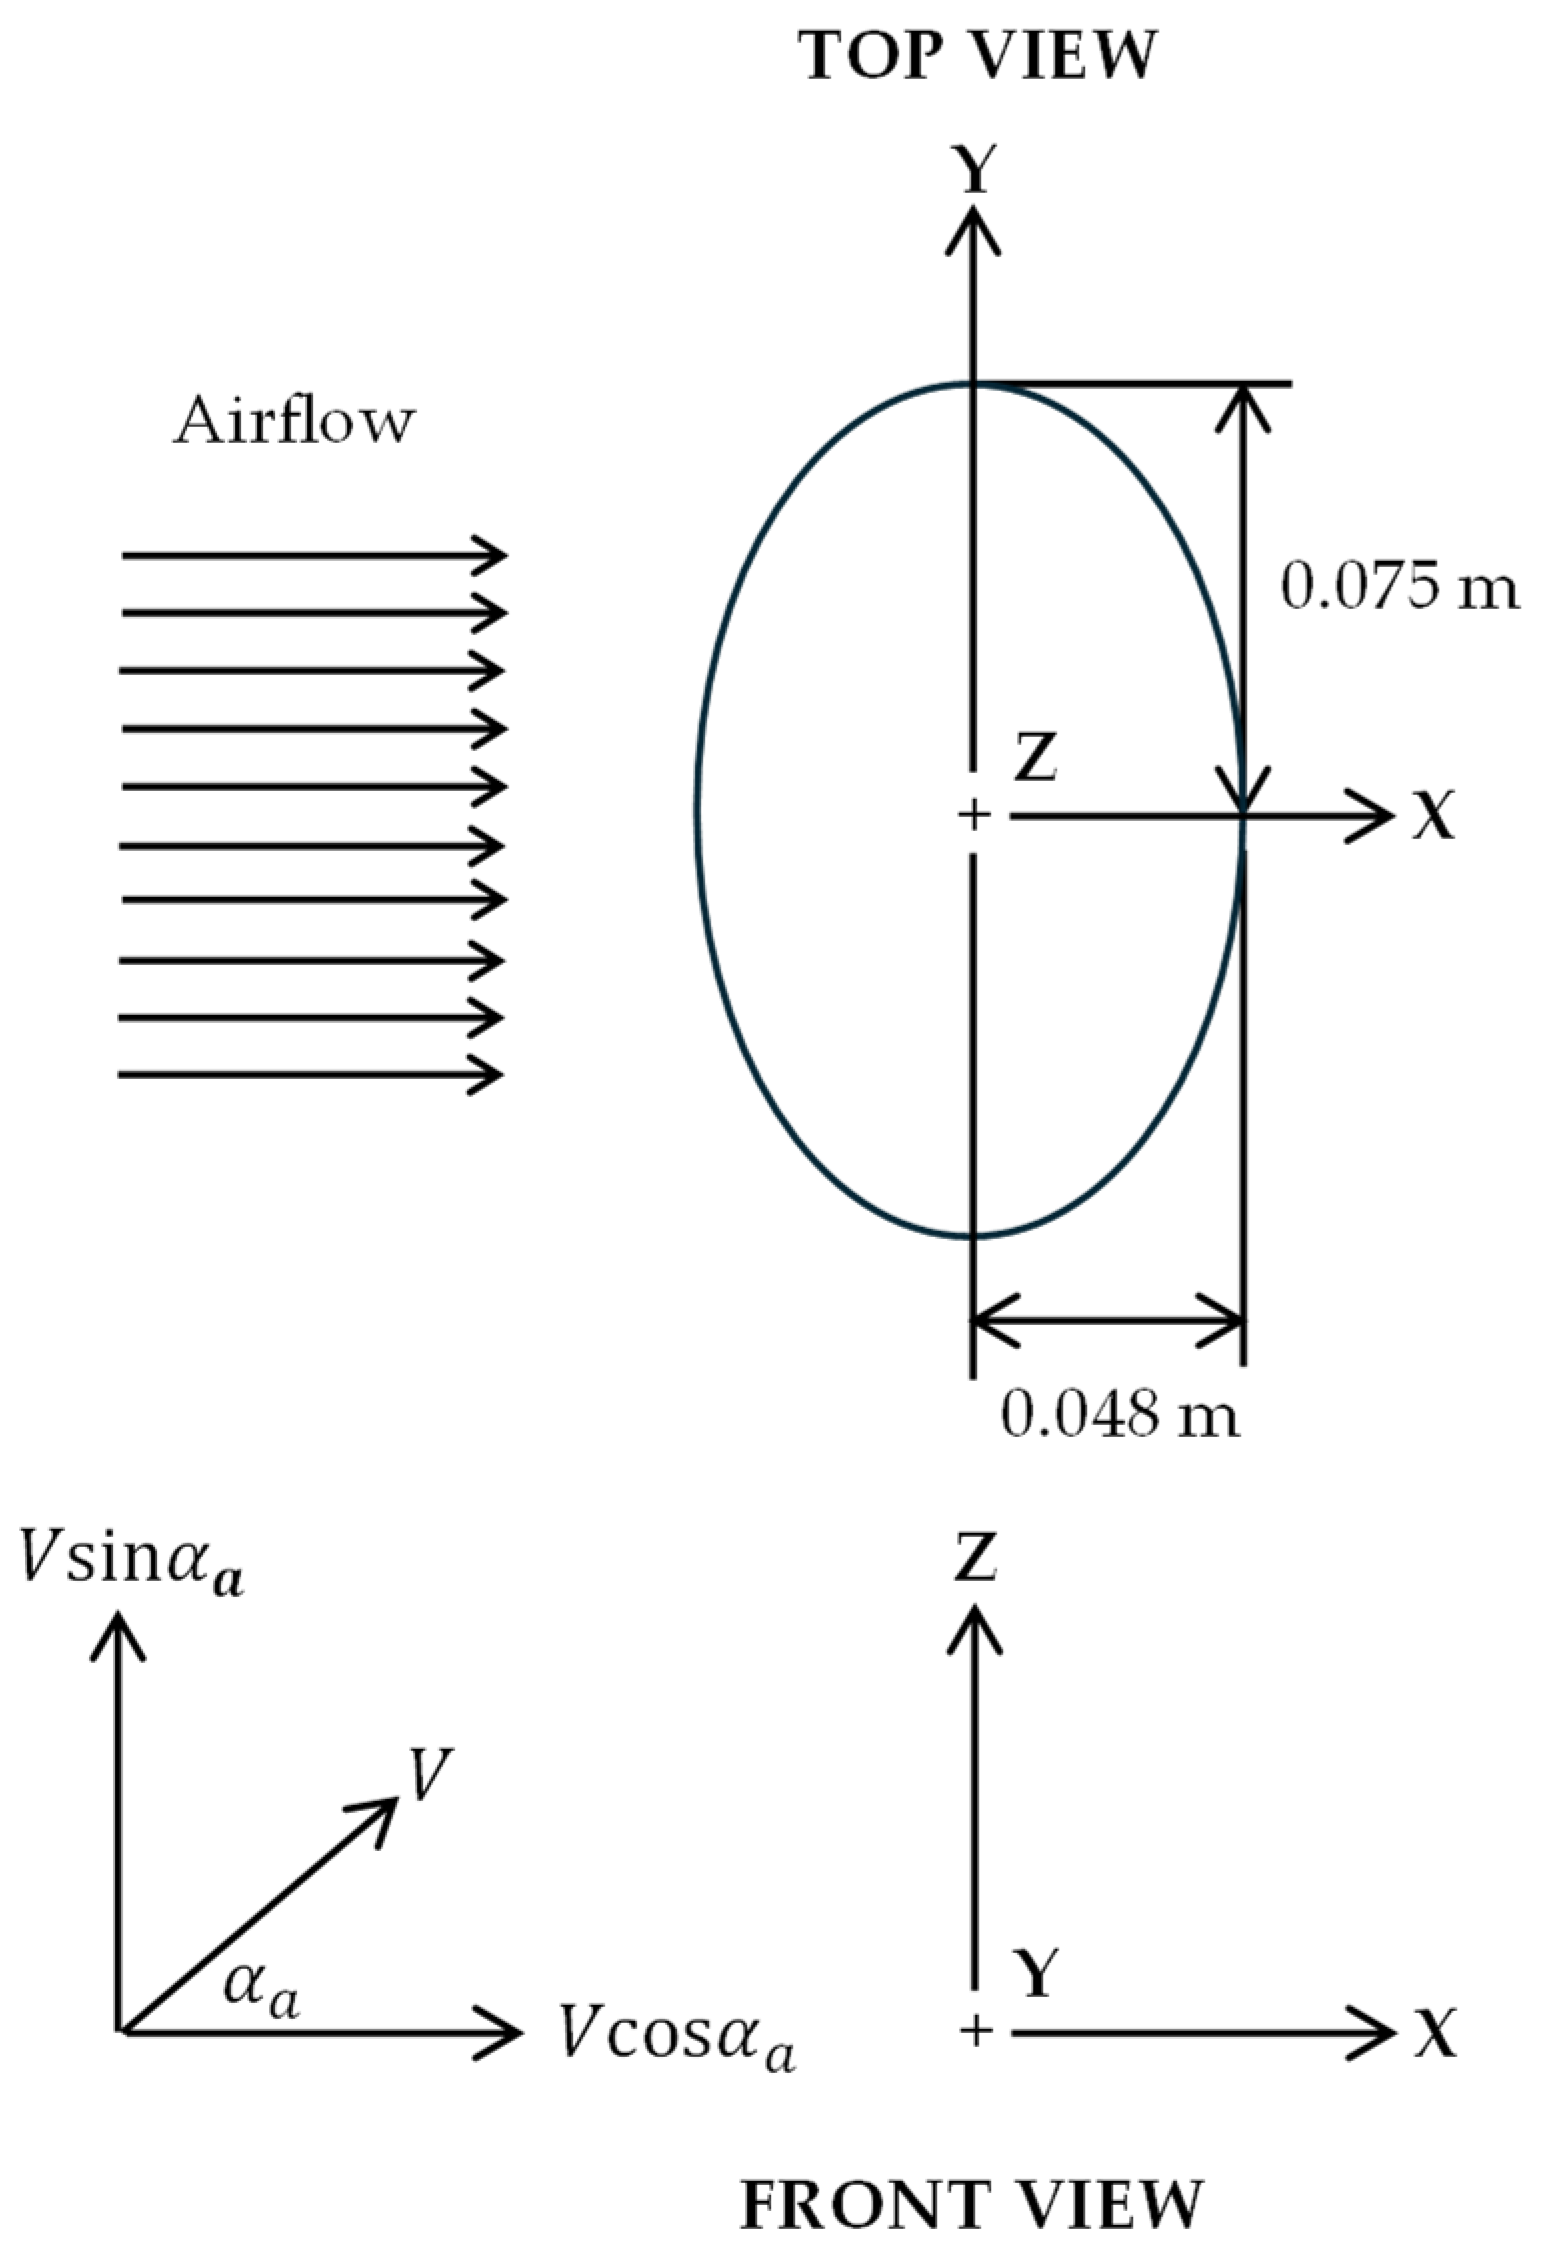
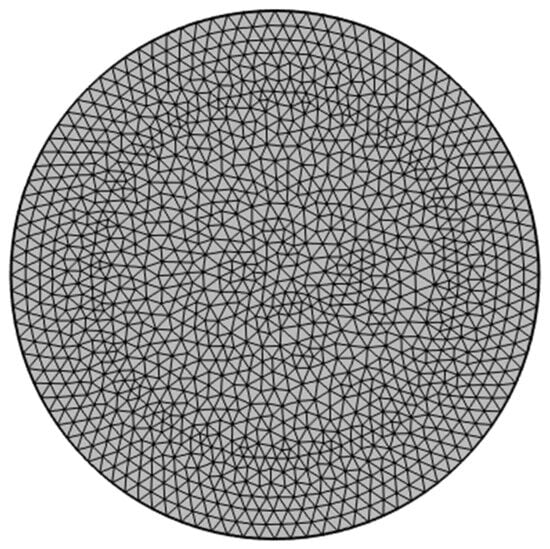
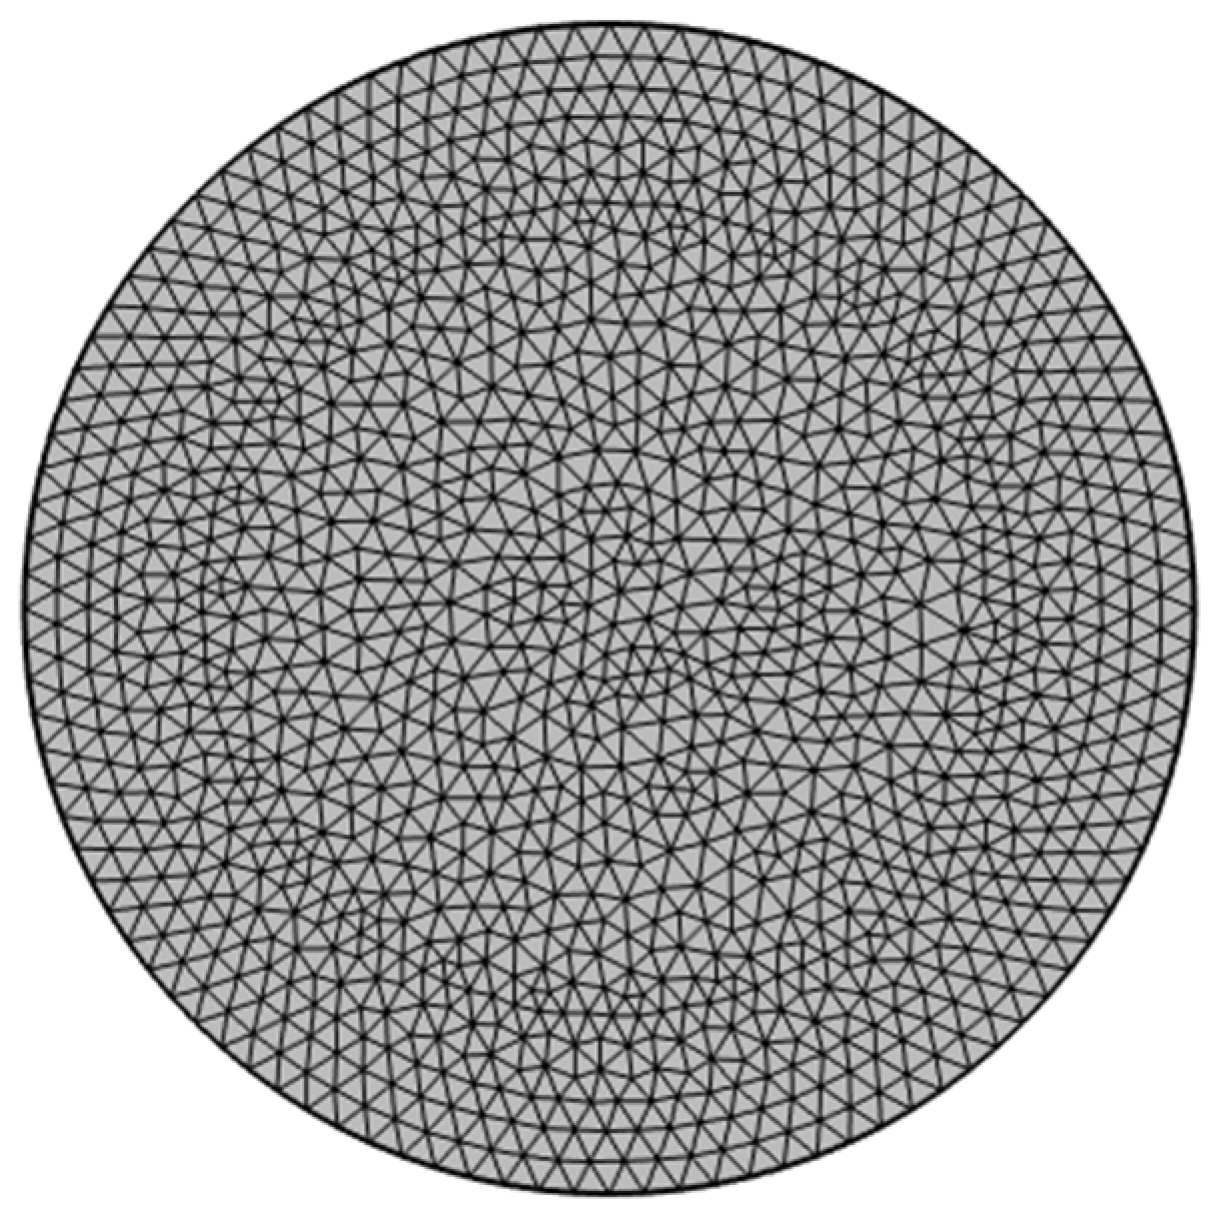
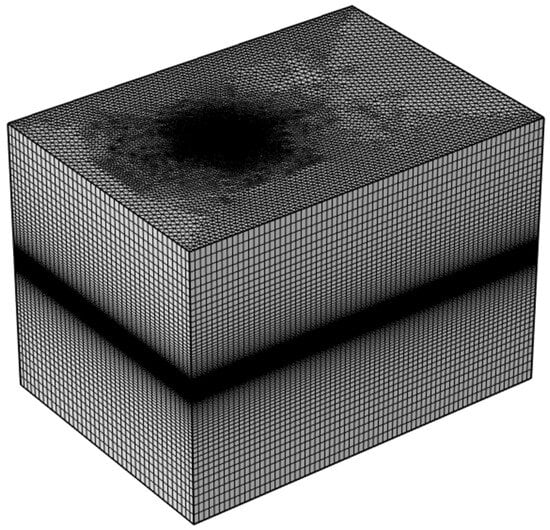
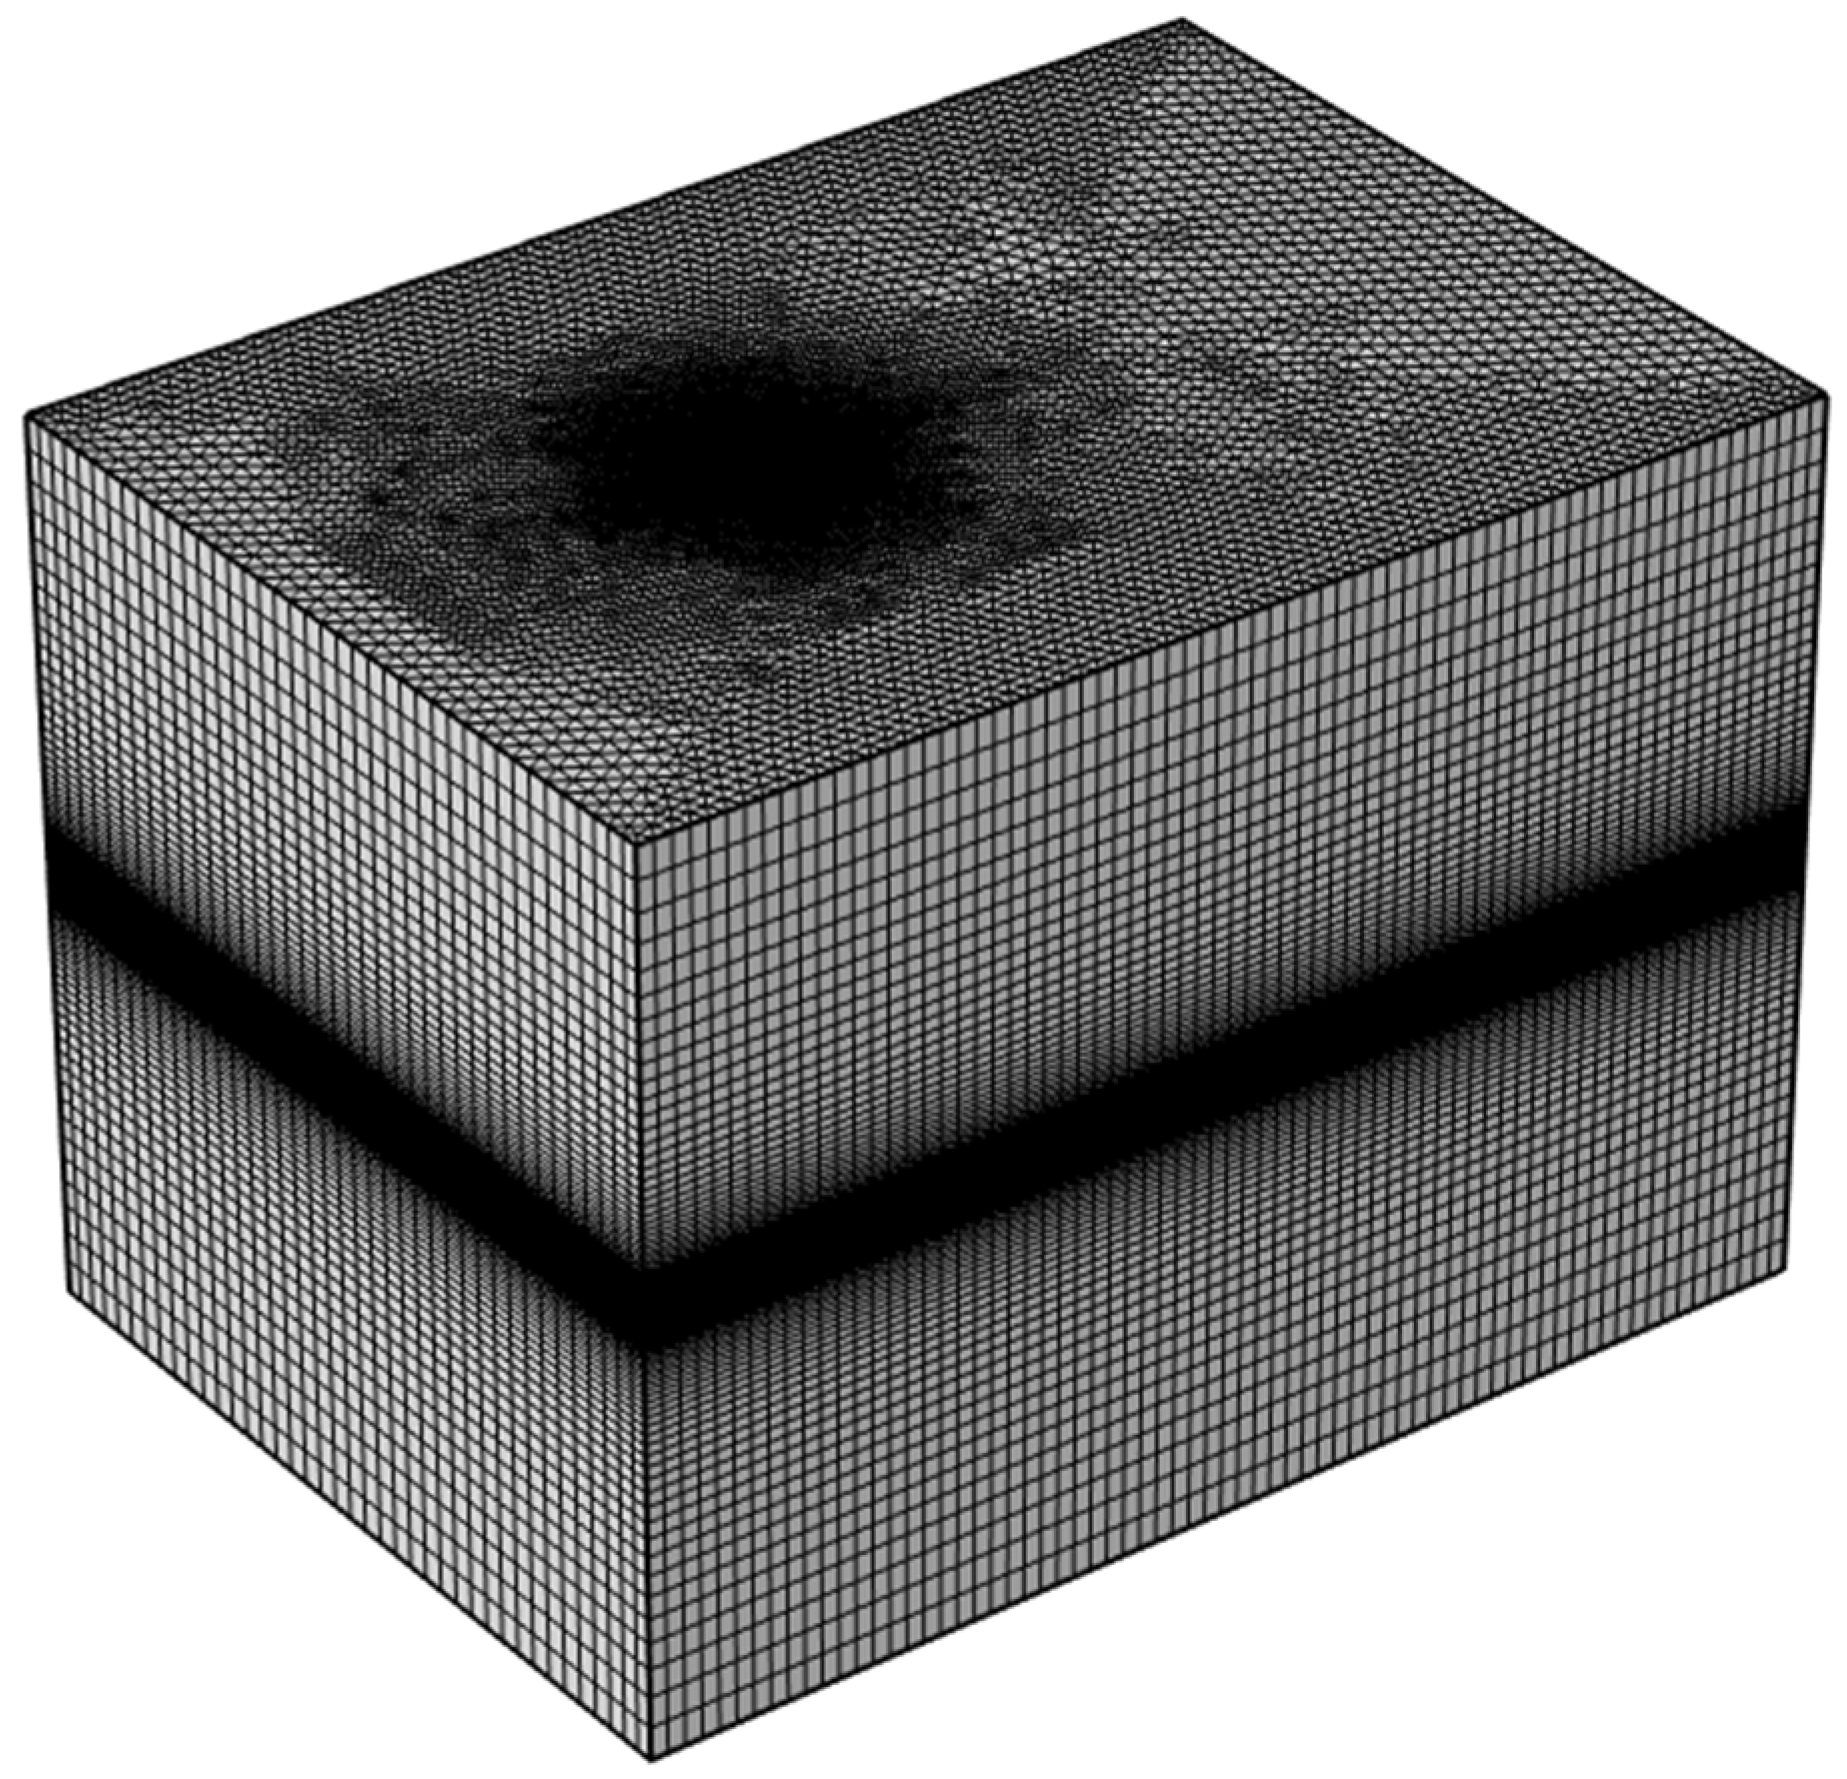
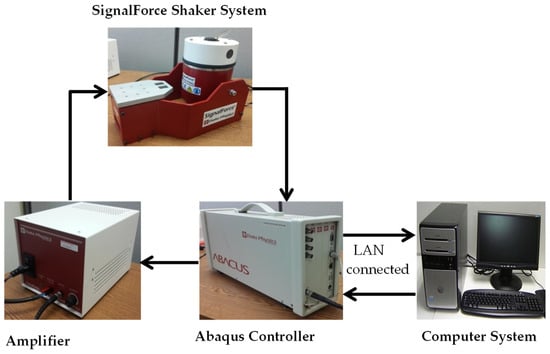
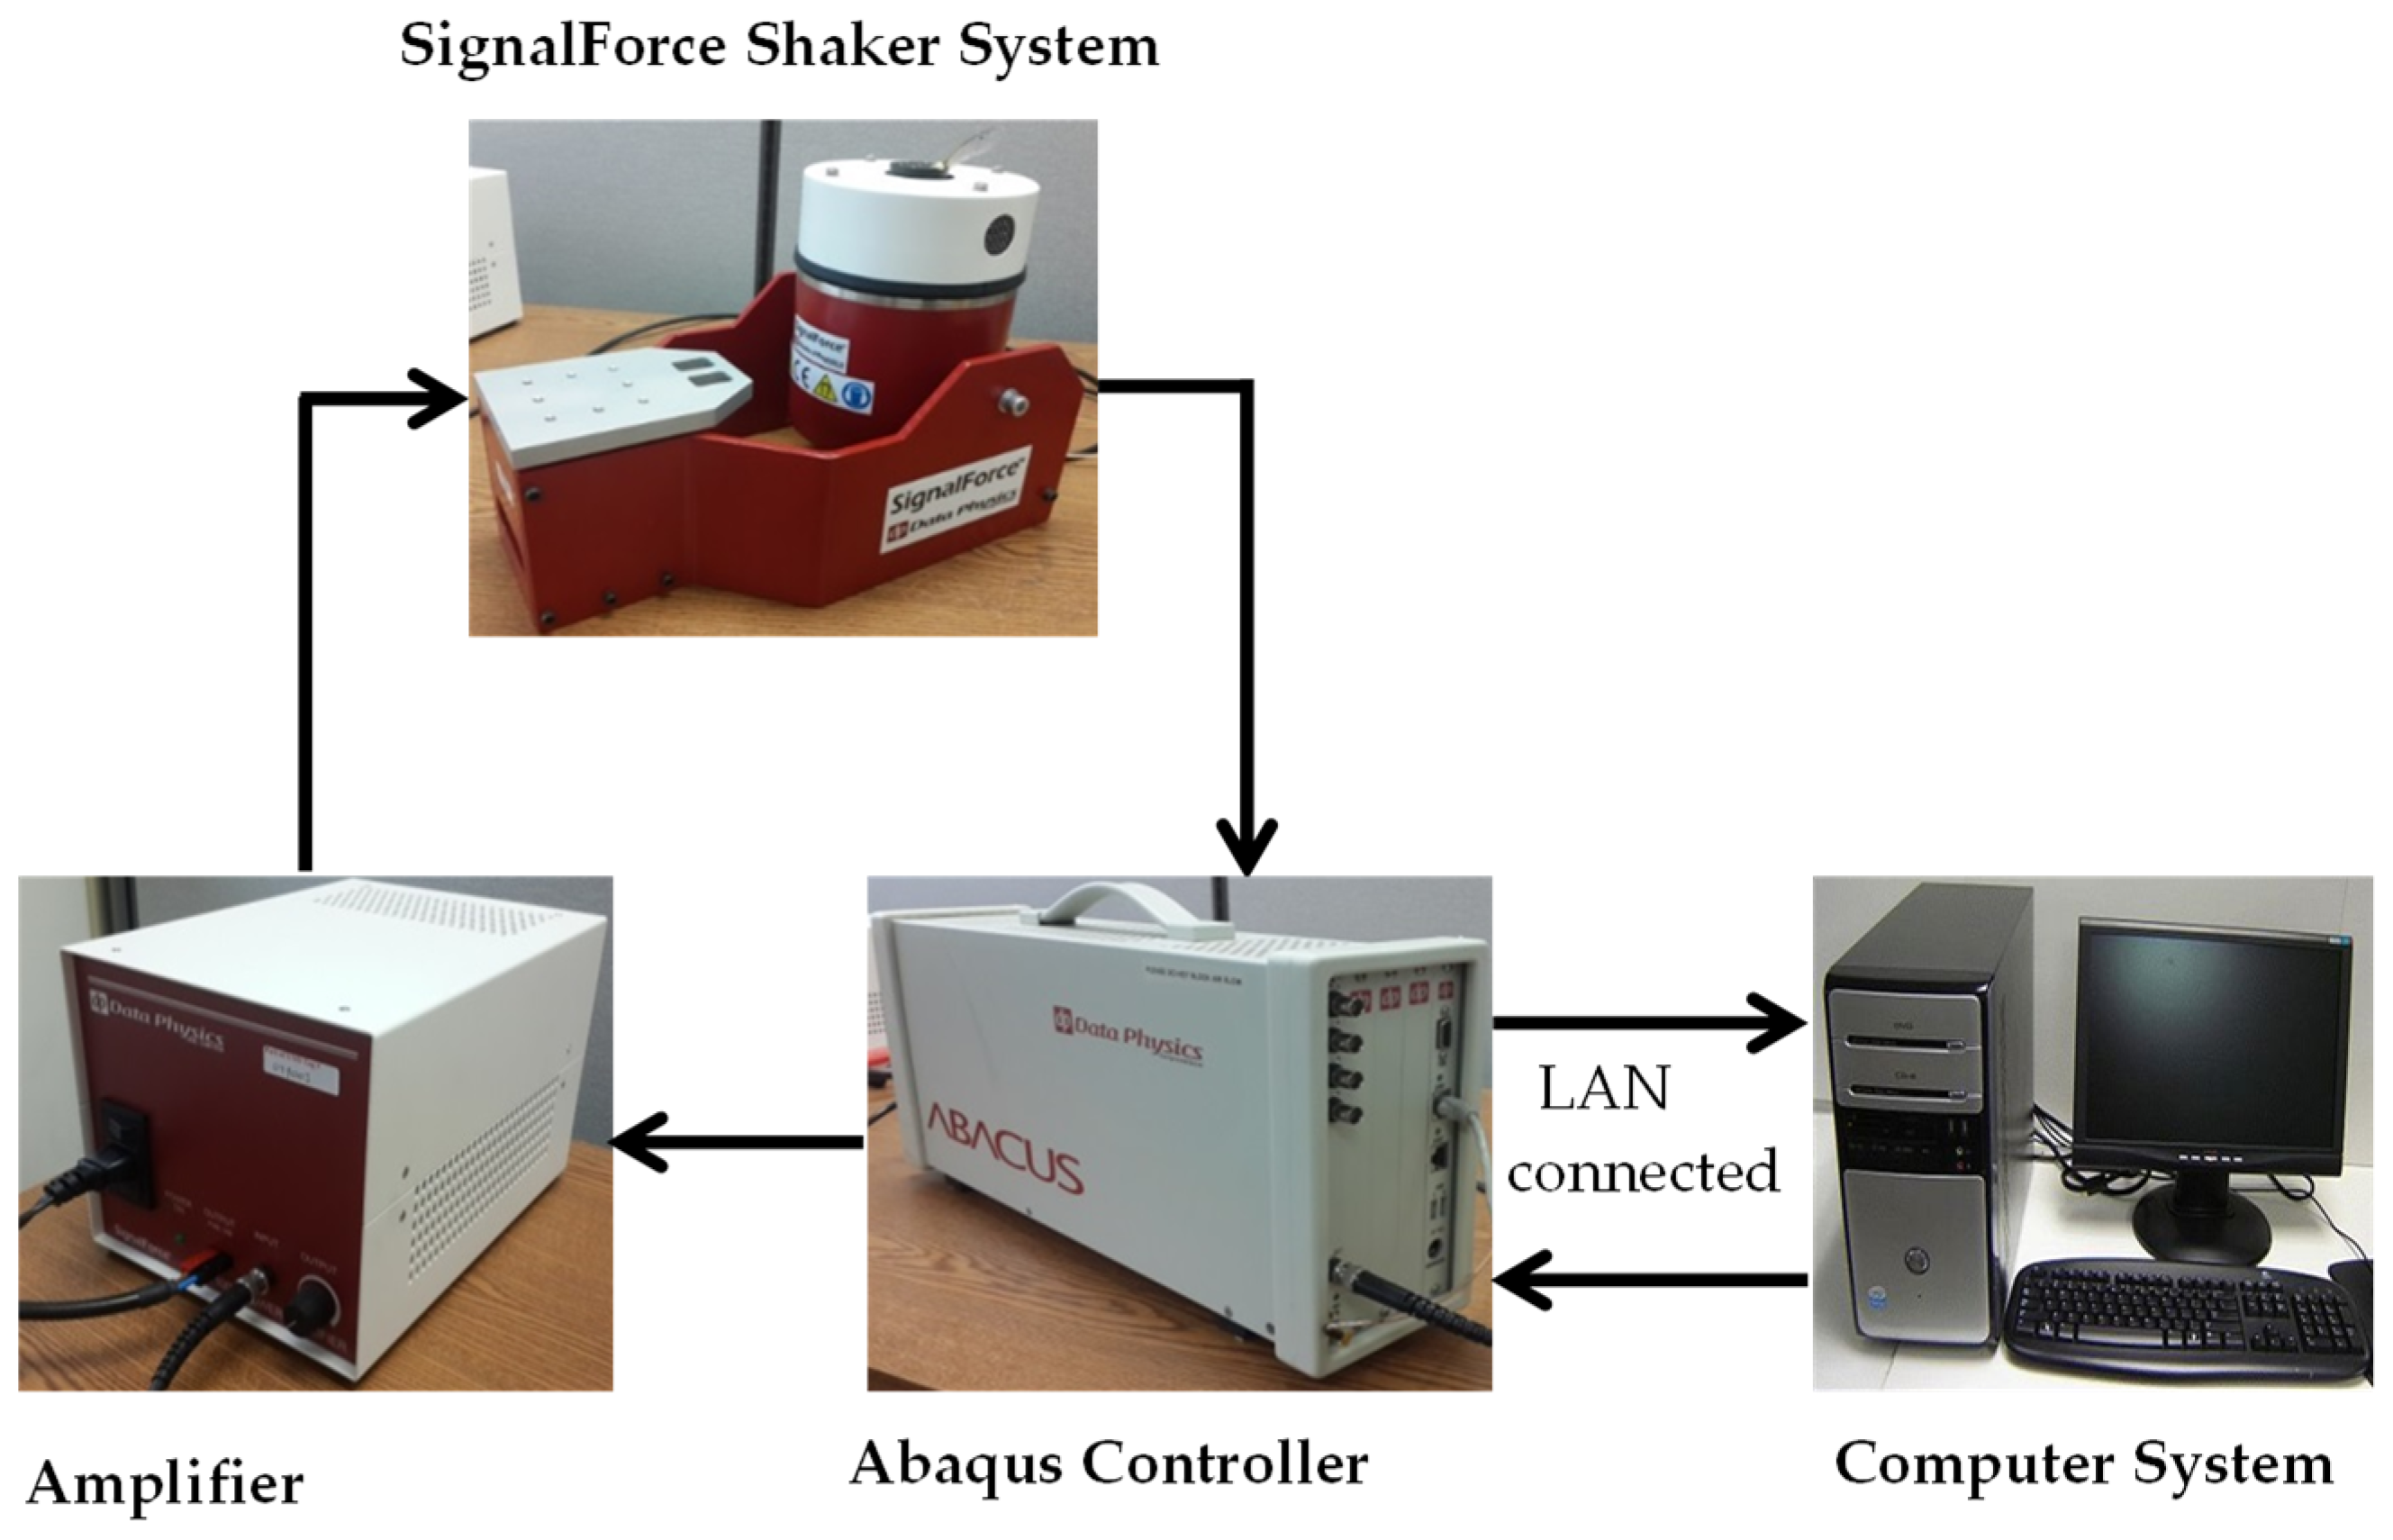
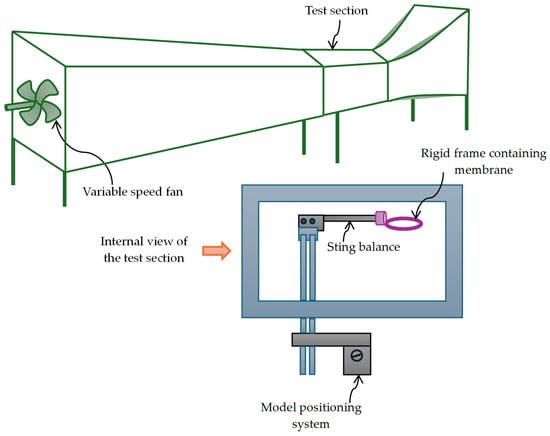
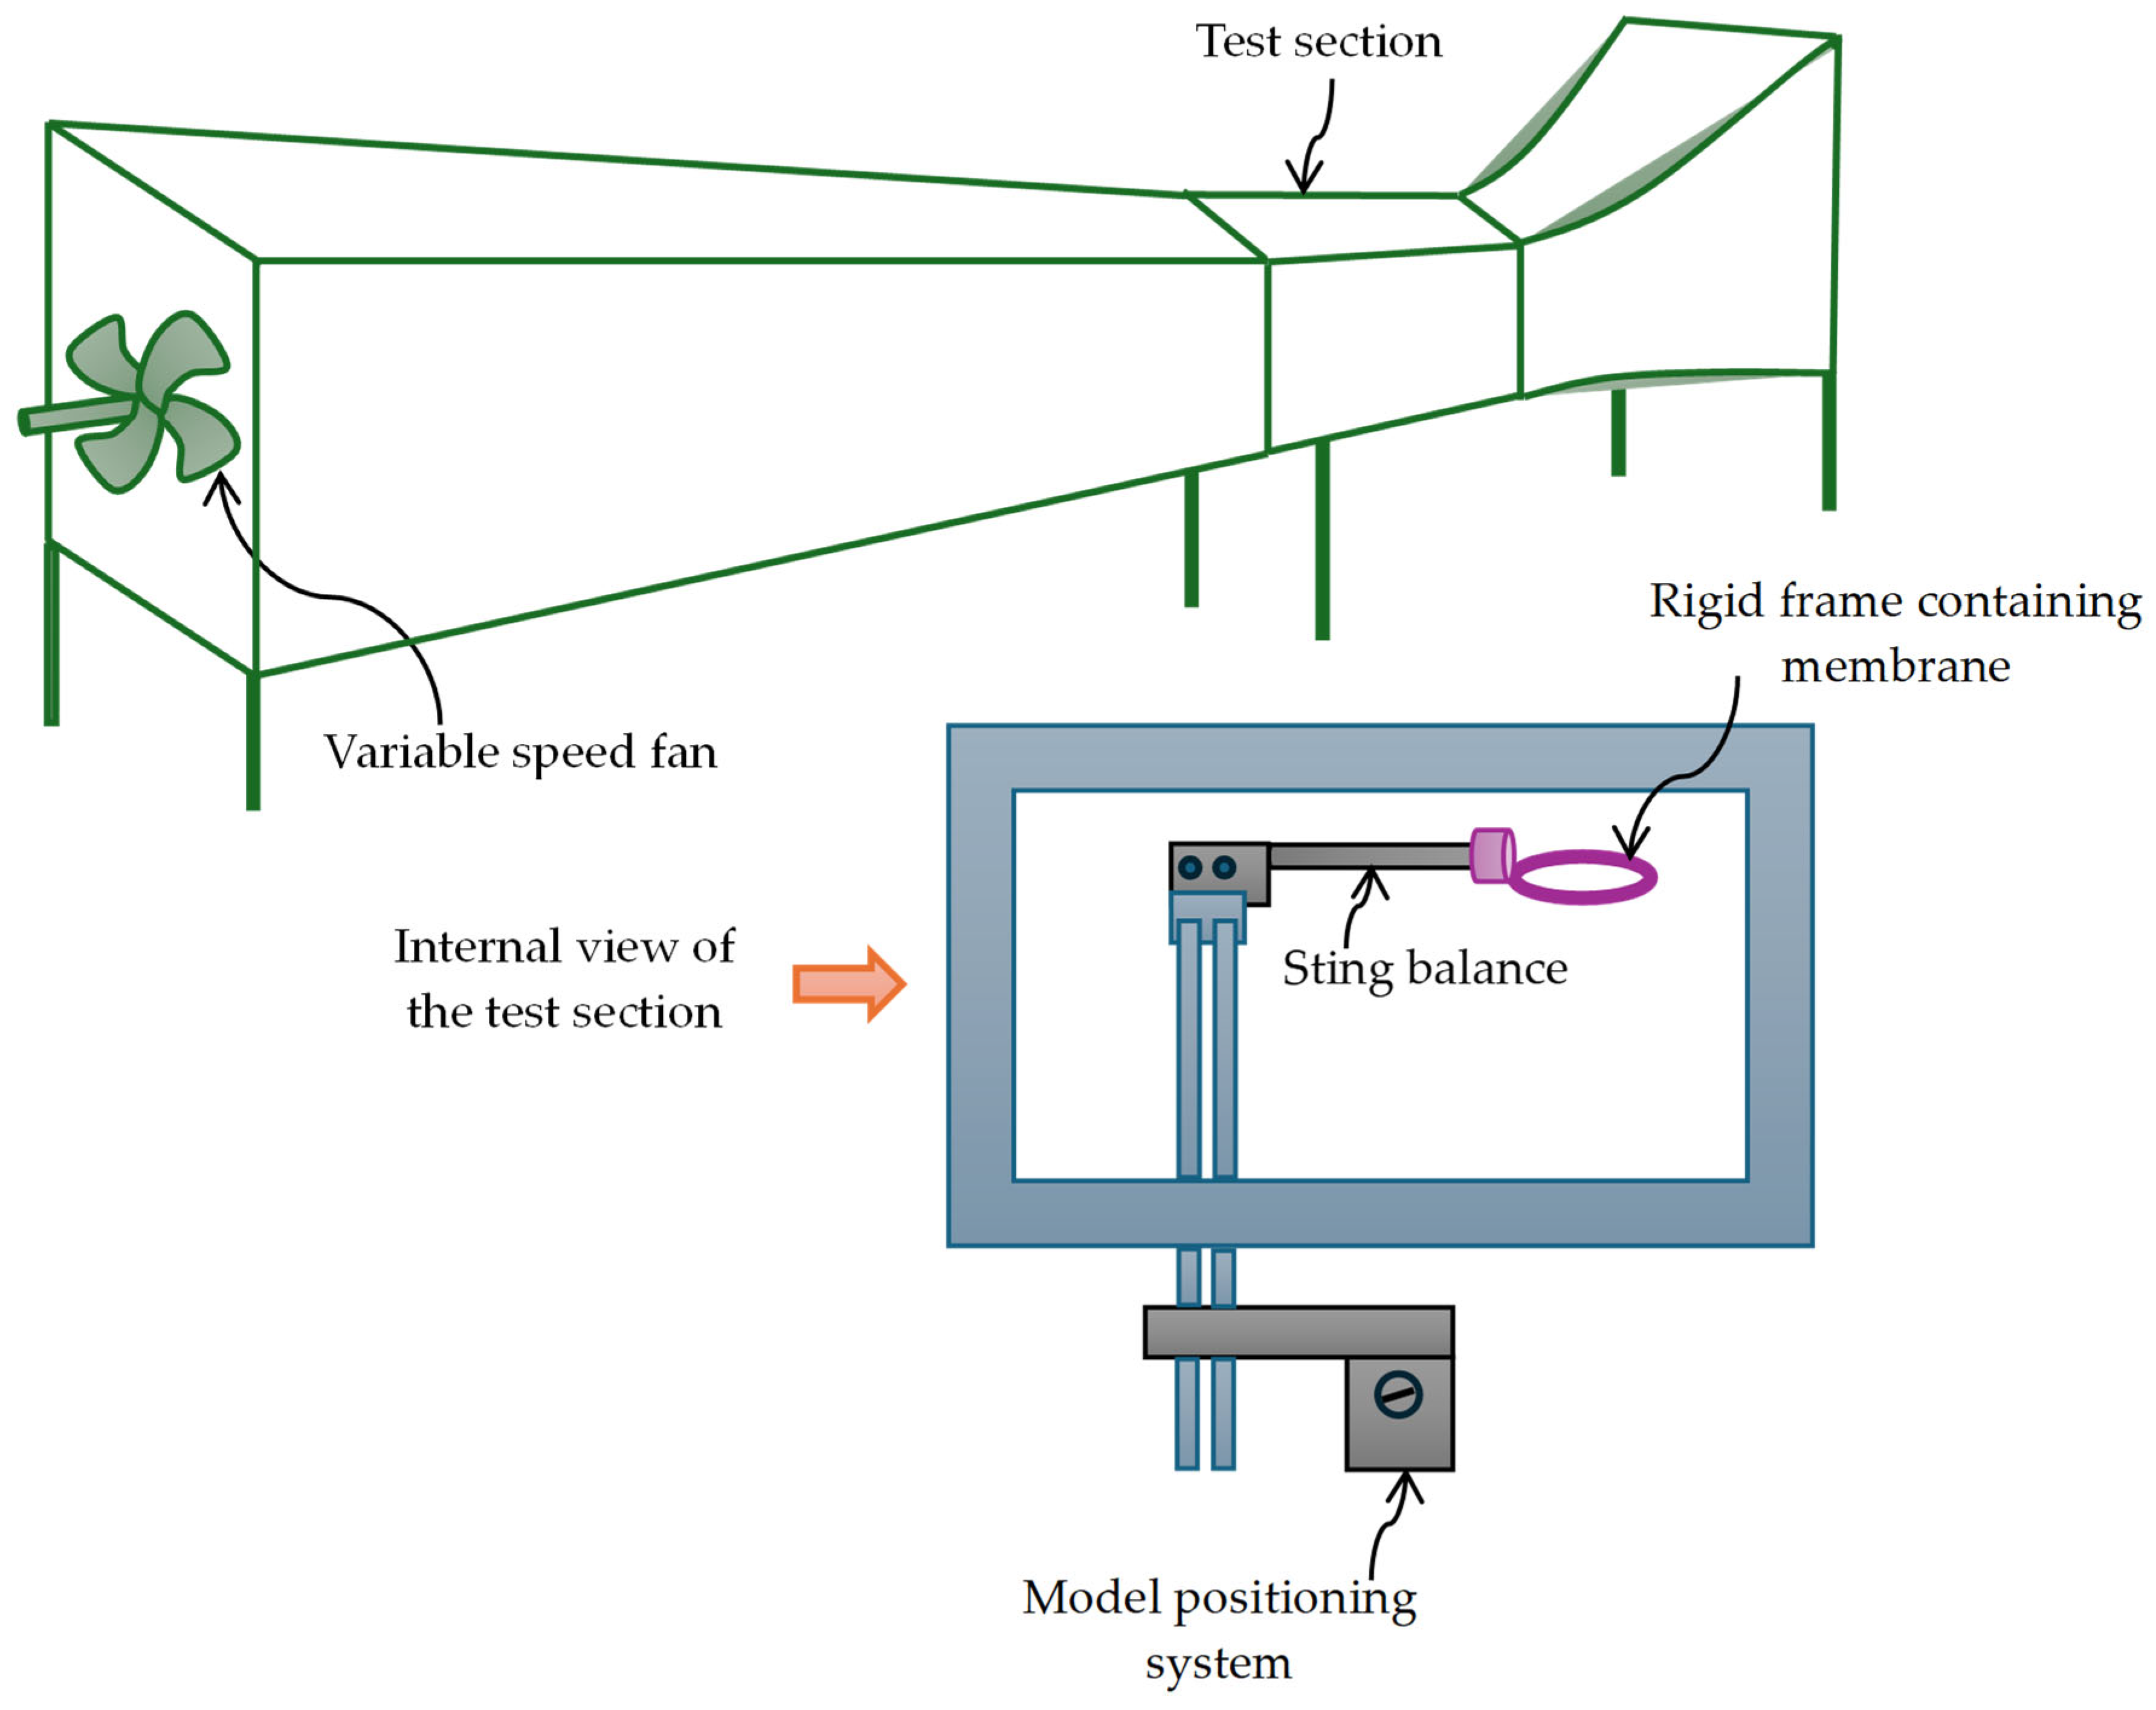
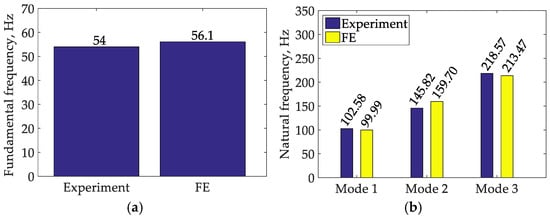
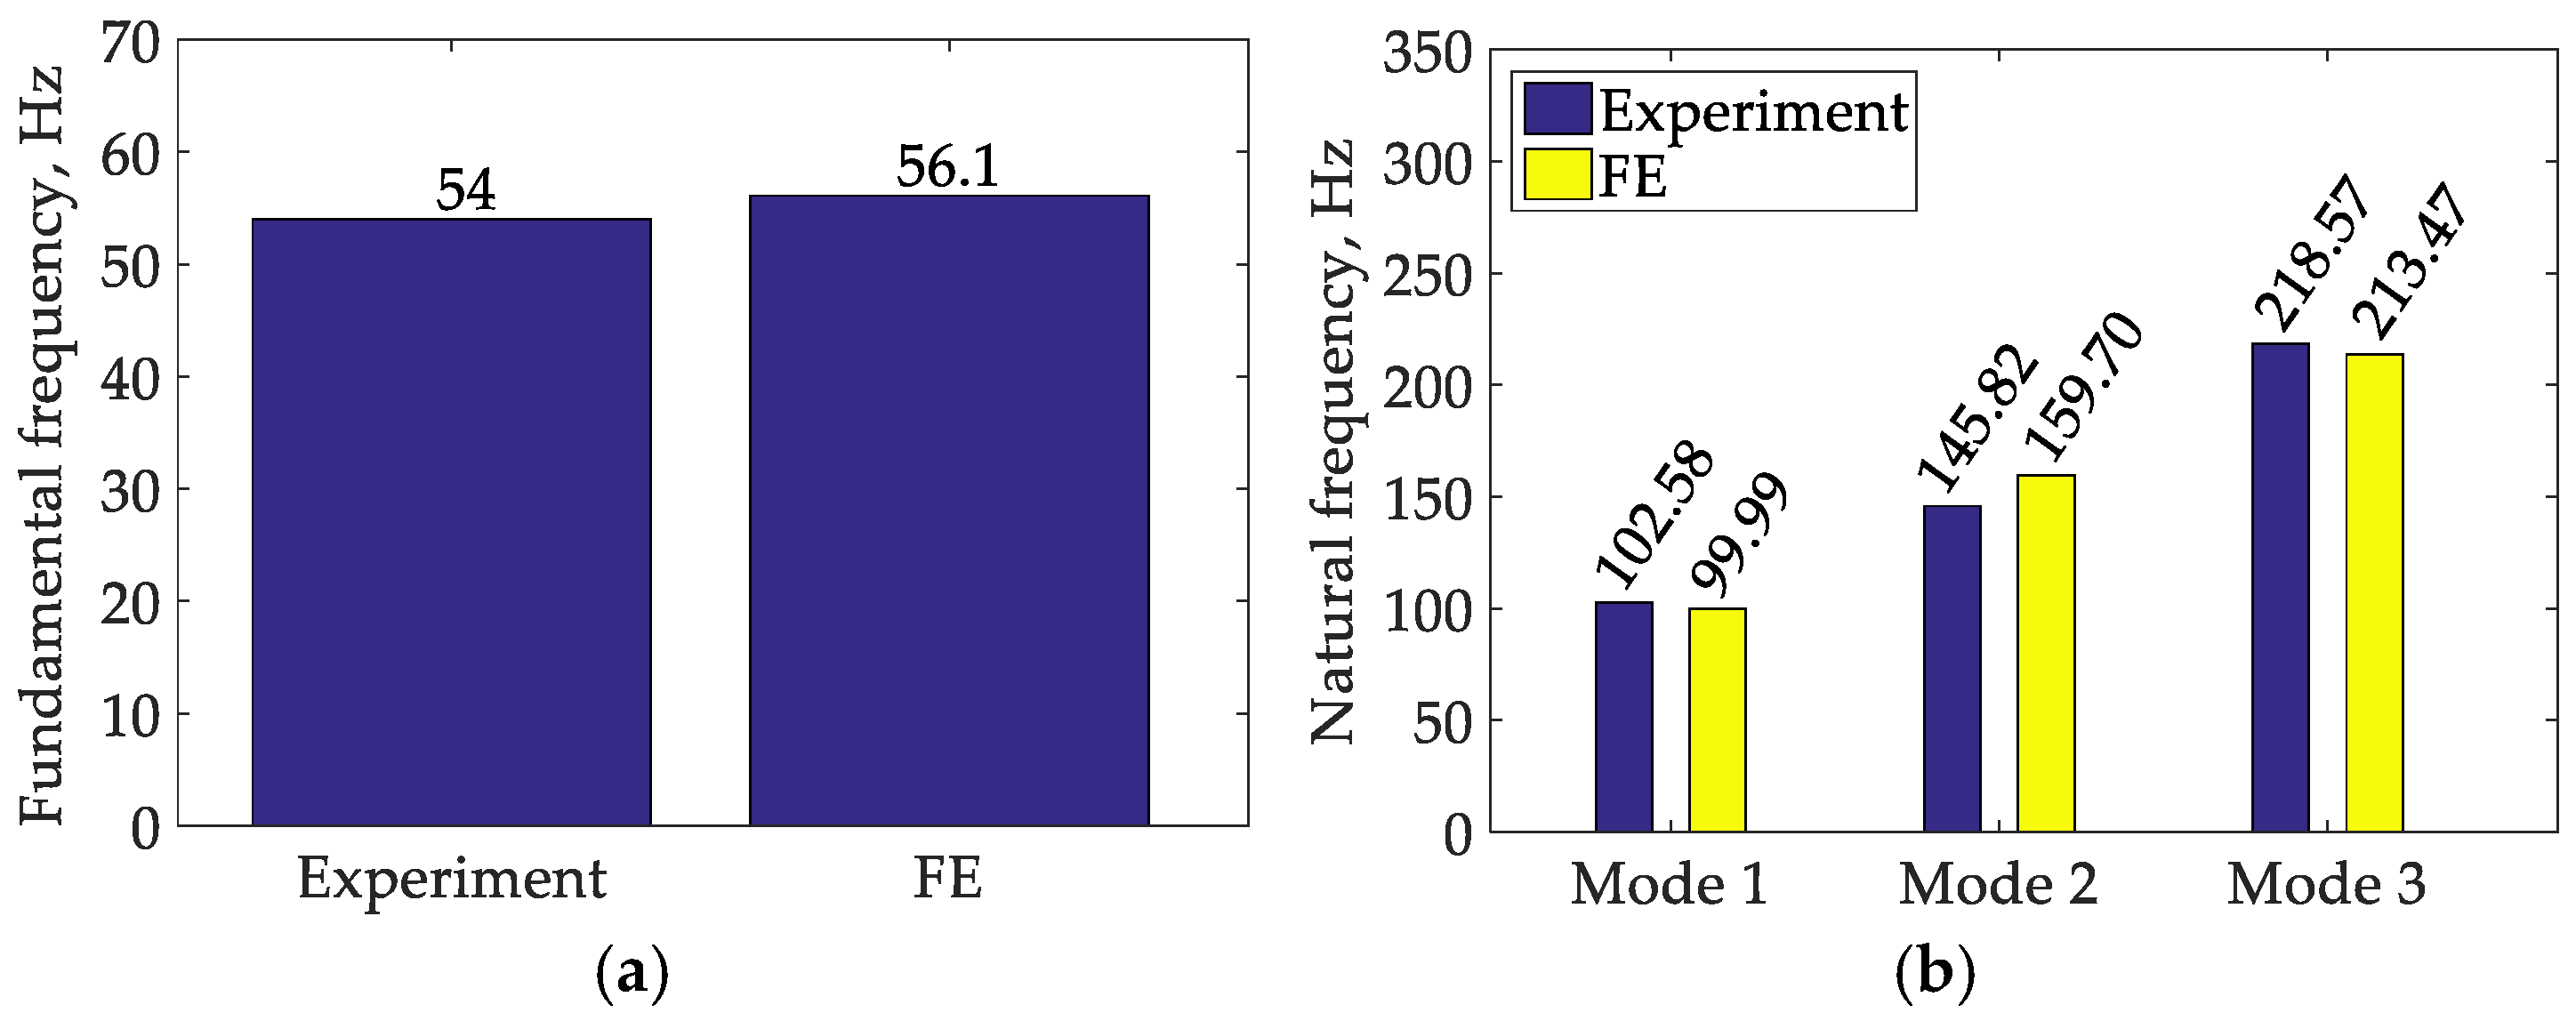
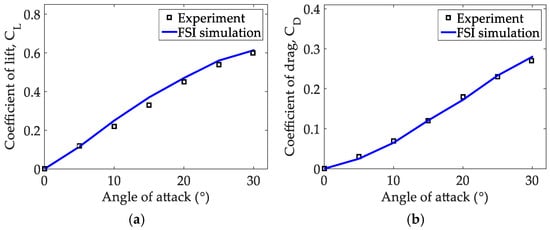
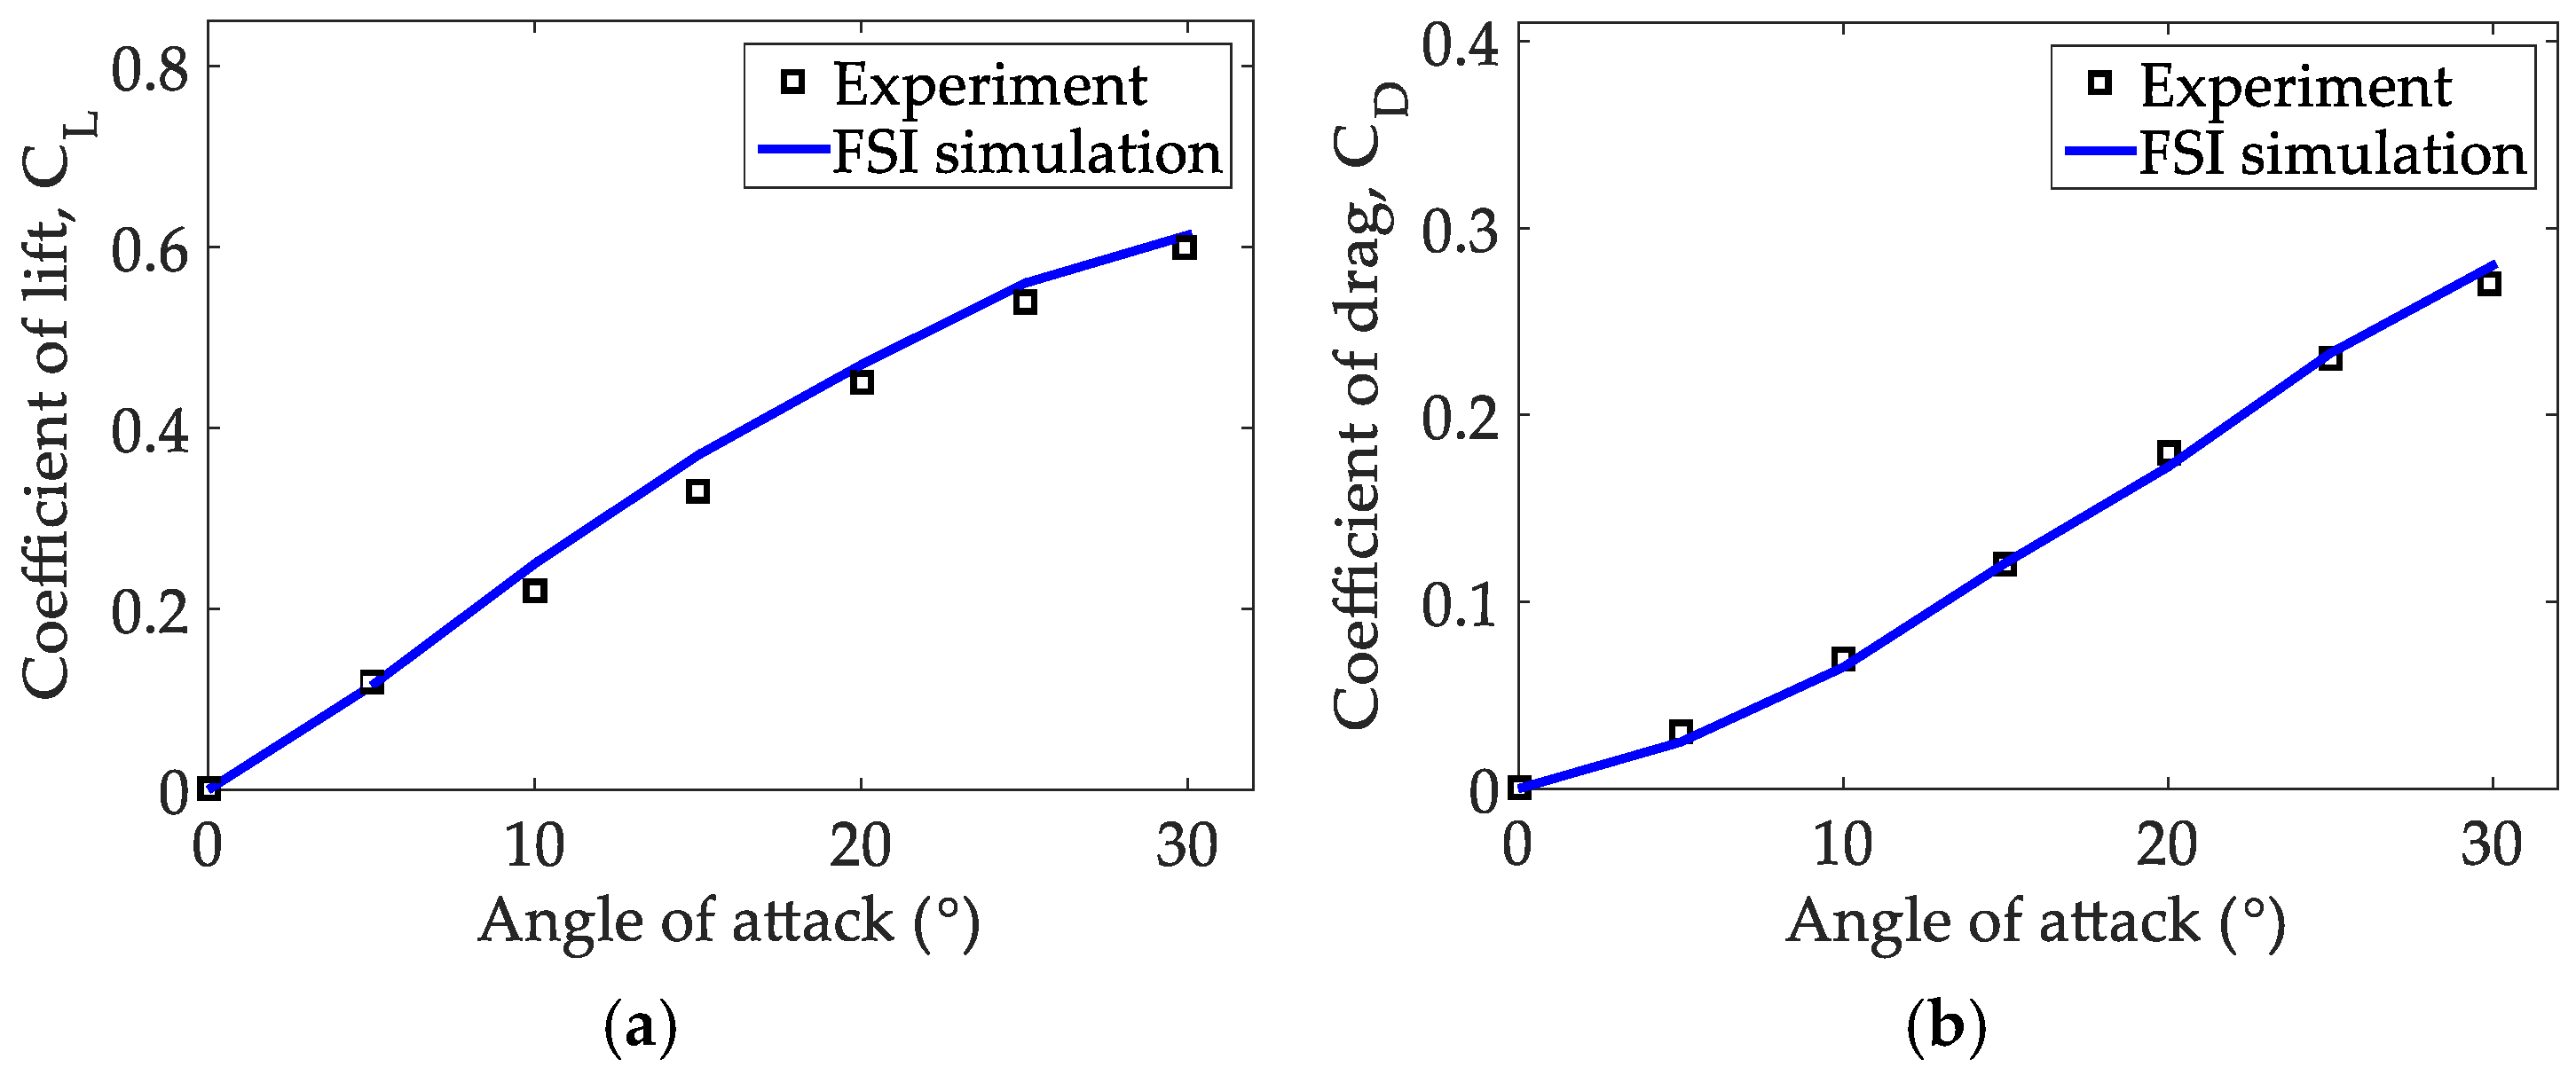
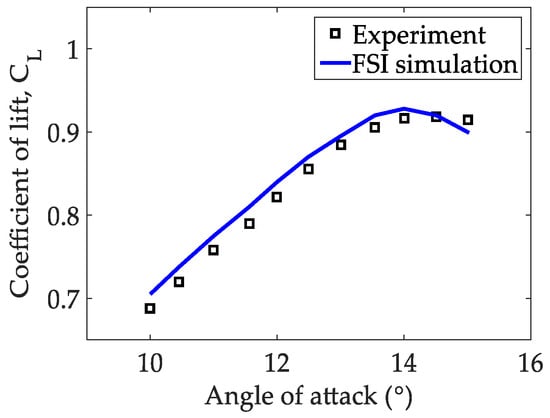
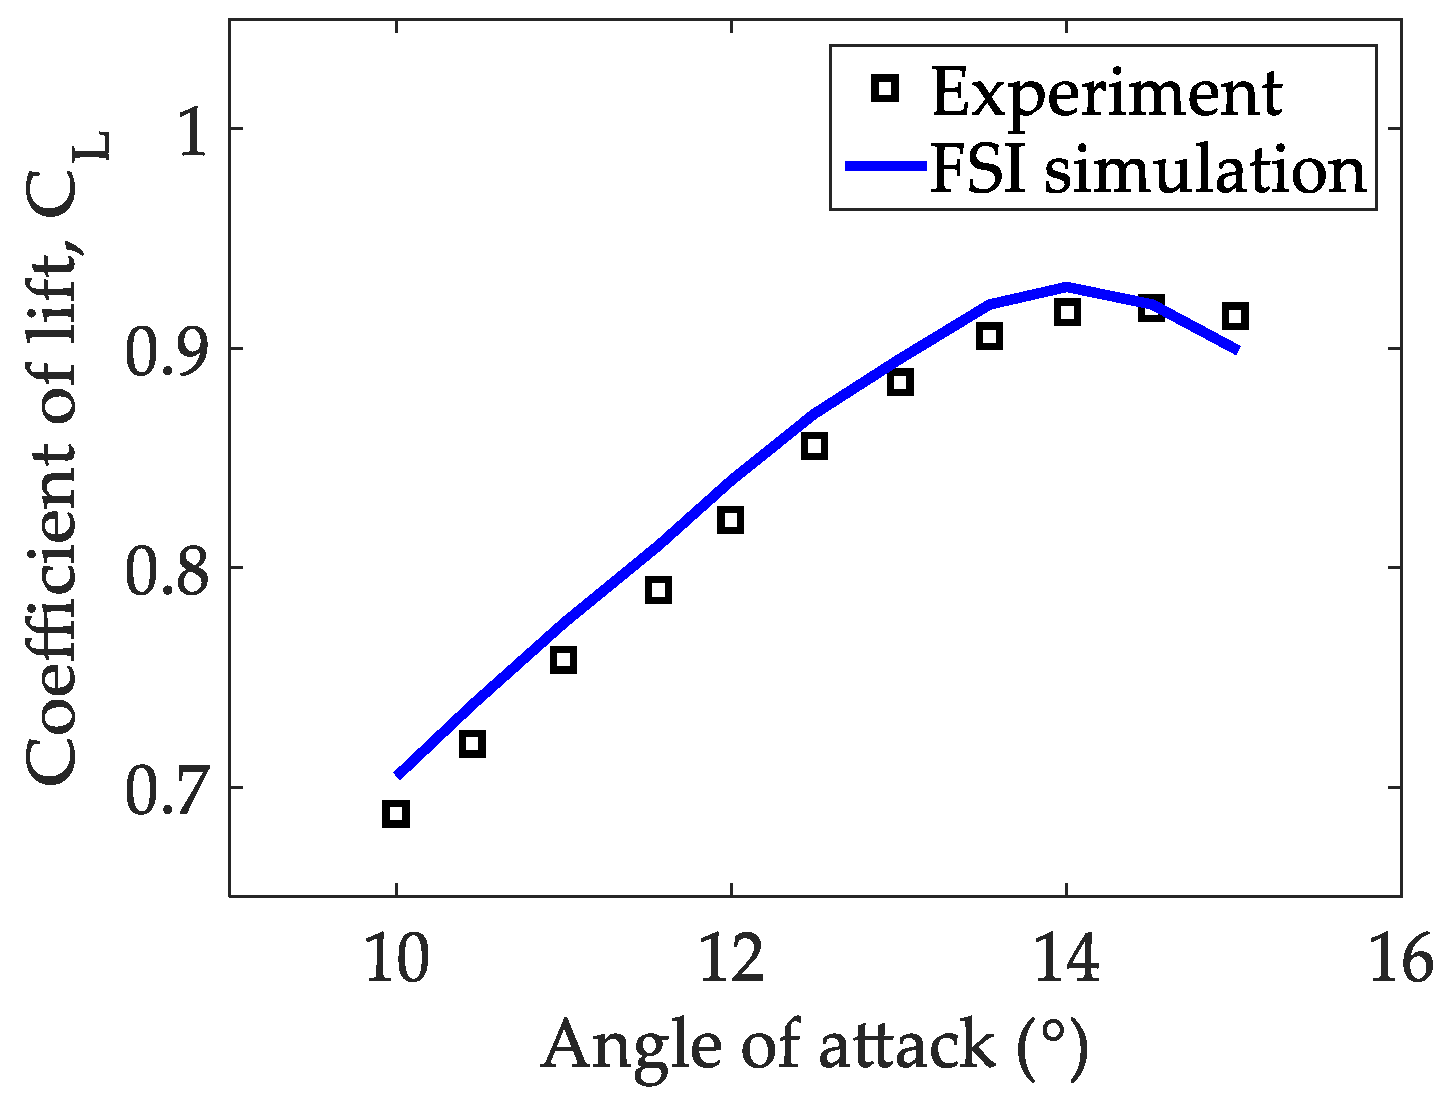
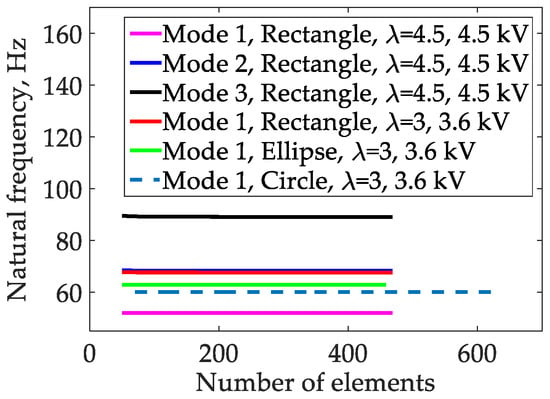
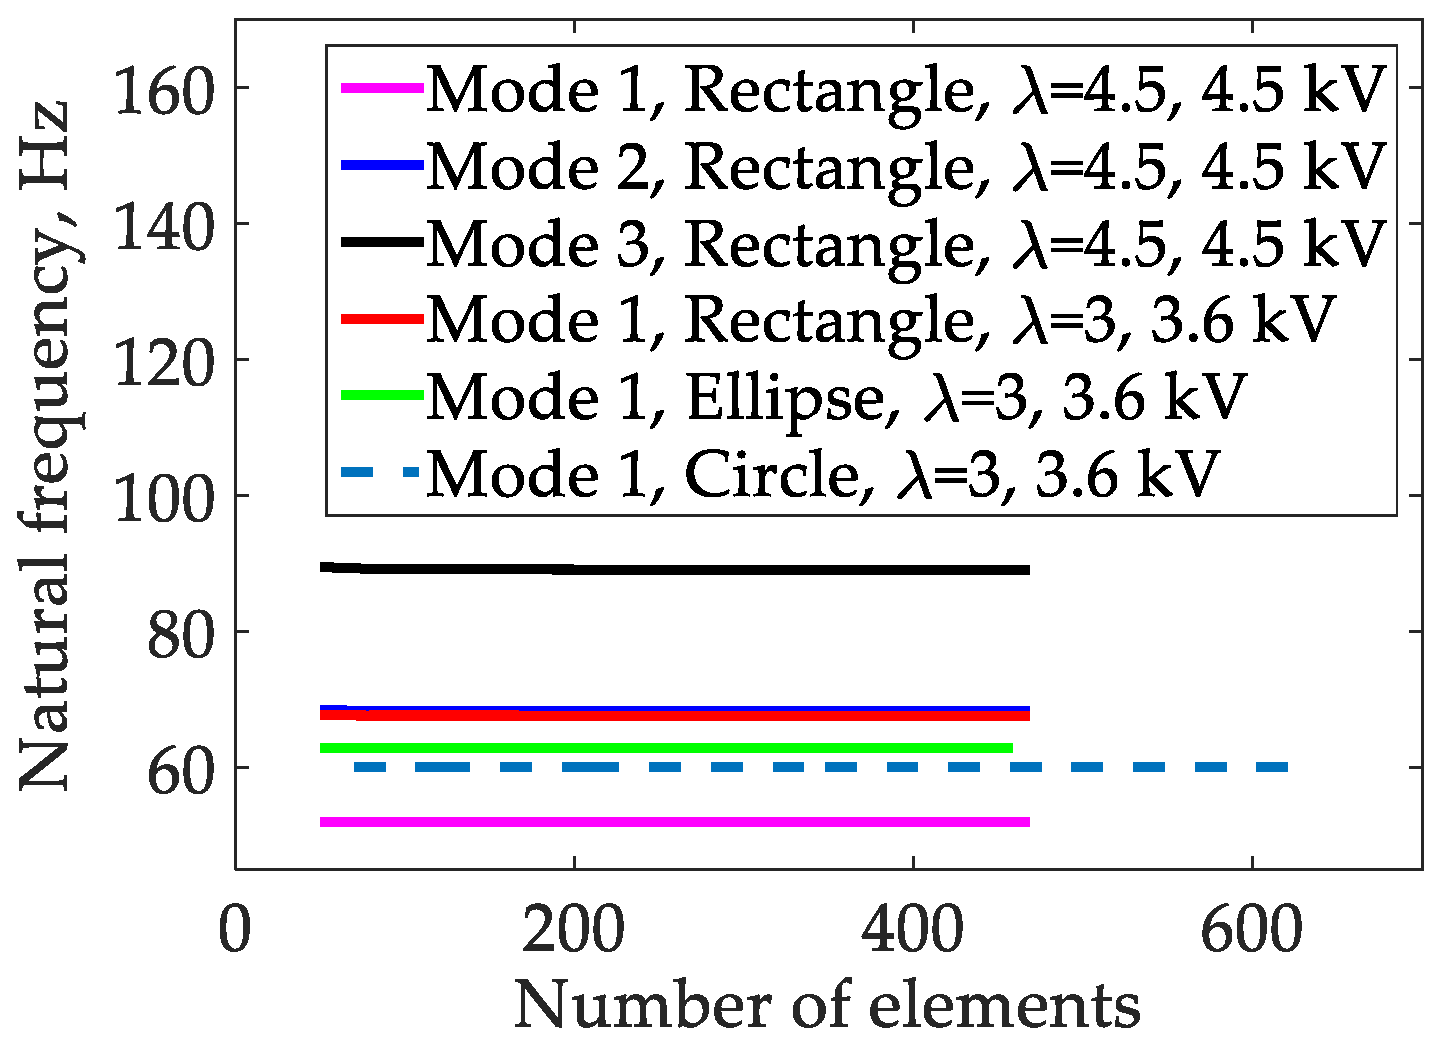
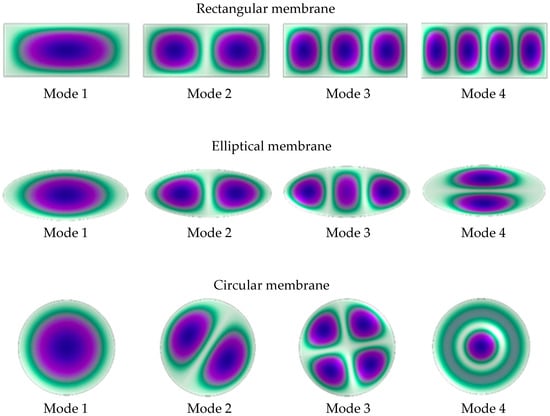
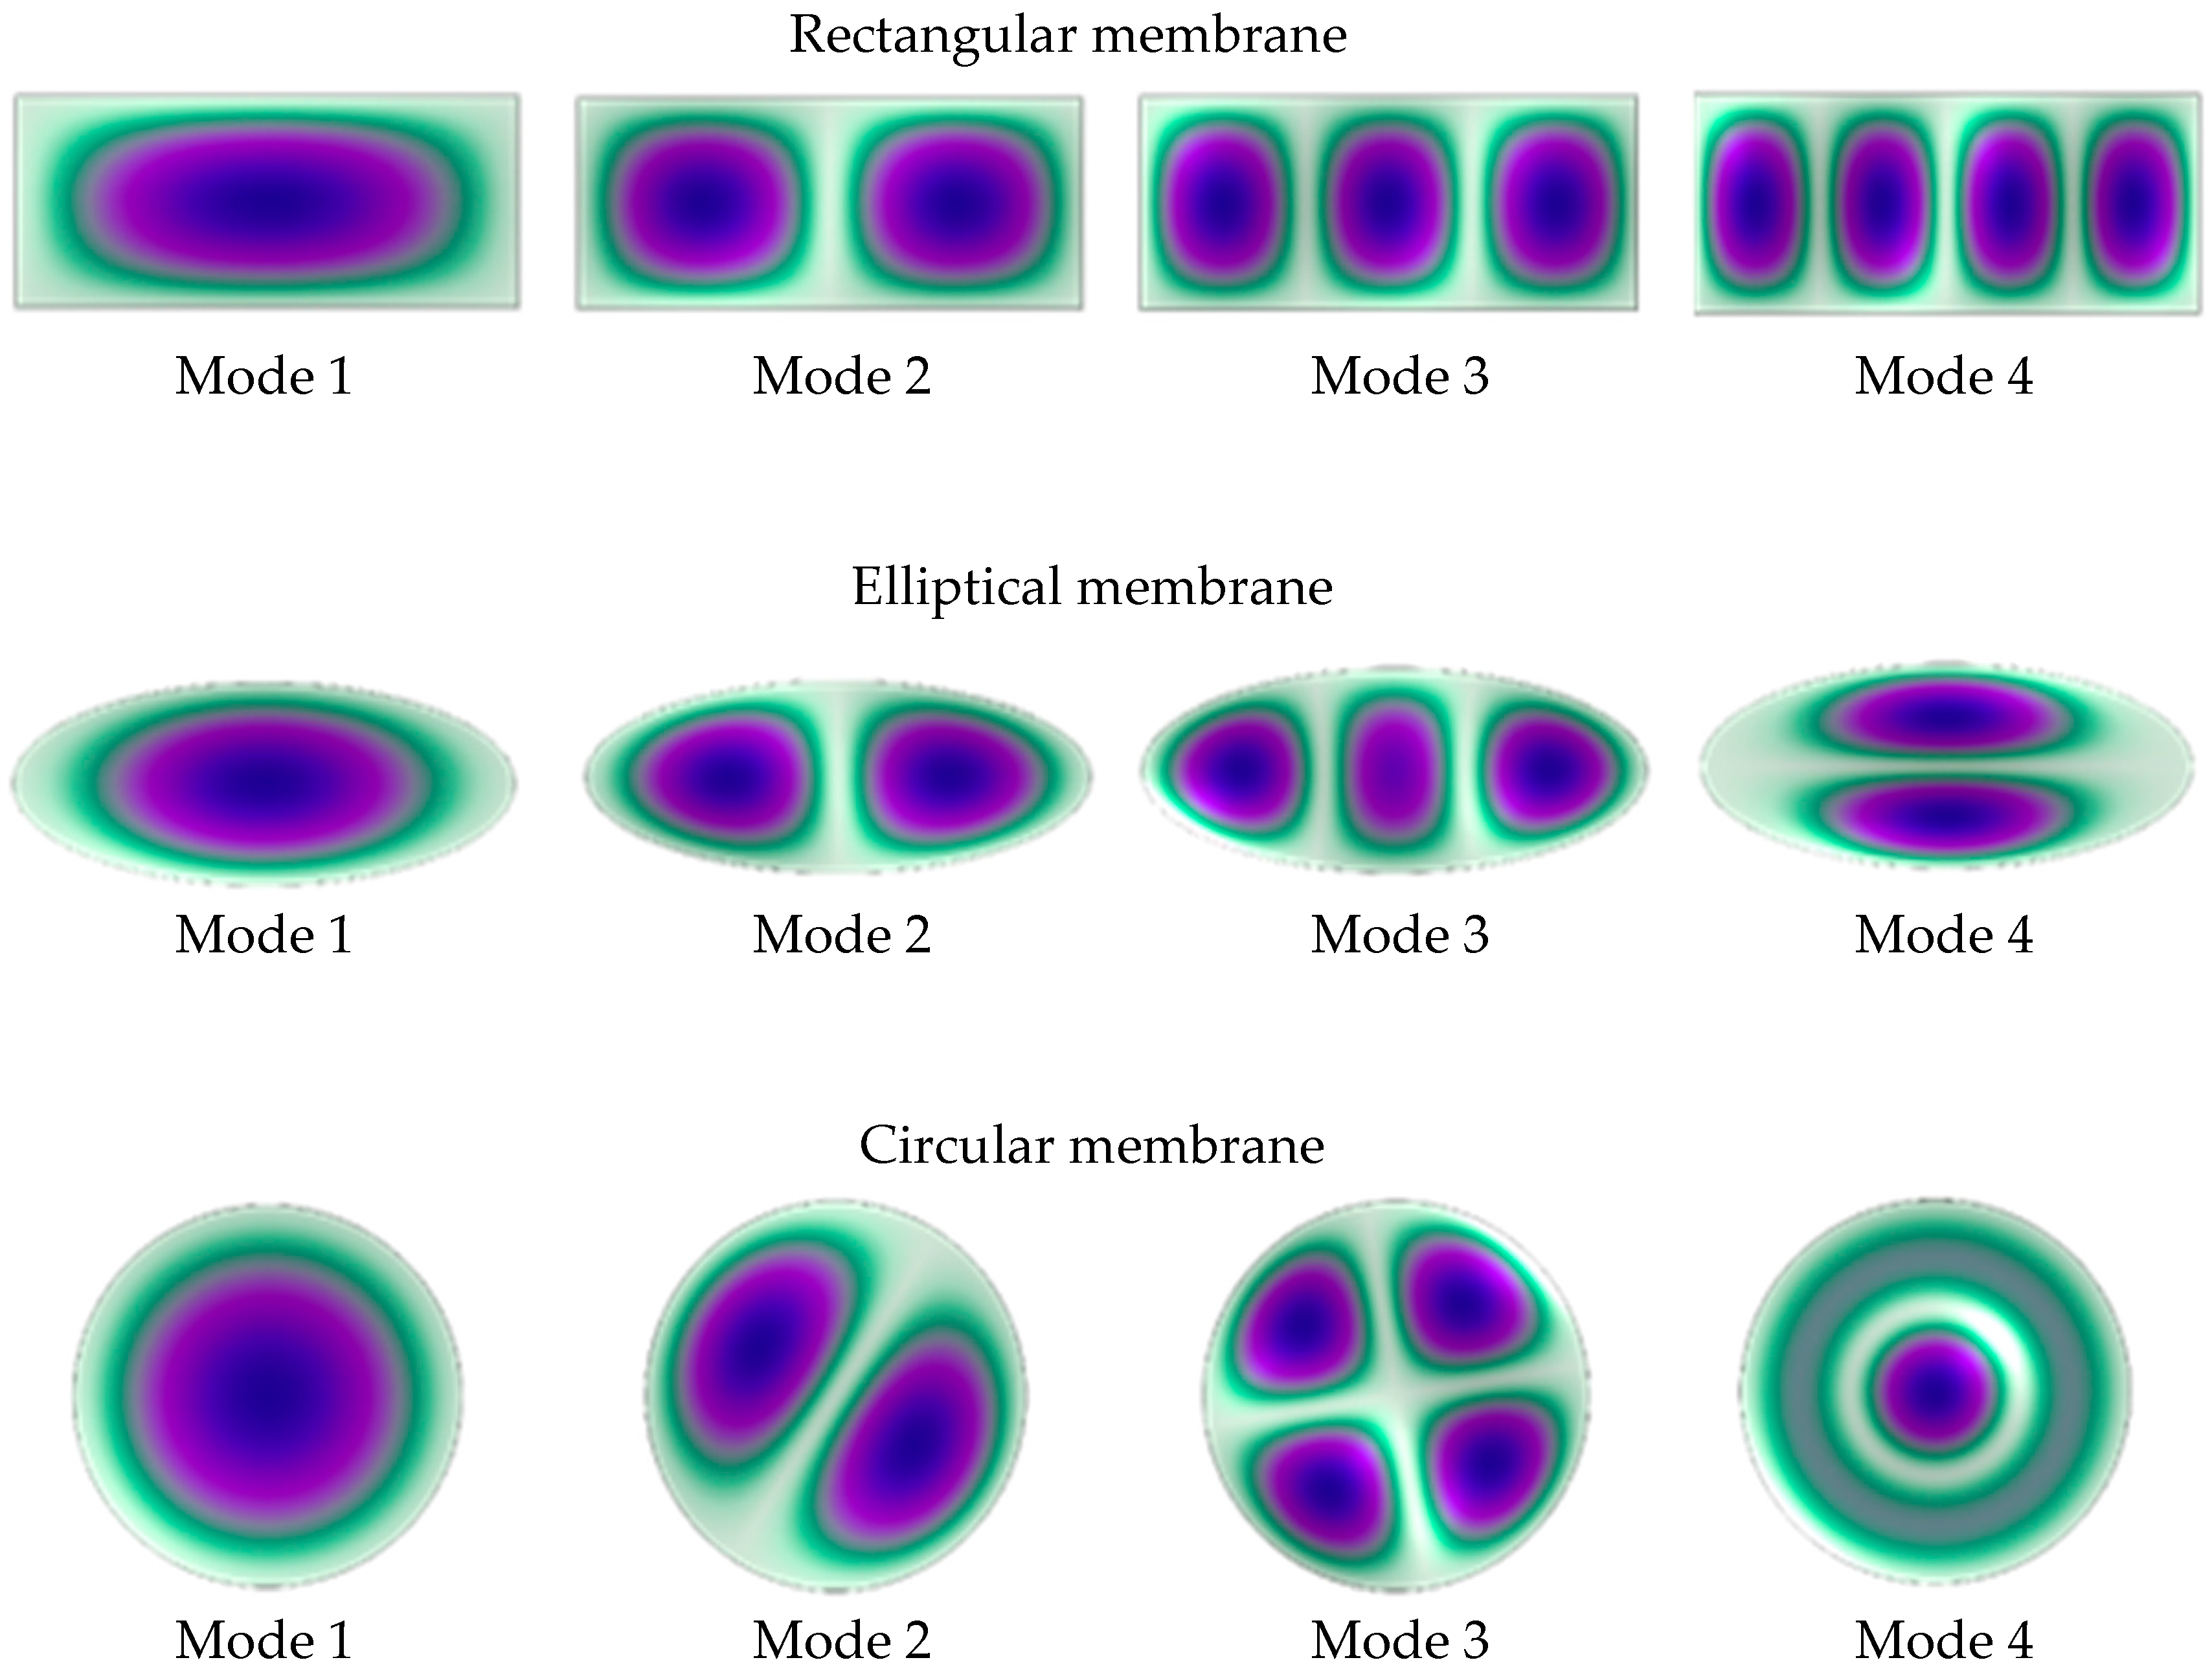
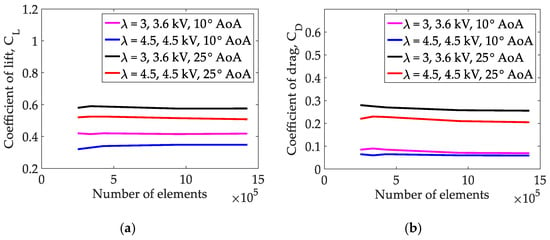
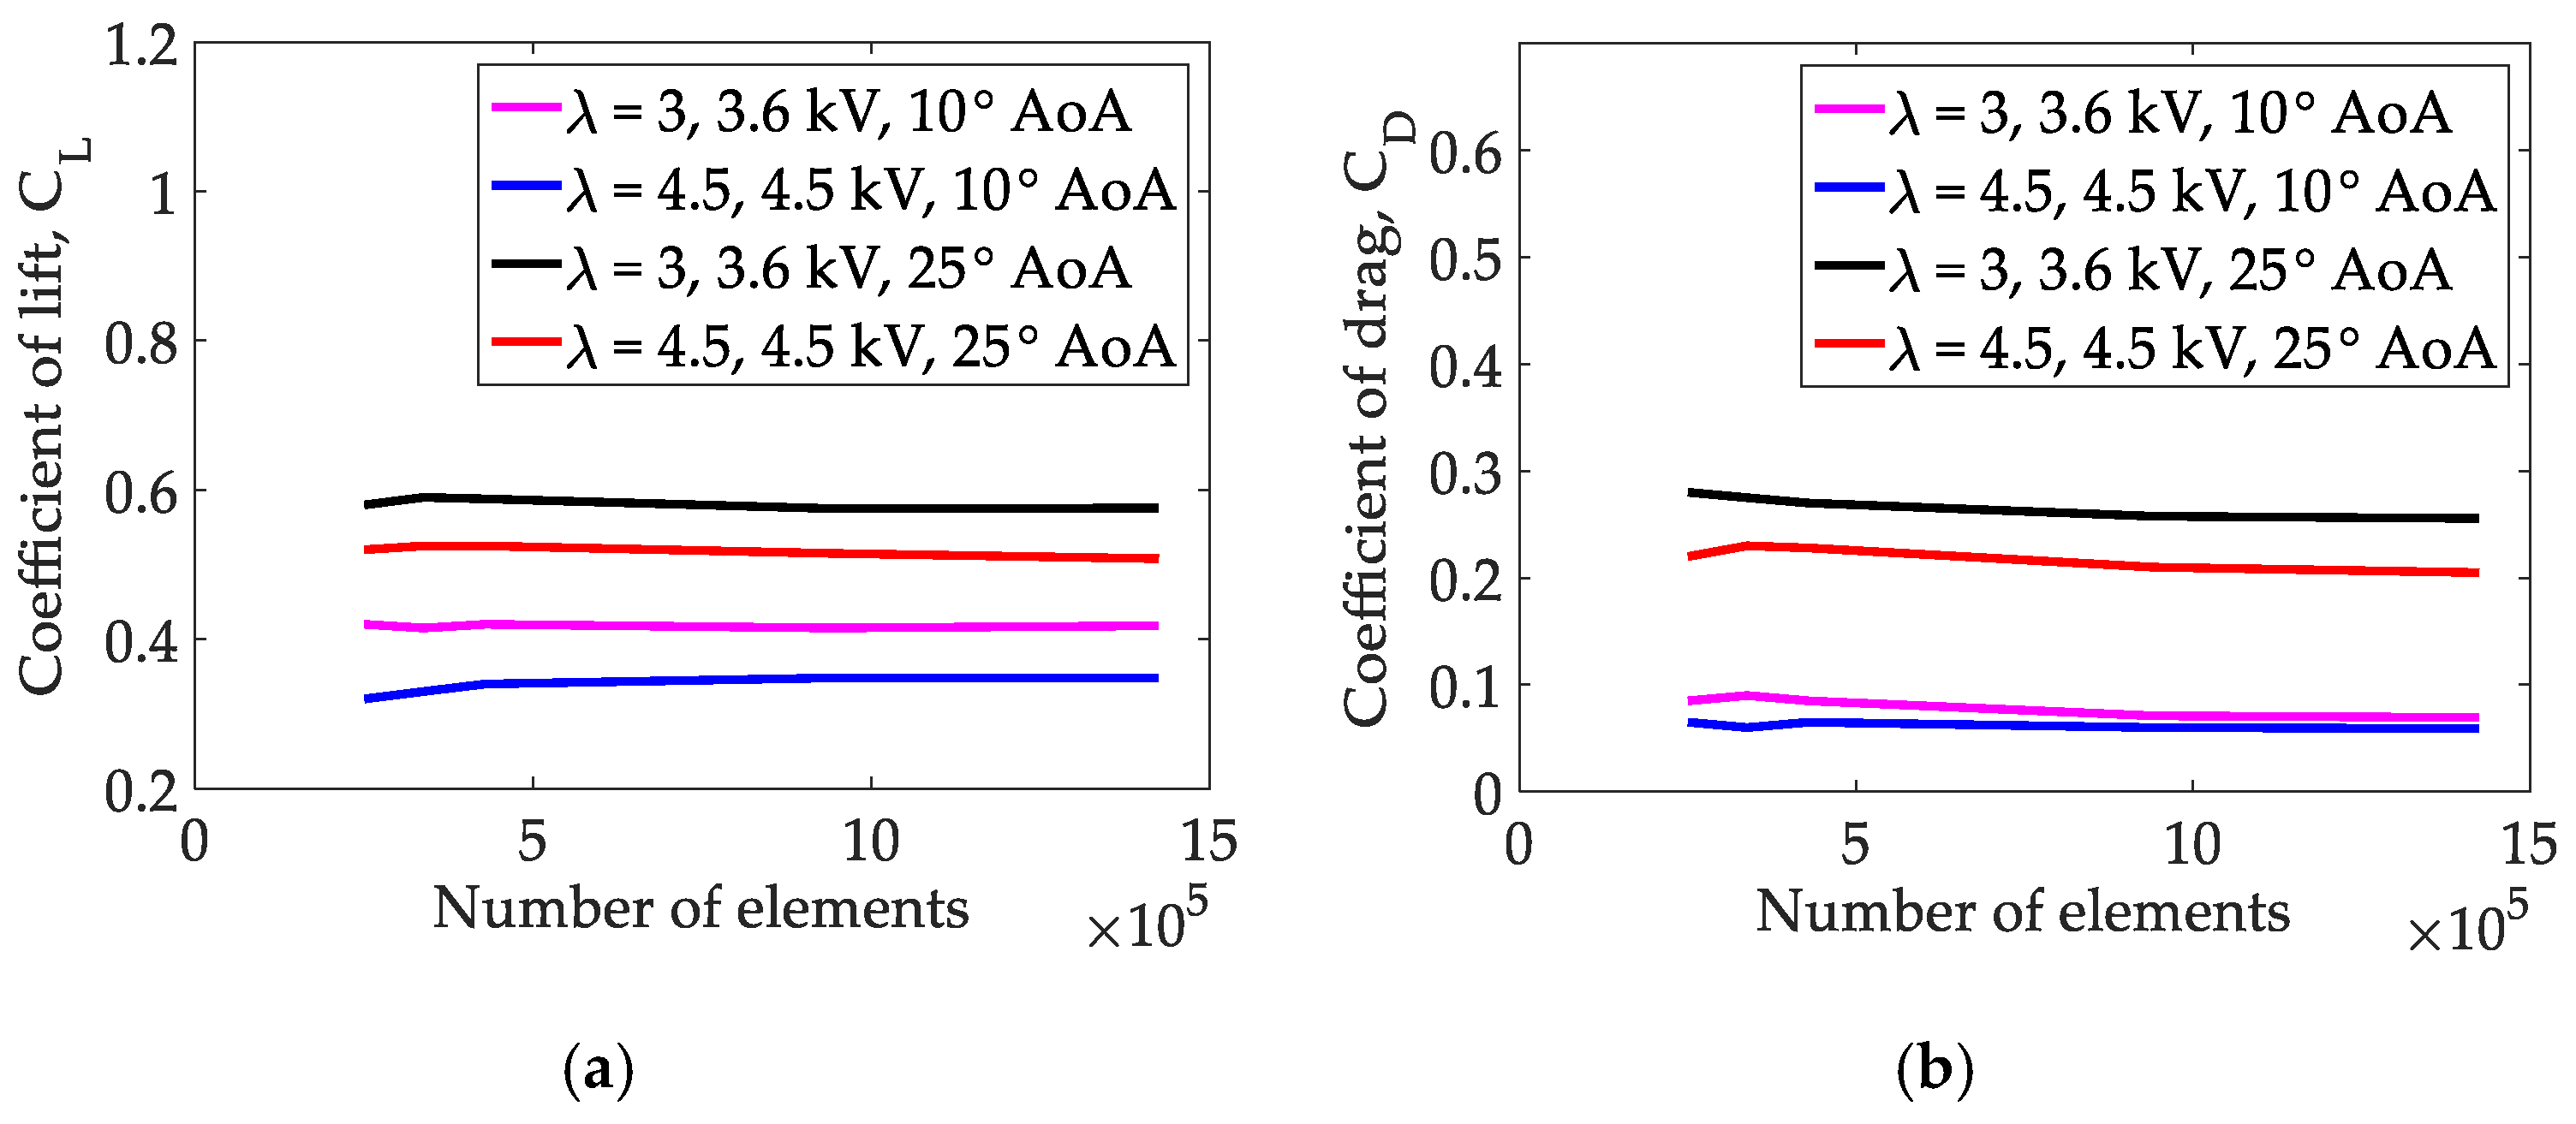
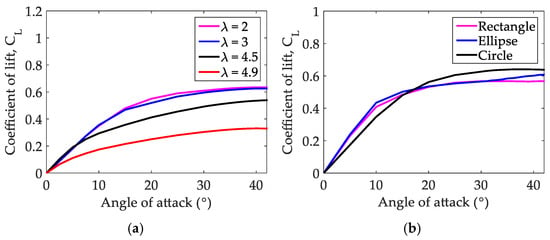
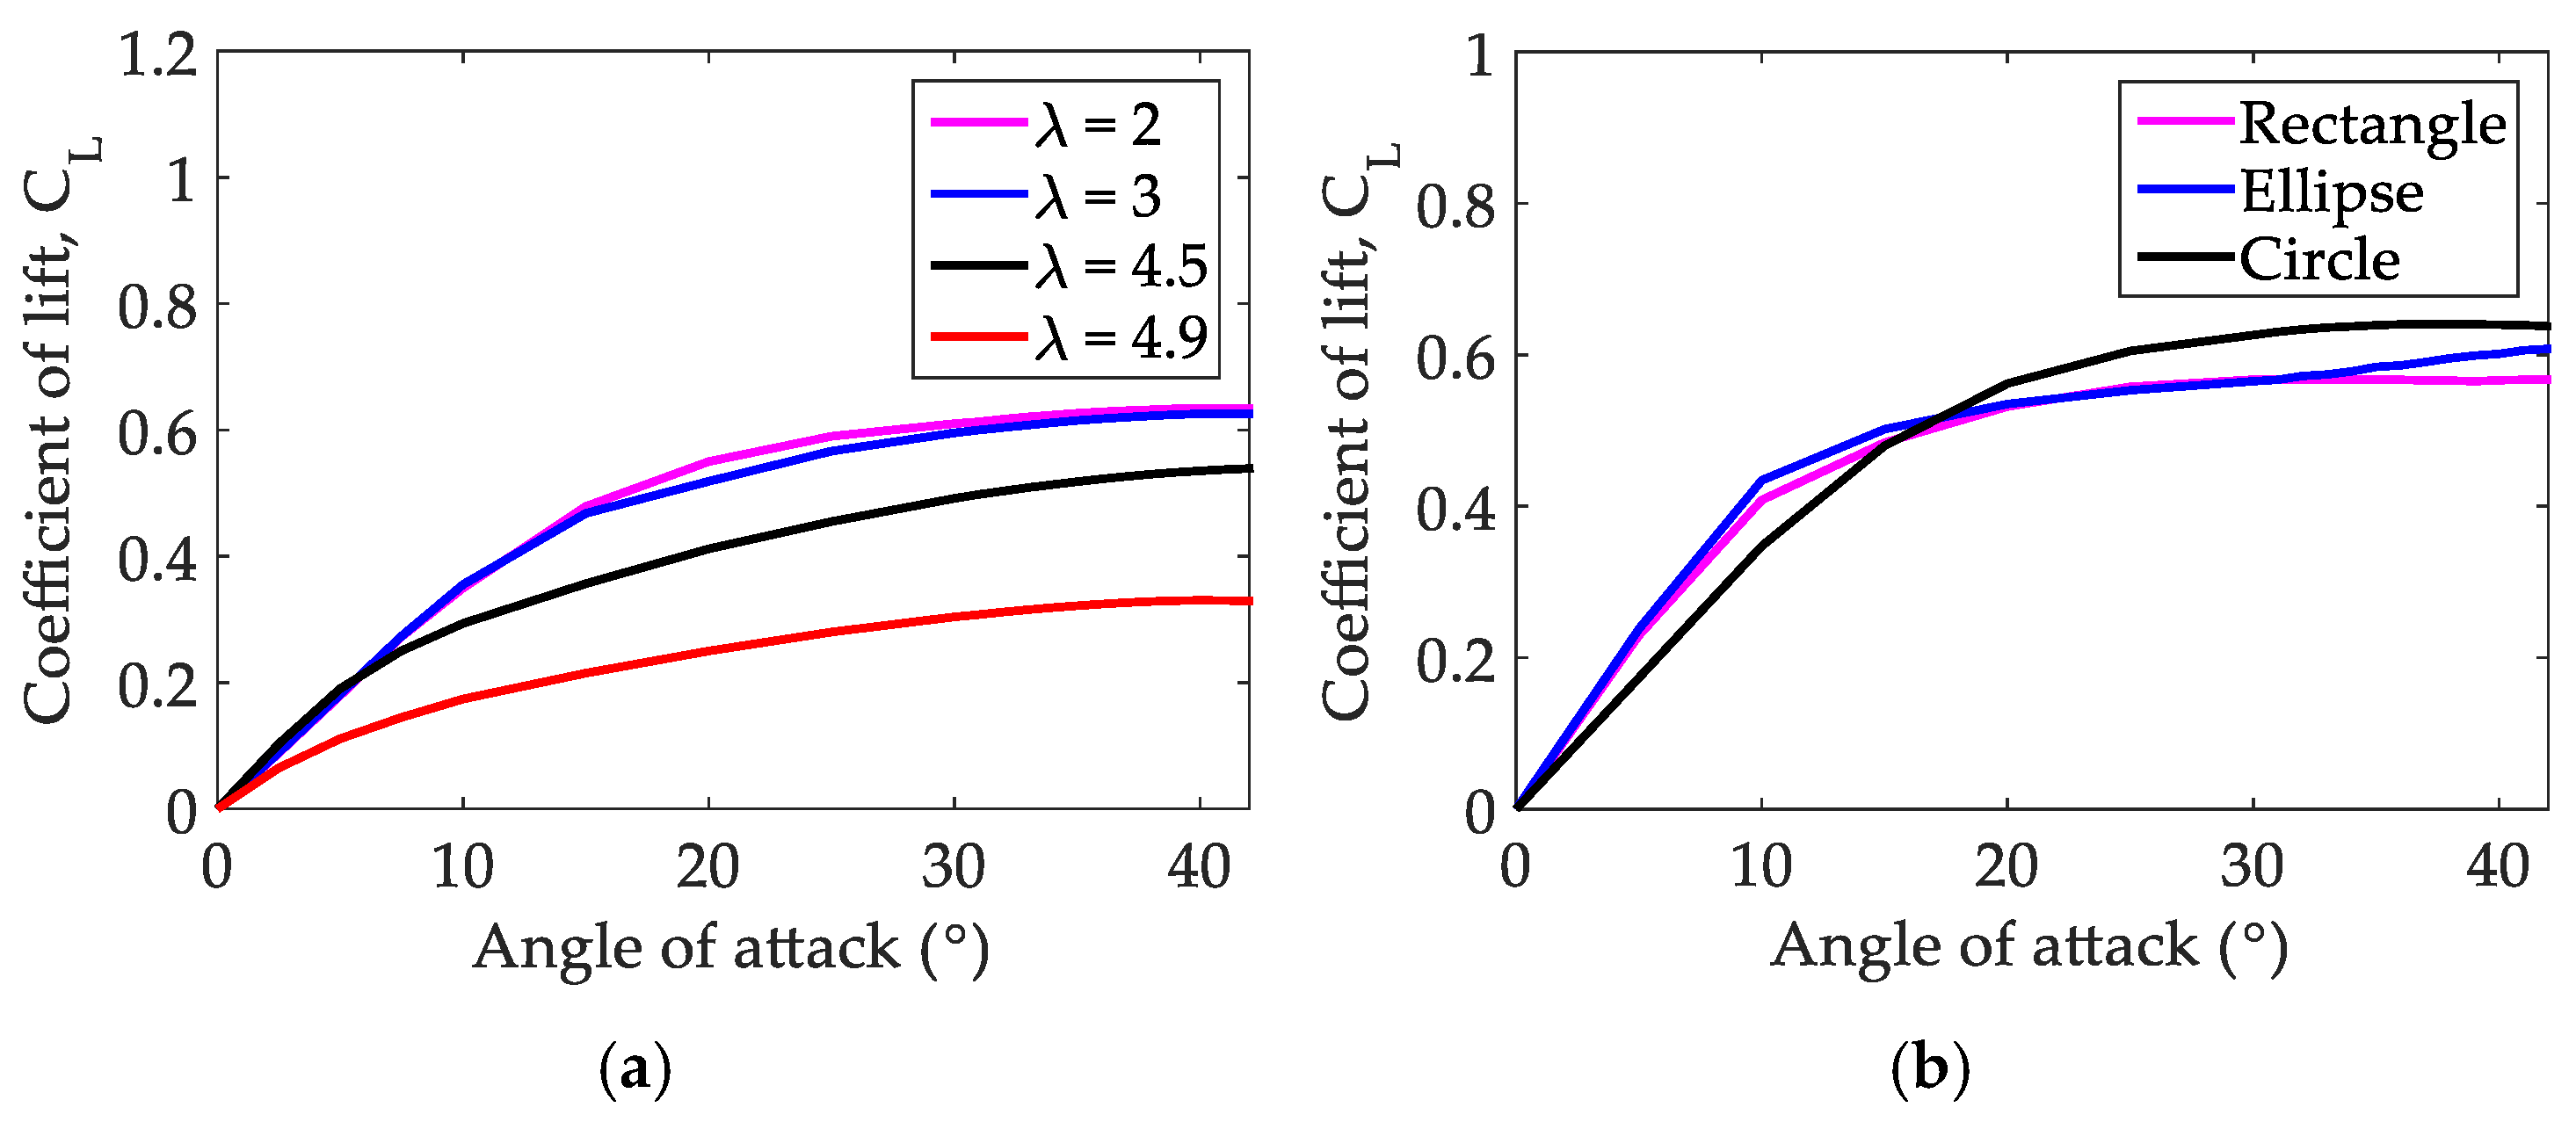
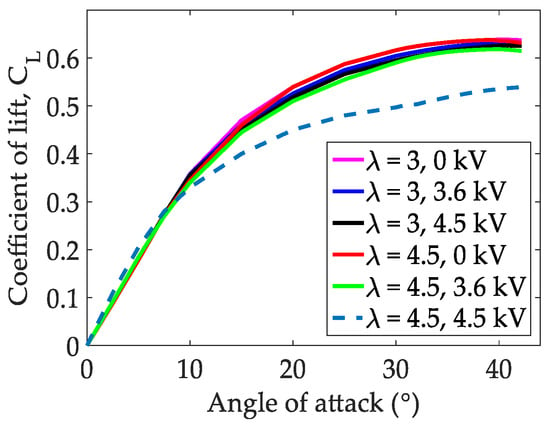
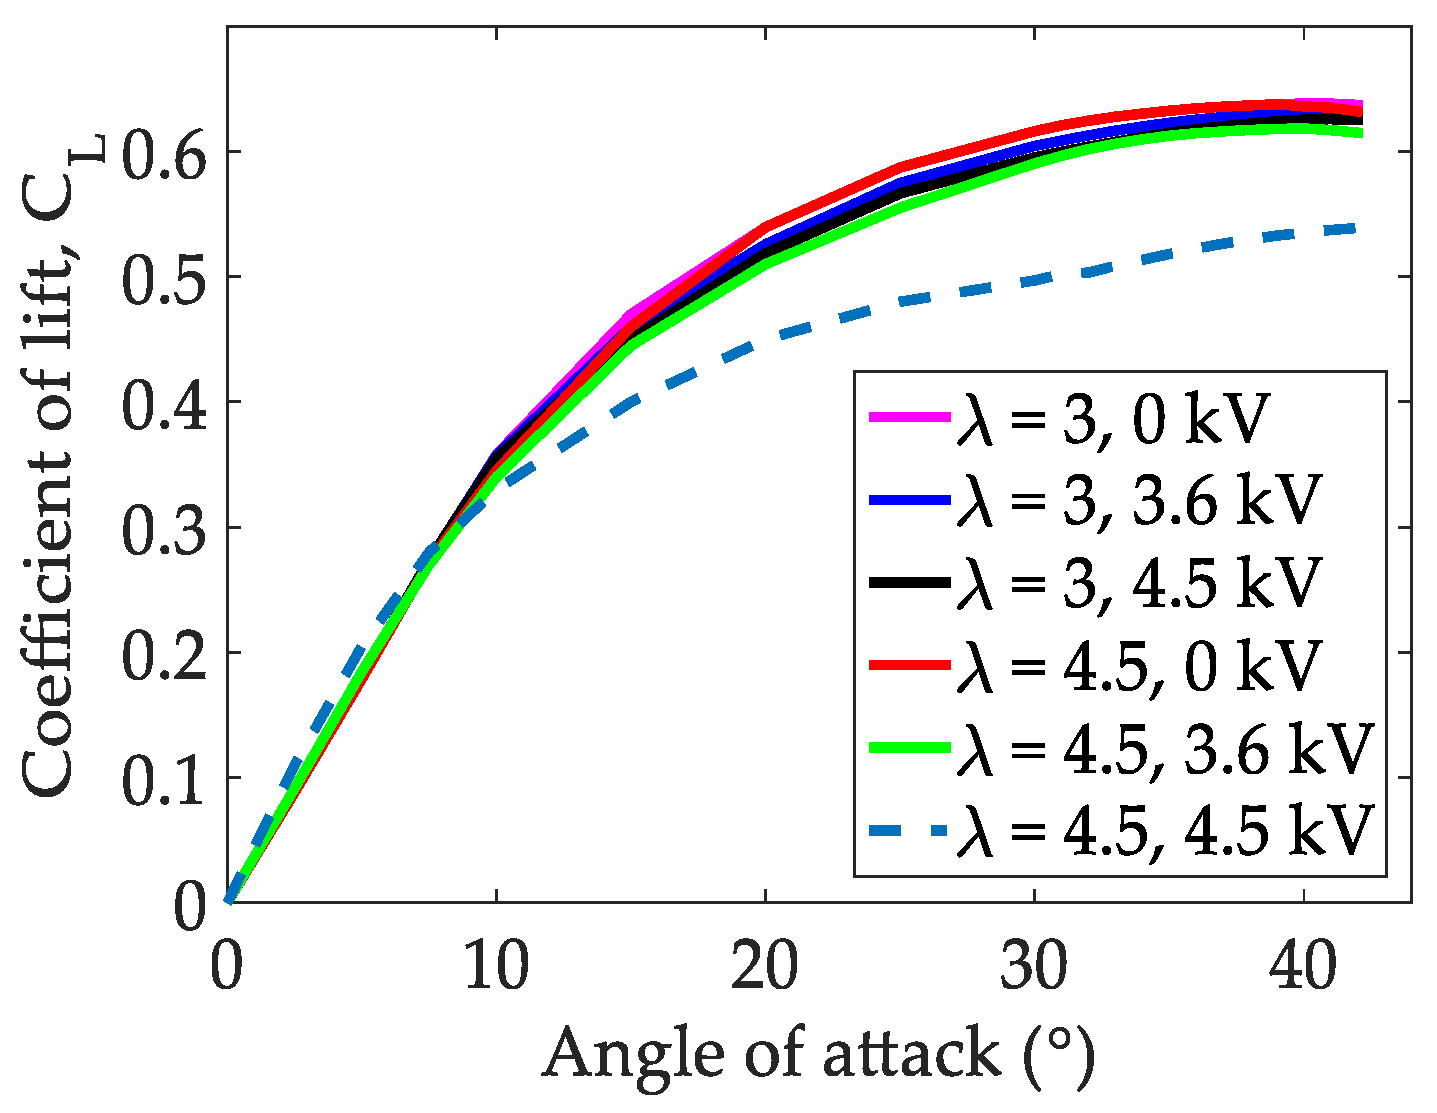
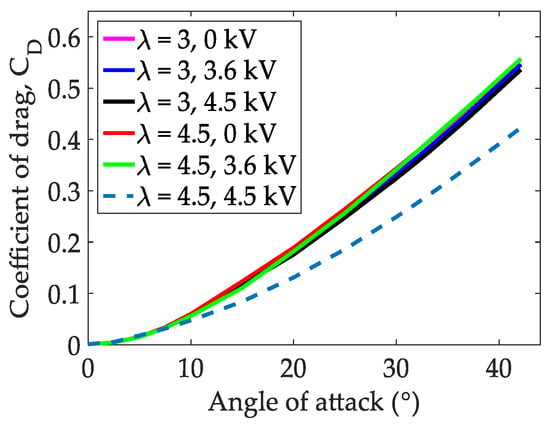
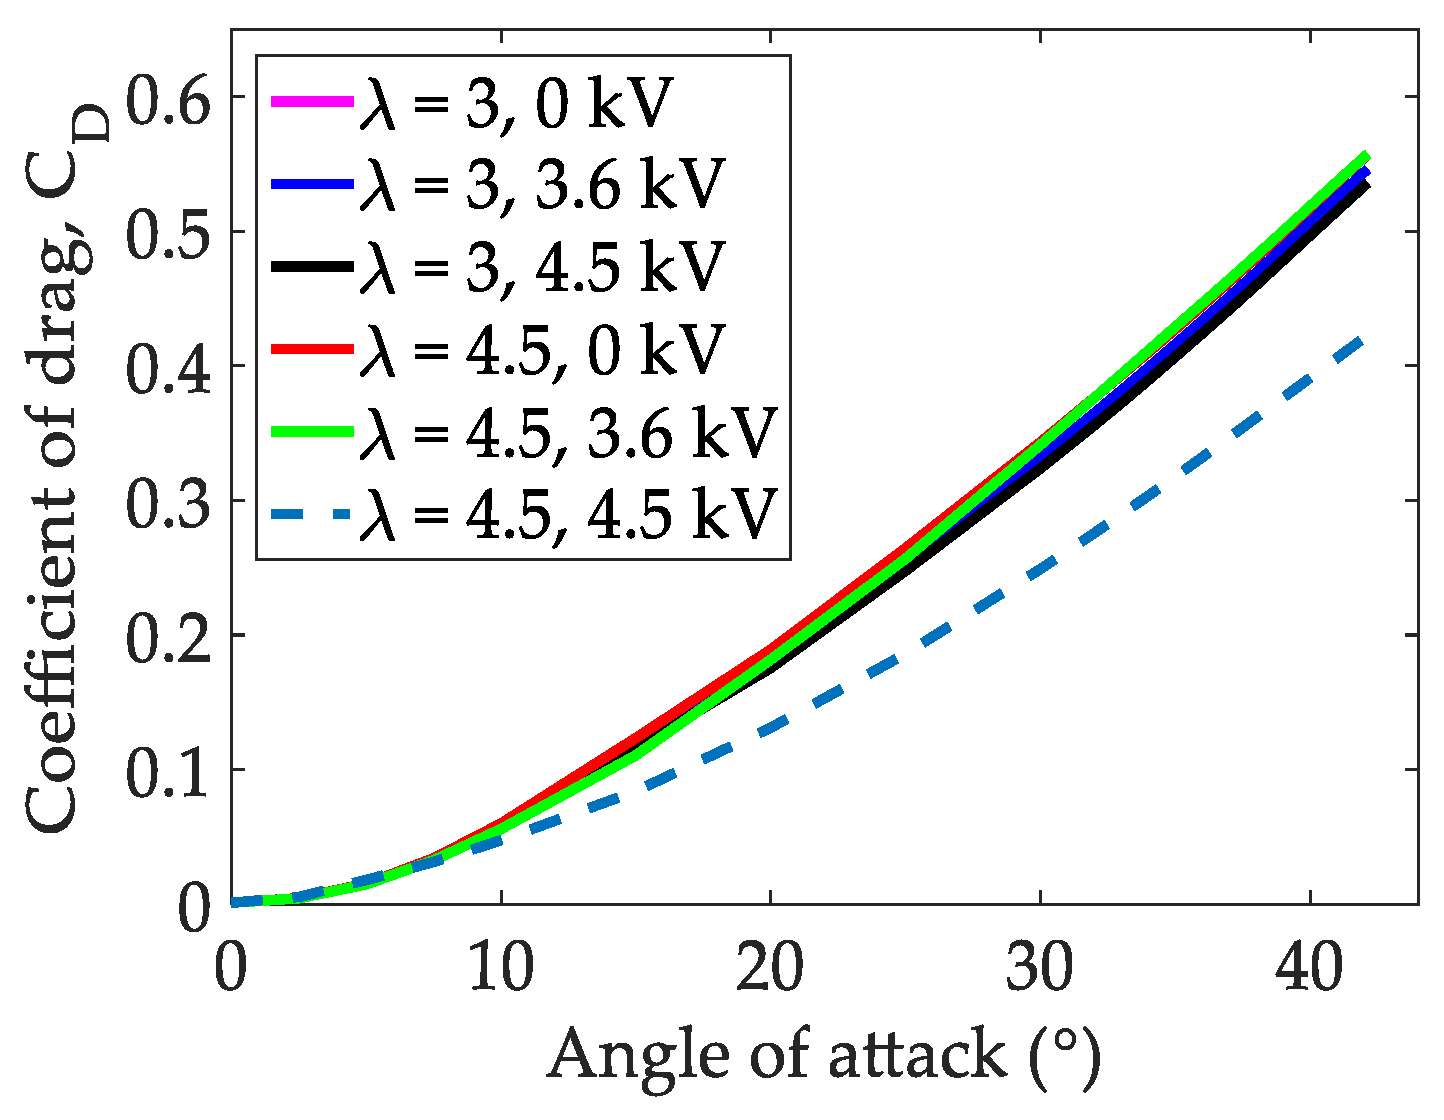
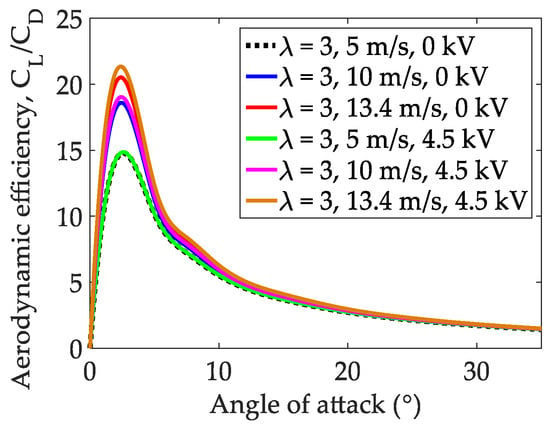
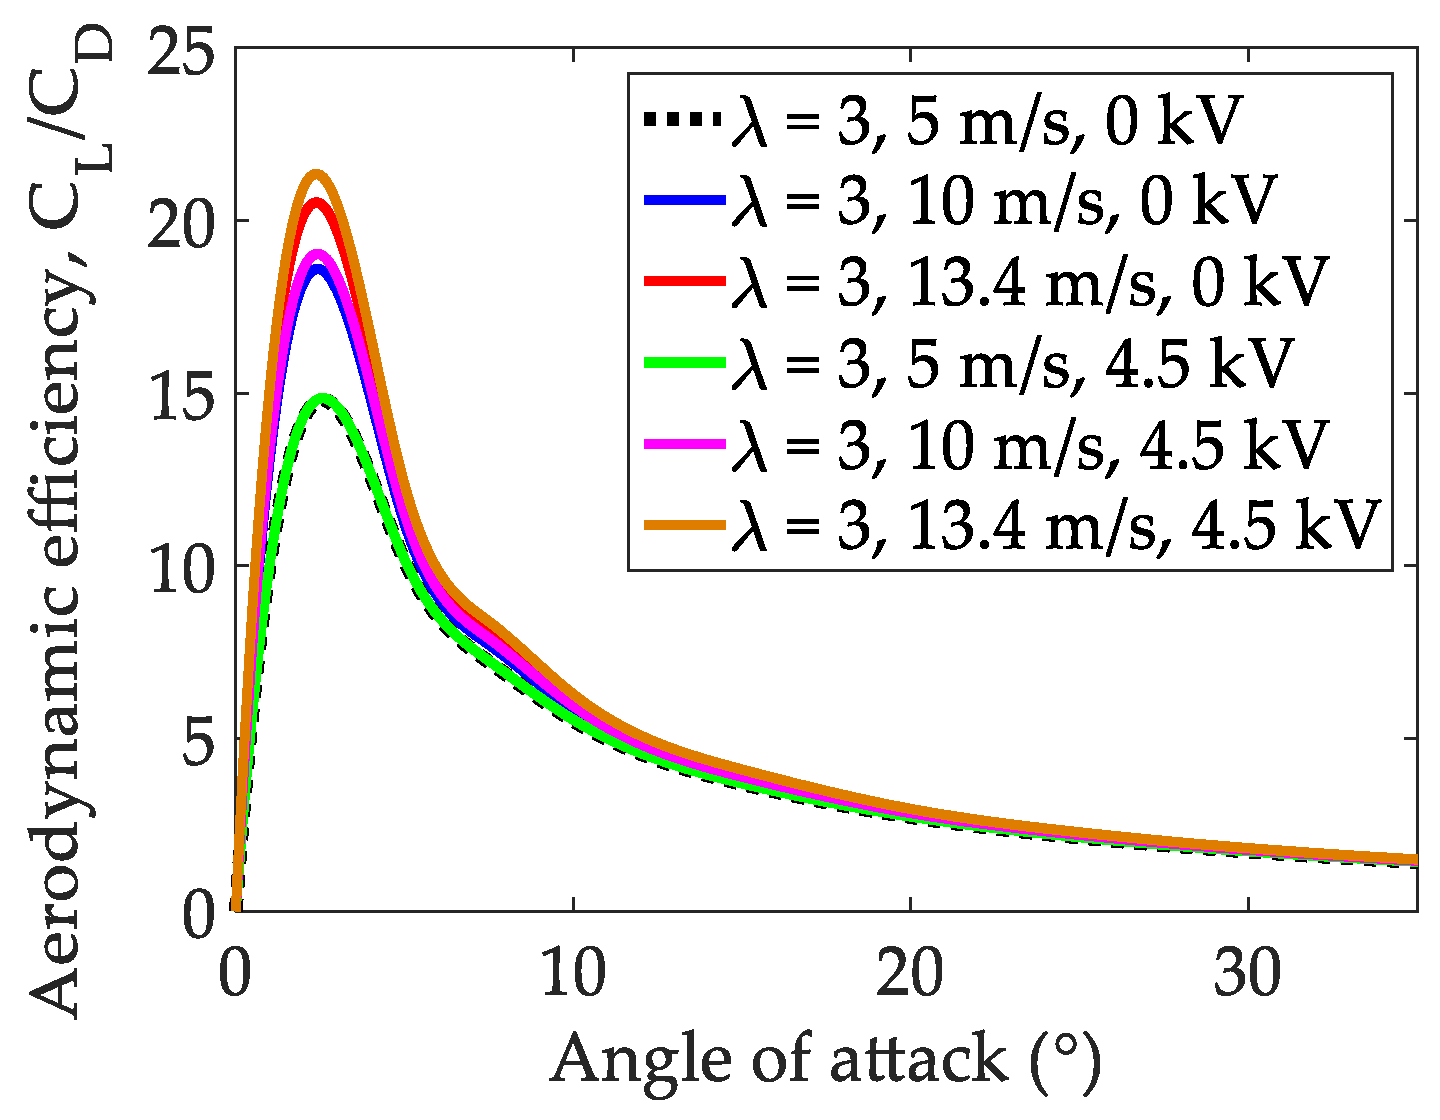
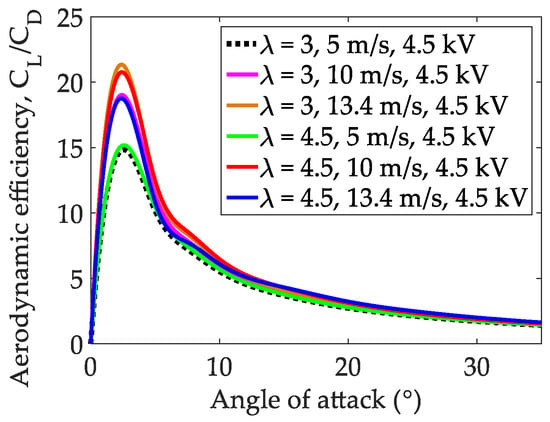
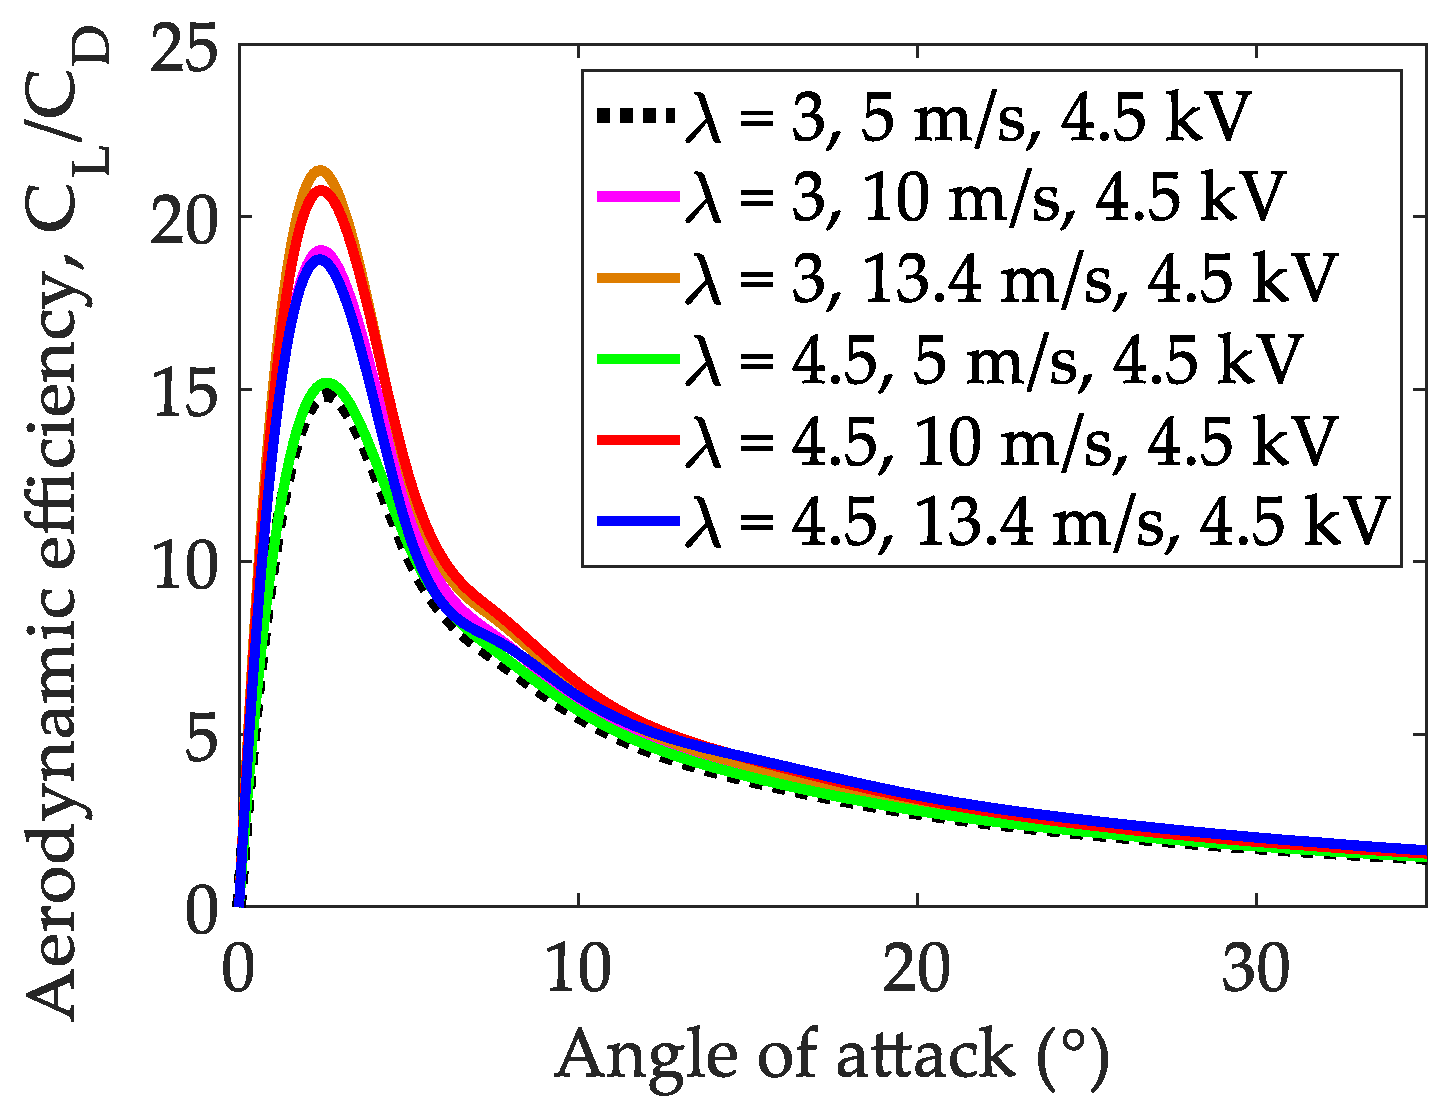
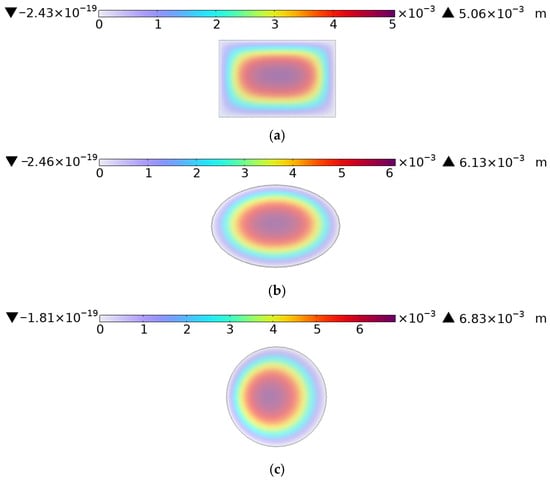
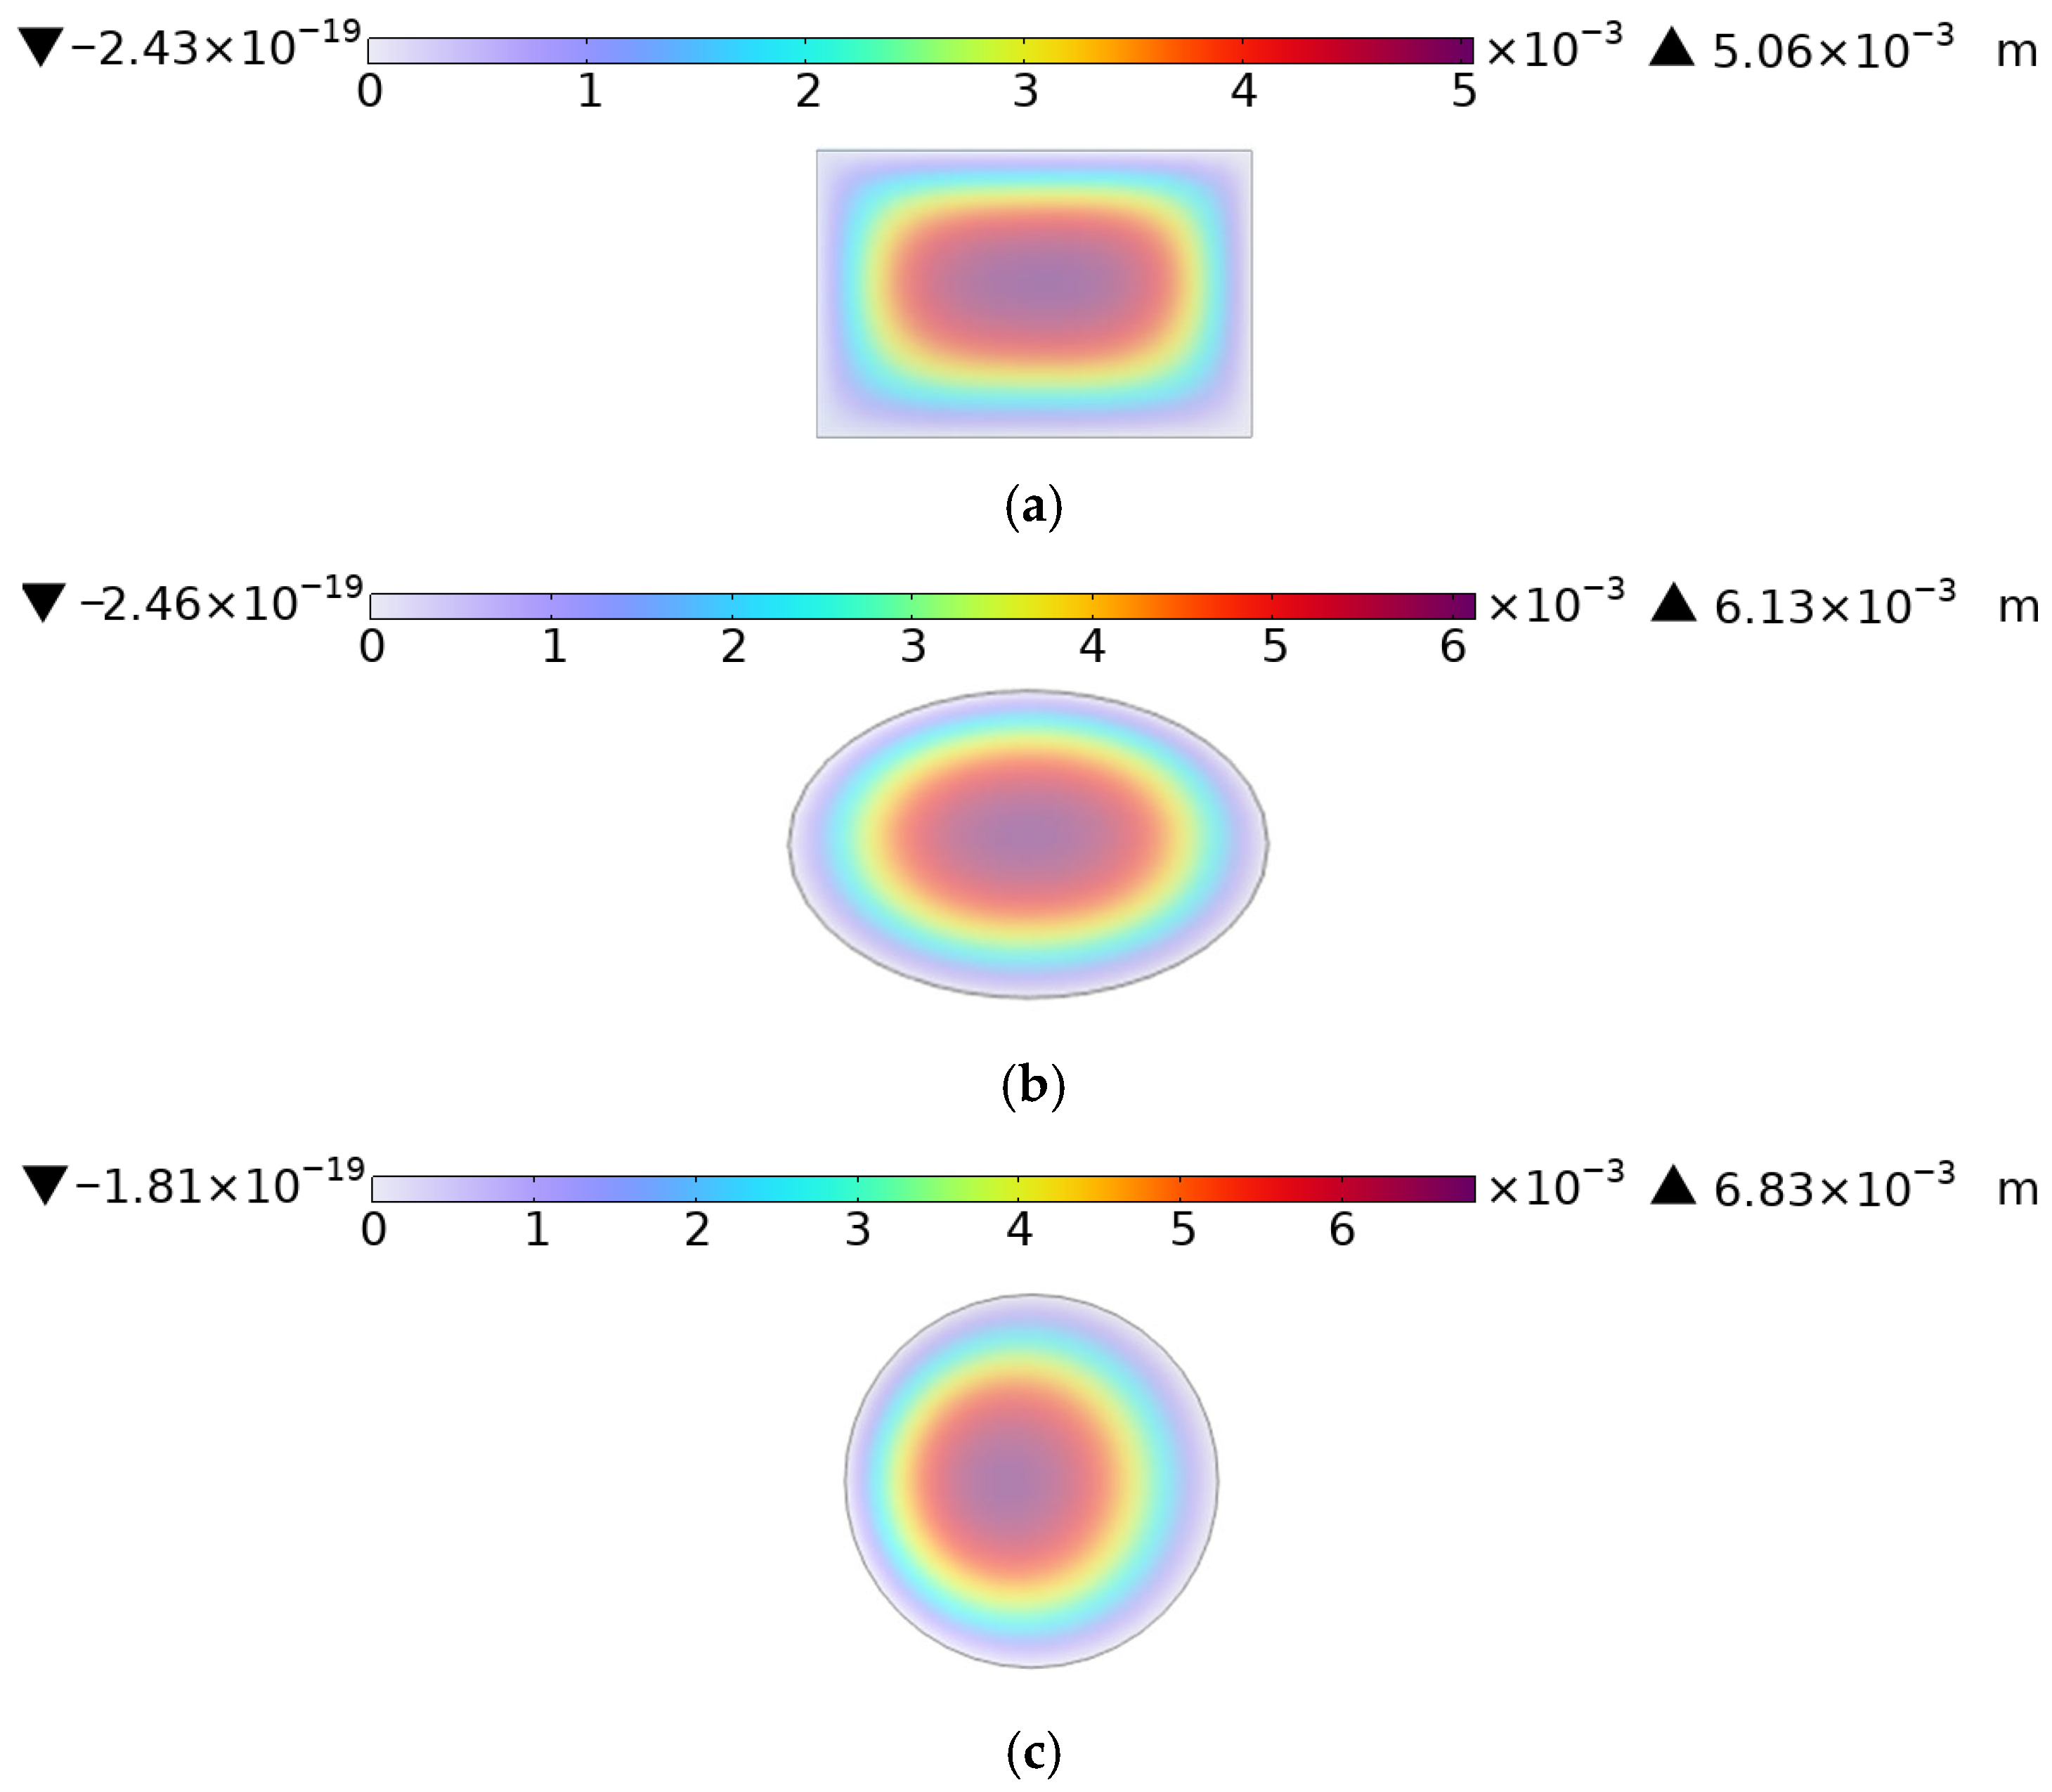

Disclaimer/Publisher’s Note: The statements, opinions and data contained in all publications are solely those of the individual author(s) and contributor(s) and not of MDPI and/or the editor(s). MDPI and/or the editor(s) disclaim responsibility for any injury to people or property resulting from any ideas, methods, instructions or products referred to in the content. |
© 2026 by the authors. Licensee MDPI, Basel, Switzerland. This article is an open access article distributed under the terms and conditions of the Creative Commons Attribution (CC BY) license.