


Abstract
Drone logistics is emerging as a key trend in future delivery systems due to its efficiency. However, current benefit assessments are often one-dimensional, focusing on single-node modes and overlooking load variations and charging processes in continuous multi-node delivery. To address this gap, this paper develops an integrated assessment framework across three dimensions: environment, economy, and time. Based on lifecycle emissions and total cost of ownership, a structured time-performance indicator, time value, is introduced. By incorporating an energy consumption model that accounts for dynamic loads and a charging model that considers charging behavior, an improved genetic algorithm is designed to optimize large-scale urban drone dispatch. Furthermore, a comparative sensitivity analysis with electric trucks quantifies the effects of market demand, charging strategy and technological progress. Results show that, under the modeled scenarios and parameter assumptions, electric trucks remain preferable in the short term, while drones demonstrate stronger long-term potential. Enterprises should align drone and truck deployment with demand and manage charging dynamically, while governments should combine initial subsidies with long-term guidance and systemic support to enable large-scale drone logistics adoption.
1. Introduction
Drone logistics has emerged as a promising solution for urban last-mile delivery by utilizing low-altitude airspace to bypass ground congestion. Supported by regulatory reforms such as the U.S. Federal Aviation Administration’s “Part 107” framework [1], commercial drone applications have accelerated in recent years. However, despite rapid technological progress, the long-term environmental and economic performance of drone logistics across its full life cycle remains uncertain. Existing studies report mixed quantitative conclusions regarding the environmental and economic performance of drone logistics. For example, ref. [2] found that integrating drones into truck-based delivery systems could reduce carbon emissions by approximately 24.9% and total costs by 22.1% under optimized configurations. Similarly, ref. [3] reported that hybrid truck–drone systems may reduce lifecycle emissions by around 15% compared with pure electric truck delivery. In contrast, ref. [4] demonstrated that under dense urban delivery conditions, drone operations may generate 10–35% higher energy consumption than electric trucks, and cost competitiveness remains limited in the short term.
These inconsistencies largely arise from heterogeneity in evaluation frameworks and modeling assumptions. Many studies adopt inconsistent indicator systems, subjective weighting schemes, and insufficiently transparent calculation procedures, limiting reproducibility and cross-study comparability. Moreover, key physical behaviors of drones are often oversimplified. Inaccurate energy modeling may distort endurance estimation and operational feasibility, while neglecting the nonlinear charging characteristics at high state-of-charge levels can lead to underestimated charging times [5], thereby biasing scheduling decisions. In addition, critical factors such as customer density and technological progress significantly influence outcomes [3,6]. Therefore, establishing a comprehensive and transparent evaluation framework that integrates realistic operational modeling with multi-dimensional performance assessment is essential. Such a framework can support operators in optimizing dispatch strategies and assist policymakers in designing evidence-based industrial policies.
This paper aims to provide a theoretical underpinning of drones’ sustainable development prospects. To this end, we propose a comprehensive assessment system incorporating tri-dimensional (environmental–economic–temporal) metrics and establish a dynamic dispatch model for large-scale urban drone delivery. We further incorporate key factor changes into multi-scenario sensitivity analyses. The main contributions are as follows:
- This paper proposes an integrated benefit assessment framework for drone delivery systems, integrating life cycle emissions (including indirect charging emissions), total cost of ownership (with refined labor cost structure and explicit infrastructure cost inclusion), and time value (newly introduced several indicators). Compared with traditional single-dimensional evaluations, this framework provides a more structured and transparent multi-dimensional performance assessment.
- This paper develops a stage-based energy consumption model accounting for payload variation and a piecewise linear charging function reflecting the CC-CV mechanism, and designs an improved genetic algorithm to solve the large-scale drone dispatching problem under multi-node continuous delivery scenarios. Unlike simplified static-load and linear-charging assumptions in prior studies, the proposed modeling approach aims to better approximate real operational behaviors under the given modeling assumptions.
- This paper incorporates key factors such as market demand fluctuations, charging strategy selection and future technological advancements, and conducts multidimensional sensitivity analyses with a structured comparison against electric trucks. Beyond static case comparison, this design helps illustrate potential boundary conditions, scale effects, and long-term sustainability tendencies under scenario-based analysis, thereby providing industry and policy insights for sustainable drone logistics.
The remaining sections of this paper are organized as follows: Section 2 reviews relevant literature. Section 3 proposes the integrated benefit assessment system based on environmental, economic, and temporal dimensions. Section 4 details the modeling and solution procedures for large-scale urban drone dispatching. Section 5 compares drones with electric trucks through case studies and multidimensional sensitivity analysis. Section 6 provides a comprehensive summary of the entire paper.
2. Literature Review
This section reviews the literature from three perspectives: the benefit assessment of drone delivery system, the drone routing optimization and the energy consumption/charging model.
2.1. Benefit Assessment of Drone Delivery System
Evaluating the benefits of drone logistics has become a growing research focus, particularly from environmental and economic perspectives.
From an environmental perspective, life cycle assessment (LCA) has been widely adopted. Ref. [7] indicated that emissions during the production phase, especially battery manufacturing, account for a significant share, and that drones exhibit emission advantages mainly in low-demand/density scenarios. Ref. [8] demonstrated that payload levels significantly influence per-delivery emissions, and that electricity mix and warehouse network configurations play a critical role in evaluation outcomes. Ref. [9] focused on the use phase and compared emissions from drones and motorcycles in food delivery scenarios, highlighting the importance of optimizing take-off/landing locations and flight paths to reduce energy consumption. However, most studies emphasize direct life-cycle emissions while insufficiently accounting for indirect emissions from electricity generation and long-term energy system transitions, potentially leading to biased conclusions.
From an economic perspective, total cost of ownership (TCO) has been employed to analyze cost competitiveness across transport modes. Ref. [10] revealed the critical impacts of energy prices and subsidy policies on the economic performance of different transport modes. Ref. [11] demonstrated that task allocation optimization and automation improvements can substantially reduce system costs. Ref. [3] further analyzed economic differences across truck–drone operational configurations, while ref. [2] incorporated carbon pricing mechanisms into TCO models. Nevertheless, many studies overlook long-term structural changes, such as evolving labor patterns under high automation and infrastructure-related expenditures, which may result in overly optimistic cost assessments.
From a temporal perspective, ref. [12] experimentally confirmed the significant time-saving advantages of drone delivery systems. Ref. [13] indicated that time savings strongly depend on the number of deployed drones and the speed ratio between drones and trucks. Yet, research on the time value of drone logistics remains limited, with no unified evaluation framework.
2.2. Drone Routing Optimization
Early studies on independent drone delivery primarily focused on single-node discrete scheduling problems [14], where a single drone serves one customer per trip and must return to the depot for recharging or replenishment. Although such formulations are convenient for methodological validation, frequent depot returns lead to high empty-flight rates and low resource utilization in dense urban scenarios, limiting their scalability. To better reflect practical operations, subsequent research gradually relaxed these assumptions and extended the problem toward multi-node and multi-drone settings [15,16]. In particular, the multi-node continuous scheduling framework allows multiple drones to operate in parallel, with each drone visiting several customers within a single sortie. This paradigm significantly improves operational efficiency and is widely regarded as a core research direction in drone logistics scheduling.
In terms of model formulation, multi-node continuous scheduling typically integrates energy consumption modeling, charging processes, objective design, and operational constraints [17]. However, most studies adopt single-objective formulations, such as minimizing fleet size or energy consumption [18,19], while multi-objective trade-offs remain insufficiently explored. In terms of solution algorithms, the problem is NP-hard. Exact methods (e.g., MILP [20] and column generation [21]) can solve small-scale instances but struggle with scalability. Therefore, heuristic algorithms (e.g., genetic algorithms [22], local search [23], and particle swarm optimization [24]) have been widely applied, and have gradually evolved into hybrid algorithms [25], two-stage frameworks [26], and reinforcement learning-based methods [27].
2.3. Energy Consumption Model and Charging Model
Energy consumption and charging models are core components of drone scheduling frameworks, directly determining the reliability of benefit assessment. Energy models characterize mission energy expenditure, while charging models describe energy recovery between tasks. They jointly constrain system performance in high-frequency delivery operations.
Existing drone energy consumption models can be broadly classified into integrated and composite approaches [28]. Integrated models, grounded in flight dynamics and aerodynamics, provide unified representations of induced, parasitic, and profile power [29,30], but their computational complexity limits applicability in large-scale scheduling optimization. Composite models adopt a phase-based structure, estimating energy use during takeoff, cruise, hovering, and landing separately [14], thereby reducing computational burden while maintaining reasonable accuracy. Some extensions incorporate environmental factors or onboard power consumption [4,31]. However, most studies assume static payloads throughout the delivery process, neglecting the dynamic weight reduction in multi-node continuous operations. This simplification may accumulate estimation errors and bias scheduling outcomes.
Regarding charging modeling, wired charging under the typical CC-CV mechanism exhibits strong nonlinear characteristics [32]. In the electric vehicle literature, charging models have evolved from fixed-time or linear assumptions to piecewise linear approximations. Early studies typically assumed full charging at each charging station or assumed charging time to be proportional to the charged energy [33]. Subsequently, researchers treated the charging amount as a decision variable and introduced partial charging strategies [34]. To capture the nonlinear nature of real charging curves, refs. [35,36] employed piecewise linear functions to approximate the charging process. In contrast, most drone scheduling studies still rely on idealized replenishment assumptions, which constrains the practical applicability of scheduling solutions.
In summary, although prior studies have made important contributions, three limitations remain. First, most benefit assessments focus on either environmental or economic dimensions, while few integrate environmental, economic, and temporal performance within a transparent framework. Second, multi-node continuous drone routing is increasingly recognized as a realistic operational paradigm, yet dynamic payload variation and nonlinear charging behavior are rarely incorporated simultaneously into large-scale dispatch models. Third, comparative analyses with electric trucks often adopt simplified routing or static energy assumptions, limiting cross-modal comparability. These gaps motivate the integrated methodological framework proposed in this study.
3. Benefit Assessment System for Drone Logistics
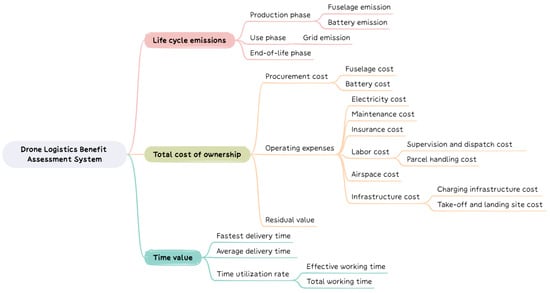
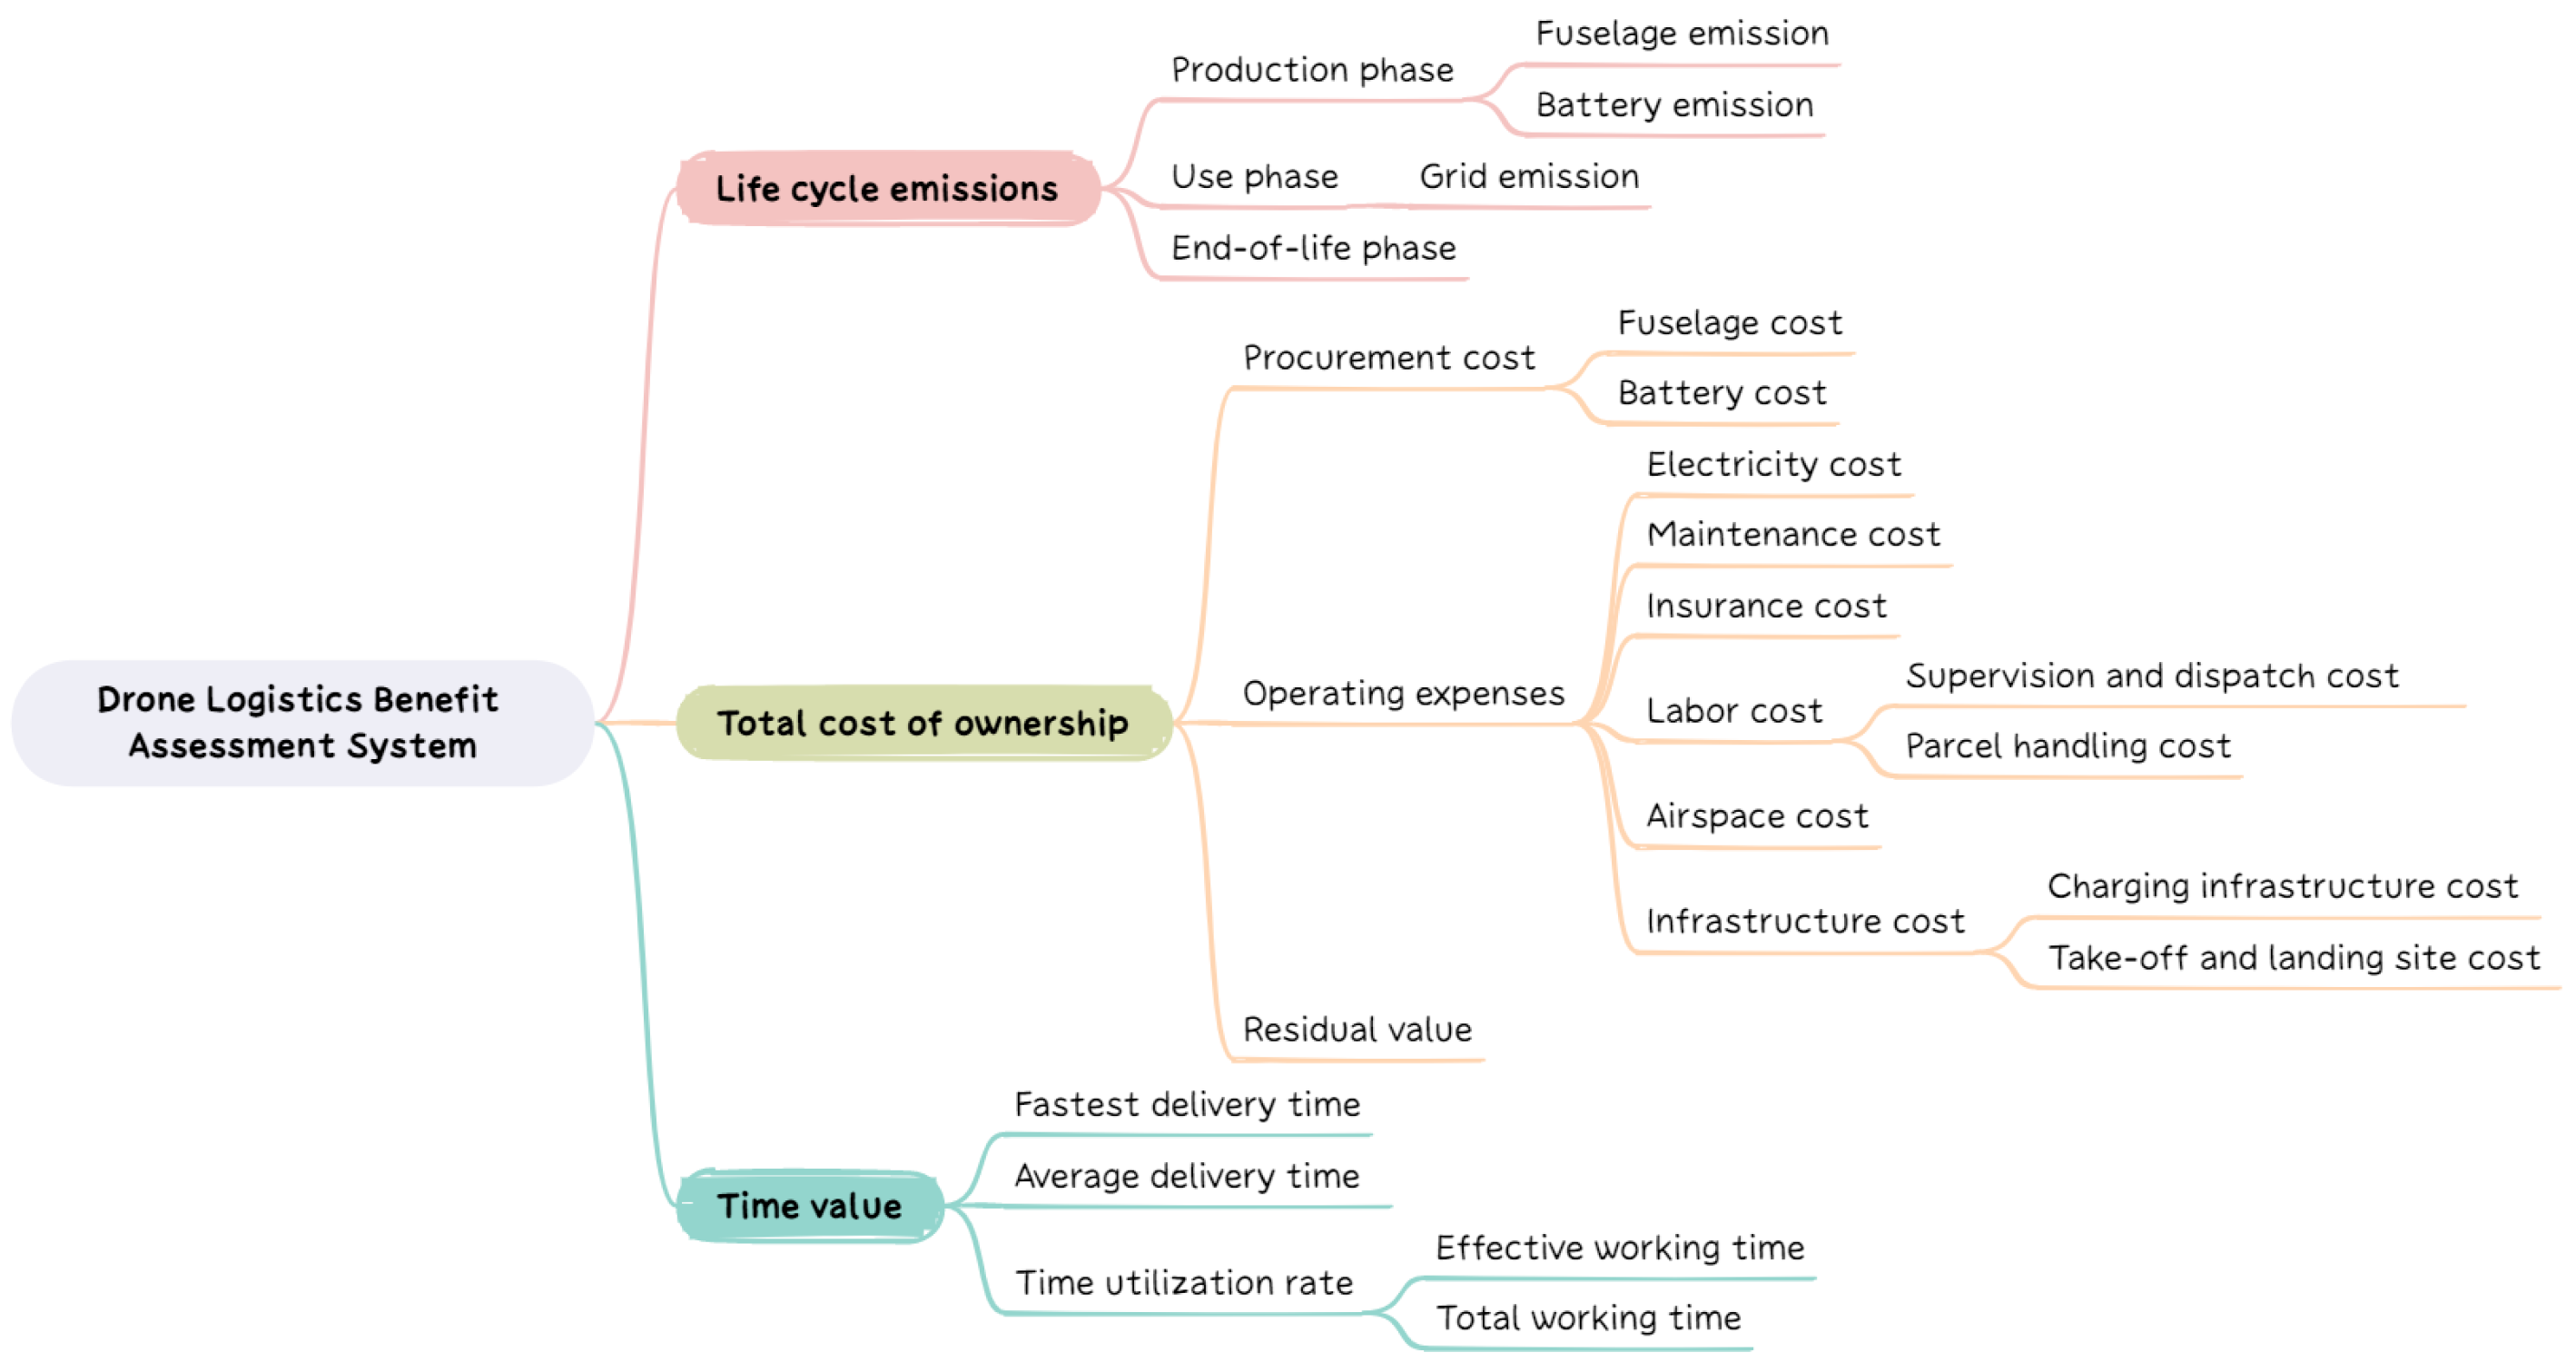
The drone logistics benefit assessment system developed in this paper consists of three fundamental modules: life cycle emissions (environmental dimension), total cost of ownership (economic dimension), and time value (temporal dimension). The overall framework is illustrated in Figure 1. The values of all parameters involved in this section are detailed in Appendix B.
Figure 1.
Conceptual framework of the benefit assessment system for drone logistics.
3.1. Life Cycle Emissions
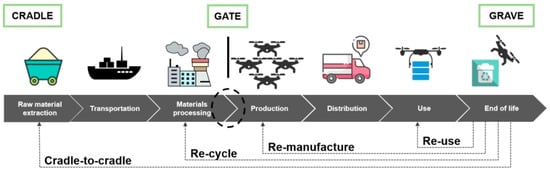
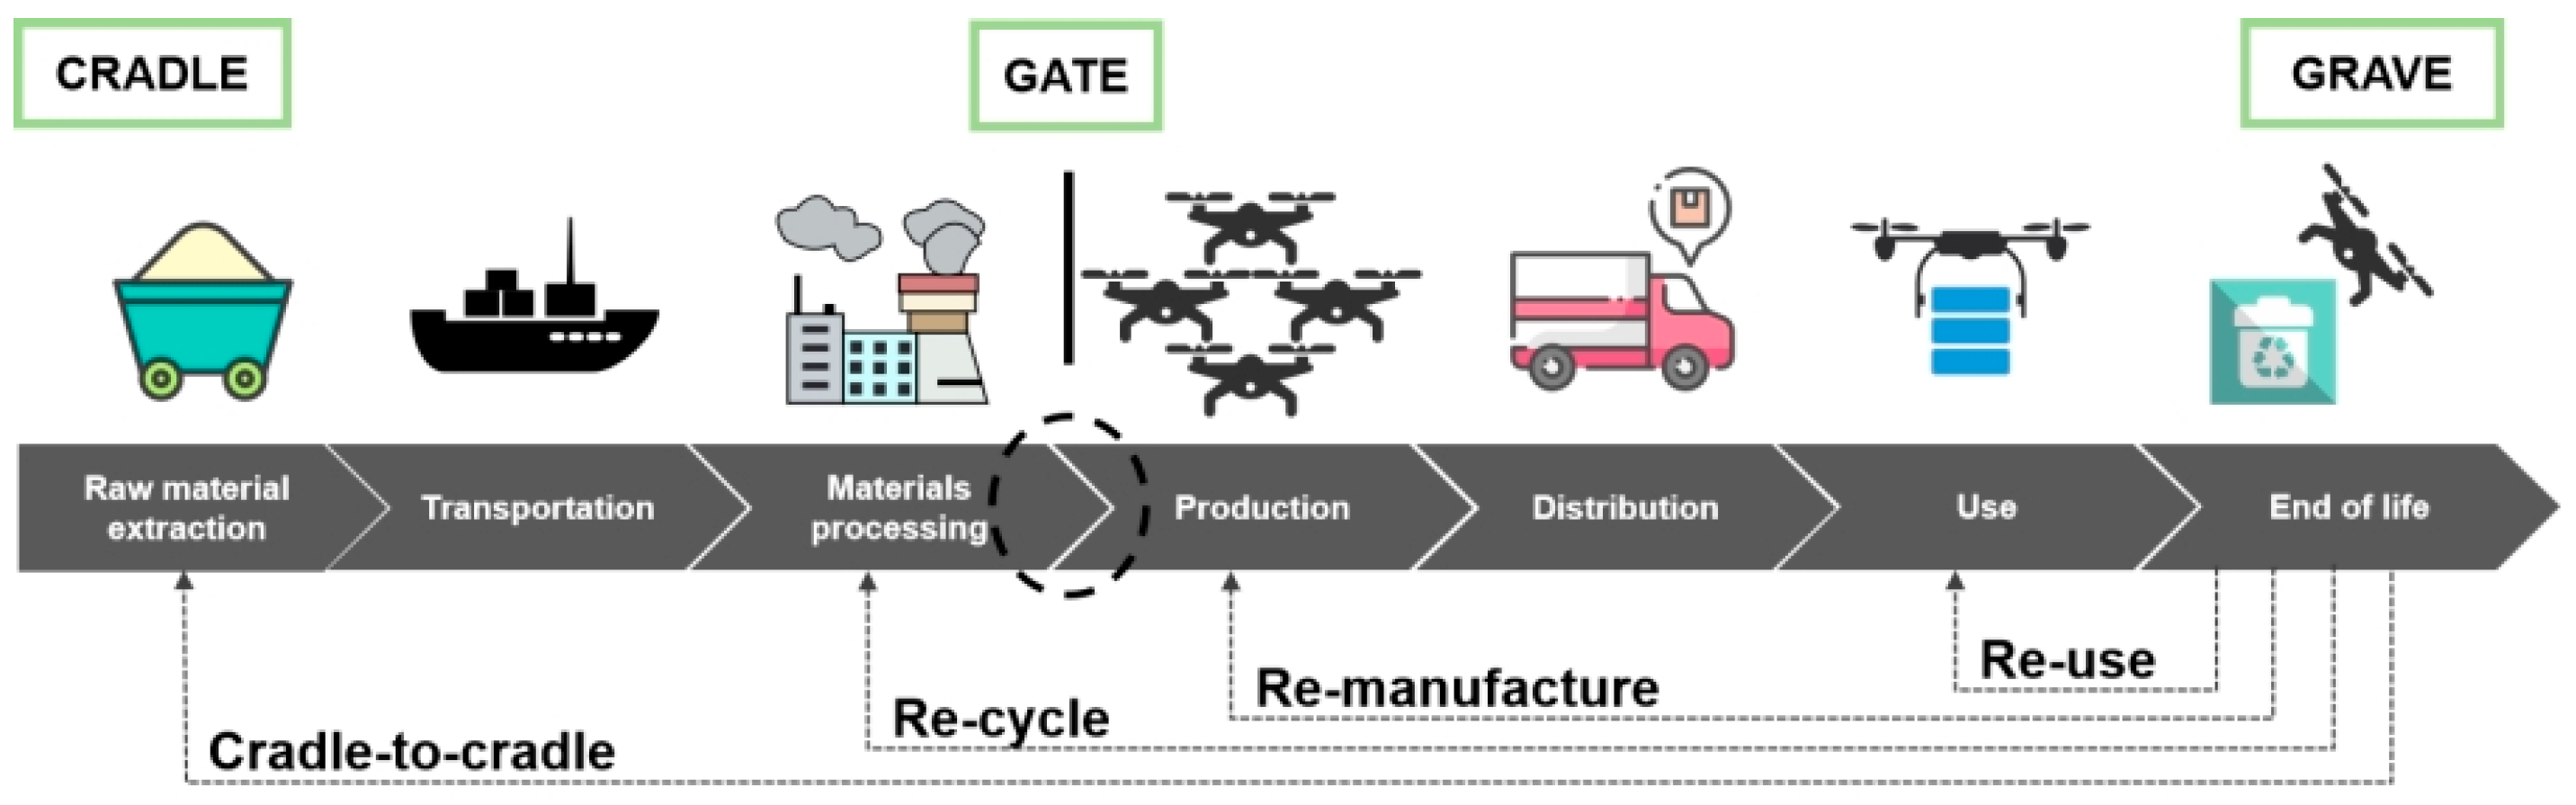
The reference unit for drone life cycle emission assessment is a single delivered parcel. The system boundary is defined as “cradle to grave”, encompassing emissions from all life cycle phases: from raw material extraction, transportation, material processing, production, distribution, use, to end-of-life disposal. This paper assumes a design life of 5 years for drones [3], with a detailed life cycle process shown in Figure 2.
Figure 2.
System boundaries of the cradle-to-grave life cycle for drone delivery.
As shown in Figure 2, drones’ life cycle emissions can be assessed across three main phases: the production phase, the use phase, and the end-of-life phase. Each unit’s environmental impacts are measured in terms of global warming potential, using kg of carbon dioxide equivalent (CO2e) as the unit of measurement.
3.1.1. Production Phase
The drone production phase considers emissions from both fuselage and battery manufacturing.
The formula for drone fuselage production emissions is as follows:
where:
: emission factor for drone fuselage production.
: drone weight excluding payload (including battery).
: battery energy density.
: battery capacity.
The formula for battery production emissions is as follows:
where represents the emission factor for battery production.
3.1.2. Use Phase
The drone must be frequently recharged during its operation, and the electricity conversion in the charging infrastructure leads to carbon dioxide emissions. Therefore, the drone’s electricity consumption also results in indirect emissions, which primarily depend on the energy sources of the power grid. Currently, most power grids are still predominantly powered by fossil fuels, such as coal and natural gas. The formula for the indirect charging emissions during the drone’s use phase is as follows:
where:
: emission factor of the power grid.
: drone’s daily energy consumption (including transmission and charging conversion losses, obtained from the routing problem under a given scenario, as detailed in Section 4).
3.1.3. End-of-Life Phase
If appropriate recycling processes are adopted, the end-of-life phase of drones can significantly reduce carbon dioxide emissions. According to ref. [37], the emissions of the drone’s fuselage and battery during the end-of-life phase can be calculated as a portion of the production phase, with the following formulas:
where:
: emission rate of drone fuselage at end-of-life.
: emission rate of battery at end-of-life.
3.1.4. Allocation to the Functional Unit
In the life cycle emission assessment, the CO2 emission values must be allocated to the selected functional unit, namely the delivery of a single parcel transported by the drone.
- (1)
- Drone fuselage emissions
For the production and end-of-life phases of the drone fuselage, emissions are allocated to a single delivery by dividing the total emissions by the total number of deliveries completed by the drone over its entire lifecycle in a specific scenario. The formula is as follows:
- (2)
- Battery emissions
Battery emissions are allocated to drone operations based on the battery lifecycle emissions, its maximum number of charge–discharge cycles , and its energy capacity. Specifically, the total lifecycle emissions of the battery are evenly distributed across all usable cycles and normalized by the battery capacity to obtain the emission factor per unit electricity consumed. This emission factor is then multiplied by the drone’s daily electricity consumption and divided by the number of daily deliveries to derive the battery emissions per parcel.
- (3)
- Indirect charging emissions
As for the indirect charging emissions during the use phase, the formula is as follows:
In summary, the lifecycle emissions per parcel are obtained by summing the above three components, and are calculated as follows:
3.2. Total Cost of Ownership
Total cost of ownership is a method used to evaluate all relevant costs of a drone throughout its entire lifecycle, aiming to comprehensively analyze all direct and indirect expenses involved from the procurement to the disposal of the drone. According to ref. [37], the relevant cost items during the drone’s lifespan can be categorized into: (i) procurement cost; (ii) operational expenses; (iii) residual value.
3.2.1. Procurement Cost
The procurement cost refers to all expenses paid when purchasing a particular item. This section specifically refers to the procurement cost of the drone and its batteries. Given that the battery lifespan is typically shorter than the service life of the drone fuselage, a drone requires multiple battery replacements over its lifetime. Therefore, the battery procurement cost is a cumulative expenditure, and its total value depends on the battery lifetime characteristics. The procurement cost is calculated as follows:
where:
: procurement cost of a drone.
: procurement cost of a battery.
: annual operating days of drones.
3.2.2. Operational Expenses
Operational expenses refer to various costs incurred during the operation of the delivery system. According to the studies by ref. [3], commonly analyzed costs include electricity, maintenance, insurance, labor, and airspace costs. However, the conventional framework has two key limitations. First, labor cost is typically modeled under the one-operator–one-drone assumption, failing to distinguish between supervision and dispatch labor under highly automated operations and basic labor for parcel handling. Second, as market demand for drone logistics continues to expand, the cost of supporting infrastructure, such as charging facilities and takeoff/landing sites, is becoming a critical expenditure that can no longer be neglected.
Accordingly, this section revises the traditional operational cost framework. On the one hand, labor cost is decomposed into supervision/dispatch and parcel handling components to reflect structural changes in human resource inputs. On the other hand, infrastructure cost is incorporated into the evaluation system to more comprehensively characterize the actual cost structure of drone logistics operations. For quantification purposes, this section adopts the daily per drone cost as the basic accounting unit.
- (1)
- Electricity cost
Electricity cost refers to the expenditure incurred to supply electrical energy for drone flight and related onboard systems during logistics operations, and this cost primarily depends on the drone’s average daily energy consumption.
- (2)
- Maintenance cost
Maintenance cost refers to the expenditure incurred for maintenance, inspection, and component replacement to ensure normal drone operation, and is typically incurred on an annual basis.
- (3)
- Insurance cost
Insurance cost refers to the expenditure incurred for purchasing insurance to hedge against potential operational risks, and is also accounted for on an annual basis.
- (4)
- Labor cost
Labor cost refers to the human resource expenses associated with the operation and management of drones. In this context, we mainly consider two components: (i) supervision and dispatch cost, where an operator can manage multiple drones, and the manageable fleet size per operator is expected to increase with higher levels of automation; (ii) parcel handling cost, which includes labor expenditures for parcel sorting, loading, and unloading operations. Given the fact that relevant personnel typically collaborate across multiple operational stages, this study estimates parcel handling cost based on the number of parcels.
- (5)
- Airspace cost
Airspace cost refers to the expenditure associated with airspace usage during drone operations, including airspace control, monitoring, and flight authorization services. This cost is typically charged on an hourly basis and is allocated to individual drones, as airspace resources are shared among multiple drones.
- (6)
- Infrastructure cost
Infrastructure cost refers to the expenditure incurred for the construction and maintenance of various facilities required to ensure the normal operation of drone logistics systems. In this study, infrastructure cost is decomposed into two components: (i) charging facility cost, which covers the procurement, installation, routine operation and maintenance of charging equipment. This cost is assumed to be proportional to the fleet size; (ii) takeoff/landing site cost, which includes site maintenance and the construction of supporting facilities such as navigation systems and communication equipment. As shared infrastructure, the takeoff/landing site cost is assumed to be proportional to the number of sites. When multiple logistics operators share the same site, the cost is allocated among operators according to their operational volume at that node. Each node is assumed to be equipped with one standard takeoff/landing site.
In summary, operational expenses are obtained by summing the above six components, and are calculated as follows:
where:
: electricity cost per kilowatt-hour.
: annual maintenance cost per drone.
: annual insurance cost per drone.
: hourly labor cost for unit supervision and dispatch personnel.
: handling cost per parcel.
: hourly airspace cost.
: annual cost per charging station.
: annual cost per takeoff/landing site.
: daily parcel volume.
: number of drones.
: daily working hours per drone.
: number of drones assigned per person.
: business volume ordered by each node.
3.2.3. Residual Value
Given that materials can be recycled and some components can be resold, the disposal of drone fuselages and batteries can be considered a potential source of income.
The formula for the residual value is as follows:
where:
: conversion rate of the residual value of drone fuselages.
: conversion rate of the residual value of batteries.
3.2.4. Allocation to Functional Unit
In the total cost of ownership assessment, the drone procurement cost, operational expenses, and residual value are also allocated to the delivery of a single parcel. The formula for the total cost of ownership per parcel is as follows:
3.3. Time Value
In the assessment of drone logistics benefits, in addition to the environmental and economic dimensions, the temporal dimension is equally crucial as it directly impacts delivery efficiency and timeliness requirements. Although delivery time is frequently reported in routing studies, it is often treated merely as an optimization output or constraint rather than being structured as an independent evaluation module.
To this end, this chapter establishes a structured time-performance assessment module that organizes temporal performance into three complementary indicators: fastest delivery time, average delivery time, and time utilization rate. Together, these indicators reflect response capability under ideal conditions, realized service performance under operational constraints, and the structural efficiency of time resource utilization, forming an operational time-performance module at the system level.
3.3.1. Fastest Delivery Time
Fastest delivery time is defined as the theoretical shortest average time required for a drone to depart from the depot and complete the first delivery task, which is used to measure the system’s fastest response capability under ideal operating conditions (without charging interruption). Specifically, the fastest delivery time is calculated based on the average cruise flight time from the depot to customer nodes, plus the time required for takeoff and landing operations. The formula is given as follows:
where:
: route length from the depot to node .
: flight altitude of drones.
: cruising speed of drones.
: takeoff and landing speed of drones.
3.3.2. Average Delivery Time
Considering the limited endurance of drones, in multi-node continuous delivery scenarios, multiple recharges are often required to restore battery power, which consumes a significant amount of time. Therefore, this section introduces the average delivery time metric to measure the time efficiency of drones under multiple recharges. This metric focuses on the overall completion status of all orders and is defined as the average time between the customer’s service request and the actual receipt of service. Unlike the fastest delivery time, this indicator captures realized service performance under cumulative routing, unloading, and charging processes. The formula is as follows:
where represents the actual delivery time for node . Its value depends on the cumulative flight time, cumulative unloading time, and cumulative charging time before the drone serves the corresponding customer node. In the subsequent algorithmic solution process, the above time-related variables are stored in the solver as state variables, and the value of is dynamically updated through iterative computations and reported together with the optimization results.
3.3.3. Time Utilization Rate
Time utilization rate is used to measure the degree of intensive utilization of time resources. This indicator can reveal the impact of charging activities on overall operational efficiency, thereby providing decision support for optimizing operational modes. In this study, the time utilization rate is defined as the ratio of effective working time to total working time. Total working time refers to the aggregated time of all drones from their first departure from the depot until they complete all tasks and return to the depot, including total flight time, total unloading time, and total charging time. Effective working time denotes the total time spent on actual delivery operations, which complements delivery-time metrics by evaluating how effectively operational time is converted into productive service, highlighting structural time losses caused by charging and empty return trips. The formula is given as follows:
The above time-related variables are also stored in the solver as state variables and are reported together with the optimization results. Therefore, detailed formula derivations are omitted in this section.
4. Large-Scale Urban Drone Dispatching Model
4.1. Problem Description
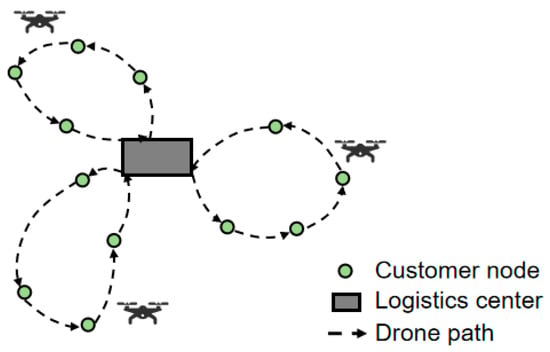
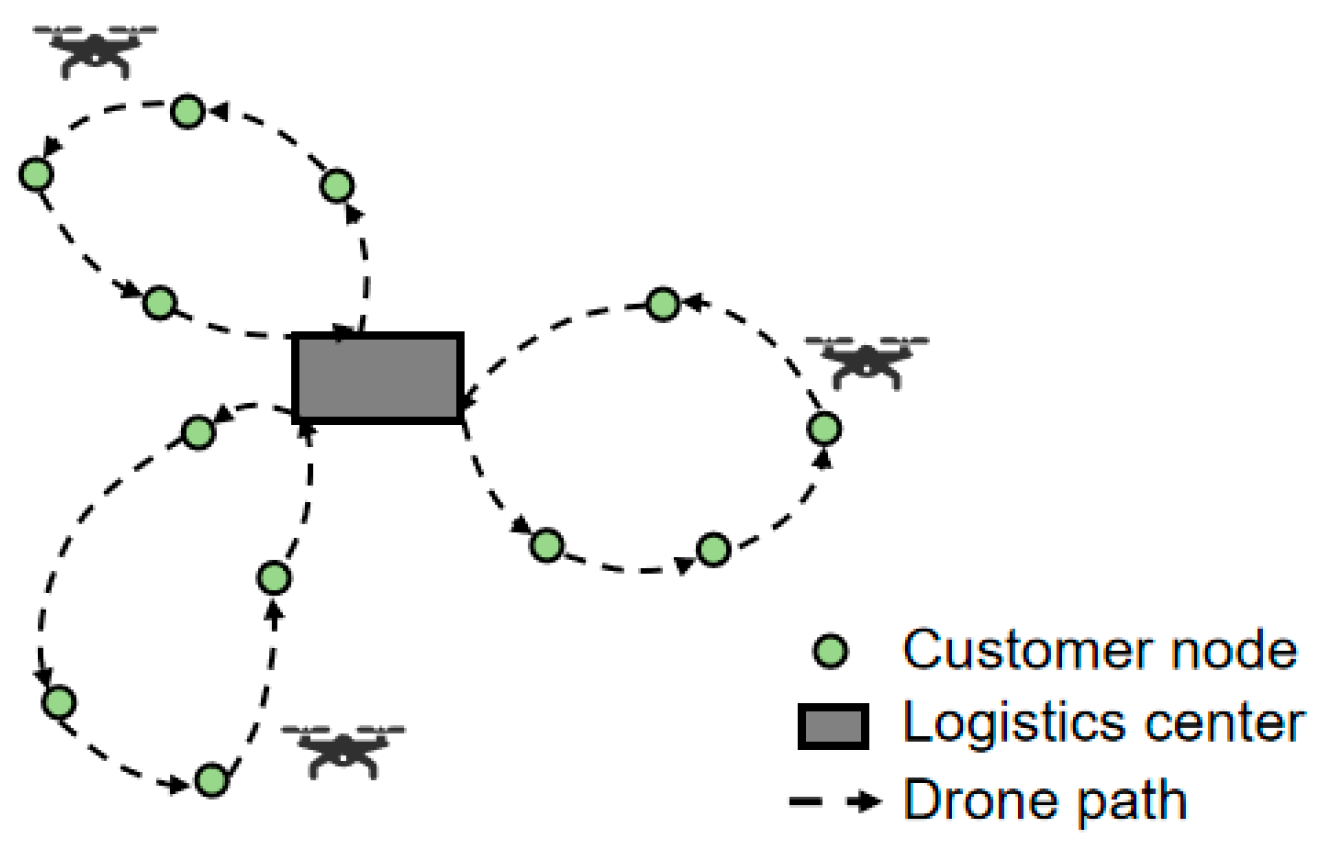
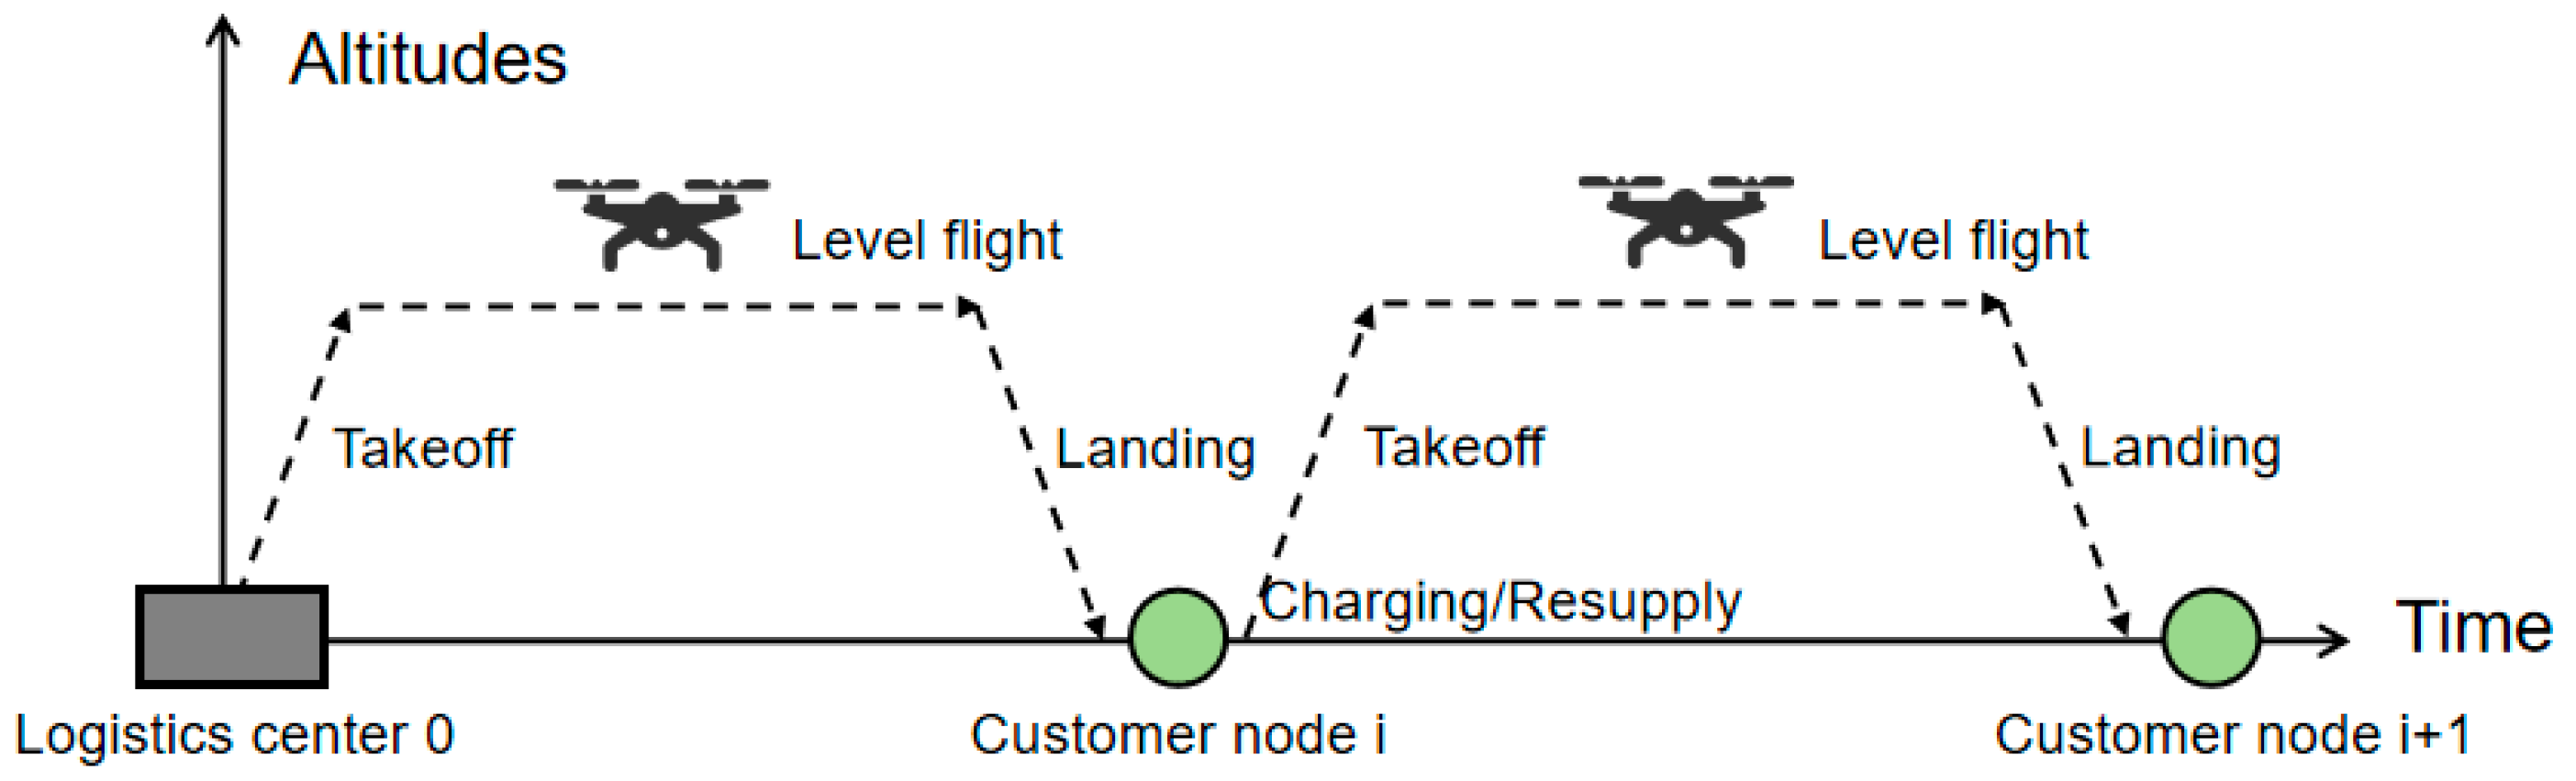
For customer nodes within urban areas, we operate under the assumption that the logistics center employs the same type of drones to provide delivery services. Consider a directed weighted network , where represents the set of nodes, . Here, denotes the logistics center node, from which drones depart and to which they return after completing delivery tasks for recharging and replenishment, and signifies the set of customer nodes. Each customer node requires at most one delivery service per day. is the set of arcs, defined as . denotes the set of drones, where each element in the set is indexed by , satisfying (for ease of counting, different trips performed by the same drone are considered as distinct elements in the set). The continuous delivery mode for drone swarms is illustrated in Figure 3.
Figure 3.
Continuous delivery mode for drone swarms.
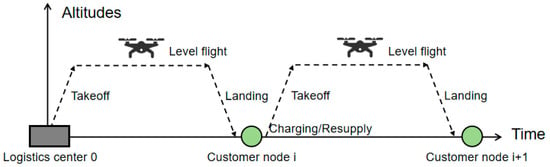
For each customer node , a drone performs delivery service. It is assumed that the demand at each customer node is , and the unloading time per delivery is . For each path , its attributes include path length , drone flight time and energy consumption . For each drone , the maximum working time is , and the maximum number of customer nodes that can be served per mission is (which is derived based on the battery capacity and payload capacity ). The drone flight process can be described as follows: the drone takes off vertically from the previous customer node at a constant speed and ascends to an altitude . Then, it cruises at a constant horizontal speed along the flight path. Upon reaching the next customer node, the drone descends vertically at a constant speed and stops at the destination node. The ideal flight mode is illustrated in Figure 4.
Figure 4.
Ideal flight mode for drone delivery.
At the same time, the decision variables are defined as follows: if drone passes through path , is assigned the value of 1; otherwise, it is 0. represents the remaining battery charge level when drone arrives at node . represents the arrival time of drone at node . represents the remaining load capacity of drone at node . Parameters involved in this section are detailed in Appendix B.
4.2. Model
4.2.1. Phased Energy Consumption Model
Following ref. [4], we determine the energy consumption by summing the energy requirements of each phase in the drone delivery process. The electricity that needs to be compensated from the power grid is denoted as , and the formula is shown in Equation (17).
In the equation, the first addend represents the energy consumed during the drone’s takeoff, level flight, and landing, while the second addend accounts for the energy consumed by the internal electronic devices. denotes the power demand of the drone in different phases. represents the power required to keep the internal electronic devices functioning. refers to the drone’s takeoff and landing time, indicates the drone’s level flight time, and represents the total flight time on path . denotes the climb and descent angle. represents the charging efficiency of the battery from the grid perspective, denotes the energy transmission efficiency between the battery and the propulsion system, and represents the electrical efficiency of the propulsion motor. The formula for is given by Equation (18):
where:
: power for air drag.
: lifting power mark-up.
: power for lifting.
: power for profile air drag.
: power for climbing.
The detailed formulations for the specific indicators are provided in Appendix B Table A4.
The formula for is given in Equation (19):
The formula for is given in Equation (20):
The formula for is given in Equation (21):
4.2.2. Nonlinear Charging Model
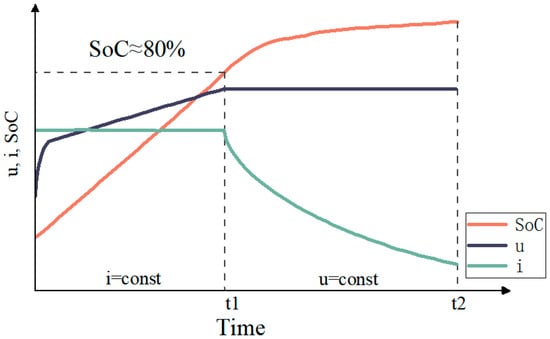
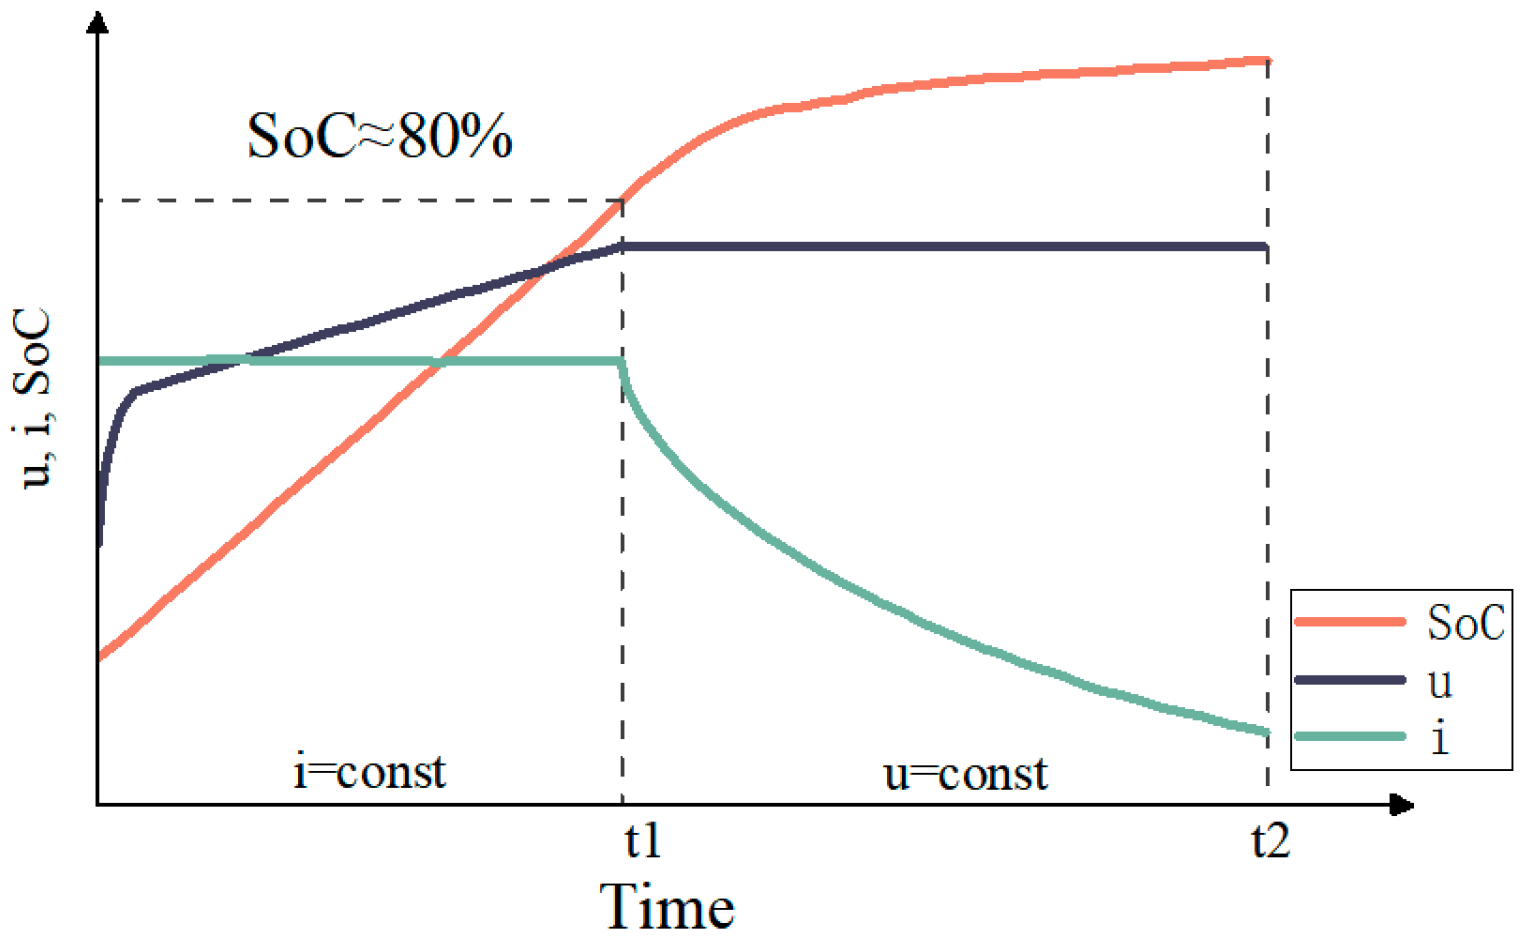
Drones are powered by lithium batteries with known charging characteristics. However, accurately modeling the charging process is challenging due to the influence of factors such as current, voltage, battery recovery effects, and ambient temperature, as shown in Figure 5.
Figure 5.
Typical charging curve.
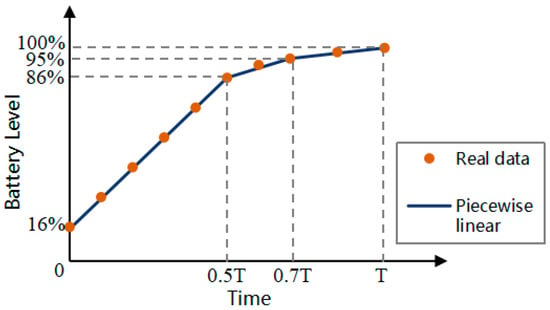
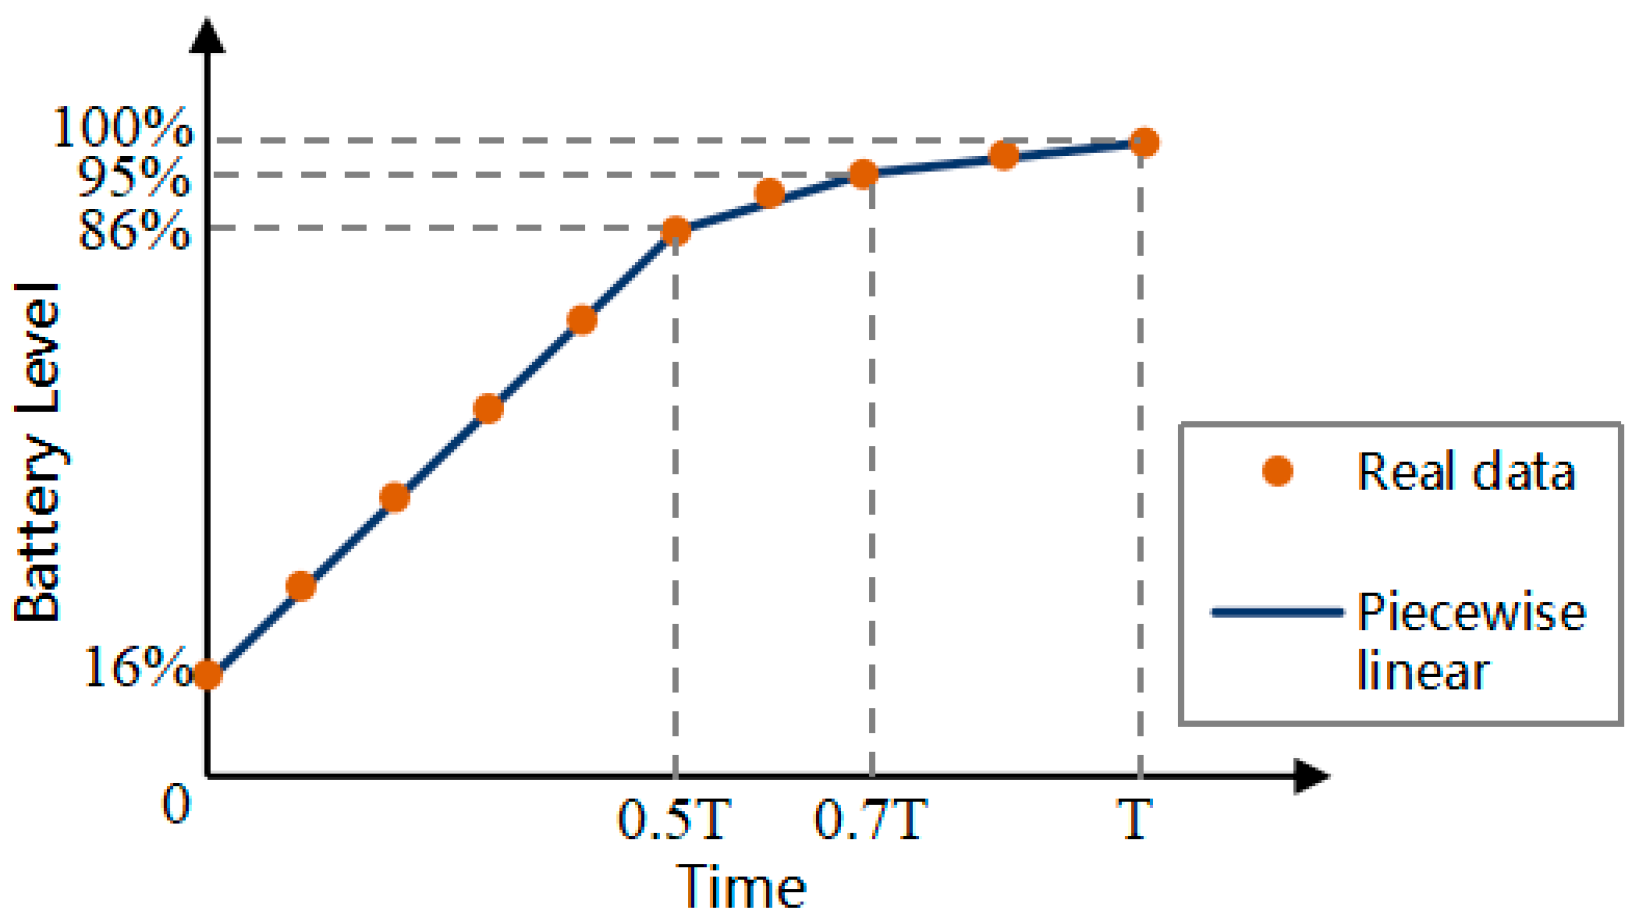
The charging process can be divided into two stages based on the state of charge (SoC): a constant-current (CC) stage, where the current remains constant and the voltage increases linearly until the SoC reaches approximately 80%, and a constant-voltage (CV) stage, where the voltage remains constant and the current gradually decreases until the SoC reaches 100% [5]. To capture this CC-CV behavior, a piecewise linear model is adopted. Key feature points are extracted from a typical charging curve using Python 3.11. The SoC starts at 16% and increases linearly to 86% at 0.5, followed by two inflection points at 95% (0.7) and 100% (). Based on these points, the charging process is approximated by a piecewise linear function, as shown in Figure 6, with the corresponding formulation given in Equation (22).
where represents the charging time, represents the full charge time.
Figure 6.
Piecewise linear approximation charging function.
4.2.3. Multi-Objective Optimization Function
In multi-node continuous dispatching scenarios, logistics operators aim to establish a sustainable and efficient delivery system. This study considers three optimization dimensions:
- (1)
- Minimization of the number of drones
The first objective is to minimize the number of drones. From an environmental perspective, fewer drones reduce embodied emissions; from an economic perspective, fewer drones lower capital and maintenance costs, as well as improve asset utilization. The objective function is formulated as:
- (2)
- Minimization of total energy consumption
The second objective is to minimize the total energy consumption of the drone fleet, thereby reducing electricity costs and indirect emissions. Assuming the battery is recharged to after each trip, the objective function is formulated as:
where represents drone ’s energy consumed during a single trip.
- (3)
- Minimization of average delivery time
The third objective is to minimize the average delivery time, which reflects service quality and customer satisfaction. The objective function is formulated as:
4.2.4. Operational Constraints
The constraint set includes sequential constraints, energy constraints, time constraints, and payload constraints. The foundational model is formulated as follows:
Equation (26) ensures that each customer node accepts parcel delivery service from only one drone for once. Equation (27) indicates that all drones depart from the logistics center to perform delivery tasks. Equation (28) ensures that drones return to the logistics center after completing all service tasks. Equation (29) signifies that when a drone arrives at a customer node, it will eventually depart from that same node. Equation (30) asserts that the remaining available battery charge level of any drone at any moment is not less than and does not exceed . Equation (31) establishes the energy relationship from customer node to the next node . Equation (32) highlights that all parcels must be delivered within their designated time windows. Equation (33) illustrates the time relationship from customer node to the next node . Equation (34) denotes that the payload of any drone is not less than 0 and does not exceed . Equation (35) describes the payload relationship from customer node to the next node . Equation (36) defines the 0–1 decision variable constraints.
4.3. Algorithm
The large-scale drone dispatch problem is a typical NP-hard problem, for which is difficult to solve using exact algorithms. As a classic heuristic method, the genetic algorithm (GA) offers strong global search ability and good adaptability, and is therefore widely used in path planning. However, this problem features an extremely large combinatorial search space and complex coupled constraints, which limits the effectiveness of conventional GA. Simple penalty functions tend to generate a large number of infeasible solutions, while generic crossover and mutation operators often fail to preserve high-quality substructures. To address these challenges, this study proposes an improved genetic algorithm that integrates greedy heuristics and adaptive strategies.
4.3.1. Chromosome Structure Design
In this paper, a chromosome corresponds to a drone flight route and is represented by a sequence of natural numbers. Each chromosome in the population is assumed to have a length of , where is the number of customer nodes. The logistics center is labeled as 0, and the customer nodes are numbered 1, 2, 3, …, . The number 0 is placed at both the beginning and the end of the sequence to denote departure from and return to the logistics center, thereby forming a complete chromosome.
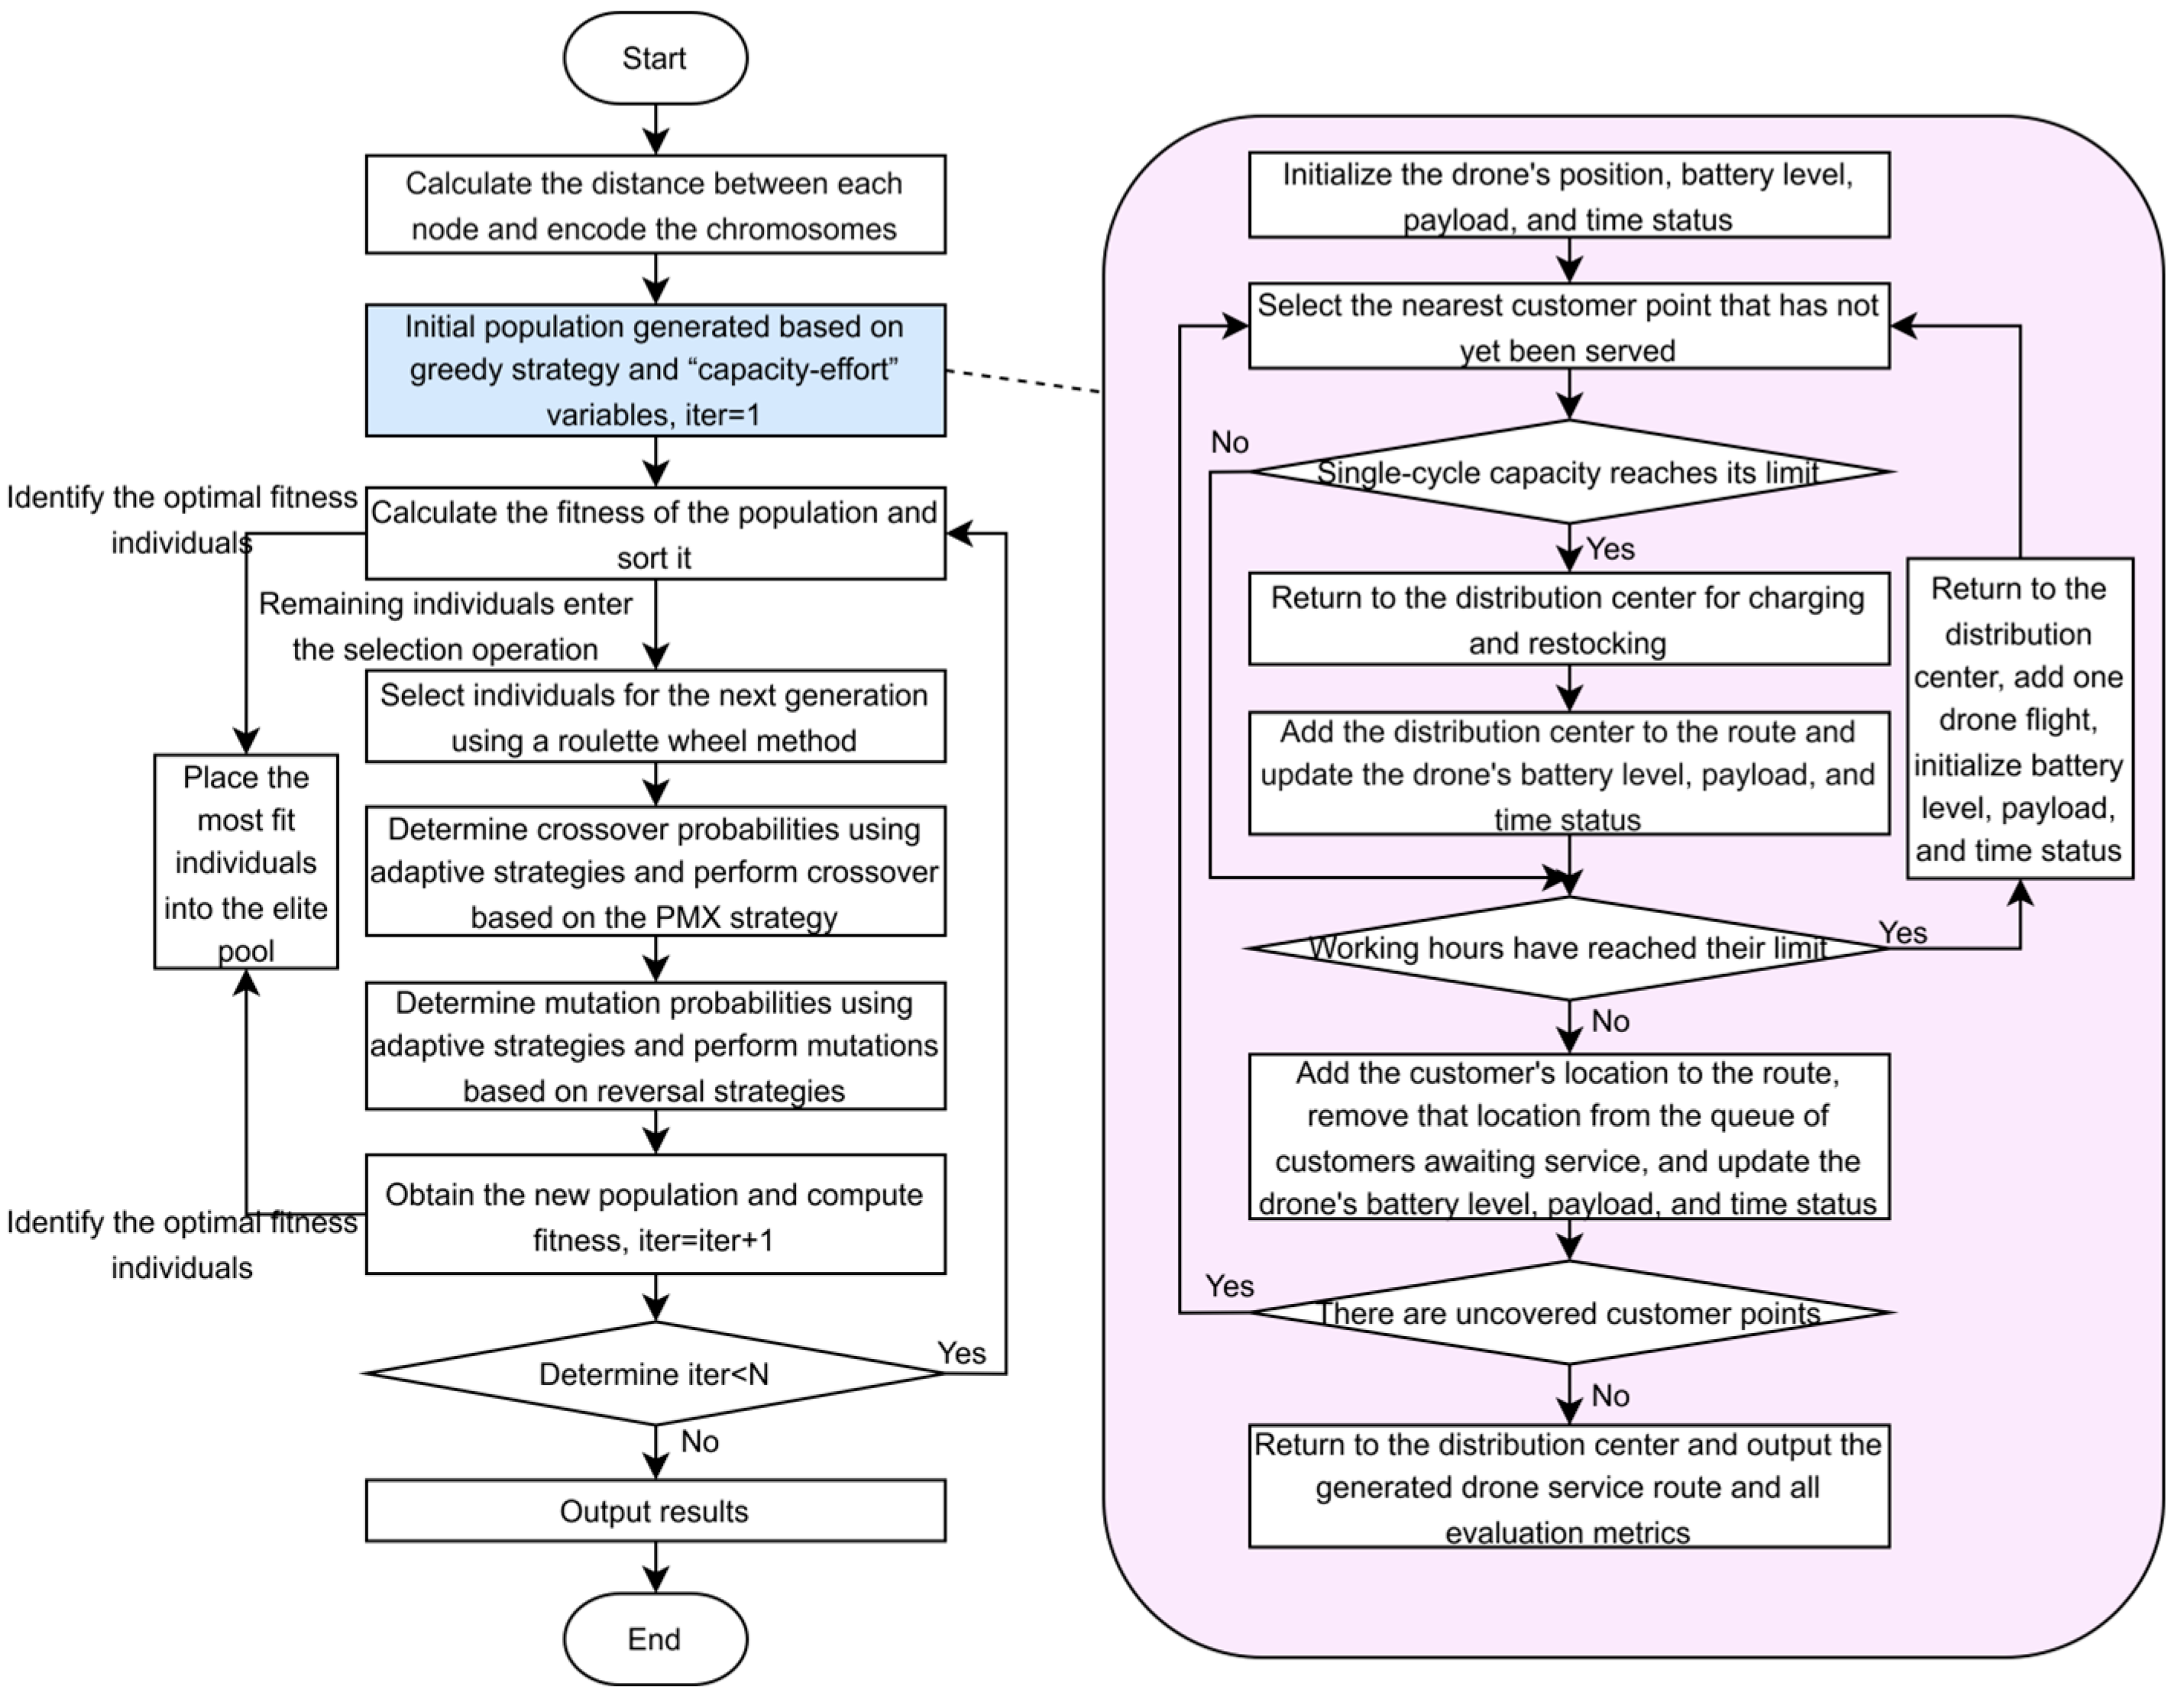
4.3.2. Population Initialization
A greedy mechanism and a capacity–time dual-state representation are introduced to improve the quality of initial solutions. Specifically, a nearest-neighbor heuristic is used to construct customer selection sequences for drones in a greedy manner while satisfying operational constraints, thereby providing a better starting point for subsequent evolutionary search. The capacity state simplifies energy and payload constraints by pre-deriving the maximum number of customers that can be served in a single trip. Meanwhile, the time state tracks cumulative working time to ensure that generated individuals are feasible with respect to time constraints.
4.3.3. Fitness Evaluation
- (1)
- Multi-objective function processing
Multi-objective optimization problems are commonly addressed using weighted-sum methods, Pareto-based evolutionary algorithms, or constrained transformation strategies. The weighted-sum approach combines multiple objectives into a single objective function through predefined coefficients, while Pareto-based algorithms generate a set of non-dominated solutions that reflect trade-offs among objectives. Constrained transformation methods, in contrast, select one objective as the primary optimization target and incorporate the remaining objectives through feasibility constraints or penalty mechanisms.
In this study, the dispatching problem is formulated as a tri-objective model aiming to minimize fleet size, total drone energy consumption, and average delivery time. Considering the heterogeneous physical dimensions of these objectives, determining appropriate weight coefficients for a weighted-sum formulation would introduce subjectivity and may significantly affect solution stability. Meanwhile, Pareto-based approaches typically produce multiple candidate solutions, which require additional decision rules to identify a final implementable scheme.
Therefore, a constrained transformation strategy is adopted. Total drone energy consumption is used as the primary fitness function in the genetic algorithm, while fleet size and average delivery time are controlled through operational constraints and penalty mechanisms. Specifically, fleet size is implicitly minimized under the hard working-time constraint, since insufficient deployment leads to infeasible solutions exceeding the allowable working duration. Average delivery time is indirectly reduced by promoting workload balancing among drones, and penalty factors are imposed on highly uneven task distributions. Through these mechanisms, the tri-objective formulation is addressed within a constrained optimization framework for computational tractability.
- (2)
- Fitness function construction
Since genetic algorithms typically maximize fitness values, while the objective function is to be minimized, the reciprocal of the objective value is used as the fitness function, thereby transforming the minimization problem into an equivalent maximization problem. The fitness function is defined as follows:
4.3.4. Population Update
- (1)
- Selection
This paper adopts a hybrid population selection mechanism that combines elitism with roulette wheel selection.
- (2)
- Crossover
This paper adopts an adaptive crossover strategy to dynamically adjust the crossover probability denoted as , based on the fitness values and of two individuals and undergoing crossover. Here, represents the maximum fitness value between the two individuals involved in the crossover operation, defined as . The formula for adaptively adjusting the crossover probability is given in Equation (38):
where:
: maximum fitness value in the population.
: average fitness value in the population.
: predefined interval of crossover probabilities.
The chromosome crossover procedure uses the Partially Mapped Crossover (PMX) operator.
- (3)
- Mutation
This paper adopts an adaptive mutation strategy, where the mutation probability is dynamically adjusted according to the fitness values of the individuals participating in the mutation operation. The expression for adjusting the adaptive mutation probability is:
where indicates the predefined interval of mutation probability. The chromosome mutation process adopts a gene-segment reversal strategy.
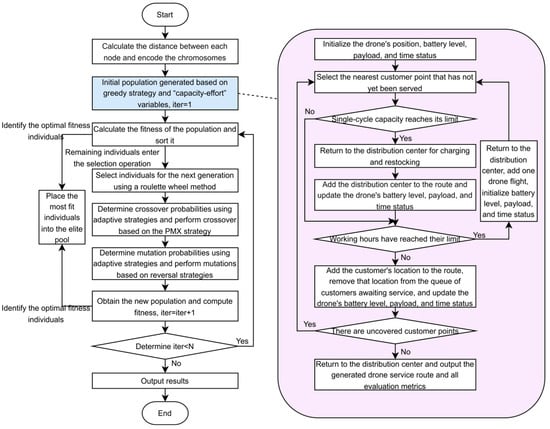
In summary, the complete process for improving the genetic algorithm is shown in Figure 7.
Figure 7.
Complete flowchart for improving genetic algorithms.
5. Case Study
5.1. Case Design
All parameters mentioned in this section are detailed in Appendix B.
- (1)
- Drone platform information
The ARK40 drone developed by Fengyi Technology is selected as the experimental platform. It is a commercially deployed model with a maximum payload of 14 kg, cruising speed of 18 km/h, and flight endurance of approximately 18 km. Model parameters are obtained from public sources and relevant literature.
- (2)
- Spatial scenario information
The study area is defined as a 5 km-radius circular region. Real coordinates of Cainiao pickup stations are obtained from a public urban geographic information service platform and used as the base spatial reference for network construction. Inter-node distances are calculated using Euclidean distance based on spatial coordinates, and travel time is derived according to the predefined cruising speed.
To evaluate scalability under controlled settings, instances with 50–500 customer nodes are constructed. Small-scale instances are randomly sampled from the real dataset without replacement. Medium- and large-scale instances are generated through a hybrid “real data + random augmentation” strategy. Specifically, additional customer nodes are generated in MATLAB using independent uniform random sampling within the predefined circular region. Identical spatial boundaries and parameter settings are applied across experiments to ensure methodological consistency, although specific random realizations may vary.
- (3)
- Operational scenario information
Annual operating days are set to 260 with a daily operating window of 10 h. Parcel weight and unloading time are set to 2.5 kg and 5 min. Each supervisor manages 2 drones, each customer demands 5 parcels, and a 100% charging strategy is adopted. Given the payload limit and battery capacity, each trip can serve up to 4 nodes.
- (4)
- Algorithmic operator information
The model is implemented in MATLAB R2018b. The population size is set to 250. A dynamic iteration strategy is adopted, with a baseline of 1500 iterations plus 150 additional iterations for every 50 added customer nodes. The generation gap is 0.9, adaptive crossover and mutation probabilities range within [0.6, 0.8] and [0.009, 0.2], respectively, and upper bounds for capacity and time constraints are set to 4 and 10.
5.2. Results
5.2.1. Algorithm Comparison
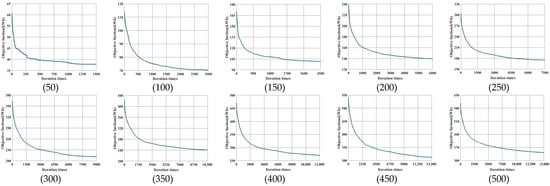
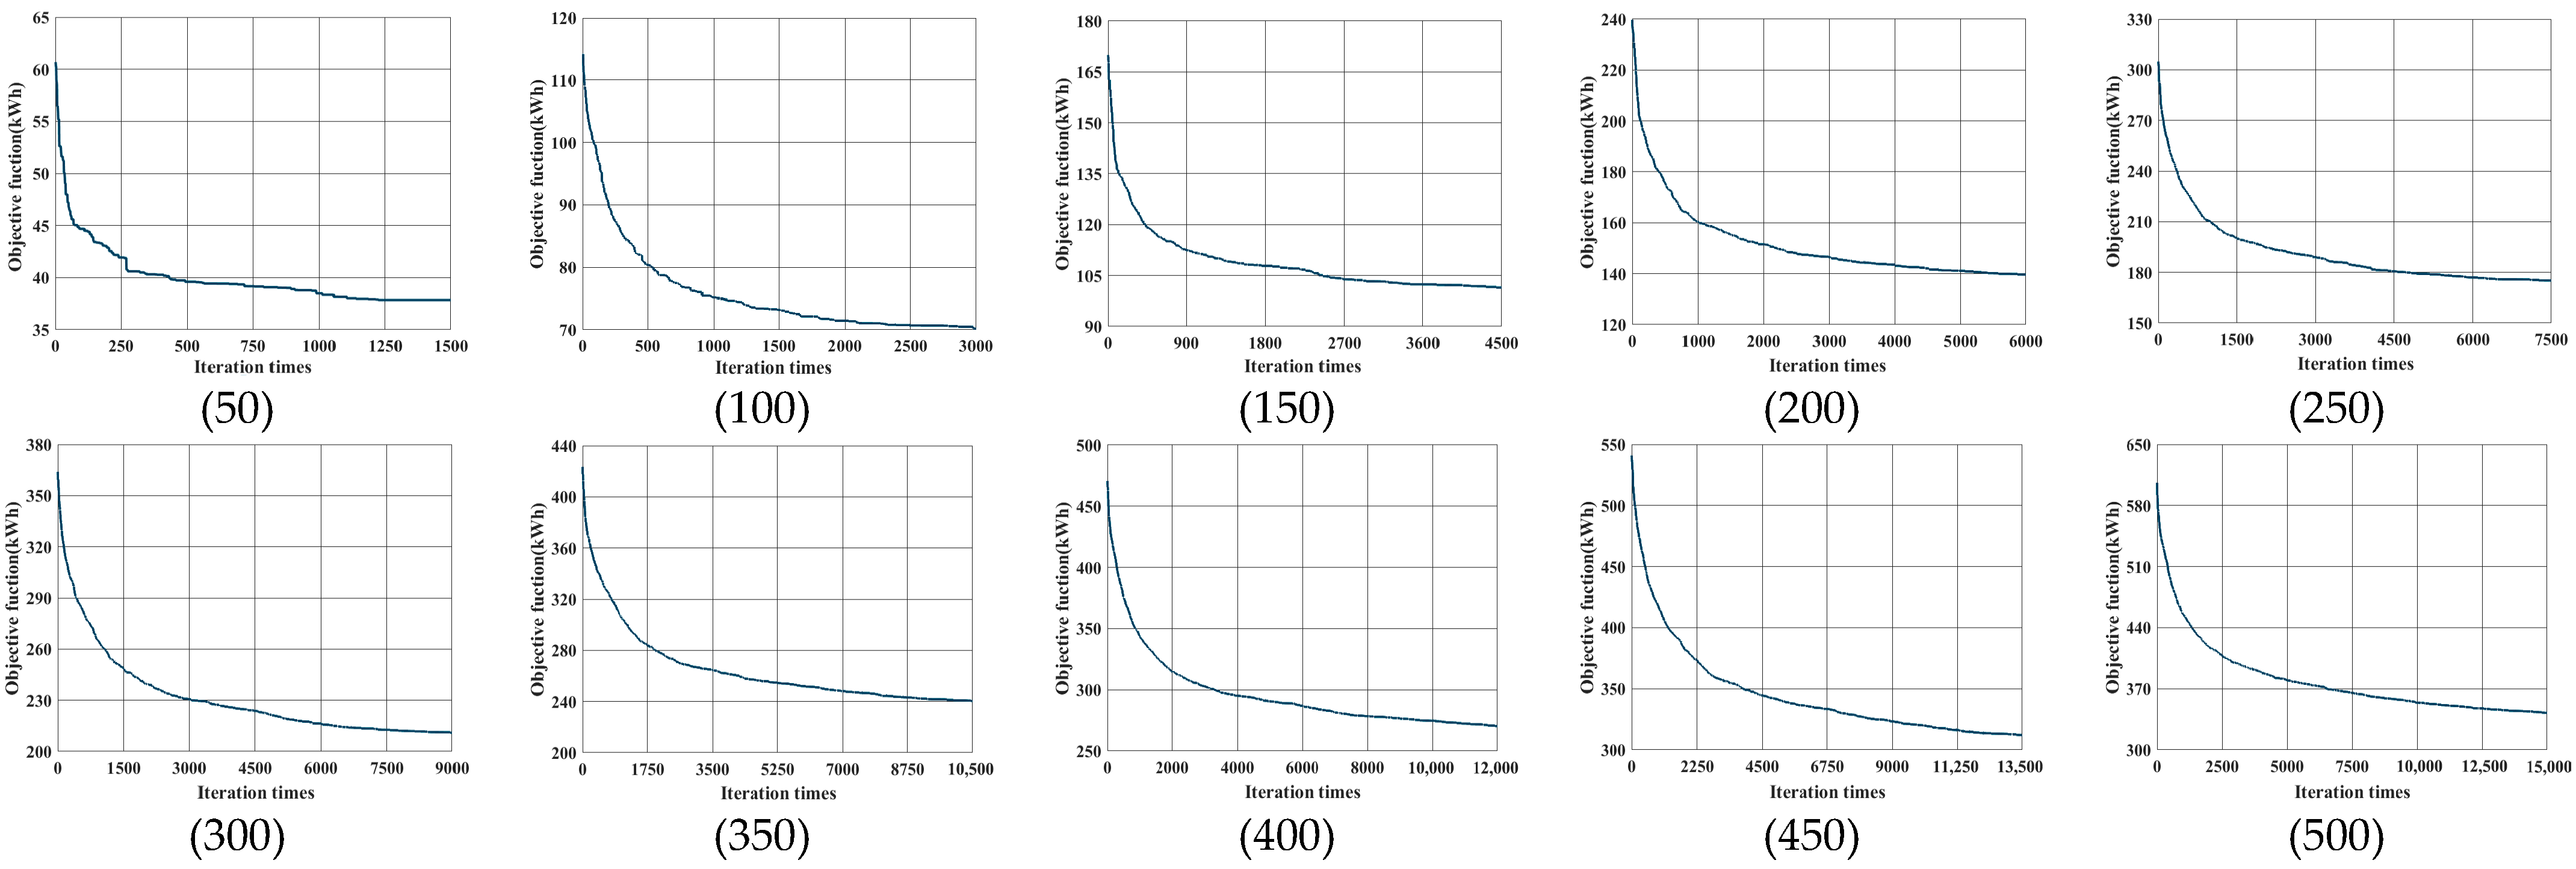
To validate the scalability of the proposed improved genetic algorithm, ten test scenarios with gradually increasing problem sizes are constructed, with the number of customers ranging from 50 to 500 in increments of 50. In addition to the ablation study, six algorithms are compared: the standard genetic algorithm (GA), the greedy genetic algorithm (Greedy-GA), the adaptive genetic algorithm (Adaptive-GA), the proposed improved genetic algorithm (IGA), the variable neighborhood search (VNS), and the particle swarm optimization (PSO). The corresponding objective function values are summarized in Table 1, while the convergence behavior of the improved genetic algorithm is illustrated in Figure 8.
Table 1.
Drone dispatching results under different scale scenarios.
Figure 8.
Convergence of the improved genetic algorithm in ten different scale scenarios.
According to Table 1, both the greedy genetic algorithm and the adaptive genetic algorithm outperform the conventional genetic algorithm, with the greedy strategy yielding more significant improvements, highlighting the importance of high-quality initial solutions. VNS and PSO also achieve lower objective values than the conventional GA; however, their performance remains consistently inferior to the proposed IGA. By combining greedy initialization and adaptive crossover-mutation, the proposed algorithm achieved the best performance across all test instances. Its advantage increased with problem size, reducing the objective value by 14.5% for the 50-node instance and decreasing energy consumption from 545.88 kWh to 344.82 kWh (36.8% improvement) for the 500-node instance. Figure 8 shows that the proposed algorithm demonstrates stable convergence and strong robustness across different scales, confirming its effectiveness for the multi-node continuous delivery problem.
5.2.2. Results Presentation
Based on the current nationwide distribution density of customer nodes, 200 customers are selected to represent the case scale. Using the proposed large-scale urban drone scheduling method and the drone logistics benefit assessment framework, the evaluation results are summarized in Table 2.
Table 2.
Drone logistics benefit assessment.
According to Table 2, under the scenario of 200 customer nodes, the drone delivery system yields per-parcel emissions of 0.582 kg CO2e and a unit delivery cost of €4.17. Fastest delivery time is 3.69 min, average delivery time is 281.61 min, and time utilization rate is 34.33%.
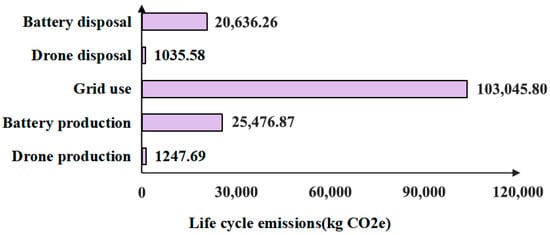
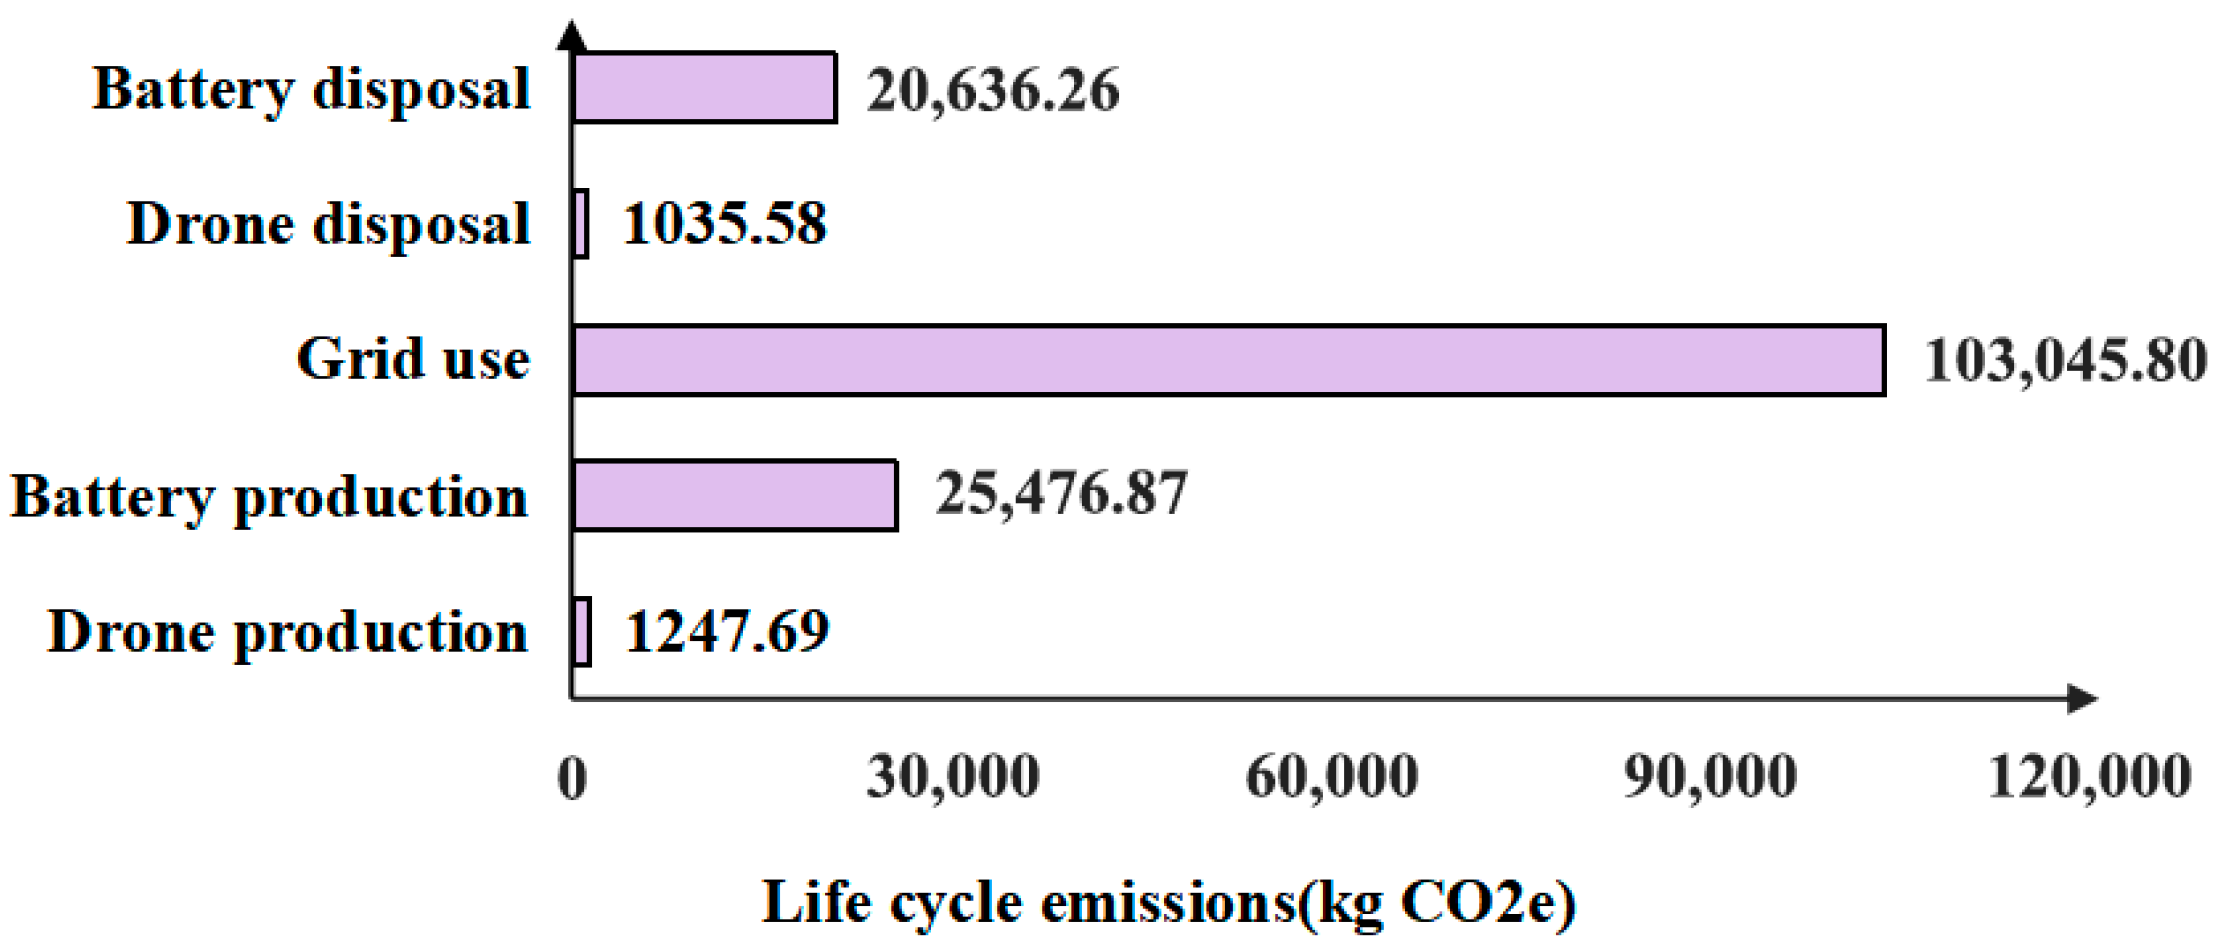
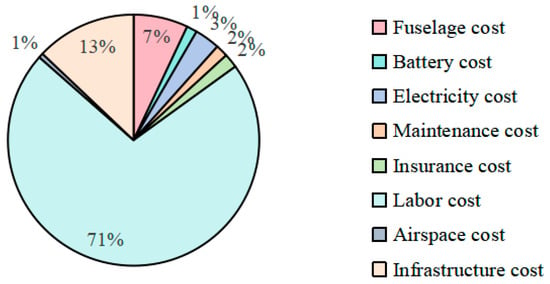
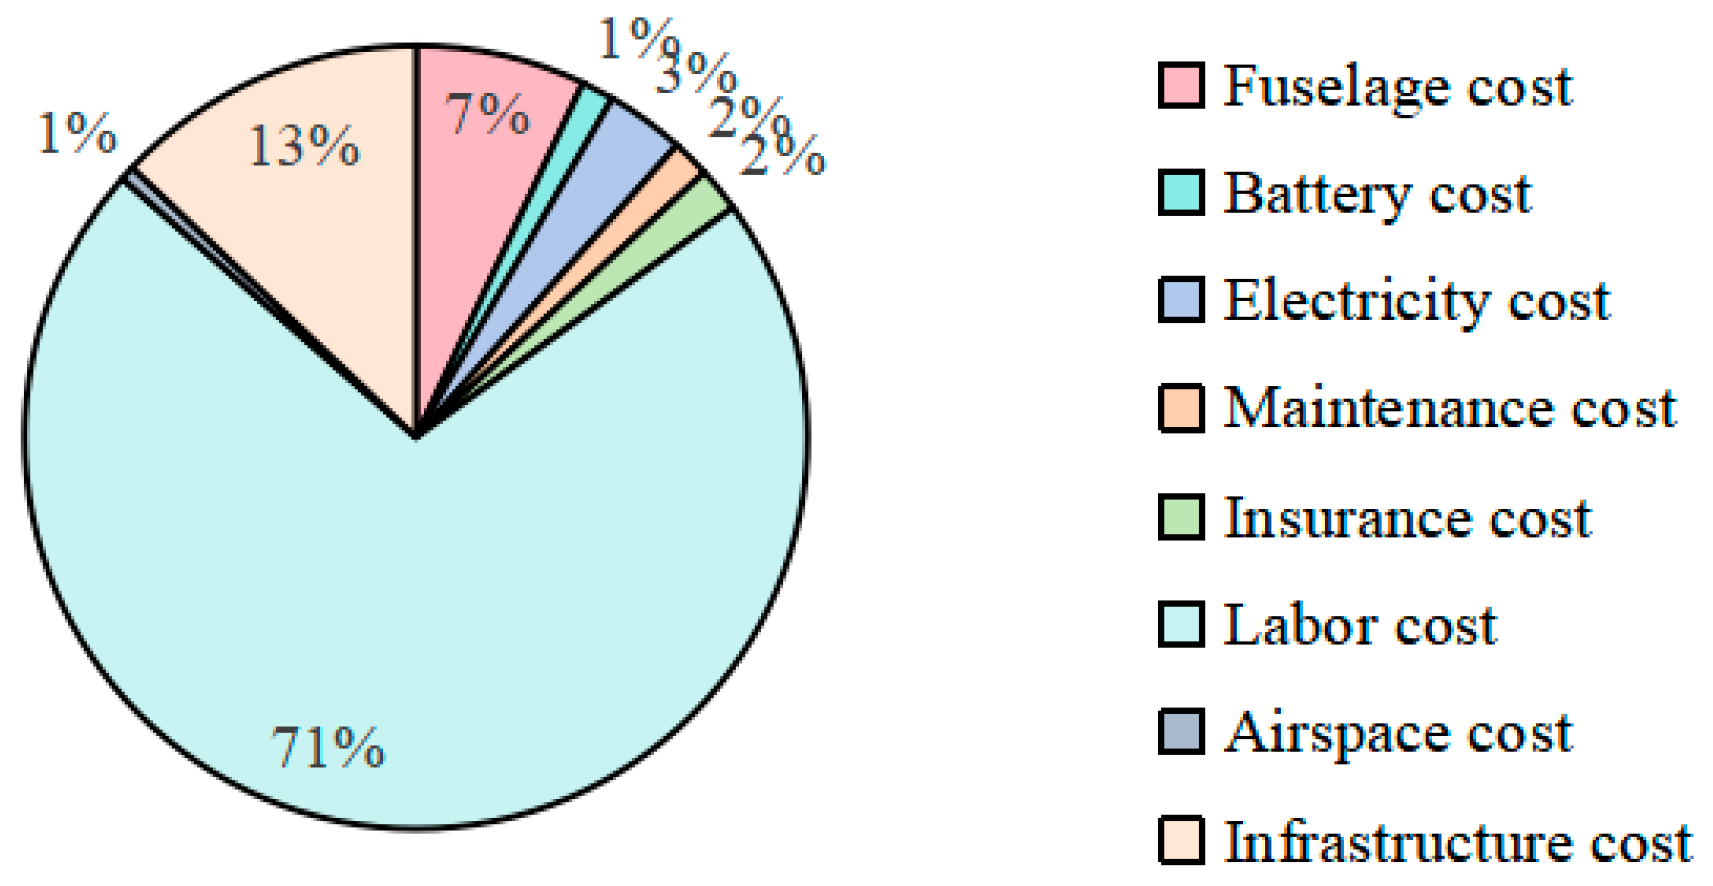
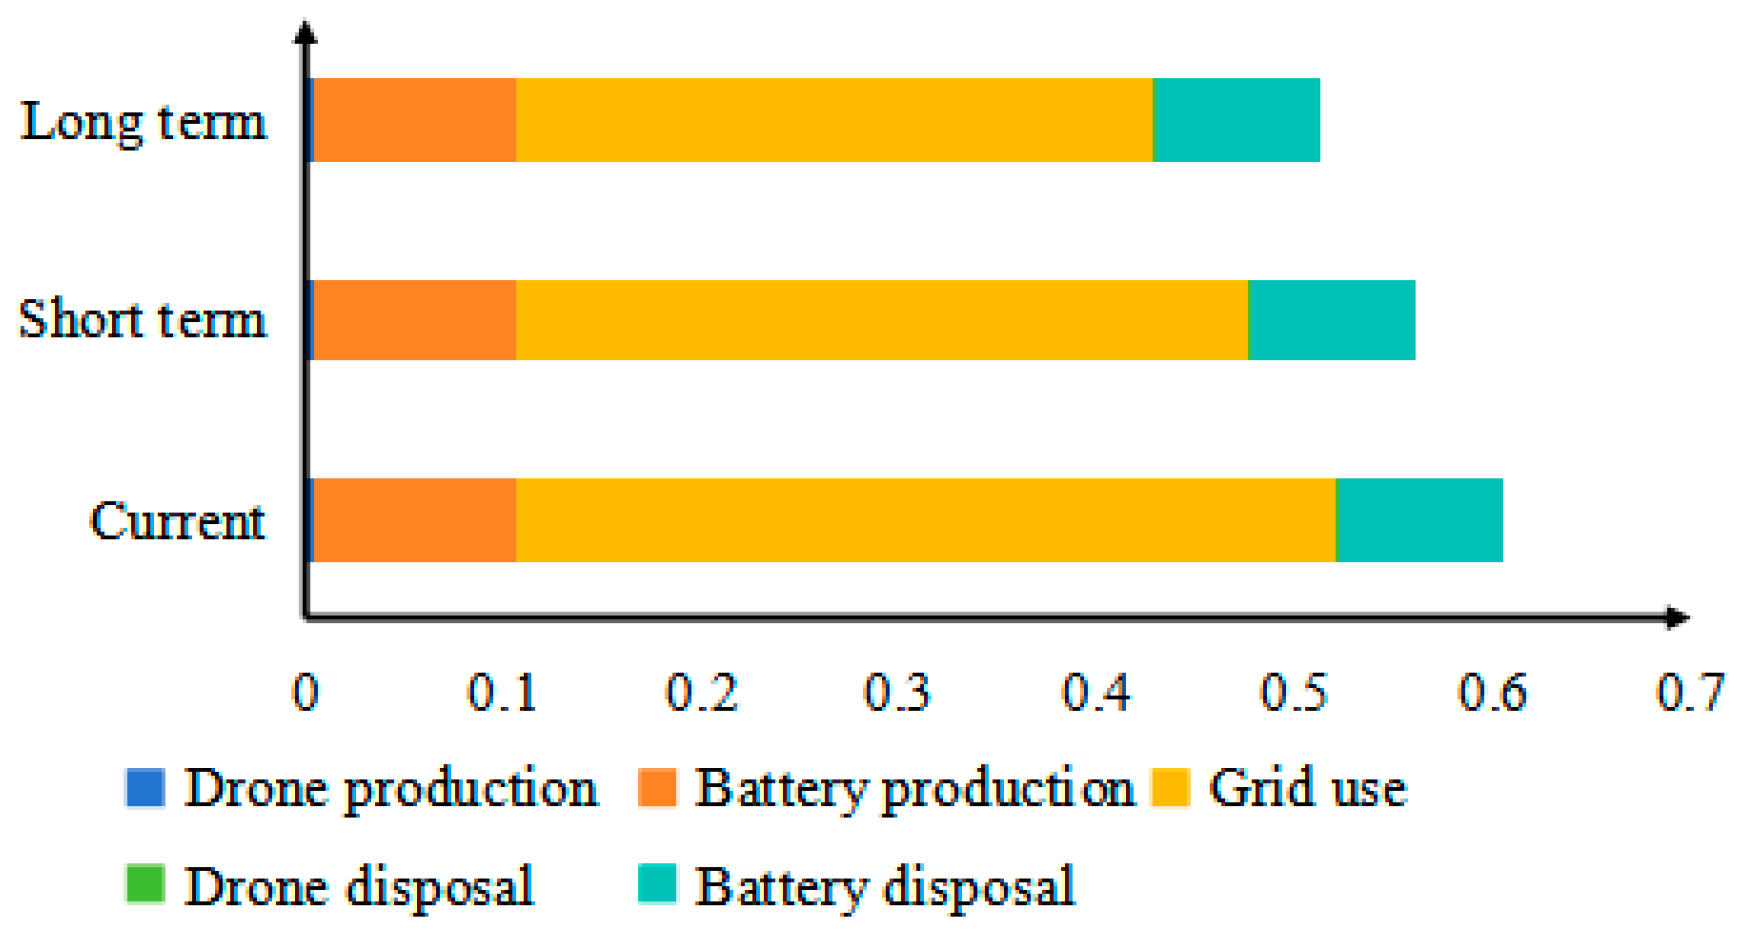
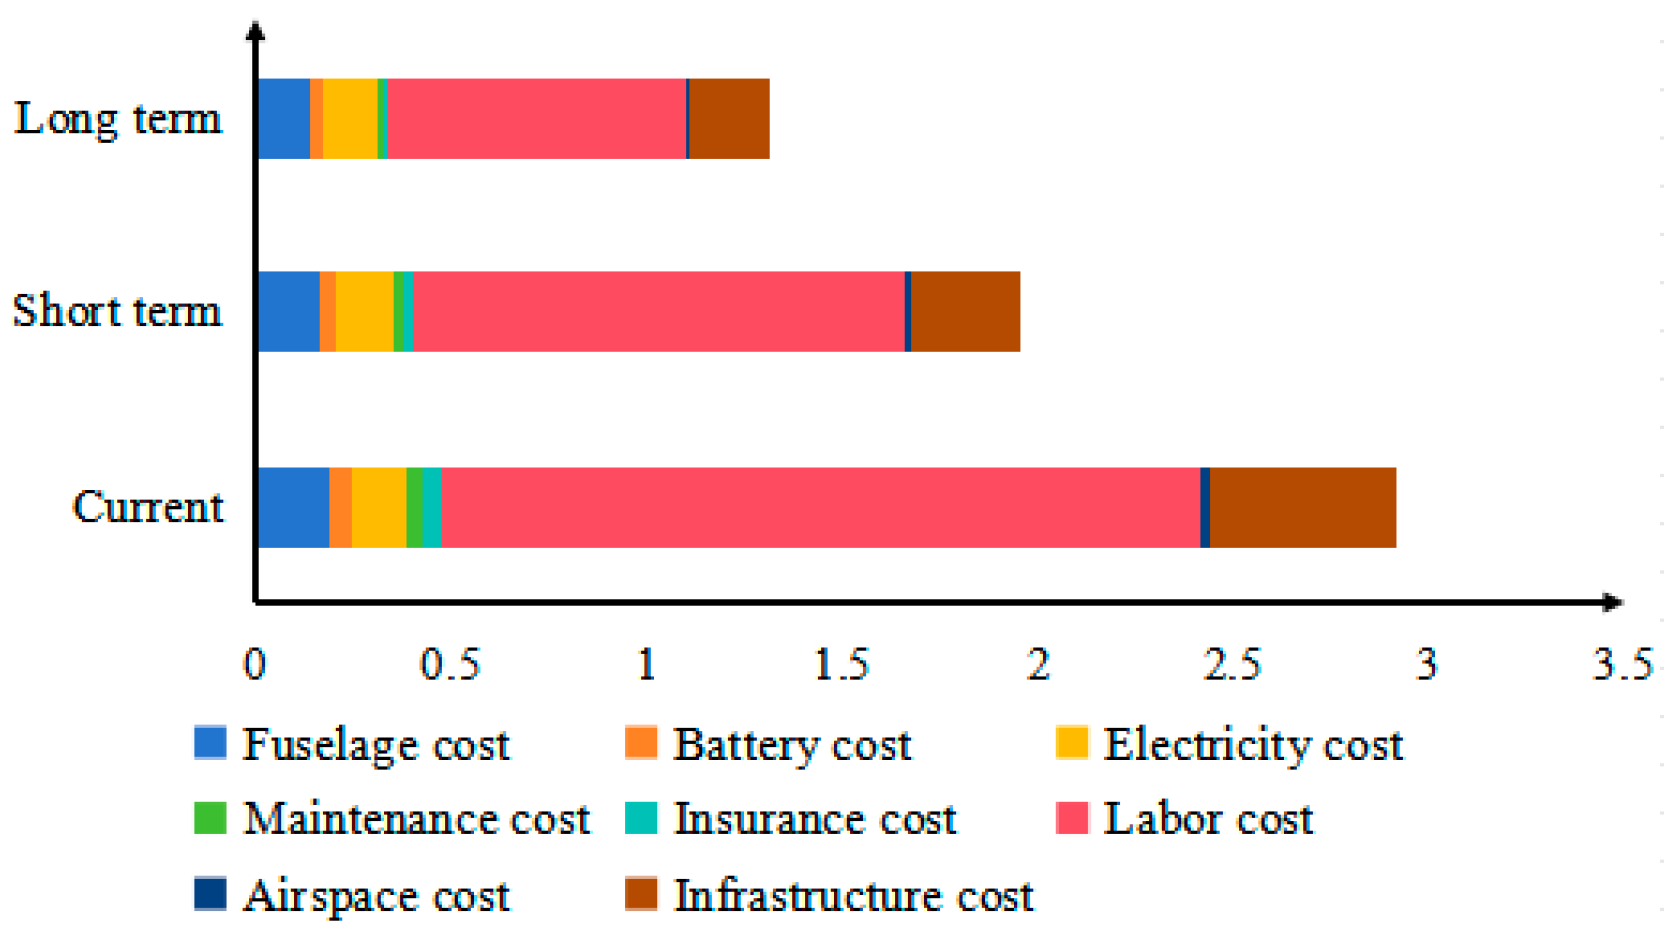
From the environmental perspective, a more detailed analysis of life cycle emissions is conducted, with the comparison of CO2 emissions across different phases of the drone life cycle illustrated in Figure 9. Meanwhile, from the economic dimension, an analysis of the total cost of ownership is presented, as shown in Figure 10. A more detailed analysis of CO2 emissions across drone life-cycle phases is illustrated in Figure 9, with total cost of ownership analyzed in Figure 10.
Figure 9.
Comparison of life cycle emissions.
Figure 10.
Composition of total cost of ownership.
According to Figure 9, battery production generates 25,476.87 kg CO2e, which is quite higher than the 1247.69 kg CO2e emitted from drone manufacturing, accounting for 94.7% of the production-stage emissions. At the end-of-life stage, battery disposal emissions also far exceed those from the drone fuselage. Overall, battery-related emissions account for 30.4% of total life cycle emissions, indicating that the battery system is a key contributor to the carbon footprint of drone logistics. During the use phase, grid electricity dominates emissions, reaching 103,045.8 kg CO2e (68% of total emissions). Therefore, improving battery manufacturing and recycling processes, along with increasing the share of renewable electricity, is essential for further emission reduction.
According to Figure 10, labor cost accounts for the largest share of the TCO per parcel (71%), followed by infrastructure cost (13%) and fuselage cost (7%). Electricity, maintenance, and insurance costs contribute 3%, 2%, and 2%, respectively. Overall, labor and equipment-related costs are the main drivers of TCO. Future reductions can be achieved by enhancing automation to decrease labor input, as well as by improving equipment durability and economies of scale to reduce equipment-related cost.
5.3. Sensitivity Analysis
To further evaluate the potential of drones in sustainable logistics, this study conducts a multidimensional sensitivity comparison between drones and electric trucks. To ensure cross-modal consistency, both models are constructed under unified lifecycle system boundaries, functional units, and demand scales. The electric truck model adopts a structurally analogous benefit accounting framework while incorporating mode-specific operational characteristics. Detailed formulations and parameter settings are provided in Appendix A and Appendix B.
5.3.1. Market Demand Changes
With the rapid development of e-commerce, market demand for drone delivery is expected to increase substantially. This rising demand will profoundly reshape the layout of logistics networks, particularly in terms of customer scale. Thus, this section incorporates customer number adjustments into the sensitivity analysis framework, aiming to evaluate the performance of drones under different demand scenarios more comprehensively. Based on Section 5.2.1, we have obtained ten sets of drone dispatching results. Combined with the dispatching schemes for electric trucks, we have calculated key indicators such as number of vehicles, emissions per parcel and cost per parcel. The comparison results are shown in Table 3.
Table 3.
Comparison of the logistics benefits between drones and electric trucks under different customer scale scenarios.
According to Table 3, as the customer scale increases from 50 to 500, both delivery modes exhibit declining per-parcel emissions and costs, indicating clear economies of scale. For drones, per-parcel emissions decrease from 0.634 to 0.578 kg CO2e and costs go from 4.257 to €4.155, showing limited reductions. In contrast, electric trucks demonstrate more pronounced scale effects, with emissions declining from 0.765 to 0.572 kg CO2e and costs from 2.752 to €2.373.
Drones exhibit lower emissions at small scales, whereas electric trucks outperform drones in both environmental and economic performance at larger scales (around 400 customers), due to improved route consolidation and load factors. Overall, electric trucks are more suitable for large-scale delivery, while drones can serve as a complementary option for small-scale or dispersed demand. Therefore, logistics system planning should jointly deploy drones and electric trucks according to customer scale to achieve optimal environmental and economic performance.
5.3.2. Charging Strategy Selection
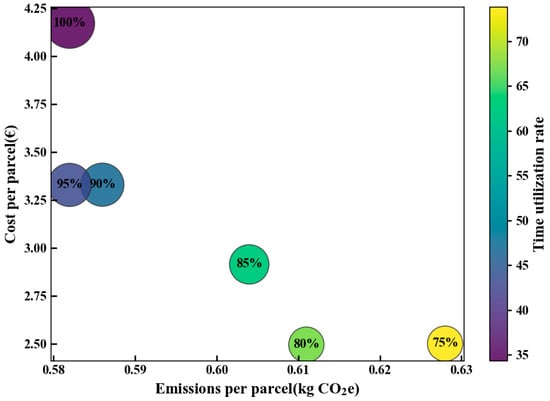
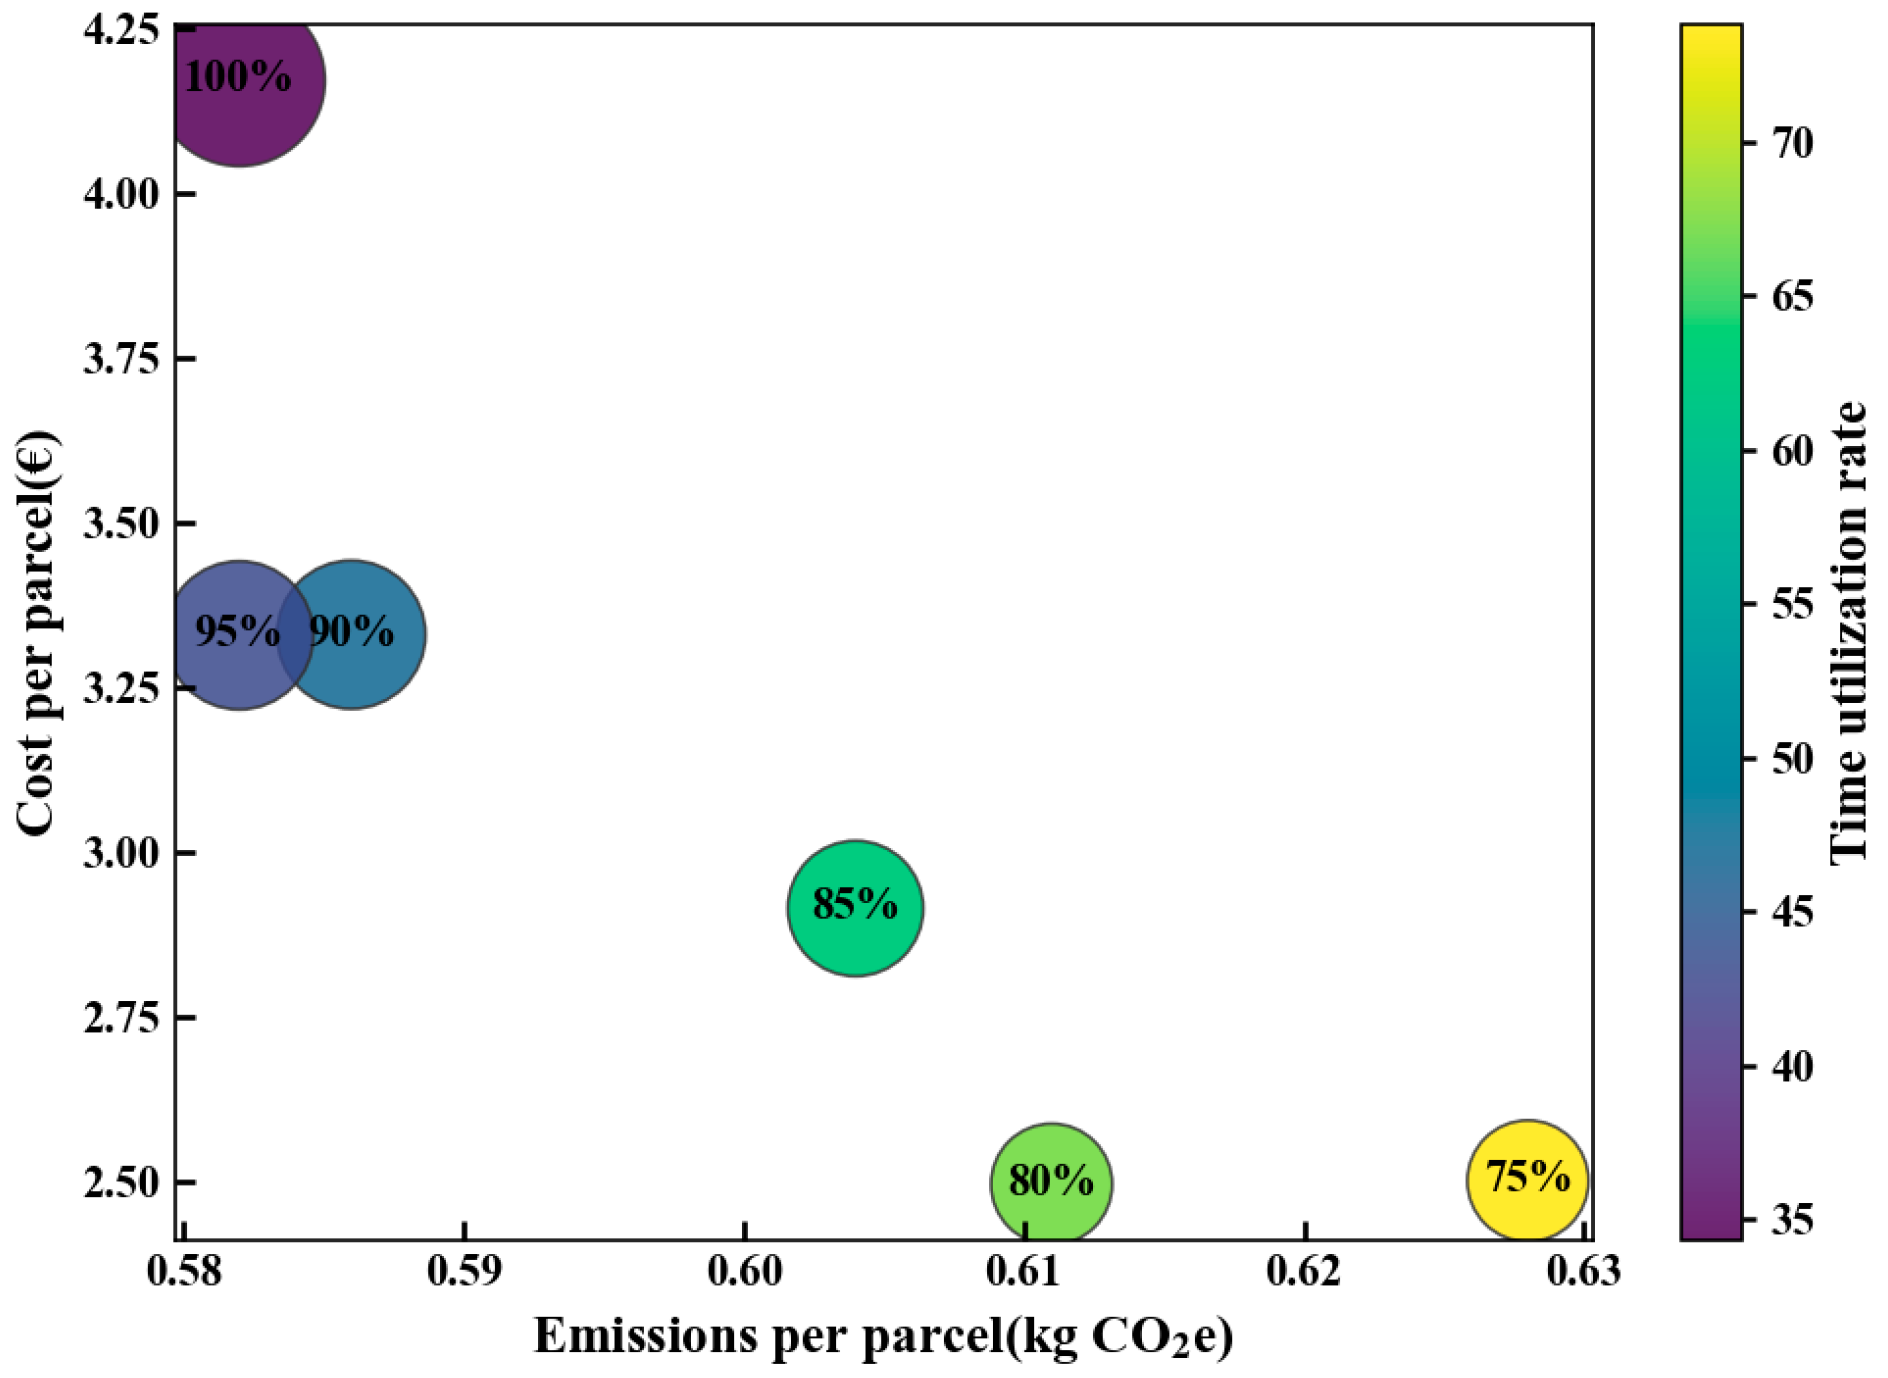
Under the established dispatching framework, the operational efficiency of drones is strongly influenced by charging time, which was identified as a key limiting factor in the baseline scenario. The segmented linear charging model developed in Section 4.2.2 indicates a nonlinear charging pattern, where charging efficiency decreases significantly at high state-of-charge levels, leading to substantial time losses when pursuing full battery replenishment. Therefore, charging strategy is incorporated into the sensitivity analysis by introducing a maximum charging threshold parameter. Six threshold levels (75%, 80%, 85%, 90%, 95%, and 100%) are considered. For each scenario, optimal dispatching solutions are obtained, and key indicators, including number of drones, emissions per parcel, cost per parcel, and time utilization rate, are calculated. The comparative results are presented in Table 4 and Figure 11.
Table 4.
Comparison of drone logistics benefits under different charging strategy scenarios.
Figure 11.
Comparison of drone logistics benefits under different charging strategy scenarios.
According to Table 4, the evaluation indicators exhibit consistent trends across different maximum charging threshold scenarios. As the maximum charging threshold decreases, the number of drones and cost per parcel generally decline, while the time utilization rate increases significantly, indicating that shorter charging times enhance drone turnover efficiency and reduce system scale requirements. However, emissions per parcel show an opposite trend, mainly because lower thresholds reduce the service range per trip and increase return and charging frequencies, thereby raising total energy consumption.
Two critical turning points are identified. Between the 95% and 100% thresholds, the difference in unit emissions is negligible, but full charging significantly reduces time utilization and requires more drones, indicating clear disadvantages. Between the 75% and 80% thresholds, although time utilization further improves, transportation costs increase, suggesting diminishing operational efficiency at excessively low thresholds. Overall, the 80–95% range achieves a favorable trade-off. In practice, firms may prefer 90–95% thresholds under government incentives to reduce emissions, while cost- and time-driven decisions may favor around 80%, with the 85% strategy showing a balanced performance.
5.3.3. Future Technological Advancements
When assessing the performance of logistics transportation systems, conclusions based solely on the current technological level are inherently stage-specific. Therefore, it is necessary to introduce future technological advancement scenarios to characterize the evolution of key parameters over time. In this study, future technological progress is divided into two stages: short-term (5 years) and long-term (5–10 years).
Within this framework, not all indicators are expected to change significantly with technological progress. Considering technological feasibility and structural relevance, this study selects the grid emission factor, equipment acquisition cost, and full charging time as the core evolving parameters. The grid emission factor values are derived from ref. [38]. The long-term scenario adopts the projected 2035 value, while the short-term scenario is estimated according to the reported trend. Cost-related parameters and full charge time are modeled using learning curve theory, with proportional reduction factors of 87.5% (short-term) and 75% (long-term) relative to the baseline values, following the staged scenario modeling approaches in refs. [3,11].
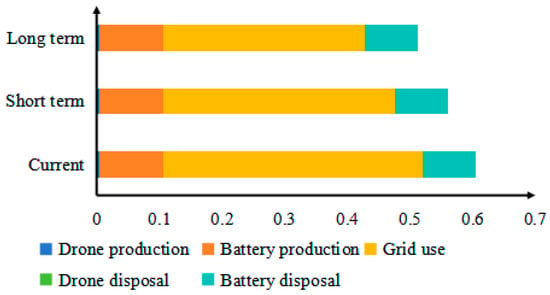
It should be noted that these parameters are intended to capture relative technological evolution trends. Since technological progress in practice typically involves simultaneous improvements in multiple dimensions, proportional multi-parameter adjustments are adopted to reflect system-level co-evolution rather than isolated single-parameter variation. To ensure comparability across scenarios, a unified charging strategy of 85% is adopted in all scenarios. Detailed parameter settings are summarized in Appendix B. The comparative assessment results under short-term and long-term scenarios are obtained in Table 5. Meanwhile, Figure 12 and Figure 13 present stacked bar charts illustrating the breakdown of emission and cost reductions.
Table 5.
Comparative assessment results of logistics benefits for drones and electric trucks under short-term and long-term scenarios.
Figure 12.
Breakdown evolution of drone emission reduction.
Figure 13.
Breakdown evolution of drone cost reduction.
According to Table 5, Figure 12 and Figure 13, in terms of environmental performance, per-parcel emissions of drones and electric trucks are nearly identical, indicating no clear environmental advantage for drones under current conditions. With technological progress, drone emissions decline to 0.56 kg CO2e in the short term and 0.512 kg CO2e in the long term, driven mainly by grid decarbonization, while reductions for electric trucks are comparatively smaller.
In terms of economic performance, drones exhibit a baseline cost disadvantage. However, costs decrease substantially to €1.951 and €1.308 in the short- and long-term scenarios. Decomposition analysis indicates that labor cost reduction associated with increased automation and multi-drone supervision is the most influential contributor to total cost decline, while equipment and infrastructure costs also decrease due to technological learning and scale effects.
In terms of temporal performance, drones consistently outperform electric trucks in fastest delivery time, a metric largely determined by modal characteristics. Average delivery time further declines with improved charging efficiency, accompanied by higher time utilization, whereas truck performance remains constrained by road conditions.
In summary, as technology advances from the current to the long-term stages, drones demonstrate significant improvements across environmental, economic, and time-efficiency dimensions, highlighting their potential for sustainable integration into future urban low-carbon, high-efficiency logistics systems.
5.4. Strategic Recommendations
From a corporate perspective, under the modeled multi-node continuous dispatching scenario, the overall performance of drone logistics depends primarily on the rationality of scheduling, fleet size, and operational strategies rather than any single technical parameter. Sensitivity analysis indicates that drones exhibit high operational flexibility across multiple dimensions, providing opportunities to offset current cost disadvantages through refined management. Firms should prioritize optimizing scheduling to improve fleet utilization, and match fleet size to dispersed or time-sensitive demand. Regarding charging strategies, a maximum charge level between 80% and 95% provides balanced system performance under the defined operational and demand conditions, with adjustments possible depending on cost, efficiency, or low-carbon objectives. Labor remains the largest cost component, and investments in automation, multi-drone coordination, and intelligent task allocation can increase the number of drones managed per operator, hence enhancing long-term economic competitiveness.
From a governmental perspective, drone logistics represents not only a novel delivery mode but also a key component of urban low-carbon transport systems, requiring a balance between emission reduction, economic efficiency, and public governance costs. In the current stage, with per-parcel costs about €0.5 higher than electric trucks, transitional subsidies may help offset initial economic disadvantages under the modeled cost structure and support early-stage market development. In the short term, as costs drop below those of trucks, subsidies could be gradually adjusted and linked to low-carbon operations, efficient charging, and automated scheduling. In the long term, when drones achieve clear advantages in cost and emissions, direct operational subsidies should be phased out in favor of systemic support, including R&D, shared infrastructure, and battery recycling. Policy coordination with the energy and manufacturing sectors can further enhance environmental outcomes. Overall, the full realization of drone logistics benefits depends on both refined corporate operations and phased government guidance, enabling drones and electric trucks to complement each other and support low-carbon, high-efficiency urban delivery systems.
6. Conclusions
This paper develops a comprehensive framework to evaluate the environmental, economic, and temporal performance of large-scale urban drone logistics, together with a multi-objective scheduling model that incorporates dynamic payload and charging behavior. Compared with existing fragmented assessment or simplified routing studies, the proposed framework integrates realistic operational modeling with life-cycle transparency and cross-modal comparability. The assessment system integrates life cycle emissions including indirect charging emissions, total cost of ownership with refined labor and infrastructure cost structures, and a structured temporal evaluation module comprising fastest delivery time, average delivery time, and time utilization rate, thereby establishing a tri-dimensional assessment architecture. An improved genetic algorithm is designed to solve the continuous multi-node dispatching problem. Ablation experiments confirm its superior solution accuracy compared with conventional algorithms. Sensitivity analyses considering market demand, charging strategies, and future technological progress are further conducted to evaluate long-term sustainability.
The results show that: (i) drone life cycle emissions are mainly driven by electricity generation and battery production and disposal, while total cost per parcel is dominated by labor and infrastructure costs; (ii) electric trucks exhibit economies of scale in large and centralized scenarios, whereas drones demonstrate greater flexibility and emission advantages under small-scale or dispersed demand, with an optimal charging threshold around 85%; and (iii) grid decarbonization and automation improvements will further enhance the environmental, economic, and temporal performance of drones, indicating strong long-term sustainability potential.
Overall, this study advances the benefit assessment framework and large-scale dispatch optimization theory for drone logistics, providing quantitative support for operational planning and policymaking. Under the assumed scenario, enterprises should adopt differentiated fleet configurations and dynamic charging strategies within 80% to 95%, while governments may maintain targeted delivery subsidies of approximately €0.5 per order together with long-term supportive policies to promote orderly deployment.
It should be noted that although the proposed framework aims to enhance structural realism, several simplifying assumptions are retained, including fixed node demand, constant wind conditions, and predefined cruising speeds. While the selected 200-node configuration approximates the pickup station density of the studied urban area, uncertainties remain regarding future electricity mix transitions, automation development, and market demand evolution. Accordingly, the quantitative outcomes and derived operational or policy implications should be interpreted as scenario-contingent analytical insights rather than universally transferable solutions. Future research may further strengthen the framework by incorporating empirical operational datasets, stochastic demand patterns, heterogeneous customer time sensitivity, weather and airspace constraints, and monetized time-value modeling, as well as by applying the model to diverse regional and regulatory environments to further examine external validity.
Supplementary Materials
The following supporting information can be downloaded at: https://www.mdpi.com/article/10.3390/aerospace13040369/s1.
Author Contributions
Conceptualization, D.B. and J.T.; methodology, D.B. and Z.Z.; software, Z.Z., J.C.; investigation, D.B., J.T., and J.C.; writing—original draft preparation, D.B. and Z.Z.; writing—review and editing, J.T., Y.Y., and Y.L.; funding acquisition, D.B. and J.T. All authors have read and agreed to the published version of the manuscript.
Funding
This research was funded by the State Key Laboratory of Air Traffic Management System [grant numbers SKLATM202406].
Data Availability Statement
The datasets used and generated during the current study are described in detail within the article. The base geographic data are derived from publicly accessible urban geographic information service platforms, and additional synthetic instances are generated according to the procedures specified in Section 5.1. The processed dataset and representative instance files are provided as Supplementary Materials. Due to the stochastic nature of instance generation, specific realizations may vary, while the methodological framework remains reproducible.
Acknowledgments
The authors wish to express their sincere gratitude to the editor and the anonymous reviewers for their insightful comments and constructive feedback, which have significantly contributed to the improvement and clarification of this manuscript.
Conflicts of Interest
The authors declare no conflicts of interest.
Appendix A
To ensure the research case possesses high real-world representativeness and reproducibility, this paper selects the Geely Remote Star Intelligence H8E pure electric light truck as the subject for studying ground logistics transportation operations. This section only presents some of the differential formulas and parameters.
- (1)
- Benefit assessment system
The logistics benefit assessment system for electric trucks is similar to that for drones, with the following differences: (1) The service life of electric trucks is longer, so the assessment cycle is set to 10 years. (2) Electric trucks are less affected by weather, so the number of operation days per year is 300. (3) Electric trucks do not incur airspace or takeoff/landing site costs. (4) The labor cost of electric trucks is determined by the fleet size and the duration of operation. Other than these differences, the parameters involved in the assessment are different, with the specific values listed in Appendix B.
- (2)
- Energy consumption model
The delivery mode of electric trucks is similar to that of drones, with the main difference being the distinct parameters of electric trucks, especially their payload capacity and battery capacity, which allow them to carry more parcels in a single trip. In addition, electric trucks operate within urban road networks. On the one hand, the roads between delivery stations are not straight lines but rather winding paths; on the other hand, urban traffic conditions are complex, requiring consideration of congestion, traffic lights, and other factors. Therefore, we assume that the acceleration frequency coefficient between adjacent nodes is , and the braking and dwell time is , with representing the distance between customer nodes. The ideal driving mode for electric truck deliveries is shown in Figure A1.
Figure A1.
Ideal driving mode for electric truck delivery.
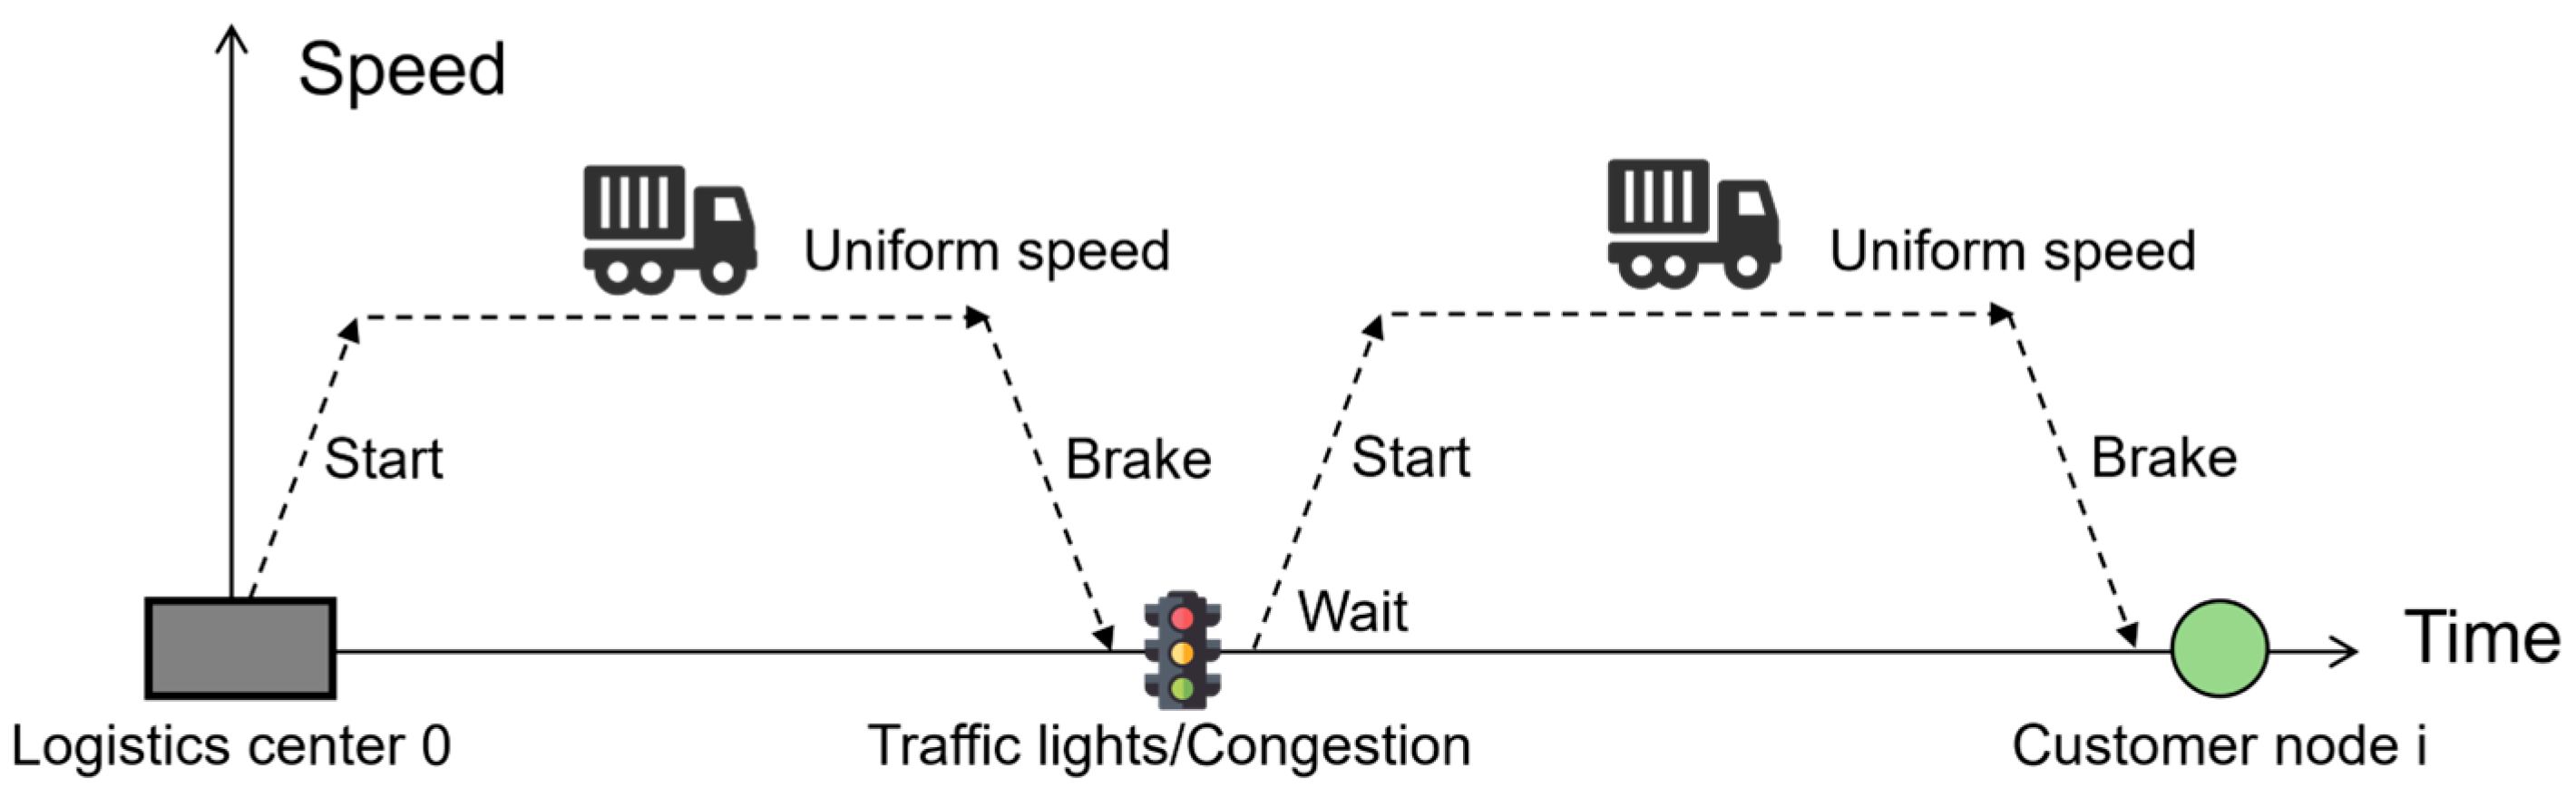
The energy consumption model for electric trucks refers to the summary by ref. [4]. Building upon this theoretical foundation, we further incorporate urban road network conditions into our analysis. The formula for is shown in Equation (A1).
where represents the power demand during the electric truck delivery process. The formula is given in Equation (A2).
where:
: power required to overcome the air drag of the electric truck body.
: power required to overcome rolling resistance.
: power required to overcome gravitational force on inclined roads.
: power required to overcome inertial force.
The detailed formulations for the specific indicators are provided in Appendix B Table A7.
Appendix B
Table A1.
Parameters for drone performance.
Table A2.
Parameters for drone operating environments.
Table A3.
Parameters for the benefit assessment system of drone delivery.
Table A4.
Formulas for drone energy consumption model.
Table A5.
Parameters for drone energy consumption model.
Table A6.
Various differentiated parameters for the benefit assessment system of electric truck delivery.
Table A7.
Formulas for electric truck energy consumption model.
Table A8.
Parameters for electric truck performance and its dispatching model.
Table A9.
Changes in assessment indicators due to future technological advancements.
References
- FAA. Part 107 Small Unmanned Aircraft Regulations; FAA: Washington, DC, USA, 2016.
- Meng, Z.; Zhou, Y.; Li, E.Y.; Peng, X.; Qiu, R. Environmental and economic impacts of drone-assisted truck delivery under the carbon market price. J. Clean. Prod. 2023, 401, 136758. [Google Scholar] [CrossRef] [Scilit]
- Baldisseri, A.; Siragusa, C.; Seghezzi, A.; Mangiaracina, R.; Tumino, A. Truck-based drone delivery system: An economic and environmental assessment. Transp. Res. Part D Transp. Environ. 2022, 107, 103296. [Google Scholar] [CrossRef] [Scilit]
- Kirschstein, T. Comparison of energy demands of drone-based and ground-based parcel delivery services. Transp. Res. Part D Transp. Environ. 2020, 78, 102209. [Google Scholar] [CrossRef] [Scilit]
- Bao, D.; Zhang, Z.; Kang, D. Charge-discharge coupling strategy for dispatching problems with electric tractors at airports. J. Air Transp. Manag. 2025, 124, 102733. [Google Scholar] [CrossRef] [Scilit]
- Bao, D.; Yan, Y.; Li, Y.; Chu, J. The Future of Last-Mile Delivery: Lifecycle Environmental and Economic Impacts of Drone-Truck Parallel Systems. Drones 2025, 9, 54. [Google Scholar] [CrossRef] [Scilit]
- Figliozzi, M.A. Lifecycle modeling and assessment of unmanned aerial vehicles (Drones) CO2e emissions. Transp. Res. Part D Transp. Environ. 2017, 57, 251–261. [Google Scholar] [CrossRef] [Scilit]
- Stolaroff, J.K.; Samaras, C.; O’Neill, E.R.; Lubers, A.; Mitchell, A.S.; Ceperley, D. Energy use and life cycle greenhouse gas emissions of drones for commercial package delivery. Nat. Commun. 2018, 9, 409. [Google Scholar] [CrossRef] [Scilit]
- Park, J.; Kim, S.; Suh, K. A comparative analysis of the environmental benefits of drone-based delivery services in urban and rural areas. Sustainability 2018, 10, 888. [Google Scholar] [CrossRef] [Scilit]
- Palmer, K.; Tate, J.E.; Wadud, Z.; Nellthorp, J. Total cost of ownership and market share for hybrid and electric vehicles in the UK, US and Japan. Appl. Energy 2018, 209, 108–119. [Google Scholar] [CrossRef] [Scilit]
- Doole, M.; Ellerbroek, J.; Hoekstra, J. Estimation of traffic density from drone-based delivery in very low level urban airspace. J. Air Transp. Manag. 2020, 88, 101862. [Google Scholar] [CrossRef] [Scilit]
- Pugliese, L.D.P.; Guerriero, F.; Macrina, G. Using drones for parcels delivery process. Procedia Manuf. 2020, 42, 488–497. [Google Scholar] [CrossRef] [Scilit]
- Carlsson, J.G.; Song, S. Coordinated logistics with a truck and a drone. Manag. Sci. 2018, 64, 4052–4069. [Google Scholar] [CrossRef] [Scilit]
- Dorling, K.; Heinrichs, J.; Messier, G.G.; Magierowski, S. Vehicle routing problems for drone delivery. IEEE Trans. Syst. Man Cybern. Syst. 2016, 47, 70–85. [Google Scholar] [CrossRef] [Scilit]
- Hassija, V.; Saxena, V.; Chamola, V. Scheduling drone charging for multi-drone network based on consensus time-stamp and game theory. Comput. Commun. 2020, 149, 51–61. [Google Scholar] [CrossRef] [Scilit]
- Machovec, D.; Siegel, H.J.; Crowder, J.A.; Pasricha, S.; Maciejewski, A.A.; Friese, R.D. Surveillance mission scheduling with unmanned aerial vehicles in dynamic heterogeneous environments. J. Supercomput. 2023, 79, 13864–13888. [Google Scholar] [CrossRef] [Scilit]
- Torabbeigi, M.; Lim, G.J.; Kim, S.J. Drone delivery scheduling optimization considering payload-induced battery consumption rates. J. Intell. Robot. Syst. 2020, 97, 471–487. [Google Scholar] [CrossRef] [Scilit]
- Yoon, J.J. The Traveling Salesman Problem with Multiple Drones: An Optimization Model for Last-Mile Delivery. Doctoral Dissertation, Massachusetts Institute of Technology, Cambridge, MA, USA, 2018. [Google Scholar]
- Liu, Y. An optimization-driven dynamic vehicle routing algorithm for on-demand meal delivery using drones. Comput. Oper. Res. 2019, 111, 1–20. [Google Scholar] [CrossRef] [Scilit]
- Darrah, M.; Niland, W.; Stolarik, B. Multiple UAV dynamic task allocation using mixed integer linear programming in a SEAD mission. In Infotech@ Aerospace; Infotech Aerospace Services, Inc.: Isabela, Puerto Rico, 2005; p. 7164. [Google Scholar]
- Bouman, P.; Agatz, N.; Schmidt, M. Dynamic programming approaches for the traveling salesman problem with drone. Networks 2018, 72, 528–542. [Google Scholar] [CrossRef] [Scilit]
- Peng, K.; Du, J.; Lu, F.; Sun, Q.; Dong, Y.; Zhou, P.; Hu, M. A hybrid genetic algorithm on routing and scheduling for vehicle-assisted multi-drone parcel delivery. IEEE Access 2019, 7, 49191–49200. [Google Scholar] [CrossRef] [Scilit]
- Sacramento, D.; Pisinger, D.; Ropke, S. An adaptive large neighborhood search metaheuristic for the vehicle routing problem with drones. Transp. Res. Part C Emerg. Technol. 2019, 102, 289–315. [Google Scholar] [CrossRef] [Scilit]
- Zhang, T.; Chai, L. Path planning for UAVs and multiple targets. Command Inf. Syst. Technol. 2020, 11, 32–36. [Google Scholar]
- Luo, Q.; Wu, G.; Ji, B.; Wang, L.; Suganthan, P.N. Hybrid multi-objective optimization approach with pareto local search for collaborative truck-drone routing problems considering flexible time windows. IEEE Trans. Intell. Transp. Syst. 2021, 23, 13011–13025. [Google Scholar] [CrossRef] [Scilit]
- De Freitas, J.C.; Penna, P.H.V. A variable neighborhood search for flying sidekick traveling salesman problem. Int. Trans. Oper. Res. 2020, 27, 267–290. [Google Scholar] [CrossRef] [Scilit]
- Xing, Y.; Carlson, C.; Yuan, H. Optimize path planning for UAV COVID-19 test kits delivery system by hybrid reinforcement learning. In 2022 IEEE 12th Annual Computing and Communication Workshop and Conference (CCWC); IEEE: Piscataway, NJ, USA, 2022; pp. 0177–0183. [Google Scholar]
- Zhang, J.; Campbell, J.F.; Sweeney, D.C., II; Hupman, A.C. Energy consumption models for delivery drones: A comparison and assessment. Transp. Res. Part D Transp. Environ. 2021, 90, 102668. [Google Scholar] [CrossRef] [Scilit]
- D’Andrea, R. Guest editorial can drones deliver? IEEE Trans. Autom. Sci. Eng. 2014, 11, 647–648. [Google Scholar] [CrossRef] [Scilit]
- Troudi, A.; Addouche, S.-A.; Sofiene, D.; El Mhamedi, A. Sizing of the drone delivery fleet considering energy autonomy. Sustainability 2018, 10, 3344. [Google Scholar] [CrossRef] [Scilit]
- Van Huynh, D.; Do-Duy, T.; Nguyen, L.D.; Le, M.-T.; Vo, N.-S.; Duong, T.Q. Real-time optimized path planning and energy consumption for data collection in unmanned ariel vehicles-aided intelligent wireless sensing. IEEE Trans. Ind. Inform. 2021, 18, 2753–2761. [Google Scholar] [CrossRef] [Scilit]
- Pelletier, S.; Jabali, O.; Laporte, G.; Veneroni, M. Battery degradation and behaviour for electric vehicles: Review and numerical analyses of several models. Transp. Res. Part B Methodol. 2017, 103, 158–187. [Google Scholar] [CrossRef] [Scilit]
- Lin, B.; Ghaddar, B.; Nathwani, J. Deep reinforcement learning for the electric vehicle routing problem with time windows. IEEE Trans. Intell. Transp. Syst. 2021, 23, 11528–11538. [Google Scholar] [CrossRef] [Scilit]
- Goeke, D.; Schneider, M. Routing a mixed fleet of electric and conventional vehicles. Eur. J. Oper. Res. 2015, 245, 81–99. [Google Scholar] [CrossRef] [Scilit]
- Montoya, A.; Guéret, C.; Mendoza, J.E.; Villegas, J.G. The electric vehicle routing problem with nonlinear charging function. Transp. Res. Part B Methodol. 2017, 103, 87–110. [Google Scholar] [CrossRef] [Scilit]
- Pelletier, S.; Jabali, O.; Laporte, G. The electric vehicle routing problem with energy consumption uncertainty. Transp. Res. Part B Methodol. 2019, 126, 225–255. [Google Scholar] [CrossRef] [Scilit]
- Yang, L.; Hao, C.; Chai, Y. Life cycle assessment of commercial delivery trucks: Diesel, plug-in electric, and battery-swap electric. Sustainability 2018, 10, 4547. [Google Scholar] [CrossRef] [Scilit]
- Wei, X.; Tan, X.; Lin, M.; Cheng, J.; Xiang, K.; Ding, S. Calculation and Projection of Carbon Emission Factors for China’s National Power Grid from 2005 to 2035. Integr. Smart Energy 2024, 46, 72–78. [Google Scholar] [CrossRef]
- Fengyi Drone. Ark 40[EB/OL]. Available online: https://www.fyuav.cn/uav/ark-40 (accessed on 10 April 2026).
- Peters, J.F.; Baumann, M.; Zimmermann, B.; Braun, J.; Weil, M. The environmental impact of Li-Ion batteries and the role of key parameters–A review. Renew. Sustain. Energy Rev. 2017, 67, 491–506. [Google Scholar] [CrossRef] [Scilit]
- Zhejiang Geely Remote New Energy Commercial Vehicle Group Co., Ltd. Remote Star Intelligence H7E and H8E Pure Electric Light Truck Owner’s Manual (LE21ABEFCDG). Available online: https://official.geelycv-test.com/service/servicefile/ (accessed on 10 April 2026).

Disclaimer/Publisher’s Note: The statements, opinions and data contained in all publications are solely those of the individual author(s) and contributor(s) and not of MDPI and/or the editor(s). MDPI and/or the editor(s) disclaim responsibility for any injury to people or property resulting from any ideas, methods, instructions or products referred to in the content. |
© 2026 by the authors. Licensee MDPI, Basel, Switzerland. This article is an open access article distributed under the terms and conditions of the Creative Commons Attribution (CC BY) license.