


Abstract
The cloud spatial uniformity in the test section is crucial for icing wind tunnels in aircraft icing research and airworthiness certification. To achieve uniform supercooled large droplet (SLD) icing conditions, both the spatial variation in droplet size distribution and the concentration should be considered. In this study, the spatial distribution of droplets under three SLD conditions is explored in the Aviation Industry Corporation of China Aerodynamics Research Institute (AVICARI)’s FL-61 icing wind tunnel. Measurements are conducted at 12 test points in vertical and horizontal directions using the holographic airborne cloud particle imager (HACPI) in conjunction with a two-axis traversing system. The droplet images obtained at specific test points below the test section centerline show deformation phenomena for droplets larger than 400 m. Additionally, the aspect ratio of deformed droplets increases with droplet size. The spatial evolution of the median volume diameter (MVD) and liquid water content (LWC) is examined. For two spray arrangements where the activated nozzles are positioned close, the test point where the LWC peak in the vertical direction occurs is higher than that of the MVD peak. Further analysis focuses on the size distribution of droplets in the vertical direction. The results show that the settling effect of the droplets larger than 50 m is evident under a flow velocity of 78 m/s. Meanwhile, the position where large droplets tend to appear lowers as the droplet size increases. Finally, the spatial uniformity of droplet size distributions at the same radial distance is discussed.
1. Introduction
Aircraft icing poses severe threats to aviation safety [1,2,3]. Supercooled droplets in an icing cloud can impact on the airframe surfaces and freeze rapidly, resulting in ice accretion and the subsequent impairment of the aircraft’s aerodynamic performance. To address this challenge, aircraft must undergo tests in specified icing cloud conditions, with icing wind tunnels serving as key ground simulation facilities for icing mechanism research and commercial aircraft certification [4,5]. The Federal Aviation Administration (FAA) has prescribed supercooled droplet icing conditions with the Code of Federal Regulations Title 14 Part 25 (14 CFR Part 25), Appendix C [6] and Appendix O [7]. According to Appendix O, supercooled large droplet (SLD) environments are classified as either freezing drizzle (FZDZ) or freezing rain (FZRA). SLDs are naturally formed through the condensation–collision–coalescence mechanism or through the melting and re-supercooling process of ice crystals [8]. These distinct formation mechanisms lead to a bimodal size distribution of droplets in SLD clouds. While supercooled droplets under Appendix C feature a median volume diameter (MVD) ranging from 15 to 50 m, the maximum droplet diameter for FZDZ is close to 500 m, and that for FZRA is greater than 2000 m. In icing wind tunnels, cloud droplets are generated in the settling chamber by an array of atomization nozzles installed on spray bars. Given the bimodal size distribution, two sets of nozzles with separated air and water supplies are usually utilized to generate droplets within different size ranges [9,10,11]. According to the icing wind tunnel calibration procedure outlined in the Aerospace Recommended Practice document (ARP5905) [12], the key parameters for simulating icing cloud droplets include the MVD and liquid water content (LWC) at the test section centerline, as well as the LWC’s spatial uniformity in the test section. Meanwhile, for icing tests conducted at the same LWC level, the ice accretion shapes vary with different droplet size distributions [13]. To ensure optimal cloud uniformity in the test section, especially for SLD conditions, the spray arrangements must be carefully designed based on simulation results and experimental calibrations for each icing wind tunnel.
Continuous efforts have been made to explore the complex icing cloud flow processes in the major icing wind tunnels around the world. Interactions between droplets and airflow during transport can affect the spatial distribution of droplets with different sizes. As the droplet density is much greater than the gas density in the tunnel, the droplet acceleration is mainly affected by aerodynamic drag and gravity. The National Aeronautics and Space Administration (NASA) Glenn Icing Research Tunnel (IRT) has employed a numerical simulation strategy for icing cloud uniformity characterizing using tunnel speed and droplet size. The simulation predictions of the cloud generated by an individual nozzle and the full complement of nozzles at the test section are compared with the experimental results. The influence of jet and spray bar turbulence on the cloud uniformity is addressed [14]. Other simulation studies on the turbulent structure caused by the spray bar also point out that the design of spray bar seriously affects the spatial distribution of droplets [15,16]. However, the droplet size distributions in these studies failed to cover the SLDs, for which the gravitational settling effect can be significant. In the icing wind tunnel of the China Aerodynamic Research and Development Center (CARDC IWT), an SLD cloud measurement test has been conducted at three measurement positions with the icing calibration grid and Cloud Imaging Probe Grayscale (CIP-GS). The LWC uniformity is evaluated using the local LWC derived from the thickness of the accreted ice on the icing calibration grid. A U-shaped structure of the cloud spatial distribution is observed, which is indicated to be due to the combined effects of gravity and airflow contraction [17]. Moreover, deformed large droplets are captured using CIP-GS, indicating the slip velocity between the droplets and the airflow. This phenomenon has also been analyzed in the IRT using the Phase Doppler Interferometer (PDI) and the shadowgraphy-based particle-tracking velocimetry probe [18,19]. At the Rail Tec Arsenal (RTA) institute [20,21], researchers have conducted studies into droplet trajectories under SLD conditions using simulation and experimental techniques. When activating a single row of spray nozzles, data from the Cloud Imaging Probe (CIP) show that the droplet diameters are constrained to a particular range at a specific air velocity. The computed droplets trajectories are validated by varying the heights of the test points. Other researches at RTA developed a rotating nozzle setup [22], achieving a rather uniform cloud for FZRA condition. When addressing droplet uniformity characterization, traditional techniques usually require a trade-off between precision and efficiency. The icing grid process typically begins after the spray is shut off and requires time-consuming manual measurements in the test section using cooled digital calipers. Furthermore, the icing grid reflects a combined response of droplet impingement and accretion rather than a direct in situ droplet field, and may be influenced by collection efficiency and splashing effects for SLD conditions [23]. Meanwhile, although particle-based probes provide valuable in situ measurements, their fixed mounting positions limit their operational flexibility. Additionally, large droplets can experience collision and breakup upon impacting the probe tips, resulting in the formation of fragments. These fragments are often misidentified as individual particles, which distort the results and leads to incorrect droplet size distribution [24].
To enable the efficient monitoring of cloud spatial distribution in the test section, newly developed experimental methods focus on two directions. One aims to collect signals from a large spatial field at once [25,26], while the other focuses on automatically moving the measurement point of those traditional probes [27,28]. NASA has developed two techniques in succession at the Propulsion Systems Laboratory (PSL) test facility: a laser sheet cloud imaging system and light extinction tomography [25]. These techniques aim to measure the total water content (TWC) and uniformity of the ice crystal cloud. Quantitative planar TWC results can be calculated based on the single-point TWC calibrated previously. The light extinction tomography is subsequently tested and verified with calibrated supercooled droplets conditions in the IRT [29]. For conditions with MVDs of 266 m and 460 m and an air velocity of 150 knots, LWC values were noticeable higher in the central portion compared to those with smaller MVDs. One reason for the phenomenon is considered to be the presence of larger droplets which tend to migrate towards the center. The absence of droplet size distribution data at different locations hinders the ability to substantiate this hypothesis. To investigate the natural migration of droplets to the center of the test section, PSL has also developed a traversing system for both intrusive probes and non-intrusive probes to measure cloud radial variations [27]. The results from the non-intrusive PDI and high-speed imaging (HSI) instruments indicated a decreasing trend in MVD as the test point moved away from the center. Due to physical limitations, measurements with PDI and HSI were restricted to points above the central region. Meanwhile, the LWC was measured using other intrusive probes, including the multiwire probe and the isokinetic probe. During recent SLD condition tests in CARDC IWT [30,31], several particle-based instruments with a quantifiable sampling volume have demonstrated their ability to measure the droplet morphology, size distribution and LWC simultaneously. By integrating these instruments with the traversing system, a more comprehensive and in-depth method for obtaining droplet size distribution and concentration in the test section is enabled.
This study aims to provide a more thorough understanding of the spatial distribution and morphology of droplets under typical SLD conditions. To achieve this, a two-axis traversing system, integrated with the Holographic Airborne for Cloud Particle Imager (HACPI) [30], has been employed in the Aviation Industry Corporation of China Aerodynamics Research Institute (AVICARI)’s FL-61 icing wind tunnel [32]. This system enables the capture of high-resolution droplet images within a well-defined sampling volume, unaffected by variations in airflow or droplet velocities. The study investigates droplets’ spatial distribution at 12 test points along both vertical and horizontal directions. At a specific test point, droplet deformation phenomena are observed. The evolution of MVD and LWC is analyzed in both directions, while the vertical droplet size distributions are examined in further detail. Finally, the spatial uniformity of droplet size distributions at the same radial distance is discussed.
2. Experimental Setup
2.1. Experimental Setup at FL-61 Icing Wind Tunnel
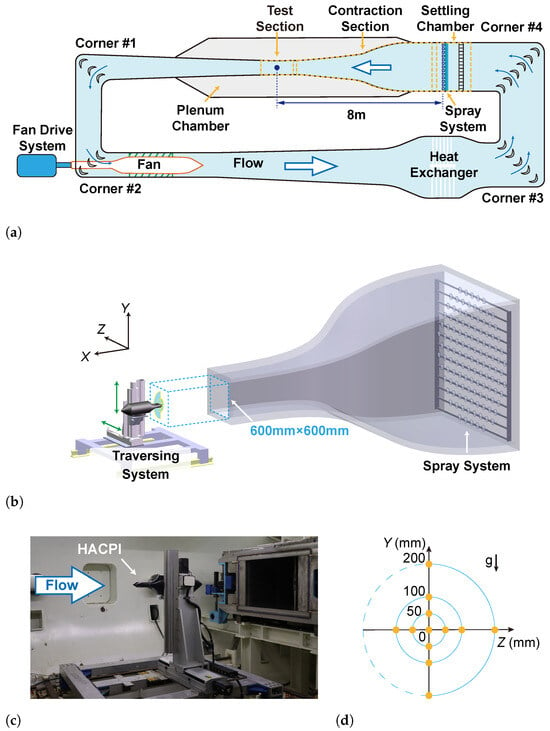
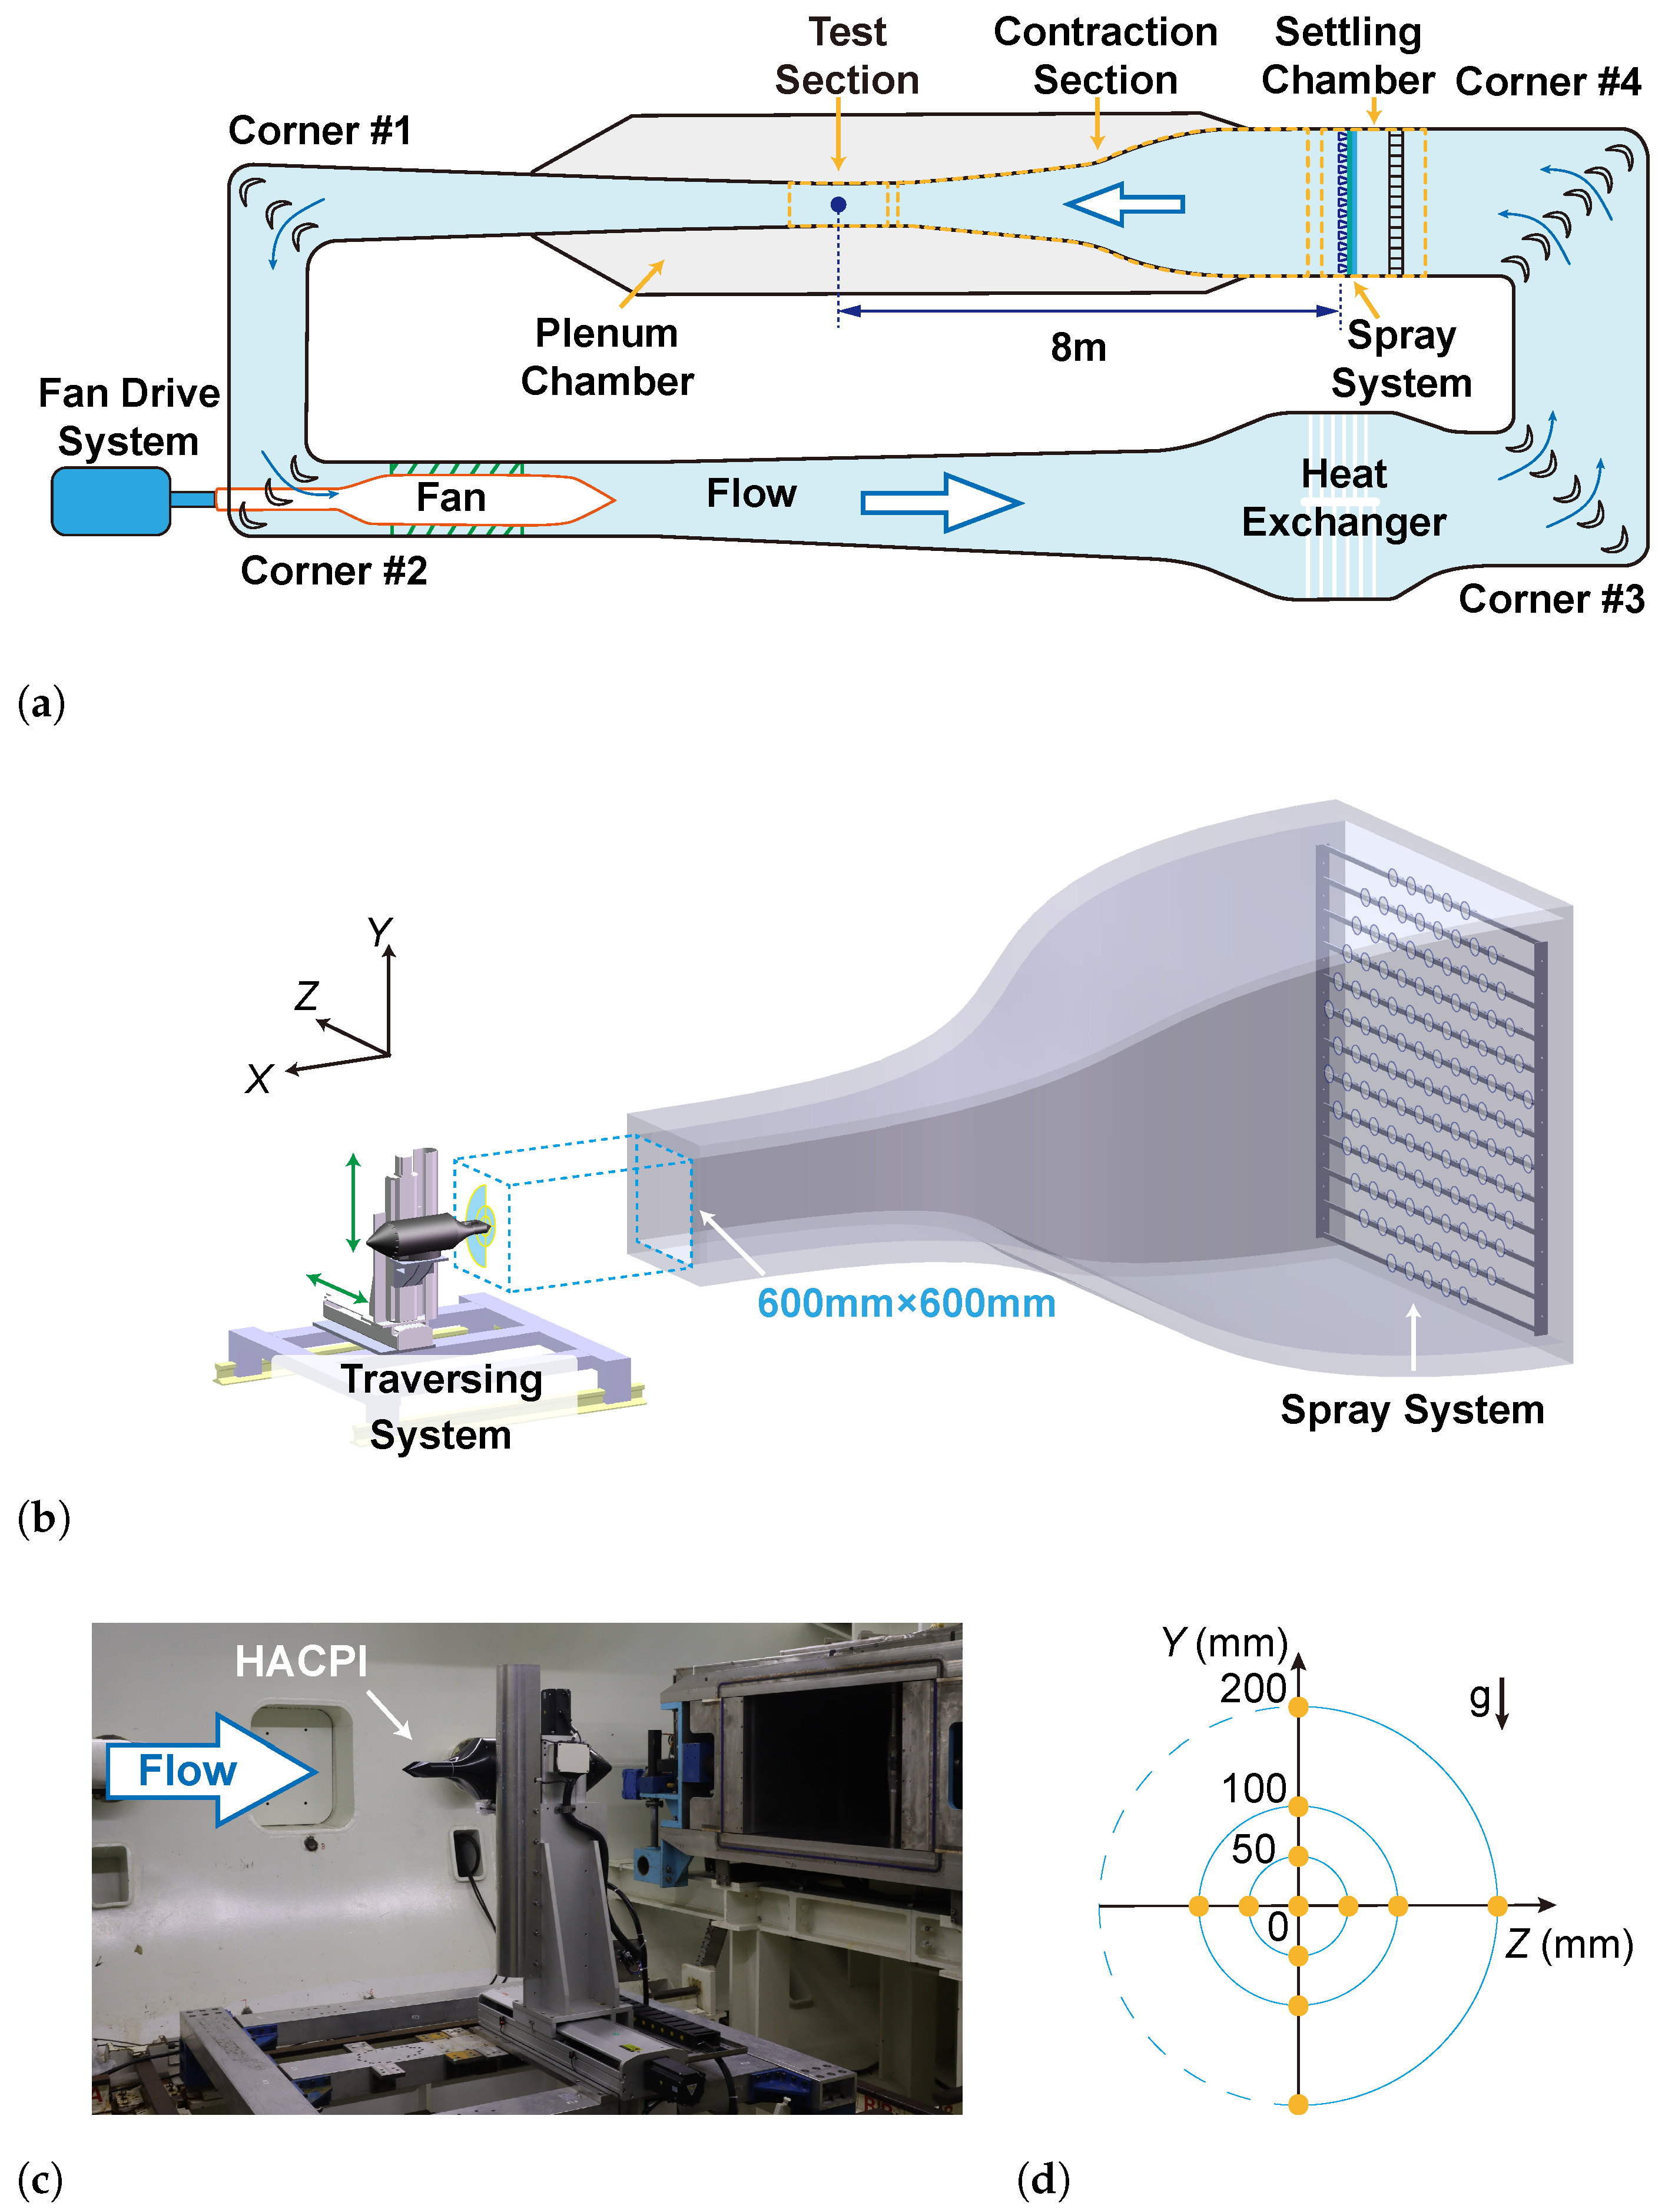
The FL-61 icing wind tunnel is a closed-circuit refrigerated wind tunnel as illustrated in Figure 1a. The fan drive system of this wind tunnel consists of a 5.2 MW main compressor and a 2.5 MW auxiliary compressor. FL-61 typically features a test section that is 0.6 m in width, 0.6 m in height, and 2.7 m in length. The flow field quality in the test section and measurement uncertainty meets the requirement of ARP5905 [12,32]. The spray system is installed in the settling chamber, approximately 8 m upstream of the test section, and comprises 13 rows of spray bars equipped with 121 air-atomizing nozzles. By combining two sets of nozzles, FL-61 has developed SLD cloud simulation capability [33]. One set of nozzles (Spraying Systems Co., Glendale Heights, IL, USA; model 98818), referred to as the Mod-small nozzles, produces droplets with MVD below 50 m to achieve uniform supercooled droplet conditions. Meanwhile, the other nozzles (Spraying Systems Co.; model 98838), referred to as Mod-large nozzles, aim to produce large droplets with MVD over 100 m, enabling the simulation of the freezing drizzle conditions in Appendix O [34]. The water pressure of each row of nozzles can be controlled separately. Besides, each nozzle is equipped with its own water supply pipeline regulated by an electromagnetic valve, which allows for individual control of the spraying status of each nozzle. Therefore, the spray can be adjusted flexibly for the designed test conditions.
Figure 1.
The experimental configuration in the FL-61 icing wind tunnel. (a) The layout of FL-61. The blue dot in the test section indicates the center of the test section. (b) The three dimensional schematic diagram from the settling chamber to the test section. (c) HACPI installation with the traversing system in the test section. (d) The test point matrix in this study.
In this study, a two-axis motorized traversing system has been installed in the test section, as shown in Figure 1b,c. The traversing system is capable of moving instruments or test models along both horizontal and vertical directions via remote control, enhancing operational flexibility and precision. The HACPI is mounted on the system, and cloud measurements are focused at distances of 50 mm, 100 mm, and 200 mm away from the airflow center in both the horizontal and vertical directions. The matrix of 12 test point locations in Cartesian coordinates (Z-Y axes) is shown with orange dots in Figure 1d. The coordinate (0, 0) represents the center of the airflow, which has been calibrated beforehand.
2.2. Test Conditions
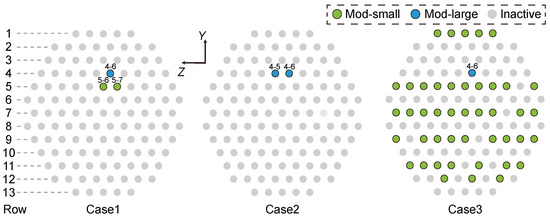
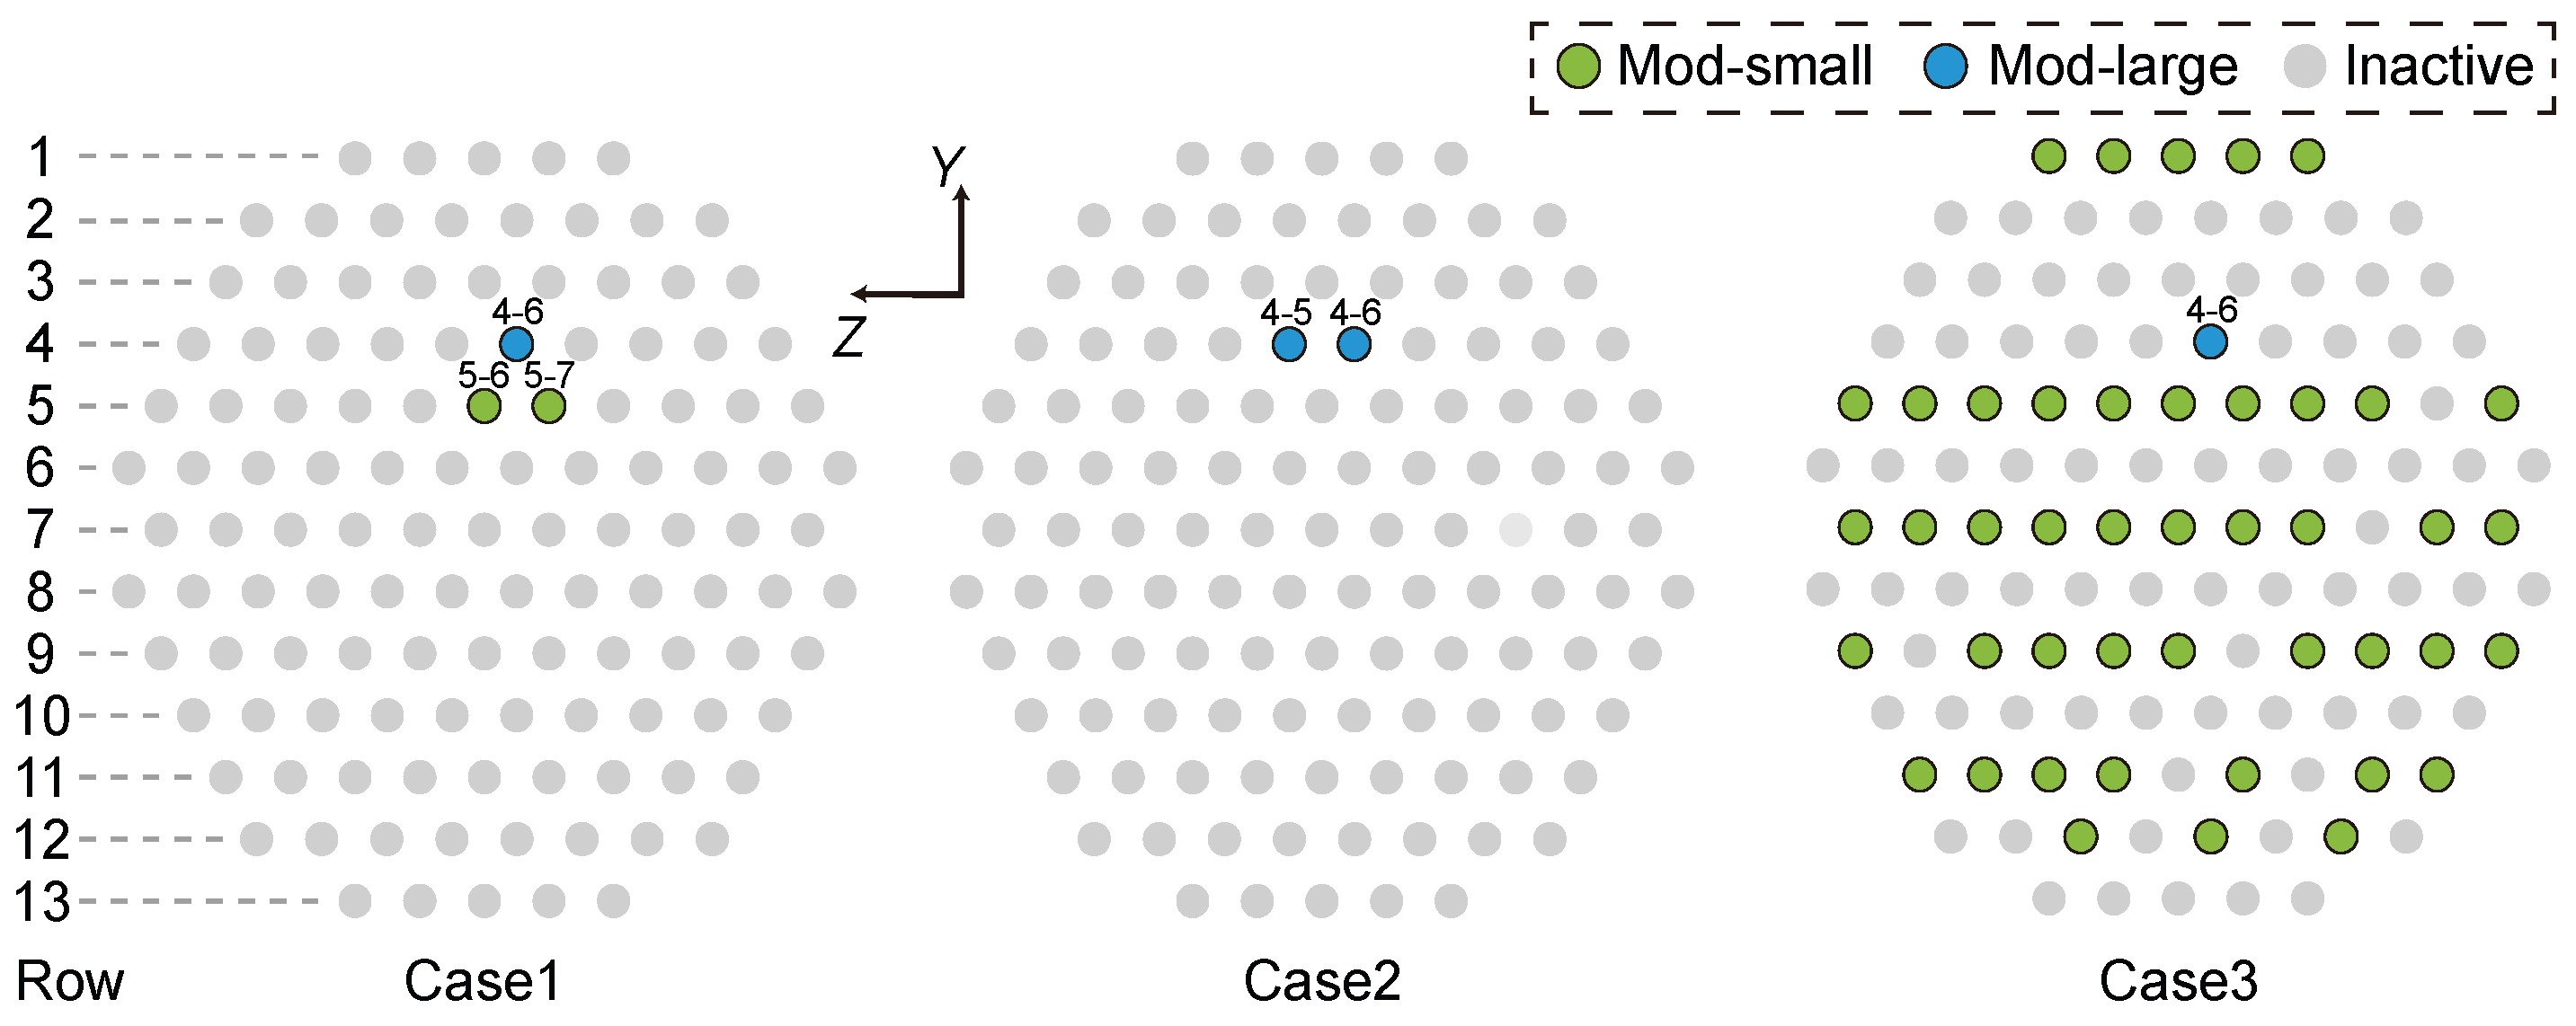
Three nozzle configurations were designed to investigate the spatial distribution of droplets with different sizes, as shown in Figure 2. The nozzles were numbered according to their spatial positions. In these test cases, the fifth and sixth Mod-large nozzles in the fourth row were primarily used to produce large droplets, where the row indexing follows the negative Y direction and the nozzle numbering within each row follows the negative Z direction. For case 1, two Mod-small nozzles (5-6 and 5-7) and one Mod-large nozzle (4-6) were activated. For case 2, only two Mod-large nozzles (4-5 and 4-6) were activated. For case 3, 43 Mod-small nozzles and one Mod-large nozzle (4-6) were activated.
Figure 2.
The spray nozzle configurations utilized in this study. The nozzle row indexing follows the negative Y direction and the nozzle numbering within each row follows the negative Z direction.
The test conditions are summarized in Table 1, where denotes the free-jet velocity and represents the air’s total temperature measured in the settling chamber. is the pressure of the nozzle air supply, and and are the supplied water pressure of Mod-small nozzles and Mod-large nozzles respectively. In this study, the free jet velocity was maintained at 78 m/s, which has been employed in several SLD icing tests in this wind tunnel. The water temperature in the pipeline before entering the nozzle was maintained between 20 and 25 °C. Under this setting, the droplets might not be supercooled when passing through the test section. Nevertheless, this setup prevents ice crystal recirculation caused by excessively low temperatures [35] and avoids droplet recirculation, which could occur at high temperature.
Table 1.
Test conditions for the icing cloud measurement test conducted in FL-61.
The supplied air and water pressures were regulated to simulate clouds with freezing drizzle size characteristics, achieving different MVDs and LWCs. Cases 1 and 2 were designed to simulate droplets with target MVDs of 100 m and 200 m at the test section centerline (Z = 0), respectively. The activated nozzles were limited in number and positioned close to each other. Consequently, droplets of the same diameter generated at the spray system may exhibit similar motion behavior during transportation. In these particular spray configurations, the spatial uniformity of the droplets was not a primary consideration. For case 3, the nozzle configuration was designed to produce a comparatively uniform cloud with MVD of approximately 20 m, although the droplet size distribution may still vary across different positions. These tests were conducted continuously in case of the status shift of the spray system. The spray process last for over 30 s for each test point.
2.3. Cloud Droplet Measurement with HACPI
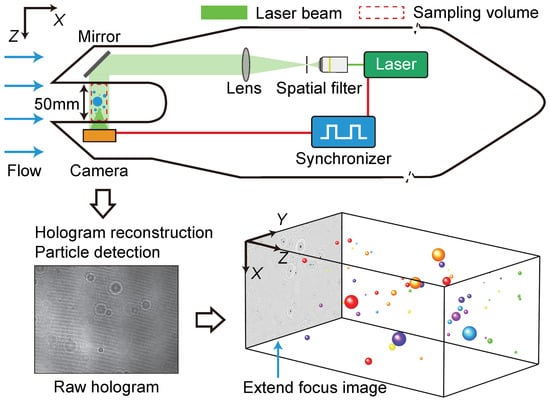
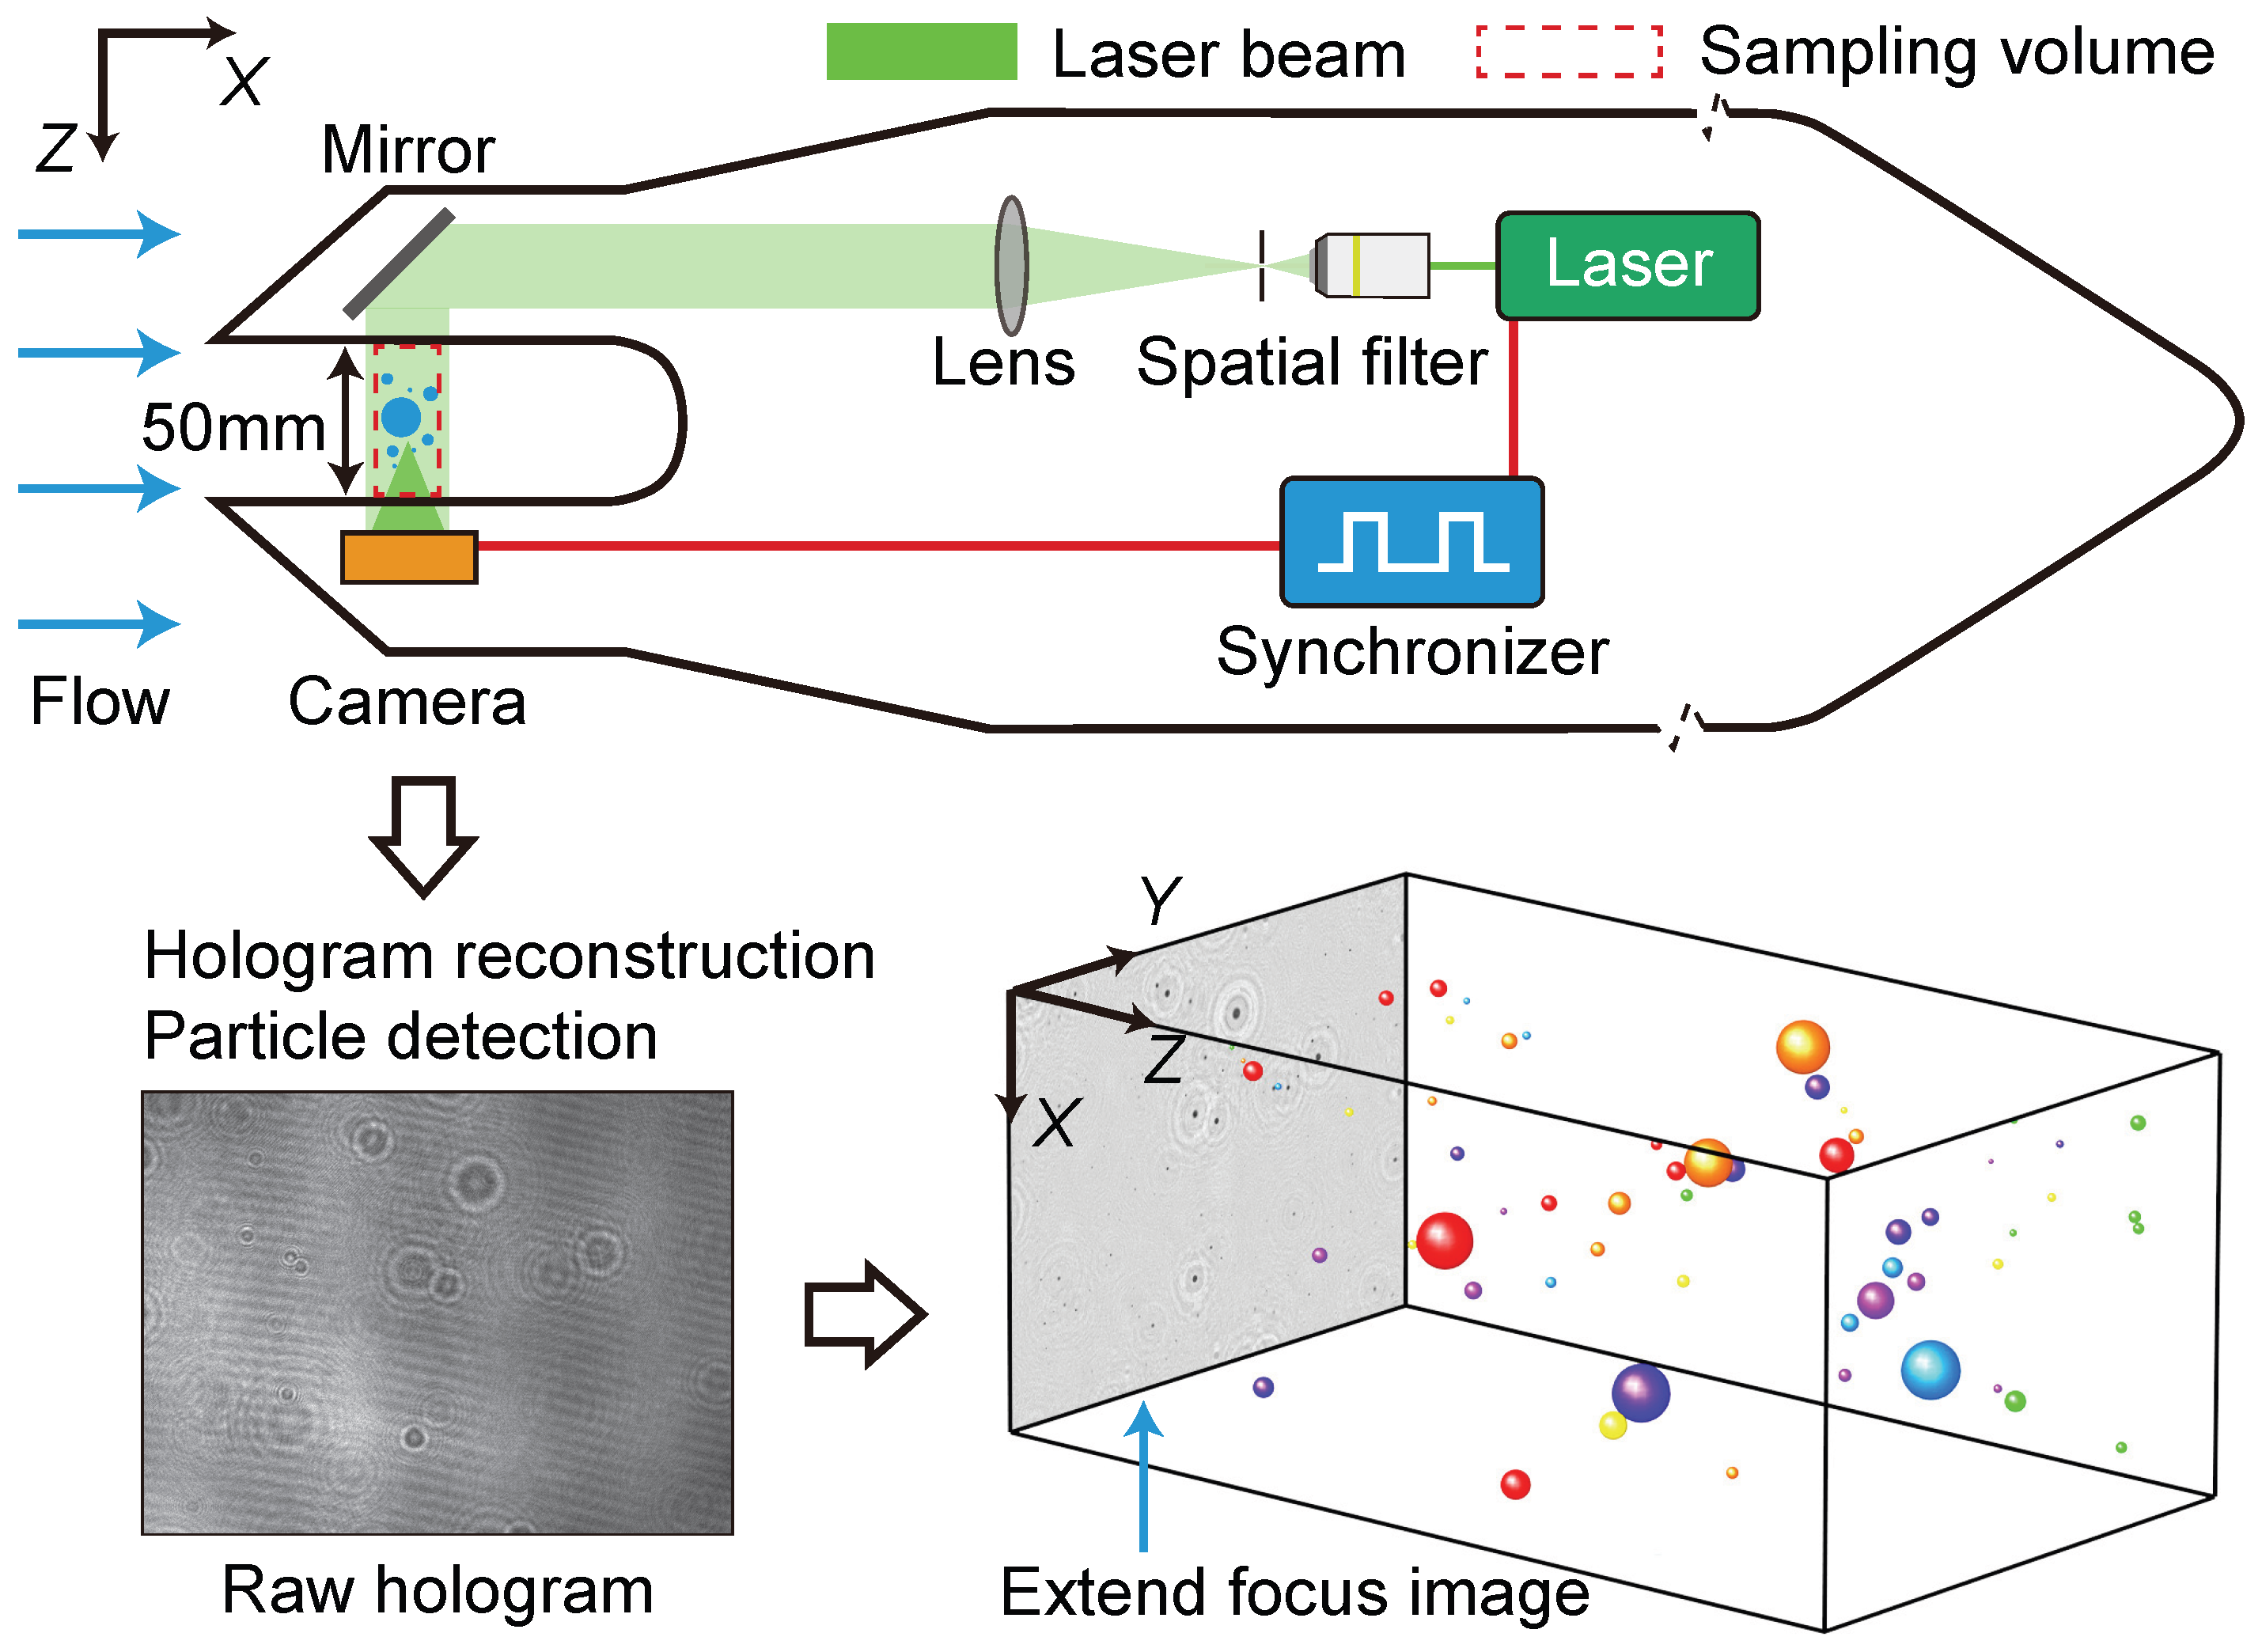
HACPI is based on in-line digital holography, as illustrated in Figure 3, and provides the size, morphology, and three-dimensional (3D) position of droplets within a fixed sampling volume. The collimated pulsed 532 nm laser beam is formed by means of a spatial filter and a collimating lens. Using a lensless in-line holographic configuration, the interference pattern between the light scattered by the particles and the undisturbed reference wave is recorded by the camera sensor, thereby forming a hologram. Using a compact Gigabit Ethernet (GigE) camera, HACPI is capable of recording eight-bit monochrome holograms at 65 fps with a resolution of pixels and a pixel size of 3.45 m. This imaging system eliminates the need to consider perspective effects and provides a cuboid sampling area with a depth of 50 mm. The distance between the optical window surface and the imaging sensor is 10 mm. A synchronizer is integrated to realize the timing synchronization of the laser pulse and camera exposure. The pulsewidth of the laser is approximately 2.5 ns, limiting the motion blur within 1 m for a droplet with a velocity of 300 m/s.
Figure 3.
Scheme of the optical layout and data process flow of HACPI.
Droplet characteristics can be derived through the numerical reconstruction of holograms [36]. The in-focus particles signals are focalized in a single synthesis image, which is called the extended focus image (EFI). The particle sizes are described by , which is the equivalent diameter of a circle equal to the projected area of the segmented particle. It is imperative that a minimum of two pixels are incorporated within a holographic imaging system in order to successfully resolve an object, particularly in the context of speckle noise. In addition, an increase in the reconstruction distance leads to reduced resolution. In this study, the range of the hologram reconstruction distance (z) is 9–61 mm, covering the whole sampling volume and the outer surfaces of the optical windows. Based on the resolution calibration results [30], the selected droplet’s z-locations range from 12 to 35 mm, and only droplets with diameters greater than 7 m are considered. Meanwhile, only the central region of the hologram, with a resolution of pixels, is used for statistical analysis. Therefore, the effective sampling volume of each hologram is 0.308 cm3.
The sizing calibration of HACPI was performed using a high-precision standard dot glass plate [37]. Particles with size of 10.0 m, 25.0 m, 50 m, 100.0 m, and 250.0 m are selected for calibration. The absolute error in the measured size for 25.0 m and 10.0 m is limited to 3.0 m, while the relative error for the other measured sizes is less than 2%.
The analysis of the particle size distribution typically involves dividing the particle size range into equal or unequal intervals, followed by counting the number of particles within each interval. Therefore, the size distribution can be represented by the normalized particle number concentration:
where and represent the number concentration and number of particles within the ith size range. denotes the width of the the ith size range. The total sampling volume is expressed as
where is the number of the counted holograms and is the effective sample volume of each hologram.
The LWC is the mass of liquid water per unit volume. For each size range, is calculated by
The total LWC is the sum of the :
The statistical analysis of the droplets begins with sorting the equivalent diameters in ascending order, after which the cumulative volume based on particle index can be calculated by
Here, denotes the total number of sampled particles. Thus, is the cumulative volume of all sampled droplets. The cumulative mass fraction can be expressed as
The median volume diameter MVD, also known as , refers to the droplet diameter at which 50% of the cumulative volume consists of droplets with diameters less than or equal to MVD. Therefore, MVD is expressed as
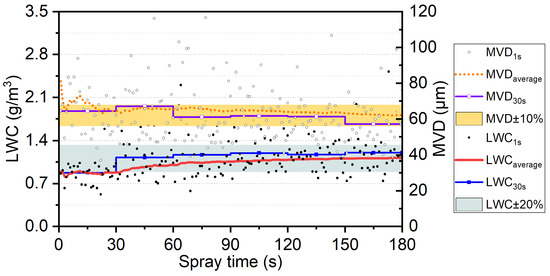
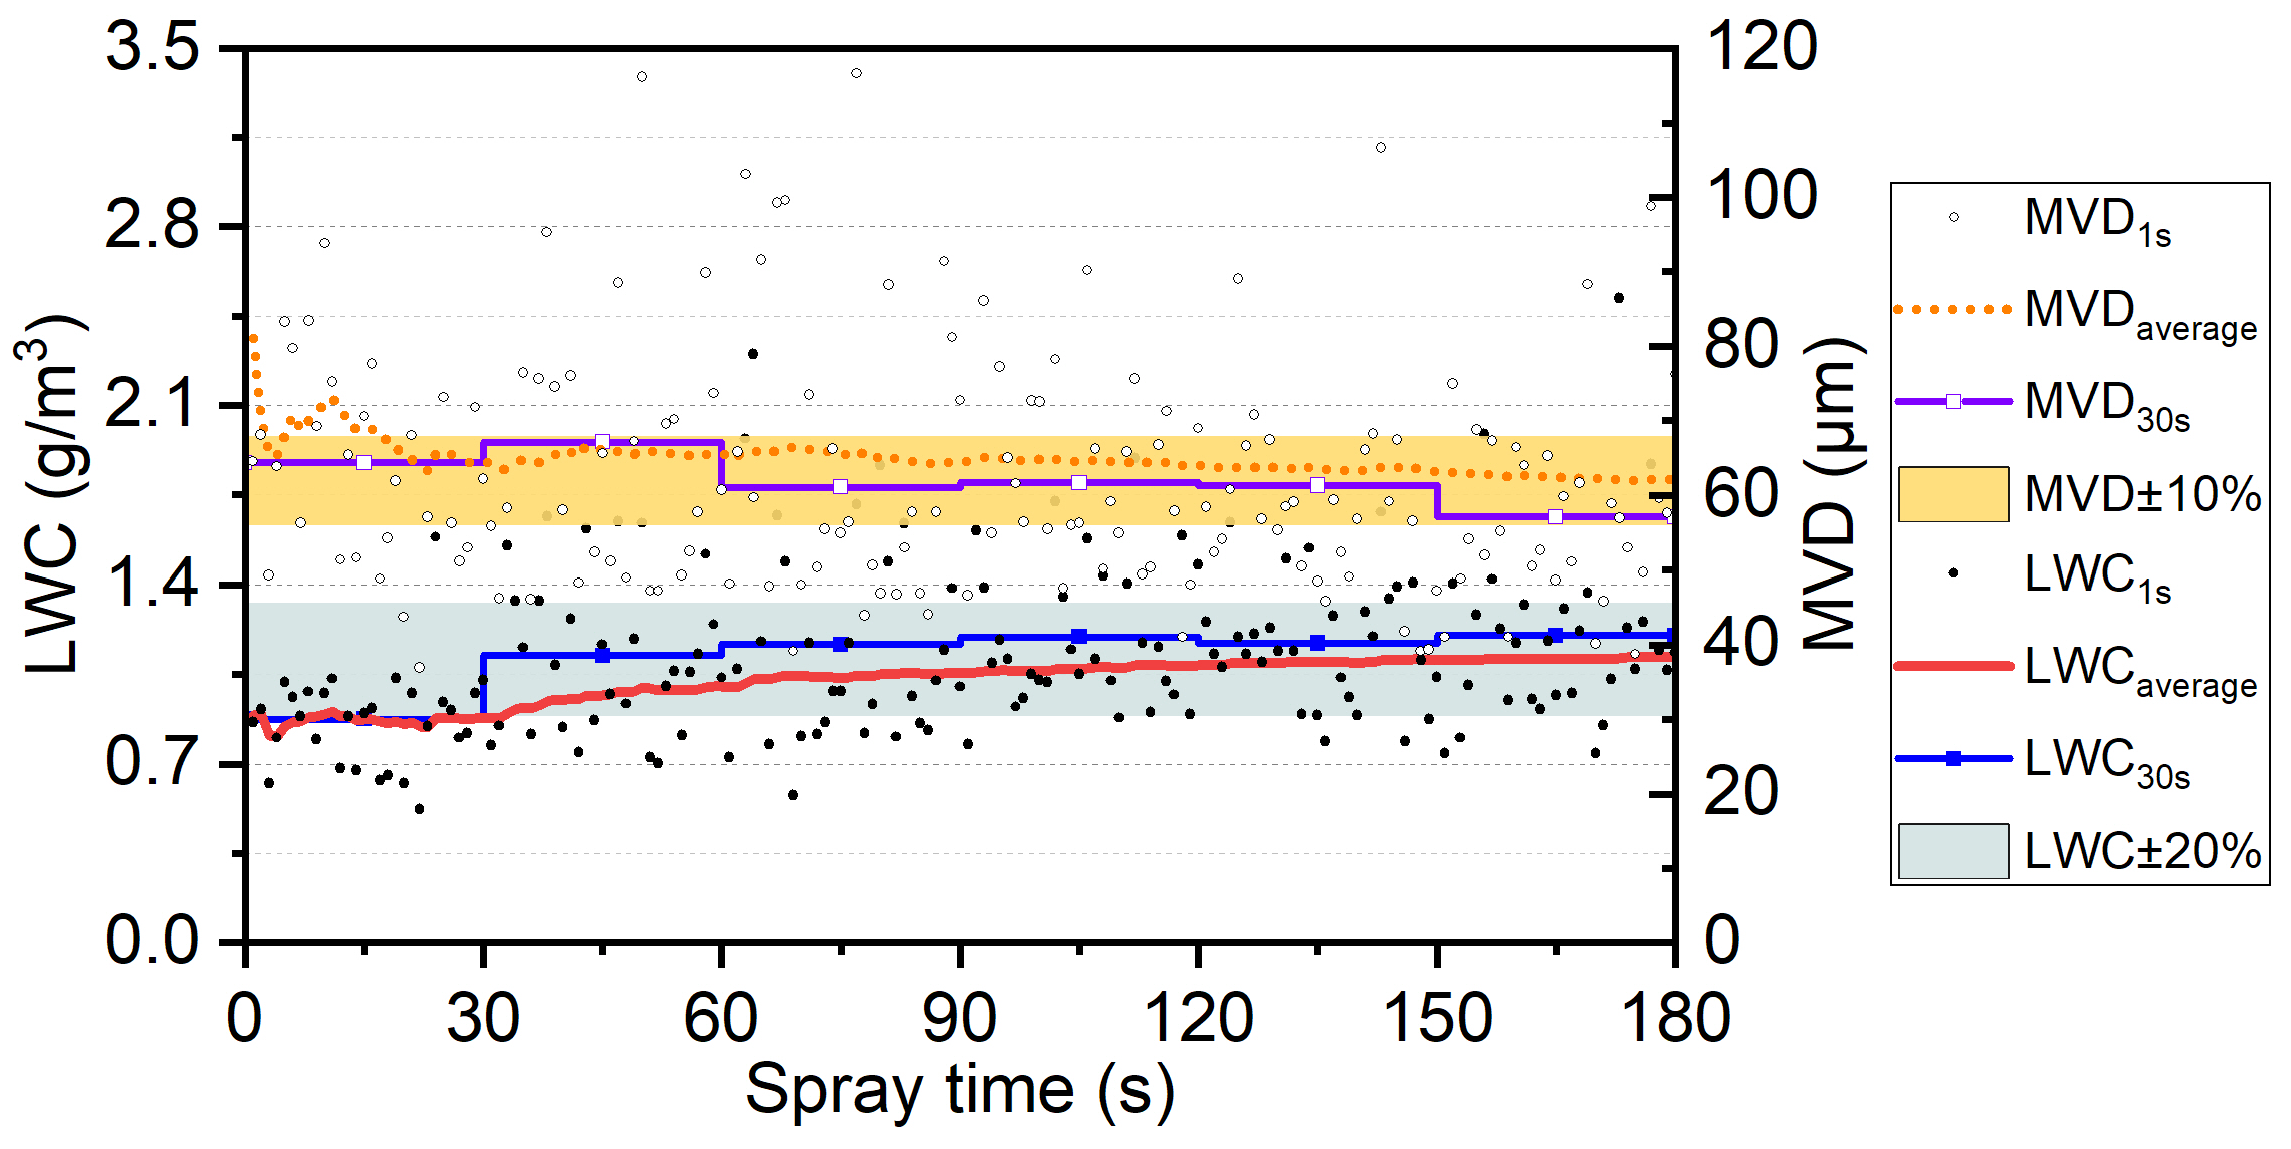
The uncertainty associated with both the MVD and LWC is significantly influenced by the number of droplets sampled, which is directly related to the sampling time. A larger sample size generally leads to more reliable statistical results and reduces uncertainty, while smaller sample sizes may introduce more variability. A time-based analysis of droplet statistics has been conducted with the HACPI in the CARDC IWT previously [30], as shown in Figure 4. When compared to measurements taken over a 180 s period, with an MVD of approximately 62.0 m and an average LWC of 1.2 , measurements calculated from droplets detected over 30 s yielded deviations of less than for the MVD and for the LWC.
Figure 4.
Time-based MVD and LWC results and the number of droplets.
3. Results and Discussion
3.1. Morphology Analysis
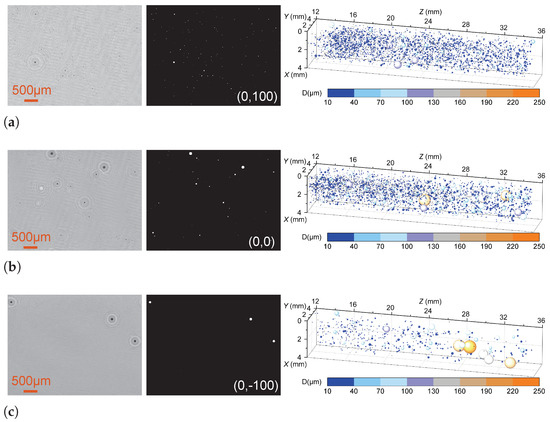
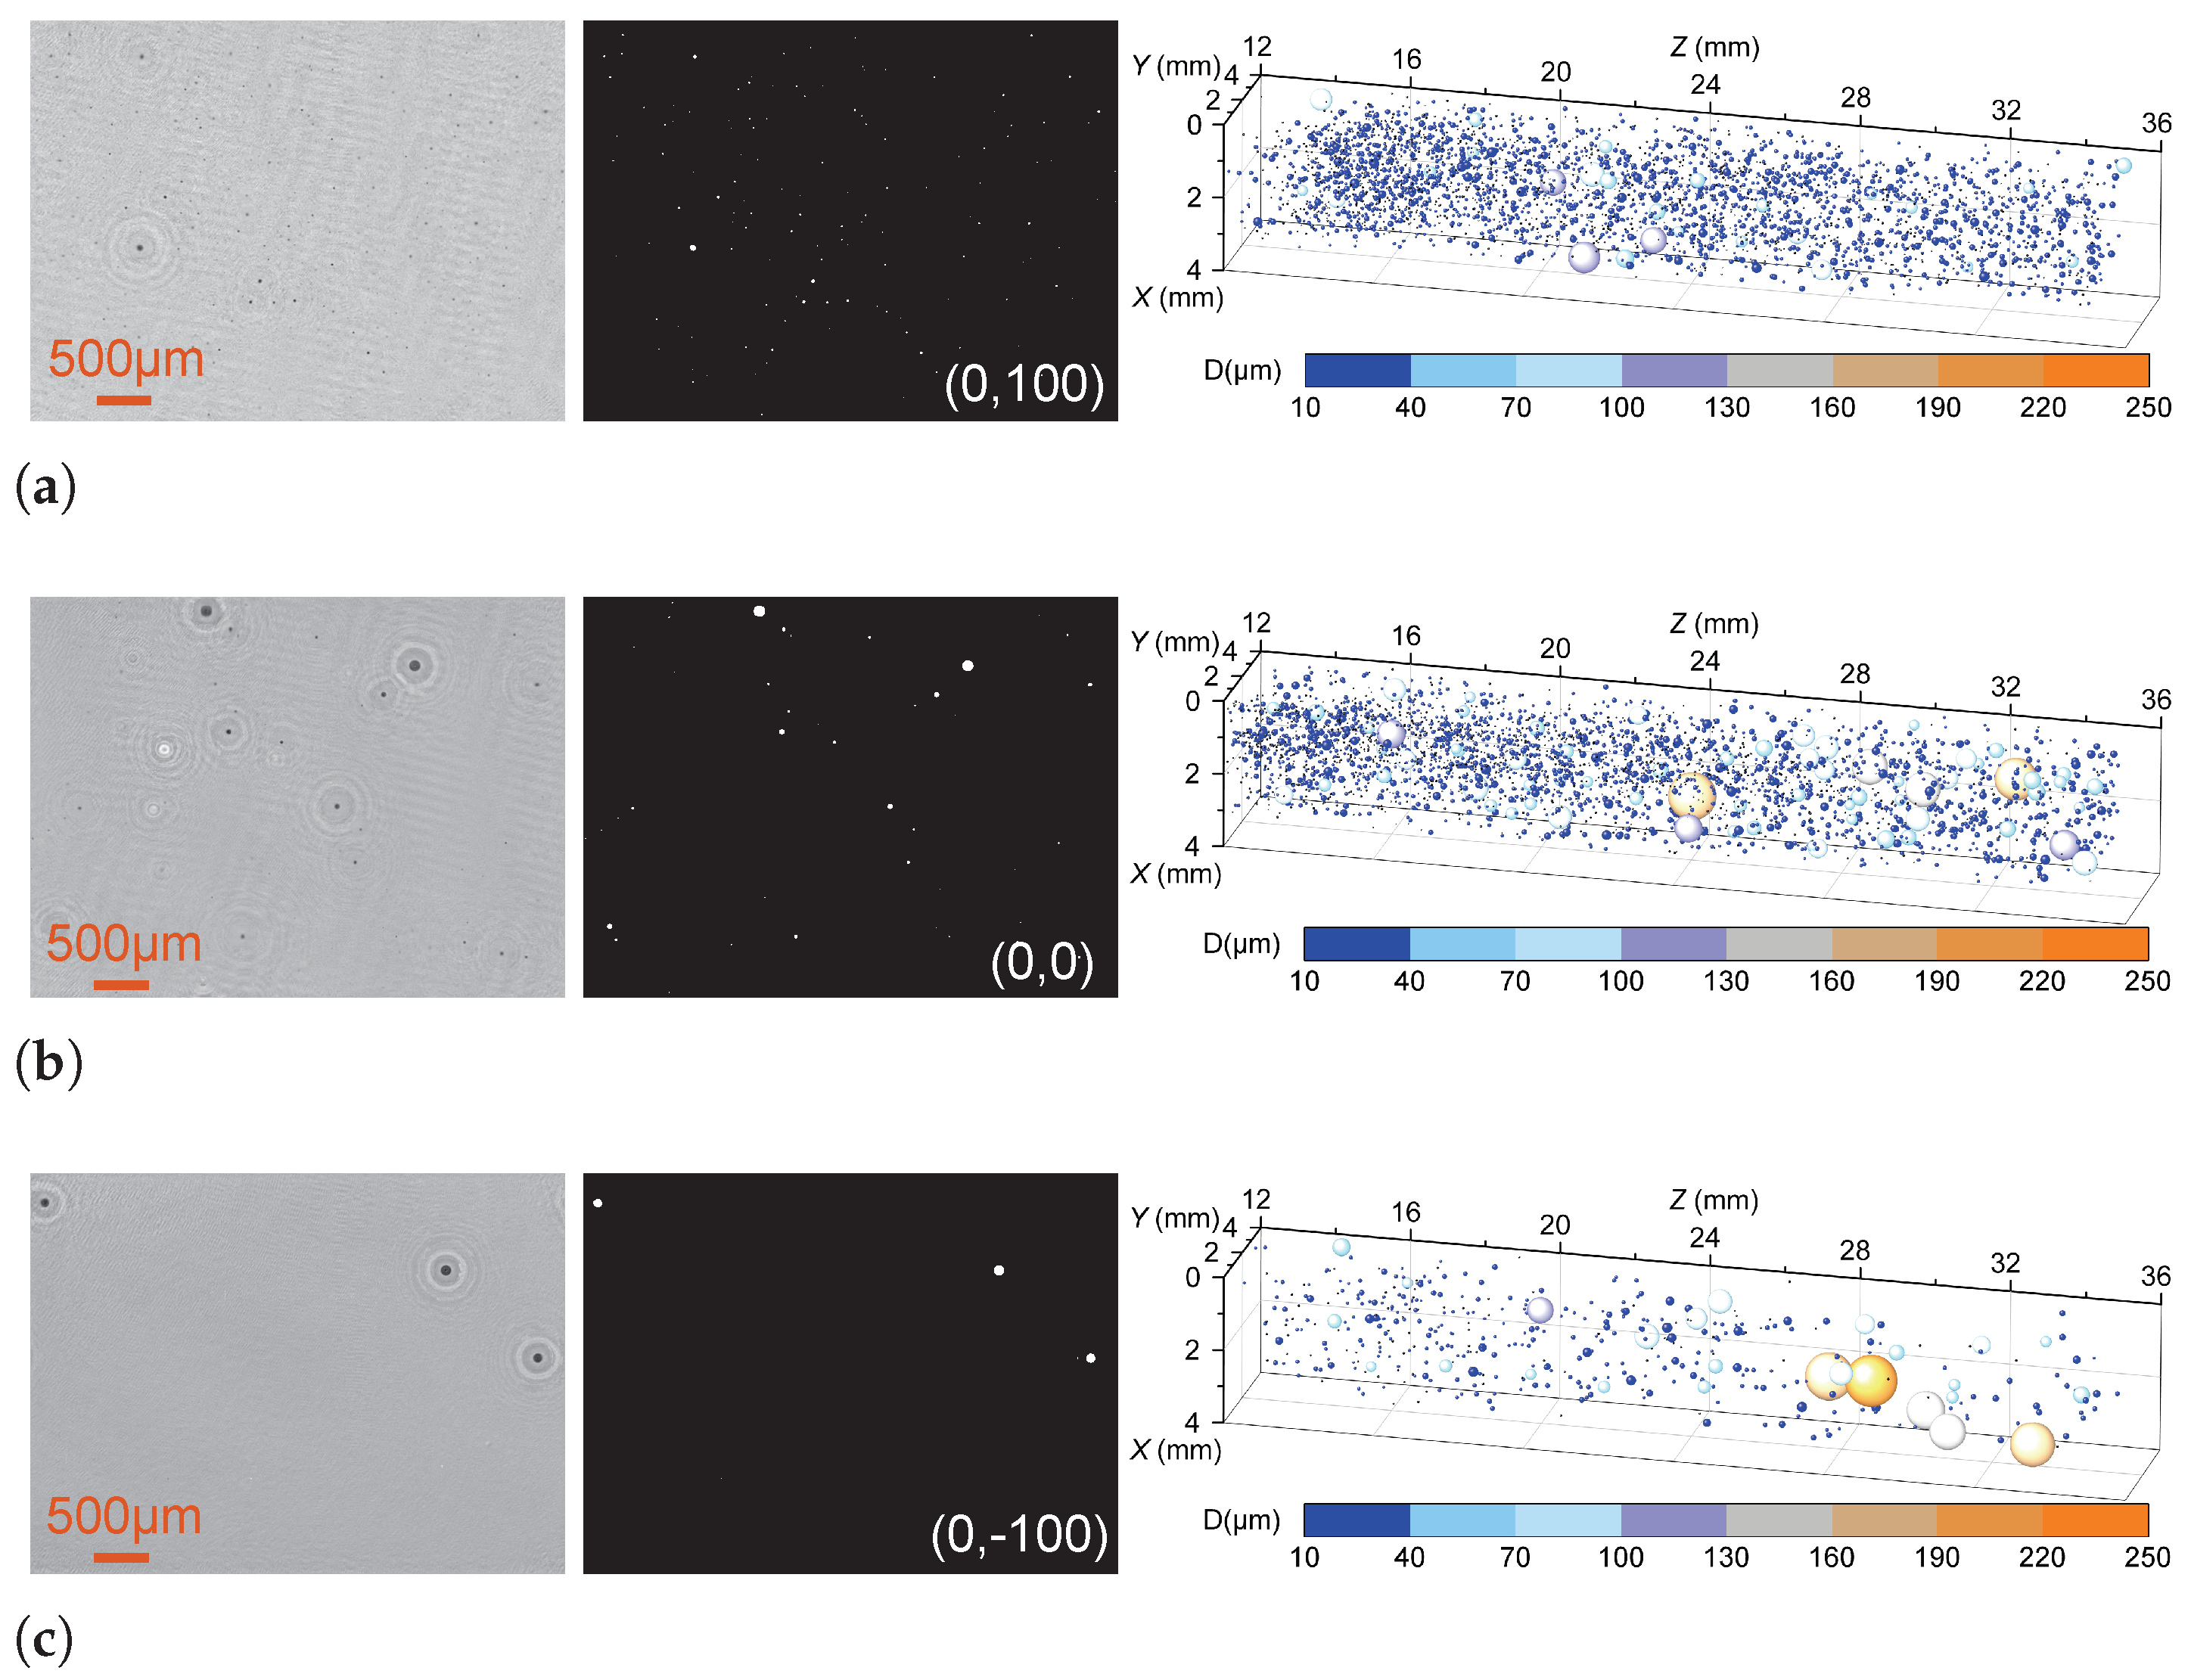
Figure 5 displays typical reconstructed EFIs, binarized EFIs and droplet spatial distributions in case 1 at the test points (0, 100), (0, 0) and (0, −100). In the EFIs, regions with low gray values correspond to the focused droplets fused from the reconstructed hologram slices [36]. The 3D bubble plot on the right side of Figure 5 summarizes the droplets from 180 holograms at these test points, respectively. At test point (0, 100), a number of droplets were detected, but those with large diameters were rare. As the test point moved downward, the number of droplets larger than 100 m increased, while the total number of detected droplets decreased significantly. Since these droplets of different sizes were produced by nozzles at the same location, it can be inferred that this phenomenon is caused by the settling effect of large droplets.
Figure 5.
Typical reconstructed EFIs, binarized EFIs and droplet spatial distributions in case 1. (a) Results at the test point (0, 100). (b) Results at the test point (0, 0). (c) Results at the test point (0, −100).
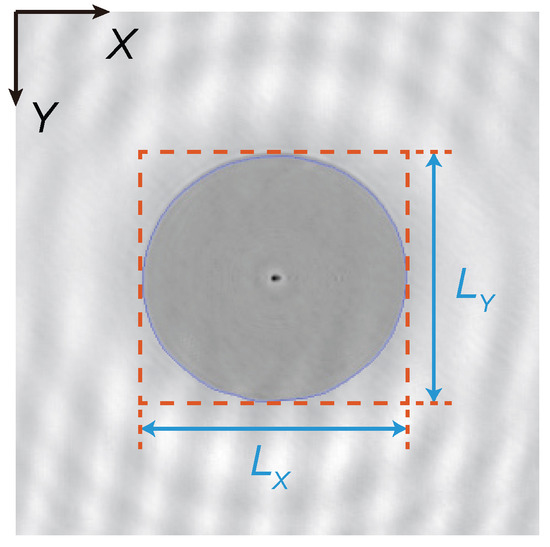
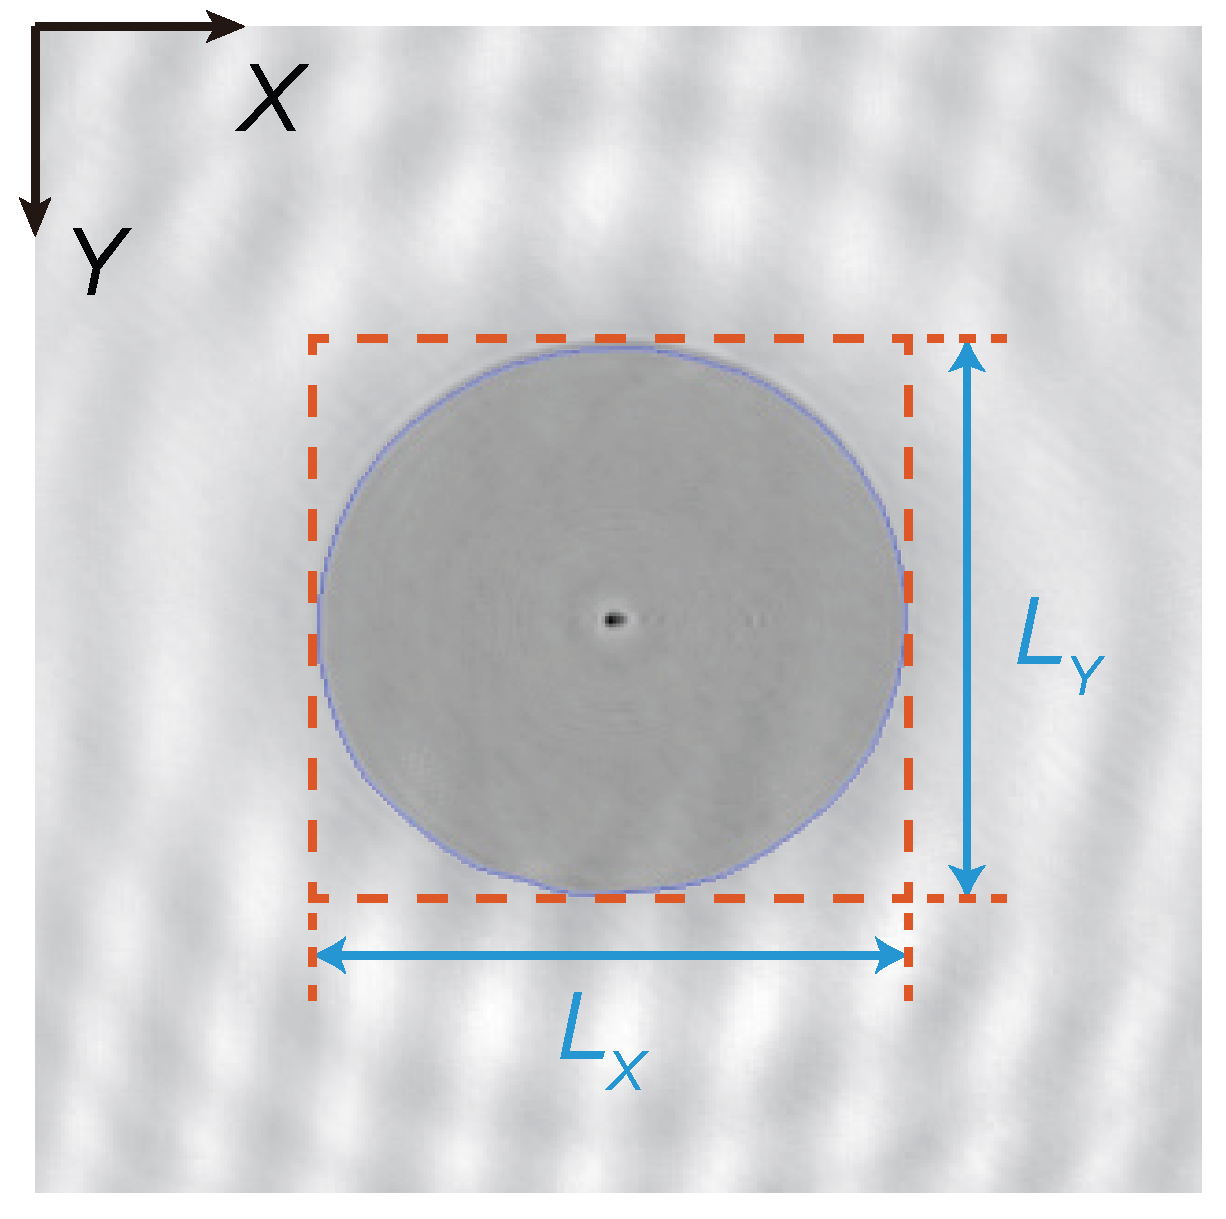
The velocity slip between the flow and large droplets is the cause of the settling effect, which occurs both along the airflow direction and the vertical direction [17]. Meanwhile, the velocity slip affects the Weber number, which is an important parameter related to the deformation and breakup of droplets [38]. Across the test points in the three cases, deformed large droplets were mainly observed at the (0, −100) position. Figure 6 defines two morphological parameters of the droplets, where denotes the length of the minimum bounding rectangle of the recognized particle region along the airflow direction, and represents its length in the vertical direction. Thus, the aspect ratio is defined as
Figure 6.
The morphological characteristic parameters of the droplet.
Since the size of the bounding rectangle is calculated based on the pixel count of the detected region, errors in identifying the edge of a droplet can affect the determination process of and , particularly for small droplets. Therefore, a dimensionless criterion number is defined as
where is the pixel size.
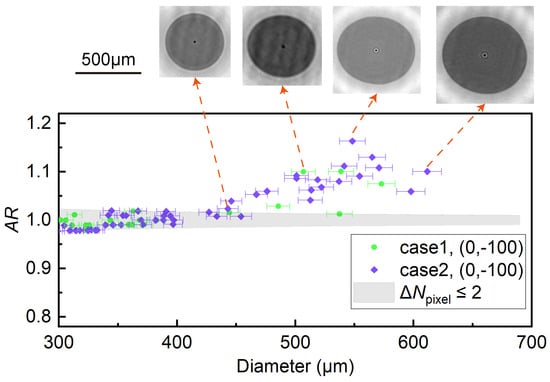
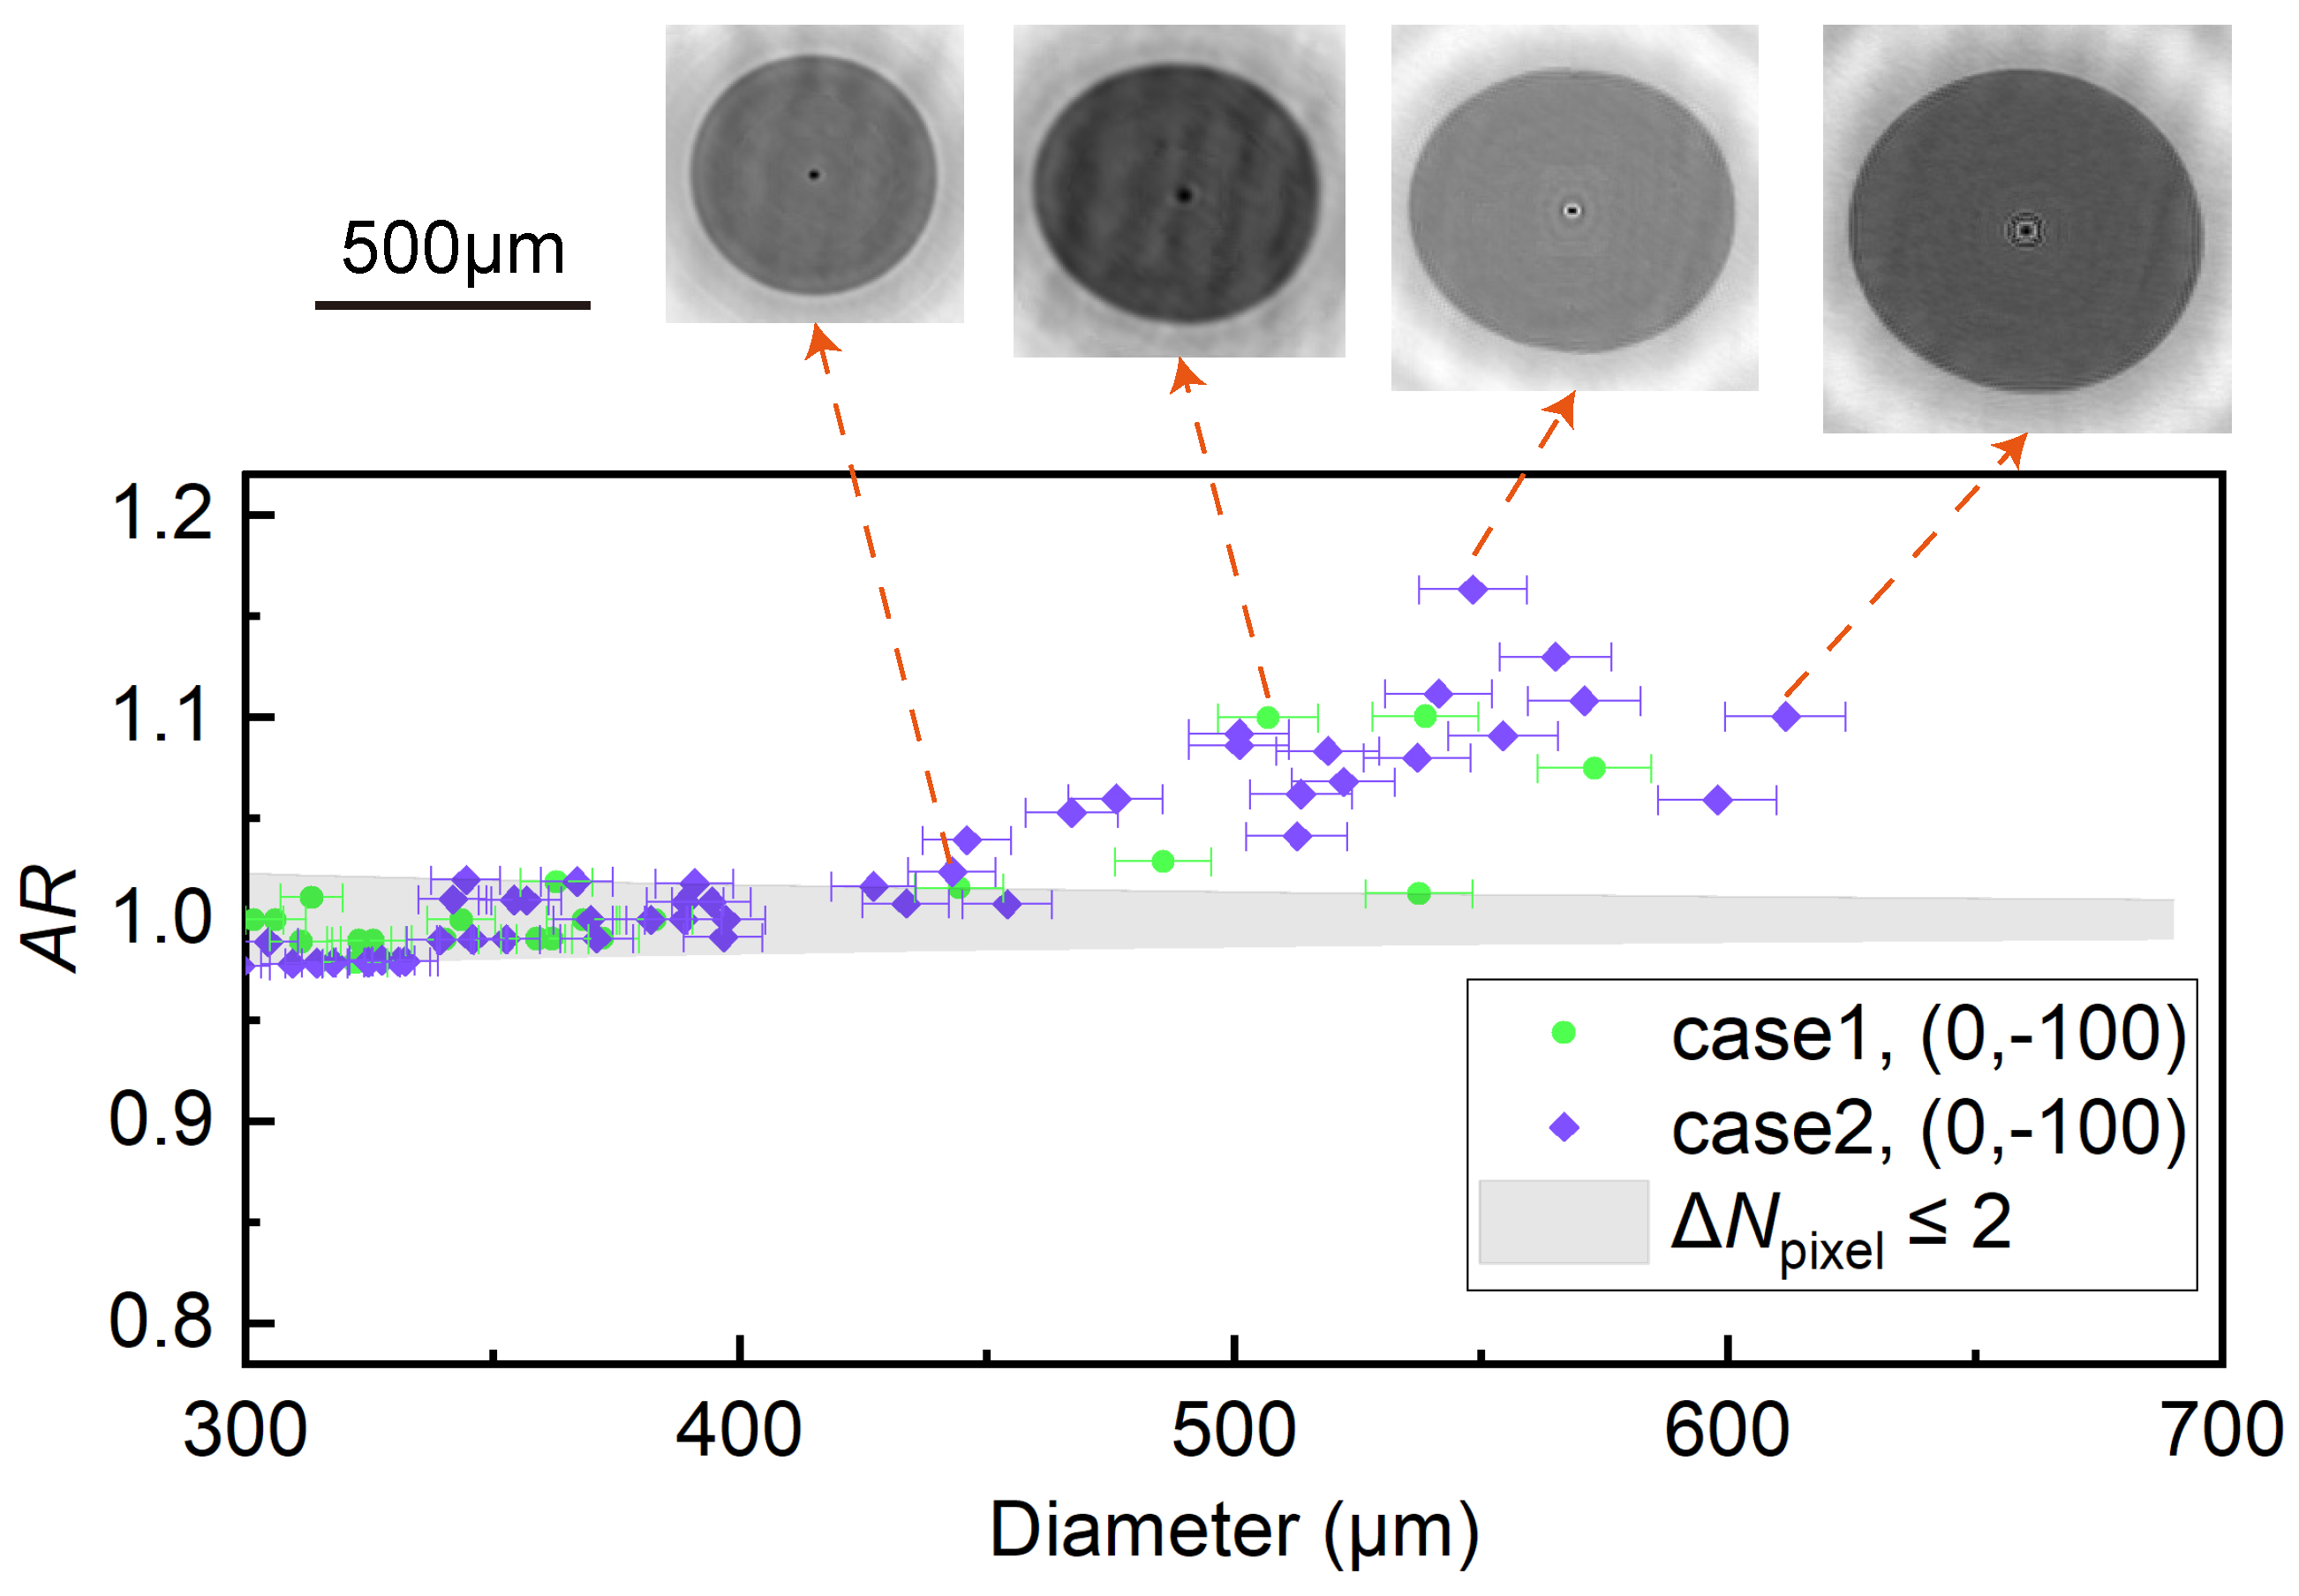
Figure 7 presents the of droplets larger than 300 m collected at (0, −100) in case 1 and case 2 while four typical deformed droplets are displayed. The gray areas in the figure represent droplets with not exceeding two, which are considered to be circular in statistics. It is clear that in the size range below 400 m, the droplets maintain an approximately circular shape. For larger droplets, the value of became greater than , and the increased with droplet size. This indicates that under the given airflow velocity, these droplets experienced almost no deformation along the airflow direction but exhibited noticeable deformation in the vertical direction. Because this test point was located well below the nozzle height, the droplet deformation is inferred to be primarily governed by gravity.
Figure 7.
The aspect ratios of droplets larger than 300 m collected at (0, −100) in case 1 and case 2. Four typical deformed droplets are also displayed.
3.2. Spatial MVD and LWC Distributions
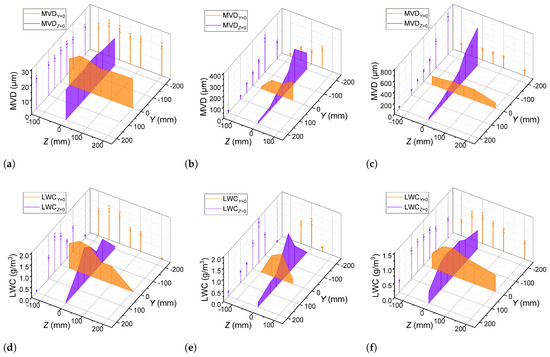
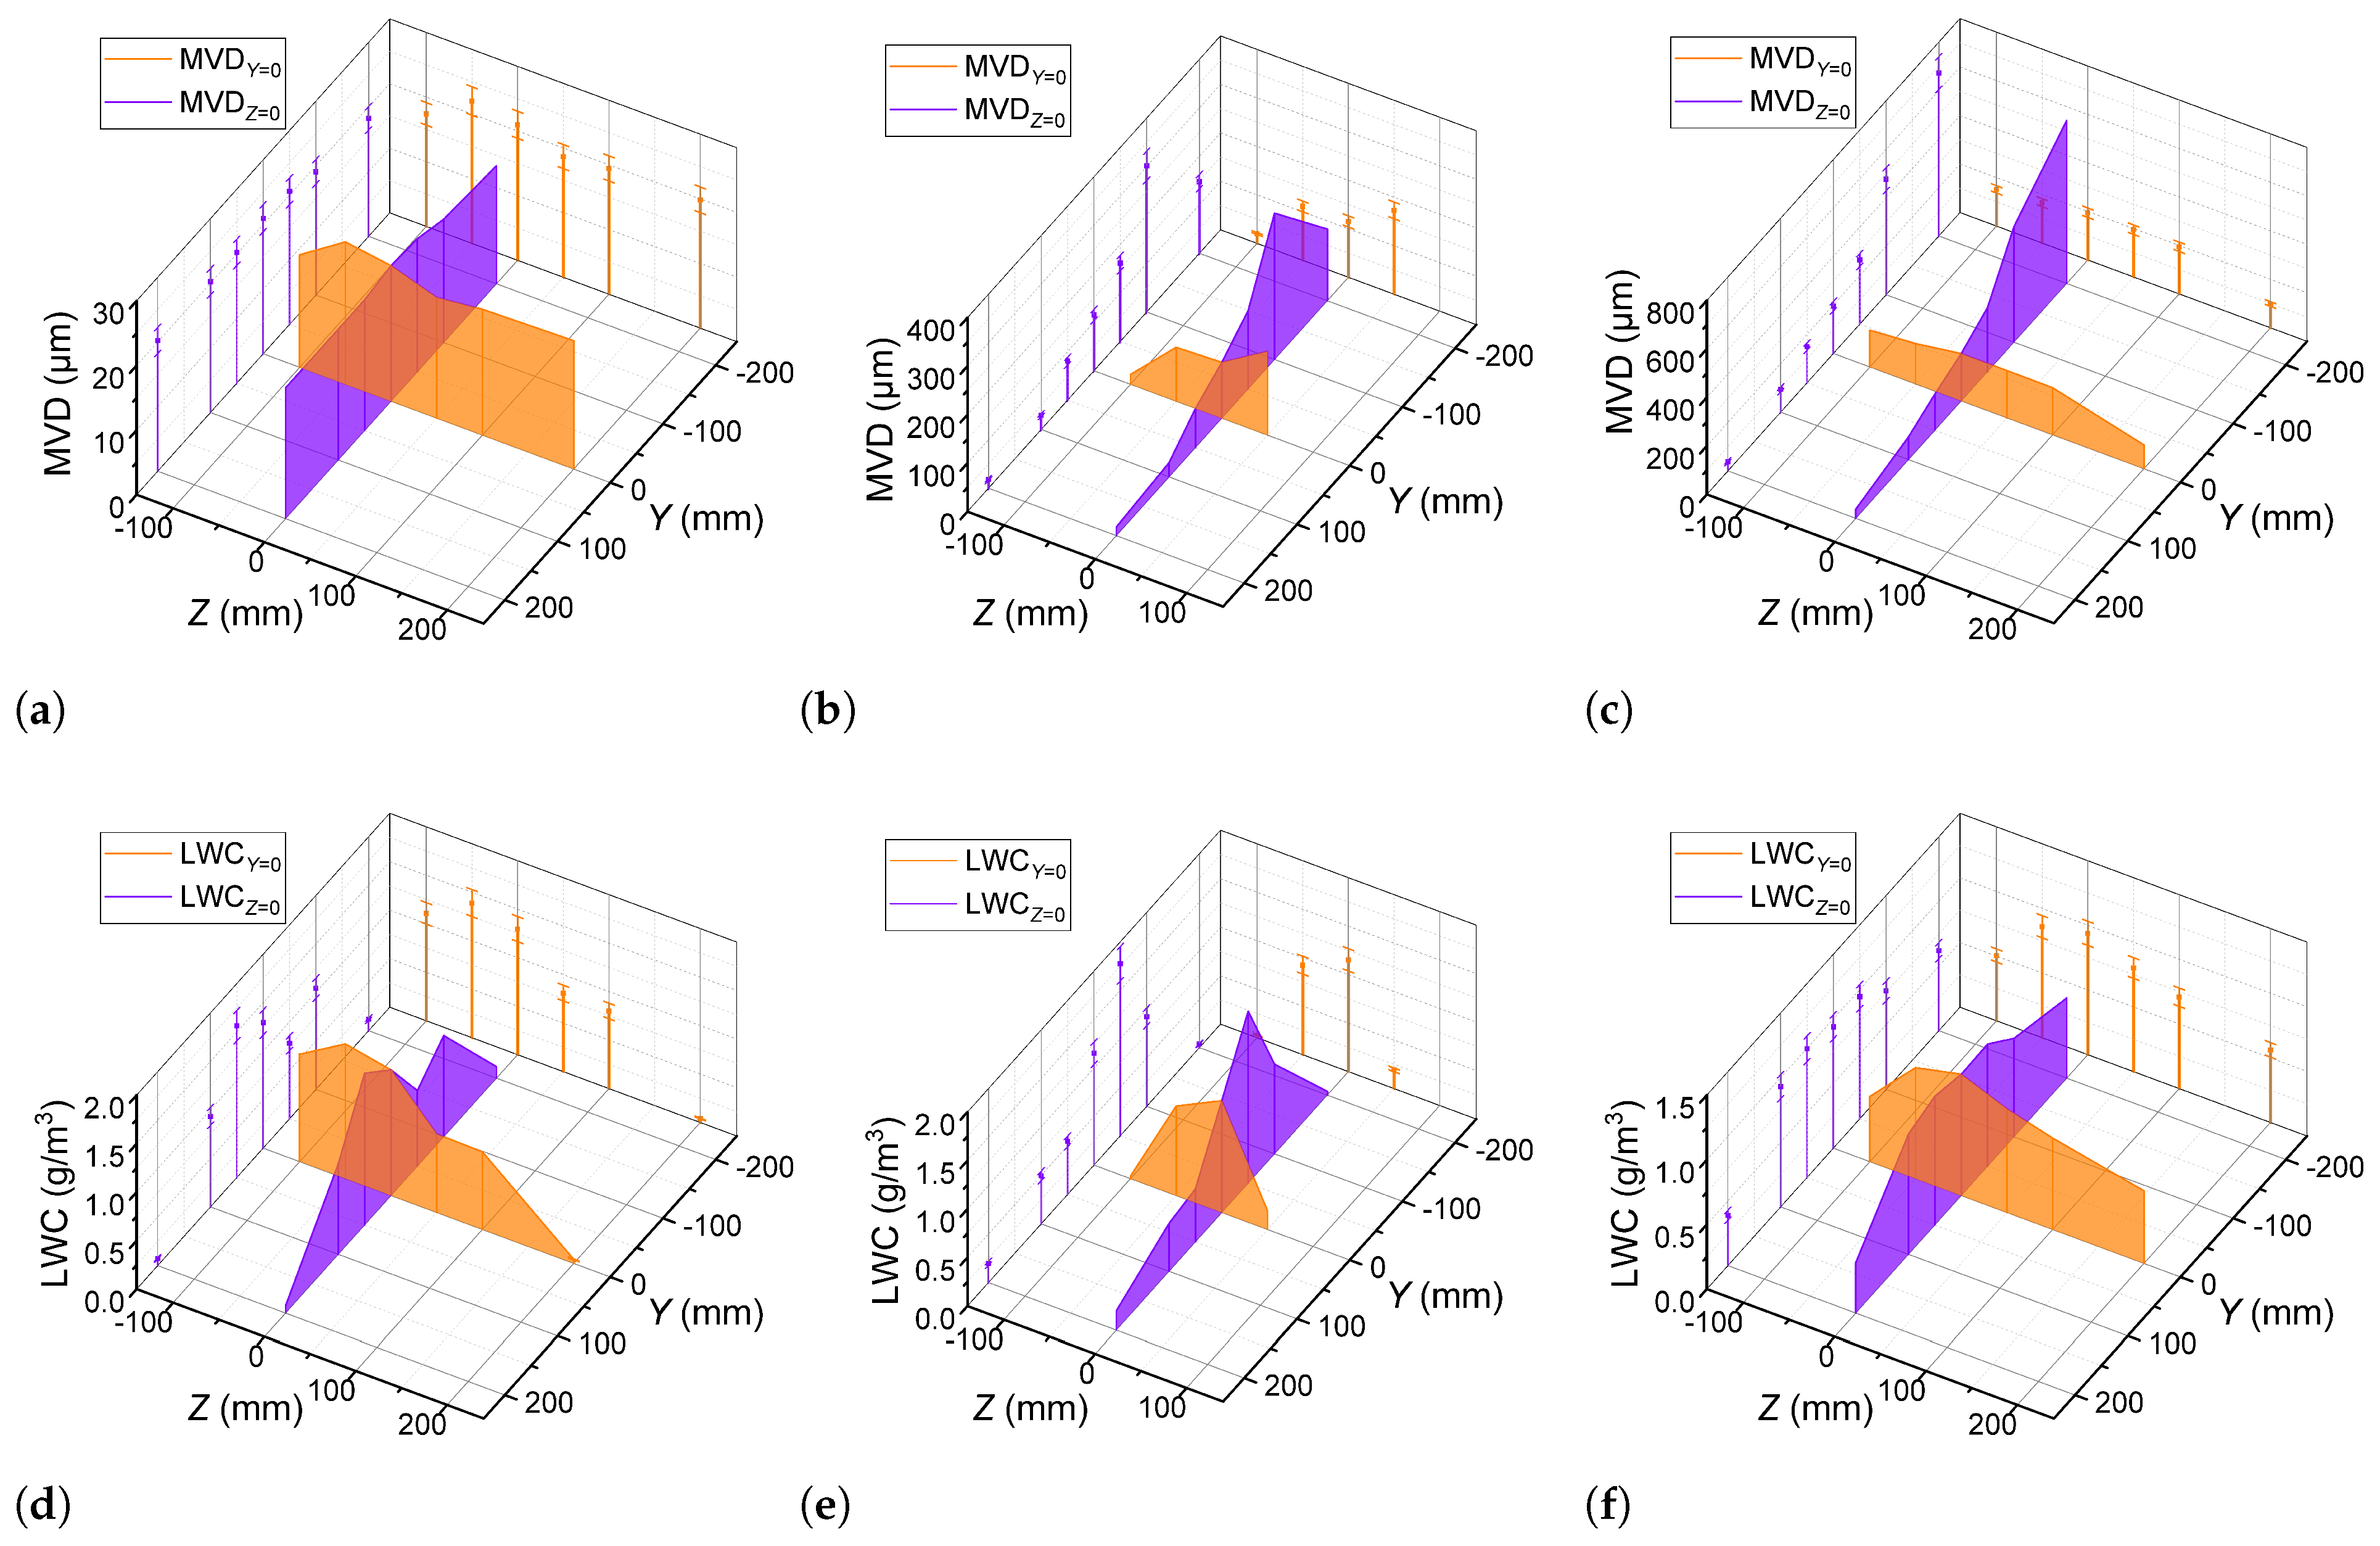
Figure 8 illustrates the MVD and LWC distributions along the test points in the select three cases. Similar to case 1, case 2 aims to produce large droplets whose size range encompasses the freezing drizzle condition with a target MVD of 200 m at the Z = 0 position. From the vertical perspective, the MVD value increases generally as the Y position decreases for the two SLD cases. While small droplets are delivered by the high-speed airflow to the positions corresponding with the nozzle configuration, those large droplets exhibit slow motion along the flow direction and tend to settle at low positions. Among the selected test points, the smallest MVD is located at (0, 200). The highest MVD for case 1 is 301.6 m, which occurs at (0, −100). For case 2, MVD reaches a peak at (0, −200) with a value of 672.5 m.
Figure 8.
The MVD and LWC distributions along the test points. (a) The MVD distribution for case 1. (b) The MVD distribution for case 2. (c) The MVD distribution for case 3. (d) The LWC distribution for case 1. (e) The LWC distribution for case 2. (f) The LWC distribution for case 3.
As indicated by the LWC distribution in case 1, the coverage area of the simulated cloud droplets spans approximately from Z = −100 mm to Z = 50 mm. In case 2, the activation of an additional Mod-large nozzle, together with increased water and air pressures, leads to an expanded spray coverage area. The LWC value at (200, 0) is significantly lower than at other locations, indicating the edge of the cloud. Along the Y direction, the LWC initially increases with Y and then decreases beyond Y = −50 mm or Y = −100 mm. The LWC value in case 2 reaches its peak of 1.57 at mm. In the horizontal direction, the MVD and LWC values generally increase as the Z position moves closer to the center. In case 2, the activated nozzles are symmetrically arranged. However, the specific MVD and LWC values are not symmetrical. For the test points with mm, the MVD values are larger than those at the opposite test points, while the LWC values are smaller than those at the opposite test points.
In case 3, 41 additional Mod-small nozzles are activated under the same water and air pressures as in case 1, while the water pressure of the Mod-large nozzles was reduced to 70 kPa. For air-assisted atomization nozzles, when the air supply pressure is kept constant, a decrease in the supplied water pressure results in a smaller droplet size. Furthermore, as nozzles producing small droplets are increased and uniformly arranged in case 3, the cloud spatial uniformity in the test section is improved. At the center test point (0, 0), the MVD is 21.0 m and the LWC is 0.94 , respectively. Generally, as the test point moves away from the center, both the LWC and MVD decrease. The LWC and MVD values show minimal fluctuations across the test points within the Y position range of −50 mm to 100 mm and the Z position range of −50 to 50 mm. The largest MVD is 22.0 m at (−50, 0) and the largest LWC is 1.00 at (0, 50).
Based on the statistical data from these cases, it is clear that increasing the water and air pressures, or expanding the range of the nozzle layout, can both broaden the spray coverage. In case 3, where the Mod-small nozzles are strategically arranged, the clouds’ uniformity is good in the central region. In the other cases with fewer activated nozzles, the spatial distributions of the MVD and LWC exhibit a clearly uneven pattern in the vertical direction. Compared to the location of the activated nozzle in the settling chamber, the positions of the highest MVD and LWC values are relatively lower at the test points in the test section. Within a given case, the MVD and LWC values peak at different test points. Due to the presence of a bimodal droplet size distribution under SLD conditions, MVD alone cannot adequately characterize the droplet size distribution.
3.3. Cloud Size Distribution Characteristics in Vertical Direction
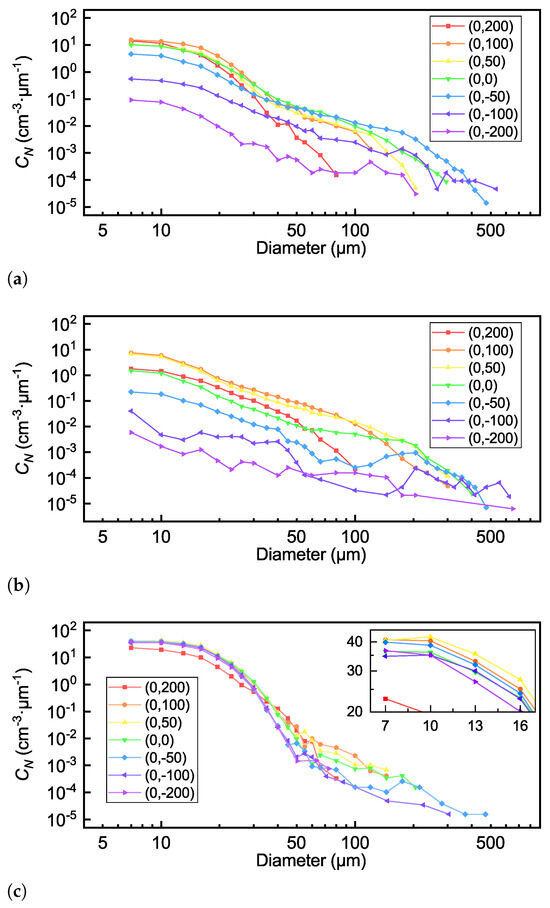
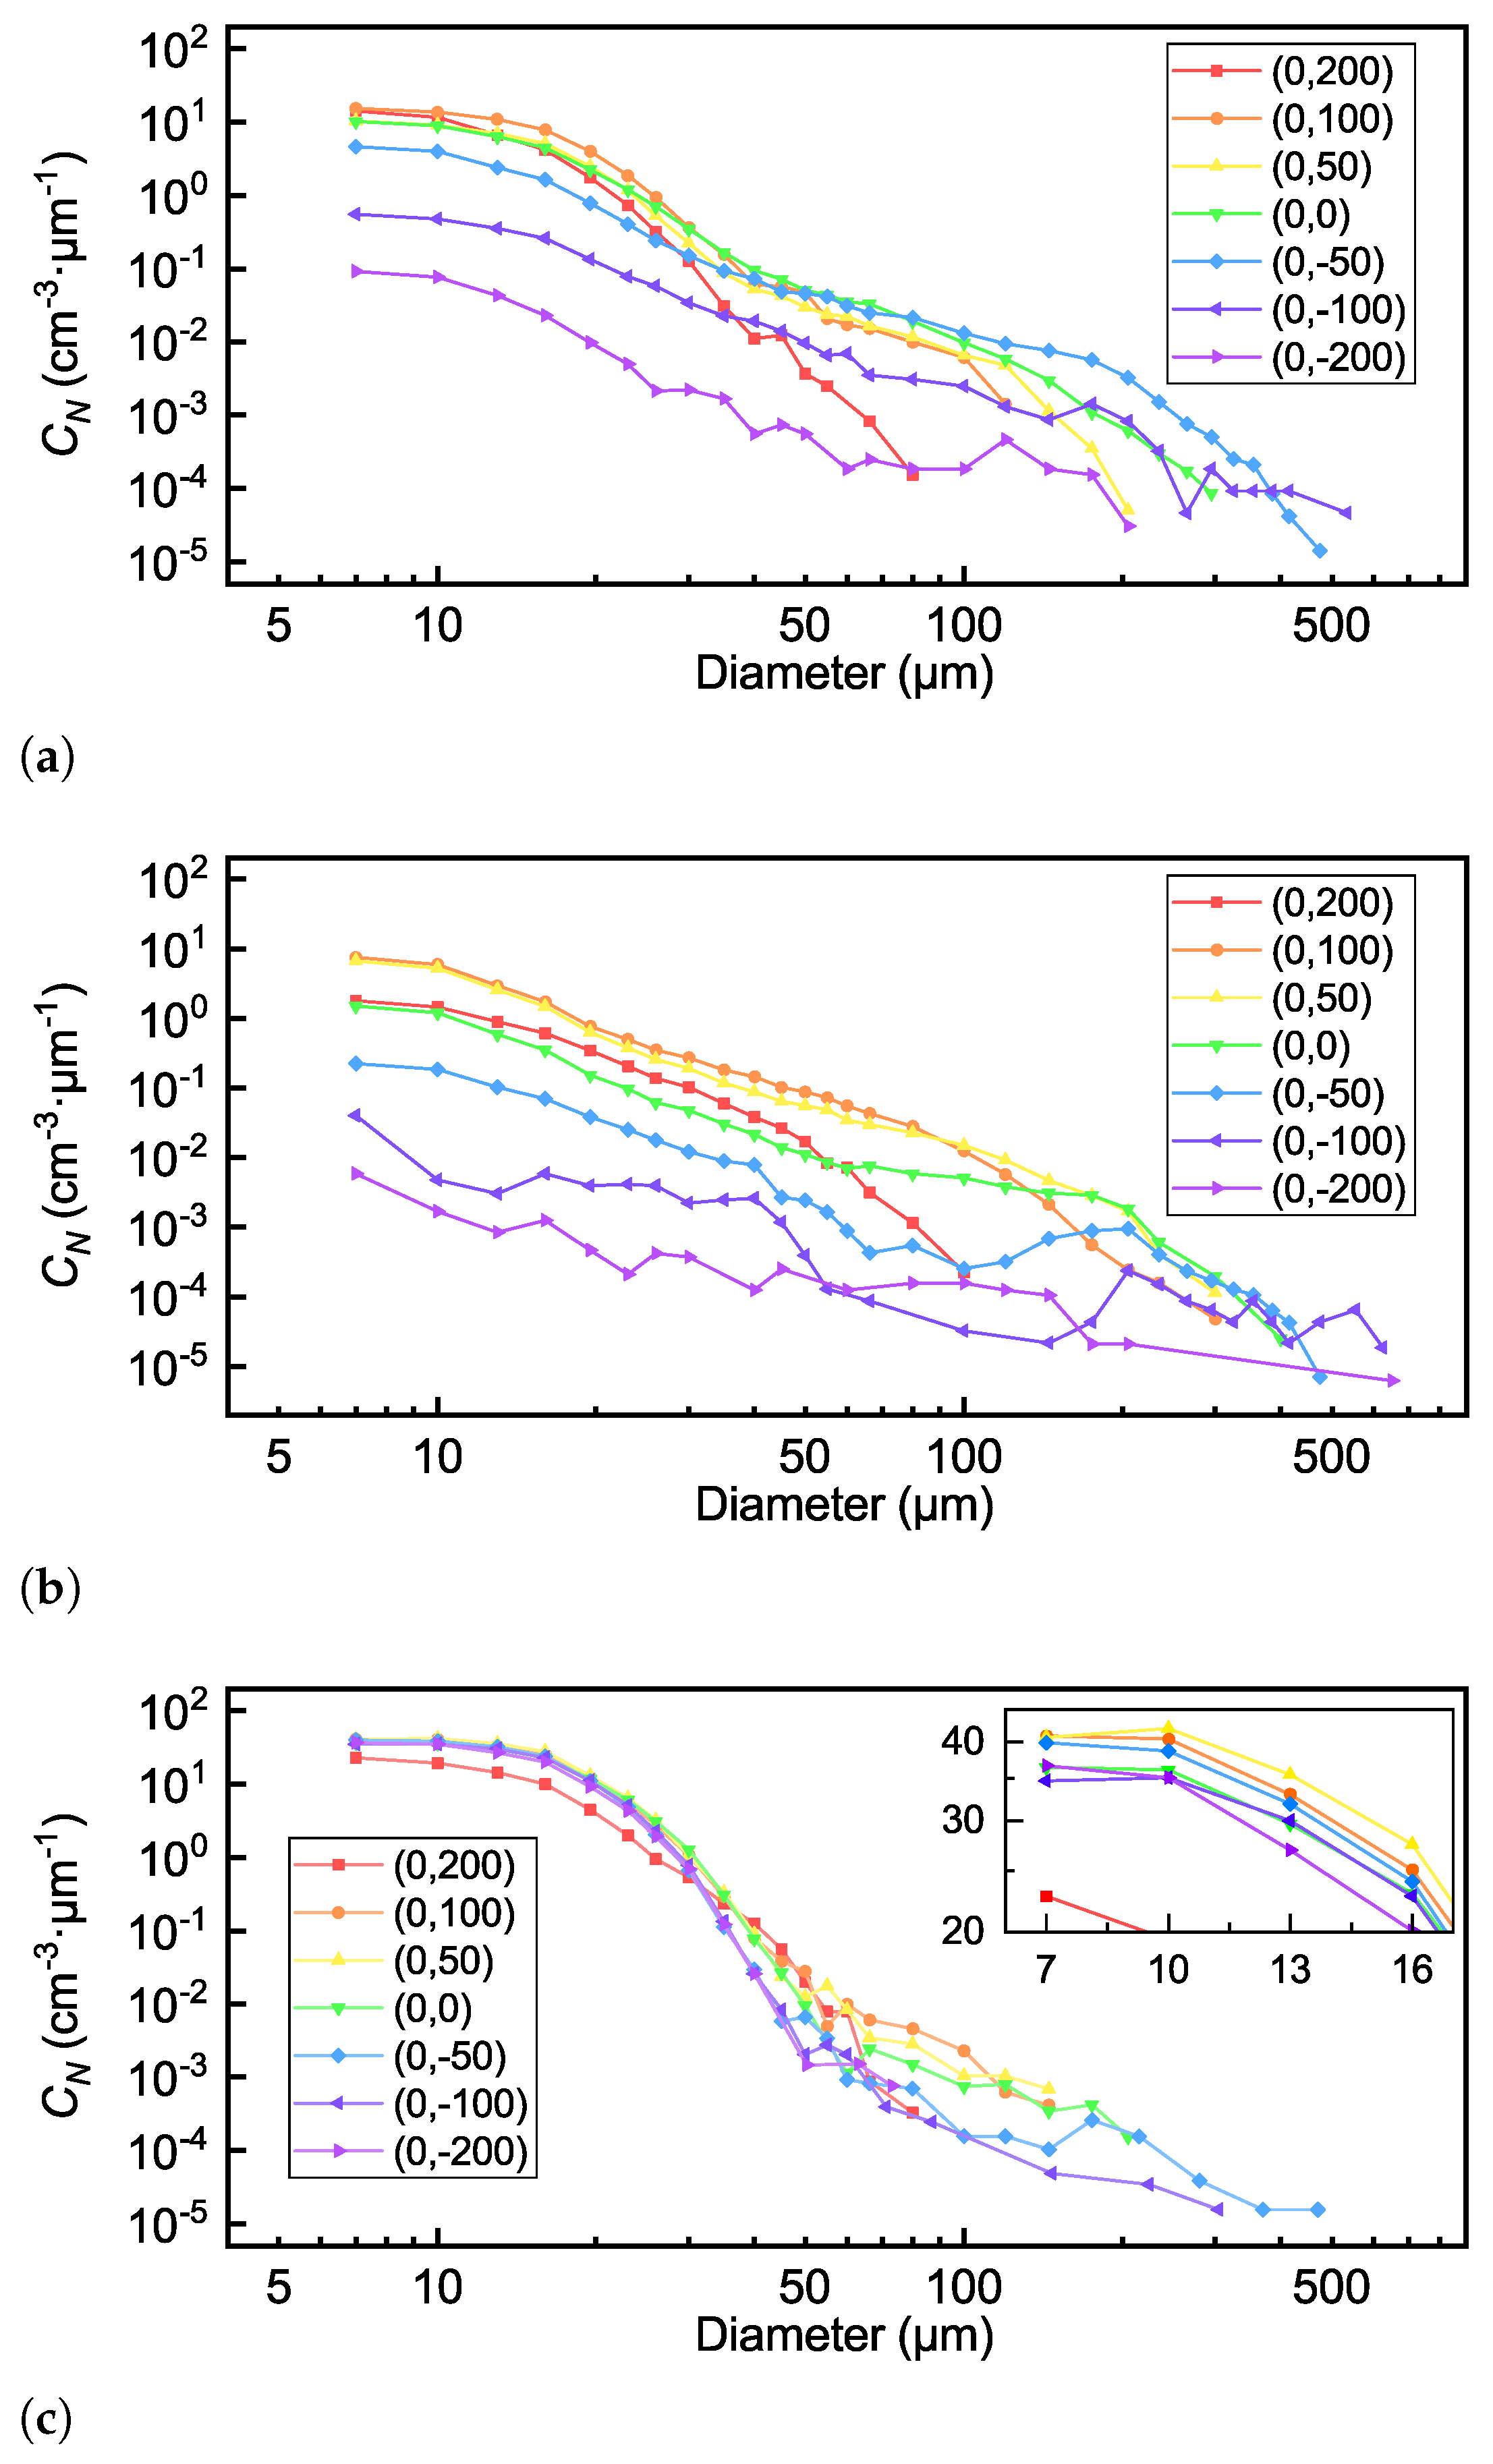
The spatial MVD distribution results in case 1 and case 2 clearly indicate the gravitational settling of large droplets. To further examine the size distribution characteristics of droplets at different vertical locations, the normalized particle number concentration curves of the three cases across the mm positions are presented in Figure 9. Due to the significant difference in the number of large and small particles, the droplet diameter range is divided into unequal intervals to minimize excessive fluctuations in the statistical curves. The size bin width for the plotted curves is 3 m for the size range from 7 m to 27.5 m, and 5 m from 27.5 m to 62.5 m. For droplets larger than 62.5 m, the bin width is adjusted as needed, ranging from 20 m to 100 m.
Figure 9.
The normalized particle number concentration curve variation in vertical locations at the mm positions. The Y positions range from 200 mm to −200 mm. (a) Case 1. (b) Case 2. (c) Case 3.
Across all the test points in the three cases, the value generally decreases as the droplet diameter increases. The maximum values for different size ranges are observed at different test points. In case 1, for droplets with diameters less than 20 m, the values measured at test points below the centerline are lower than those measured above the centerline. Within the 10–30 m diameter range, the values at (0, 100) are the highest among these test points. For droplets larger than 50 m, due to the influence of gravity, the values at lower test points exceed those at higher test points. When the diameter is between 100 and 400 m, the value at the test point (0, −50) becomes the largest.
With only two Mod-large nozzles in the same row activated, the settlement of large droplets in case 2 is clearer than that in case 1. In the droplet size range below 50 m, the values at each test point largely reflect the initial spatial distribution of the droplets. The closer the test point is to the relative position of the activated nozzle, the higher the value. The highest value below 80 m occurs at (0, 100), which is very close to the value at (0, 50). At the test points below the centerline, the values are much smaller than those at higher positions by an order of magnitude. For large droplets, the effect of gravity on their spatial distribution is apparent. When the droplet sizes are over 100 m, the value at (0, 100) becomes smaller than that at (0, 50). At (0, −50) and (0, −100), the curves exhibit a local minimum at about 100 m, after which the values increase with the diameter until they reach a peak at about 200 m.
Although the MVD values for case 3 are similar at different locations, the specific droplet size distribution features differ as shown in Figure 9c. The curves for droplets smaller than 30 m in case 3 are relatively consistent except at the Y = 200 mm position, where the absence of activated nozzles within the third row may lead to lower droplet density. Within the size range under 16 m, the value at the test point (0, 50) are the largest as the enlarged curves. Within the 60–100 m range, the values at (0, 100) is the highest among these test points. The largest detected droplet diameter along the Y direction reaches 476.7 m at (0, −50). The droplet spectra at Y = 200 mm and Y = −200 mm reveal an absence of large droplets with sizes exceeding 80 m.
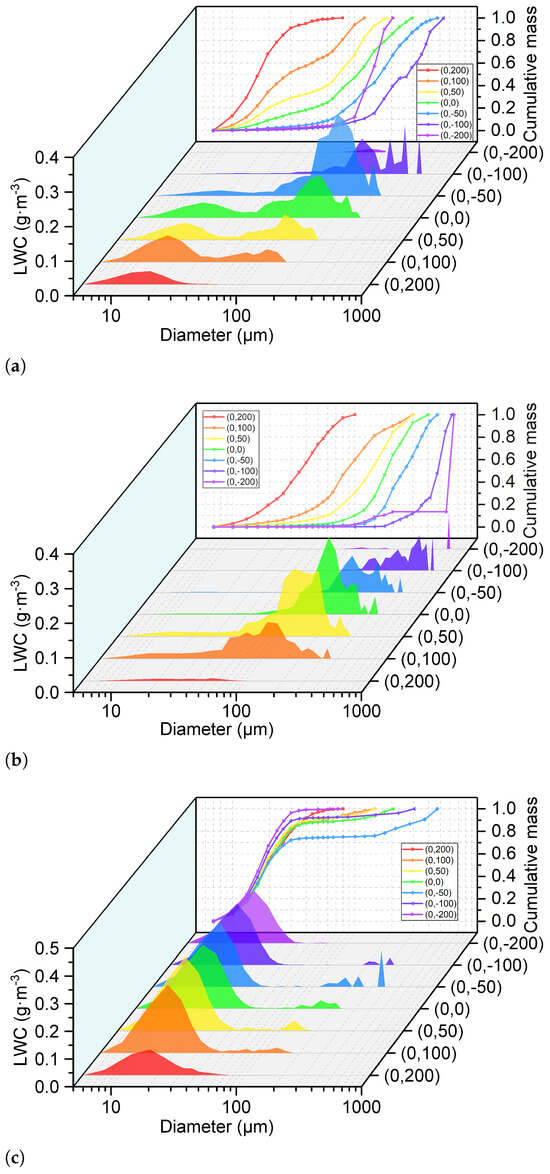
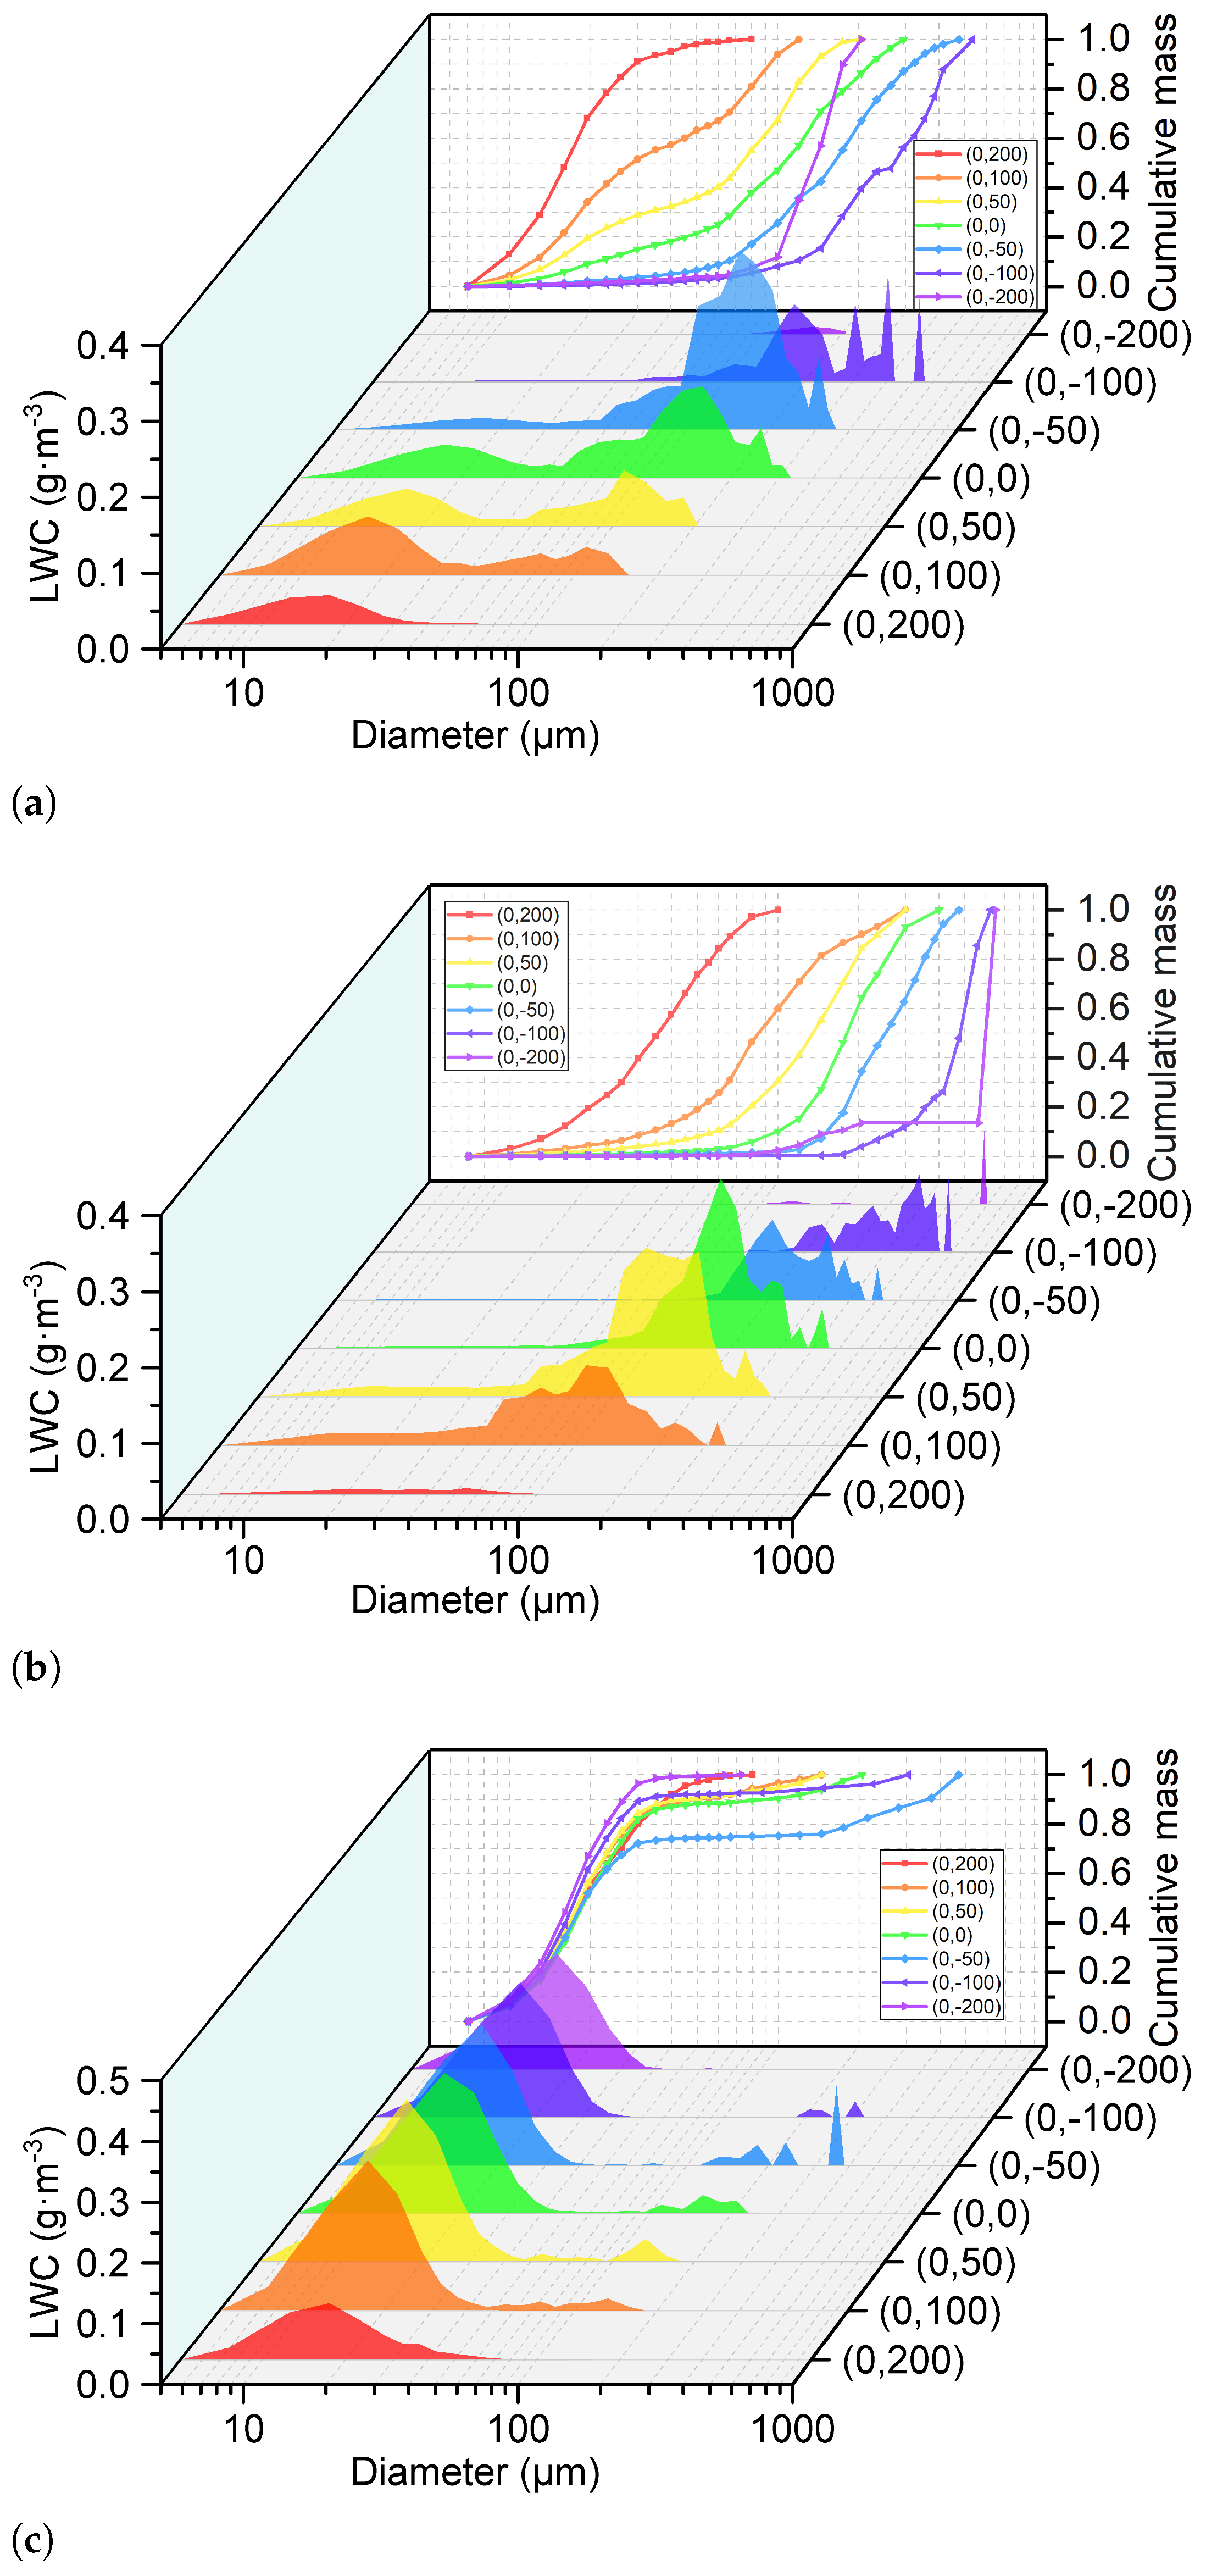
Although large droplets are less numerous compared to smaller ones, their greater individual volume leads to a more pronounced impact on the liquid water content. Figure 10 shows the LWC distribution and the cumulative mass fraction curves across the Z = 0 mm positions for the three cases. Here, the size bin width of is 5 m for droplets smaller than 50 m and 10 m for those between 50 and 100 m. For droplets larger than 100 m, the bin width is set to 25 m.
Figure 10.
The LWC distribution and the cumulative mass fraction curves across the mm positions. (a) Case 1. (b) Case 2. (c) case 3.
An obvious characteristic of the SLD cloud is the bimodal state of the size distribution. In case 1 and case 3, the bimodal pattern is confined to the region spanning Y positions from −50 mm to 100 mm. The first peak lies within the 10–30 m range, while the second spans from 80 m to 200 m. The LWC peak for the large droplets shifts to a larger diameter as the test point moves lower. In case 1, the LWC values of the first and second peaks exhibit opposite trends along the vertical direction. For small droplets, the maximum LWC value occurs at (0, 100), whereas for large droplets, it occurs at (0, −50). The LWC contributed, as droplets larger than 50 m increase as the test point height decreases from 100 mm to −50 mm and then decreases, which corresponds to the variation in the LWC shown in Figure 8a.
As Y decreases from 200 mm to −100 mm, the cumulative mass curves for case 1 and case 2 shift rightward, indicating a continuous reduction in the contribution of small droplets to the LWC and an increasing contribution from larger droplets. For case 2, with increased water and air pressures supplied to the Mod-large nozzles, the large droplet size range is much broader than that in case 1. Additionally, the maximum LWC value is observed at a higher location than that in case 1, which may be due to the increase in initial droplet velocity. Meanwhile, reduced water pressure to the Mod-large nozzles in case 3 results in a narrower size spectrum for large droplets than that case 1.
As shown in Figure 10, the contribution ratio of droplets of different sizes to the LWC at different positions varies with the initial spray conditions, especially for large droplets. Here, is defined as the Y positions where the maximum along the vertical direction occurs for each statistical diameter range, as shown in Figure 11. For case 1, decreases monotonically as the diameter increases. At −50 mm, the LWC of droplets in the 70–300 m size range is the highest along the vertical direction, while the LWC of droplets larger than 300 m is highest at Y = −100 mm. For case 2, shows a similar trend to case 1. For droplets in the 40–300 m range, in case 2 tends to be higher than in case 1. For droplets larger than 300 m, primarily remains at −100 mm and occasionally occurs at higher positions. The for case 3 shows two distribution patterns for large and small droplets due to the expanded nozzle layout range. For droplets larger than 60 m, the distribution pattern matches that in case 2.
Figure 11.
The Y positions where the maximum along the vertical direction occurs for each statistical diameter range.
In summary, the settling effect of droplets larger than 50 m is evident under the three test cases. Droplets produced by an individual nozzle can cover an area in the test section with a length exceeding 200 mm in the vertical direction. Meanwhile, for case 1, the length of the area in the horizontal direction is limited to about 150 mm, as shown in Figure 8a. Droplets larger than 300 m tend to appear near the lower edge of the cloud area. By adjusting the water and air supply pressures of the nozzle, the spatial distribution range of large particles can be altered.
3.4. Cloud Uniformity in the Same Radial Distance
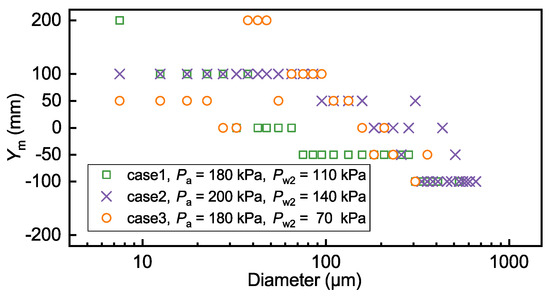
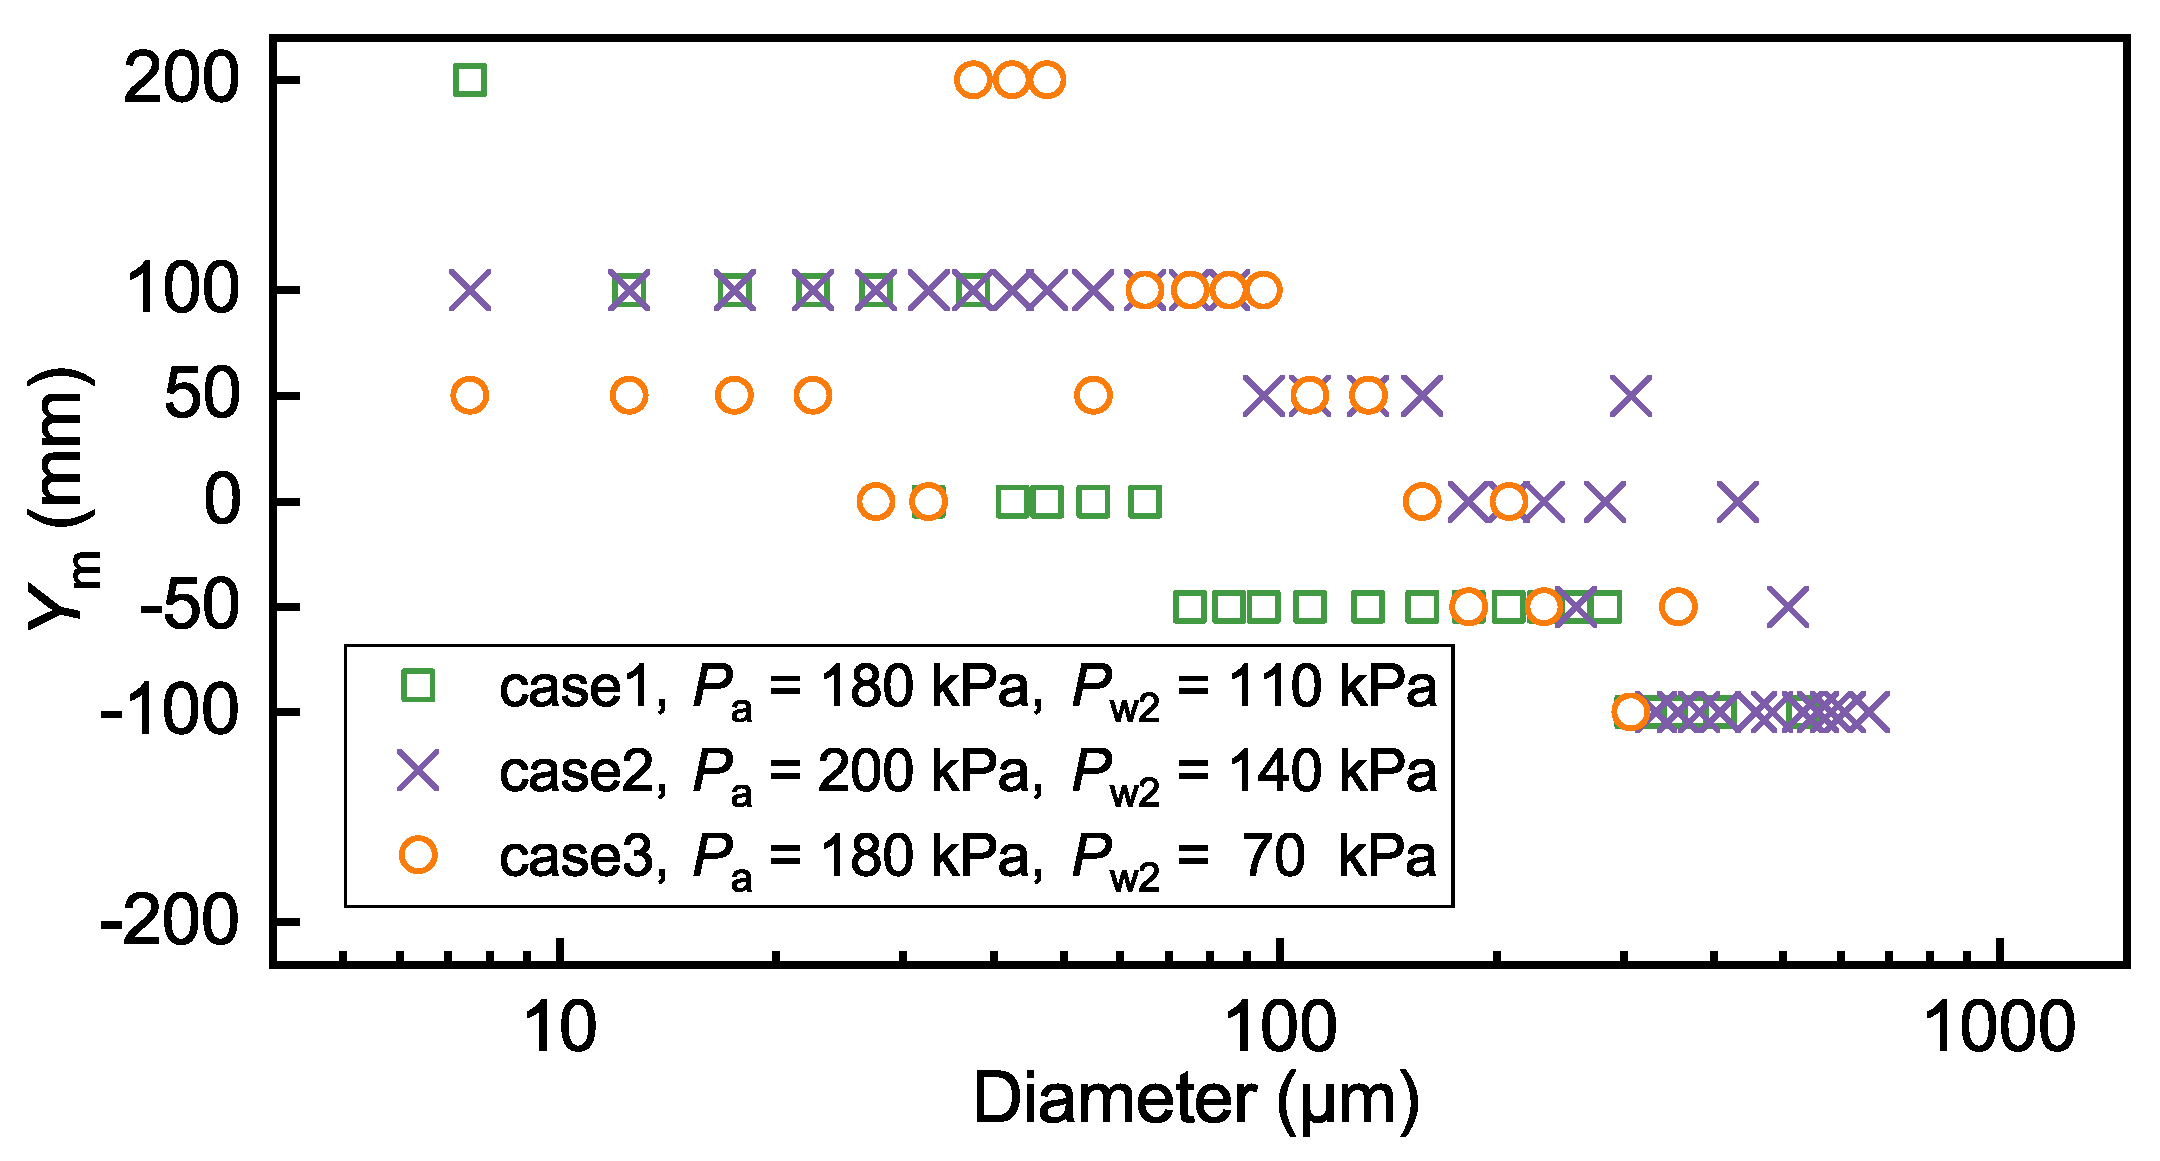
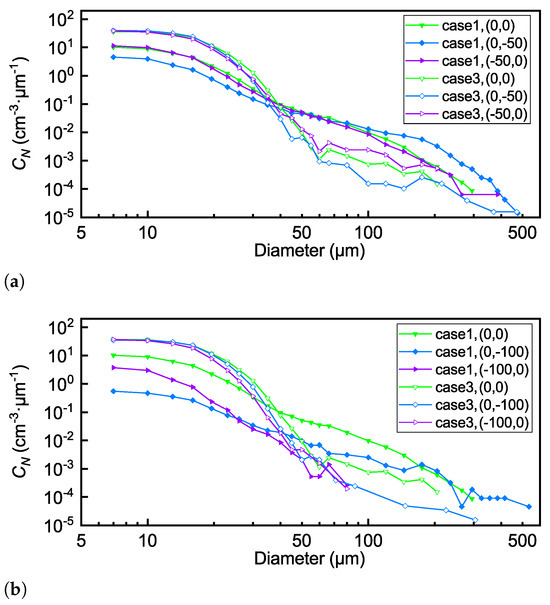
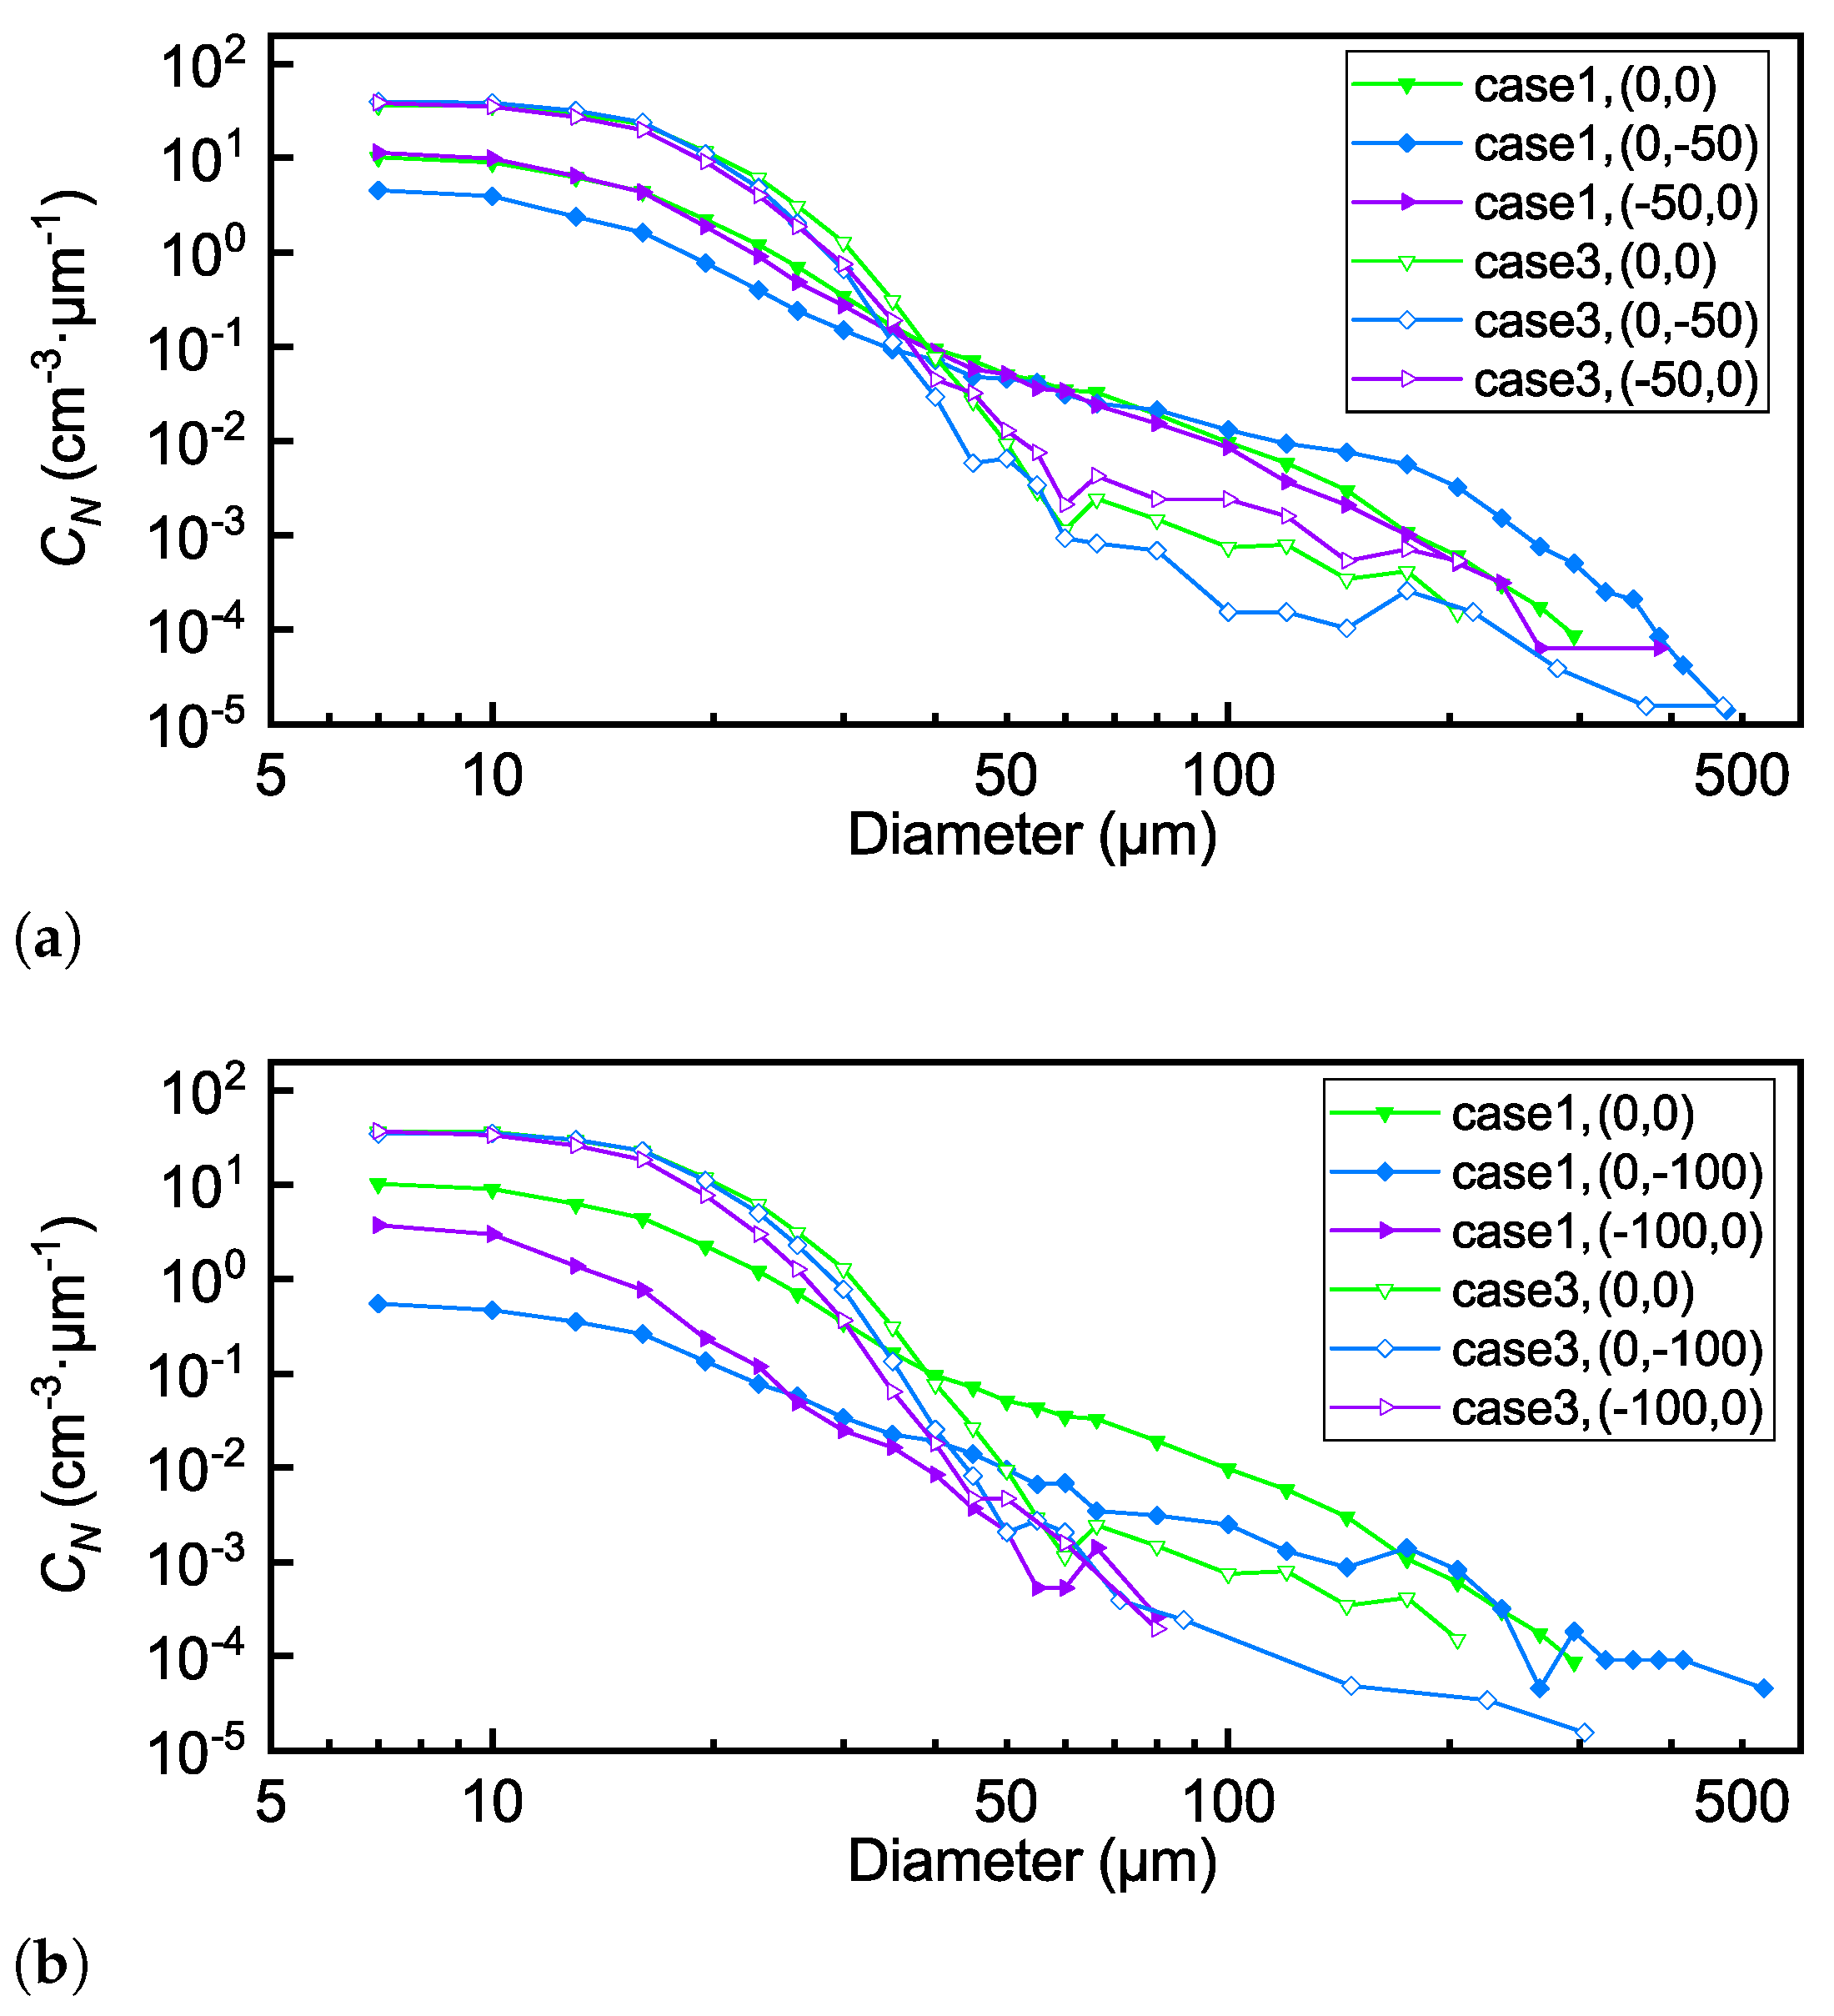
For the size range of large droplets, the difference between case 1 and case 3 lies solely in the air pressure of the Mod-large nozzle. Figure 12 compares the curves for both horizontal and vertical directions at distances of 50 mm and 100 mm from the center point (0, 0) in the two cases. Since the activated nozzle position is not located at the horizontal center of the spray bar, the center of the cloud coverage area when the droplets are transported to the test section is also not located at point (0, 0). For the selected test points, case 1 exhibits higher values than case 3 in the range above 50 m. At the three specified locations, the curves for case 1 are relatively close within the 50–100 m particle size range. This indicates that appropriately increasing the nozzle water pressure improves the uniformity of SLD cloud particles, which may result from the increased atomization cone angle.
Figure 12.
The curves in the same radial distance from the center point (0, 0) in case 1 and case 3. (a) The curves at distances of 50 mm from the center point. (b) The curves at distances of 100 mm from the center point.
For either case, the largest droplets at (0, 0) and (−50, 0) sizes close. Meanwhile, as shown in Figure 12b, neither case at (−100, 0) exhibits particles larger than 90 m, indicating that the current large particles cannot be transported to this region. Moreover, the values within 50–100 m at (0, −100) are much smaller than those at (0, 0), indicating the limited area that a single nozzle covers. The spatial distribution of droplets in the testing section is largely dependent on the initial spray formed by the nozzles with various arrangement. For the Mod-large nozzle, the distribution features are distinct in the horizontal and vertical direction. Thus, to achieve a uniform cloud in size distributions for SLD conditions, the effort should be made both in the nozzle position’s setup and the supplied air and water pressure in different rows with specific heights.
4. Conclusions
In this study, the spatial characteristics of droplet size distribution and concentration of three SLD conditions are investigated in FL-61 icing wind tunnel. The key results are summarized as follows:
- An in situ measurement system for droplet spatial distribution has been developed in the wind tunnel test section, integrating a holographic imaging probe named HACPI with a two-axis motorized traversing system. The integrated system enables multi-parameter measurement for SLDs with high efficiency and flexibility. The droplet images, droplet sizes, 3D locations and the LWC are obtained at 12 horizontal and vertical positions in three spray conditions. Droplet deformation phenomena for droplets larger than 400 m are observed in images obtained at specific test points below the test section centerline. The aspect ratio of deformed droplets increases with droplet size.
- The MVD values in the center test point (0, 0) vary from 21 m to 195 m. For the two spray arrangements where the activated nozzles are close together, the test point where the LWC peak occurs in the vertical direction is higher than the test point of the MVD peak. Meanwhile, both peaks are relatively lower compared to the nozzle locations.
- The results of the size distribution of droplets in the vertical direction show the settling effect of large droplets evidently. For droplets under 50 m, the value at each test point largely reflects the initial spatial distribution of the droplets, which decreases as the test point moves away from the position corresponding to the nozzle location. Meanwhile, the LWC contributed by droplets larger than 50 m generally grows as the test point move downwards. Droplets larger than 300 m tend to appear near the lower edge of the cloud coverage area, which is (0, −50) or (0, −100) for the select cases.
In summary, the integrated measurement system is a promising tool for quantifying droplets’ spatial distribution in icing wind tunnels, which can also be adapted to altitude test facilities for aero-engine tests. Meanwhile, several limitations should be acknowledged, and these can be addressed in future studies. First, increasing the number of activated nozzles and extending the sampling duration would improve the representativeness and accuracy of the data. Additionally, incorporating numerical simulations to analyze the spatial evolution of droplets would provide a deeper understanding of how variations in airspeed and release height affect droplet behavior. To further advance this area of research, we propose utilizing holographic particle tracking velocimetry in future studies to quantify droplet velocity slip and conduct a more comprehensive investigation into droplet deformation. Finally, comparing the spatial distribution results with ice accretion patterns of the icing grid or standard airfoil models at lower airflow total temperatures would offer valuable insights into the real impact of droplet size distribution on ice formation dynamics.
Author Contributions
Conceptualization, L.Z. and Y.W.; methodology, L.Z.; software, B.W.; validation, L.Z.; formal analysis, L.Z.; investigation, L.Z., Z.Z. and X.G.; resources, X.W., S.L., Q.X. and Z.L.; data curation, L.Z. and B.W.; writing—original draft preparation, L.Z.; writing—review and editing, Y.W.; supervision, Y.W.; and funding acquisition, Y.W. All authors have read and agreed to the published version of the manuscript.
Funding
This research was funded by Natural Science Foundation of Zhejiang Province for Distinguished Young Scholars (Grant No. LR24E060002).
Institutional Review Board Statement
Not applicable.
Informed Consent Statement
Not applicable.
Data Availability Statement
The original contributions presented in this study are included in the article. Further inquiries can be directed to the corresponding author.
Conflicts of Interest
The authors declare that the research was conducted in the absence of any commercial or financial relationships that could be construed as a potential conflict of interest.
References
- Tetteh, E.; Loth, E.; Neuteboom, M.O.; Fisher, J. In-flight gas turbine engine icing. AIAA J. 2022, 60, 5610–5632. [Google Scholar] [CrossRef] [Scilit]
- Yamazaki, M.; Jemcov, A.; Sakaue, H. A review on the current status of icing physics and mitigation in aviation. Aerospace 2021, 8, 188. [Google Scholar] [CrossRef] [Scilit]
- Cao, Y.; Tan, W.; Wu, Z. Aircraft icing: An ongoing threat to aviation safety. Aerosp. Sci. Technol. 2018, 75, 353–385. [Google Scholar] [CrossRef] [Scilit]
- SAE Standard AIR5320A; Summary of Icing Simulation Test Facilities. SAE: Warrendale, PA, USA, 2015. [CrossRef] [Scilit]
- Guo, X.; Wang, Z.; Zhao, R.; Wu, Y.; Wu, X.; Yi, X. Liquid water content measurement with SEA multi-element sensor in CARDC icing wind tunnel: Calibration and performance. Appl. Therm. Eng. 2023, 235, 121255. [Google Scholar] [CrossRef] [Scilit]
- Federal Aviation Administration. Appendix C, Icing Design Envelopes, Part 25, Title 14; Code of Federal Regulations, Amendment 25–140; Federal Aviation Administration: Washington, DC, USA, 2015.
- Federal Aviation Administration. Appendix O, Supercooled Large Drop Icing Conditions, Part 25, Title 14; Code of Federal Regulations, Amendment 25–140; Federal Aviation Administration: Washington, DC, USA, 2015.
- Cober, S.G.; Isaac, G.A.; Strapp, J.W. Characterizations of Aircraft Icing Environments that Include Supercooled Large Drops. J. Appl. Meteorol. 2001, 40, 1984–2002. [Google Scholar] [CrossRef] [Scilit]
- Orchard, D.M.; Clark, C.; Oleskiw, M. Development of a Supercooled Large Droplet Environment Within the NRC Altitude Icing Wind Tunnel; Technical Report, SAE Technical Paper; SAE: Warrendale, PA, USA, 2015. [Google Scholar] [CrossRef] [Scilit]
- Zante, J.F.V.; Ratvasky, T.P.; Bencic, T.J.; Challis, C.C.; Timko, E.N.; Woike, M.R. Update on the NASA Glenn Propulsion Systems Lab Icing and Ice Crystal Cloud Characterization (2017). In Proceedings of the 2018 Atmospheric and Space Environments Conference, Atlanta, GA, USA, 25–29 June 2018; p. 3969. [Google Scholar] [CrossRef] [Scilit]
- Bansmer, S.E.; Baumert, A.; Sattler, S.; Knop, I.; Leroy, D.; Schwarzenboeck, A.; Jurkat-Witschas, T.; Voigt, C.; Pervier, H.; Esposito, B. Design, construction and commissioning of the Braunschweig Icing Wind Tunnel. Atmos. Meas. Tech. 2018, 11, 3221–3249. [Google Scholar] [CrossRef] [Scilit]
- SAE Standard ARP5905; Calibration and Acceptance of Icing Wind Tunnels. SAE: Warrendale, PA, USA, 2015. [CrossRef] [Scilit]
- Tsao, J.C.; Potapczuk, M.G. Comparison of Bimodal Ice Shapes on Full-Chord and Hybrid CRM midspan Models. In Proceedings of the AIAA AVIATION 2022 Forum, Chicago, IL, USA, 27 June–1 July 2022; p. 4068. [Google Scholar] [CrossRef] [Scilit]
- Bhargava, C.; Loth, E.; Potapczuk, M. Numerical Simulation of Icing Clouds in the NASA Glenn Icing Research Tunnel. J. Aircr. 2005, 42, 1442–1451. [Google Scholar] [CrossRef] [Scilit]
- Lee, A.; Loth, E. Droplet dispersion in the icing research tunnel. In Proceedings of the AIAA Atmospheric and Space Environments Conference, Toronto, ON, Canada, 2–5 August 2010; p. 7533. [Google Scholar] [CrossRef] [Scilit]
- Zhang, H.; Guan, B.; Wei, R.; Bai, B. Effect of the spray bar on gas–liquid two-phase flow characteristics in icing wind tunnel. Appl. Therm. Eng. 2025, 262, 125303. [Google Scholar] [CrossRef] [Scilit]
- Guo, X.; Guo, Q.; Zhao, R.; Wu, Y.; Wu, X.; Yi, X. Cloud spatial evolution characteristics under some supercooled large drop conditions in a large-scale icing wind tunnel: Effects of the gravity and airflow contraction on cloud size, cloud uniformity, and particle morphology. Aerosp. Sci. Technol. 2026, 168, 111141. [Google Scholar] [CrossRef] [Scilit]
- King, M.C.; Bachalo, W.; Bell, D.; King-Steen, L.C. Weber Number Tests in the NASA Icing Research Tunnel. In Proceedings of the 2018 Atmospheric and Space Environments Conference, Atlanta, GA, USA, 25–29 June 2018; p. 3184. [Google Scholar] [CrossRef] [Scilit]
- Tsao, J.C.; Vargas, M.M.; Sabri, Z.H.; Insana, E.; Stewart, E.; Timko, E.; Payne, G. Characterization of Large Drop Velocity in the NASA Icing Research Tunnel. In Proceedings of the AIAA Aviation Forum and Ascend 2024, Las Vegas, NV, USA, 29 July–2 August 2024; p. 4245. [Google Scholar] [CrossRef] [Scilit]
- Ferschitz, H.; Wannemacher, M.; Bucek, O.; Knöbel, F.; Breitfuß, W. Development of SLD Capabilities in the RTA Icing Wind Tunnel. SAE Int. J. Aerosp. 2017, 10, 12–21. [Google Scholar] [CrossRef] [Scilit]
- Fallast, A.; Rapf, A.R.; Tramposch, A.; Hassler, W. Kinetic and thermal simulation of water droplets in icing wind tunnels. CEAS Aeronaut. J. 2021, 13, 181–198. [Google Scholar] [CrossRef] [Scilit]
- Breitfuß, W.; Wannemacher, M.; Knöbl, F.; Ferschitz, H. Aerodynamic comparison of freezing rain and freezing drizzle conditions at the RTA icing wind tunnel. SAE Int. J. Adv. Curr. Pract. Mobil. 2019, 2, 245–255. [Google Scholar] [CrossRef] [Scilit]
- Lucke, J.; Jurkat-Witschas, T.; Heller, R.; Hahn, V.; Hamman, M.; Breitfuss, W.; Bora, V.R.; Moser, M.; Voigt, C. Icing wind tunnel measurements of supercooled large droplets using the 12 mm total water content cone of the Nevzorov probe. Atmos. Meas. Tech. 2022, 15, 7375–7394. [Google Scholar] [CrossRef] [Scilit]
- Korolev, A.; Emery, E.; Creelman, K. Modification and Tests of Particle Probe Tips to Mitigate Effects of Ice Shattering. J. Atmos. Ocean. Technol. 2013, 30, 690–708. [Google Scholar] [CrossRef] [Scilit]
- Bencic, T.; Fagan, A.; Van Zante, J.F.; Kirkegaard, J.P.; Rohler, D.P.; Maniyedath, A.; Izen, S.H. Advanced Optical Diagnostics for Ice Crystal Cloud Measurements in the NASA Glenn Propulsion Systems Laboratory. In Proceedings of the 5th AIAA Atmospheric and Space Environments Conference, San Diego, CA, USA, 24–27 June 2013; p. 2678. [Google Scholar] [CrossRef] [Scilit]
- Hervy, F.; Maguis, S.; Virion, F.; Esposito, B.; Pervier, H. Improvement of an altitude test facility capability in glaciated icing conditions at DGA Aero-engine Testing. SAE Int. J. Aerosp. 2015, 8, 9–14. [Google Scholar] [CrossRef] [Scilit]
- Chen, R.C.; Struk, P.M.; Ratvasky, T.P. Cloud uniformity measurement from NASA’s 2nd fundamental ice crystal icing test part 1 (water content & PSD). In Proceedings of the AIAA Aviation 2020 Forum, Online, 15–19 June 2020; p. 2840. [Google Scholar] [CrossRef] [Scilit]
- Agui, J.H.; Von Hardenberg, P.; Struk, P.M.; Chen, R.C.; Bartkus, T.P. Cloud uniformity measurement from NASA’s 2nd fundamental ice crystal icing test-part 2 (temperature & humidity). In Proceedings of the AIAA Aviation 2020 Forum, Online, 15–19 June 2020; p. 2841. [Google Scholar] [CrossRef] [Scilit]
- Woike, M.R.; Ponder, J.D.; Van Zante, J.F.; Bencic, T.J.; King-Steen, L.; Timko, E.N.; Rohler, D.P.; Izen, S.H. The Demonstration of a Light Extinction Tomography System at the NASA Glenn Research Center’s Icing Research Tunnel. In Proceedings of the AIAA Aviation 2019 Forum, Dallas, TX, USA, 17–21 June 2019; p. 3287. [Google Scholar] [CrossRef] [Scilit]
- Wu, Y.; Zhang, L.; Wang, B.; Lin, X.; Huang, X.; Guo, X.; Wang, Z.; Li, S.; Zhang, Z.; Wu, X. Holographic Airborne for Cloud Particle Imager (HACPI): Development and Applications to Icing Wind Tunnels. IEEE Trans. Instrum. Meas. 2024, 74, 5000411. [Google Scholar] [CrossRef] [Scilit]
- Guo, X.; Wang, Z.; Zhao, R.; Wu, Y.; Wu, X.; Yi, X.; Li, M. Particle size distribution measurements under supercooled large drop conditions with cloud combination probe in CARDC icing wind tunnel. Powder Technol. 2024, 434, 119378. [Google Scholar] [CrossRef] [Scilit]
- Wu, Y.; Yu, L.; Li, S.; Zhu, D.; Zhang, Z. Study on the effect of icing wind tunnel spray system control on liquid water content. In Proceedings of the China Aeronautical Science and Technology Conference; Springer: Berlin/Heidelberg, Germany, 2023; pp. 670–680. [Google Scholar]
- Yu, L.; Wu, Y.; Zhao, H.; Zhu, D. A study on the sensitivities of an ice protection system combining thermoelectric and superhydrophobic coating to icing environment parameters. Appl. Sci. 2023, 13, 6607. [Google Scholar] [CrossRef] [Scilit]
- Zhang, Z.; Zhao, H.; Zhu, D.; Dai, H.; Wang, Z. Experimental Study on the Icing of Rotating Intake Cones in Wind Tunnels Under Supercooled Large-Droplet Conditions. Aerospace 2025, 12, 384. [Google Scholar] [CrossRef] [Scilit]
- Guo, X.; Guo, Q.; Zhao, R.; Wu, Y.; Wu, X.; Yi, X. Experimental investigation on cloud temporal evolution characteristics under SLD icing conditions in large-scale icing wind tunnel: Cloud recirculation effects. Appl. Therm. Eng. 2025, 269, 125791. [Google Scholar] [CrossRef] [Scilit]
- Yingchun, W.; Xuecheng, W.; Jing, Y.; Zhihua, W.; Xiang, G.; Binwu, Z.; Linghong, C.; Kunzan, Q.; Gréhan, G.; Kefa, C. Wavelet-based depth-of-field extension, accurate autofocusing, and particle pairing for digital inline particle holography. Appl. Opt. 2014, 53, 556–564. [Google Scholar] [CrossRef] [Scilit] [PubMed]
- Wang, B.; Zhang, L.; Huang, X.; Guo, X.; Wu, Y.; Wu, X.; Song, X.; Bai, P.; Shi, P.; Zhu, S.; et al. Simultaneous measurements of morphology, size distribution and concentration of ice crystals in icing wind tunnel with HACPI. Exp. Therm. Fluid Sci. 2024, 159, 111266. [Google Scholar] [CrossRef] [Scilit]
- Guildenbecher, D.R.; López-Rivera, C.; Sojka, P.E. Secondary atomization. Exp. Fluids 2009, 46, 371–402. [Google Scholar] [CrossRef] [Scilit]

Disclaimer/Publisher’s Note: The statements, opinions and data contained in all publications are solely those of the individual author(s) and contributor(s) and not of MDPI and/or the editor(s). MDPI and/or the editor(s) disclaim responsibility for any injury to people or property resulting from any ideas, methods, instructions or products referred to in the content. |
© 2026 by the authors. Licensee MDPI, Basel, Switzerland. This article is an open access article distributed under the terms and conditions of the Creative Commons Attribution (CC BY) license.