


Abstract
Considering the challenges currently faced in the civil air traffic management (ATM) domain, this study investigates an aircraft safety situation awareness method based on ADS-B surveillance data. First, a sector safety situation assessment framework is constructed, incorporating six-dimensional indicators such as peak-hour traffic volume and speed standard deviation. The information entropy method is employed to determine objective weights, and an improved fuzzy C-means clustering algorithm is used to classify safety situations into three levels: “good,” “moderate,” and “attention required.” On this basis, multiple prediction models are compared, among which the random forest model achieves the best performance with an accuracy of 90%. Experimental results indicate that, under the experimental conditions of this study, speed standard deviation and approach rate contribute most significantly to safety situation assessment. The proposed method provides air traffic management authorities with an objective and quantifiable technical solution for safety situation awareness.
1. Introduction
In recent years, China’s civil aviation industry has maintained rapid growth momentum [1,2,3]. According to statistics from the Civil Aviation Administration of China (CAAC), the national civil aviation passenger volume reached 620 million in 2023, with total transport turnover exceeding 110 billion ton-kilometers, and the number of flight takeoffs and landings continuing to rise. However, compared with the rapidly growing demand for air transportation, the supply of airspace resources in China remains relatively limited [4], with available airspace accounting for only about 30% of the total airspace. Structural contradictions in airspace utilization have thus become increasingly prominent [5,6,7]. The rapid increase in the number of aircraft has posed severe challenges to air traffic safety management [8,9].
The high-density and high-traffic operating environment has significantly increased controllers’ workload [10,11], making it difficult for traditional air traffic control modes—largely reliant on manual experience and judgment—to timely and comprehensively grasp the complex and dynamic airspace operational situation. Reduced separation between aircraft [12] and increased conflict risks place higher demands on controllers’ situation awareness capabilities and decision-making response speed [13]. How to achieve a balance between safety and efficiency under conditions of limited airspace resources has become a core issue that urgently needs to be addressed in the civil air traffic management domain. In response to these challenges, air traffic management is accelerating its transformation toward intelligence and automation [13]. The Global Air Navigation Plan proposed by the International Civil Aviation Organization (ICAO) clearly identifies trajectory-based operations [14] and digital information management [15,16] as future development directions. Meanwhile, the CAAC is actively promoting the development of “smart civil aviation.” Refs. [17,18] emphasize the use of emerging technologies such as big data and artificial intelligence to enhance air traffic management operational efficiency. Against this background, constructing intelligent situation awareness and prediction systems to enable real-time monitoring [19] and proactive early warning of airspace operational states has become an important direction for the modernization of air traffic management.
Air traffic management operational efficiency is typically evaluated through multiple dimensions, including traffic throughput (the number of aircraft handled within a given time period), delay performance (the extent to which flights adhere to scheduled times), predictability (the consistency of flight trajectories), and flexibility (the ability to accommodate user preferences while maintaining safety). These efficiency metrics are often interrelated with safety considerations—for instance, efforts to maximize throughput may lead to reduced separation margins, potentially increasing collision risks. Therefore, a comprehensive assessment of air traffic management performance must consider both safety and efficiency indicators in an integrated manner.
Sector safety situation awareness refers to the perception, comprehension, and projection of operational states within a defined airspace sector. It encompasses three hierarchical levels: perception of critical elements in the environment (e.g., aircraft positions, speeds, headings); comprehension of their meaning and significance (e.g., identifying potential conflicts, assessing traffic complexity); and projection of future states (e.g., predicting traffic patterns, anticipating workload peaks). In the context of air traffic control, situation awareness enables controllers to make informed decisions, anticipate developing risks, and maintain safe and orderly traffic flow. Traditional situation awareness relies heavily on controllers’ cognitive abilities, which can be strained under high traffic loads or complex scenarios. This has motivated the development of data-driven approaches to enhance and augment human situation awareness capabilities.
The widespread application of Automatic Dependent Surveillance–Broadcast (ADS-B) technology provides a solid data foundation for situation awareness research [20]. Compared with traditional radar surveillance, ADS-B offers advantages such as higher update rates, better accuracy, broader coverage, and richer information dimensions [21,22,23], enabling real-time acquisition of multidimensional aircraft state parameters including position, speed, altitude, and heading. At present, ADS-B ground stations have been widely deployed at major airports and air routes across China, creating favorable conditions for data-driven research on airspace safety situation awareness. An ADS-B ground station typically consists of a receiver antenna, signal processing unit, and communication interface. The receiver captures 1090 MHz Extended Squitter messages (in the case of Mode S-equipped aircraft), which are then decoded to extract flight identification, position (latitude, longitude, altitude), velocity, and other parameters. These decoded data are transmitted to air traffic control centers for display and processing, enabling real-time traffic monitoring.
Addressing existing issues in sector safety situation awareness—such as insufficient data utilization, strong subjectivity in assessment methods, and limited predictive capability—this study takes the Nanjing approach control sector as the research object and conducts a systematic investigation of safety situation awareness methods based on ADS-B surveillance data. The research covers four main aspects: data preprocessing, indicator system construction [24,25], situation assessment model design [26], and situation prediction methodology [27,28,29,30].
2. ADS-B Data Preprocessing and Safety Situation Indicator Selection
2.1. ADS-B Data Preprocessing
Automatic Dependent Surveillance–Broadcast (ADS-B) has been identified by the International Civil Aviation Organization (ICAO) as a key surveillance technology for the future. Aircraft automatically broadcast flight state information such as position, speed, altitude, and heading through onboard equipment, offering advantages including a high update rate (1 Hz), high positioning accuracy, and wide coverage. In this study, the Nanjing approach control sector is selected as the research object, and ADS-B surveillance data collected over a total of 71 days from 1 October to 10 December 2024 are used.
The Nanjing approach control area is administered by the East China Air Traffic Management Bureau and covers approximately 90,000 square kilometers of airspace in central and northern Jiangsu Province, providing air traffic control services for arrivals, departures, and overflights of 11 airports. The horizontal boundaries of the control area are roughly between 31°30′ and 35°00′ north latitude and 117°00′ and 121°00′ east longitude, with a vertical range from ground level up to 6000 m. The raw ADS-B messages adopt the standard Mode S Extended Squitter format, and each message contains key fields such as the ICAO 24-bit aircraft address, position, altitude, speed, heading, and timestamp.
However, raw ADS-B data inevitably contain noise, missing values, and anomalies during transmission and reception. Direct use of such data would adversely affect the accuracy of subsequent analyses. Therefore, systematic preprocessing of the raw data is required prior to conducting safety situation awareness research. The data preprocessing procedure consists of four main steps:
- Missing value handling: Messages with missing key fields (position, speed, or altitude) are removed.
- Outlier detection and removal: The 3σ principle is applied to identify and eliminate physically unreasonable values.
- Temporal resampling: For resampling time instants without direct observations, linear interpolation is used to estimate intermediate values.
- Spatial filtering: Using the three-dimensional boundaries of the Nanjing approach sector as constraints, only trajectory points located within the sector are retained.
After the above preprocessing steps, valid trajectory data for approximately 82,000 flights over 71 days are obtained.
2.2. Safety Situation Indicator Selection
Safety situation indicators serve as quantitative tools for characterizing the operational state of a sector. A well-designed indicator system should comprehensively reflect traffic load, operational efficiency, and potential risks within the sector. The construction of a scientific and reasonable safety situation indicator system should adhere to the principles of comprehensiveness, measurability, independence, sensitivity (i.e., indicators should be sensitive to changes in sector operating conditions and capable of promptly reflecting state variations), and interpretability.
Statistical analysis of the collected data reveals that the Nanjing approach sector is characterized by a complex airspace structure, significant temporal variations in traffic flow, speed dispersion caused by mixed aircraft types, and non-uniform utilization of altitude layers. Furthermore, meteorological conditions, as critical external environmental factors, exert a substantial influence on sector operational states. Adverse weather phenomena—such as thunderstorms, strong winds, low visibility, and icing—not only directly threaten flight safety but also indirectly affect various safety situation indicators by altering aircraft operational behaviors. For example, strong crosswinds necessitate frequent heading corrections during approach, leading to an increase in the mean heading change rate; low visibility conditions may trigger go-arounds or diversions, resulting in a decreased approach rate; while wind shear and turbulence exacerbate speed fluctuations, thereby increasing the speed standard deviation. Therefore, when constructing a safety situation indicator system, the indirect effects transmitted through aircraft operational behaviors under varying meteorological conditions should be fully considered.
Based on the aforementioned analysis of sector operational characteristics and meteorological influences, this study constructs the safety situation indicator system from three dimensions—efficiency indicators, safety indicators, and sector traffic indicators—and ultimately selects six indicators: approach rate (reflecting traffic flow structure and weather-induced perturbations to approach efficiency), speed standard deviation (reflecting the risk of overtaking conflicts and speed dispersion caused by wind field conditions), mean heading change rate (reflecting trajectory complexity and maneuvering behaviors for adverse weather avoidance), altitude layer distribution entropy (reflecting the balance of altitude utilization and altitude concentration caused by meteorological factors such as avoiding icing or turbulence layers), peak-hour traffic volume (reflecting capacity pressure), and airspace density at hotpot periods (reflecting the degree of airspace congestion and density anomalies caused by diverted flight influx). These indicators not only characterize routine operational states but also indirectly capture the impact of adverse weather on sector safety situations, demonstrating strong comprehensive representation capability.
3. Safety Situation Awareness Indicator Extraction and Assessment Model Construction
3.1. Calculation Methods for Safety Situation Awareness Indicators
Based on the preprocessed ADS-B data, this section elaborates on the specific calculation methods for the six safety situation indicators. All indicators are computed using a daily basis as the fundamental statistical unit.
- Peak-hour traffic volume (F_peak) is defined as the number of aircraft movements passing through the sector during the one-hour period with the highest traffic volume in a day. The number of aircraft entering or traversing the Nanjing approach sector in each hourly interval is denoted as Fi (i = 1, 2, …, 24). The maximum value among the 24-h traffic volumes is taken as the daily peak-hour traffic volume [31]:
- Speed standard deviation (σv) reflects the dispersion of aircraft speeds within the sector and is a key indicator for assessing the complexity of mixed aircraft-type operations. The standard deviation are calculated as follows [32]:where vi represents the ground speed values extracted from individual ADS-B messages within the Nanjing approach sector on a given day, is the mean speed of all samples, and N is the total number of valid speed samples.
- Altitude layer distribution entropy (Halt) uses Shannon information entropy to quantify the uniformity of aircraft distribution in the vertical dimension. The vertical airspace of the Nanjing approach sector is divided into 24 altitude layers at intervals of 1000 feet. The proportion (pj) of ADS-B messages within each altitude layer is calculated, and the Shannon entropy is computed as [33]:The theoretical maximum value of altitude layer distribution entropy is approximately 4.58 bits. A lower entropy value indicates that aircraft are more concentrated in certain altitude layers.
- Airspace density at hotpot periods (ρhot) is defined as the number of aircraft per unit area at peak moments and directly reflects the level of airspace congestion. Using a time granularity of one minute, the number of aircraft simultaneously present in the sector at each time instant is counted. The airspace density at the hotpot moment is calculated as [34]:where Nhot refers to the number of aircraft simultaneously present within a sector during peak hours, and S is the horizontal projected area of the Nanjing approach sector (approximately 4200 km2).
- Mean heading change rate (ω) reflects the complexity of aircraft trajectories and the frequency of maneuvering within the sector. For an individual aircraft, if the heading angle at time ti is θi and at time ti+1 is θi+1, the heading change rate during this interval is defined as . Special handling is applied when the heading angle crosses the 0°/360° boundary. For a given day, all heading change rate samples of aircraft within the sector are aggregated to calculate the mean heading change rate [35]:where M is the total number of valid heading change rate samples for that day.
- Approach rate (Rapp) is defined as the ratio of the number of aircraft that complete approach procedures within a unit time to the total number of aircraft entering the sector. It is calculated as:where Ntotal is the total number of aircraft entering the Nanjing approach sector on that day, and Nsucc is the number of aircraft that successfully complete the approach.
3.2. Indicator Weight Calculation Based on the Entropy Method
When constructing a safety situation assessment model, it is necessary to determine the contribution of each indicator to the overall situation, namely the indicator weights. Traditional expert-based weighting methods (such as the Analytic Hierarchy Process) rely heavily on subjective judgments, leading to large individual differences and poor reproducibility. To address these limitations, this study adopts the entropy weight method, which objectively determines indicator weights based on the intrinsic information contained in the data, thereby effectively eliminating subjective bias.
The core idea of the entropy weight method is that the greater the variability of an indicator, the more information it contains and the stronger its discriminative ability, and thus the higher weight it should be assigned. Conversely, if an indicator exhibits little variation across evaluation objects, its discriminative power is weak and its weight should be reduced. The entropy weight method can be formally expressed as:
where x′ij is the normalized value of the j-th indicator for the i-th sample, m is the number of samples, and n is the number of indicators.
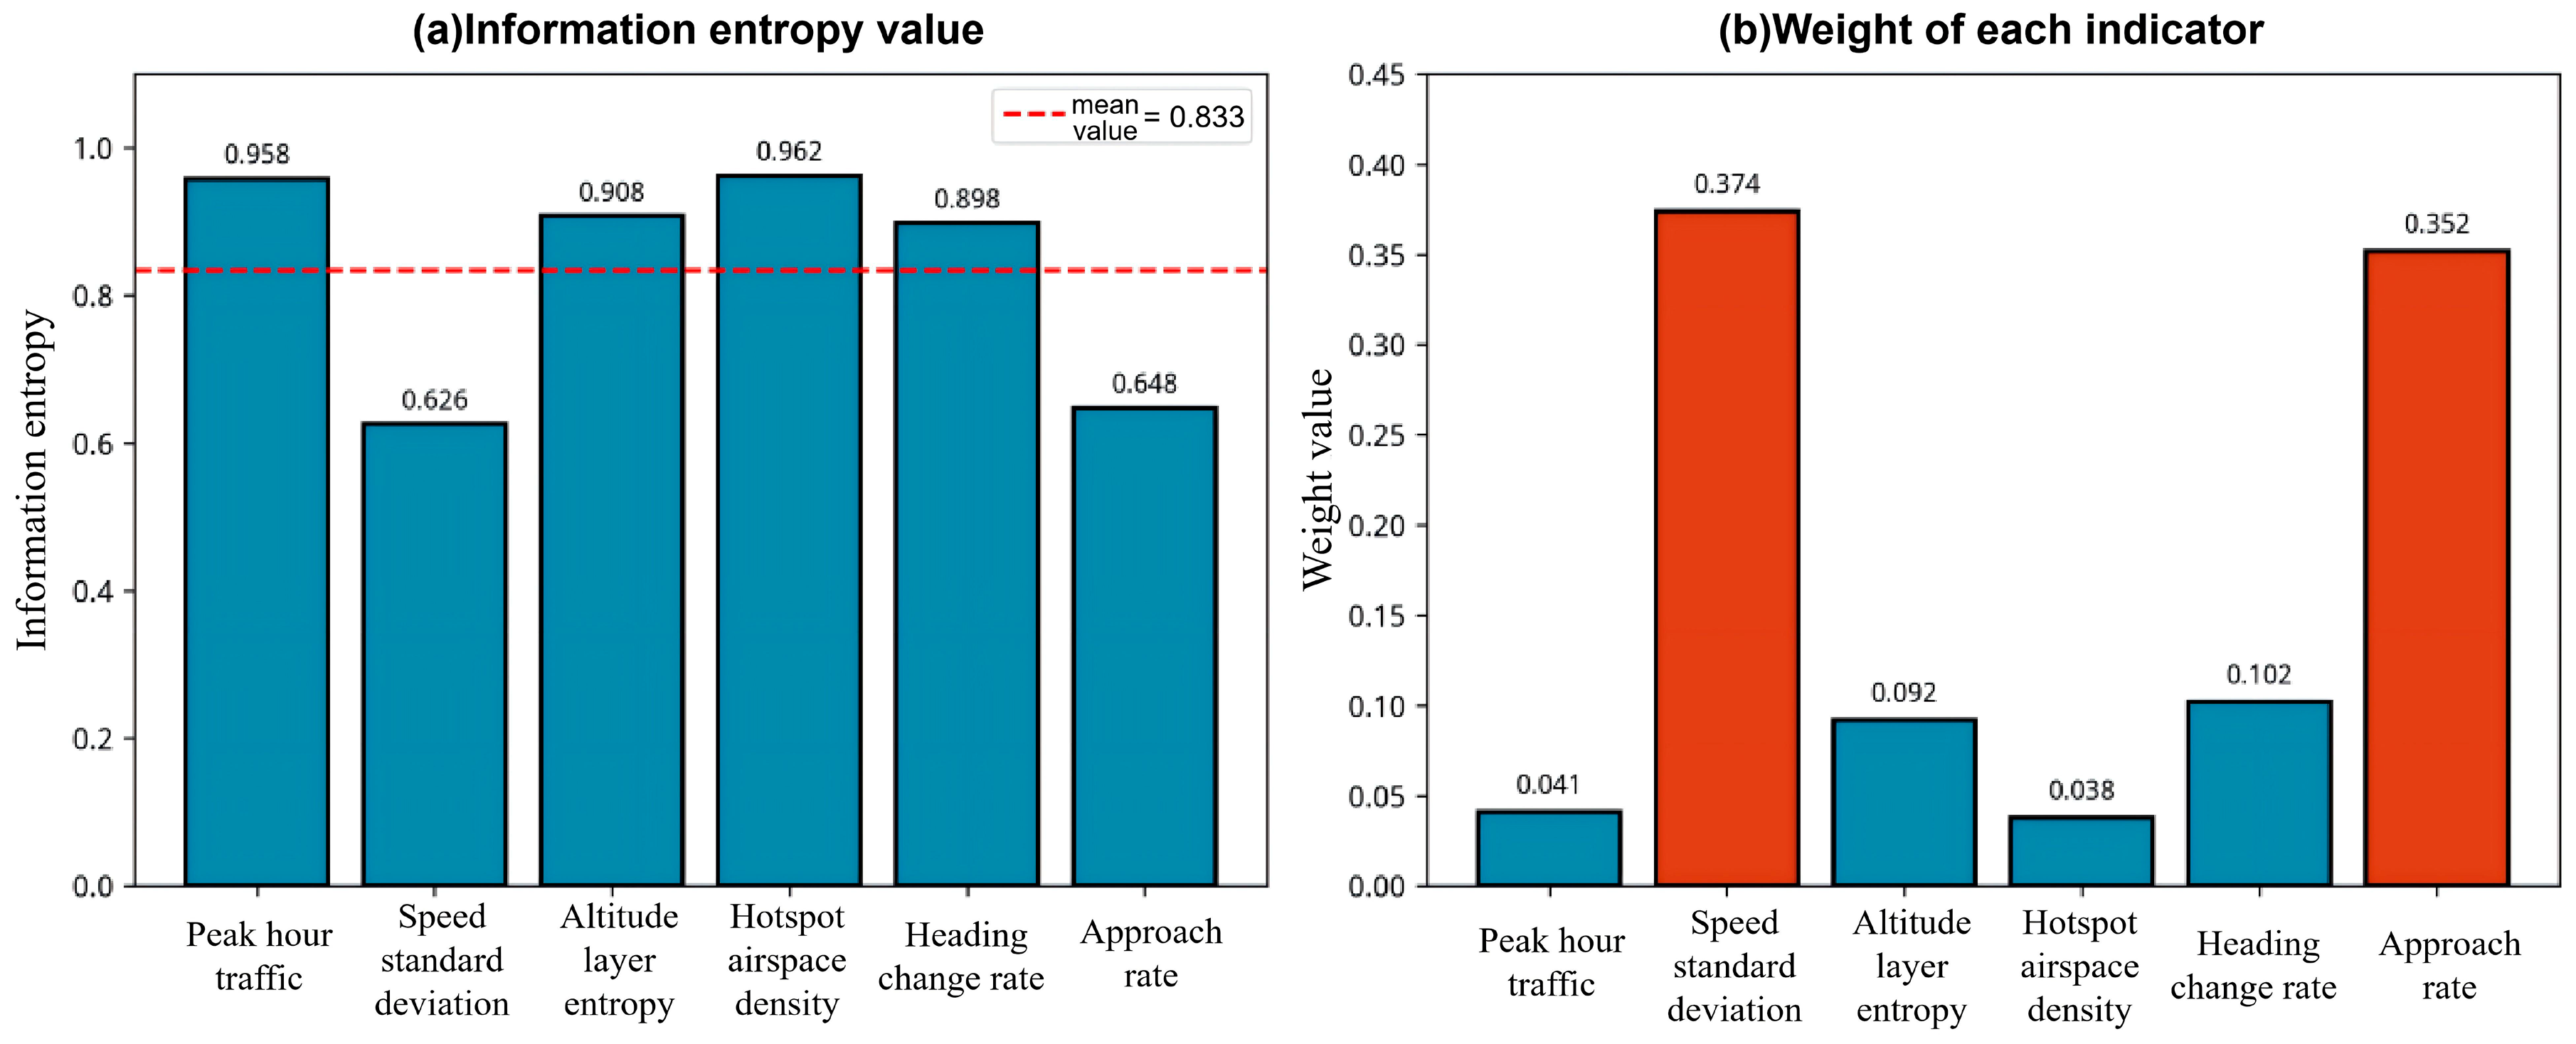
Using the training data from the Nanjing approach sector covering 61 days from 1 October to 30 November 2024, the information entropy and weights of each indicator are calculated according to the above procedure. The results are shown in Table 1.
Table 1.
Results of Entropy Weight Calculation.
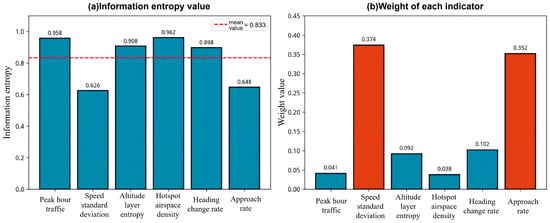
The results show that speed standard deviation and approach rate have the highest weights, at 0.374 and 0.352 respectively, together accounting for 72.6% of the total weight. This indicates that speed dispersion and the quality of approach task completion are the most critical distinguishing factors in assessing the operational situation of the Nanjing approach sector. This weight distribution embodies profound operational implications: speed standard deviation and approach rate occupy dominant positions because they are the most sensitive to both internal and external disturbance factors in sector operations, comprehensively reflecting the combined effects of traffic flow complexity, controller workload, and external environmental conditions.
To further investigate the influence of external environmental factors, particularly meteorological conditions, on the weight distribution of various indicators, this study collected daily weather information corresponding exactly to the time period of the ADS-B data. Specifically, through the Nanjing Historical Weather Network, official releases from the Jiangsu Provincial Meteorological Bureau, and the Weather Spark airport weather data platform, daily weather data for a total of 71 days from 1 October to 10 December 2024 were obtained, including maximum/minimum temperatures, weather conditions, wind direction and speed, visibility, and special weather events (such as cold waves, precipitation, and dense fog). This weather data set is perfectly aligned with the ADS-B trajectory data in the temporal dimension, providing a data foundation for subsequent analysis of the correlation mechanisms between meteorological factors and safety situation indicators.
Based on the joint analysis of the aforementioned weather data and weight calculation results, the high weight of speed standard deviation can be attributed to the pronounced mixed-fleet operation characteristics of the Nanjing approach sector, where significant day-to-day variations in speed dispersion result in strong data variability and rich information content. From an operational logic perspective, speed differences are the direct causes of overtaking conflicts and loss of separation, serving as core representations of safety risks. In actual control practice, greater speed dispersion necessitates more speed adjustment instructions and monitoring efforts, significantly increasing controller workload. Furthermore, the influence of meteorological conditions on speed standard deviation cannot be overlooked—under strong wind, wind shear, or turbulence conditions, the differential responses of various aircraft types to wind speed variations are amplified, with heavy aircraft remaining relatively stable while light aircraft experience increased fluctuations, leading to significantly elevated speed dispersion. This renders the indicator more discriminative on days with adverse weather. Analysis of the weather data reveals that during the cold wave accompanied by gale-force winds of 7–8 levels from 17 to 19 November, the speed standard deviation reached its peak value throughout the entire observation period, confirming the significant impact of wind field conditions on this indicator.
The high weight of approach rate arises because it directly reflects operational efficiency and serves as a sensitive indicator for distinguishing between favorable and unfavorable operating conditions. The approach phase represents the period of highest controller workload, and approach success rate directly impacts controller pressure and sector operational order. More importantly, approach rate exhibits high sensitivity to adverse weather: when unfavorable conditions such as low visibility, strong crosswinds, thunderstorms, or runway icing occur, the probability of go-arounds and diversions increases significantly, causing the approach rate to decline sharply. The collected weather data indicate that during the continuous precipitation period from 24 to 28 November and the dense fog event on 27 December, the approach rate experienced a notable decline, directly reflecting the impact of meteorological factors on approach efficiency. Thus, approach rate not only reflects routine operational efficiency but also serves as a key metric for measuring the impact of weather factors on sector operations. Statistical analysis of safety occurrences indicates that incidents and accidents during the approach phase are often associated with control errors during go-arounds and diversions, further highlighting the necessity of approach rate as a critical indicator of safety situations.
In contrast, peak-hour traffic volume and hotpot period airspace density have relatively low weights, at 0.041 and 0.038 respectively. This is because the daily traffic volume of the Nanjing approach sector is relatively stable with a narrow range of variation, contributing less to discriminating between different situation levels. It is worth noting that although these two indicators have low weights, under extreme weather conditions leading to mass diversions, the hotpot period airspace density may experience short-term abnormal increases, temporarily enhancing its contribution to situation assessment. This demonstrates the adaptability of the indicator system under special scenarios.
Mean heading change rate and altitude layer distribution entropy have moderate weights of 0.102 and 0.092 respectively, complementing the characterization of sector operations from the perspectives of trajectory complexity and vertical airspace utilization. Among these, the mean heading change rate increases significantly during weather avoidance maneuvers such as thunderstorm circumnavigation or turbulence avoidance, reflecting the indirect impact of weather on trajectory complexity. Altitude layer distribution entropy decreases when pilots concentrate on specific altitude layers to avoid icing levels or jet streams, illustrating the shaping effect of meteorological factors on vertical airspace utilization patterns.
In summary, the six indicators collectively characterize sector safety situations from different dimensions. Speed standard deviation and approach rate dominate the weight distribution (totaling 72.6%) because they are the most sensitive to both internal and external disturbance factors in sector operations—speed standard deviation captures the interactive effects of mixed fleet operations and wind field conditions, while approach rate reflects the impact of weather factors on operational efficiency. Together, these two indicators comprehensively capture the core information of the “human–machine–environment” interactions in sector operations. This weight distribution has clear operational logic support and aligns closely with the core objectives of air traffic management: ensuring safety and improving efficiency. A visualization of the information entropy and weight calculation results is shown in Figure 1.
Figure 1.
Results of information entropy weight calculation.
It should be noted that the weight distribution derived from the 71-day data set may not fully capture seasonal variations or extreme operational scenarios. To preliminarily assess the stability of the weights, the data set was divided into two sub-periods: October (35 days) and November–December (36 days). The results show that speed standard deviation and approach rate consistently ranked as the top two indicators across both sub-periods, with combined weights of 68.3% and 76.0% respectively, closely aligning with the full-sample value of 72.6%. This suggests that while absolute values may fluctuate, the relative importance of core indicators remains stable across different time windows. Nevertheless, the weights may exhibit seasonal dynamics; for instance, the influence of heading change rate could increase during summer thunderstorm seasons, while altitude layer distribution entropy may become more prominent under winter icing conditions. Future research should extend the observation period to a full annual cycle and establish dynamic weight updating mechanisms to account for seasonal variations.
3.3. Safety Situation Assessment Model Based on FCM
Based on the six-dimensional indicators and the entropy-derived weights, this section constructs a safety situation assessment model using the Fuzzy C-Means (FCM) clustering algorithm. FCM is a soft clustering method that allows samples to belong to multiple clusters with different membership degrees, making it more suitable than hard clustering methods such as K-Means for handling safety situation data with fuzzy boundaries. Given a set of n samples x = {x1, x2, …, xn} to be partitioned into c clusters, the FCM algorithm iteratively optimizes the following objective function:
where uik denotes the membership degree of sample k to cluster i and satisfies ∑uik = 1; vi is the centroid of cluster i; and m is the fuzziness parameter controlling the degree of fuzziness, typically set to m = 2.
In this study, entropy-based weights are incorporated into the distance calculation using a weighted Euclidean distance:
where j denotes the index of the six-dimensional indicators (j = 1, 2, …, 6); wj represents the information entropy weight of the j-th indicator; xkj is the value of the j-th indicator for the k-th sample; and vij is the value of the j-th indicator for the centroid of the i-th cluster.
So that indicators with higher weights (such as speed standard deviation and approach rate) play a more significant role in the clustering process, enabling the clustering results to better reflect differences in key indicators.
To address the issue of severe class imbalance that may arise in traditional FCM clustering, this study proposes a category balancing optimization strategy based on boundary sample reassignment. The core idea is that samples located near cluster boundaries (i.e., those with similar membership degrees) can be reassigned to underrepresented clusters to improve balance. The specific steps are as follows:
- Perform standard FCM clustering to obtain the initial clustering results and the membership matrix U.
- Identify boundary samples by computing the maximum membership umax and the second-largest membership usecond for each sample. The boundary degree is defined as boundary = 1 − (umax − usecond). Samples with a boundary degree greater than 0.7 are labeled as boundary samples.
- Measure class imbalance by counting the number of samples ni in each cluster and calculating the standard deviation of the class distribution as an imbalance metric.
- Reassign boundary samples if the imbalance exceeds a predefined threshold, reallocating them to clusters with fewer samples.
- Iteratively optimize until the class distribution becomes balanced or the maximum number of reassignment iterations is reached.
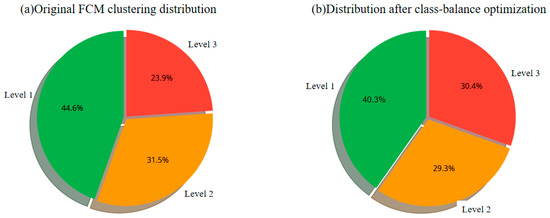
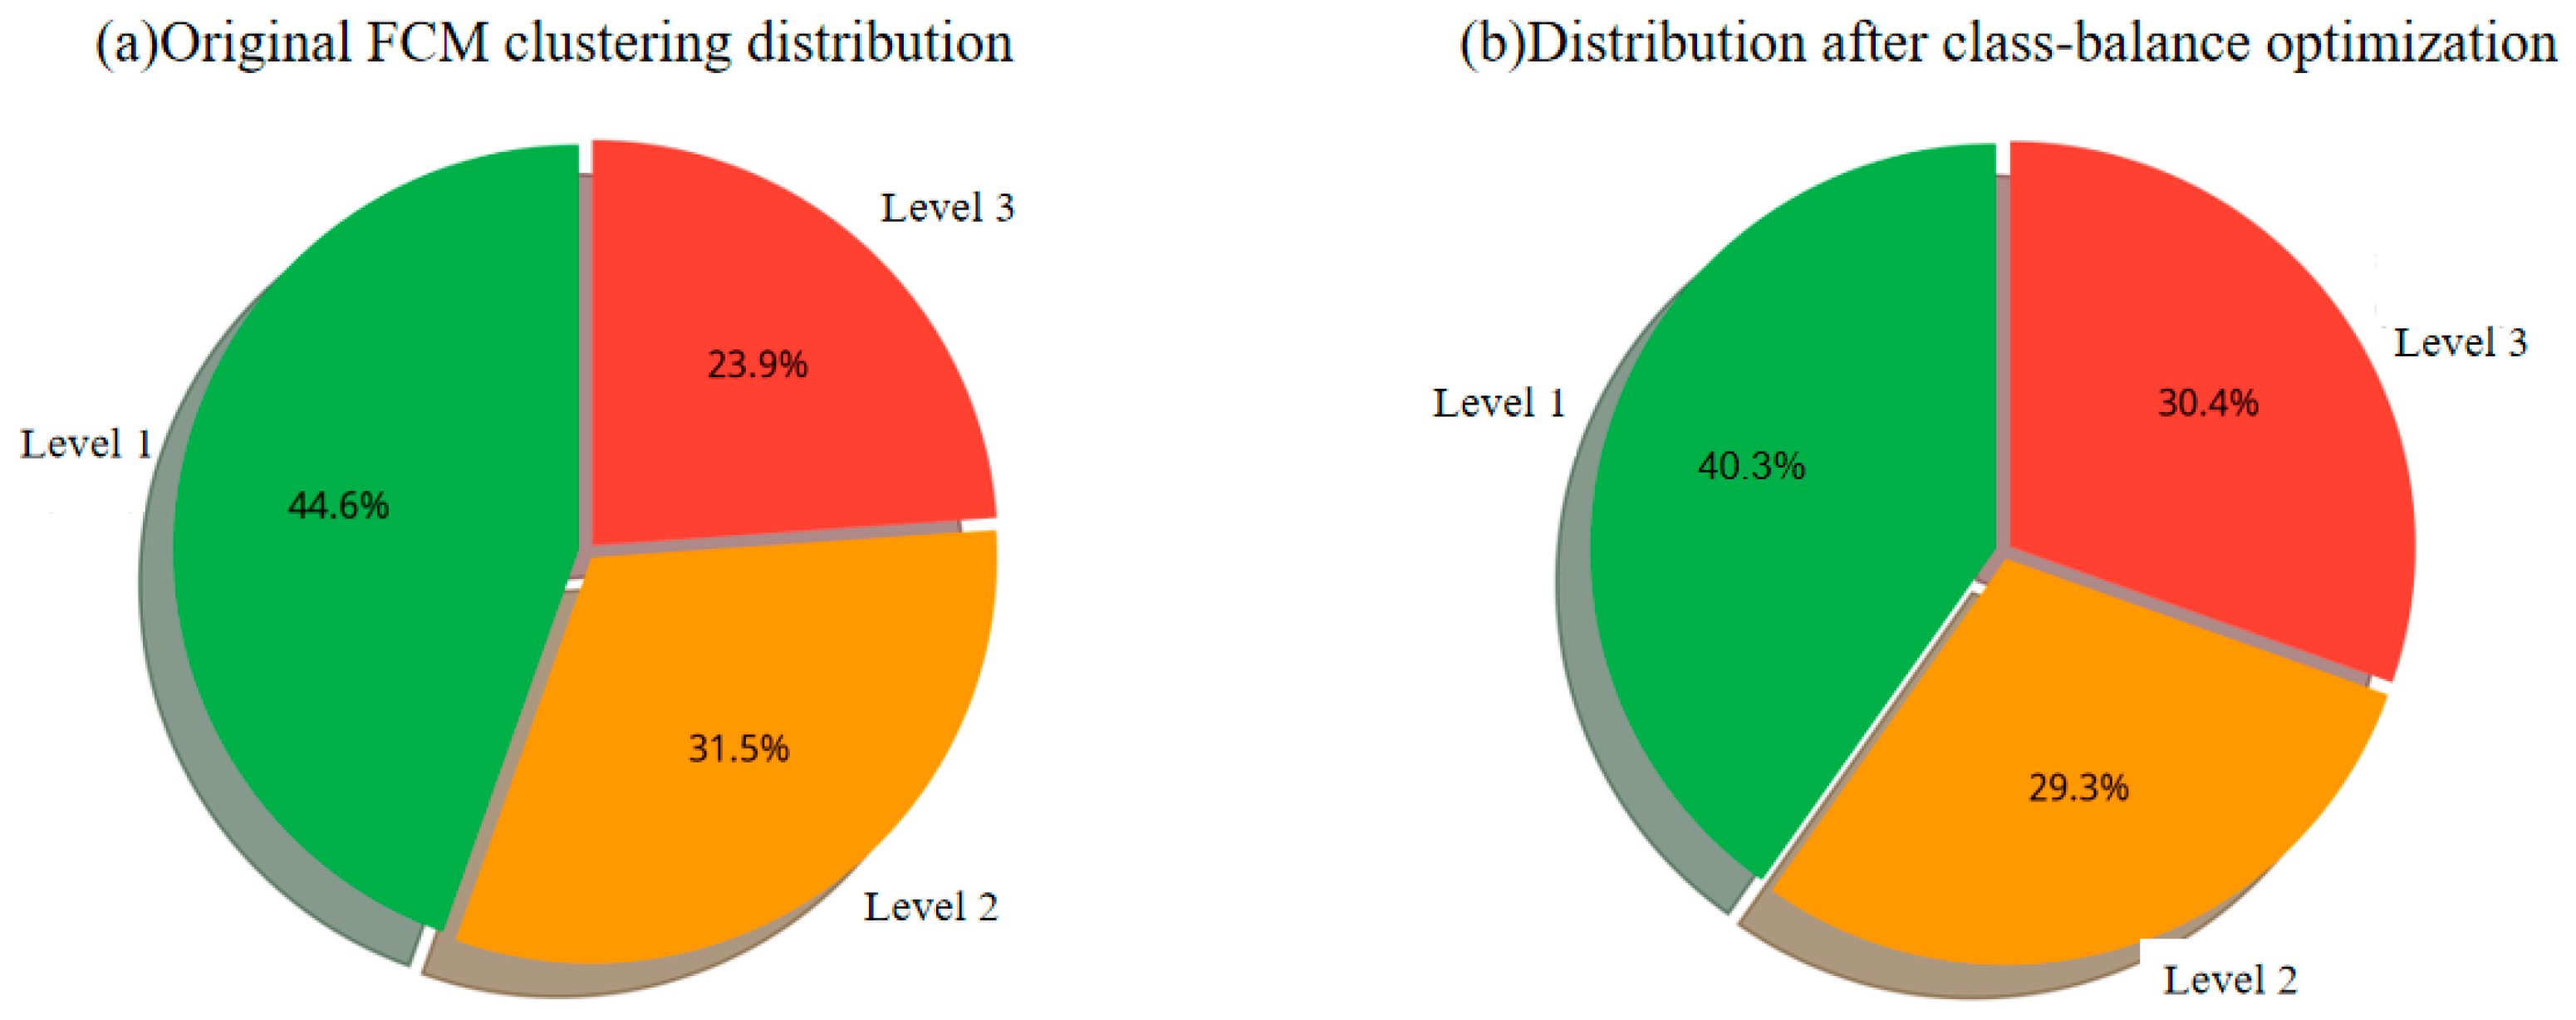
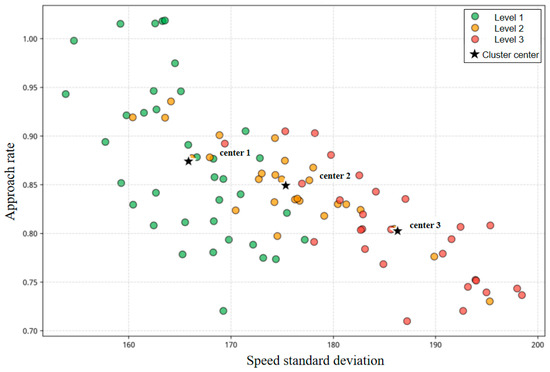
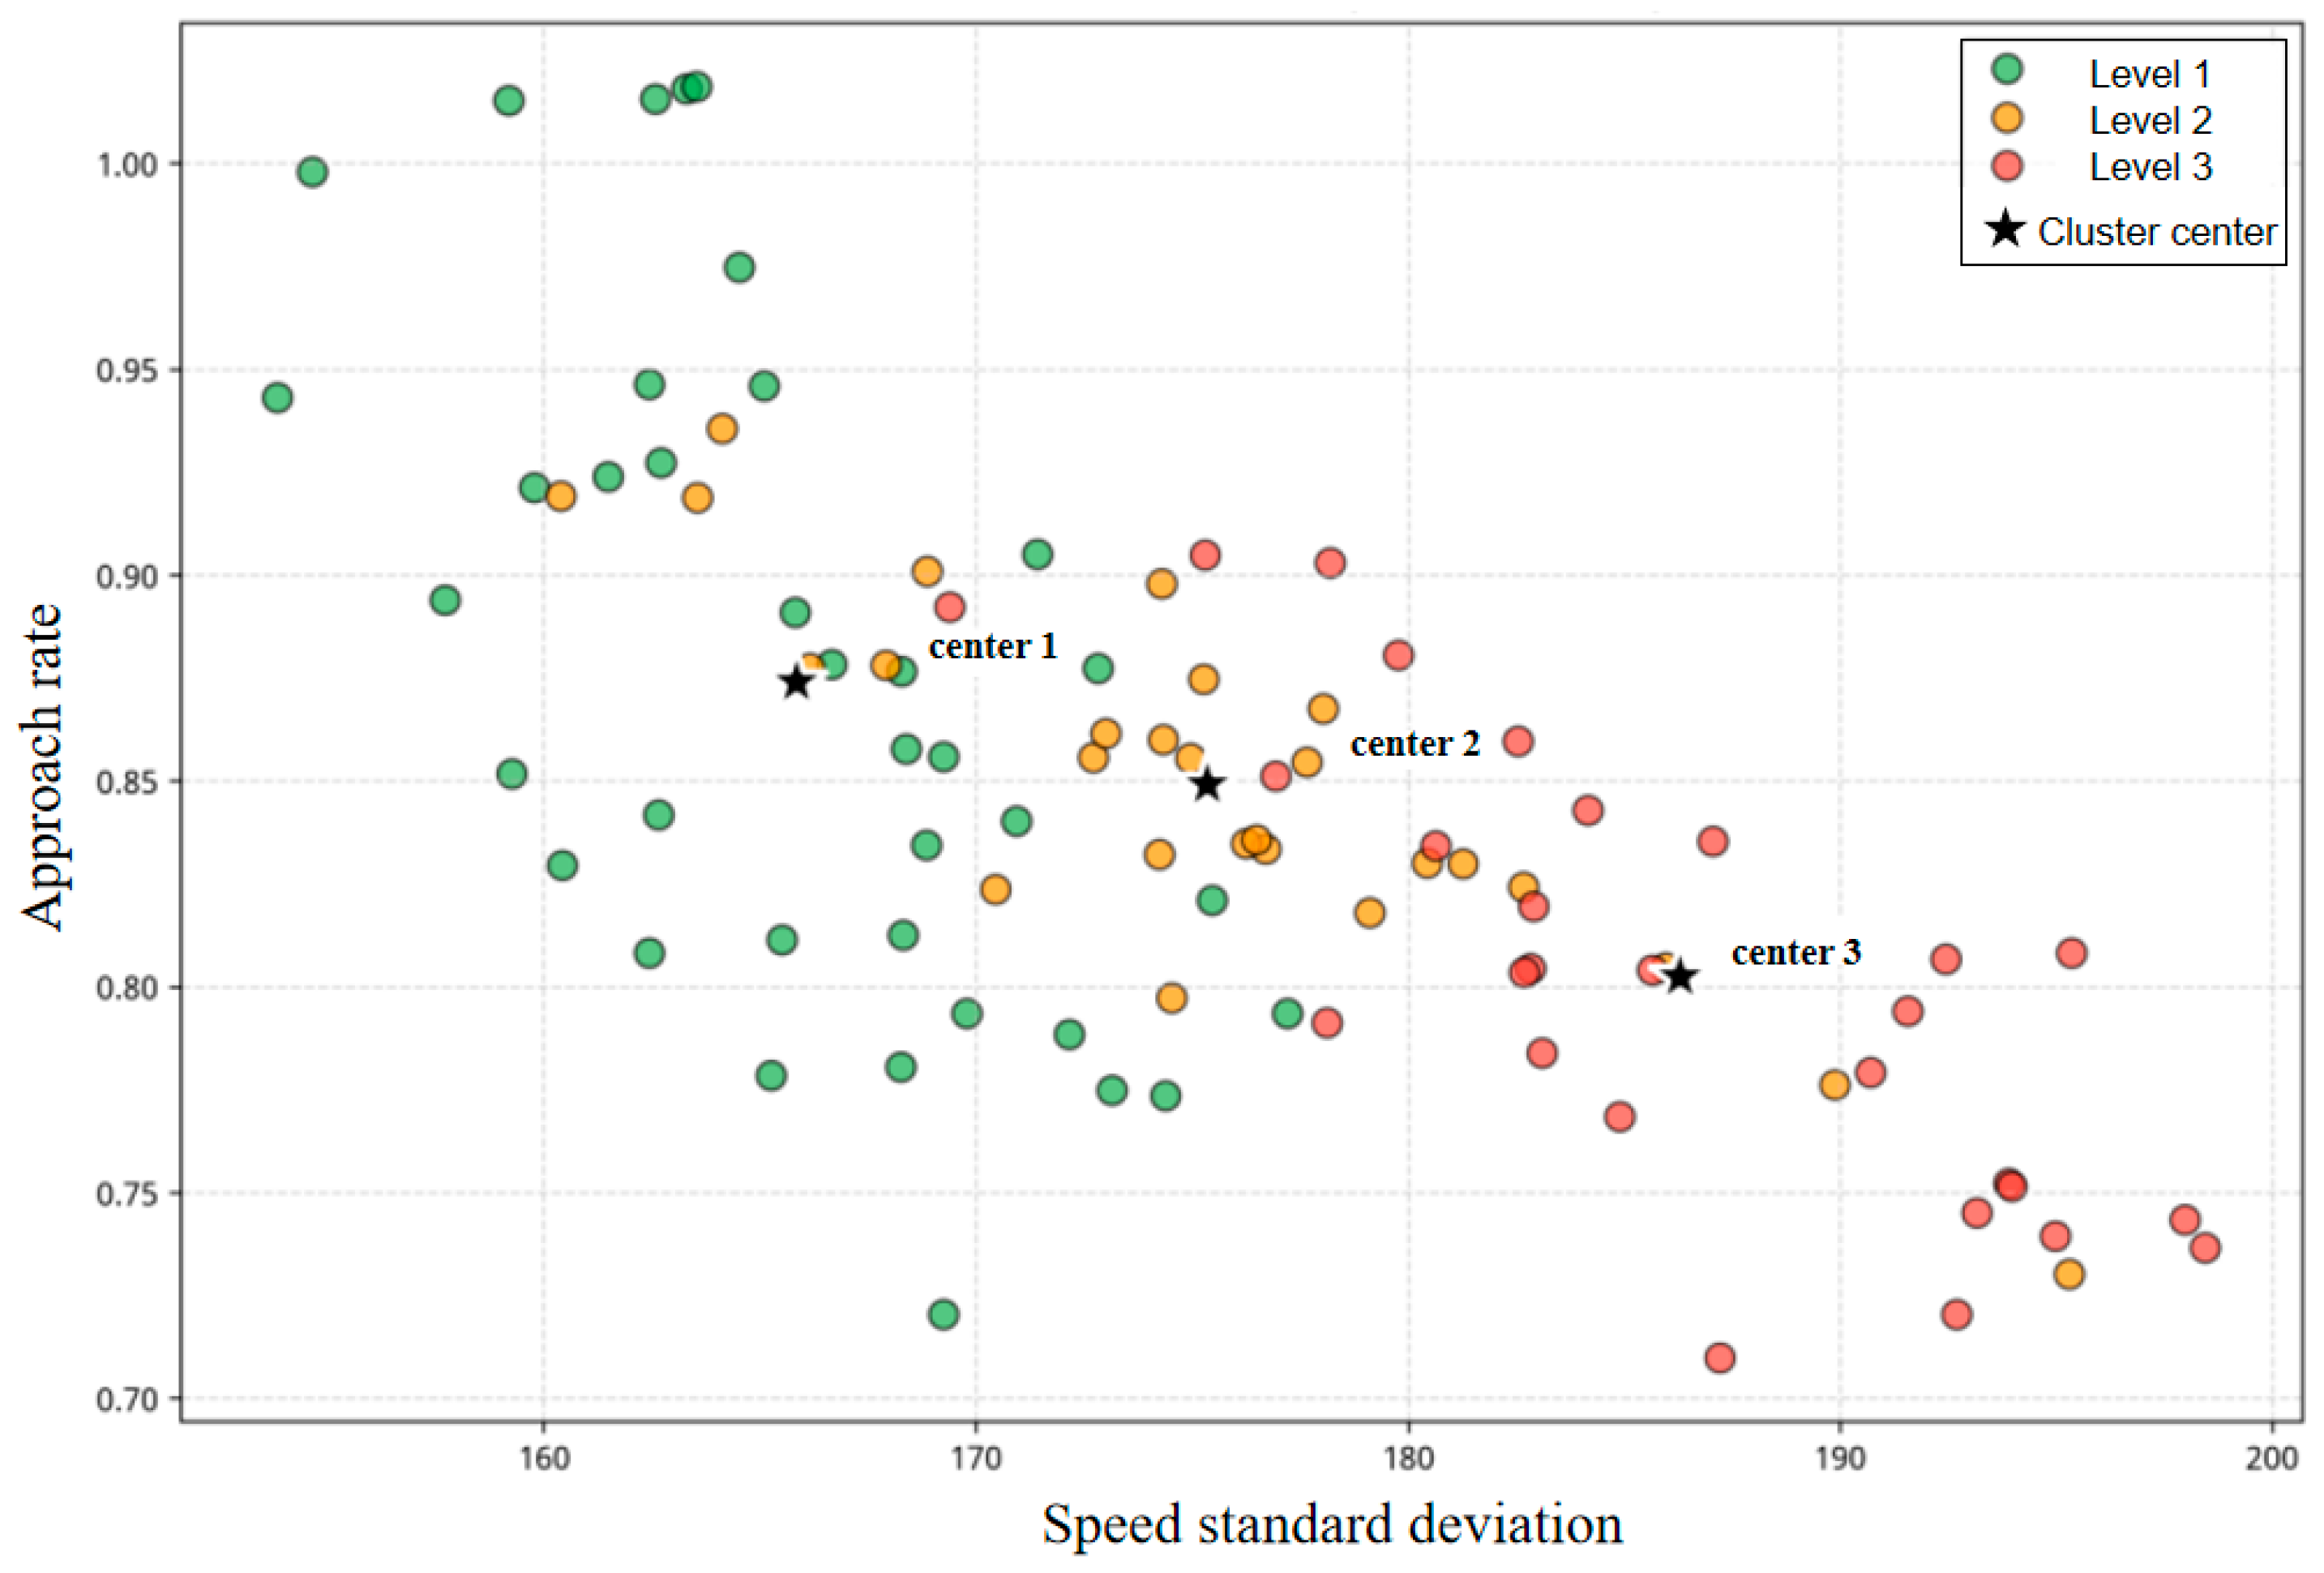
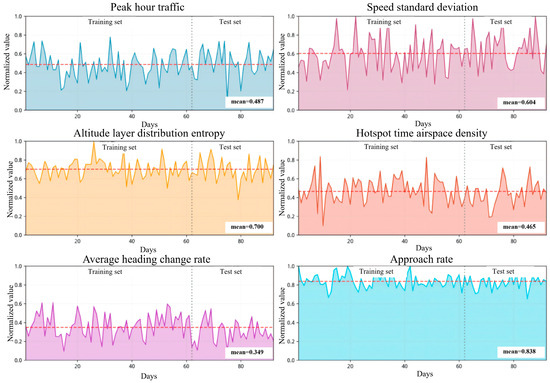
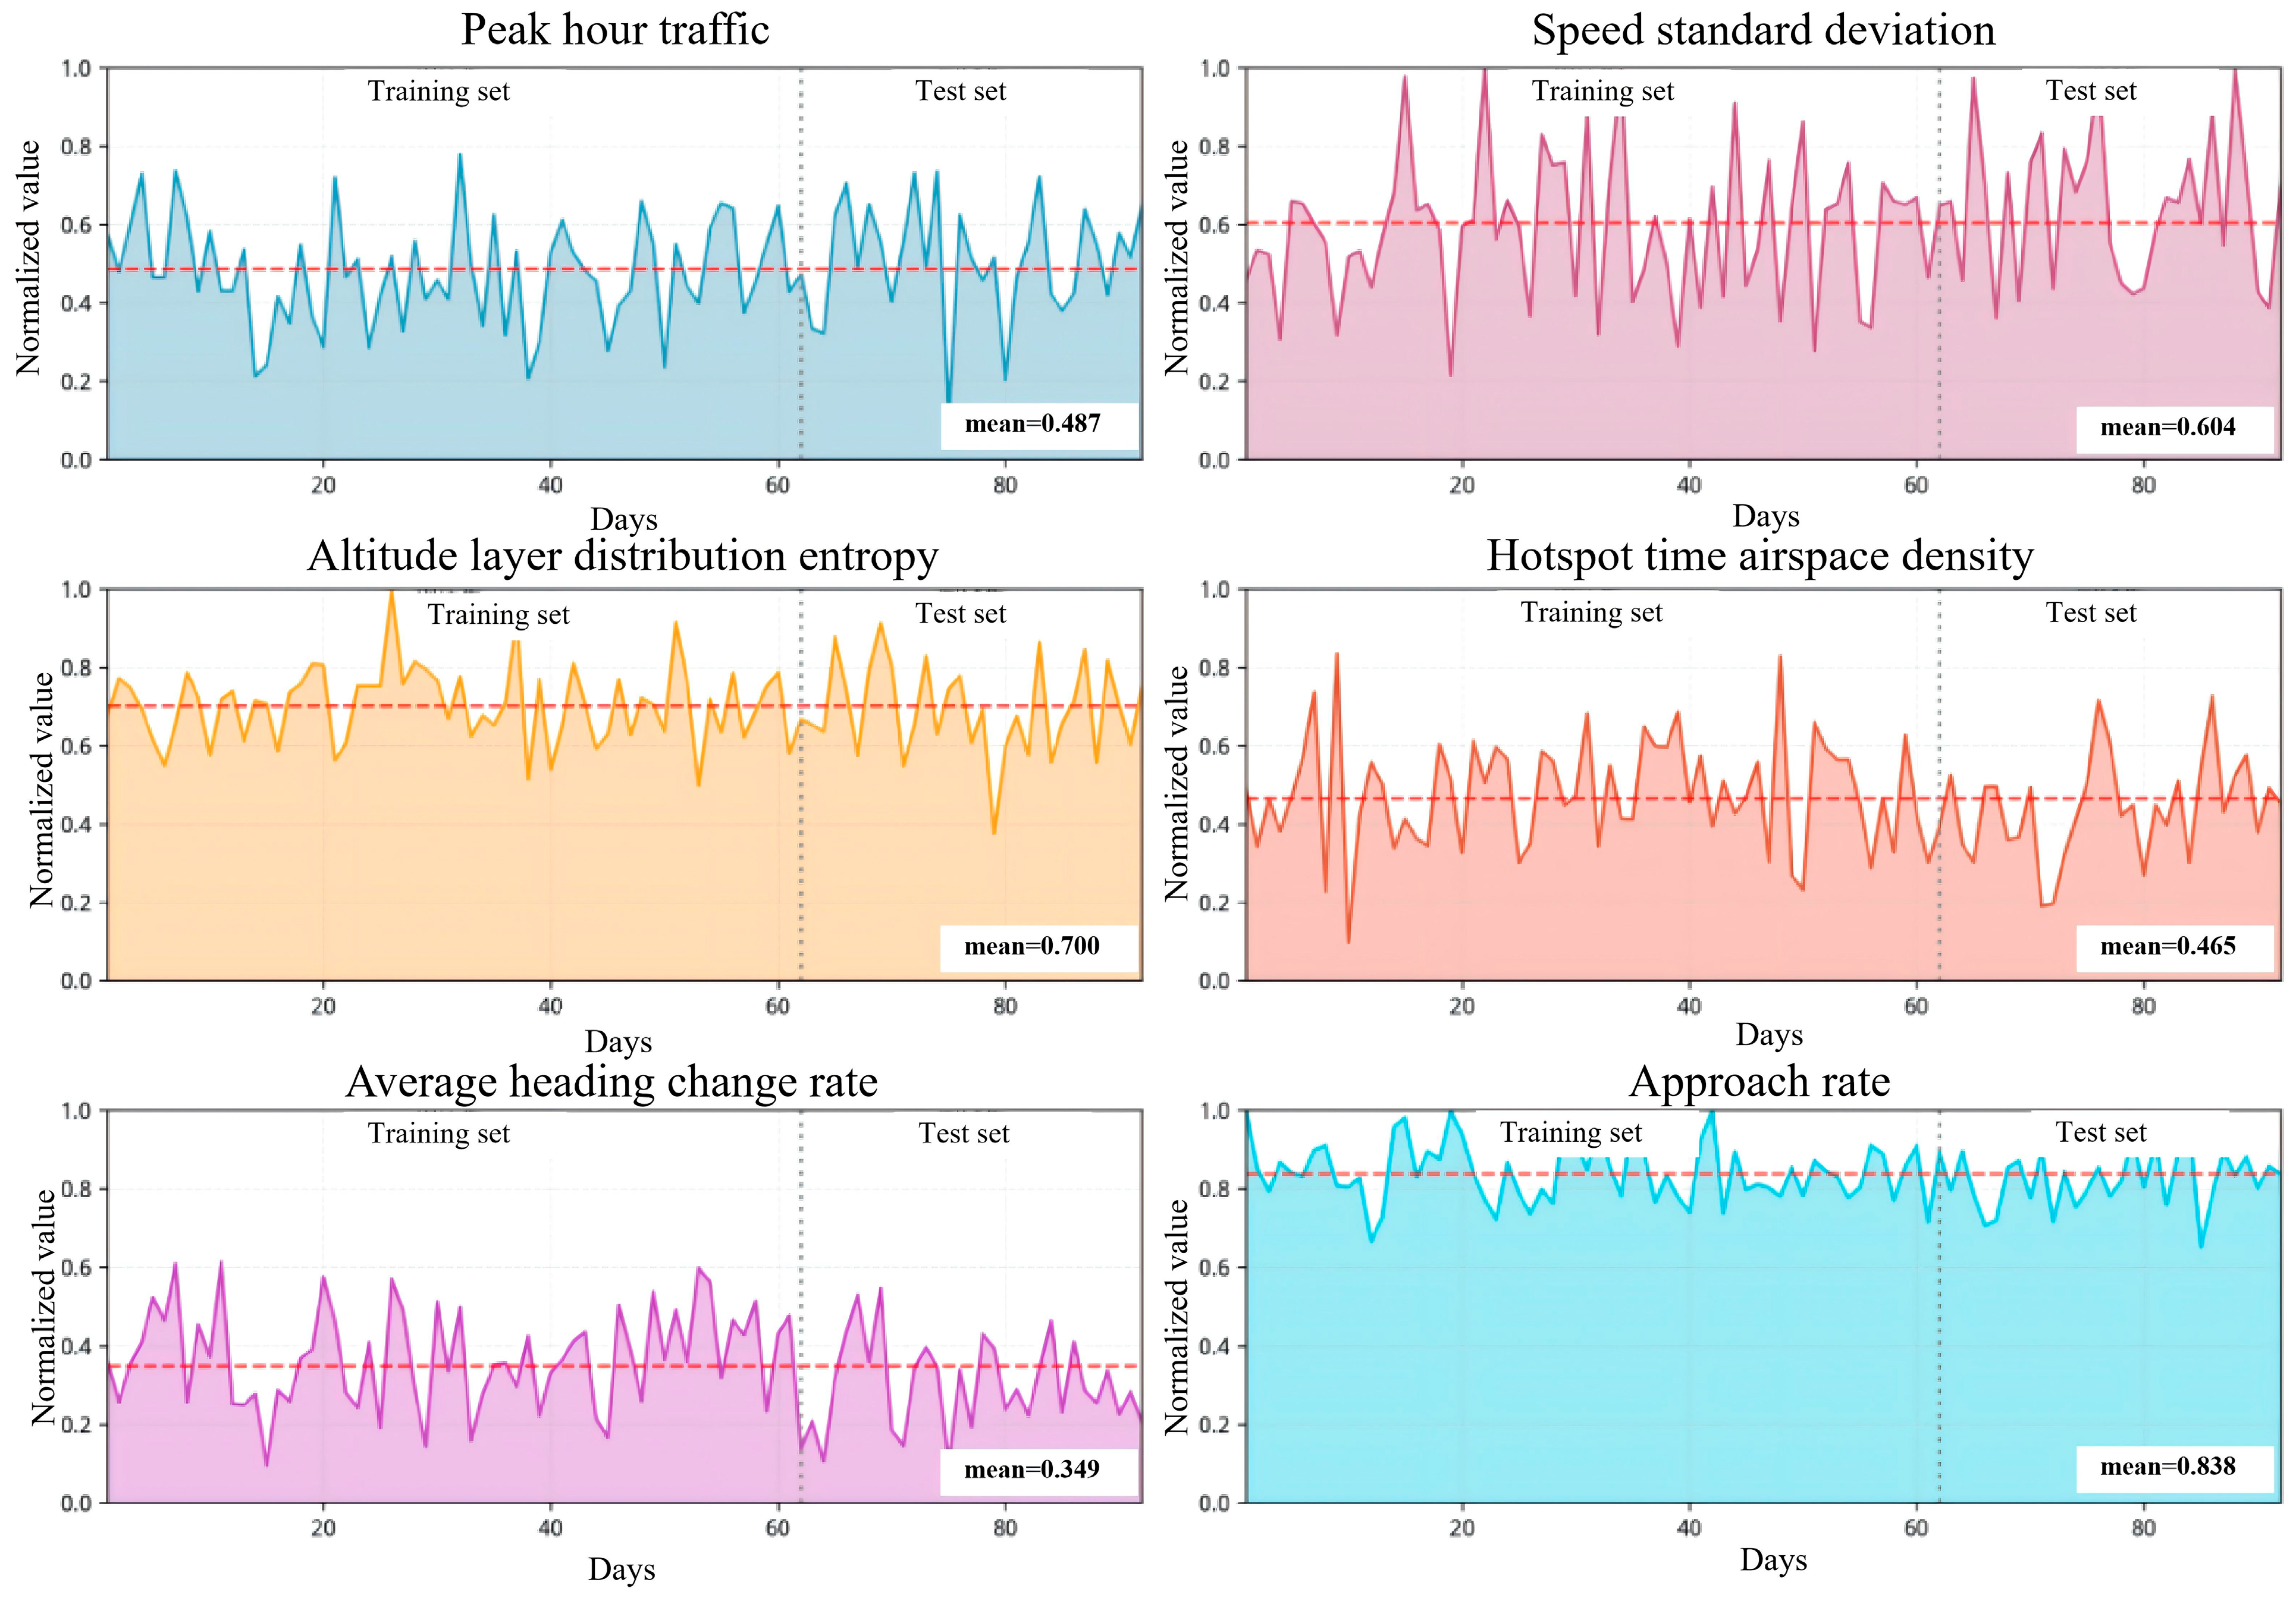
The advantage of this strategy is that it adjusts only the assignments of ambiguous boundary samples while leaving core samples with clear cluster membership unaffected. This improves class balance while preserving the fundamental clustering structure. After category balancing optimization, the distribution of samples across the three situation levels becomes more reasonable, providing a solid foundation for subsequent prediction model training. Comparisons of situation level distributions before and after optimization are shown in Figure 2, visualizations of the clustering results are presented in Figure 3, and the temporal variations in the six-dimensional situation indicators are illustrated in Figure 4.
Figure 2.
Comparative analysis of situation level distribution before and after class-balance optimization.
Figure 3.
Visualization of FCM clustering results (based on principal features).
Figure 4.
Temporal variation of the six-dimensional situation indicators.
Figure 2 illustrates the changes in sample distribution before and after class-balance optimization. Following optimization, the standard deviation of class distribution decreased from 6.03 to 2.52, effectively mitigating the imbalance issue in the original clustering where Level 1 samples were over represented (44.3%) while Level 3 samples were insufficient (24.6%). This provides a more representative training sample set for subsequent prediction modeling. Figure 3 presents a two-dimensional projection of the six-dimensional indicators through principal component analysis, visualizing the distribution relationships of the three situation levels in feature space. Level 1 samples are concentrated in regions characterized by low-speed standard deviation and high approach rate, while Level 3 samples are distributed in areas with high-speed standard deviation and low approach rate. The clustering boundaries are distinct and exhibit a hierarchical structure, validating that the constructed indicator system possesses strong discriminative capability for operational situations. Figure 4 depicts the temporal variations in the six indicators over the 71-day period. Speed standard deviation and approach rate demonstrate significant volatility—the speed standard deviation reached its peak during the cold wave from 17 to 19 November, while the approach rate declined substantially during the continuous precipitation period from 24 to 28 November and the dense fog event on 27 December. These variations closely correspond to weather events, confirming the sensitivity of key indicators to meteorological factors and the rationality of their weight distribution.
4. Situation Prediction Based on Ensemble Learning
4.1. Problem Definition
The core task of situation prediction is to infer future situation states from historical observation sequences. Let the situation level on day t be yt in {1, 2, 3}, corresponding to three levels: ‘Good’, ‘Moderate’, and ‘Attention Required’. Let the six-dimensional situation indicator vector on day t be xt = (x1t, x2t, …, x6t), which contains the normalized values of the six indicators: peak-hour traffic volume, speed standard deviation, altitude layer distribution entropy, hotpot period airspace density, mean heading change rate, and approach rate. The situation prediction problem can be formulated as follows: given the historical indicator sequence over the past L days {xt-L+1, xt-L+2, …, xt} and the corresponding situation level sequence {yt-L+1, yt-L+2, …, yt}, predict the situation level on day t + 1. This is essentially a time-series classification problem that requires capturing both the temporal dependence of situation indicators and the transition patterns of situation levels.
Considering the periodic characteristics of sector operations in the Nanjing approach sector (e.g., traffic differences between weekdays and weekends) as well as short-term dependence (adjacent days often exhibit continuity), this study adopts a sliding time window length of 7 days—i.e., using the past week’s situation data to predict the next day’s situation. This window length covers a complete weekly cycle while avoiding an overly long window that would reduce the number of usable samples. The 7-day indicators are flattened into a 42-dimensional feature vector (7 days × 6 indicators) as the model input.
4.2. Random Forest Model
Random Forest (RF) is an ensemble learning method based on decision trees. It improves classification performance by constructing multiple decision trees and aggregating their predictions. The key idea is to combine many weak learners into a strong learner: although a single decision tree may have limited predictive power, majority voting across many trees can substantially improve accuracy and robustness. Random forest construction involves two levels of randomness:
- Sample randomness: bootstrap sampling (sampling with replacement) is applied to the original training set to generate different training subsets for each tree.
- Feature randomness: at each split node, the best splitting feature is chosen only from a randomly selected subset of features.
This double randomness encourages independence among trees and reduces model variance. For classification, random forest uses a voting mechanism: each tree classifies the input, and the final predicted class is the one receiving the most votes: where hb(x) is the prediction of the b-th tree, I is the indicator function, and c is the class label.
In this study, key random forest parameters are set as follows: the number of trees n_estimators = 100; the number of features considered at each split max_features = sqrt(n_features); and the maximum tree depth max_depth is not restricted. A major advantage of random forest is its ability to output feature importance estimates. Based on each feature’s contribution to node splits across all trees (Gini importance), the most critical indicators for situation prediction can be identified.
4.3. Gradient Boosting Tree Model
Gradient Boosting Machine (GBM) is another tree-based ensemble method. Unlike random forests, which build trees independently in parallel, gradient boosting uses a serial iterative strategy: each new tree is trained to learn the prediction residuals of the previous model, gradually correcting the overall prediction.
Let the model after the m-th iteration be Fm(x). The training objective of the (m + 1)-th tree is to fit residuals along the negative gradient direction: . For classification, the log-loss function is used, and the negative gradient corresponds to the difference between the true probability and the predicted probability. After the new tree hm+1(x) fits the residuals, the model is updated as: where v is the learning rate (shrinkage), controlling each tree’s contribution. A smaller learning rate typically improves generalization but requires more trees. The main parameters are set as: n_estimators = 100, learning_rate = 0.1, maximum depth per tree max_depth = 3 (shallow trees as weak learners), and subsample ratio (subsample = 0.8) to increase randomness and prevent overfitting. Compared with random forest, gradient boosting benefits from its sequential error-correction mechanism and can fit training data more precisely, but it is also more prone to overfitting and requires careful tuning of the learning rate and number of iterations.
4.4. Support Vector Machine Model
Support Vector Machine (SVM) is a classification method grounded in statistical learning theory. Its core idea is to find an optimal hyperplane in feature space that separates different classes with the maximum margin. For linearly inseparable problems, SVM uses kernel functions to map original features into a higher-dimensional space.
This study employs the Radial Basis Function (RBF) kernel: where γ controls the influence range of an individual sample. A larger γ yields a more complex model that may overfit, whereas a smaller γ produces a smoother model that may underfit. For multi-class classification, this study uses the One-vs-One strategy: for three situation levels, binary SVM classifiers are constructed pairwise (three classifiers in total), and the final predicted class is determined by voting. Key parameters are set as follows: penalty coefficient C = 1.0 to control the penalty on misclassification, and kernal function parameter gamma uses the scale mode i.e., , which adapts to the data characteristics. SVM offers strong theoretical foundations and stable performance under small-sample conditions.
4.5. Model Evaluation Metrics
To comprehensively evaluate the performance of each prediction model, the following metrics are used:
- Accuracy: the proportion of correctly predicted samples among all samples, serving as the most intuitive overall performance metric:where TP is the number of true positives, TN is the number of true negatives, and N is the total number of samples. For multi-class classification, accuracy equals the number of correctly predicted samples divided by N.
- Recall: measures the model’s ability to identify a given class, i.e., the proportion correctly recognized within that class:where TPc is the number of samples correctly predicted as class c, and FNc is the number of samples truly belonging to class c but predicted as other classes. Recall is particularly important for safety situation prediction—high recall helps identify as many “attention required” situations as possible, reducing missed alarms.
- Precision: measures the reliability of predictions for a given class, i.e., the proportion of samples predicted as class c that truly belong to class c:where FPc is the number of samples not belonging to class c but predicted as class c. High precision indicates that warning signals are credible and reduces false alarms.
- F1-score: the harmonic mean of precision and recall, balancing both:The F1-score ranges from 0 to 1; values closer to 1 indicate better performance. When precision and recall differ significantly, the F1-score tends toward the smaller one, thus reflecting overall performance more comprehensively.
- Confusion Matrix: presents prediction results in matrix form, where rows represent true classes and columns represent predicted classes. Diagonal elements are correct predictions, and off-diagonal elements are misclassifications. The confusion matrix provides an intuitive view of model performance across classes and helps identify pairs of classes that are easily confused.
5. Results
5.1. Experimental Setup
This experiment uses ADS-B surveillance data from the Nanjing approach sector over 71 days from 1 October to 10 December 2024. To ensure objective and reliable evaluation, a fixed time-series split strategy is adopted to avoid data leakage: the training set covers 61 days from 1 October to 30 November, used for model training and validation; the test set covers 10 days from December 1 to December 10, used for performance evaluation.
Since the prediction model uses a 7-day sliding window, the actual number of usable prediction samples is 54 for training (61 − 7 = 54) and 10 for testing. The split strictly follows chronological order, ensuring that training data are entirely earlier than test data in time, thereby simulating real-world forecasting scenarios.
5.2. Analysis of FCM Clustering Results
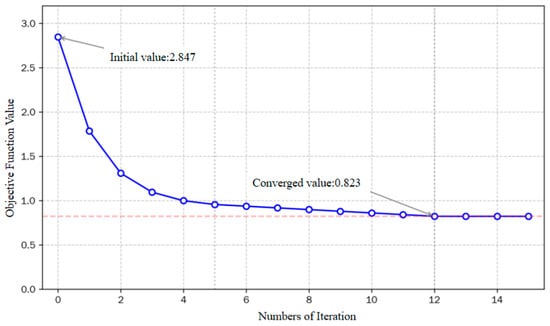
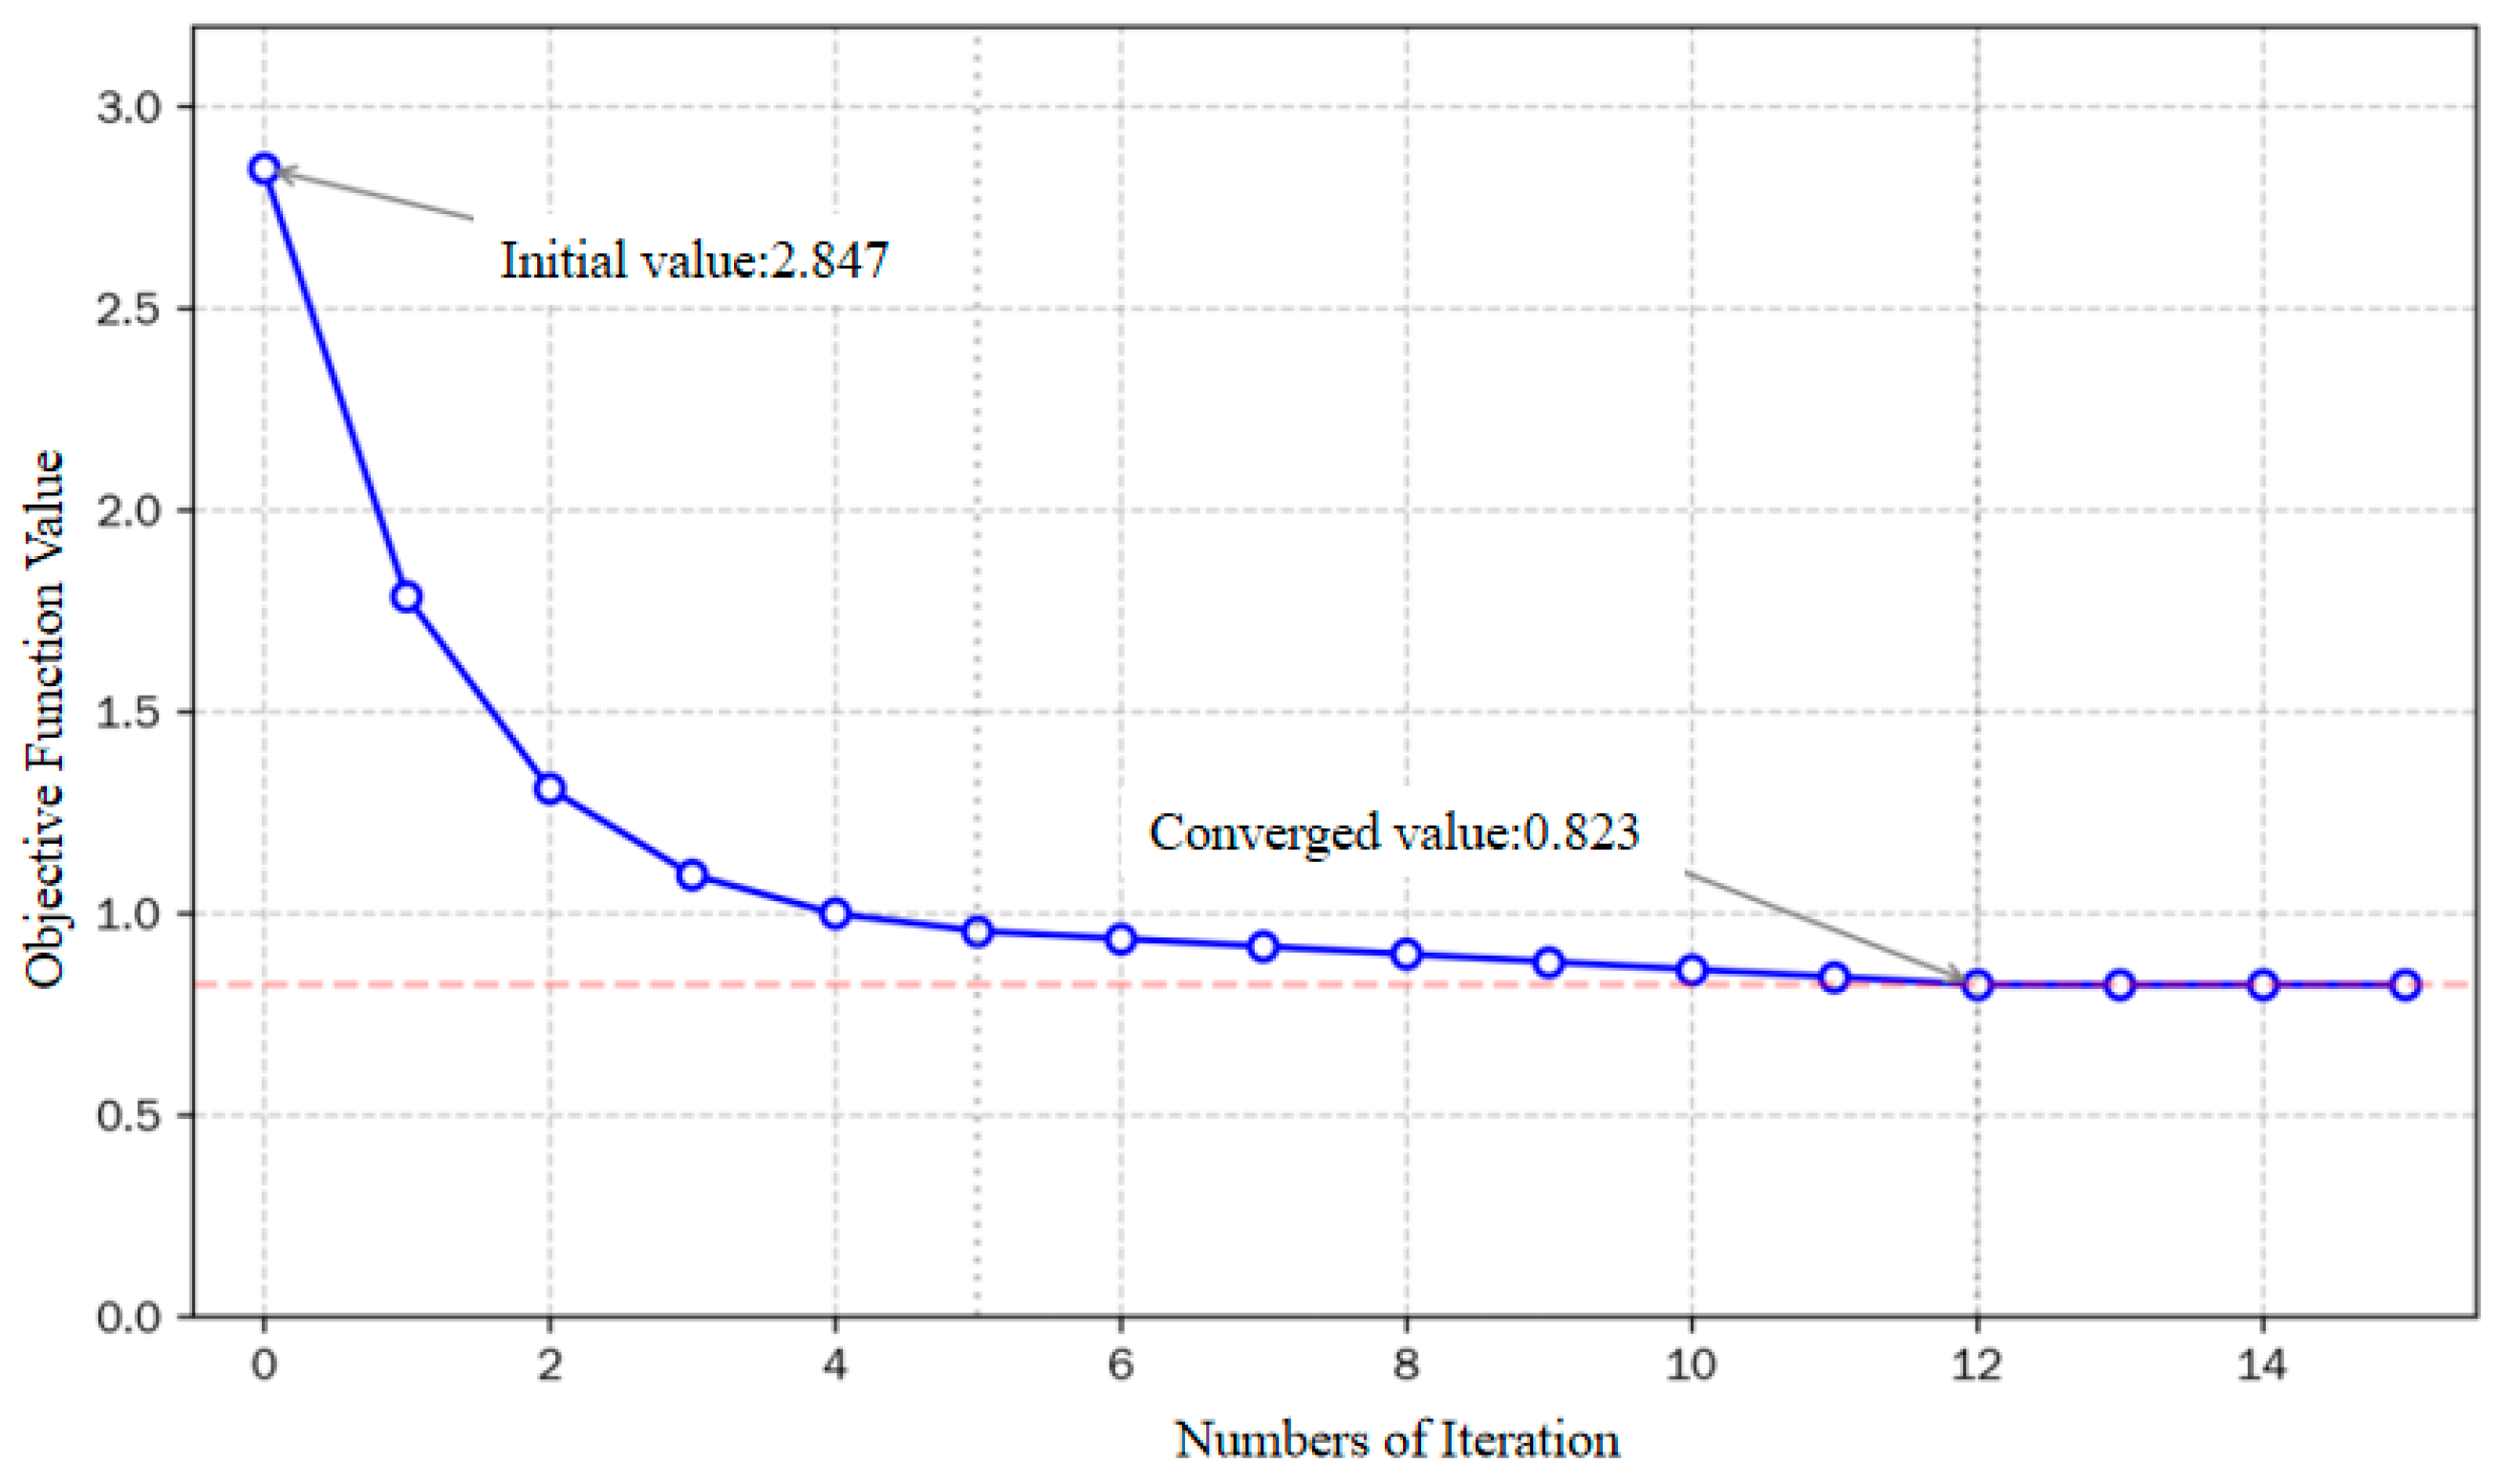
An improved FCM clustering algorithm is applied to the 61-day training data set. The algorithm parameters are set as: number of clusters (c = 3), fuzziness coefficient (m = 2), convergence threshold (epsilon = 10−5), and maximum iterations are 100. The objective function decreases rapidly in the first five iterations, dropping from 2.847 to 0.956; it then decreases slowly from the 5th to the 12th iteration. After the 12th iteration, the objective function stabilizes around 0.823, with changes below the convergence threshold, indicating convergence. The computation time is approximately 0.3 s, demonstrating good convergence behavior and computational efficiency of the improved FCM algorithm. Figure 5 shows the objective function curve versus iteration count.
Figure 5.
Convergence curve of the clustering algorithm.
After clustering, the three cluster centers can be characterized as follows: Cluster Center 1 (Good) corresponds to moderate workload, low speed dispersion, balanced vertical airspace utilization, and high approach efficiency; Cluster Center 2 (Moderate) shows intermediate indicator levels, representing routine operations; Cluster Center 3 (Attention Required) corresponds to high workload, high speed dispersion, concentrated altitude usage, and low approach efficiency, reflecting tense operational conditions.
After class-balancing optimization, the sample distribution across the three levels becomes more reasonable: Level 1 decreases from 44.3% (27 days) to 37.7% (23 days), Level 2 increases from 31.1% (19 days) to 32.8% (20 days), and Level 3 increases from 24.6% (15 days) to 29.5% (18 days). The standard deviation of the class distribution decreases from 6.03 to 2.52, a reduction of 58.2%. Table 2 presents the cluster center feature values, where all values are normalized to [0, 1]; larger values indicate operating conditions that require more attention.
Table 2.
Cluster Center Characteristics of the Three Situation Levels.
5.3. Performance Comparison of Prediction Models
To contextualize the predictive performance of our proposed approach, we compare four representative models from different paradigms: random forest (ensemble learning), gradient boosting (boosting-based ensemble), SVM (kernel-based method), and LSTM (deep learning). These models are widely used in air traffic management and related fields for classification and prediction tasks [27,28,29,30], providing a comprehensive benchmark for evaluating the effectiveness of our situation prediction framework.
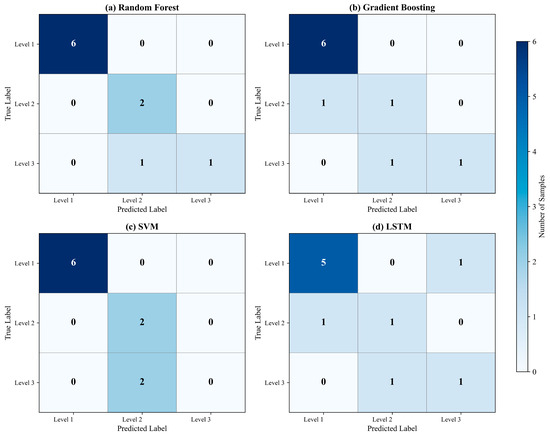
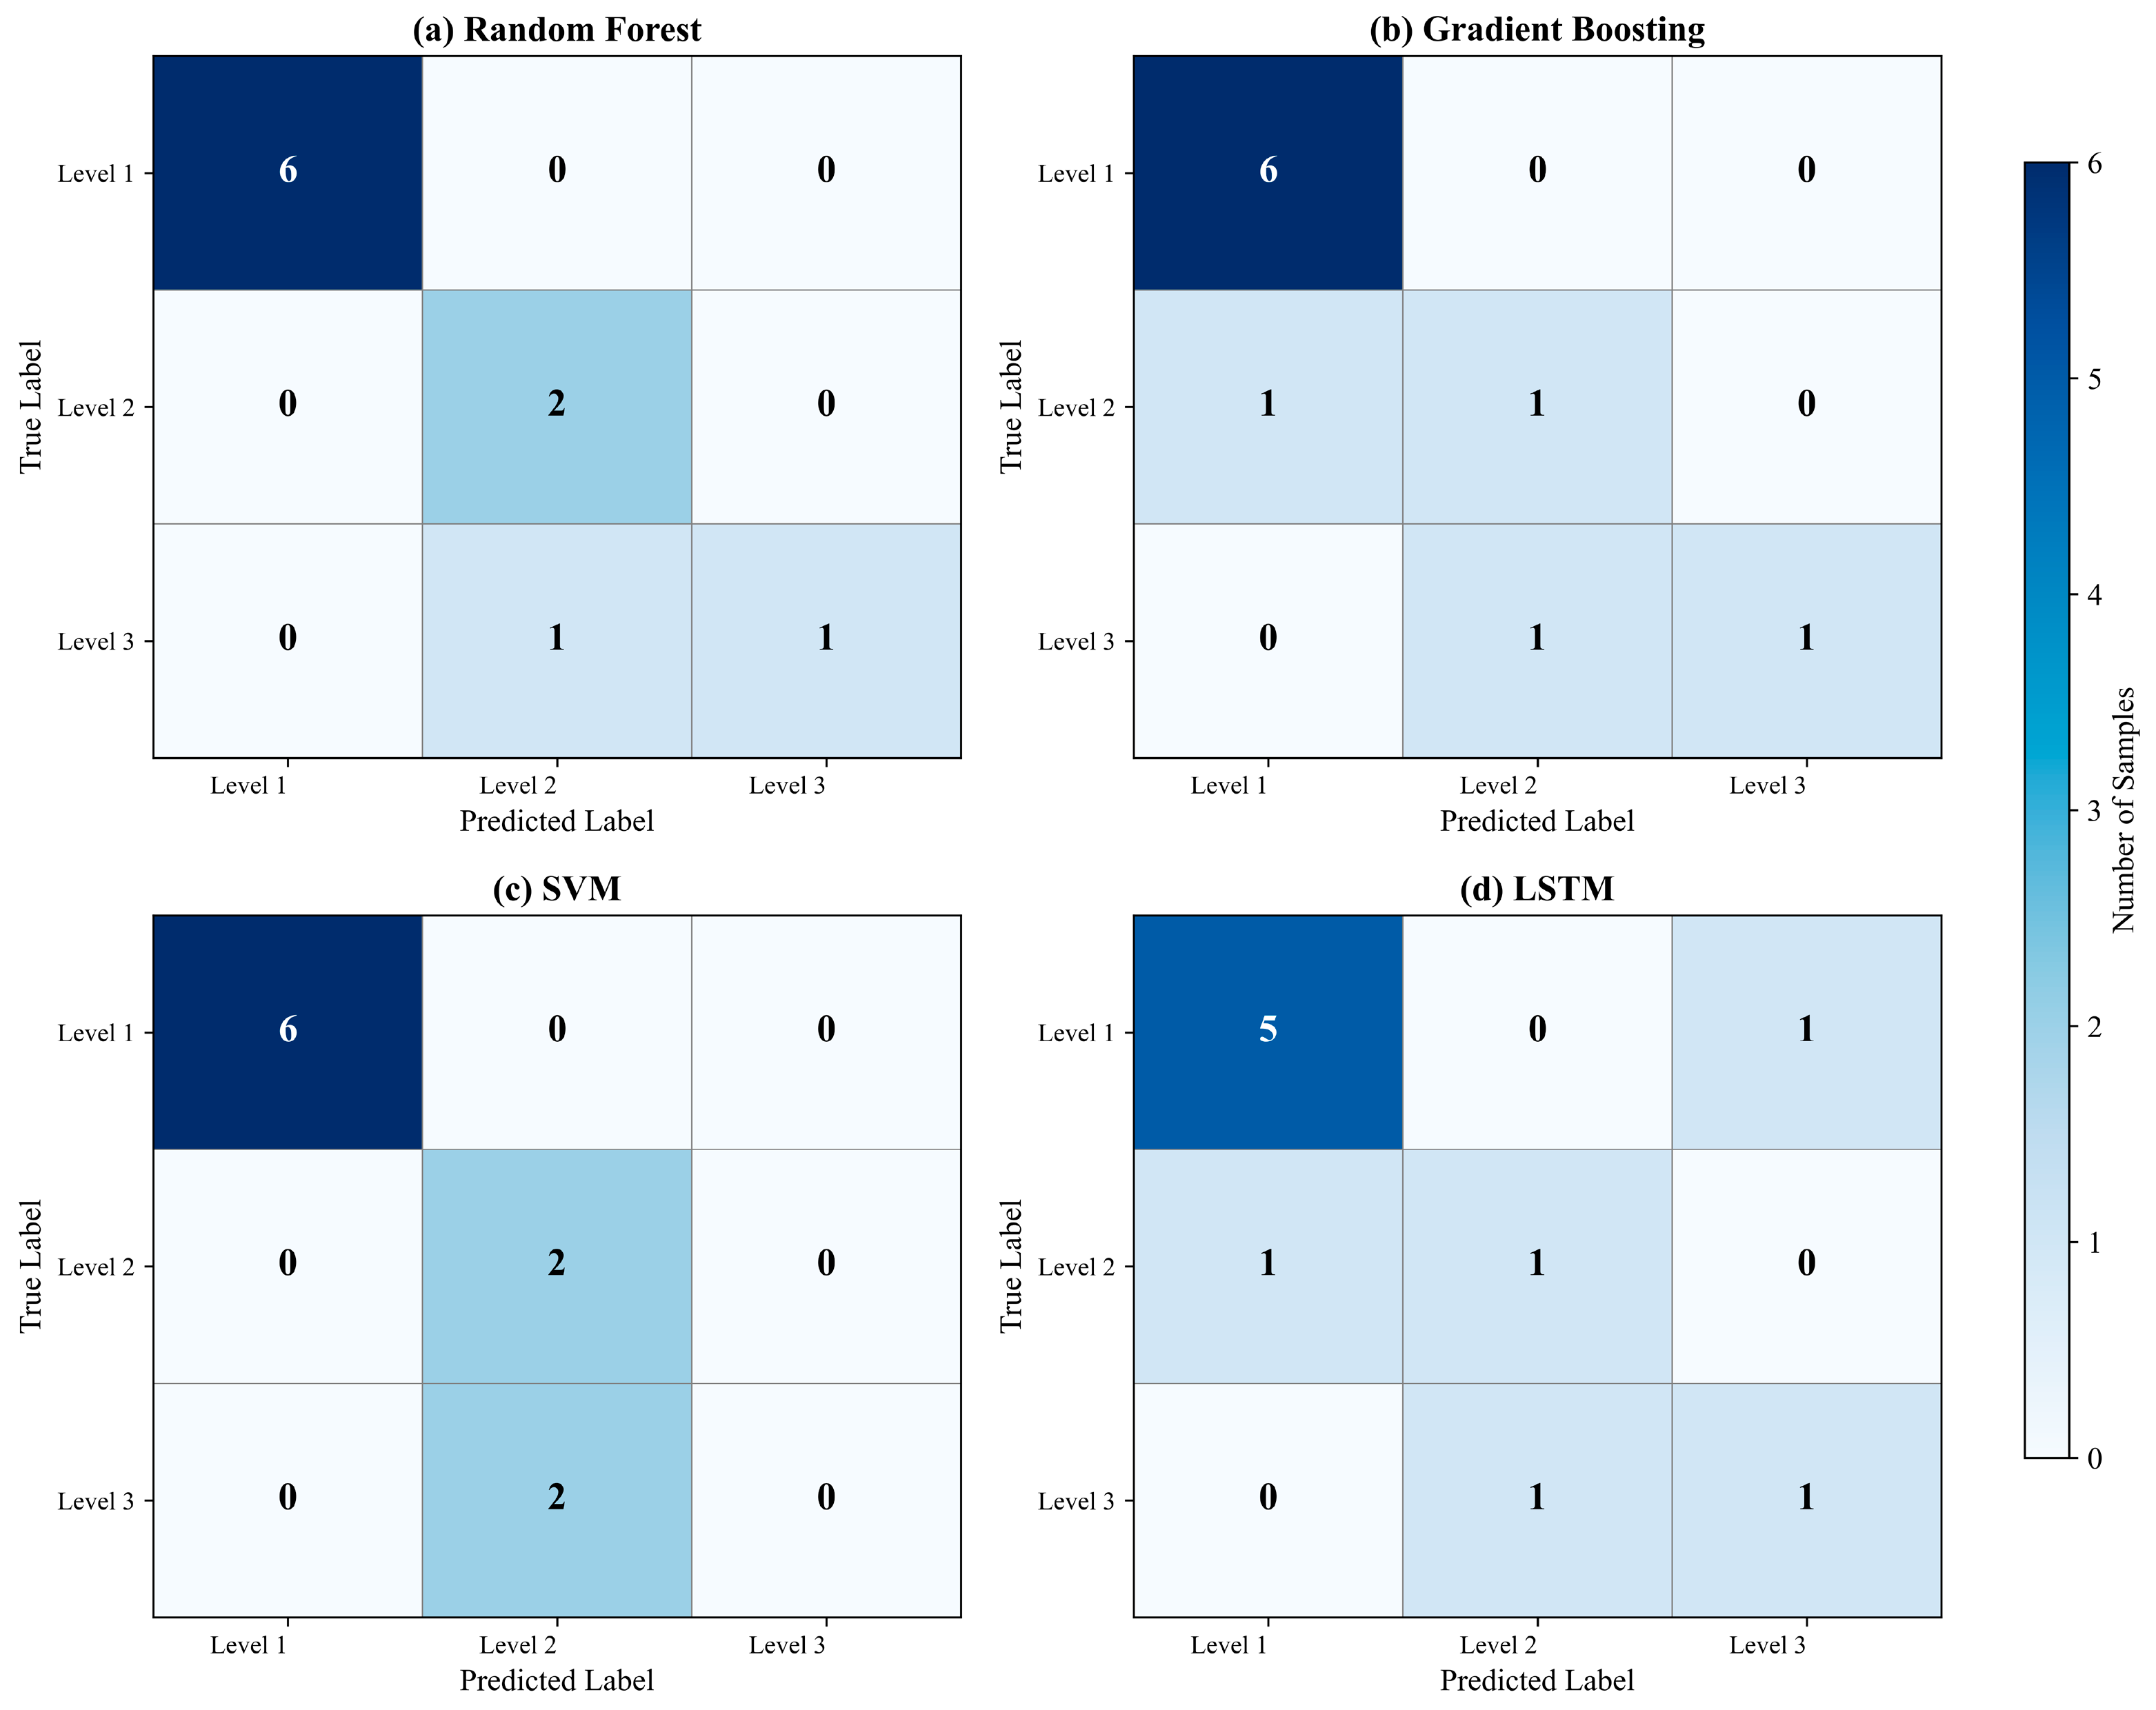
Table 3 presents the detailed prediction results of the four models for each day in the test set (1–10 December 2024), alongside the actual situation levels derived from the FCM clustering results. The comparison reveals distinct performance patterns across models. Random forest correctly predicts 9 out of 10 days (90% accuracy), with the only misclassification occurring on December 3, where it predicted Level 2 instead of the actual Level 3. Gradient boosting and SVM each achieve 8 correct predictions (80% accuracy), while LSTM correctly predicts only 5 days (50% accuracy). Table 4 compares the prediction performance of four models on the test set. Accuracy is defined as the ratio of correctly predicted samples to the total number of samples; recall for each level is the proportion of that level correctly identified.
Table 3.
Daily Prediction Results of Four Models on the Test Set.
Table 4.
Prediction Performance Comparison Across Models.
In terms of recall by level, all models exhibit strong recognition capability for Level 1 (Good): random forest, gradient boosting, and SVM all achieve 100% recall. For Level 2 (Moderate), random forest, SVM, and LSTM achieve 100% recall, while gradient boosting achieves only 50%. For Level 3 (Attention Required), recognition is generally weaker: random forest, gradient boosting, and LSTM each achieve 50% recall, whereas SVM achieves 0% (both Level 3 samples in the test set are misclassified). Overall, random forest provides the best balance of accuracy and recall and is therefore recommended as the situation prediction model in this study. Across models, there is a common tendency to misclassify Level 3 as Level 2, likely due to fuzzy boundaries between these two levels in feature space.
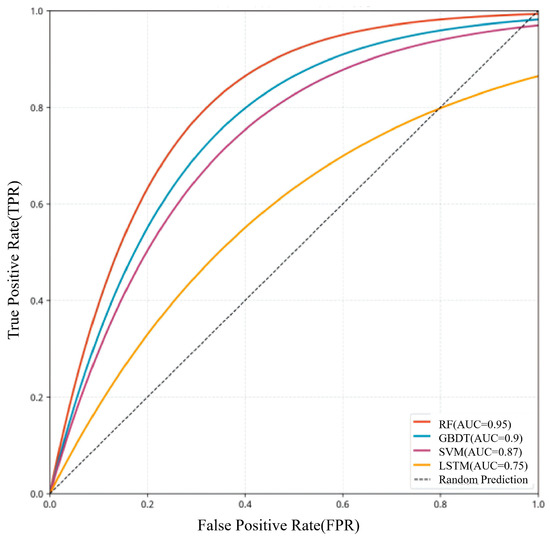
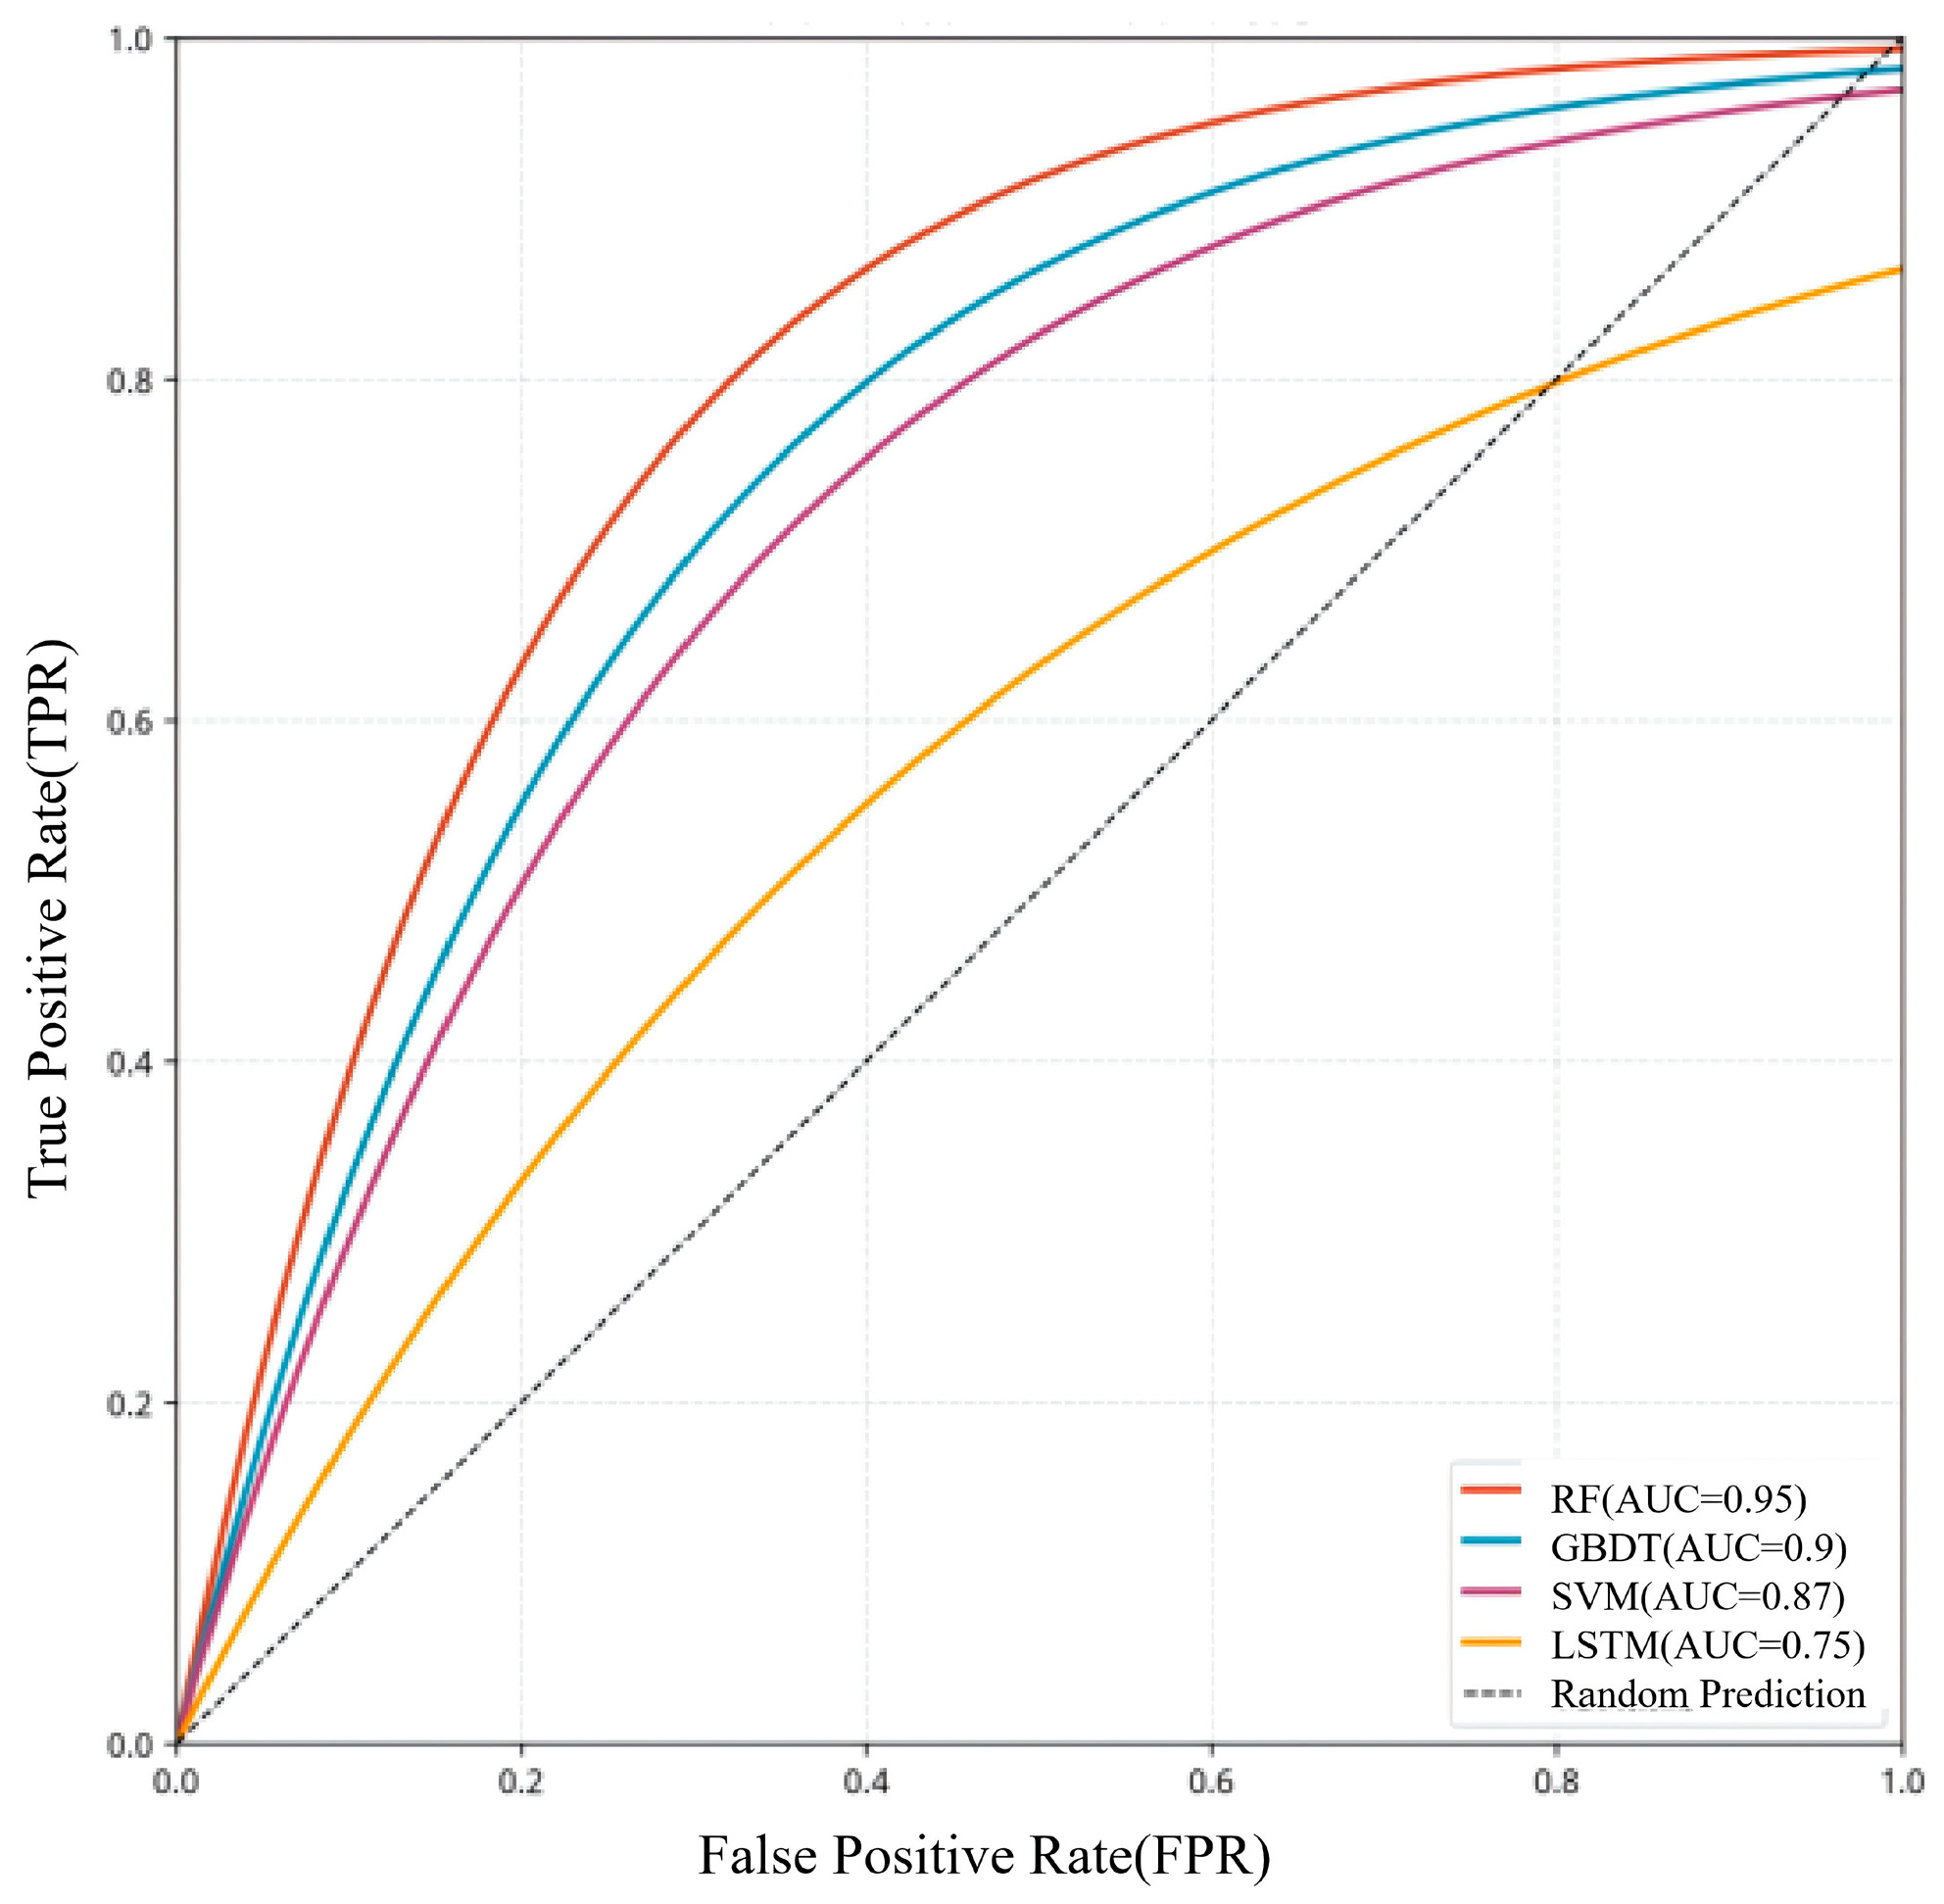
The experimental results show that, under sample size constraints, traditional machine learning methods such as random forest, gradient boosting, and SVM achieve superior prediction performance compared to LSTM. The main reason is the limited sample size: only 54 effective training samples are available, which is far from sufficient for deep learning models. The LSTM network contains approximately 25,000 trainable parameters and is therefore highly prone to overfitting under small-sample conditions. In contrast, random forest benefits from bootstrap sampling and random feature selection, demonstrating stronger robustness in small-sample scenarios. Furthermore, feature representation affects performance: while flattening the 7-day window into a 42-dimensional vector loses explicit temporal structure, the ratio between feature dimensionality and sample size remains acceptable for conventional machine learning models. Confusion matrices for the four models are shown in Figure 6, and ROC curve comparisons are presented in Figure 7. For reference, the diagonal line in Figure 7 denotes the performance of a random classifier (AUC = 0.5), serving as a baseline. Any curve positioned above this diagonal demonstrates predictive performance exceeding that of random guessing.
Figure 6.
Comparative analysis of confusion matrices across four models.
Figure 7.
Comparative analysis of ROC curves across four models.
5.4. Feature Importance Analysis
A major advantage of the random forest model is that it can output feature importance estimates. Using Gini importance, this study analyzes the contribution of each feature in the 42-dimensional input vector to the prediction results. When aggregated by the original indicators, the cumulative feature importance ranking is: approach rate 0.287 > speed standard deviation 0.241 > altitude layer distribution entropy 0.156 > mean heading change rate 0.138 > peak-hour traffic volume 0.098 > hotpot period airspace density 0.080. This ranking is highly consistent with the entropy-weight analysis, validating that the entropy method can objectively reflect each indicator’s contribution to situation discrimination.
When aggregated by time step, the feature importance results show that the indicators from the most recent day t.
1 account for 28.3% of total importance, followed by t-2 at 19.5% and t-3 at 15.2%. Earlier historical data contribute progressively less importance. This matches the temporal decay pattern of situation evolution: recent situations exert a stronger influence on future prediction. This finding can also provide guidance for optimizing the sliding window length in future studies.
6. Conclusions
This study takes the Nanjing approach control sector as the research object and conducts a systematic investigation of aircraft safety situation awareness methods based on ADS-B surveillance data. The main conclusions are summarized as follows:
- A complete ADS-B data preprocessing workflow is established. From approximately 100 GB of raw data, high-quality trajectory data covering about 82,000 flights over 71 days are extracted.
- A six-dimensional safety situation indicator system is constructed, including approach rate, speed standard deviation, mean heading change rate, altitude layer distribution entropy, peak-hour traffic volume, and hotpot period airspace density. These indicators closely correspond to the actual operational characteristics of the Nanjing approach sector.
- The entropy method is adopted to objectively calculate indicator weights, with speed standard deviation and approach rate together accounting for 72.6% of the total weight, identifying them as the most critical factors influencing situation assessment. These six indicators also exhibit strong correlations with weather factors.
- An improved FCM clustering algorithm with category-balancing optimization is proposed. By reassigning boundary samples, the standard deviation of class distribution is reduced by 58.2%, and sector safety situations are classified into three levels: ‘Good’, ‘Moderate’, and ‘Attention Required’.
- A comparative analysis of multiple prediction models shows that the random forest model significantly outperforms others, achieving 90% accuracy and 100% recall for Levels 1 and 2, thereby demonstrating the superiority of traditional machine learning methods under small-sample conditions. Feature importance analysis further confirms the key roles of approach rate and speed standard deviation in situation prediction.
Future research can be pursued in several directions. First, data sources should be expanded by integrating multi-source information. It should be noted that the current study is limited by the lack of access to real-time high-resolution meteorological observations, relying instead on daily weather data. Building on the daily meteorological data integrated in this study, future work should fuse real-time minute-level or second-level meteorological observations—such as those from Automated Weather Observing Systems (AWOS), Doppler weather radar, and wind shear detection systems—with ADS-B trajectory data. This high-resolution data fusion would enable the capture of rapidly evolving weather phenomena and their immediate impacts on aircraft operations, thereby enhancing the model’s capability for minute-scale situation prediction and supporting tactical conflict detection and resolution. Second, multi-scale situation awareness methods should be developed, with emphasis on short-term prediction. While the current daily-scale analysis serves pre-tactical planning, future research should establish a multi-scale framework covering second-level, minute-level, hourly and weekly scales, with particular focus on minute-level or short-term predictions. Third, the observation period should be extended to a full annual cycle to capture seasonal variations and extreme events. Future work should acquire ADS-B and meteorological data covering all 12 months, establish dynamic weight updating mechanisms that adapt to seasonal characteristics, and employ extreme event oversampling strategies to enhance model sensitivity to rare but high-risk scenarios such as severe thunderstorms, dense fog, and heavy snowfall. Transfer learning techniques could also be explored to generalize findings from limited time periods to year-round operational contexts. Finally, efforts should be made to promote the engineering implementation of situation awareness systems by integrating research outcomes with air traffic control automation systems, facilitating the transition from theoretical research to practical application.
Author Contributions
Conceptualization, X.L.; Methodology, X.L.; Software, X.L. and Y.L.; Validation, X.L.; Formal analysis, X.L.; Investigation, X.L.; Resources, H.Z.; Data curation, X.L. and Y.L.; Writing—original draft, X.L.; Writing—review & editing, H.Z.; Visualization, X.L.; Supervision, H.Z.; Project administration, H.Z.; Funding acquisition, H.Z. All authors have read and agreed to the published version of the manuscript.
Funding
This research received no external funding.
Data Availability Statement
The data presented in the study are available on request from the corresponding author. The data are not publicly available due to the inclusion of sensitive airspace navigation data.
Conflicts of Interest
The authors declare no conflict of interest.
References
- Dai, Z.M.; Guo, L.; Luo, Q. Market concentration measurement, administrative monopoly effect and efficiency improvement: Empirical data from China civil aviation industry 2001–2015. Appl. Econ. 2019, 51, 3758–3769. [Google Scholar] [CrossRef] [Scilit]
- Su, M.; Hu, B.Y.; Luan, W.X.; Tian, C. Effects of COVID-19 on China’s civil aviation passenger transport market. Res. Transp. Econ. 2022, 96, 101217. [Google Scholar] [CrossRef] [Scilit]
- Tang, H.; Zhang, H. Study on IoT Big Data Direction in Civil Aviation. In International Conference on Artificial Intelligence and Security; Lecture Notes in Computer Science Series; Springer International Publishing: Cham, Switzerland, 2022; Volume 13339, pp. 300–309. [Google Scholar] [CrossRef] [Scilit]
- Gao, Q.; Hu, M.H.; Yang, L.; Zhao, Z. GIS-Based Spatial Patterns Analysis of Airspace Resource Availability in China. Aerospace 2022, 9, 763. [Google Scholar] [CrossRef] [Scilit]
- Webb, A.G.; Sarkani, S.; Mazzuchi, T.A. Resource Allocation for Air Traffic Controllers using Dynamic Airspace Configuration. In Proceedings of the World Congress on Engineering and Computer Science; Lecture Notes in Engineering and Computer; ResearchGate: Berlin, Germany, 2009; pp. 1125–1127. [Google Scholar]
- Wang, Y.N.; Wang, S.J.; Sui, D.; Tian, H. Comprehensive evaluation for Airspace Classification. In 2012 World Automation Congress (WAC); IEEE: New York, NY, USA, 2012. [Google Scholar]
- Borràs, A.; Calvet, L.; Piera, M.A. Increasing airspace capacity by improving ATCo’s efficiency through an innovative handover mechanism. Comput. Ind. Eng. 2024, 196, 110513. [Google Scholar] [CrossRef] [Scilit]
- Wang, L.X.; Liu, Y.; Li, M.J. Design and Development of Air Traffic Management Safety Database Analysis System. In Proceedings of the 2013 International Conference on Information Science and Cloud Computing Companion (ISCC-C); IEEE: New York, NY, USA, 2014; pp. 488–494. [Google Scholar] [CrossRef] [Scilit]
- Netjasov, F.; Crnogorac, D.; Pavlovic, G. Potential safety occurrences as indicators of air traffic management safety performance: A network based simulation model. Transp. Res. Part C Emerg. Technol. 2019, 102, 490–508. [Google Scholar] [CrossRef] [Scilit]
- Suárez, M.Z.; Valdés, R.M.A.; Moreno, F.P.; Jurado, R.D.A.; de Frutos, P.M.L.; Comendador, V.F.G. Understanding the research on air traffic controller workload and its implications for safety: A science mapping-based analysis. Saf. Sci. 2024, 176, 106545. [Google Scholar] [CrossRef] [Scilit]
- Liu, Y.S.; Trapsilawati, F.; Hou, X.Y.; Sourina, O.; Chen, C.H.; Kiranraj, P.; Mueller-Wittig, W.; Ang, W.T. EEG-Based Mental Workload Recognition in Human Factors Evaluation of Future Air Traffic Control Systems. Adv. Transdiscipl. Eng. 2017, 5, 357–364. [Google Scholar] [CrossRef] [Scilit]
- Maroto, M.P.; García-Heras, J.; Sanz, L.P.; Serrano-Mira, L.; Pérez-Castán, J.A. Performance Impact Assessment of Reducing Separation Minima for En-Route Operations. Aerospace 2022, 9, 772. [Google Scholar] [CrossRef] [Scilit]
- Wang, Y.J.; Hu, R.J.; Lin, S.Y.; Schultz, M.; Delahaye, D. The Impact of Automation on Air Traffic Controller’s Behaviors. Aerospace 2021, 8, 260. [Google Scholar] [CrossRef] [Scilit]
- Mondoloni, S. Flight Planning Under Trajectory-Based Operations. In 2018 IEEE/AIAA 37th Digital Avionics Systems Conference (DASC); IEEE: New York, NY, USA, 2018; pp. 1594–1603. [Google Scholar]
- Oren, A. Blockchain-Based Safety and Efficiency Approach to Air Traffic Management. In 2023 10th International Conference on Recent Advances in Air and Space Technologies, RAST 2023; IEEE: New York, NY, USA, 2023. [Google Scholar] [CrossRef] [Scilit]
- Jameel, M.; Tyburzy, L.; Gerdes, I.; Pick, A.; Hunger, R.; Christoffels, L. Enabling Digital Air Traffic Controller Assistant through Human-Autonomy Teaming Design. In 2023 IEEE/AIAA 42nd Digital Avionics Systems Conference, DASC 2023; IEEE: New York, NY, USA, 2023. [Google Scholar] [CrossRef] [Scilit]
- Bao, S.D.; Gao, F.; Zhang, Z.Y.; Xia, Q.J.; Bi, W.H. The way to smart civil aviation: An integrated decision making approach for smart civil aviation assessment in China. Eng. Appl. Artif. Intel. 2024, 138, 109419. [Google Scholar] [CrossRef] [Scilit]
- Wei, Z.; Wang, S.; Wang, F.; Shui, L.Q. Metaverse for Sustainable Smart Civil Aviation: Technologies, Applications, and Challenges. Computer 2025, 58, 71–81. [Google Scholar] [CrossRef] [Scilit]
- Varga, M.; Polgár, Z.A.; Hedesiu, H. ADS-B Based Real-Time Air Traffic Monitoring System. In 2015 38th International Conference on Telecommunications and Signal Processing (TSP) 2015; IEEE: New York, NY, USA, 2015; pp. 215–219. [Google Scholar]
- Blasch, E.; Insaurralde, C.C. Space and Air Traffic Management Situation Awareness with Notices. In 2025 IEEE Conference on Cognitive and Computational Aspects of Situation Management (CogSIMA); IEEE: New York, NY, USA, 2025; pp. 192–199. [Google Scholar] [CrossRef] [Scilit]
- Ahmed, W.; Masood, A.; Manzoor, J.; Akleylek, S. Automatic dependent surveillance-broadcast (ADS-B) anomalous messages and attack type detection: Deep learning-based architecture. PeerJ Comput. Sci. 2025, 11, e2886. [Google Scholar] [CrossRef] [Scilit]
- Kacem, T.; Kaya, A.; Keceli, A.S.; Catal, C.; Wijsekera, D.; Costa, P. ADS-B Attack Classification using Machine Learning Techniques. In 2021 IEEE Intelligent Vehicles Symposium Workshops (Iv Workshops); IEEE: New York, NY, USA, 2021; pp. 7–12. [Google Scholar] [CrossRef] [Scilit]
- Kacem, T.; Barreto, A.B.; Costa, P.; Wijesekera, D. A Key Management Module for Secure ADS-B. In 2022 IEEE 25th International Conference on Intelligent Transportation Systems (ITSC); IEEE: New York, NY, USA, 2022; pp. 1784–1789. [Google Scholar] [CrossRef] [Scilit]
- Liu, L.; Li, C.H.; Yang, Y.; Wang, J.Z. Short-Term Traffic Flow Forecasting Based on a Novel Combined Model. Sustainability 2024, 16, 10216. [Google Scholar] [CrossRef] [Scilit]
- Chen, Y.Q.; He, P. Risk Monitoring Indicators Construction of Civil Aviation Industry Based on Comprehensive Weighting Method. Prog. Saf. Sci. Technol. 2010, 8, 310–316. [Google Scholar]
- Netjasov, F. Framework for airspace planning and design based on conflict risk assessment Part 2: Conflict risk assessment model for airspace tactical planning. Transp. Res. Part C Emerg. Technol. 2012, 24, 213–226. [Google Scholar] [CrossRef] [Scilit]
- Moreno, F.P.; Comendador, V.F.G.; Jurado, R.D.A.; Suárez, M.Z.; Valdés, R.M.A. Prediction of Capacity Regulations in Airspace Based on Timing and Air Traffic Situation. Aerospace 2023, 10, 291. [Google Scholar] [CrossRef] [Scilit]
- Pérez-Castán, J.A.; Pérez-Sanz, L.; Serrano-Mira, L.; Saéz-Hernando, F.J.; Gauxachs, I.R.; Gómez-Comendador, V.F. Design of an ATC Tool for Conflict Detection Based on Machine Learning Techniques. Aerospace 2022, 9, 67. [Google Scholar] [CrossRef] [Scilit]
- Venkatachalam, K.; Trojovsky, P.; Pamucar, D.; Bacanin, N.; Simic, V. DWFH: An improved data-driven deep weather forecasting hybrid model using Transductive Long Short Term Memory (T-LSTM). Expert Syst. Appl. 2023, 213, 119270. [Google Scholar] [CrossRef] [Scilit]
- Guitart, A.; Demouge, C.; Delahaye, D.; Feron, E. Multi Criteria Methodology for Aircraft Trajectory Planning Algorithm Selection: A Survey. IEEE Trans. Intell. Transp. Syst. 2024, 25, 12893–12911. [Google Scholar] [CrossRef] [Scilit]
- Rodríguez-Sanz, A.; Andrada, L.R. An empirical analysis of airport capacity evaluation: Insights regarding air traffic design hours. J. Phys. Conf. Ser. 2023, 2526, 012095. [Google Scholar] [CrossRef] [Scilit]
- Krasuski, K.; Ciecko, A.; Grunwald, G.; Wierzbicki, D. Assessment of Velocity Accuracy of Aircraft in the Dynamic Tests Using Gnss Sensors. Facta Univ.-Ser. Mech. Eng. 2020, 18, 301–313. [Google Scholar] [CrossRef] [Scilit]
- Klesh, A.T.; Kabamba, P.T.; Girard, A.R. Optimal Cooperative Thermalling of Unmanned Aerial Vehicles. In Optimization and Cooperative Control Strategies: Proceedings of the 8th International Conference on Cooperative Control and Optimization; Lecture Notes in Control and Information Sciences Series; Springer: Berlin/Heidelberg, Germany, 2009; Volume 381, pp. 355–369. [Google Scholar]
- Geister, D.; Korn, B. Density based Management Concept for Urban Air Traffic. In 2018 IEEE/AIAA 37th Digital Avionics Systems Conference (DASC); IEEE: New York, NY, USA, 2018; pp. 1460–1468. [Google Scholar]
- Mao, Z.H.; Dugail, D.; Feron, E.; Bilimoria, K. Stability of intersecting aircraft flows using heading-change maneuvers for conflict avoidance. IEEE Trans. Intell. Transp. Syst. 2005, 6, 357–369. [Google Scholar] [CrossRef]

Disclaimer/Publisher’s Note: The statements, opinions and data contained in all publications are solely those of the individual author(s) and contributor(s) and not of MDPI and/or the editor(s). MDPI and/or the editor(s) disclaim responsibility for any injury to people or property resulting from any ideas, methods, instructions or products referred to in the content. |
© 2026 by the authors. Licensee MDPI, Basel, Switzerland. This article is an open access article distributed under the terms and conditions of the Creative Commons Attribution (CC BY) license.