


Abstract
All existing Satellite-Based Augmentation Systems (SBAS) are regional, leading to discontinuous global coverage and significant service gaps. To overcome the inherent coverage limitations of SBAS caused by regional ground station distribution, this study integrates Low Earth Orbit (LEO) satellites with ground-based networks to enable global SBAS coverage. Using real observational data from eight LEO satellites, we demonstrate their feasibility as space-based monitoring stations. The results show that incorporating LEO satellites reduces the dual-frequency range error (DFRE) and significantly increases the number of available augmented satellites within the service region. Compared with Standard Point Positioning (SPP), this augmentation reduces the 95th-percentile horizontal and vertical positioning errors by approximately 51.4% and 44.2%, respectively. Furthermore, all stations satisfy the Approach with Vertical guidance I (APV-I) availability requirements, and no Hazardous Misleading Information (HMI) events are observed. Based on the observation data from eight LEO satellites, we construct an eight-satellite simulated constellation that matches the real satellites’ orbital characteristics, thereby validating the consistency between real-data findings and simulation-based assessments. Subsequently, we built a hybrid LEO constellation (108 Walker + 60 polar) as space-based monitoring stations integrated with ground stations to evaluate global SBAS service performance. The results show that with LEO satellite augmentation, the global number of available augmented satellites remains above nine. The 95th-percentile horizontal and vertical positioning accuracies are better than 0.75 m and 1.6 m. All global evaluation stations achieve APV-I availability above 99%. In addition, sensitivity analysis reveals that dissemination delay is a critical factor affecting protection levels and service availability, particularly at high latitudes. Overall, both real-data experiments and global simulations validate the significant benefit of LEO augmentation in improving global SBAS service performance.
1. Introduction
Satellite-Based Augmentation Systems (SBAS) rely on Geostationary Earth Orbit (GEO) satellites as the information broadcasting platform to transmit messages containing error correction parameters and system integrity statuses to users within the service coverage area [1,2,3]. Compared with Ground-Based Augmentation Systems (GBAS), whose service coverage is inherently constrained by the deployment of terrestrial reference stations, the space-segment architecture of SBAS provides significant advantages in extending service range and scalability [4,5,6]. By broadcasting differential correction parameters together with a layered integrity alerting mechanism, SBAS can monitor integrity and continuity risks in real time and enhance error-correction performance. It has thus become a core augmentation technology for aviation precision-approach operations [7,8,9,10].
Although SBAS has demonstrated reliable integrity monitoring and positioning enhancement within regional service areas, its global applicability remains fundamentally constrained by the geometry and density of ground monitoring stations [11]. For the European Geostationary Navigation Overlay Service (EGNOS), the current ground network is primarily concentrated in Europe, thereby limiting service availability outside the region and preventing worldwide integrity monitoring and seamless augmentation coverage.
To address these limitations, several studies have attempted to extend SBAS service capabilities and mitigate the service gaps and boundary degradations caused by the limited geometry and density of ground monitoring networks. One line of work extends SBAS capability at service boundaries by extrapolating regional ionospheric corrections using the spatial correlation of ionospheric delays. For example, Kim et al. proposed a biharmonic spline extrapolation to extend the Wide Area Augmentation System (WAAS) ionosphere map [12], and related studies have also investigated machine learning-based spatial extrapolation methods to enlarge regional ionosphere map coverage [13]. Another line focuses on interoperability and fusion of neighboring SBAS to provide partial support in uncovered regions [14]; Tsai et al. assessed extending the combined Global Positioning System (GPS), Aided GEO Augmented Navigation (GAGAN) and MSAS coverage to the Singapore region, and interoperability analyses between different SBAS have been conducted to improve user performance near SBAS boundaries and intermediate uncovered regions [15]. In addition, densifying and geographically expanding ground monitoring networks has been repeatedly identified as a direct means to improve geometry and enlarge coverage, including Dual-Frequency Multi-Constellation (DFMC SBAS) studies suggesting Southern Hemisphere station expansion to approach global land-mass coverage [16]. Although these approaches improve regional performance, they remain fundamentally constrained by ground-based monitoring and cannot achieve global coverage.
This challenge has motivated the exploration of space-based monitoring architectures, in which satellites, rather than ground stations, serve as globally distributed observation stations [17]. Low Earth Orbit (LEO) constellations are particularly well suited for this purpose due to their dense global distribution, rapid orbit motion, and favorable geometric diversity. Unlike GEO or Medium Earth Orbit (MEO) satellites, LEO satellites can observe Global Navigation Satellite System (GNSS) signals from continuously varying geometries and can, in principle, form a worldwide integrity-monitoring network independent of ground infrastructure [18].
Early studies by Enge showed that the fast-changing LEO satellites significantly benefit ambiguity resolution and enhance positioning robustness [19]. Subsequent research revealed that integrating LEO satellites with GNSS can accelerate Precise Point Positioning (PPP) convergence and improve navigation accuracy. More importantly for SBAS, LEO constellations can serve as space-based monitoring stations and provide globally distributed observations (through onboard receivers and inter-satellite links), thereby alleviating the fundamental dependence of SBAS service coverage on the geometry and density of ground monitoring networks. More recently, Gao et al. utilized LEO satellites as space-based monitoring stations and established a global real-time monitoring network composed of LEO inter-satellite links and high-precision onboard receivers. Their system enables sub-meter-level detection of orbital and clock anomalies for BeiDou satellites [20]. Jia et al. proposed a global BeiDou integrity-monitoring architecture based on a 24-satellite LEO constellation. By employing high-precision onboard receivers and inter-satellite links, their method constructs a redundant voting mechanism capable of real-time detection of orbital anomalies and clock faults [17]. Yang proposed an integrated ground–space observation scheme and demonstrated, through simulations based on a Walker LEO constellation, that GNSS could achieve global Approach with Vertical guidance I (APV-I) augmentation [21]. Building on this framework, Zhang further implemented a global simulation of BDSBAS and evaluated its service performance in polar regions using a hybrid constellation [22].
Despite these advances, several critical issues remain unresolved. Existing LEO-augmented SBAS studies often rely either on limited in-orbit experiments or on idealized constellation simulations, without establishing a correspondence between the two. As a result, the temporal evolution and geometric characteristics of simulated LEO networks may not faithfully reflect those observed in real in-orbit data, reducing the credibility of simulation-based validation. Moreover, the performance improvements introduced by hybrid LEO constellations have not been systematically evaluated with respect to their augmentation effects across different regions.
To address these issues, this study uses real GNSS observations from eight accessible LEO satellites to experimentally validate the feasibility of employing LEO satellites as space-based monitoring stations in an SBAS. We include an intermediate eight-satellite bridge simulation whose orbital characteristics (orbit type, altitude, and inclination) are consistent with the eight measured LEO satellites. This step verifies that the simulation framework reproduces similar characteristics to those observed in the real-data experiments under comparable conditions, thereby anchoring the subsequent 108 Walker + 60 polar global assessment and enabling clearer attribution of performance gains to the impact of LEO augmentation. Finally, using a hybrid LEO constellation composed of 108 satellites in a Walker configuration and 60 polar-orbiting satellites, we perform a systematic evaluation of service performance across global regions under APV-I requirements.
2. Materials and Methods
This section presents the overall processing workflow of the presented LEO-augmented SBAS. We first establish a space-based spatiotemporal reference for LEO monitoring stations using precise-ephemeris interpolation and receiver clock-offset correction. A receiver-clock estimation approach is then adopted to synchronize heterogeneous monitoring stations within a consistent SBAS time frame. Subsequently, protection levels (PLs) and Hazardous Misleading Information (HMI)-based integrity are evaluated in accordance with the International Civil Aviation Organization’s (ICAO) Standards and Recommended Practices (SARPs). Finally, a dissemination delay and correction-staleness model are developed to quantify its impact on PLs and service availability.
2.1. Orbit Determination and Receiver Clock Estimation for LEO Monitoring Stations
Because LEO satellites are continuously in motion, obtaining the true geometric range between an onboard LEO receiver and GNSS satellites is essential for computing pseudorange residuals and subsequently estimating correction parameters. This process requires the establishment of a stable space-based spatiotemporal reference, namely the precise position of the LEO satellite [23].
For the validation scenarios involving real LEO data, the precise LEO products that were employed as the reference were generated using onboard GPS observations based on the Reduced-Dynamic Precise Orbit Determination (RDPOD) method. To mitigate the influence of mismodeled non-gravitational forces, particularly atmospheric drag, and to reduce correlations among the estimated parameters, an enhanced processing strategy is employed. Specifically, the atmospheric drag scale factor is statistically constrained during the estimation process based on an initial-value function that is derived from long-term analysis, following the strategy described in [24]. The dynamic models used in the RDPOD processing mainly include the EIGEN-6C gravity field model, the DTM2020 atmospheric density model, and satellite-specific macro-models for non-gravitational force modeling. In contrast, for the simulation analysis, precise LEO orbital trajectories are generated synthetically according to the simulation truth model, and no orbit determination processing is required.
In the real-data validation, the post-processed RDPOD LEO products are used as a reference to avoid conflating LEO errors with the correction-generation errors, thereby isolating the benefit of LEO satellites as space-based monitoring stations. LEO errors may be larger in real-time operations and can enter the monitoring equations as geometry errors, potentially increasing DFRE and inflating PLs, thereby reducing availability. Addressing this effect would either require real-time POD or explicitly modeling the LEO uncertainty in the estimator, which is beyond the scope of this work and will be investigated in future studies.
These post-processed precise ephemerides are provided as discrete samples with a sampling interval of 30 s, where denotes the satellite state including position and velocity . For an arbitrary epoch within a local interpolation window, the -th order Lagrange interpolation polynomial is written as [25]:
where denotes the -th order interpolation basis. In this study, an 11th-order scheme () is adopted, using 12 ephemeris points within a 330 s sliding window. Since observation time tags include receiver clock offsets, we first estimate the onboard receiver clock using an SPP-based solution and remove it from the time tags. The corrected epochs are then used for ephemeris interpolation to generate the LEO reference position and velocity for subsequent geometric range computation.
2.2. Time Synchronization Algorithm for LEO-Augmented SBAS
In conventional SBAS, station clocks are aligned to the system time using a GEO-based common-view approach. However, this method becomes invalid when LEO satellites are introduced, as their fast motion prevents simultaneous visibility across the ground-based network. To ensure consistent observation timing among all monitoring stations, a receiver-clock estimation method is adopted [21].
For each monitoring station, the pseudorange residual before synchronization, denoted as , is expressed as:
where is the line-of-sight (LOS) unit vector from station to satellite , and denote the satellite orbit and clock errors (with the orbit error projected onto the LOS), is the receiver clock offset at station , and represents the remaining unmodeled errors. Here, is a lumped residual term that aggregates the remaining effects that are not explicitly modeled or estimated in (2). It mainly includes pseudorange measurement noise, multipath effects, and residual atmospheric errors after applying priori tropospheric corrections. In this work, is treated as a zero-mean random term with a variance of .
For receiver , the combined can be regarded as a random error whose variance is given by , as provided in the broadcast navigation message. Under this assumption, the receiver clock offset , together with its associated variance, can be estimated using a weighted least squares (WLS) method. Here and are expressed in meters (range domain), with ; also expressed in meters.
The corresponding coefficient matrix is given by:
The weight matrix is defined as:
We assume independence between and URA-represented orbit/clock uncertainty and neglect inter-satellite correlations, so is diagonal. The observation residual is
where denotes the number of satellites observed by receiver . The WLS estimate of the receiver clock offset and its variance are given by:
Finally, the estimated receiver clock offset for each monitoring station is removed from the corresponding pseudorange observations, thereby achieving synchronization between the station clock and the SBAS system time.
After clock synchronization, the pseudorange residual predominantly contains the satellite orbit error and the satellite clock offset error . The corresponding observation equation can be written as
where is the LOS unit vector from station to satellite , and represents the measurement of residual error. The estimated and are the satellite orbit and clock offset error for a satellite () and () station pair, respectively.
The correction that combines the radial orbit error contribution and the clock offset error is referred to as the equivalent clock offset model. In this model, the impact of orbit error components perpendicular to the radial is neglected. The equivalent clock (range-domain) correction can be expressed as
Here, denotes the equivalent clock correction for satellite By combining (8) and (9), the observation equation can be alternatively written as
Therefore, the equivalent clock parameter can be directly estimated using a least squares method. The estimated equivalent clock correction is then substituted back into the original observation equation to form the post-fit residuals. These residuals are further processed, and the resulting corrections are finally broadcast in the form of ephemeris-style correction parameters.
2.3. Protection Level Estimation Model
In this study, APV-I is adopted as the target service level because it is a widely used SBAS precision-approach service with clearly defined alert limits and integrity and availability criteria, enabling consistent evaluation of protection levels and HMI performance. The corresponding APV-I parameters follow the ICAO SARPs [26].
Integrity evaluation is primarily performed by statistically assessing the bounding capability of protection levels with respect to positioning errors. Before integrity assessment, the protection levels must be computed, including the horizontal protection level (HPL) and the vertical protection level (VPL). These protection levels are designed to bound the horizontal and vertical positioning errors under the specified integrity risk requirement [27]. HPL and VPL are computed from the position–domain covariance matrix obtained from the WLS solution:
where and denote the scaling factors used in the computation of HPL and VPL, respectively; denotes the semi-major axis of the horizontal error ellipse; and denotes the standard deviation of the vertical position error.
An epoch is declared as HMI if the positioning error exceeds the corresponding alert limit while the protection level does not:
where HPE and VPE denote the horizontal position error and vertical position error, respectively, HAL and VAL are the APV-I horizontal and vertical alert limits, and denotes the indicator function. Over epochs, the total number of HMI events and the observed HMI rate are reported. In addition, PL envelopment performance is evaluated by the fraction of epochs satisfying HPE < HPL and VPE < VPL, which reflects the statistical bounding capability of the computed PLs.
For each station and epoch, we compute the position solution and the corresponding HPL/VPL from the WLS-derived position–domain covariance and assess availability by comparing HPL and VPL against the APV-I alert limits (HAL/VAL). In parallel, we compute the positioning errors (HPE/VPE) with respect to the reference truth and flag HMI events according to (12) when the error exceeds the alert limit while the corresponding protection level does not. The total HMI count/rate and PL-envelopment fractions are then obtained by aggregating results over all epochs and visualized using Stanford plots (error versus PL) and statistics.
2.4. Dissemination Delay and Correction Staleness Modeling
In practical SBAS services, augmentation corrections and integrity parameters are time-tagged and should be used within their validity windows. For fast corrections, the time of applicability is a reference to SBAS Network Time (SNT) and aligns with the transmission epoch of the corresponding SBAS message [28]. When a dissemination delay exists, the user applies aged correction data, which increases correction staleness and may trigger time-out rules; both effects enlarge the user-domain error bounds and can reduce service availability [29].
To isolate the impact of a dissemination delay, a fixed delay of epochs is injected into the augmentation message stream. Let the user solution be computed at epoch with a sampling interval of . The corrections and integrity parameters used at epoch are those generated at:
Accordingly, the age (staleness) of fast correction data at epoch is modeled as:
where is the system latency time broadcast for SBAS fast-correction use, representing the processing and dissemination latency.
SBAS user receivers are required to invalidate fast corrections when their age exceeds the fast-correction time-out interval . Therefore, for each satellite at epoch , the following rules are applied: if , then the integrity information is considered valid, and if , then the information is considered expired, and the corresponding satellite is treated as unavailable for SBAS-aided positioning [30].
Even when augmentation information remains within its validity window, increased staleness should lead to more conservative protection levels. WAAS is designed to meet a 6.2 s time-to-alert and broadcasts fast corrections at a high update rate. To capture this effect in a transparent manner, the observation variance term associated with SBAS-provided correction quality is inflated as a function of staleness [30]:
where represents the variance contribution of the space-segment correction residual, and is the fast-correction degradation factor for satellite defined by the SBAS message that governs staleness-dependent error growth. The inflated variance is propagated into the observation weight matrix and subsequently into the position–domain covariance and the PLs.
3. Validation with Real LEO Measurements
3.1. Experimental Setup for Real LEO Measurements
This section evaluates the feasibility and augmentation benefit of incorporating existing LEO satellites into SBAS processing, using real GNSS observations from eight available LEO satellites. By integrating the observations from LEO onboard receivers into the SBAS monitoring network, this section analyses their impact on the quality of orbit and clock corrections, the stability of the dual-frequency range error (DFRE), and the availability of regional augmentation services, thereby verifying the capability of LEO satellites to reinforce the monitoring chain of the current SBAS. Table 1 lists the specific parameters of the selected LEO satellites.
Table 1.
LEO Satellite Parameters.
Notably, since 2019 marks the onset of Solar Cycle 25, solar activity gradually intensified thereafter, leading to increased thermospheric neutral density and more frequent geomagnetic disturbances, which can affect LEO determination and GNSS data processing. To ensure a fair and consistent evaluation of LEO-augmented SBAS performance, we therefore select data collected in 2019 for the real measurement experiments.
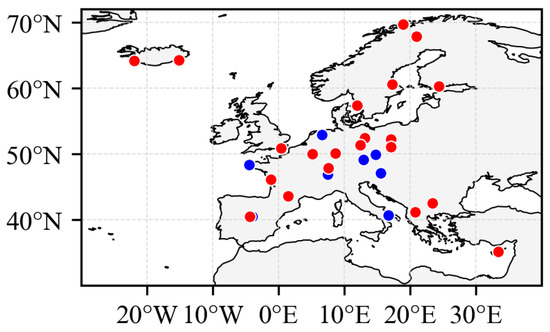
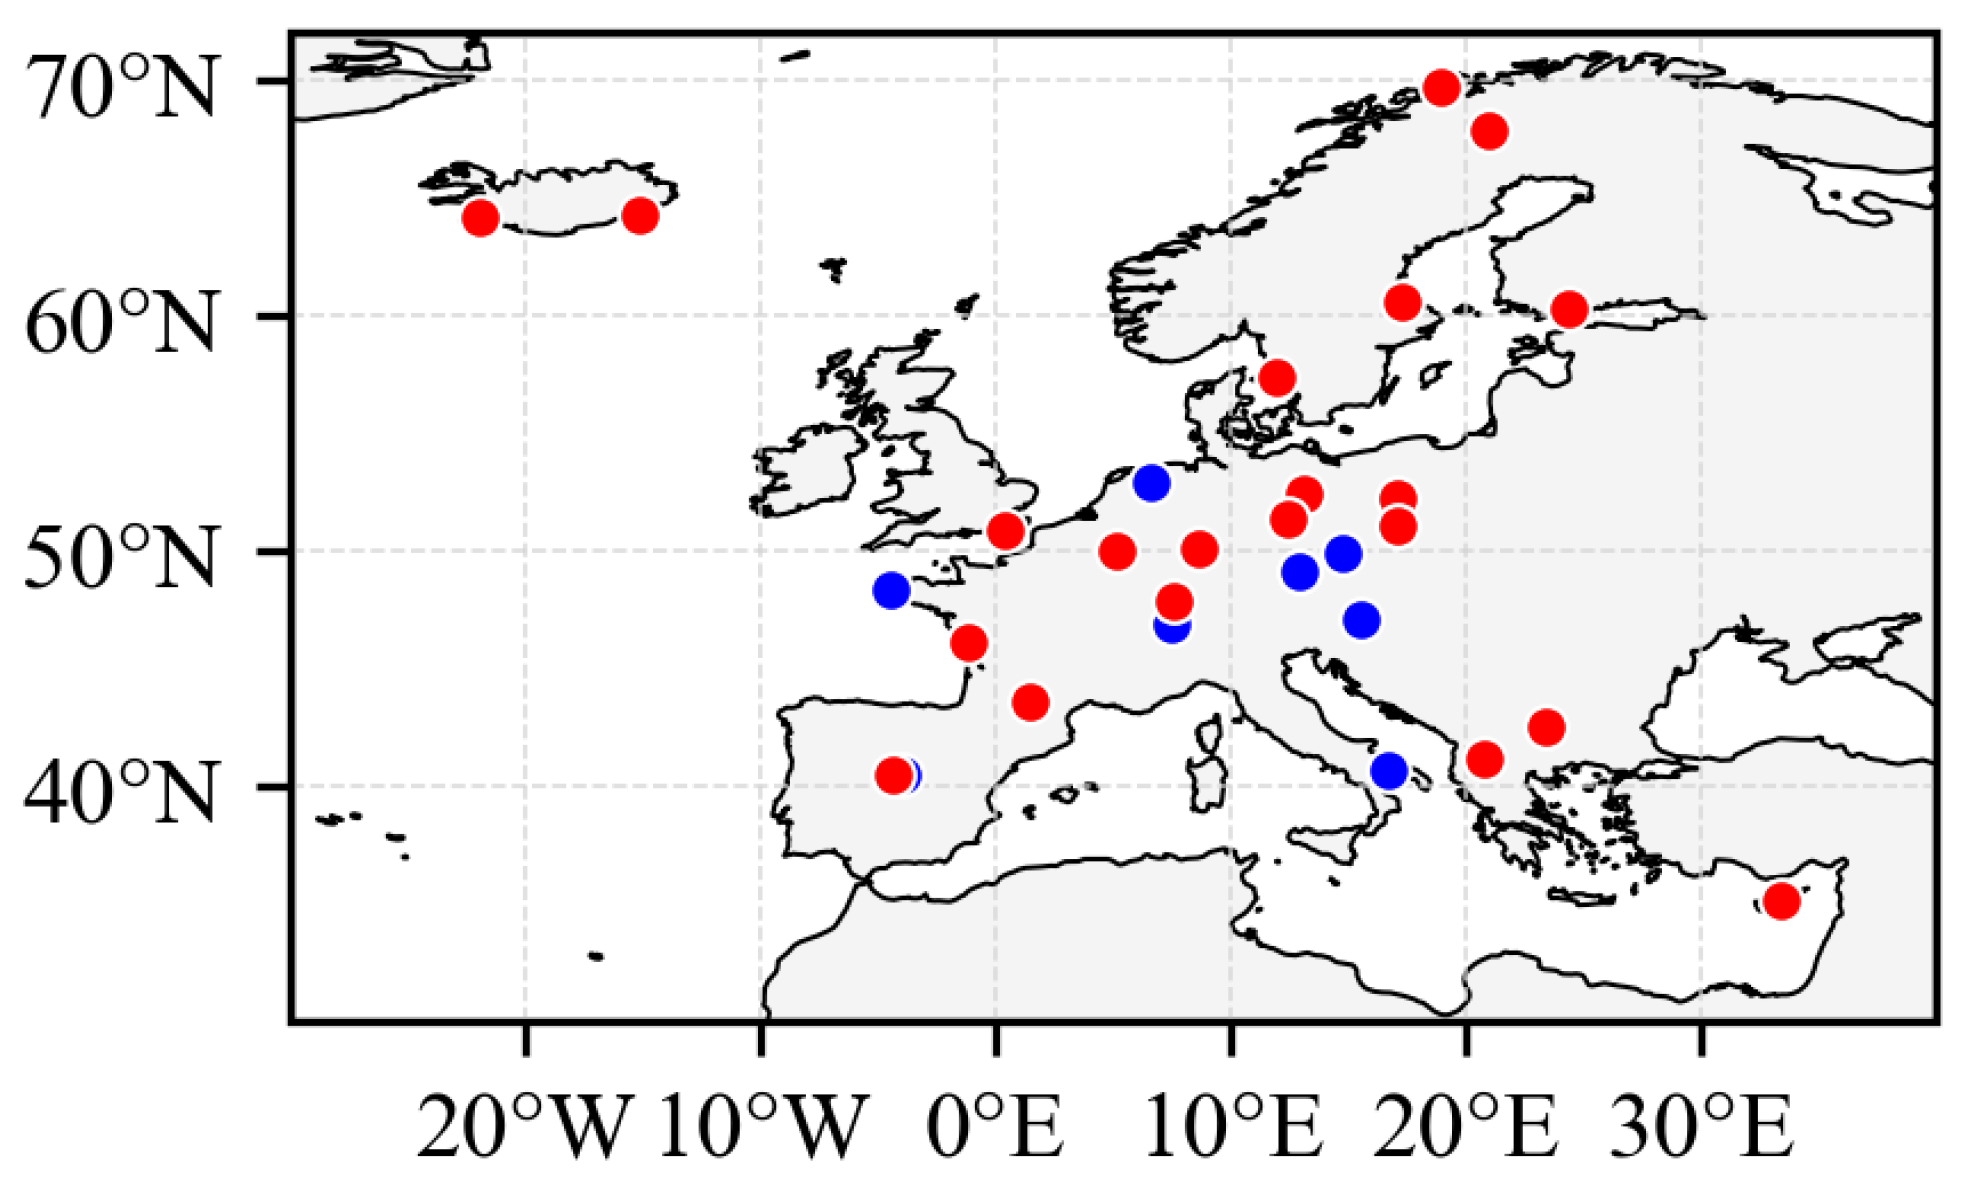
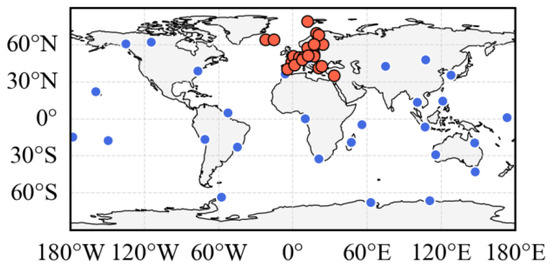
The experiment utilizes eight LEO satellites over day of year (DOY) 146–148 in 2019, with a sampling interval of 30 s. Twenty-nine ground stations in Europe are selected, including 21 ground monitoring stations used for SBAS correction generation (red dots) and 8 independent evaluation stations (blue dots), as shown in Figure 1.
Figure 1.
Ground station distribution map. Red circles indicate the regional ground monitoring stations participating in SBAS processing, while blue circles denote the evaluation stations used for performance assessment.
When LEO satellites are used as space-based monitoring stations, an elevation cutoff angle of 5° is applied, and the processing interval is set to 30 s. The SBAS processing strategy is summarized in Table 2. For ground users, the tropospheric delay is corrected using a standard SBAS tropospheric model, and the residual tropospheric uncertainty is accounted for in the integrity error budget. For LEO onboard receivers, the tropospheric delay is not applicable because the signal path does not traverse the neutral atmosphere. In addition, the integrity analysis in this study is conducted in accordance with the APV-I service requirements, with the detailed performance criteria listed in Table 3.
Table 2.
SBAS Processing and Positioning Data Handling Strategies. (GF denotes Geometry-Free; MW denotes Melbourne-Wübbena; and IF denotes ionosphere-free).
Table 3.
Performance and requirements of APV-I.
3.2. Measured Performance of the Corrections and DFRE
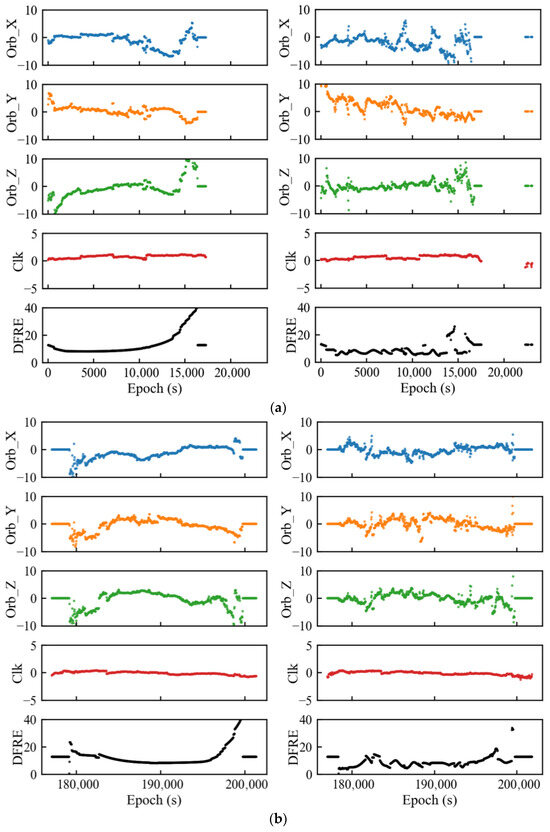
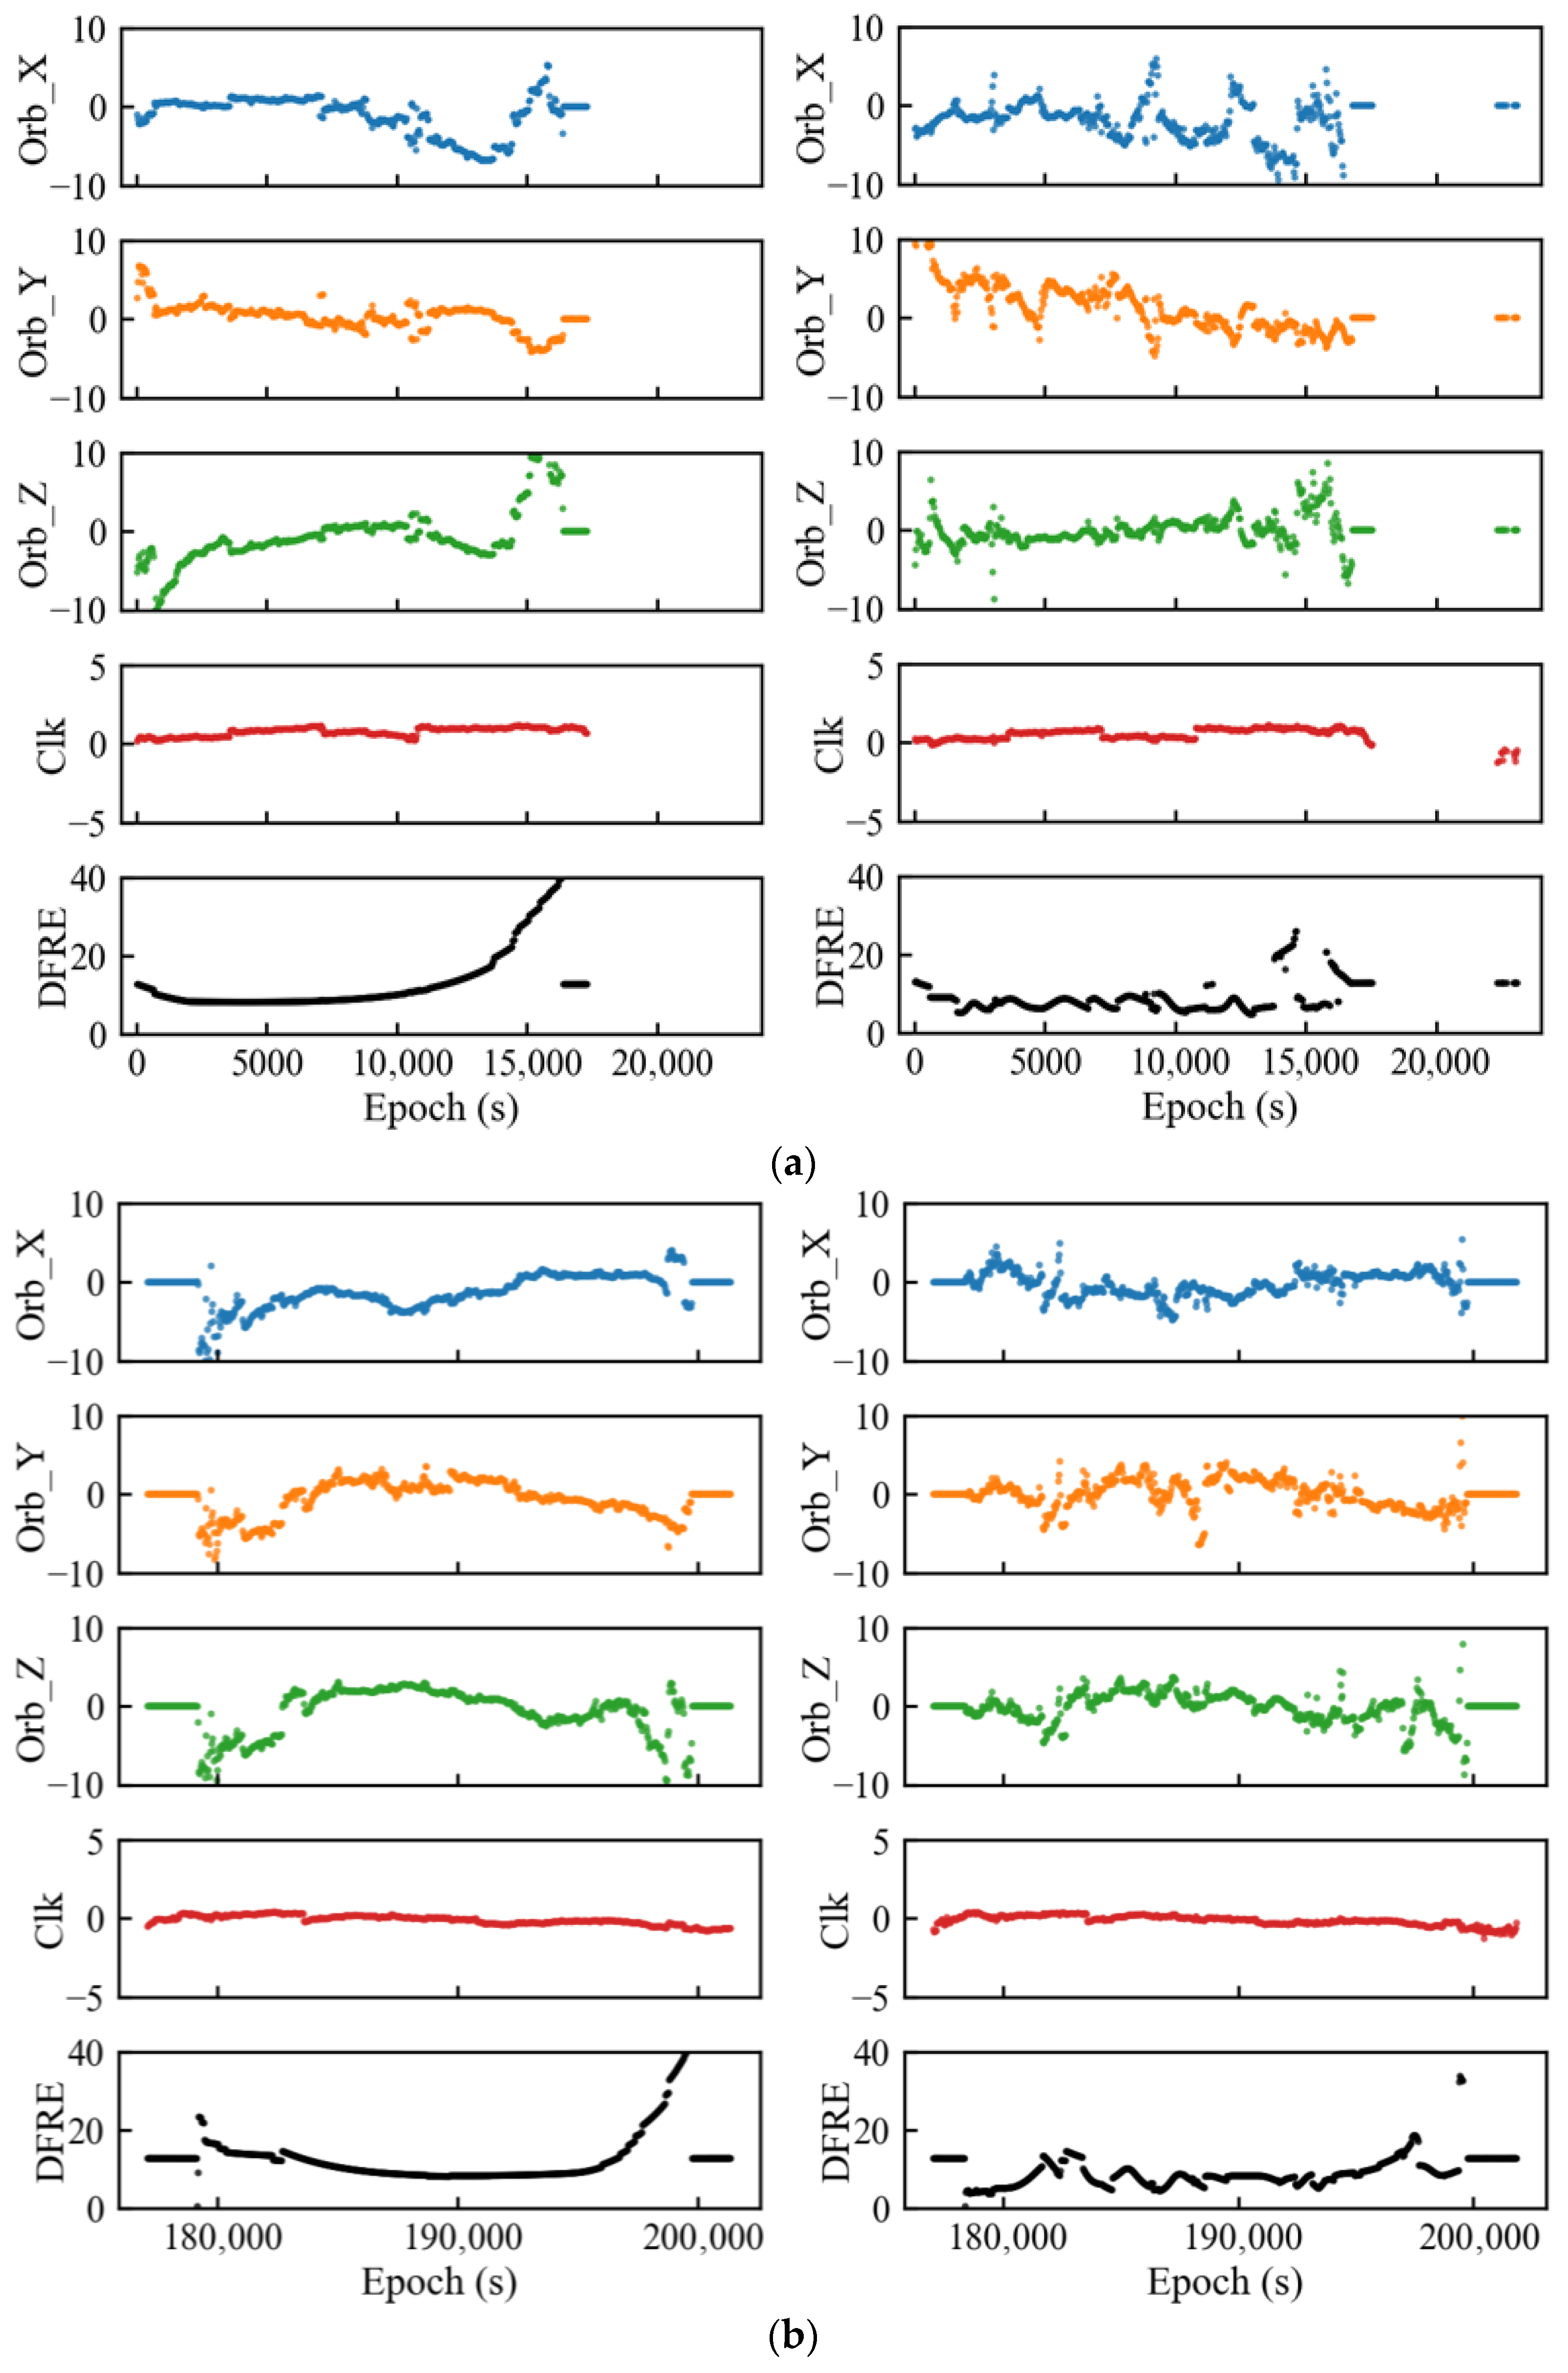
To compare the performance of the satellite orbit and clock corrections before and after incorporating LEO satellites, the G07 satellite and G13 satellite are selected as representative examples. Similar behaviors are observed for the other satellites; however, for conciseness, only the results of G07 and G13 are presented here. The correction quality at the constellation level is evaluated separately using user range error (URE) statistics over all 32 GPS satellites. DFRE is computed as the dual-frequency range error derived from the ionosphere-free combination residual after applying the estimated SBAS orbit/clock corrections. The correction sequences and the DFRE values obtained with and without LEO augmentation are compared, as shown in Figure 2. The left panel shows the correction series computed using ground stations only. The right panel presents the correction series obtained with LEO-integrated monitoring.
Figure 2.
Correction series of satellite G07 (a) and satellite G13 (b) under different monitoring configurations. ((left): ground-only and (right): ground + 8 LEO) (unit: m).
Compared with the ground-only configuration, introducing LEO satellites does not substantially change the overall pattern of the orbit corrections, and pronounced fluctuations still occur during satellite ingress and egress. The clock corrections remain similarly smooth in both configurations and stay close to zero. These ingress/egress fluctuations are primarily attributable to increased measurement noise and residual unmodeled effects at low elevation angles, together with degraded monitoring geometry when the effective number of ground stations decreases near the network boundaries. Under such unfavorable geometry, the coupling between orbit and clock parameters becomes stronger, so that part of the range–domain residuals may be absorbed into the estimated orbit-correction components, inflating their magnitudes. Notably, after LEO integration, DFRE is significantly reduced during ingress and egress, indicating that the strengthened boundary geometry mitigates the estimation instability observed in the ground-only case; the bowl-shaped DFRE profile is also largely eliminated. Meanwhile, when only eight LEO satellites are available, the orbit-correction time series may become less smooth and occasionally exhibit discontinuities because the LEO–GNSS monitoring links appear and disappear frequently, causing rapid changes in the observation set and geometry. As the number of LEO satellites increases, the monitoring redundancy and geometric stability improve, and these effects gradually diminish.
The URE is defined as the projection of satellite orbit and clock errors onto the user–satellite line of sight, reflecting the overall system performance of the satellite as well as the impact of the space and control segments on positioning accuracy [31].
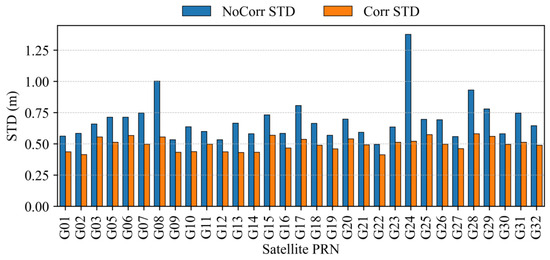
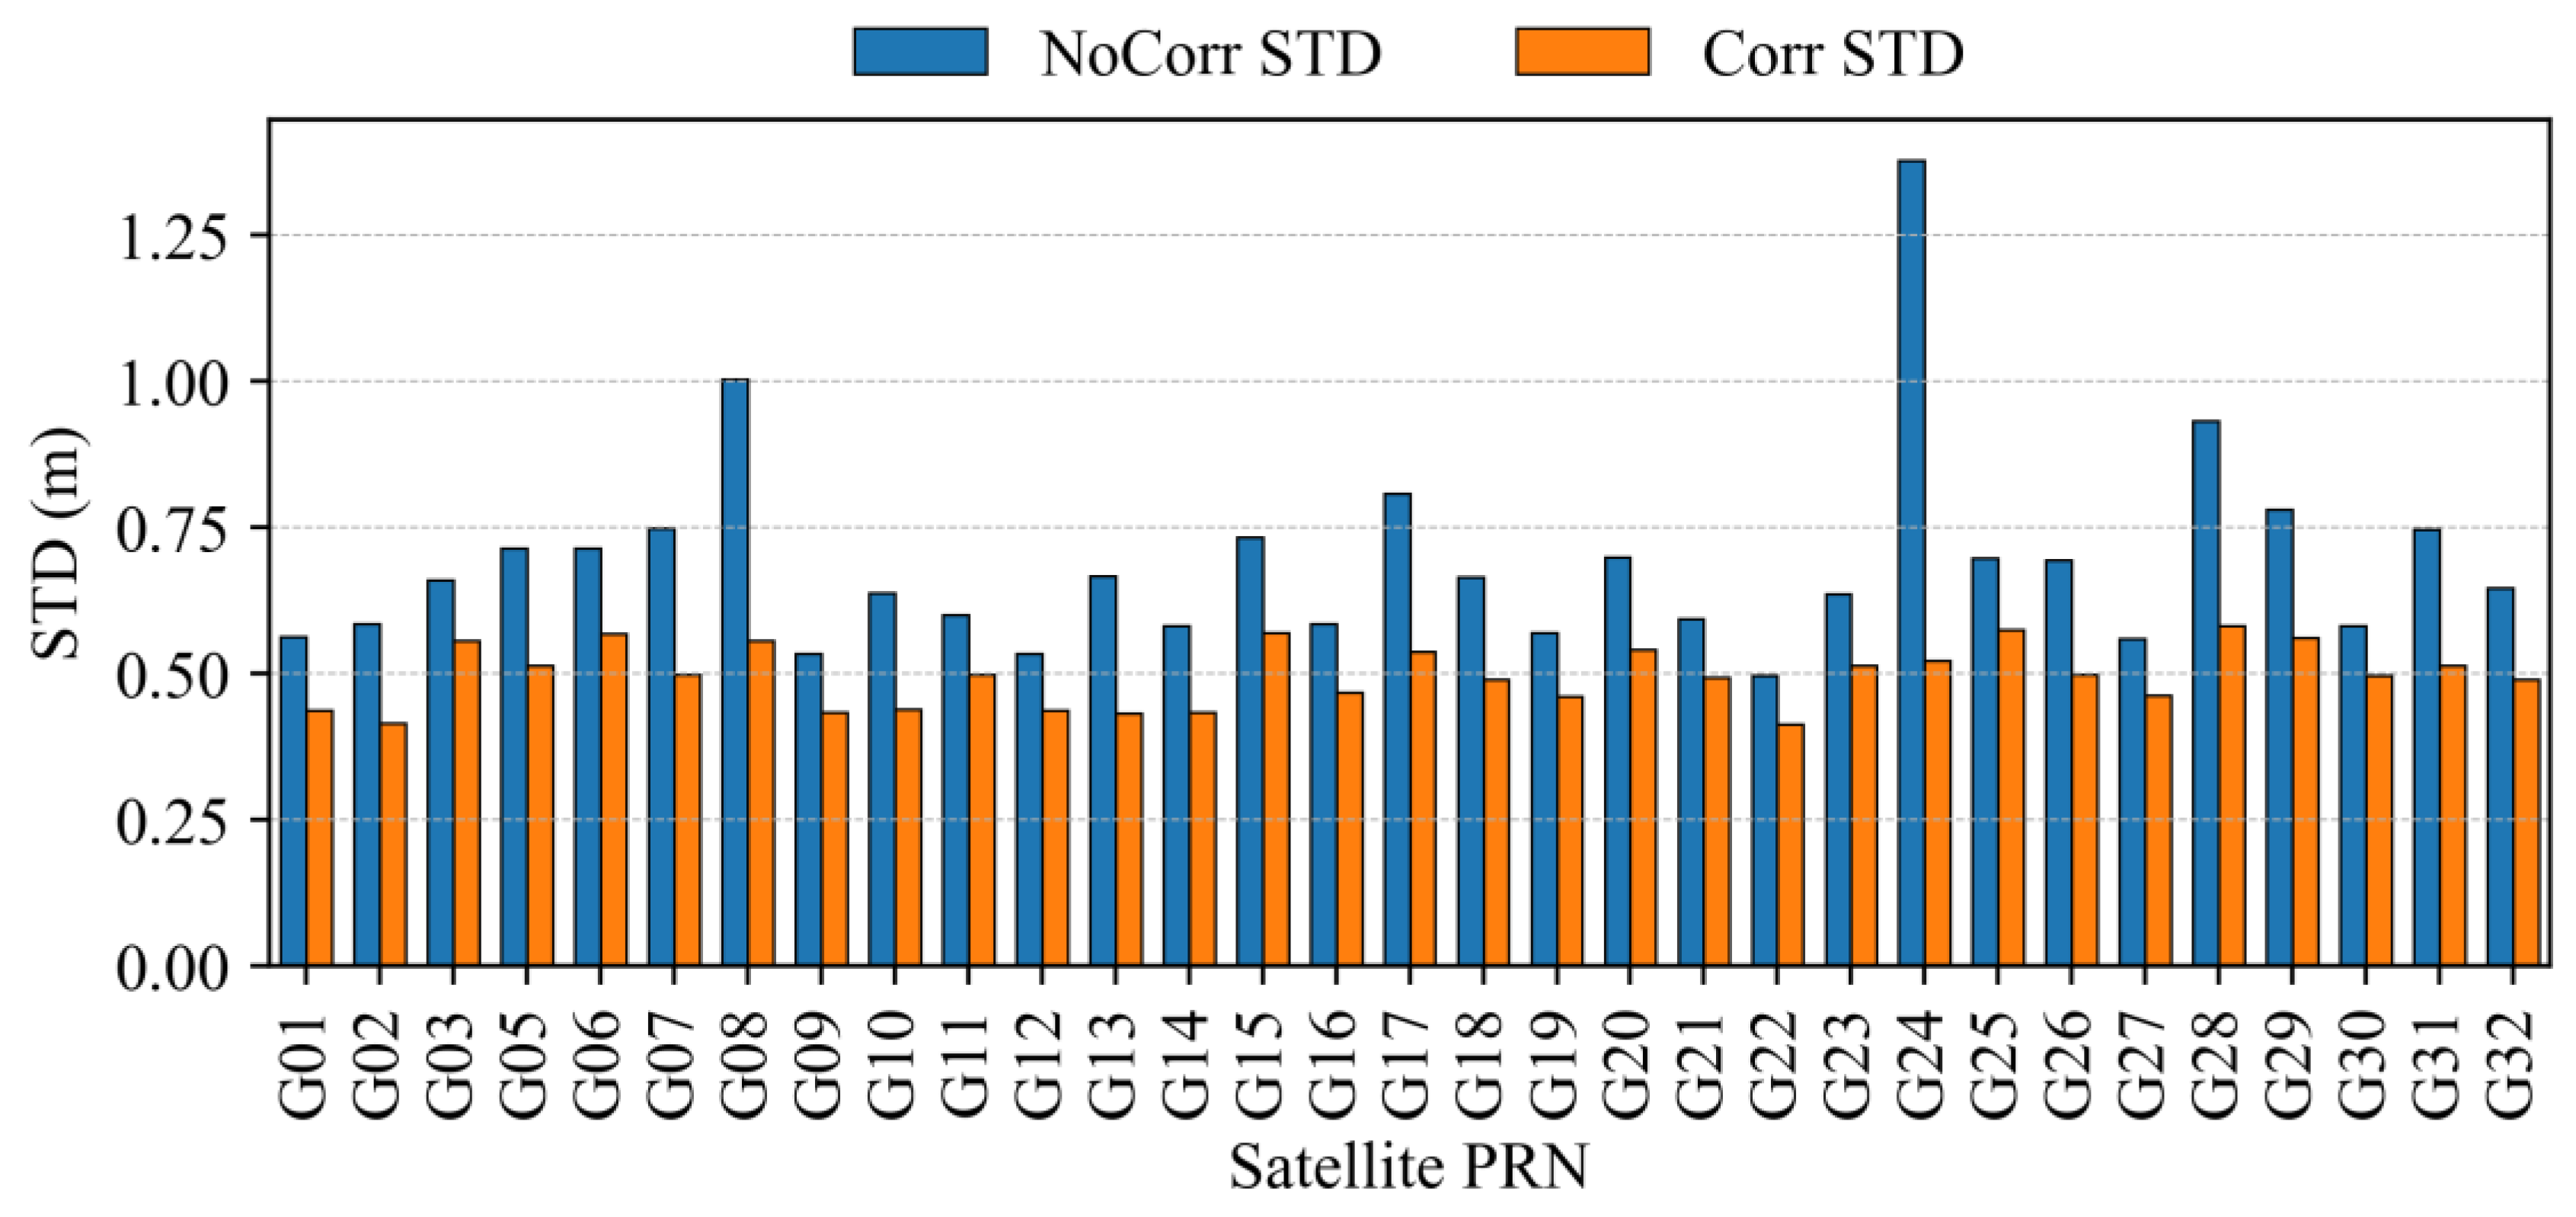
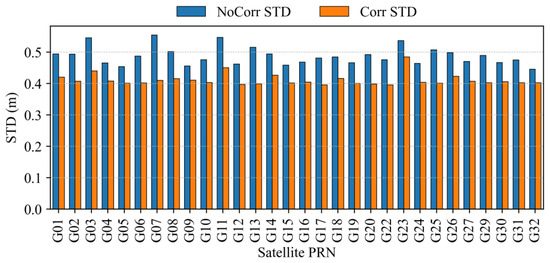
To quantify the correction quality at the constellation level, an analysis of the URE values for all satellites under different configurations was first conducted, as illustrated in Figure 3. Compared to the configuration without SBAS corrections, the mean URE after applying SBAS corrections is close to 0 m, and the overall URE dispersion is reduced, with a lower standard deviation (STD). A few satellites show relatively larger pre-correction URE dispersion, and these outliers are effectively mitigated after applying SBAS corrections.
Figure 3.
Standard deviation of satellite URE before and after augmentation. (LEO-integrated).
To further compare the satellite URE performance between the ground-only SBAS configuration and the LEO-integrated SBAS configuration, a statistical analysis was conducted, as summarized in Table 4. The results indicate that incorporating LEO satellites does not significantly affect the URE standard deviation of individual satellites. The mean of the per-satellite post-correction URE STD is 0.499 m for the LEO-integrated case, which is slightly higher than the ground-only case. This behavior is mainly attributed to changes in satellite availability and the resulting sample set after LEO integration, which may include a small number of long-tailed residuals and slightly inflate the STD-based metric. This suggests that LEO observations primarily enhance monitoring geometry and reduce edge-of-network effects, rather than further shrinking within-region URE dispersion. Moreover, the LEO reference positions are interpolated from post-processed precise ephemerides, and residual interpolation and orbit uncertainties may propagate into correction estimations, potentially masking part of the incremental URE improvement.
Table 4.
Statistical Comparison of Mean URE.
3.3. Number of Available Augmented Satellites
After SBAS augmentation messages are broadcast, the number of usable augmented satellites varies with location. It is higher near the center of the ground monitoring network and decreases with distance due to geometry degradation and service-boundary effects. Fewer usable satellites can degrade accuracy and may prevent positioning when fewer than four satellites are available. Therefore, we discretize the globe into a latitude–longitude grid and compute, for each grid point, the number of available augmented satellites. The analysis is conducted under two configurations: ground-stations-only monitoring and LEO-integrated monitoring, and the results are time-averaged. This allows us to quantify the improvement in augmented-satellite availability and coverage brought by LEO space-based monitoring stations.
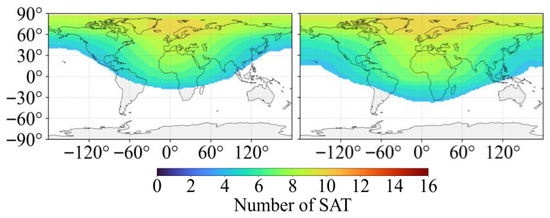
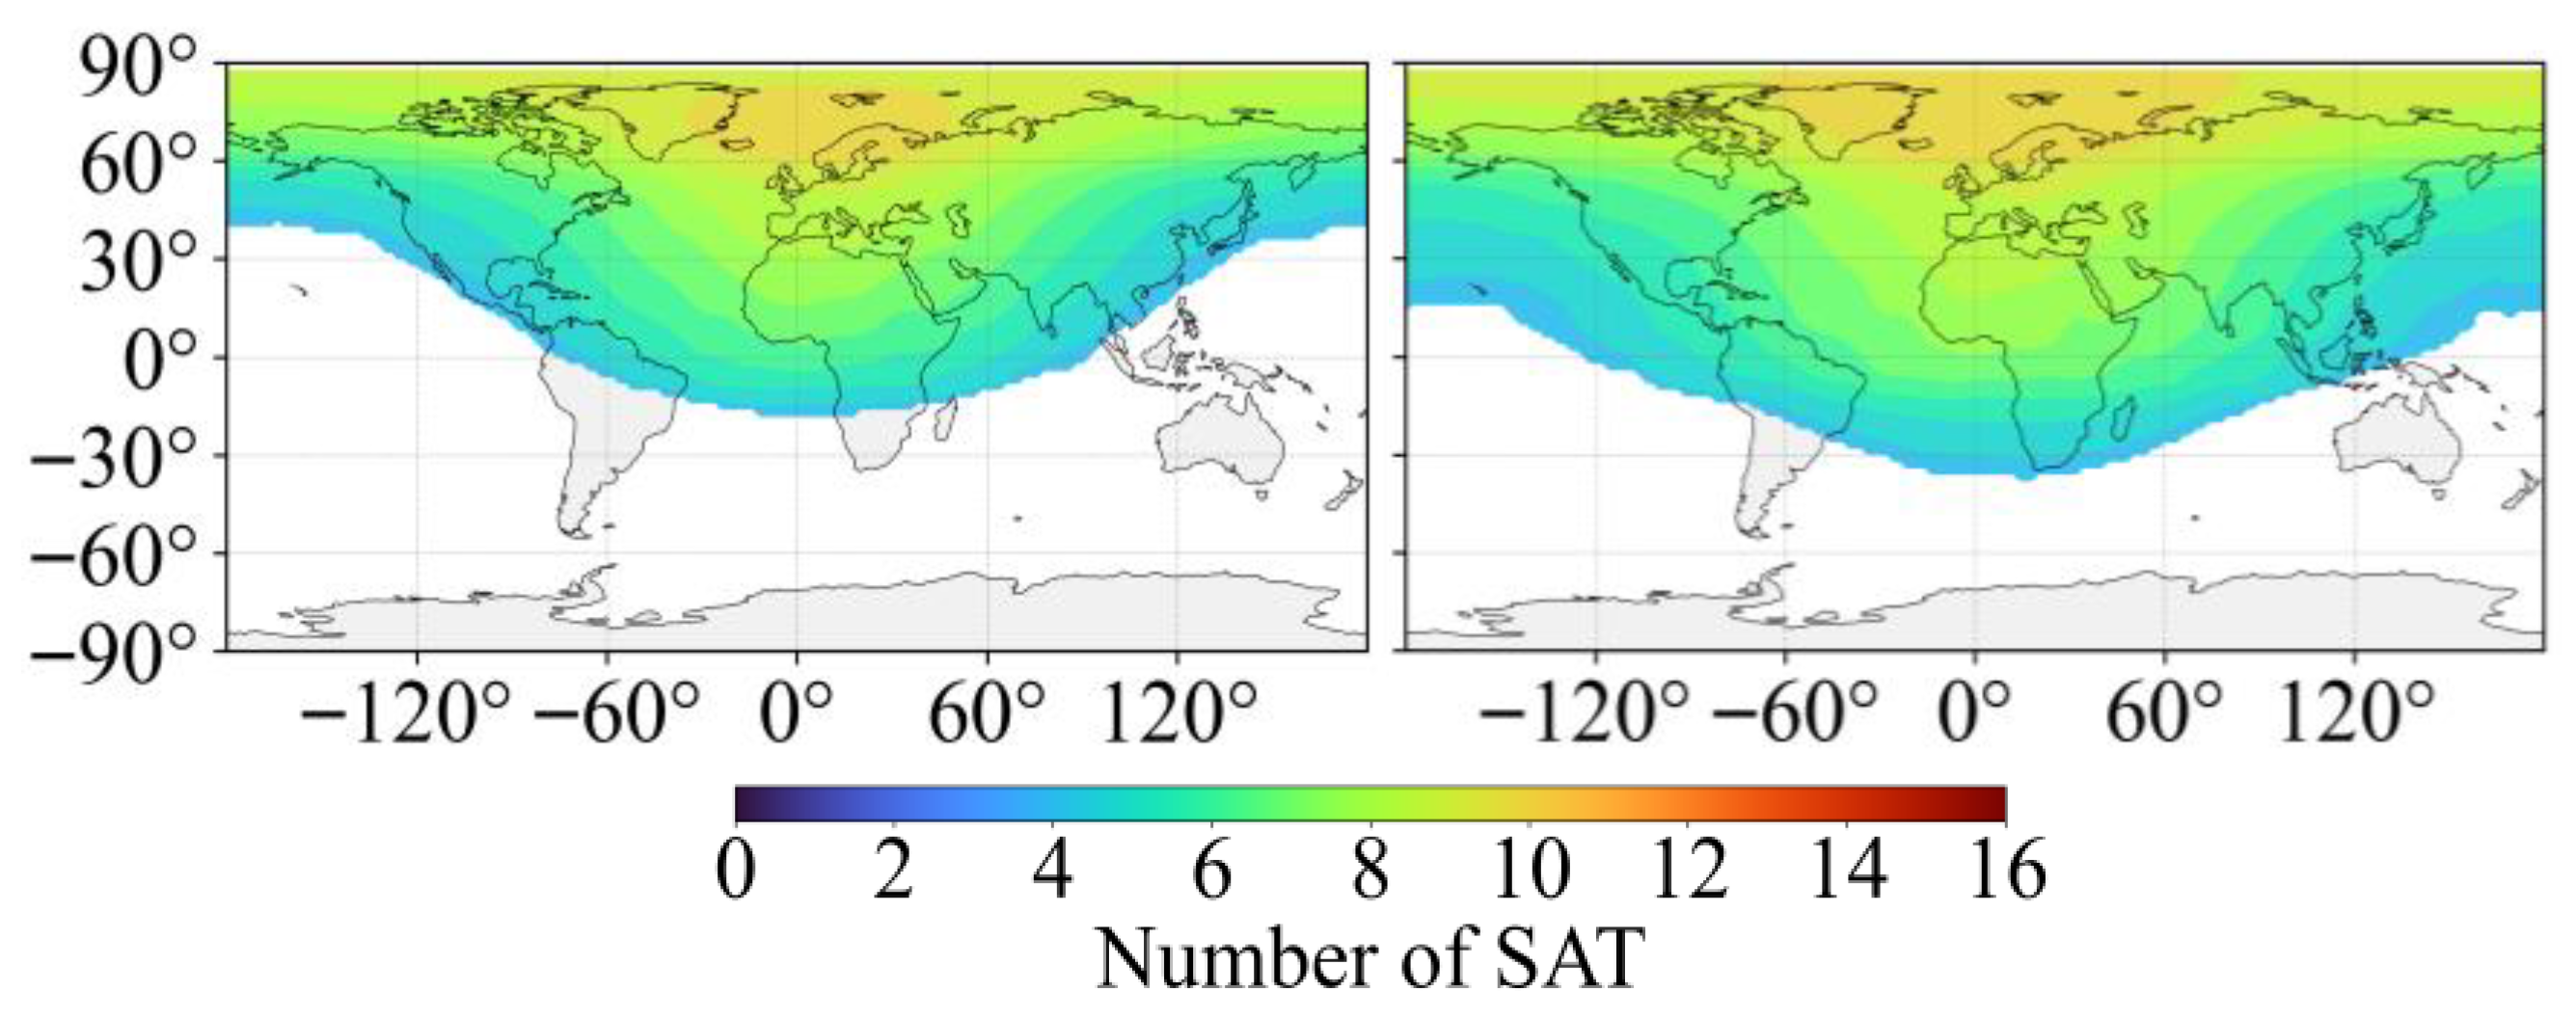
A comparison of the number of available augmented satellites in the SBAS system before and after incorporating LEO satellites is presented in Figure 4. The left panel shows the results obtained using regional ground stations only, while the right panel corresponds to the configuration with LEO integration. The white areas indicate instances where positioning was impossible due to fewer than four visible satellites.
Figure 4.
Number of available augmented satellites under different monitoring. ((left): ground-only and (right): ground + 8 LEO).
The results indicate that, when relying solely on ground stations, the number of augmented satellites in the European region ranges from 6 to 9, whereas the numbers in the Southern Hemisphere, Asia, and North America are much lower. After incorporating eight LEO satellites, the number of available augmented satellites increases markedly worldwide, with Northern Europe having the largest number. This is because all eight LEO satellites included in this study are polar-orbiting satellites, which can increase the number of visible satellites in high-latitude and polar regions. Furthermore, the area where at least four satellites are available for positioning has significantly expanded, demonstrating that the inclusion of LEO satellites can indeed extend the service range of SBAS.
3.4. Positioning Performance
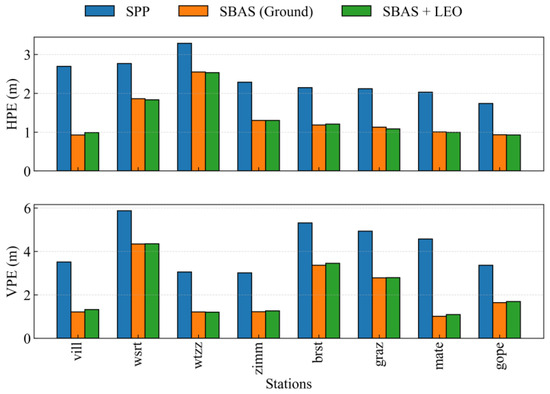
To evaluate the positioning accuracy after incorporating LEO satellites, the 95th-percentile HPE and VPE at each station are computed and compared using bar charts, as shown in Figure 5. Three positioning strategies are considered, including uncorrected SPP, ground-based SBAS correction, and SBAS augmented with LEO satellite observations.
Figure 5.
Positioning accuracy.
In Figure 5, the blue bars represent the 95th-percentile uncorrected SPP errors, while the orange and green bars denote the errors for the ground-based SBAS and LEO-augmented SBAS solutions, respectively. As illustrated, prior to augmentation, horizontal positioning errors fall within the range of 1.7 m to 3.2 m across all stations. With augmentation, these errors are noticeably reduced to 0.9–2.5 m. Similarly, for the vertical component, positioning errors decrease from an initial range of 3.0–5.8 m to 1.0–4.3 m after augmentation. All stations remain well within the APV-I accuracy requirements.
As shown in Table 5, the positioning accuracy improvements of the ground-based SBAS and the SBAS with LEO augmentation relative to SPP are compared. The improvement is computed on a station-by-station basis as and then averaged over all stations. Specifically, horizontal accuracy shows an average improvement of 51.400%, while the vertical component yields an average improvement of 44.196%. These results show that SBAS corrections significantly improve positioning accuracy relative to uncorrected SPP. However, it is worth noting that incorporating LEO satellites does not provide further improvement in positioning accuracy when compared with the ground-based SBAS solution. This behavior is consistent with the URE analysis presented in Section 3.2, which indicated that LEO integration primarily improves monitoring geometry rather than significantly reducing the residual range errors within the service region.
Table 5.
Average improvement in positioning accuracy relative to the uncorrected SPP solution.
3.5. Integrity Analysis of SBAS Services for Real LEO Measurements
The system integrity assessment is performed in accordance with ICAO standards by evaluating the availability metrics and the probability of HMI for the selected evaluation stations.
Table 6 summarizes the APV-I availability of each evaluation station together with the corresponding counts of Hazardous Misleading Information (HMI) events. Here, availability is defined as the fraction of epochs that satisfy the APV-I protection-level conditions. As shown in table, all evaluation stations achieved 99% availability throughout the test period, and no HMI events were observed.
Table 6.
Statistics of Station Availability and Integrity Risk Events.
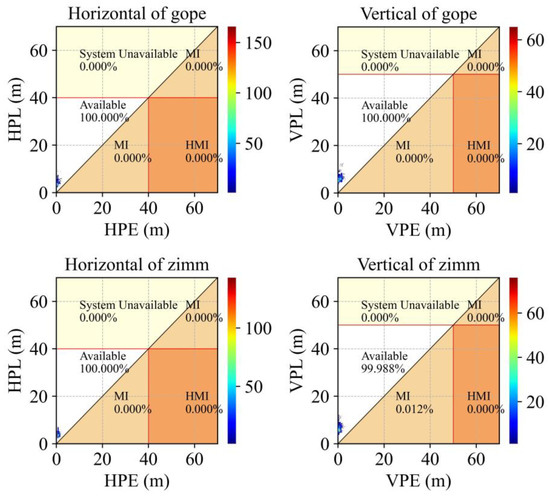
The GOPE and ZIMM stations are selected to generate the corresponding Stanford diagrams. The Stanford diagram provides an intuitive assessment of navigation integrity performance by jointly illustrating the relationship between PE on the horizontal axis and PL on the vertical axis, thereby reflecting the system’s integrity capability under APV-I requirements. The horizontal and vertical axes represent PE and PL, respectively. As shown in Figure 6, GOPE achieves 100% availability in both the horizontal and vertical directions. ZIMM reaches 100% horizontal availability, while its vertical availability is 99.988%. No HMI events are detected at either station during the test period. Overall, the statistics indicate that all eight evaluation stations satisfy the minimum APV-I availability requirement over the entire observation interval.
Figure 6.
Stanford diagram statistics for the GOPE and ZIMM stations.
4. Global Simulation and Validation
Section 3 demonstrated, based on real measurement data, that LEO satellites functioning as space-based monitoring stations can significantly improve the stability of SBAS corrections and the corresponding regional service performance. However, the real LEO data are limited in terms of satellite quantity, coverage, and duration, and therefore cannot support a comprehensive global assessment and validation.
Building on the analysis of the real-data results, this section constructs an eight-satellite simulated LEO constellation with orbital characteristics consistent with the real observations. Subsequently, a more complete LEO constellation configuration is employed for simulation analysis to investigate its enhancement effects on SBAS services.
4.1. Experimental Setup
Relevant analyses indicate that Walker constellation configurations with an inclination of 48° or 132° can significantly enhance regional augmentation performance. At altitudes above ~1000 km, atmospheric drag is generally weaker than at lower LEO altitudes, which is favorable for orbit maintenance and stable orbit determination [32]. Constellation-scale simulations demonstrate that network sizes of 60–150 satellites can achieve continuous single-layer or dual-layer ground coverage, thereby meeting the requirements of GNSS augmentation systems [33]. After considering these factors comprehensively, this study selects a Walker 108/12/1 constellation with an orbital altitude of 1150 km and an inclination of 48°, together with a Polar 60/6/1 constellation at 1175 km altitude and 86.5° inclination [18], as the simulation configuration. The detailed parameters of the simulated satellites are listed in Table 7.
Table 7.
Simulated Satellite Parameters.
Before performing this large-scale global simulation, the aforementioned eight-satellite simulated LEO constellation was used to verify consistency between real and simulated data. The orbital parameters of this constellation are summarized in Table 8.
Table 8.
Orbital Parameters of the Simulated Eight-LEO Constellation for Model Validation.
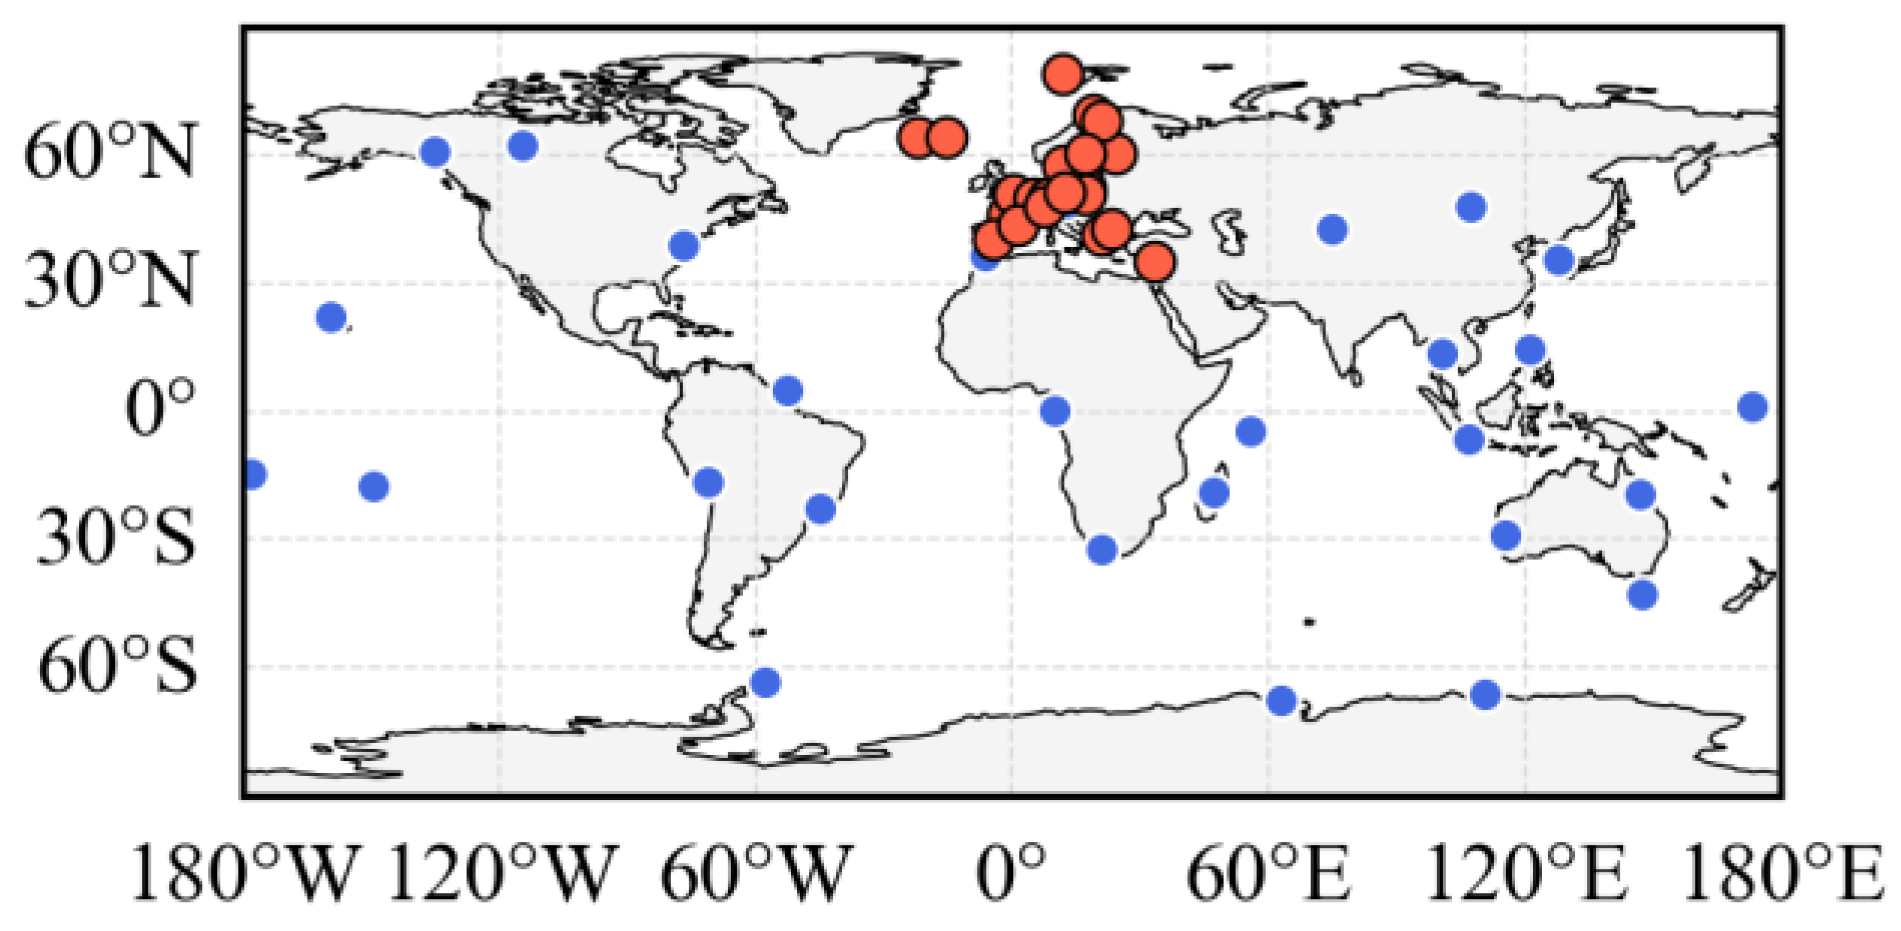
The simulation-based performance evaluation uses 31 globally distributed virtual stations, with a simulation duration of seven days. The simulation reference period spans 1–7 May 2025. To maintain consistency with the real-data experiment in Section 3, the simulation uses a European regional ground monitoring network as a representative SBAS regional deployment. Figure 7 shows the station distribution: the blue markers denote the evaluation (user) stations, while the red markers represent the regional stations that are participating in the SBAS processing. The LEO-based GNSS correction and the integrity parameter generation, as well as the positioning computation strategies, are summarized in Table 2.
Figure 7.
Global distribution of stations. Red circles indicate the regional ground monitoring stations participating in SBAS processing, while blue circles denote the globally distributed evaluation stations used for performance assessment.
4.2. Correction and DFRE Analysis
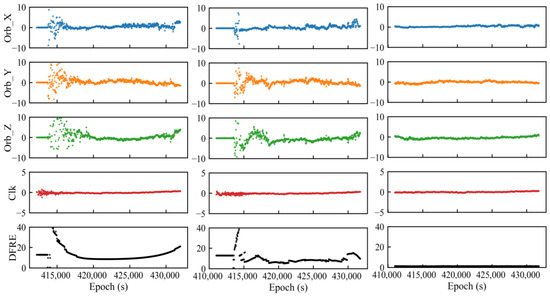
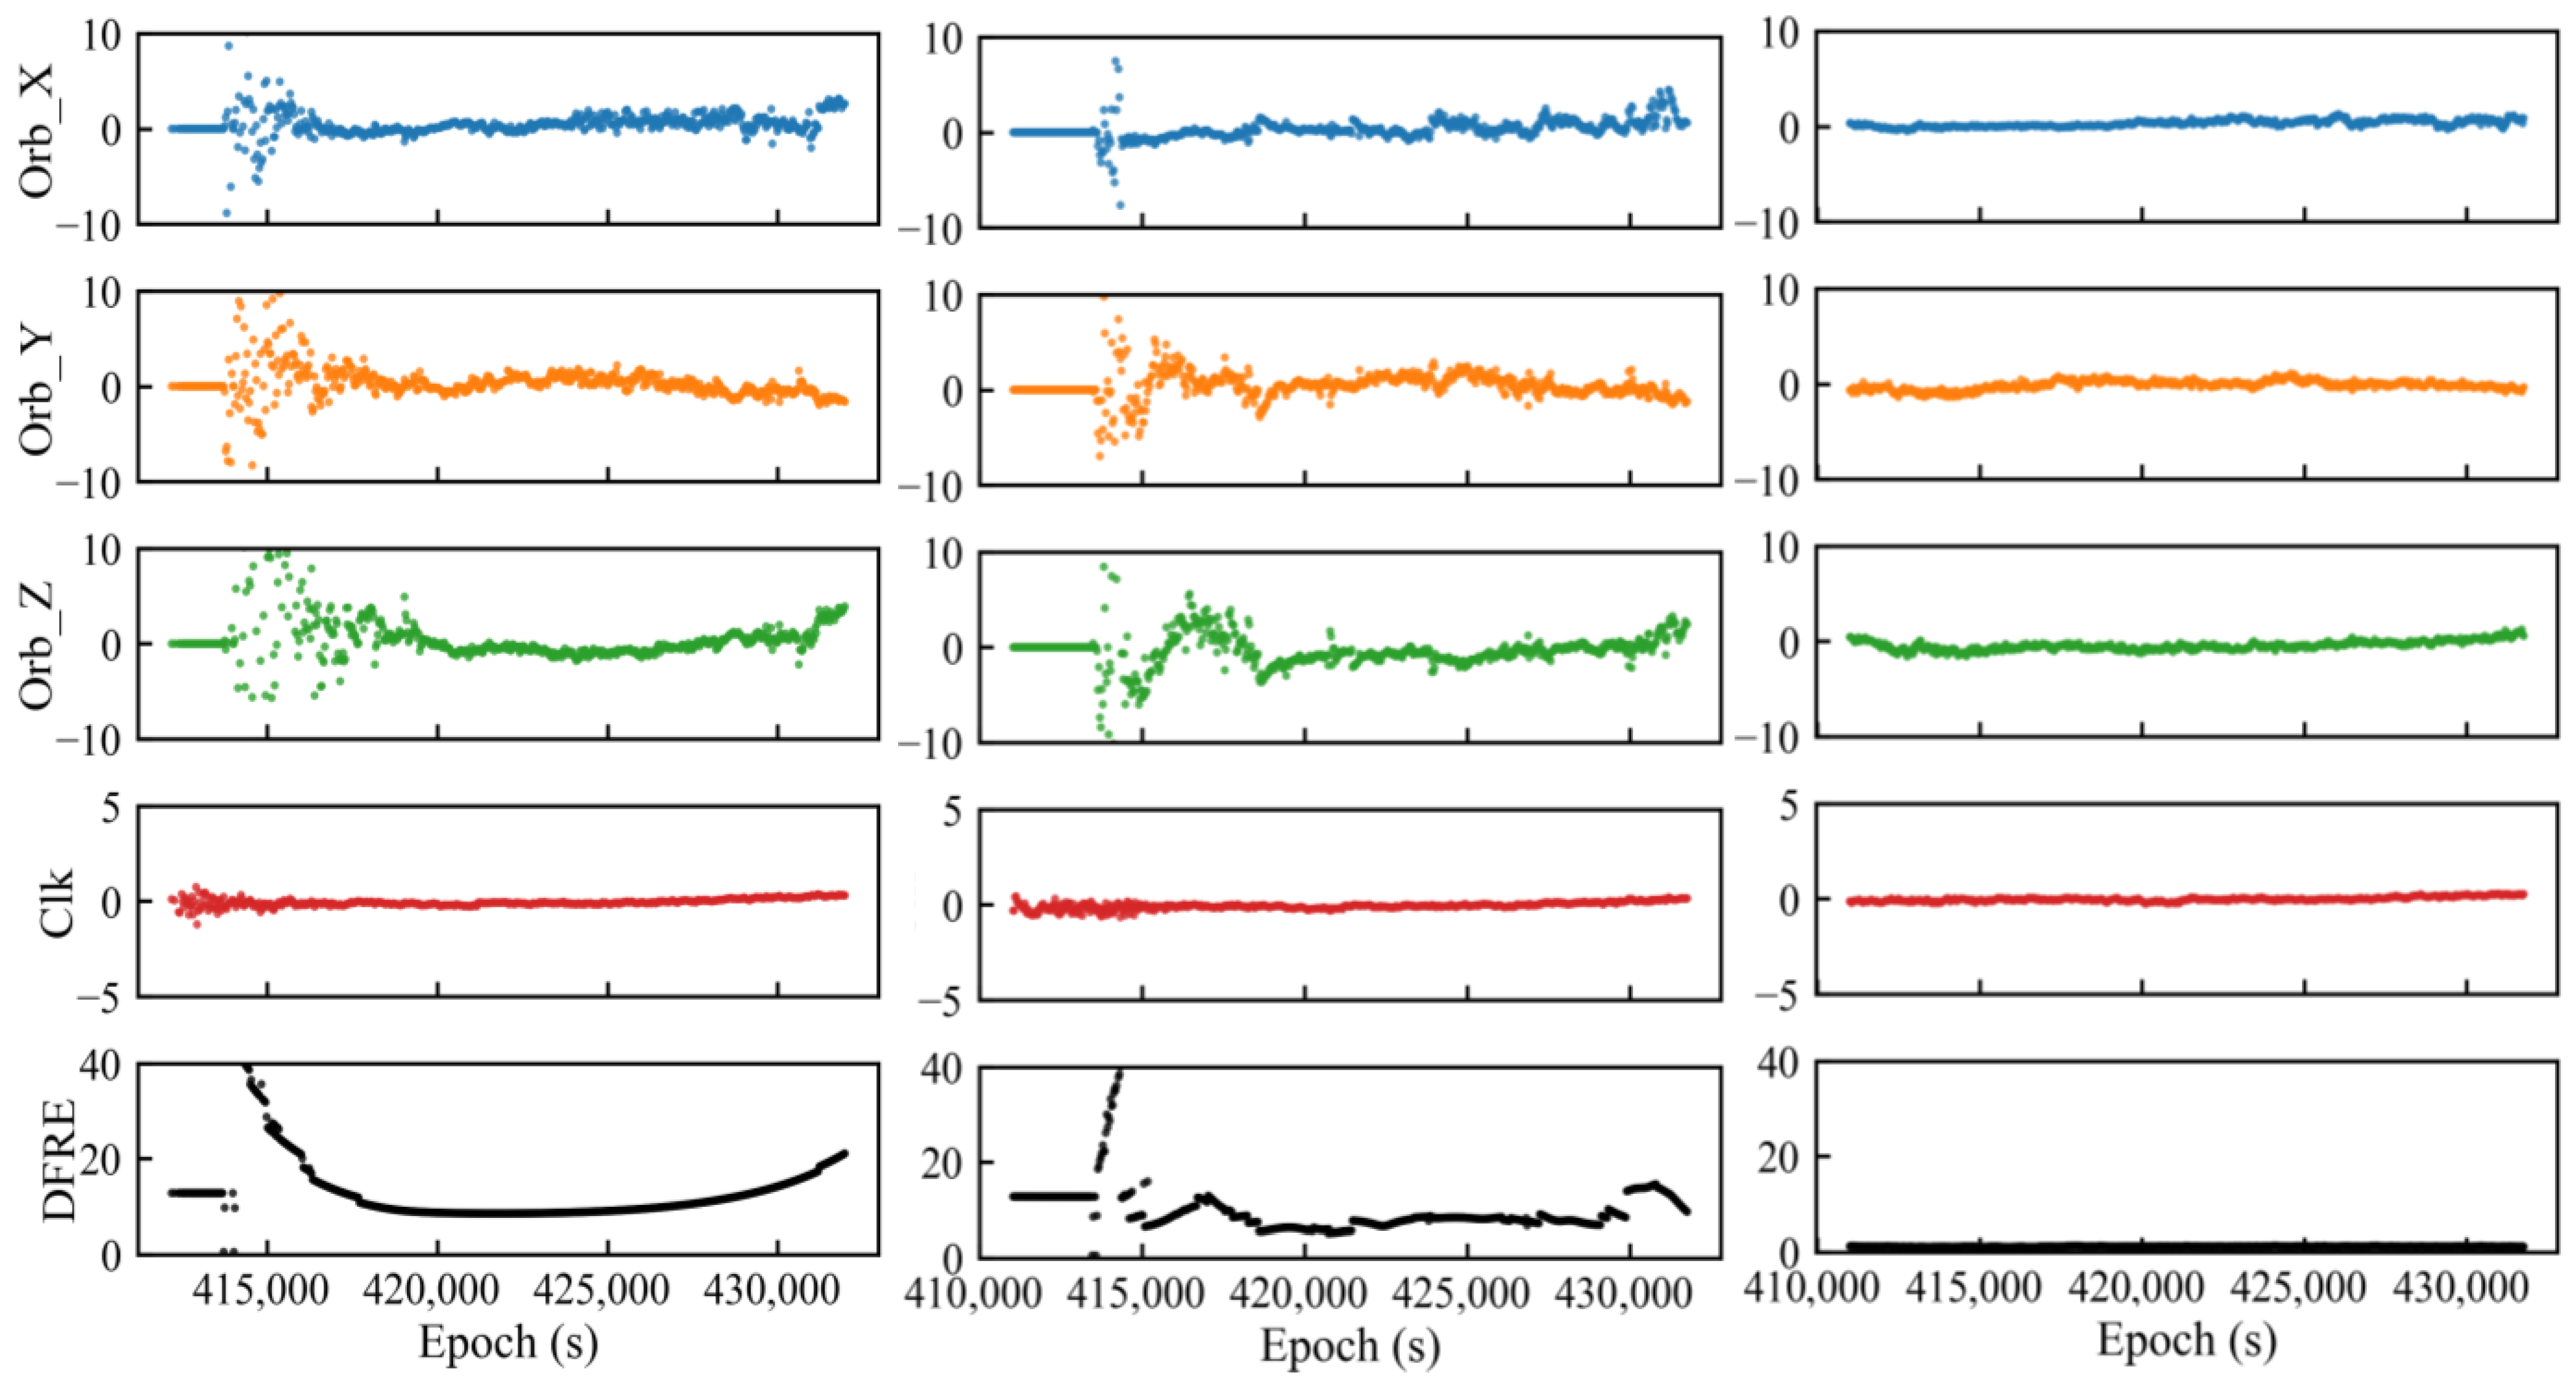
To illustrate the impact of LEO augmentation on satellite orbit and clock correction performance, the correction series and DFRE values of satellite G07 are presented as a representative example. The results under different augmentation configurations are compared in Figure 8. The left panel shows the correction series computed using ground stations only, while the middle panel presents the results after incorporating eight LEO satellites as space-based monitoring stations. Finally, the right panel illustrates the correction series obtained with a large-scale LEO constellation (108 Walker + 60 polar satellites).
Figure 8.
Correction series of satellite G07 under different monitoring configurations (ground-only, 8 LEO, and 108 + 60 LEO). (unit: m).
Due to space limitations, only one representative satellite is shown. Similar trends in correction stability and DFRE variation are observed for the other satellites under the same augmentation configurations. A comparison shows that, under ground-only monitoring, the orbit corrections fluctuate strongly before stabilizing, whereas the clock corrections remain near zero. The DFRE exhibits a bowl-shaped pattern.
After integrating eight LEO satellites, the DFRE sequence no longer exhibits this bowl-shaped characteristic, which is consistent with the measurement-based results in Section 3. Correspondingly, the orbit-correction fluctuations are noticeably reduced, with most values confined within 5 m for most epochs. Similarly, both the simulated and measurement-based eight-LEO cases show occasional fluctuations and step-like changes in orbit corrections; however, such abrupt changes are less frequent in the simulation, likely because the simulated observations are generated under more idealized conditions. When the 108 + 60 LEO constellation is introduced, the correction series becomes smooth without any discontinuities and remains centered near zero, and the DFRE values fall below 5 m.
These results indicate that incorporating LEO satellites substantially stabilizes the correction series and significantly reduces DFRE values. The underlying reason is that although broadcast ephemeris orbit errors should theoretically vary smoothly, the SBAS correction generation process relies on ground monitoring stations. When satellites enter or exit the monitoring coverage, the number and geometry of available observations change, leading to instability in both the corrections and the DFRE sequence. Additionally, the convergence characteristics of carrier-smoothed pseudoranges introduce fluctuations, and Dilution of Precision (DOP) variations contribute to the bowl-shaped DFRE distribution. With the inclusion of LEO satellites, the correction series benefits from improved DOP and becomes more stable, no longer exhibiting sensitivity to satellite ingress or egress of the monitoring region [9].
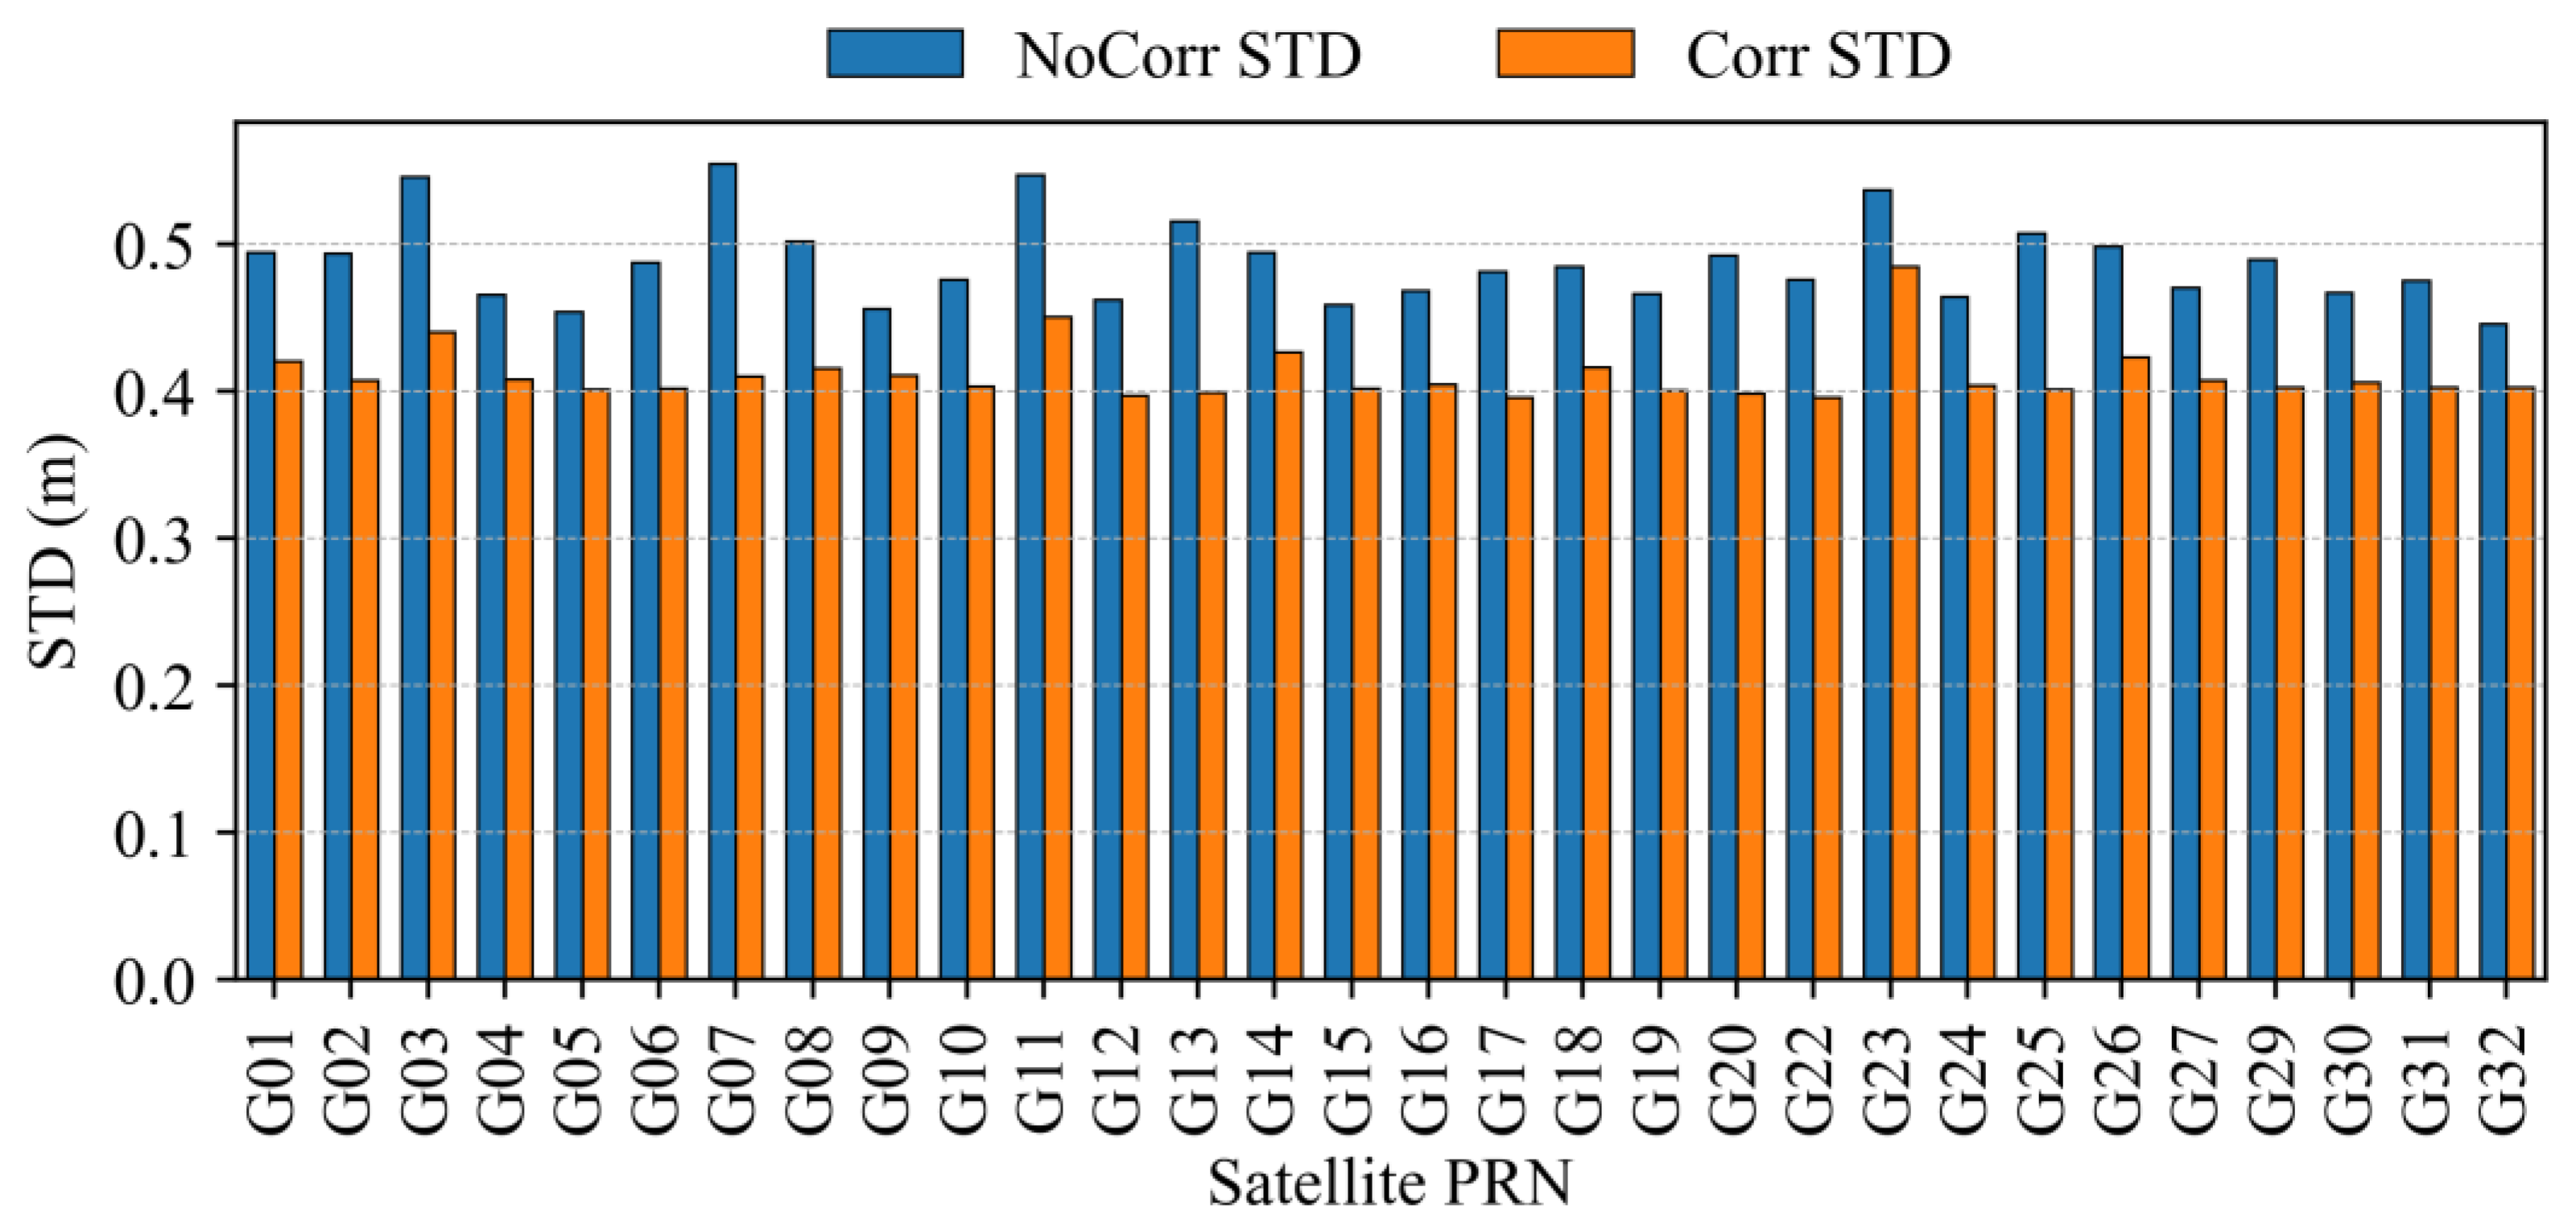
The URE values of all satellites before and after augmentation are statistically analyzed. The mean values are summarized in Table 9, while the corresponding standard deviations are illustrated in Figure 9. As shown in the figure, the URE STD of all satellites decreases after applying the corrections. Before correction, the mean URE STD across satellites is 0.488 m, whereas after correction it is reduced to approximately 0.411 m. From Table 9, it can be observed that after applying the corrections, the mean URE is close to zero, and the standard deviation is noticeably reduced, with an overall reduction of approximately 15.78%. This result indicates that the applied corrections effectively mitigate satellite orbit and clock errors, thereby improving the stability of the positioning solution.
Table 9.
Statistical Comparison of Mean URE. (108 + 60 LEO configuration).
Figure 9.
STD statistics before and after augmentation. (108 + 60 LEO configuration).
We compared the statistical characteristics of satellite URE for the measured and simulated datasets, and the results are summarized in Table 10. In all four modes, the mean satellite URE is close to zero, indicating that the URE estimates exhibit no obvious systematic bias overall. By comparing the cases before and after applying corrections, it can be seen that introducing LEO correction information significantly reduces the STD of satellite URE: in the measured scenario, it decreases from 1.112 m to 0.499 m, and in the simulated scenario, it decreases from 0.387 m to 0.265 m. Meanwhile, when the URE STD is computed for each satellite and averaged as an aggregate metric, the mean value increases slightly after adding eight LEO satellites. This behavior may be attributed to the increased number of available satellites after LEO integration and the resulting changes in data screening and the statistical sample set, which allow a small number of long-tailed residuals to be included in the statistics, thereby inflating the dispersion metric based on STD.
Table 10.
Comparison of satellite URE statistics for measured and simulated datasets.
4.3. Global Number of Available Augmented Satellites and Service Coverage
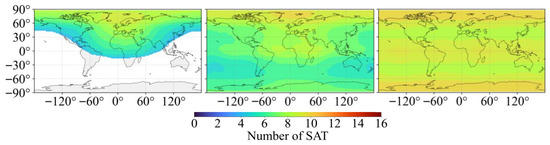
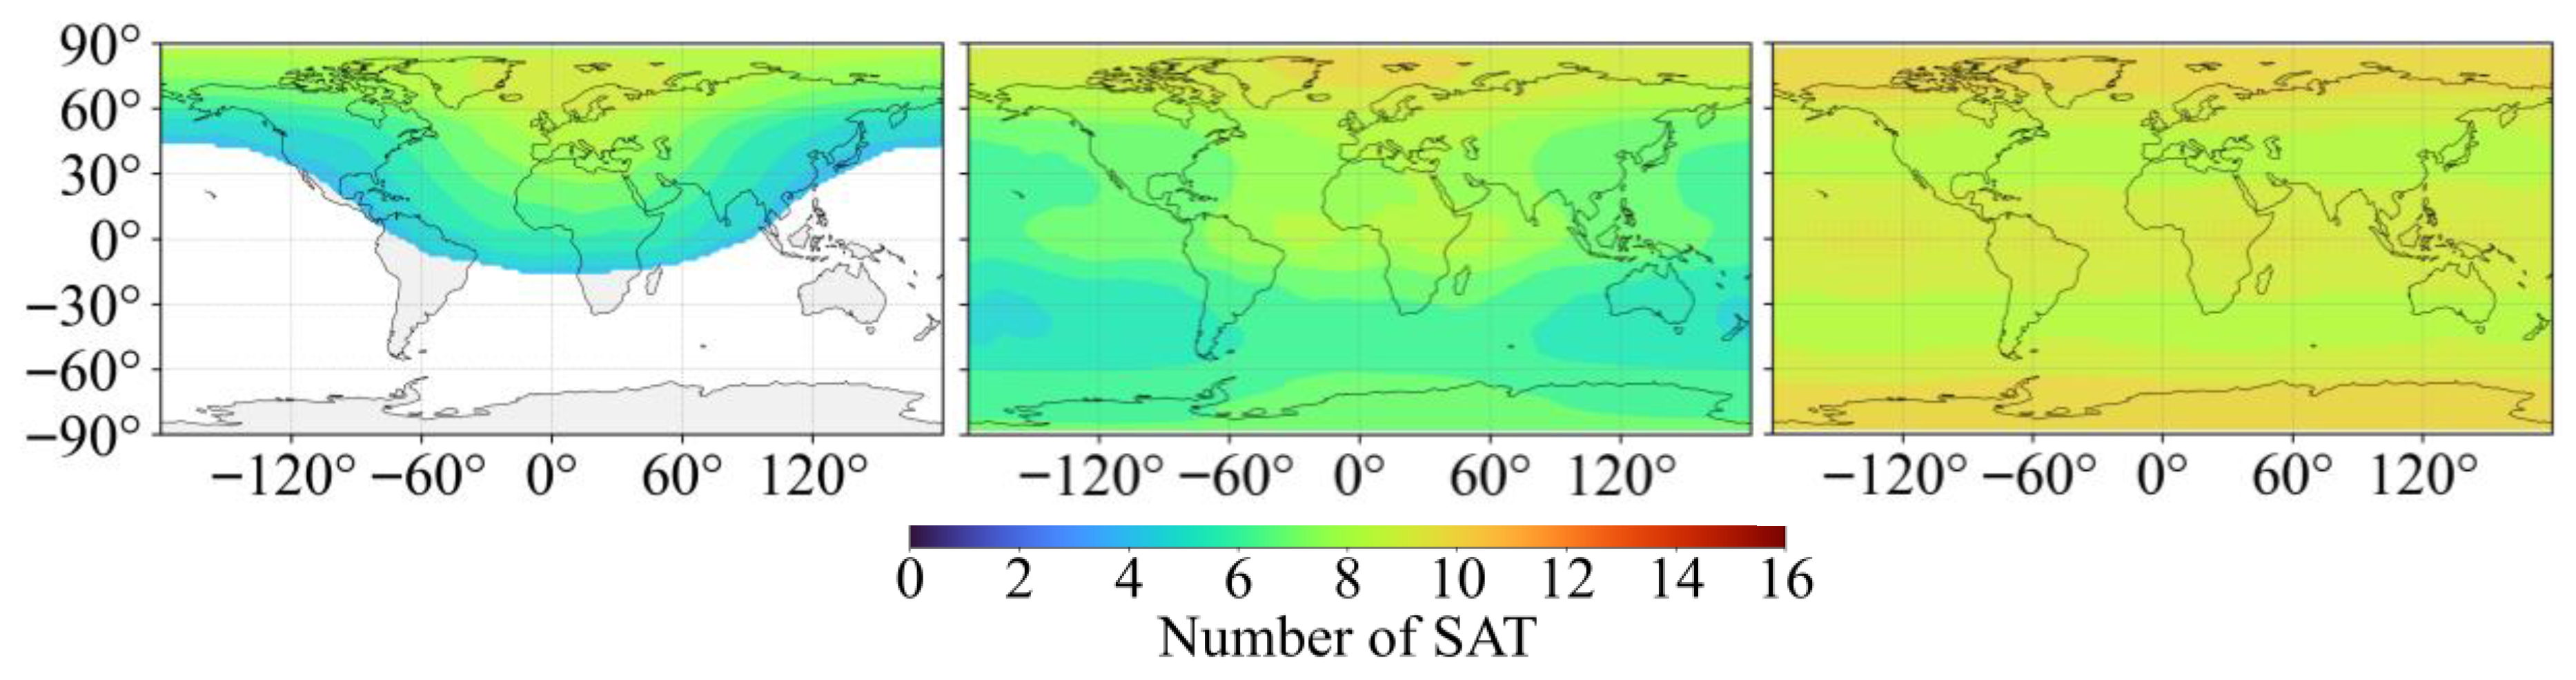
A comparison of the global average number of available augmented satellites before and after incorporating LEO satellites is presented in Figure 10. The left panel shows the number of available augmented satellites with ground stations only, the middle panel shows the results after incorporating eight LEO satellites, and the right panel shows the results obtained with a hybrid LEO constellation consisting of 108 + 60 satellites.
Figure 10.
Global number of available augmented satellites. (ground-only, 8 LEO, and 108 + 60 LEO).
The results show that when relying only on ground stations, the number of available augmented satellites across Europe and parts of the surrounding regions exceeds eight. In contrast, in areas far from the monitoring network, the number of available satellites decreases as the distance from the ground stations increases, and many regions have fewer than four satellites. After incorporating eight LEO satellites, the number of augmented satellites increases noticeably on a global scale, and the number of available satellites exceeds four worldwide. This trend is consistent with that observed in the real measurement data. However, compared with the measurement-based results, the simulated case shows a larger global area where the number of available augmented satellites exceeds four after adding the LEO satellites. This difference may arise because simulated observations are typically generated under idealized assumptions, which allow for more epochs to pass quality control and be used for correction generation and the statistics of available satellites. In contrast, real measurement data are subject to actual observational challenges, such as signal interference, satellite health status, and ground station coverage, which can reduce the effective availability of satellites. As a result, the simulated case appears to show a more widespread availability of augmented satellites compared to the real-data scenario. A detailed comparison is summarized in Table 11. For the measurement-based eight-LEO case, the coverage of regions with at least four available augmented satellites is 57.384%, whereas for the simulated eight-LEO case, the coverage reaches 100.000%. Compared with the corresponding ground-only baselines, the coverage increases by 11.923 percentage points in the measurement-based case and by 58.1 percentage points in the simulated case.
Table 11.
Coverage of regions with ≥4 available augmented satellites.
With the introduction of the 108 + 60 LEO satellites, the number of augmented satellites increases substantially on a global scale. Nearly all regions consistently maintain more than nine augmented satellites, and owing to the incorporation of the polar constellation, both of the polar areas reach up to ten satellites, meeting the requirements for SBAS augmentation and positioning. In particular, in remote areas, the introduction of LEO satellites effectively compensates for the coverage gaps inherent to traditional ground-station networks, greatly enhancing the global availability of augmented satellites.
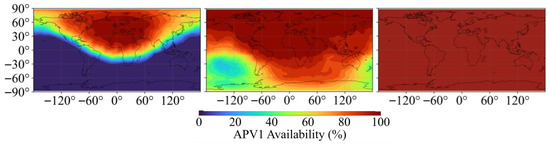
Service coverage indicates where the augmentation is effective for ground users and is a key performance metric. We discretize the globe into a latitude–longitude grid and compute, for each cell, the percentage of epochs meeting HPL ≤ HAL and VPL ≤ VAL using GNSS broadcast ephemerides and SBAS messages. The resulting availability is plotted as global contour maps and repeated for all SBAS satellites.
The global APV-I availability of SBAS before and after incorporating LEO satellites is compared in Figure 11. Specifically, the left panel shows the service coverage provided by regional ground stations only, the middle panel shows the coverage after incorporating eight LEO satellites, and the right panel shows the coverage achieved with a hybrid LEO constellation consisting of 108 + 60 satellites, all evaluated under APV-I requirements. As shown in Figure 11, when relying only on ground stations, the SBAS availability only exceeds 99% in Europe and its surrounding regions. After incorporating eight LEO satellites, the 99% availability coverage is significantly expanded. However, with the inclusion of the 108 + 60 LEO constellation, the APV-I availability meets the required standard globally, which is consistent with the distribution trend of the augmented satellites. This demonstrates that the introduction of LEO satellites greatly extends the coverage of SBAS when broadcast constraints are not considered.
Figure 11.
Global APV-I availability under three monitoring configurations. (ground-only, 8 LEO, and 108 + 60 LEO).
4.4. Evaluation of Global Positioning Performance
To evaluate the global positioning accuracy of the 108 + 60 LEO constellation, all simulated evaluation stations are used to compute and plot the distributions of horizontal and vertical positioning errors, and the corresponding improvements in positioning accuracy are analyzed. Since the eight-LEO configuration does not provide sufficient global monitoring geometry to support worldwide correction generation and availability, it is not included in the global performance comparison.
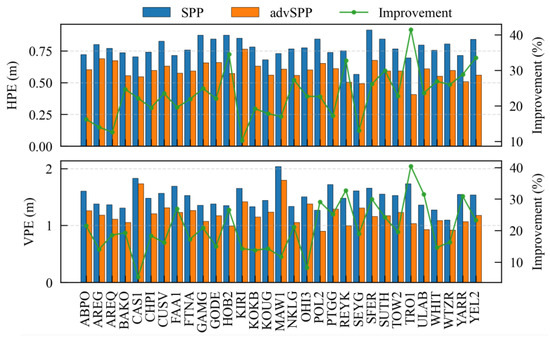
Figure 12 shows the station-wide 95th-percentile positioning errors before and after augmentation. Blue bars denote SPP results, orange bars denote augmented SPP results, and the green line indicates the improvement rate. Prior to augmentation, the station-wide mean of the 95th-percentile HPE was approximately 0.77 m, and VPE was approximately 1.5 m. After augmentation, mean HPE decreased to about 0.6 m, and VPE decreased to approximately 1.2 m. On average, HPE decreased by 23%, and VPE decreased by 20.6% across all stations.
Figure 12.
95th-percentile positioning accuracy. (Unit: m).
To evaluate the positioning enhancement performance across different parts of the world, the evaluation stations were categorized into six geographical regions: Asia, Africa, the Americas, Australia, Europe, and the polar regions. Table 12 summarizes the statistical analysis of the positioning accuracy for each region by comparing the mean and 95th-percentile errors before and after correction. Overall, significant improvements are observed in both horizontal and vertical positioning accuracy across all regions after augmentation. In Europe, benefiting from the relatively dense ground-based monitoring network, the 95th-percentile vertical positioning error decreases from 1.419 m to 1.078 m (a reduction of 24.0%), and the 95th-percentile horizontal positioning error decreases from 0.788 m to 0.584 m (a reduction of 25.9%). After augmentation, Europe exhibits one of the lowest 95th-percentile error levels among the regions considered. In the Americas, the 95th-percentile HPE and VPE decreased from 0.790 m and 1.449 m to 0.622 m and 1.156 m, corresponding to reductions of 21.2% and 17.0%, respectively. In Africa, the 95th-percentile HPE and VPE were reduced by 22.5% and 21.4%, while in Asia they are reduced by 22.8% and 23.5%, respectively. In Oceania and the polar regions, where satellite geometry is relatively weaker, the 95th-percentile errors are slightly larger in the SPP but still show a clear improvement after augmentation. In particular, in the polar regions, the 95th-percentile VPE decreases from 1.776 m to 1.486 m, and the 95th-percentile HPE decreases from 0.727 m to 0.541 m. Overall, these results demonstrate that LEO-assisted monitoring effectively enhances positioning accuracy and reduces the error tails across different geographic regions.
Table 12.
Regional statistics of positioning errors before and after correction. (unit: m).
4.5. Integrity Analysis of SBAS Services
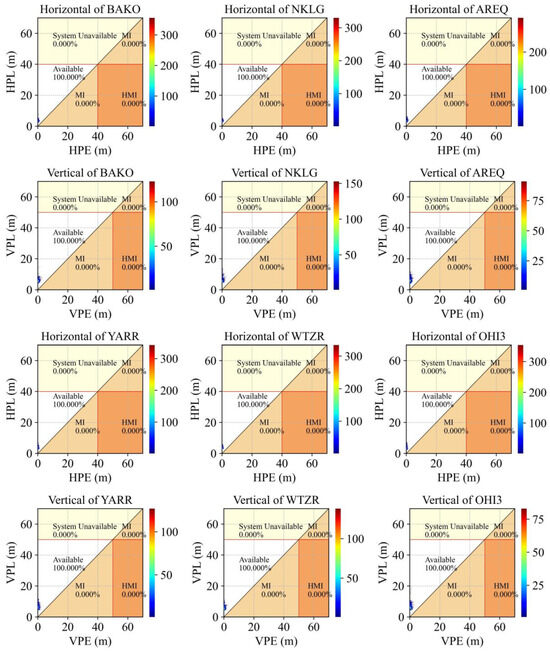
In this study, six evaluation stations with representative global geographic distribution—BAKO, NKLG, AREQ, YARR, WTZR, and OHI3, covering Asia, Africa, the Americas, Oceania, Europe, and Antarctica—were selected for integrity analysis, and the corresponding Stanford diagrams were generated. The experimental results are shown in Figure 13. The results indicate that the horizontal and vertical availability of all six selected stations is 100%. Therefore, all stations meet the APV-I precision approach requirements, with no HMI events observed throughout the entire observation period.
Figure 13.
Stanford diagram.
The availability of each station and the probability of integrity risk events are summarized in Table 13. The statistical analysis in the table shows that no integrity alert events were detected across the global monitoring network during the observation period. The APV-I precision approach availability for all six regions remains above the 99% threshold, with most stations achieving 100% availability. These results demonstrate the technical feasibility of an SBAS enhanced with LEO satellites to meet aviation integrity requirements on a global scale.
Table 13.
Regional Statistics of Integrity and Availability. (All evaluation stations).
To account for the potential impact of the dissemination delay caused by data transmission on service availability and PL, comparative experiments were conducted in this study. As shown in Table 14, the overall PL increases significantly as the transmission delay grows. After introducing a one-epoch delay, the PL values are generally more than double those obtained under the no-delay condition. The introduction of a three-epoch delay causes most PL values to approach the AL threshold. This phenomenon can be primarily attributed to the degradation of the timeliness of the augmentation corrections that are received by the user when the dissemination delay is present. As a result, the staleness of the augmentation corrections increases. When the augmentation information remains within its valid time window, the dominant impact of the dissemination delay is manifested through a staleness-dependent variance inflation mechanism. As the correction staleness increases, the associated uncertainty of the corrections is progressively increased, leading to more conservative protection level estimates and, consequently, a noticeable increase in PL.
Table 14.
95th-percentile horizontal and vertical protection levels under different dissemination delays. (aggregated over all stations and epochs).
In this simulation, one epoch corresponds to 30 s; therefore, the one-epoch and three-epoch cases represent 30 s and 90 s delays, respectively. We compare the 95th-percentile PLs in Table 14 against the Category I precision-approach (CAT-I) alert limits (HAL = 40 m, VAL = 35 m), which are more stringent than the APV-I vertical alert limit. Under the no-delay and one-epoch-delay settings, both the horizontal and vertical 95th-percentile PLs satisfy the CAT-I limits. Under the three-epoch-delay setting, the horizontal PL still satisfies the CAT-I limit, whereas the vertical PL exceeds the CAT-I limit (and also exceeds the APV-I VAL = 50 m), indicating that an excessive dissemination delay can severely degrade vertical protection levels and reduce service availability.
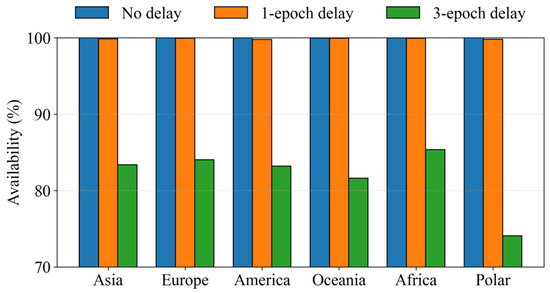
In addition, the service availability under different transmission delay scenarios was statistically evaluated, as shown in Figure 14. For each geographical region, the availability was computed by aggregating the results from all stations within the region and taking their average to represent the regional service availability.
Figure 14.
The service availability under different transmission delays.
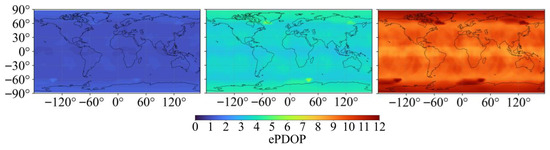
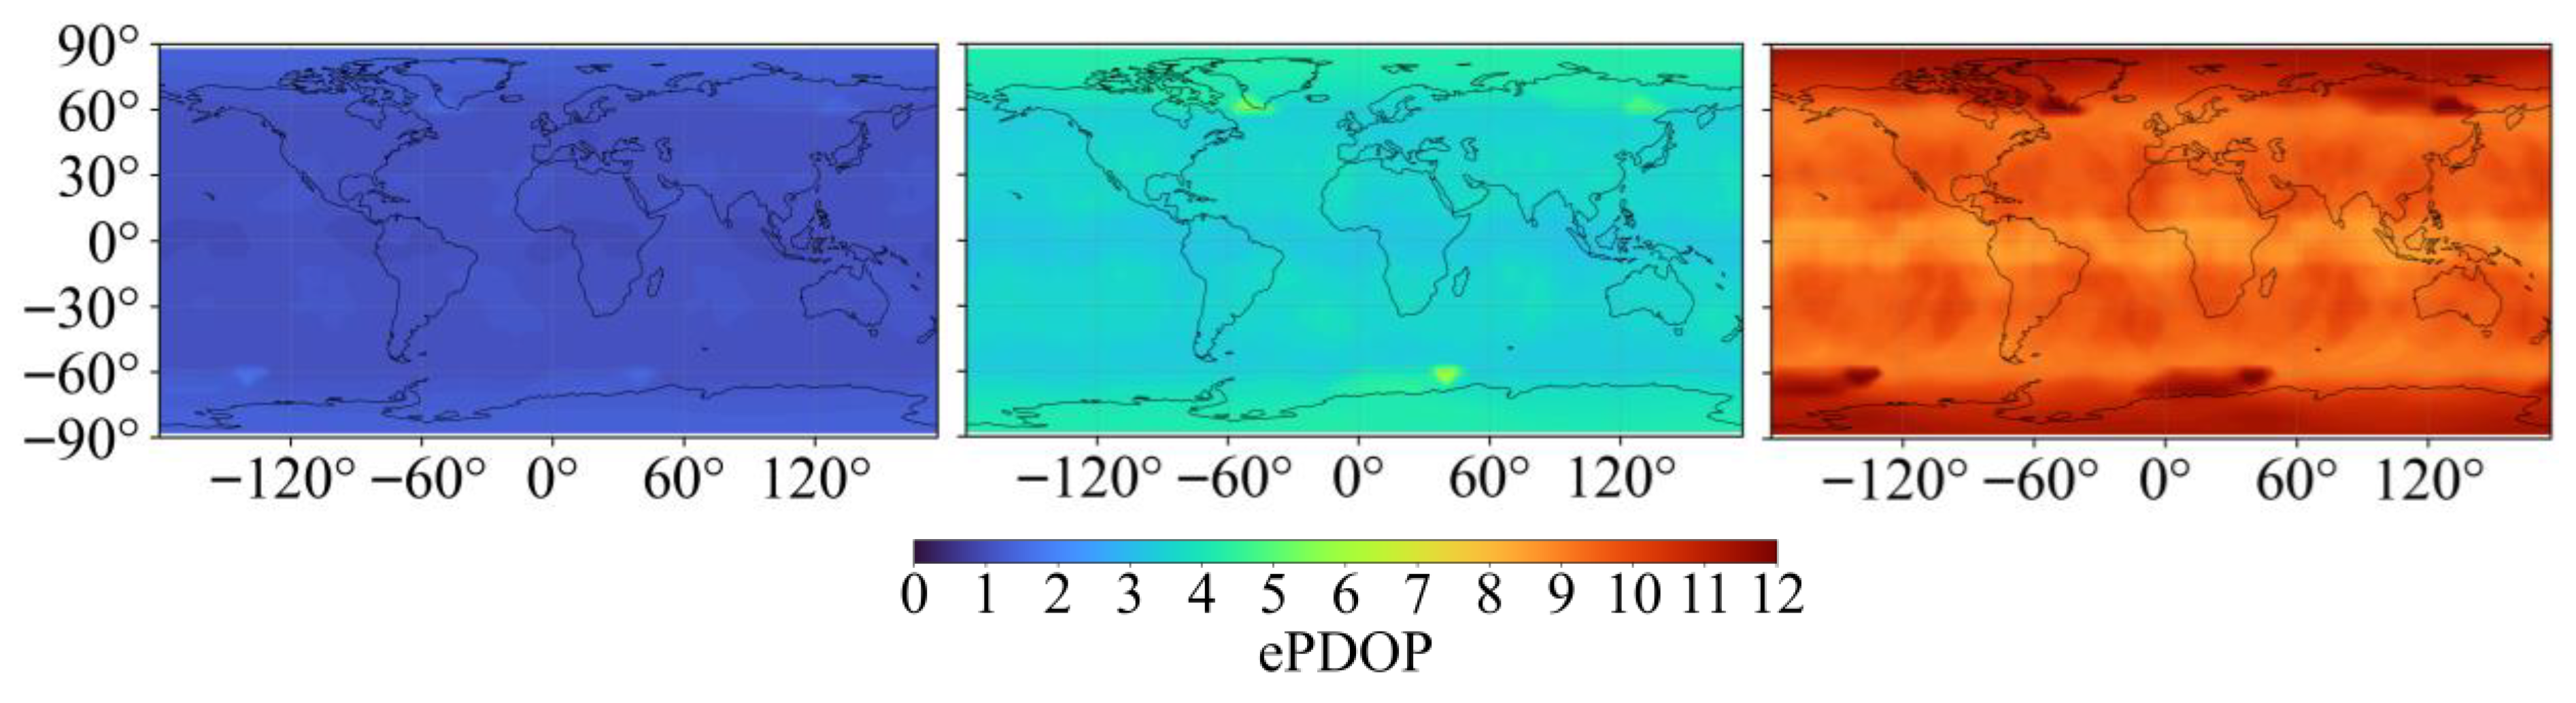
It can be observed that after introducing a one-epoch delay, service availability in all regions decreases to varying degrees. After introducing a three-epoch dissemination delay, the availability in almost all regions decreases to below 90%. Notably, the polar region exhibits the largest reduction in availability. This can be primarily attributed to the weaker and less redundant satellite geometry at high latitudes. To reflect the combined effect of geometry and staleness-inflated correction uncertainty, we define an effective PDOP (ePDOP) as , where and . The variance includes the staleness inflation term. To provide quantitative support, we computed the global maps of time-averaged ePDOP under the no-delay (left), one-epoch (mid), and three-epoch delay (right) settings using the same satellite screening rules as in the availability evaluation. As shown in Figure 15, ePDOP is systematically higher in polar areas than in mid- and low-latitude regions, indicating poorer geometry and higher sensitivity to the status of individual satellites.
Figure 15.
Global maps of time-averaged ePDOP under different transmission delays ((left): no delay; (middle): one-epoch delay; and (right): three-epoch delay).
When a dissemination delay is present, the received augmentation information becomes stale, leading to a staleness-dependent uncertainty inflation of correction errors and thus more conservative PL estimates. In addition, in some epochs the increased staleness may cause certain augmentation parameters to approach or exceed their validity limits, which can trigger correction invalidation and satellite exclusion. Under the already weak polar geometry, even limited exclusion can lead to an ePDOP increase, further amplifying the PL increase and ultimately reducing service availability. Moreover, polar regions are relatively sparse in ground monitoring coverage and therefore rely more heavily on space-based augmentation information, whose inherent uncertainty is higher; under transmission or processing delays, these unfavorable factors are more easily amplified, making the service availability in polar regions more sensitive to dissemination delay.
5. Discussion
Compared with the real-data experiments, the orbit-matched eight-LEO simulation shows more ideal overall performance. This difference mainly arises from the underlying assumptions in the simulation. For example, the simulated dataset assumes a more favorable observation environment, more idealized error modeling, and stronger data continuity. Nevertheless, the eight-LEO measurements and the orbit-matched eight-LEO simulation show consistent key trends: introducing LEO monitoring effectively suppresses DFRE fluctuations during satellite ingress and egress events and reduces the DFRE. When only a small number of LEO satellites are available, step-like variations or occasional local discontinuities may still appear in the orbit/clock correction series. This is attributed to frequent changes in the availability of links between LEO satellites and GNSS satellites, which induce rapid changes in the monitoring geometry. Relative to the real data, fewer such discontinuities are observed in the simulation, which is to be expected under more idealized simulation conditions.
Further results indicate that the primary benefit of increasing the number of LEO satellites lies in enhancing monitoring redundancy and geometric strength, rather than substantially reducing the within-network dispersion of URE. Consequently, as the number of LEO satellites increases, DFRE stability improves markedly at the edges of the ground-station network, and the correction time series becomes more consistent, thereby supporting an expansion of SBAS service coverage.
In the global simulation, the hybrid 108 Walker + 60 polar constellation increases the number of augmented satellites to more than nine worldwide and raises APV-I availability to above 99% across regions. Despite these improvements, the polar areas still show the weakest vertical improvement and the largest residual VPE. This is consistent with the inherently weaker GNSS geometry at high latitudes, where the number of medium-to-high elevation satellites is smaller and their spatial distribution is less uniform, making positioning performance more sensitive to satellite availability and correction validity.
The latency sensitivity analysis further demonstrates that correction dissemination and updating latency are key operational constraints for LEO-augmented SBAS. Even a one-epoch delay can have a noticeable impact on availability, with the strongest effects in high-latitude regions such as the polar areas. These effects can cause corrections to expire sooner and can also lead to satellite exclusion, which further weakens the already poor geometry at high latitudes.
This study still has limitations. The real-data validation is based on only eight accessible LEO satellites and relies on post-processed precise LEO/clock products rather than real-time estimations. In addition, the global assessment is conducted under idealized assumptions and covers only a limited set of fault and operational scenarios. Future work will focus on real-time LEO/clock estimation and integrity determination and will incorporate more realistic links and fault scenarios to further evaluate the performance of a deployable LEO-augmented SBAS.
6. Conclusions
This study evaluated the feasibility and global service performance of an LEO-enhanced SBAS through a two-stage workflow that integrates real-data validation with large-scale constellation simulations. The results consistently demonstrate that LEO satellites can serve as effective space-based monitoring stations and significantly extend the service coverage of SBAS.
Using real observations from eight LEO satellites, the experiments show that the inclusion of LEO satellites noticeably stabilizes orbit and clock correction series, suppresses DFRE fluctuations, and increases the number of usable augmented satellites within the regional service area. User-end positioning validation shows that, compared with SPP, the augmented positioning results achieve a reduction of 51.4% in HPE and 44.2% in VPE. All stations satisfy the APV-I availability requirements, and no HMI alert events are observed.
After verifying that the real observations from eight LEO satellites can be used for SBAS processing, an eight-satellite simulated LEO constellation with matching orbital characteristics was constructed for comparative analysis. In addition, a global simulation was carried out using a combined constellation of 108 Walker-orbit satellites and 60 polar-orbit satellites, thereby compensating for the limited satellite count and regional coverage of the real data. The results indicate that LEO-assisted monitoring raises the global number of available augmented satellites to above nine, increasing to ten in the polar regions and in certain equatorial regions through the inclusion of the polar constellation. Most simulated stations achieve 95th-percentile horizontal and vertical positioning errors of less than 0.75 m and 1.6 m, respectively, while the URE standard deviation decreases by approximately 15.8% compared with the uncorrected case. Europe shows the strongest overall enhancement in 95th-percentile errors, whereas the polar region exhibits weaker improvement in the vertical 95th percentile and still has the largest VPE after augmentation. Integrity assessments further confirm that the LEO-enhanced system meets APV-I precision-approach requirements globally, with availability above 99% and no detected HMI events. Sensitivity analysis shows that a dissemination delay is a critical factor affecting protection levels and service availability, particularly at high latitudes. This highlights the importance of timely augmentation information delivery and careful consideration of latency constraints in the design of LEO-augmented SBAS architectures.
Overall, both real-data experiments and global simulations demonstrate that LEO augmentation substantially improves SBAS service coverage. These results demonstrate the technical feasibility of developing an LEO-augmented SBAS to provide global augmentation services for worldwide users.
Author Contributions
Conceptualization, L.W. and Z.Z.; Methodology, L.W. and Z.Z.; Software, Z.Z.; Validation, L.W., Z.Z. and B.C.; Investigation, G.H. and Z.W.; Data curation, H.S.; Resources, L.W. and B.C.; Writing—original draft preparation, Z.Z.; Writing—review and editing, L.W., Z.Z. and B.C.; Funding acquisition, L.W. and B.C. All authors have read and agreed to the published version of the manuscript.
Funding
This work was supported by the Key Research and Development Program of Shaanxi Province (No. 2025CYYBXM-054) and the Shaanxi Postdoctoral Scientific Research Program (No. 2024BSHSDZZ217).
Data Availability Statement
The GNSS final products used in this study are provided by the Center for Orbit Determination in Europe (CODE) and are publicly available at http://www.aiub.unibe.ch/download/CODE (accessed on 10 January 2026). The onboard GNSS observation data for GRACE-FO and Swarm satellites are publicly available via ftp://isdcftp.gfz-potsdam.de (accessed on 1 December 2025) and ftp://swarm-diss.eo.esa.int (accessed on 1 December 2025). The SLR normal point data are available from the Crustal Dynamics Data Information System (CDDIS) archive at https://cddis.nasa.gov/archive/slr/data/npt_crd (accessed on 2 December 2025). The laser retroreflector array (LRA) offset values for LEO satellites are available from the International Laser Ranging Service (ILRS) at https://ilrs.gsfc.nasa.gov/missions/satellite_missions/current_missions (accessed on 2 December 2025). The simulation datasets generated in this study are available from the authors upon reasonable request.
Conflicts of Interest
The authors declare no conflicts of interest.
References
- Shi, C.; Guo, Q.; Li, Z. RTK from space: A novel and low-cost GNSS augmentation technique for LEO communication satellites. GPS Solut. 2025, 29, 80. [Google Scholar] [CrossRef] [Scilit]
- Heßelbarth, A.; Wanninger, L. SBAS orbit and satellite clock corrections for precise point positioning. GPS Solut. 2013, 17, 465–473. [Google Scholar] [CrossRef] [Scilit]
- Hu, Z.; Liu, X.; Wang, G. Initial performance assessment of the single-frequency (SF) service with the BeiDou satellite-based augmentation system (BDSBAS). GPS Solut. 2023, 27, 35. [Google Scholar] [CrossRef] [Scilit]
- Wang, L.; She, J.; Cui, B. Mitigating Integrity Risk in SBAS Positioning Using Enhanced IGG III Robust Estimation. Remote Sens. 2025, 17, 3067. [Google Scholar] [CrossRef] [Scilit]
- Chen, J.; Zhang, Y.; Yu, C. Models and performance of SBAS and PPP of BDS. Satell. Navig. 2022, 3, 4. [Google Scholar] [CrossRef] [Scilit]
- Yang, Y.; Yao, Z.; Mao, Y. Resilient satellite-based PNT system design and key technologies. Sci. China Earth Sci. 2025, 68, 669–682. [Google Scholar] [CrossRef] [Scilit]
- Zhang, Z.; Wang, H. Integrated BeiDou satellite-based augmentation system framework combining B2a and B1C services. GPS Solut. 2025, 29, 74. [Google Scholar] [CrossRef] [Scilit]
- Jin, B.; Chen, S.; Li, D. Performance analysis of SBAS ephemeris corrections and integrity algorithms in China region. Satell. Navig. 2021, 2, 15. [Google Scholar] [CrossRef] [Scilit]
- Zheng, S.; Gao, M.; Huang, Z. Satellite integrity monitoring for satellite-based augmentation system: An improved covariance-based method. Satell. Navig. 2022, 3, 9. [Google Scholar] [CrossRef] [Scilit]
- Yang, Y.; Ding, Q.; Gao, W. Principle and performance of BDSBAS and PPP-B2b of BDS-3. Satell. Navig. 2022, 3, 5. [Google Scholar] [CrossRef] [Scilit]
- European Union. EGNOS Open Service (OS) Service Definition Document (SDD); Issue 3.0; Publications Office of the European Union: Luxembourg, 2024. [Google Scholar] [CrossRef]
- Kim, M.; Kim, J. SBAS-Aided GPS Positioning with an Extended Ionosphere Map at the Boundaries of WAAS Service Area. Remote Sens. 2021, 13, 151. [Google Scholar] [CrossRef] [Scilit]
- Kim, M.; Kim, J. Extending the coverage area of regional ionosphere maps using a support vector machine algorithm. Ann. Geophys. 2019, 37, 77–87. [Google Scholar] [CrossRef] [Scilit]
- Tsai, Y.-F.; Low, K.-S. Performance Assessment on Expanding SBAS Service Areas of GAGAN and MSAS to Singapore Region. In Proceedings of the IEEE/ION Position, Location and Navigation Symposium (PLANS 2014), Monterey, CA, USA, 5–8 May 2014; pp. 686–691. [Google Scholar] [CrossRef] [Scilit]
- Nieto, J.; Cosmen, J.; García, I.; Ventura-Traveset, J.; Neto, I.; Hoshinoo, K. Interoperability Test Analysis between EGNOS and MSAS SBAS Systems. In Proceedings of the 12th International Technical Meeting of the Satellite Division of The Institute of Navigation (ION GPS 1999), Nashville, TN, USA, 14–17 September 1999; pp. 221–232. [Google Scholar]
- Walter, T.; Blanch, J.; Enge, P. Coverage improvement for dual frequency SBAS. In Proceedings of the 2010 International Technical Meeting of the Institute of Navigation, San Diego, CA, USA, 25–27 January 2010. [Google Scholar]
- Jia, Y.; Bian, L.; Cao, Y. Design and Analysis of Beidou Global Integrity System Based on LEO Augmentation. In China Satellite Navigation Conference (CSNC) 2020 Proceedings: Volume II; Lecture Notes in Electrical Engineering; Sun, J., Yang, C., Xie, J., Eds.; Springer: Singapore, 2020; Volume 651. [Google Scholar] [CrossRef] [Scilit]
- Yang, Y.; Mao, Y.; Ren, X. Demand and key technology for a LEO constellation as augmentation of satellite navigation systems. Satell. Navig. 2024, 5, 11. [Google Scholar] [CrossRef] [Scilit]
- Enge, P.K.; Talbot, N.C.; San, J. Method and Receiver Using a Low Earth Orbiting Satellite Signal to Augment the Global Positioning System. U.S. Patent No. 5,812,961, 22 September 1998. [Google Scholar]
- Gao, W.; Chen, L.; Lv, F. Initial Design for Next-Generation BeiDou Integrity Subsystem: Space–Ground Integrated Integrity Monitoring. Remote Sens. 2024, 16, 4333. [Google Scholar] [CrossRef] [Scilit]
- Yang, W. Key Techniques and Performance Analysis of Satellite-Based Augmentation with Integrated LEO Constellations. Master’s Thesis, Chang’an University, Xi’an, China, 2024. [Google Scholar] [CrossRef]
- Zhang, Z. Research on Satellite-Based Augmentation Technology Integrating LEO Constellations and Ground Monitoring Stations. Master’s Thesis, Chang’an University, Xi’an, China, 2025. [Google Scholar]
- Wang, L.; Yang, W.; Huang, G.; Wang, Z. LEO constellation-augmented SBAS and performance simulation analysis. In Proceedings of the EGU General Assembly 2024, Vienna, Austria, 14–19 April 2024. [Google Scholar] [CrossRef] [Scilit]
- She, H.; Huang, G.; Wang, L. Enhancing LEO orbit determination and prediction through constraints on atmospheric drag scale factor. GPS Solut. 2025, 29, 94. [Google Scholar] [CrossRef] [Scilit]
- Sanz Subirana, J.; Juan Zornoza, J.M.; Hernández-Pajares, M. GNSS Data Processing, Volume I: Fundamentals and Algorithms; ESA TM-23/1; ESA Communications: Noordwijk, The Netherlands, 2013. [Google Scholar]
- ICAO. Annex 10: Aeronautical Telecommunications, Volume I—Radio Navigation Aids, 8th ed.; ICAO: Montréal, QC, Canada, 2023. [Google Scholar]
- Federal Aviation Administration. Global Positioning System Wide Area Augmentation System (WAAS) Performance Standard, 1st ed.; Federal Aviation Administration: Washington, DC, USA, 2008.
- Porras Sánchez, D.; Pisonero Berges, C. The EGNOS SBAS Message Format Explained; Navipedia (ESA): Paris, France, 2006. [Google Scholar]
- Sierra Leone Civil Aviation Authority (SLCAA). Sierra Leone Civil Aviation Regulations: Part 10A—Aeronautical Telecommunications—Radio Navigational Aids; SLCAA: Freetown, Sierra Leone, 2024. Available online: https://slcaa.gov.sl/wp-content/uploads/2024/05/PART-10A-AERONAUTICAL-TELECOMMUNICATIONS-RADIO-NAVIGATIONAL-AIDS-5-FEB-24.pdf (accessed on 2 January 2026).
- RTCA. Minimum Operational Performance Standards for Global Positioning System/Wide Area Augmentation System (GPS/WAAS) Airborne Equipment; RTCA/DO-229D; RTCA: Washington, DC, USA, 2006. [Google Scholar]
- Wang, Z.; Wang, L.; Xie, W.; Huang, G.; Yang, W.; Tian, Y. DFMC SBAS service performance analysis of multi-GNSS based on BDS-3 in different regions. Meas. Sci. Technol. 2024, 35, 116310. [Google Scholar] [CrossRef] [Scilit]
- Ma, F.; Zhang, X.; Li, X. Hybrid constellation design using a genetic algorithm for a LEO-based navigation augmentation system. GPS Solut. 2020, 24, 62. [Google Scholar] [CrossRef] [Scilit]
- Zhang, T.-J.; Shen, H.-X.; Li, Z. Restricted constellation design for regional navigation augmentation. Acta Astronaut. 2018, 150, 231–239. [Google Scholar] [CrossRef] [Scilit]

Disclaimer/Publisher’s Note: The statements, opinions and data contained in all publications are solely those of the individual author(s) and contributor(s) and not of MDPI and/or the editor(s). MDPI and/or the editor(s) disclaim responsibility for any injury to people or property resulting from any ideas, methods, instructions or products referred to in the content. |
© 2026 by the authors. Licensee MDPI, Basel, Switzerland. This article is an open access article distributed under the terms and conditions of the Creative Commons Attribution (CC BY) license.