


Abstract
Three-dimensional numerical simulations are used to investigate the mixing performance of pulse injection in a supersonic combustion chamber. The influence of complex nozzle configurations is excluded, and the effects of pulse dynamics on mixing performance are examined. The results show that the mixing performance of the pulse injection has a periodic variation. Based on the coupling analysis of the numerical flow field structure and the penetration depth, it is found that the main factor governing changes in pulse penetration depth is the development of the near-nozzle flow field. By comparing the mixing performance trends and flow field coupling characteristics of sinusoidal and square-wave pulse injection, the proposed mechanism governing penetration depth is further verified, and the square-wave pulse injection shows an obvious mixing advantage. Therefore, this article further explores the mixing law of square-wave pulses under different duty cycles, identifies distinct mixing regions in the duty cycle–frequency parameter space, and obtains the optimal performance curve for the pulse parameters. This paper goes beyond comparisons of a few discrete frequencies reported in previous studies. By studying those factors, the frequency-dependent behavior of pulse injection is explained in terms of its underlying mechanism. By comparing different waveforms, the mechanism is further verified, and its applicability is further examined. These results provide a physical explanation for the observed mixing trends.
1. Introduction
Hypersonic vehicles are a strategic development direction for future military and civilian aircraft. The supersonic combustion ramjet engine applied to hypersonic vehicles is a technological innovation in the development of the aerospace industry, which overcomes the limitations of traditional aircraft such as low speed and complex structure [1,2]. In a supersonic combustor, the residence time of the fuel is milliseconds, and it is difficult for the fuel to mix completely in such a short time [3]. Therefore, the mixing performance of fuel will have a decisive impact on the combustion performance of the engine [4,5].
In the existing research, fuel mixing enhancement methods can be divided into active enhancement and passive enhancement. Active enhancement methods include plasma excitation, pulse injection, etc., while passive enhancement mainly changes the interaction between the jet and the mainstream through struts, slopes, cavities and other geometric structures [6,7,8]. In recent years, different flow control and injection configurations have been further studied for the supersonic fuel mixing process. Many studies [9,10,11,12] have shown that supersonic mixing enhancement is usually closely related to flow processes such as shock wave structure, vorticity transport, recirculation zones and jet momentum redistribution. Previous studies [13,14] compared the three mixing enhancement methods of pulse injection, air injection and the use of a physical ramp, and found that pulse injection has unique advantages in enhancing the structure of streamwise vortices.
A lot of work has been done on the mixing performance and unsteady flow field structure of supersonic transverse pulse injection. Previous studies [15,16] found that periodic excitation can change the large-scale unsteady structure of the jet and enhance its penetration and mixing; Cutler et al. [17] further studied the high-frequency pulse injection of about 13 kHz. Shi et al. [18] analyzed the unsteady evolution of shear layer vortices and shock wave structures during pulsed injection using large-eddy simulation (LES). Chen and Zhao [19] found that pulse injection can improve mixing performance without a significant increase in penetration depth. After the basic characteristics of pulse injection were understood, research increasingly focused on the characteristics of different pulse parameters. Du et al. [20] compared sine-wave, square-wave and triangular-wave injection, indicating that different waveforms will produce different vortex structures and mixing responses. Zhou et al. [21] also showed that the change of injection position can significantly affect the supersonic combustion instability, further indicating that the injection conditions and combustion response have obvious configuration dependence. Zhao and Ye [22] studied the influence of frequency and amplitude, and obtained a preferred frequency of 50 kHz under their calculation conditions. Zhou et al. [23] compared 12.5, 20 and 50 kHz sinusoidal pulse hydrogen injection, and the 20 kHz condition showed better comprehensive combustion performance. Williams et al. [24] found that a 16 kHz sinusoidal pulse can improve penetration and mixing to the greatest extent under their research conditions. It is not enough to explain the physical reasons for the change in pulse performance only by determining the preferred frequency under specific working conditions. Therefore, it is of great significance to further establish the relationship between pulse parameters and the dynamic response of the flow field.
It has been recognized that there is a close relationship between the pulse parameters and the unsteady structure of the jet. Sau and Mahesh [25] analyzed the jet response under different pulse conditions from the perspective of vortex ring evolution and the characteristic time scale, and discussed the combined effects of frequency, duty cycle and pulse intensity. Kouchi et al. [26] showed that the pulse period and duty cycle will affect the penetration; other studies have also explained the performance changes of pulse injection from the perspective of the dynamic response of the shear layer, shock wave and vortex structure [27,28,29,30]. However, existing research still has the following shortcomings: On the one hand, the development of the near-nozzle flow field and its relationship to mixing performance are not yet fully understood, and further characterization of flow field development is needed. On the other hand, although the performance differences of different waveforms have been reported [20], the differences in flow field development and performance coupling caused by them are still worthy of further study.
Based on the above contents, this paper studies the influence of pulse parameters on the mixing performance of a gaseous kerosene jet under the same average kerosene mass flow rate, and analyzes the internal relationship between the flow field near the nozzle and changes in mixing performance through the development state of the flow field near the nozzle. At the same time, the flow and performance differences of different waveforms are further explored by combining the waveform and duty cycle conditions, and the performance change law in the frequency–duty cycle parameter space is established to explain the performance change caused by the change in pulse parameters and provide the basis for parameter selection.
2. Methodology
2.1. Numerical Simulation Method
In this paper, commercial computational fluid dynamics software is used for numerical simulation to solve the Reynolds-averaged Navier–Stokes equations. The implicit density-based solver is used in the calculation; the turbulence model is the SST k − ω model, and the second-order upwind scheme is used in the discrete scheme. The flow process is simulated by the species transport equation, and the working fluid is a mixture of gaseous kerosene and air. The density of the mixture is calculated according to the ideal gas state equation, and the specific heat ratio is determined by the mass mixing law. Viscosity and thermal conductivity are obtained by mass-weighted averaging, and the mass diffusion coefficient and thermal diffusion coefficient are based on the theory of molecular motion. In the model boundary conditions, the combustion chamber wall is set as an adiabatic, no-slip wall. The pressure inlet conditions are used for the kerosene inlet and free-stream inlet. The outlet boundary adopts the pressure outlet condition.
2.2. Physical Model and Data Verification
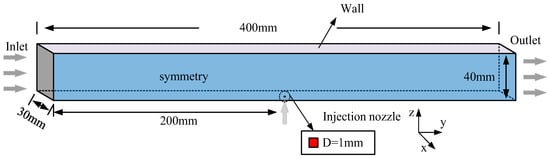
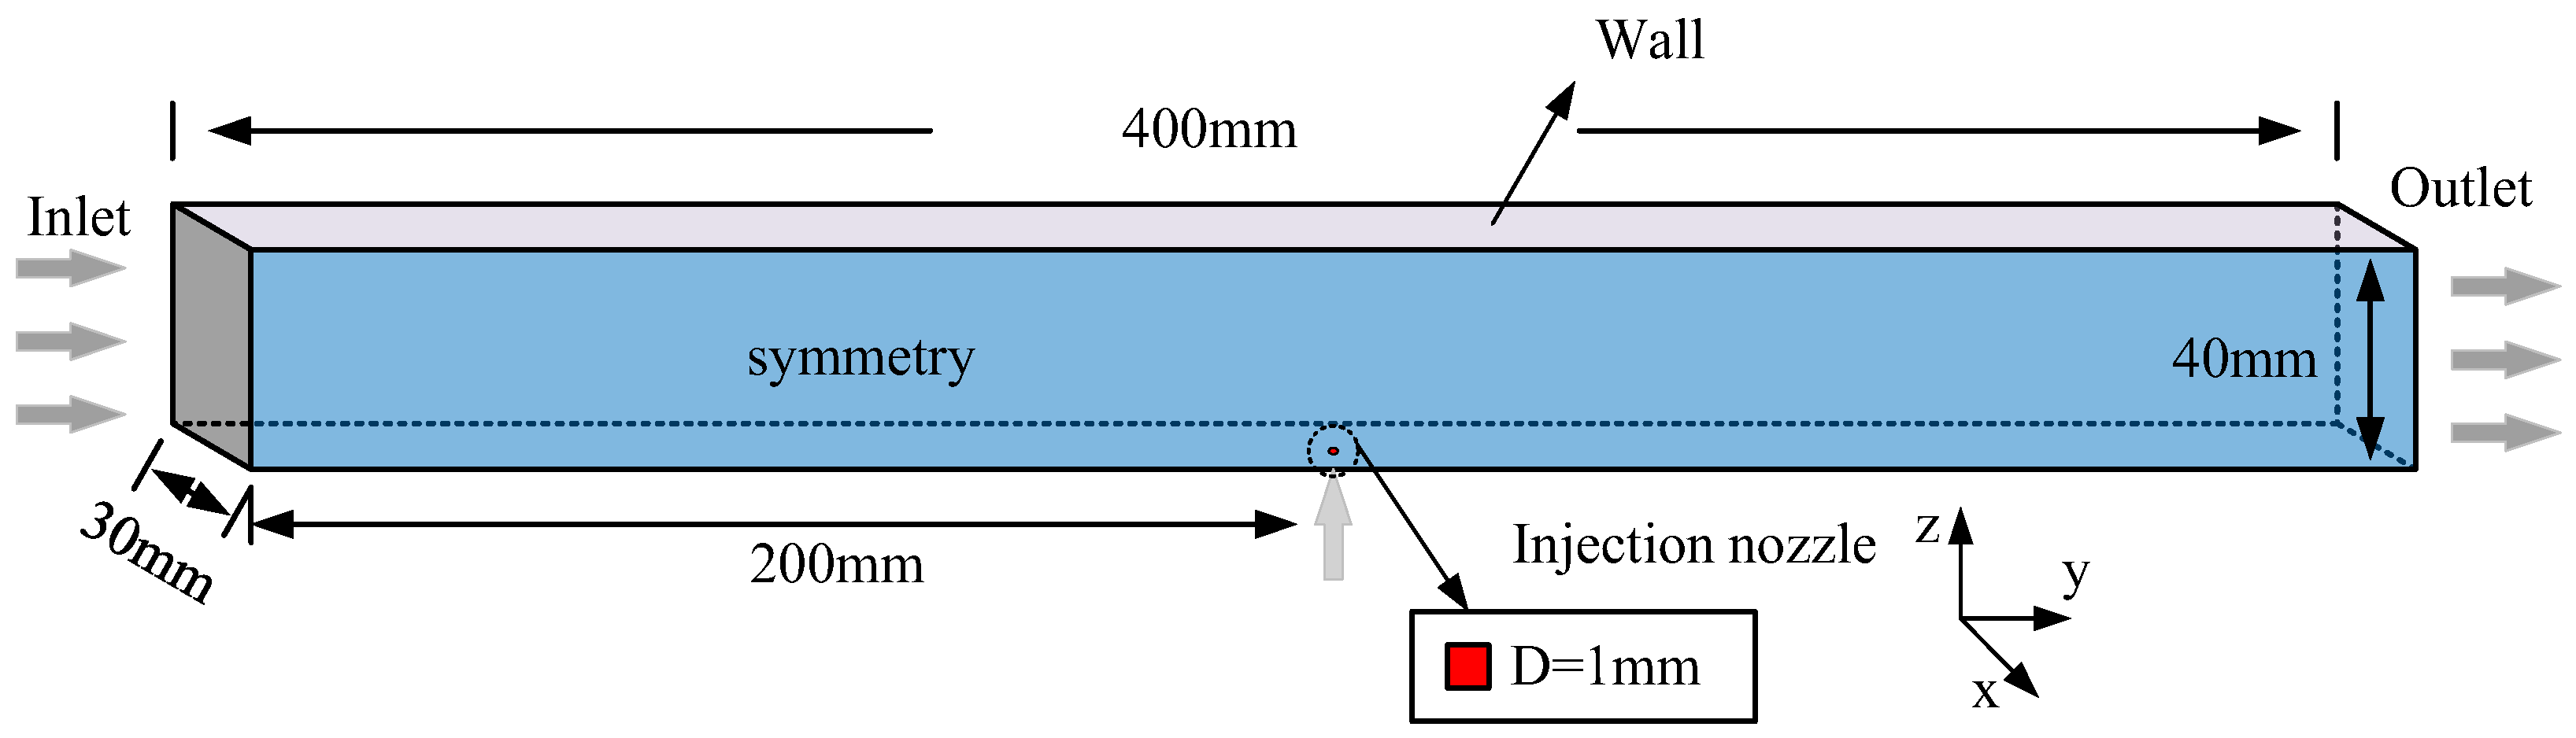
The gaseous kerosene pulse injection studied in this paper is carried out in a rectangular combustion chamber shown in Figure 1. The length of the model is 400 mm, and the height is 40 mm. In order to reduce the computational complexity, a 30 mm slice is selected in the width direction. The upper and lower boundaries of the model are the wall surfaces, the front and rear boundaries are the inlet and outlet, and the left and right boundaries are set as symmetrical surfaces. A square jet hole with a side length of 1 mm is located at the center of the lower wall of the combustion chamber. The flow distances of 200 mm upstream and 200 mm downstream not only ensure the formation of the shock wave but also show the effective mixing area.
Figure 1.
Physical model of supersonic combustor.
Commercial software is used to mesh the simulation model. Because a kerosene injection hole is located on the wall, the mesh is refined in the region surrounding the hole. In addition, in order to meet the y+ requirement, this paper also uses a gradual mesh transition within the wall boundary layer. The height of the first-layer grid at the wall of the combustion chamber is 0.01 mm, the thickness of the first-layer grid at the nozzle is 0.015 mm, and the final mesh contains 2.1 million cells.
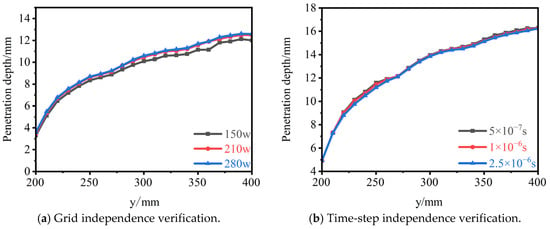
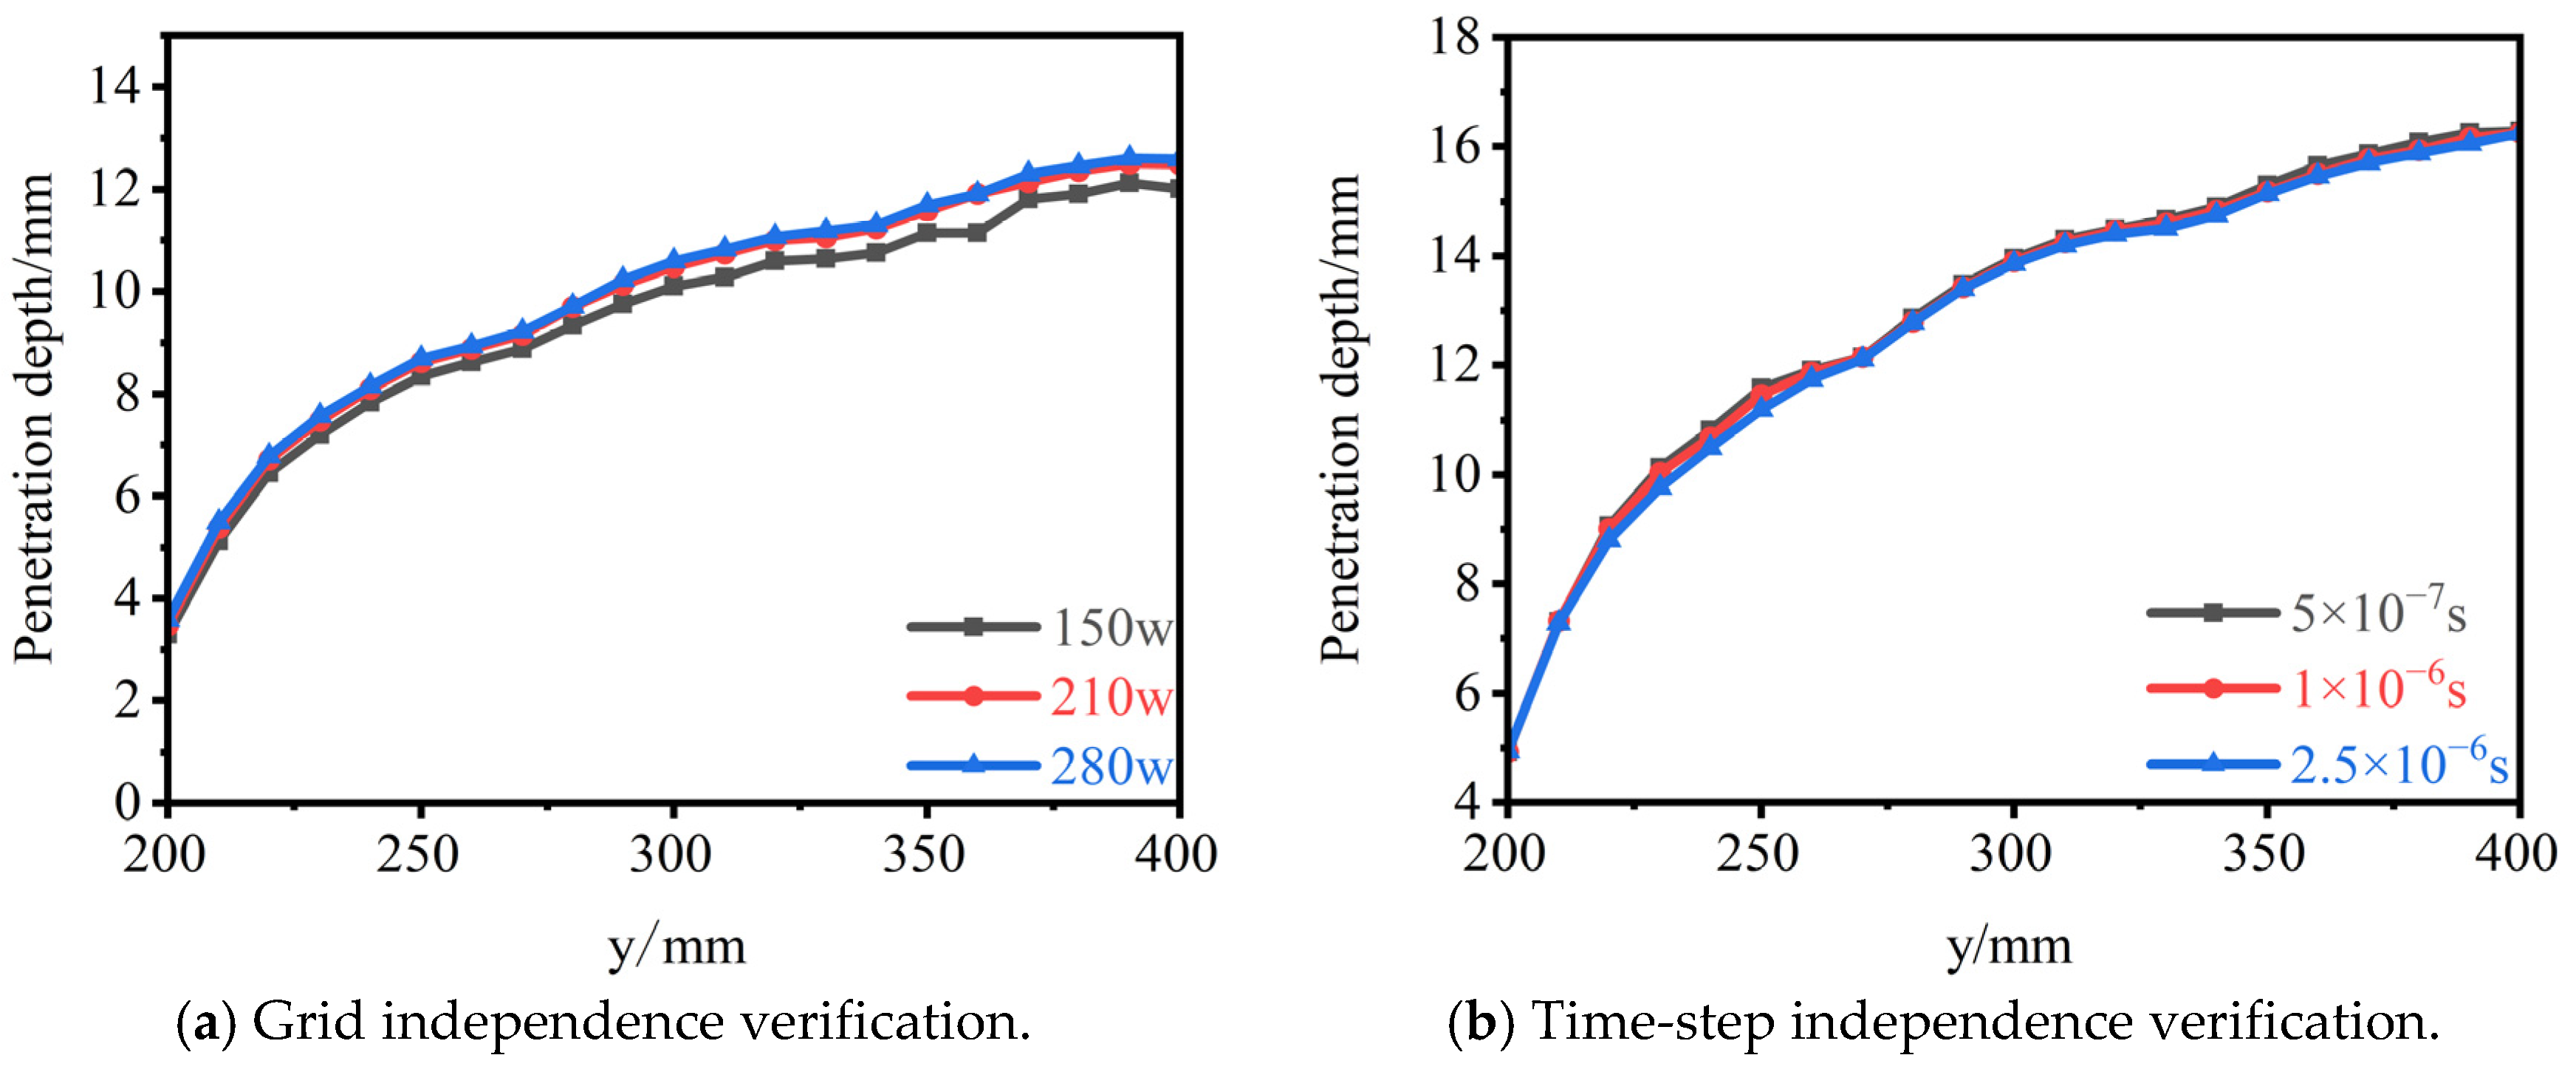
In order to ensure that the calculation results are independent of the number of grids and the time step, Figure 2 shows the verification results of the two. Figure 2a compares the penetration depth of a steady jet at an injection pressure of 0.5 MPa at mesh resolutions of 1.5 million, 2.1 million and 2.8 million cells. The results show that there is no significant difference between the results of 2.1 million and 2.8 million grids, whereas the results obtained with 1.5 million cells are lower. Therefore, in order to reduce the amount of grid calculation, the 2.1-million-cell mesh is used in the subsequent calculation. For the 2.1-million-cell mesh, Figure 2b compares the penetration depth using three time steps of 2.5 × 10⁻⁶, 1 × 10⁻⁶ and 5 × 10⁻⁷ s. The results show that the three time steps have little effect on the penetration depth, especially for 1 × 10⁻⁶ and 5 × 10⁻⁷ s. Considering the amount of calculation and the average value of each time step automatically collected, a calculation time step of 1 × 10⁻⁶ s is selected.
Figure 2.
Independence verification.
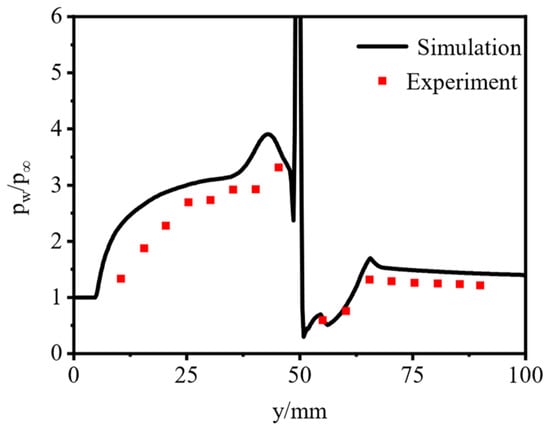
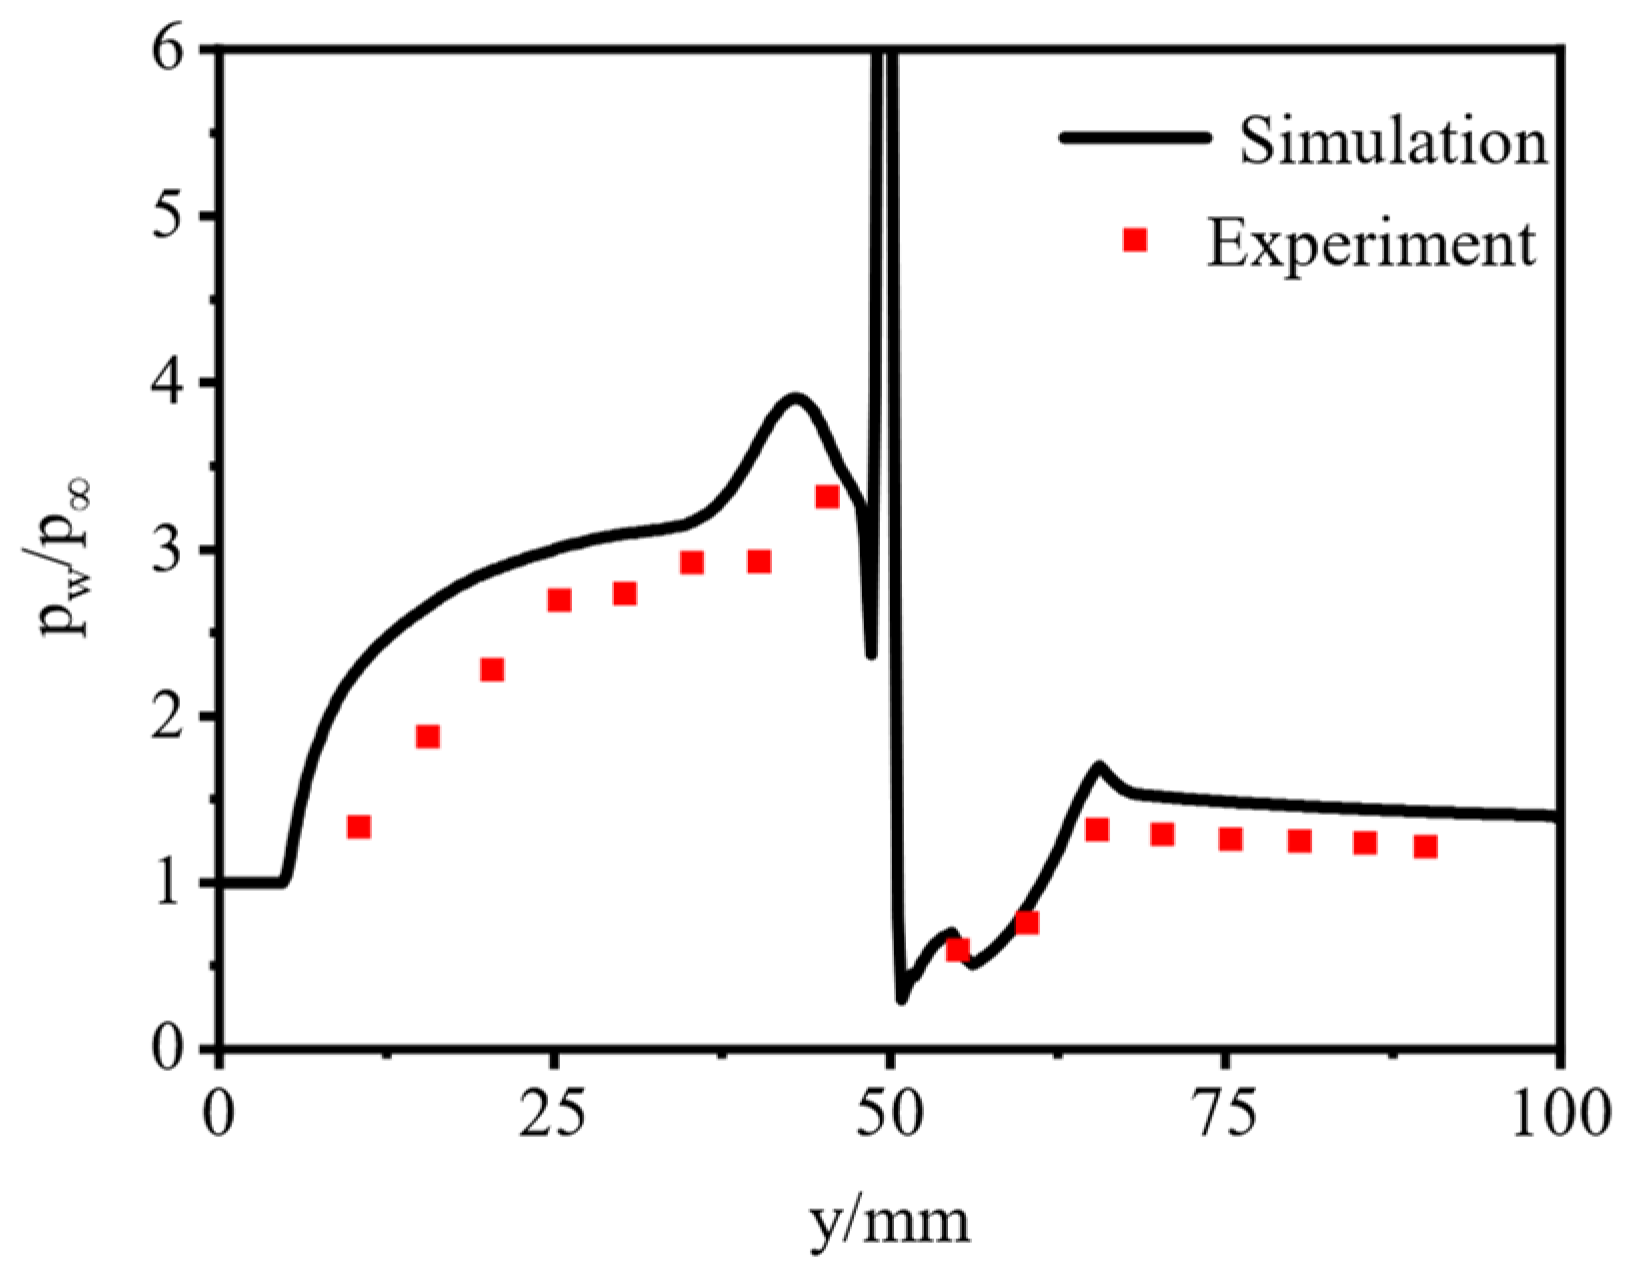
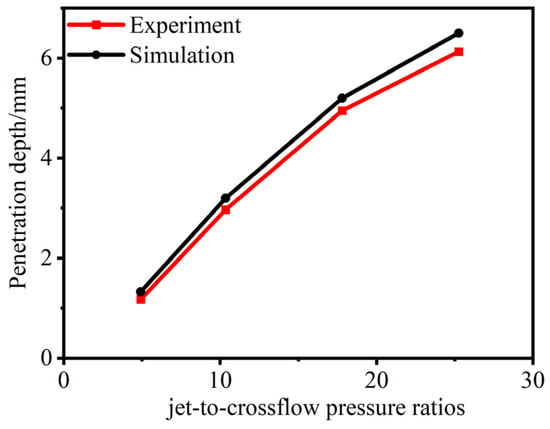
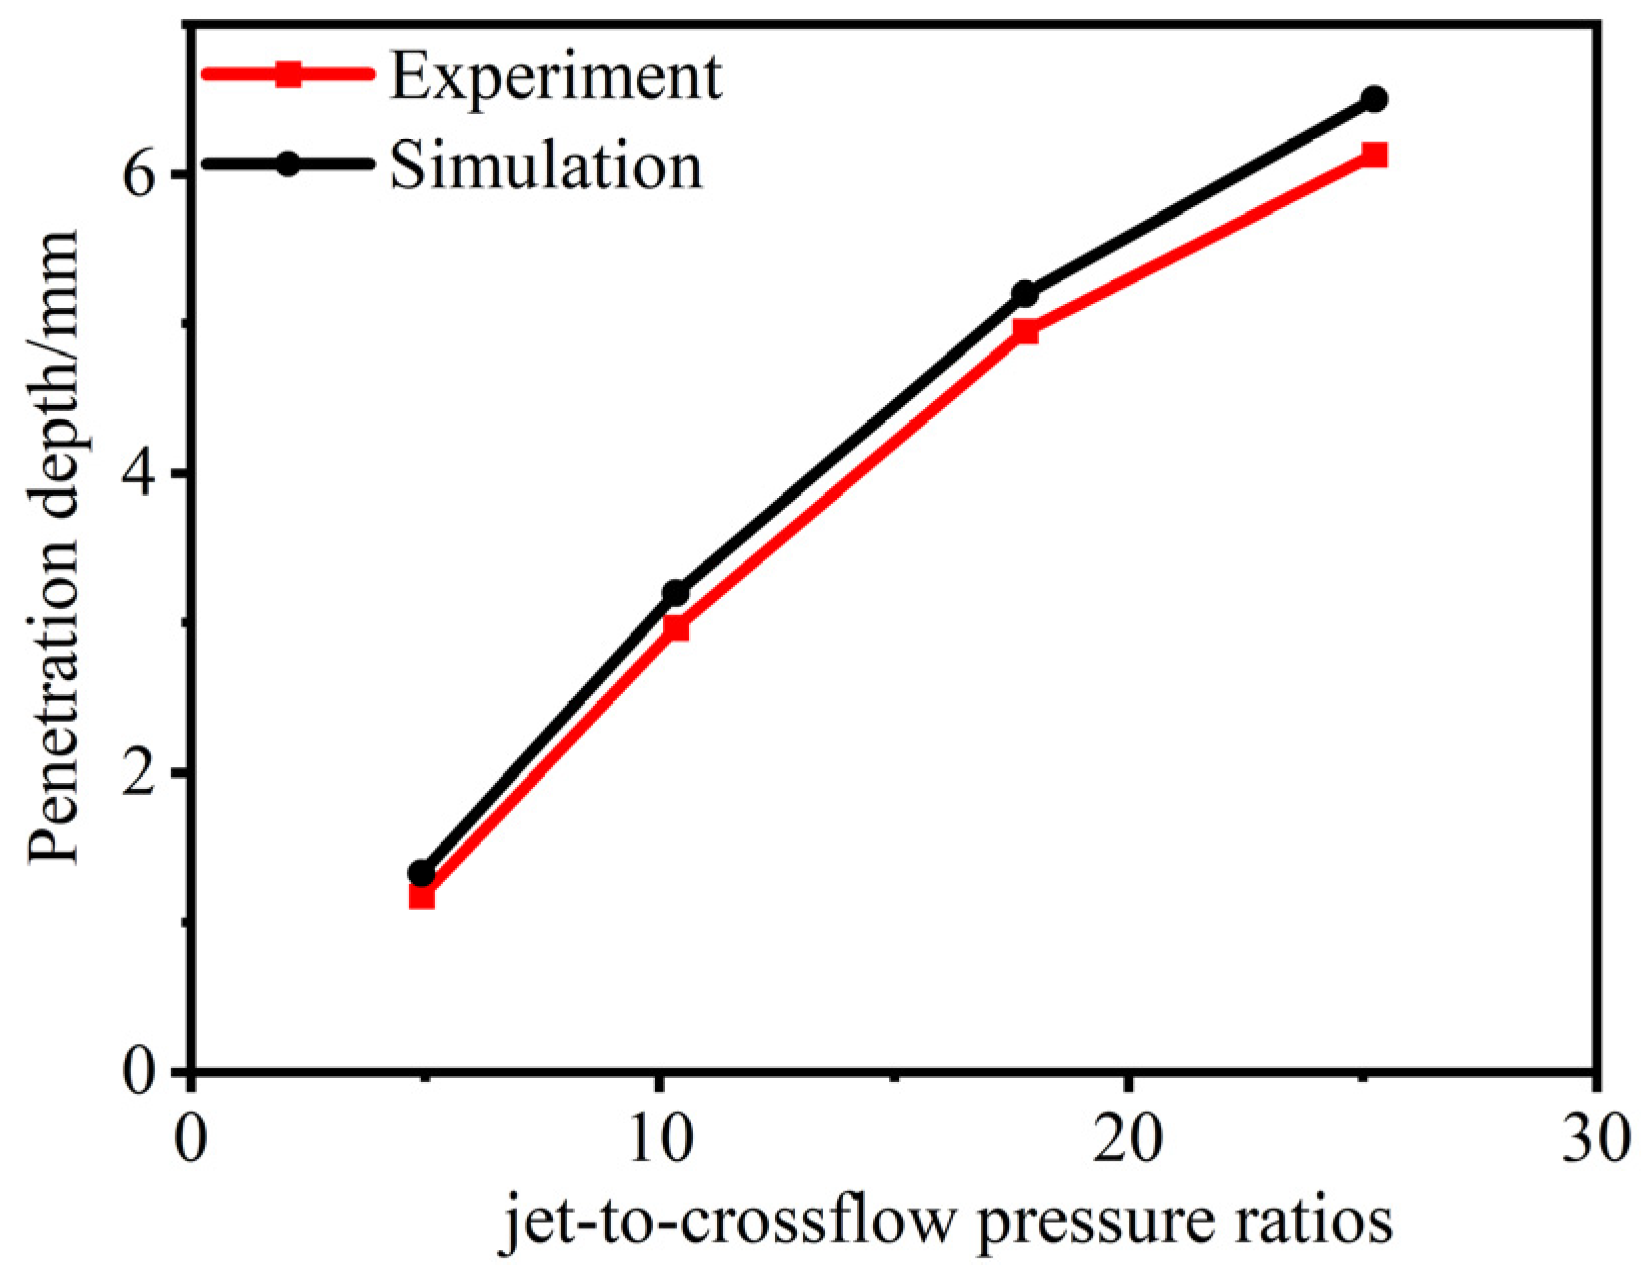
Before the simulation of specific problems, it is very important to verify the accuracy of the numerical method by comparing the experimental cases with the simulation results. In this paper, the experimental data of Aso [31] are used as a reference for simulation verification. These experimental data have been widely used for numerical validation in previous studies [3,9,20] on pulse injection. Under this experimental condition, nitrogen with a total pressure of 588 kPa and a total temperature of 300 K was injected at a Mach number of 1 into the supersonic incoming flow with a Mach number of 3.75, a total pressure of 1.2 MPa and a total temperature of 300 K. The simulation and experimental results are shown in Figure 3. It can be seen that the simulation predicts the measured wall-pressure distribution well. In addition, Figure 4 further evaluates the accuracy of the predicted penetration depth by comparing the numerical results with the experimental data [32]. Therefore, it can be considered that the numerical method is reliable.
Figure 3.
The validation of numerical data.
Figure 4.
Penetration height comparison for different jet-to-crossflow pressure ratios.
2.3. Selection of Injection Parameters and Evaluation Indexes
For comparison with the steady injection at 0.5 MPa, the pulse parameters are selected based on the same kerosene mass flow rate. Pulse frequency has little effect on the mass flow rate, whereas the duty cycle and injection total pressure determine its magnitude. Therefore, the total pressure of the injection under different duty cycles is discussed. There is a relationship between the total pressure and the mass flow rate:
where K—adiabatic index of the gas; —total pressure at the exit section; —total temperature at the exit section; Ae—cross-sectional area at the exit; q(λ)—discharge coefficient.
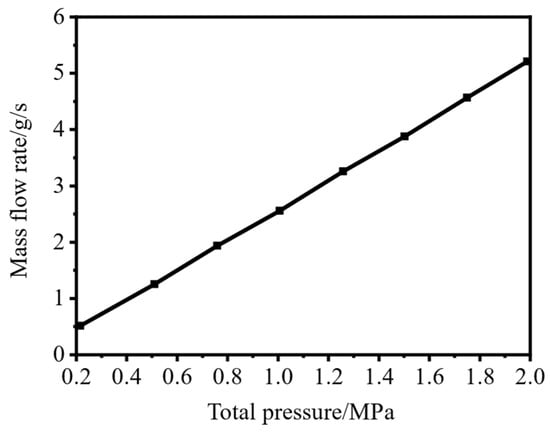
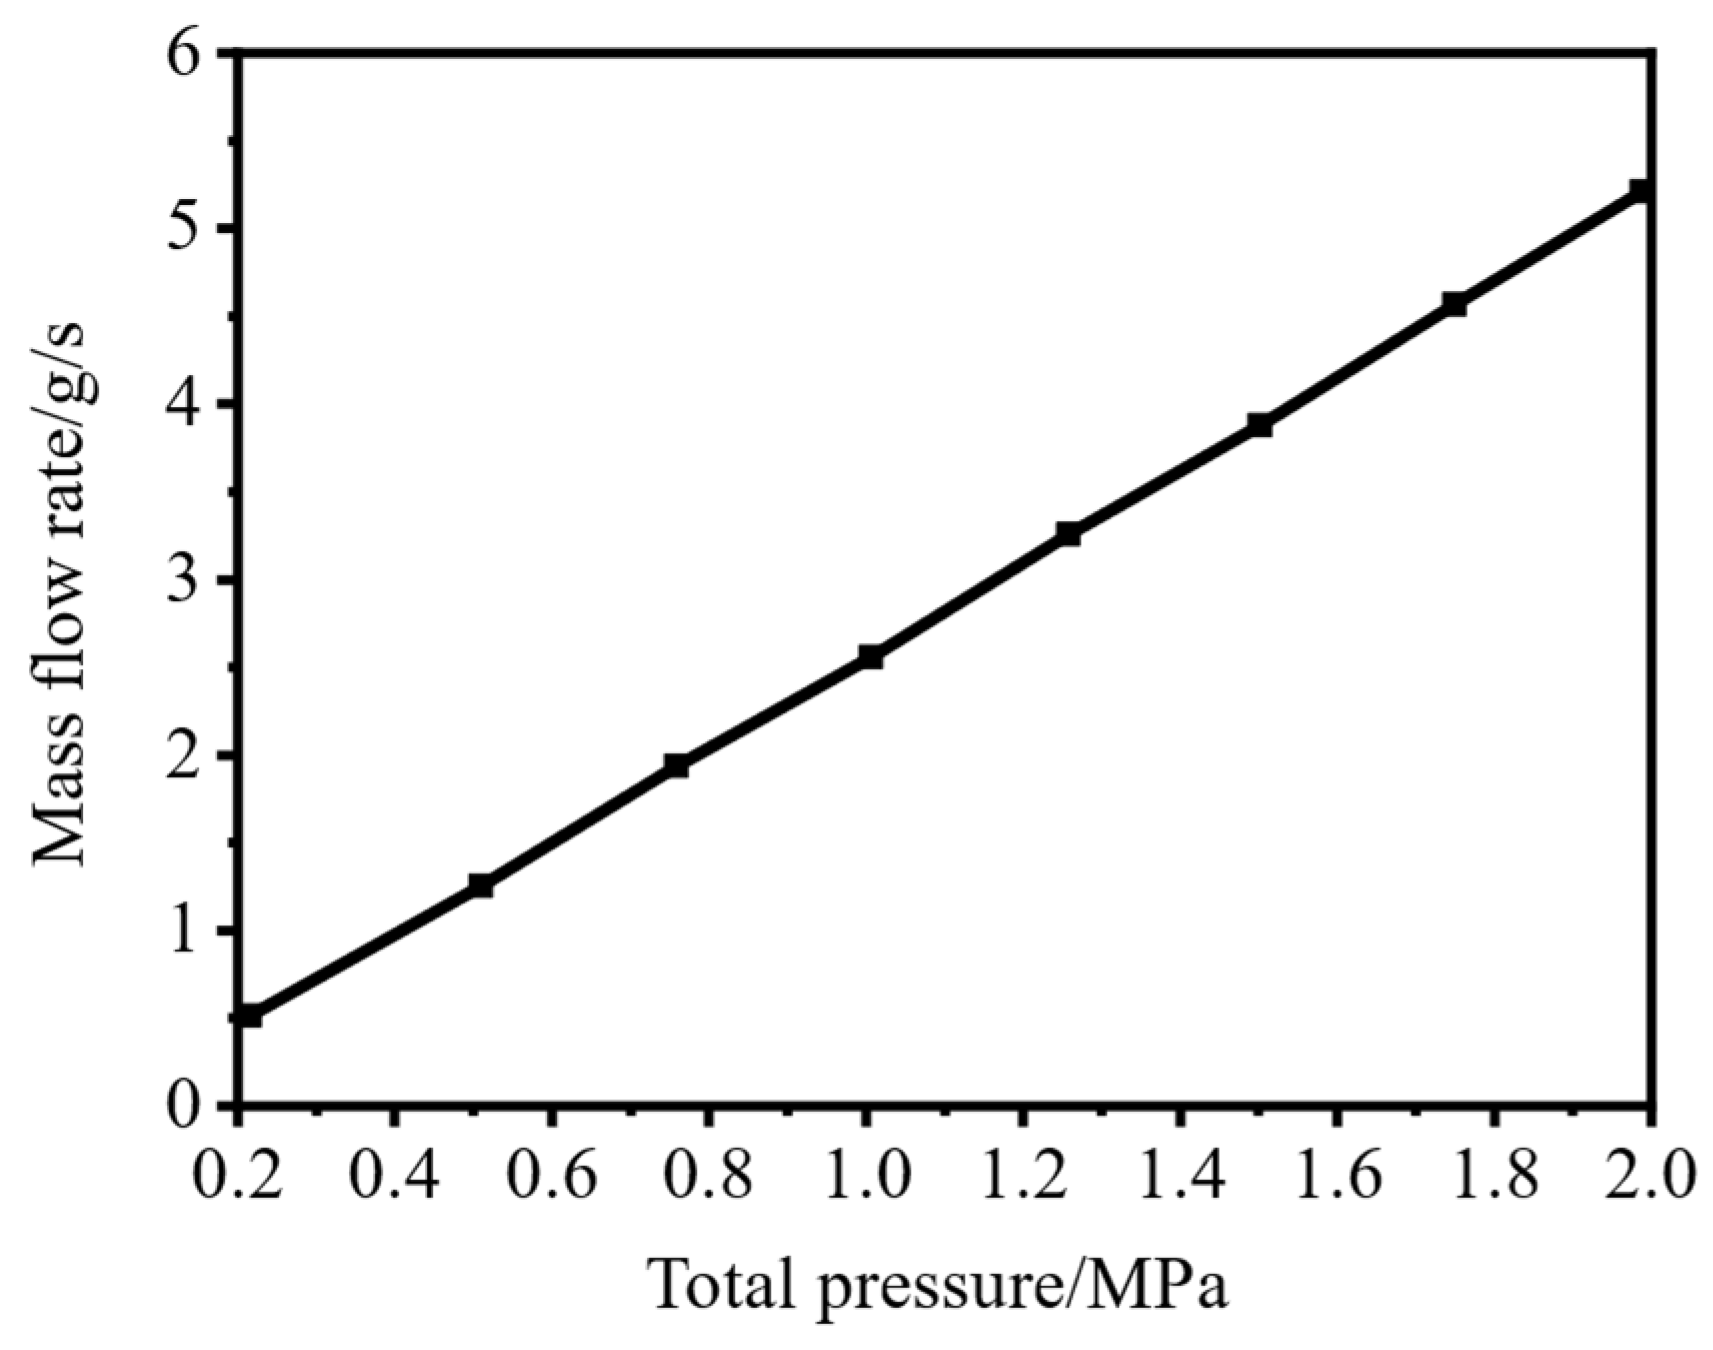
Through the calculation formula of the flow rate, it can be found that K and Ae are fixed, and the flow function is almost unchanged. Therefore, the mass flow rate is only related to the total pressure, and the two are proportional. If the injection pressure difference is too large, a choking phenomenon may occur. That is, with the increase in total pressure, the rate of increase in mass flow rate gradually slows down. Therefore, for pulse injection, in order to ensure the same mass flow rate when different duty cycles and total pressures are selected, it is necessary to explore the relationship between total pressure and mass flow rate. As shown in Figure 5, in the case of steady injection (1 mm injection hole), eight injection total pressures within 0.2 MPa–2 MPa were selected, and it was found that there was no choking phenomenon at total pressures up to 2 MPa. Therefore, to ensure the same time-averaged mass flow rate for sinusoidal and square-wave pulse injection, the injection total pressures are selected according to the following relationship:
where P∗—total pressure for steady injection; —total pressure for square-wave injection; —total pressure for sinusoidal injection; f—frequency; D—duty cycle.
Figure 5.
Kerosene mass flow rate vs. injection total pressure.
In this paper, gaseous kerosene is injected into the supersonic flow field at a certain frequency and duty cycle under the supersonic incoming flow conditions of a Mach number of 1.5, a total pressure of 237,150 Pa, a static pressure of 61,160 Pa and a temperature of 602 K. The total pressure of the square-wave pulse injection changes with the duty cycle, and the total temperature remains unchanged at 600 K. The simulation first explores the square-wave pulse with a duty cycle of 0.5 at different frequencies and the sinusoidal pulse. After that, the square-wave pulse conditions under different duty cycles are explored, and additional conditions are examined based on the preliminary trends.
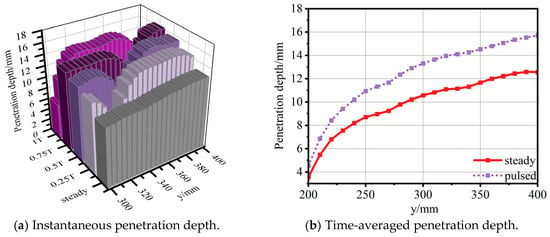
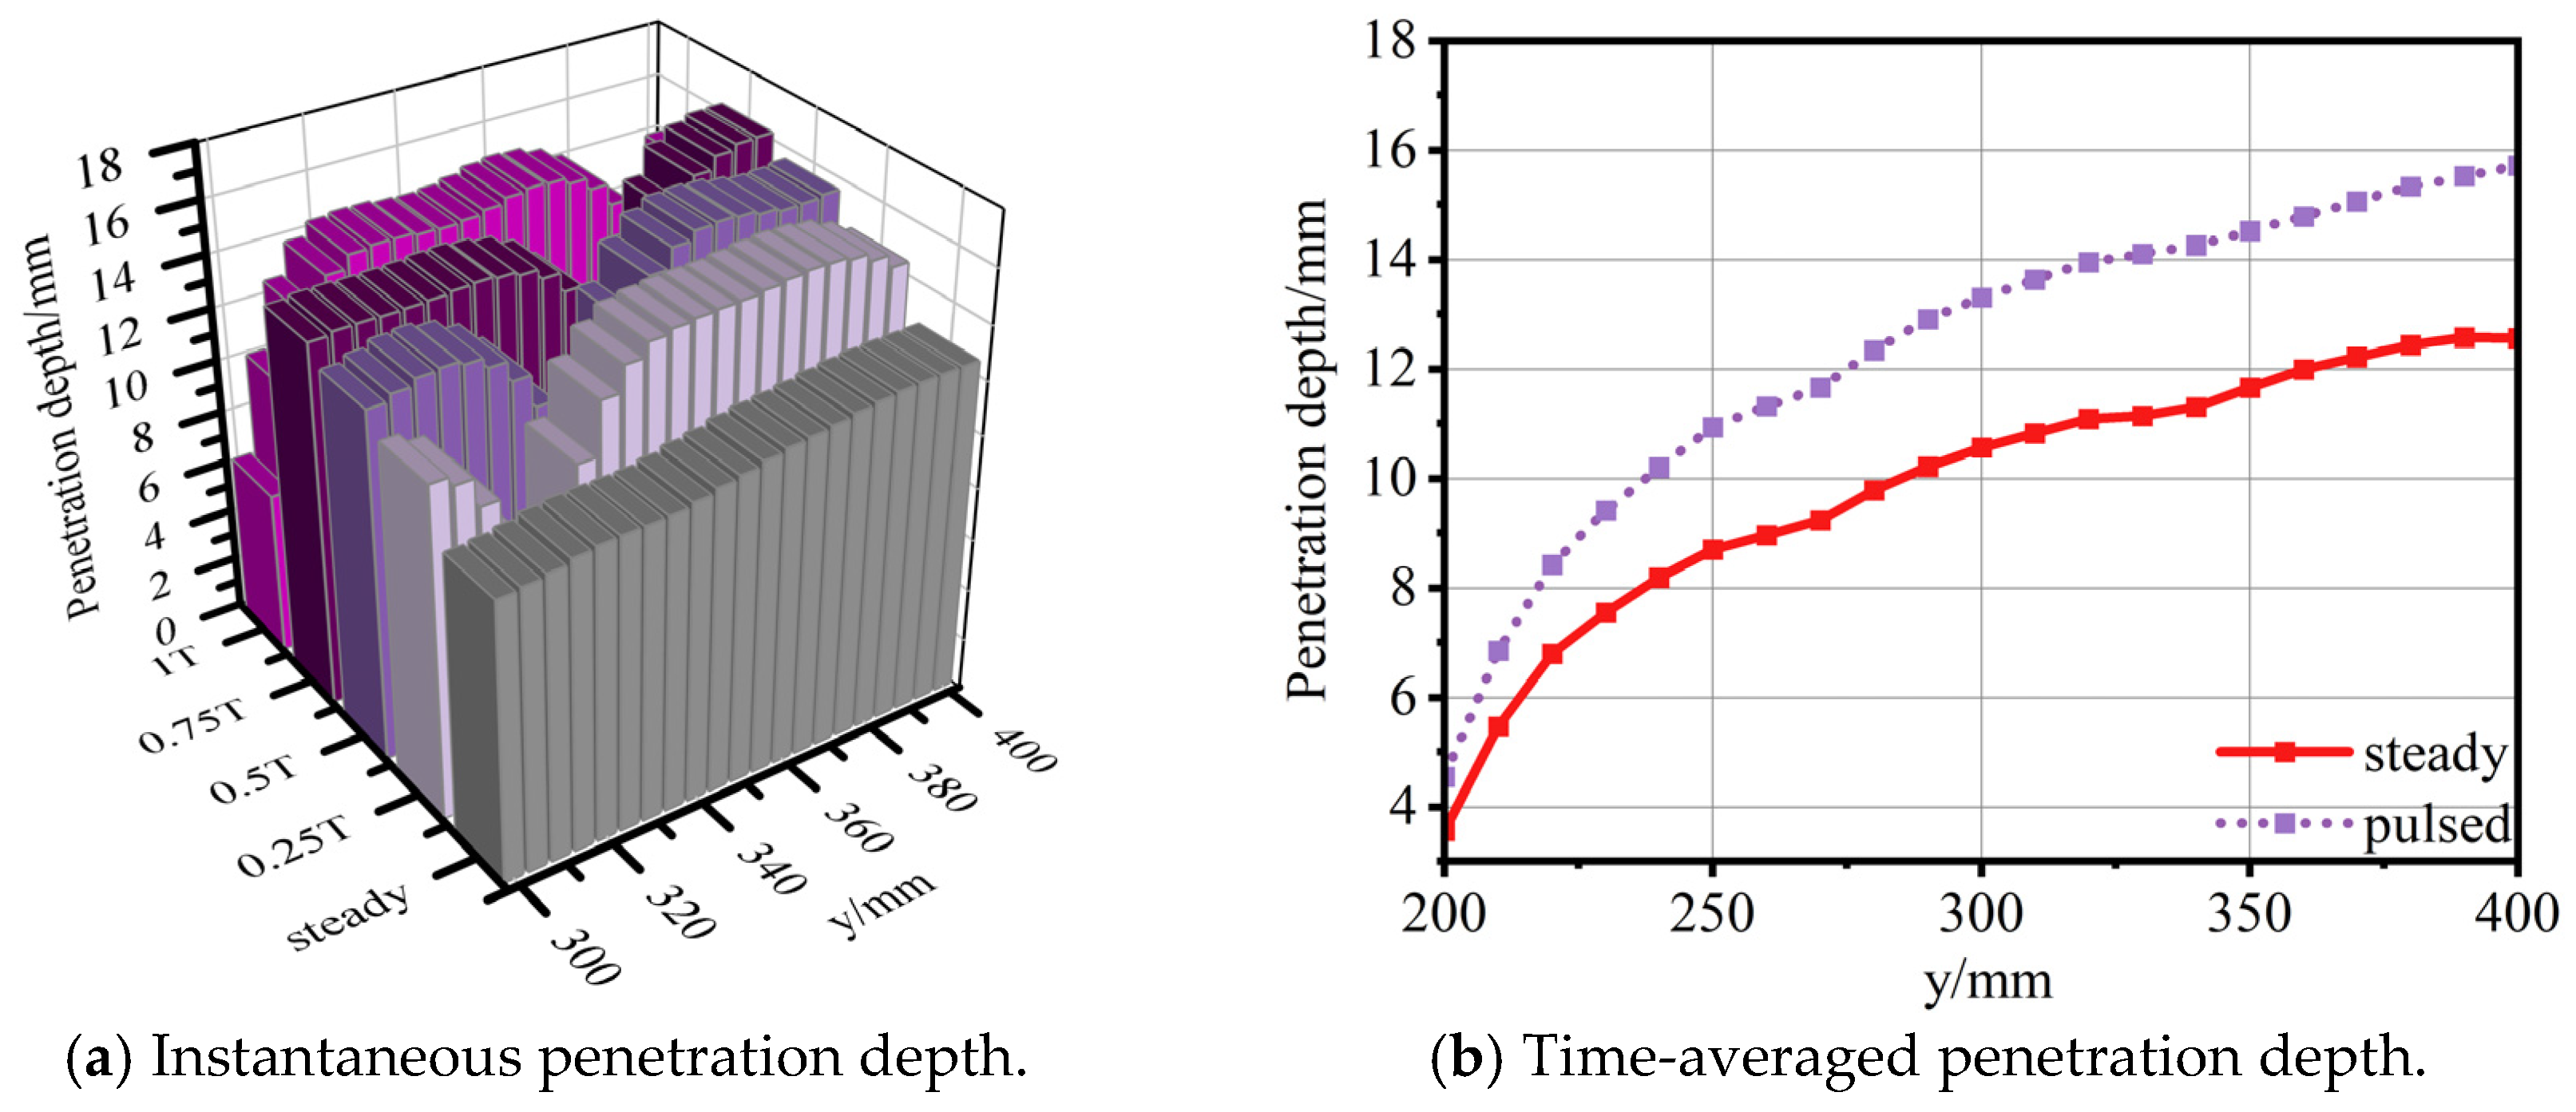
Figure 6a shows the penetration depth of a square-wave pulse jet and a steady jet at different times, and shows the advantages of a pulse jet in penetration depth over time. The penetration depth of the pulse jet is defined as the height of the boundary corresponding to a kerosene mass fraction of 0.005. However, for such an unsteady process, instantaneous penetration depth alone cannot represent the overall behavior of the pulse jet. Therefore, the penetration depth determined from the time-averaged kerosene concentration obtained using Fluent is used as the evaluation standard. As shown in Figure 6b, the time-averaged penetration depth fits well with the transient penetration depth at each moment. In addition, it can be seen that the pulse injection has a great advantage in penetration depth compared with the steady injection.
Figure 6.
Instantaneous penetration depth and time-averaged penetration depth.
Because the flow rate of the unsteady jet varies with both position and time, the mixing efficiency distribution at an individual location cannot represent the mixing efficiency of the overall jet. Therefore, the global mixing efficiency is defined as follows: 96 sections are selected between y = 210 mm and y = 400 mm, and the amount of reactable kerosene in each section is accumulated and divided by the total accumulation of kerosene.
The mixing efficiency is defined as:
where the reactable kerosene mass fraction, αreact, is defined as:
where α is the local kerosene mass fraction, and
αstoic = 0.06334
3. Results and Discussion
3.1. Variation Law and Mechanism Analysis of Mixing Performance of Pulse Injection with Frequency
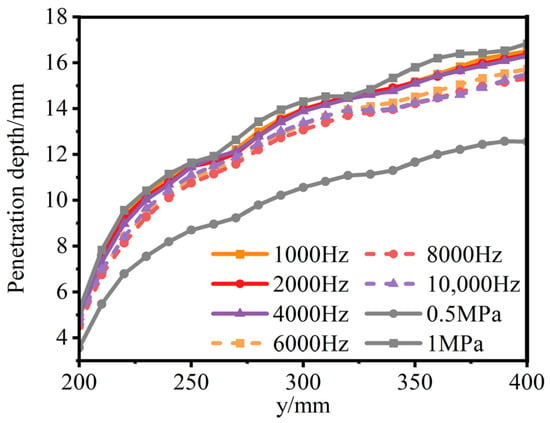
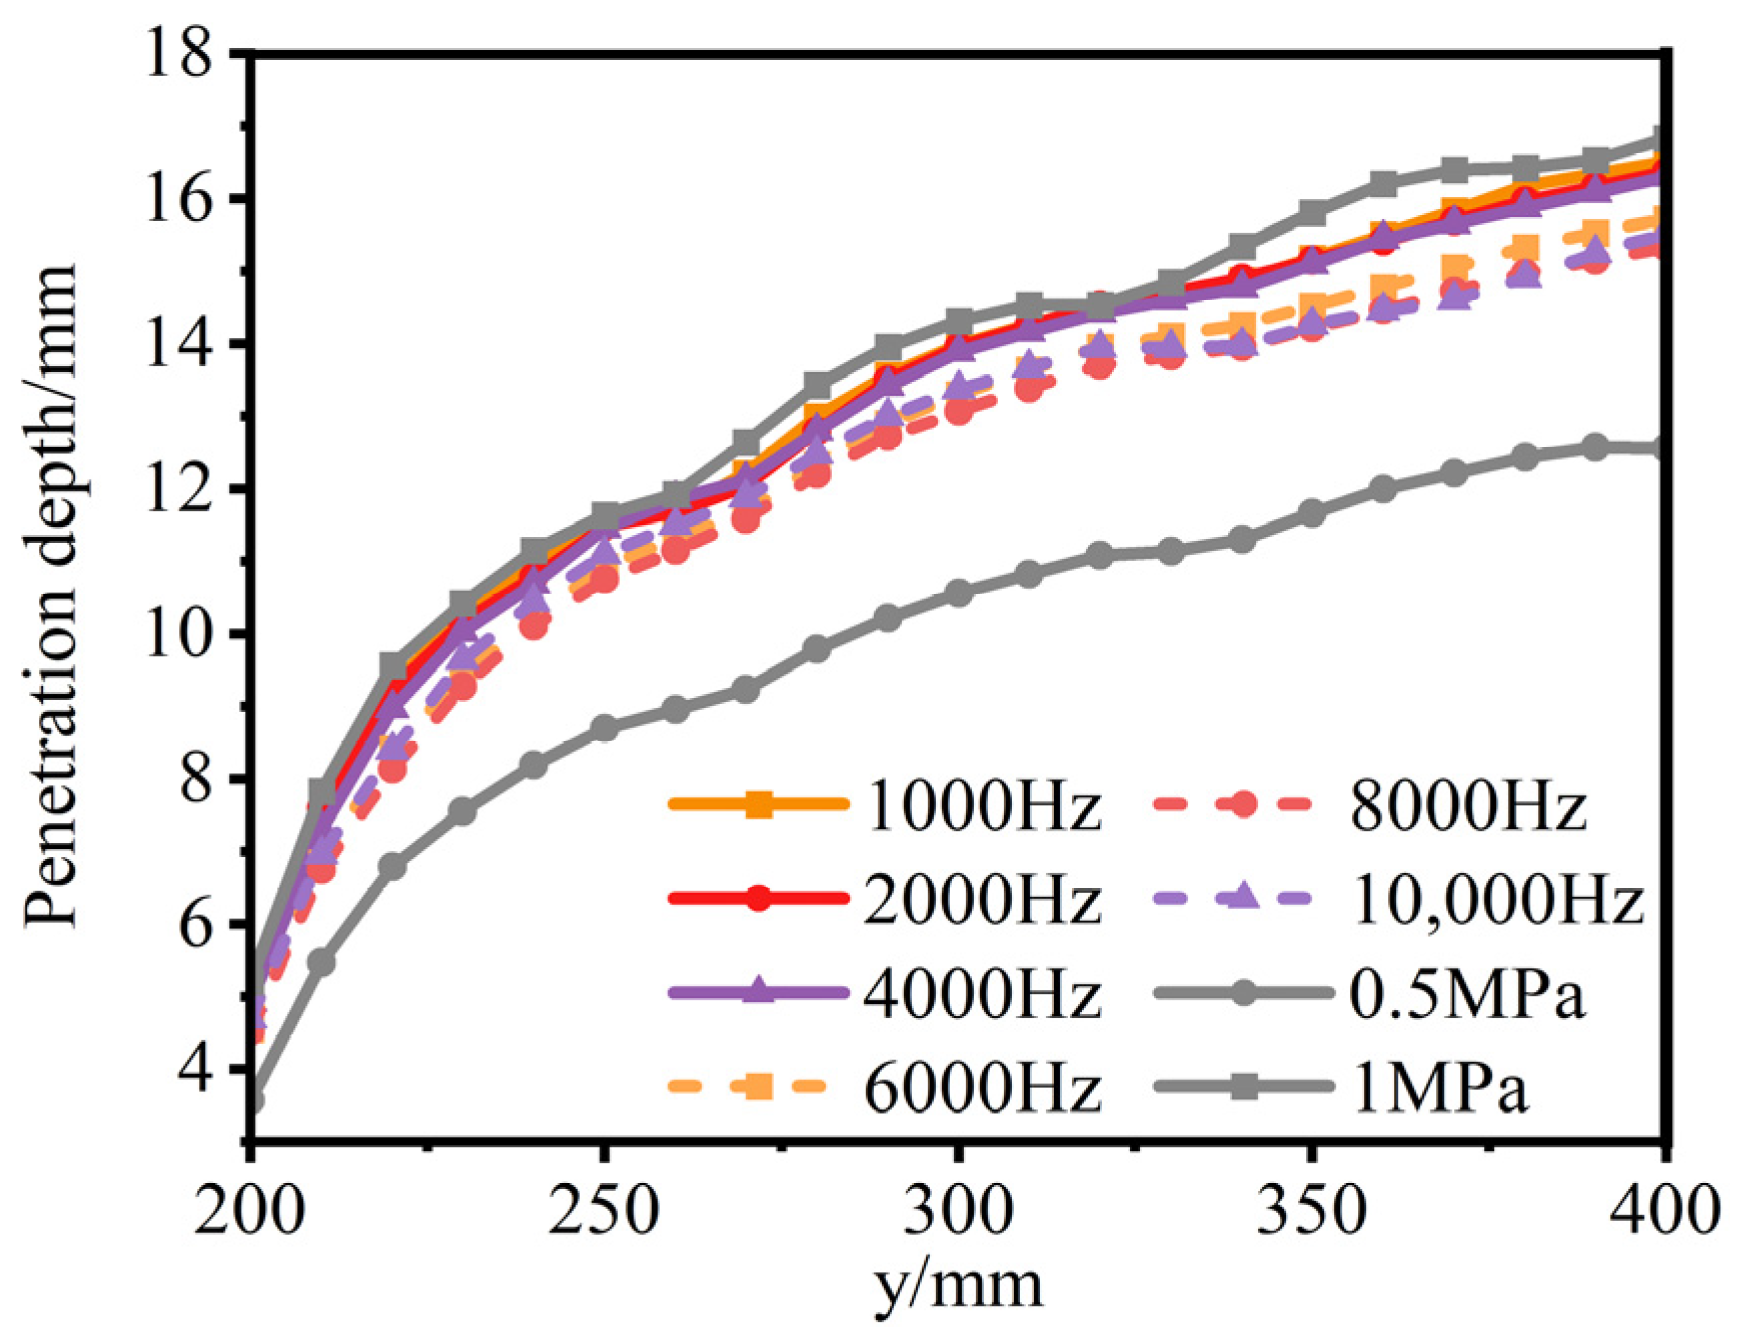
In this Section, square-wave pulse injection with a duty cycle of 0.5 is used as an example to examine the response of mixing performance to pulse frequency. Figure 7 shows the time-averaged penetration depth of a pulse jet at different frequencies and a steady jet. It can be found that at a duty cycle of 0.5, with an increase in frequency, the penetration depth remains basically unchanged and then decreases significantly. The critical frequency of penetration depth decline is about 4000–5000 Hz. Among them, compared with the steady jet with the same injection pressure, the penetration depth of the pulse jet has a downward trend, which may be because the effect of time-averaging the concentration affects the penetration depth of the pulse jet. At the same time, this is also reasonable, because the instantaneous penetration depth of intermittent injection cannot be equivalent to the steady penetration depth, and time averaging accounts for fluctuations in penetration depth.
Figure 7.
The penetration depth of the pulse jet varies with frequency at a duty cycle of 0.5.
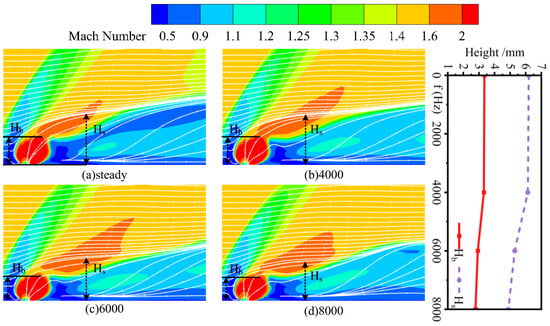
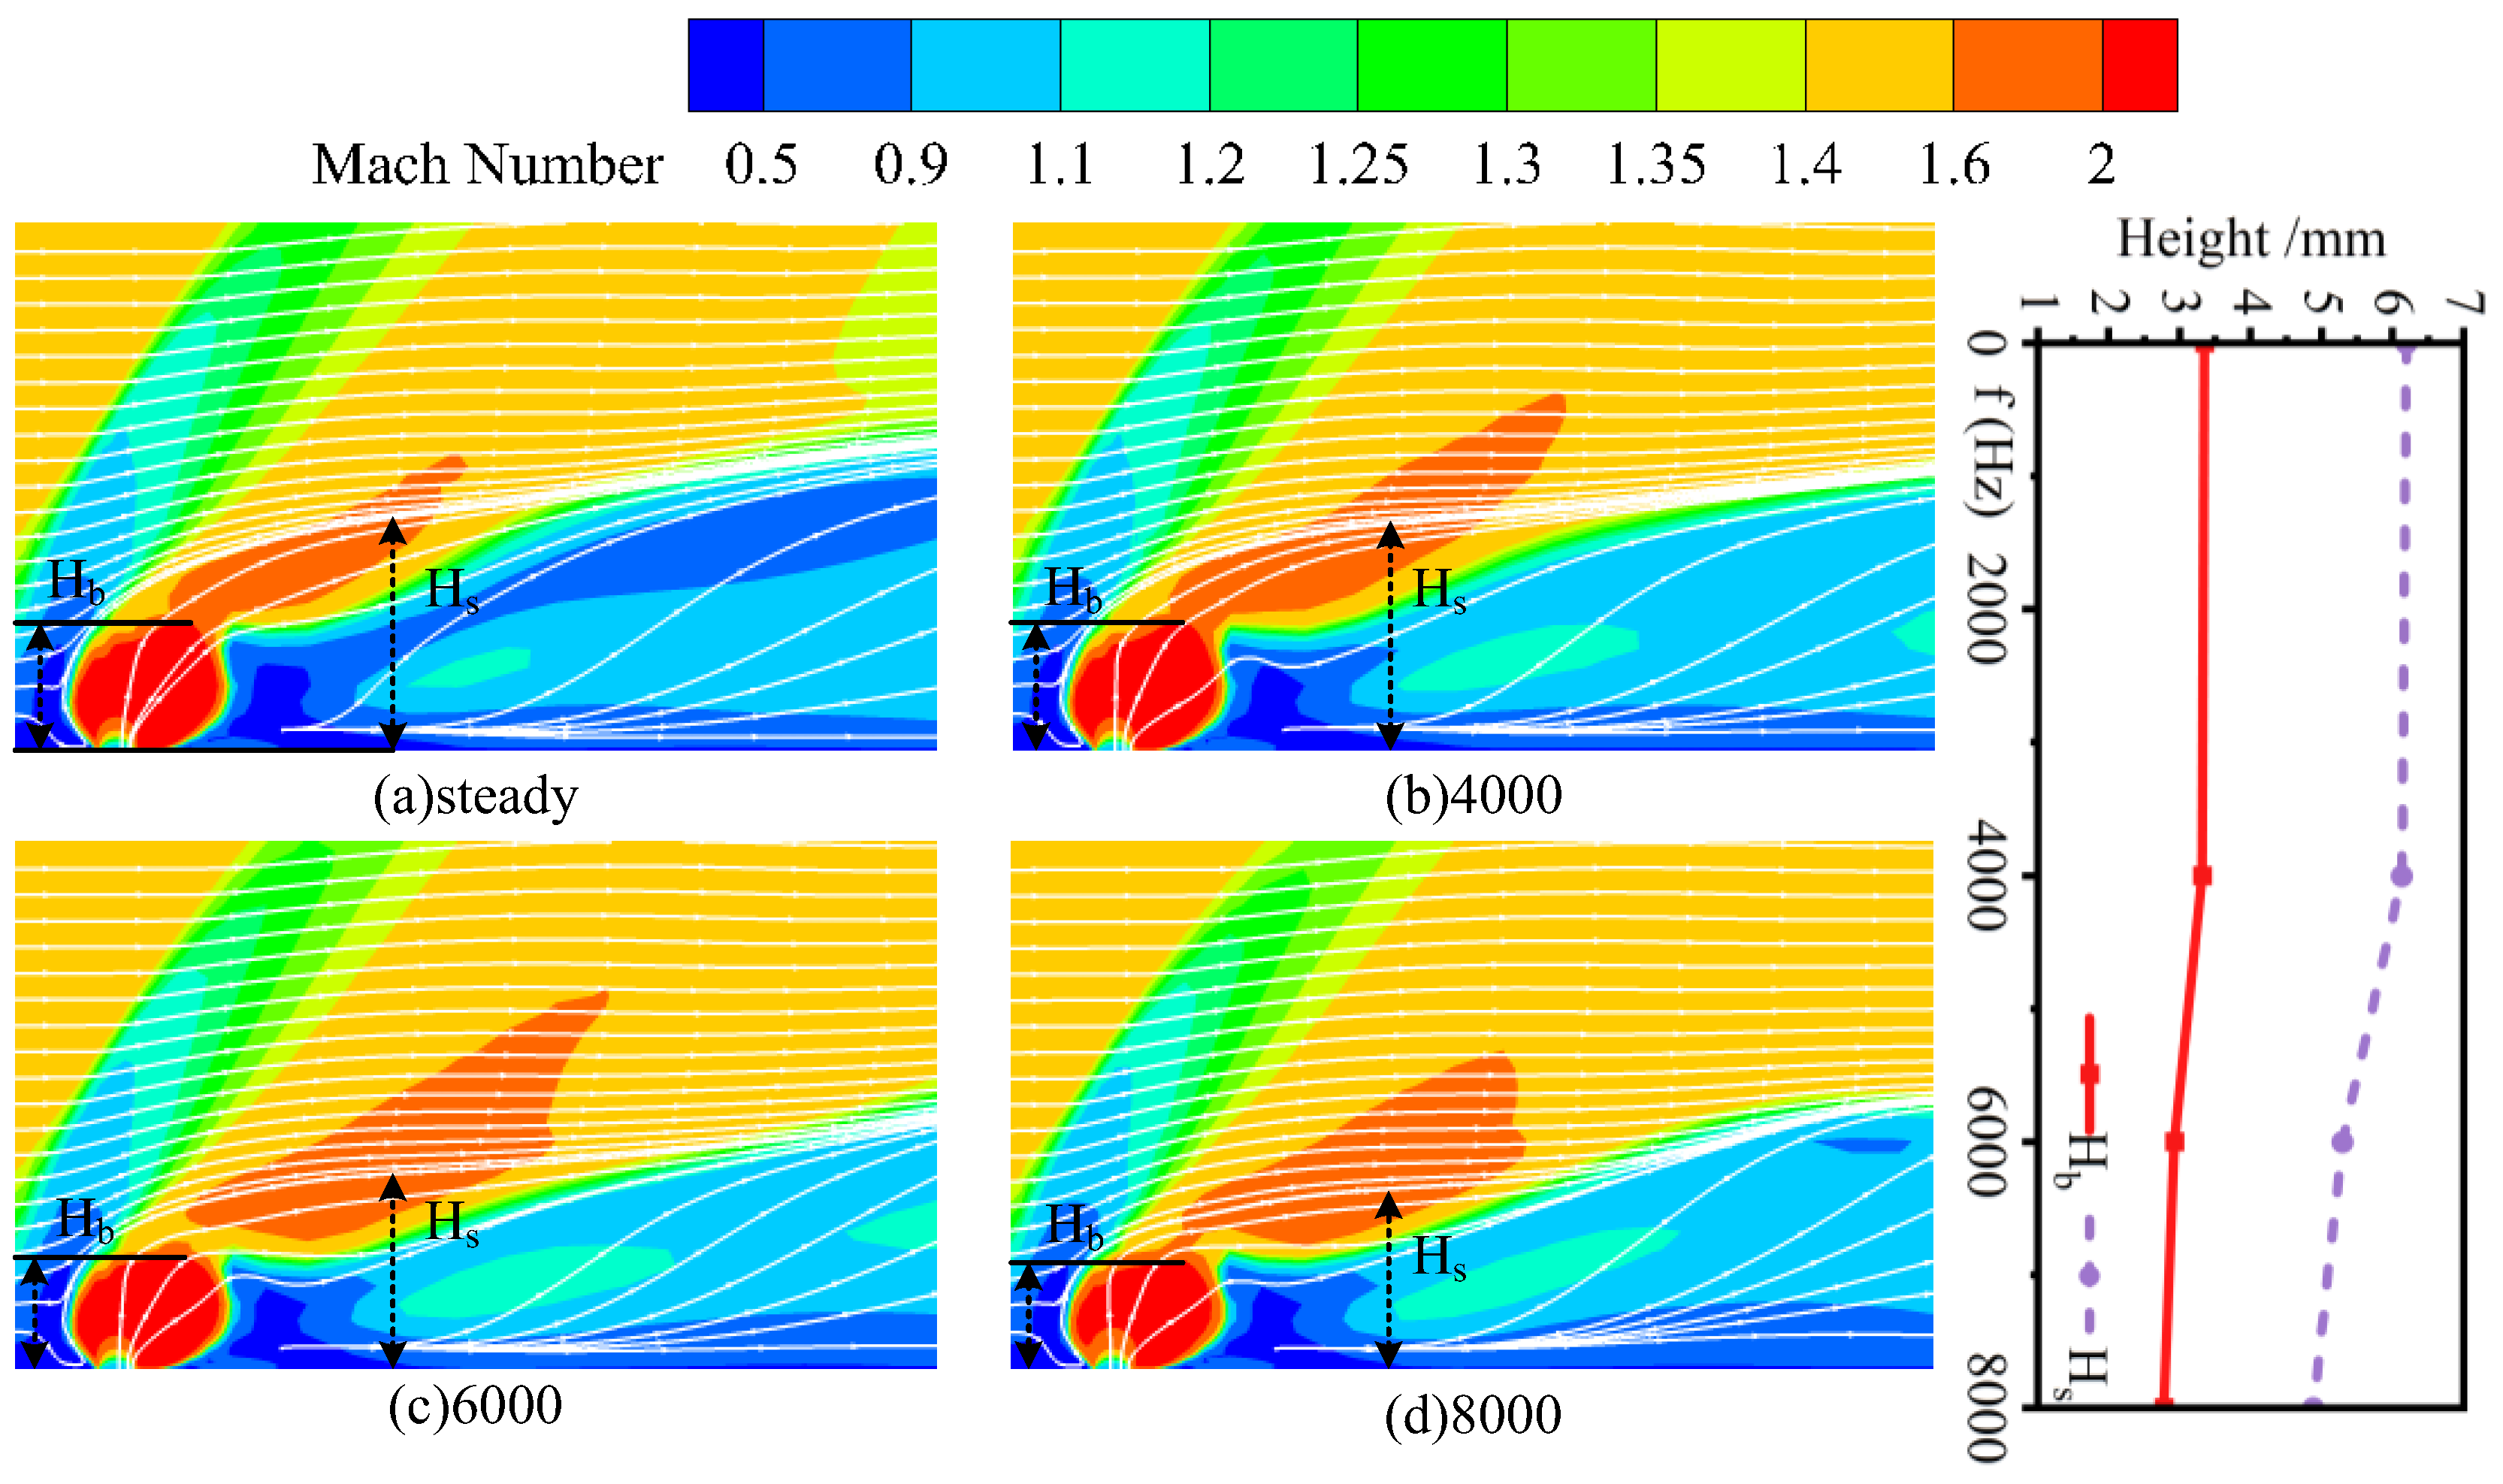
The mechanism responsible for the decrease in penetration depth with increasing frequency is examined further. Figure 8 shows the Mach number cloud diagram of the four injection conditions of steady injection, 4000 Hz, 6000 Hz and 8000 Hz. Due to the obstruction caused by the kerosene at the nozzle hole, some of the incoming streamlines rise and converge with some of the kerosene streamlines. The height of the barrel shock wave and the height of the streamline elevation are defined as the boundary height of Mach number 2.0 at the peak of the injection and the height of the incoming streamline gathered at 10 mm after the nozzle to characterize the jet lift capacity at the nozzle. By numericalizing the flow field structure, an intuitive relationship between the flow field structure and the penetration depth is established. Comparing the established Mach disk height Hb with the streamline elevation height Hs, it can be found that the penetration depth is almost stable from the steady state to 4000 Hz, and the Mach disk height and the streamline elevation height are also stable in this range. When the frequency increases from 4000 Hz to 8000 Hz, the penetration depth shows a continuous decline, while the Mach disk height and streamline elevation height show a simultaneous decline. This preliminarily shows that the change in penetration depth has a strong correlation with the establishment of the Mach disk and the lifting capacity of the streamline.
Figure 8.
The Mach number cloud diagram and the height change of the flow field structure at different frequencies.
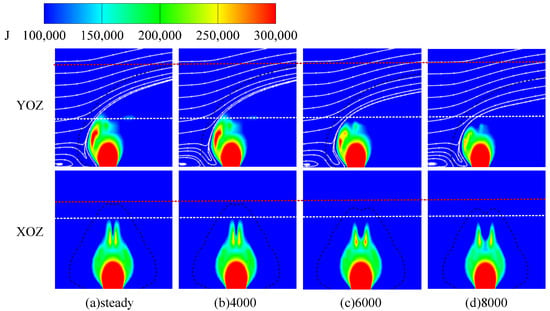
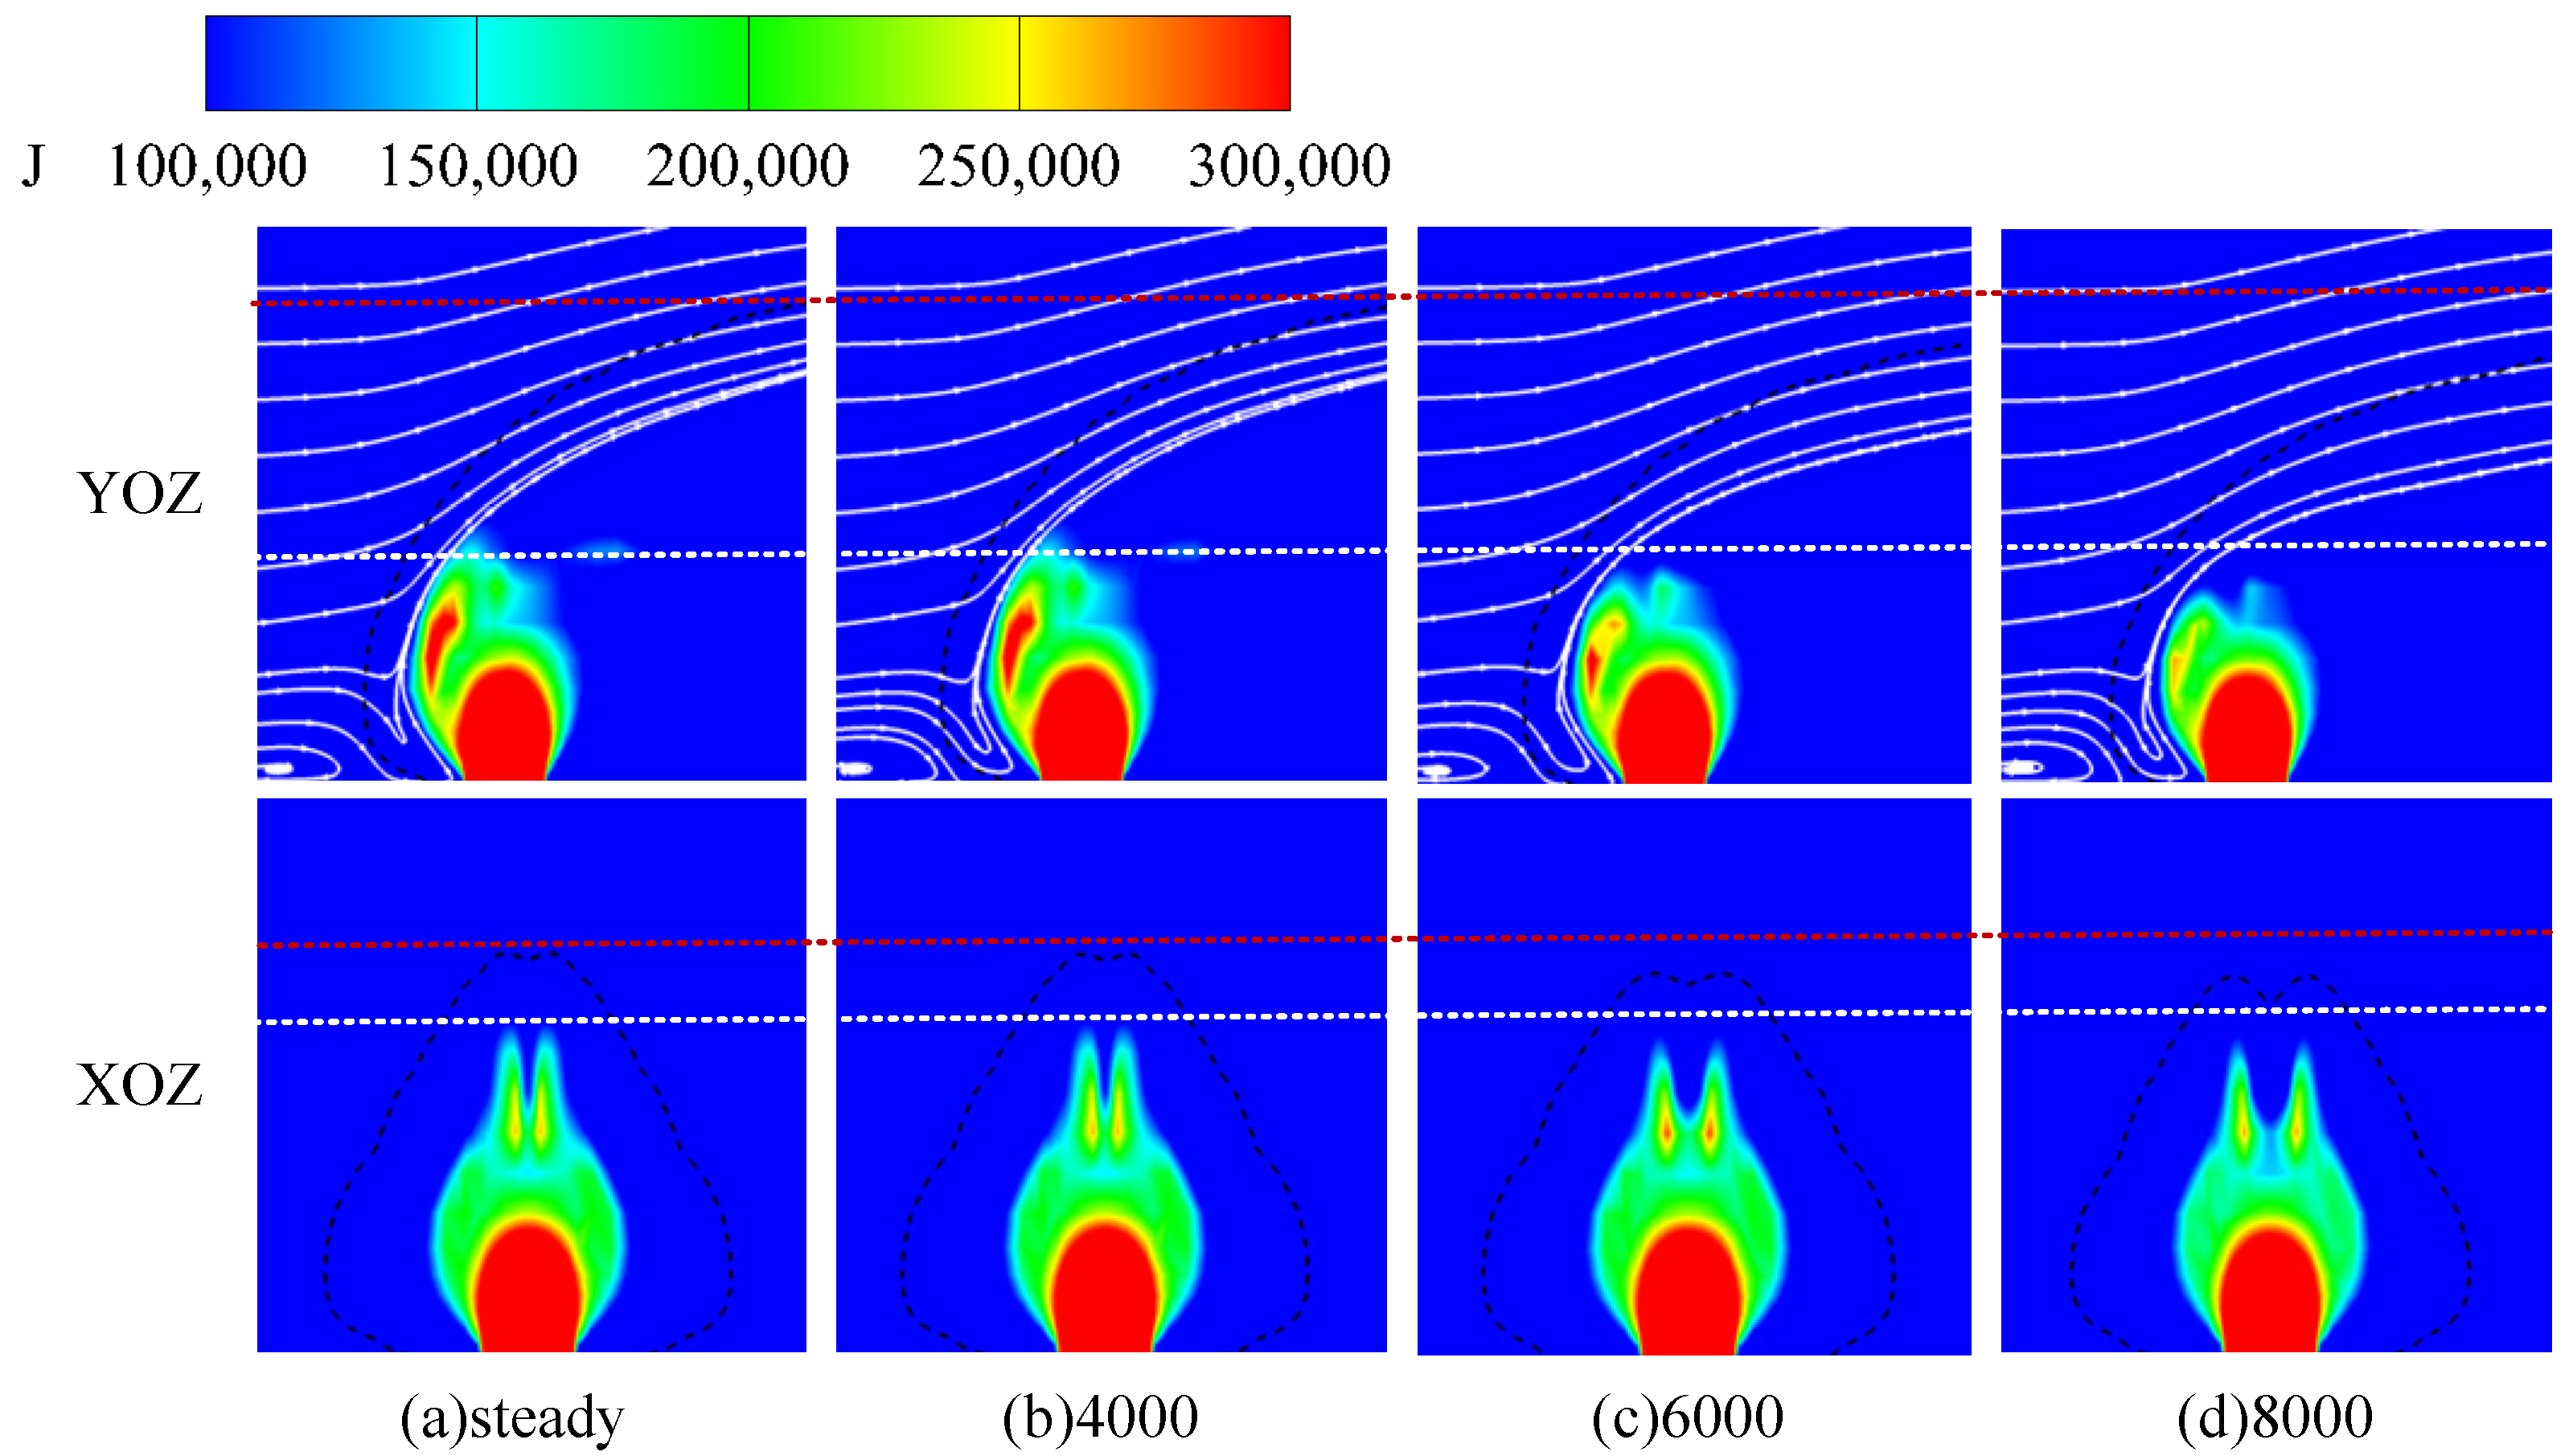
Figure 9 shows the momentum cloud distribution at the XOZ and YOZ cross-sections and the 0.1 kerosene concentration isoline at the injection peak at different frequencies. It can be seen that in the range from steady state to 4000 Hz, the momentum of the kerosene near the nozzle establishes a stable momentum field. From 4000 Hz to 8000 Hz, the kerosene momentum has not been fully developed, and there is a degradation phenomenon. From a dynamic perspective, on the YOZ plane, the kerosene expands outward after ejection, and the high-speed incoming flow on the left side impinges on the kerosene. As a result, the kerosene is compressed to form a gradually developing high-momentum region, and the high-speed incoming flow is lifted and gradually developed into a stable momentum field. The momentum is constantly weakening in the process of upward development. In the process of establishing a stable flow field near the jet nozzle, the high momentum continuously develops and deflects the incoming streamlines upward.
Figure 9.
Momentum contours and kerosene concentration isoline near the nozzle at different frequencies.
Based on the above flow field analysis, it can be seen that the main reason for the decrease in penetration depth is that the flow field near the nozzle has not fully developed, and the full development of the jet is limited by time. As a result, the momentum dissipation increases, the streamline lifting capacity decreases, and the central dominant momentum penetration structure cannot be formed, thus reducing the penetration depth.
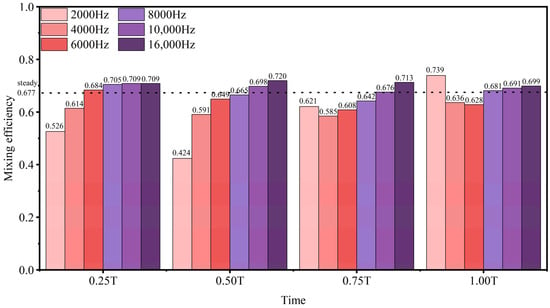
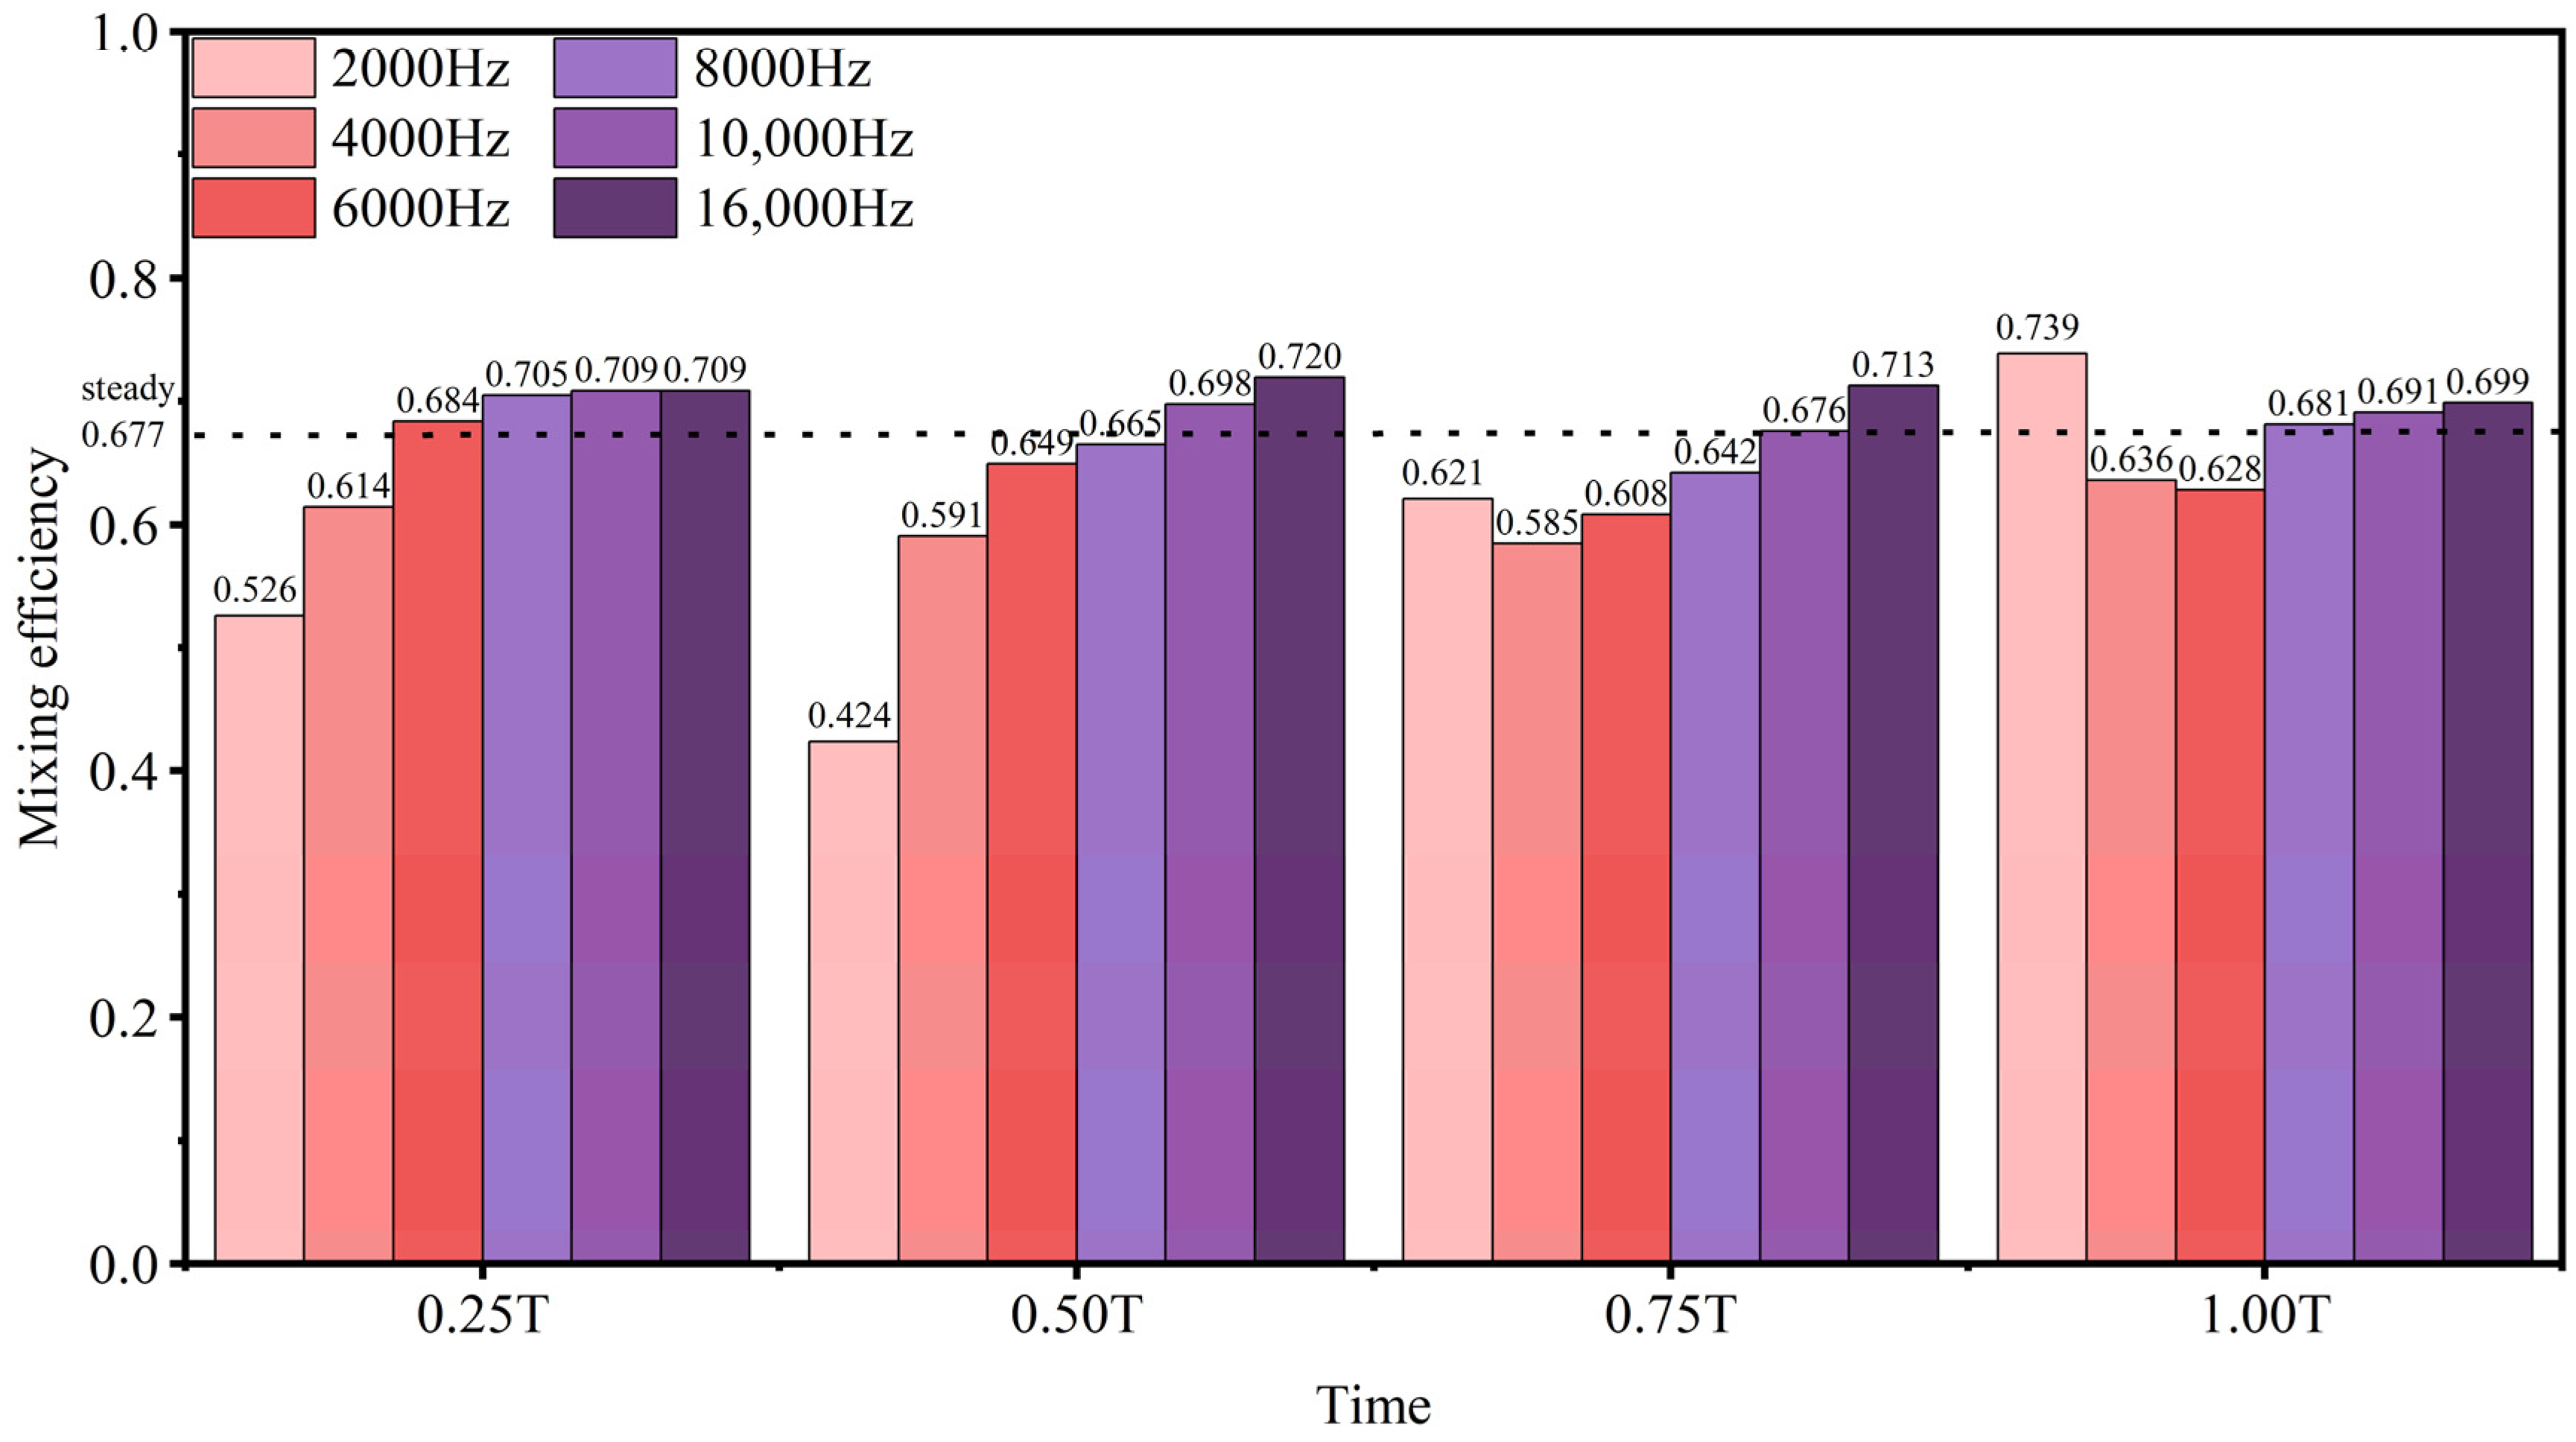
Figure 10 shows the change in mixing efficiency of pulse injection at different frequencies. It can be seen from the figure that the mixing efficiency of the pulse injection below 8000 Hz is lower than that of steady injection at the same flow rate. The pulse fluctuation is large, and it is difficult to continuously strengthen the mixing process between the mainstream and the jet. With the increase in frequency, the fluctuation of pulse mixing efficiency at different times decreases, and the pulse mixing efficiency also increases obviously. Above approximately 10,000 Hz, the rate of increase in mixing efficiency suddenly weakens. At this time, the pulse mixing efficiency is close to the saturation value of 0.711, compared with 0.677 for steady injection. Therefore, it can be seen that approximately 10,000 Hz represents the critical frequency range in which the mixing enhancement effect transitions from rapid growth to saturation.
Figure 10.
The mixing efficiency of pulse injection varies with frequency at a duty cycle of 0.5.
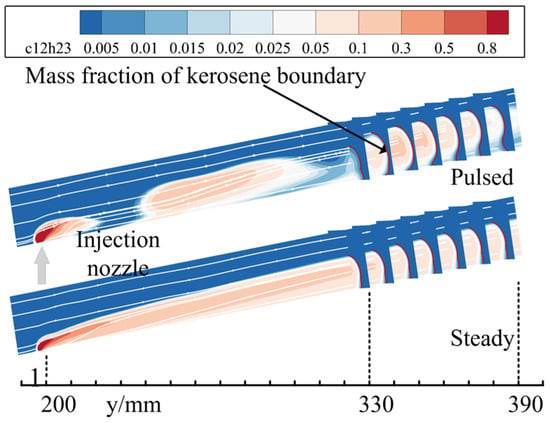
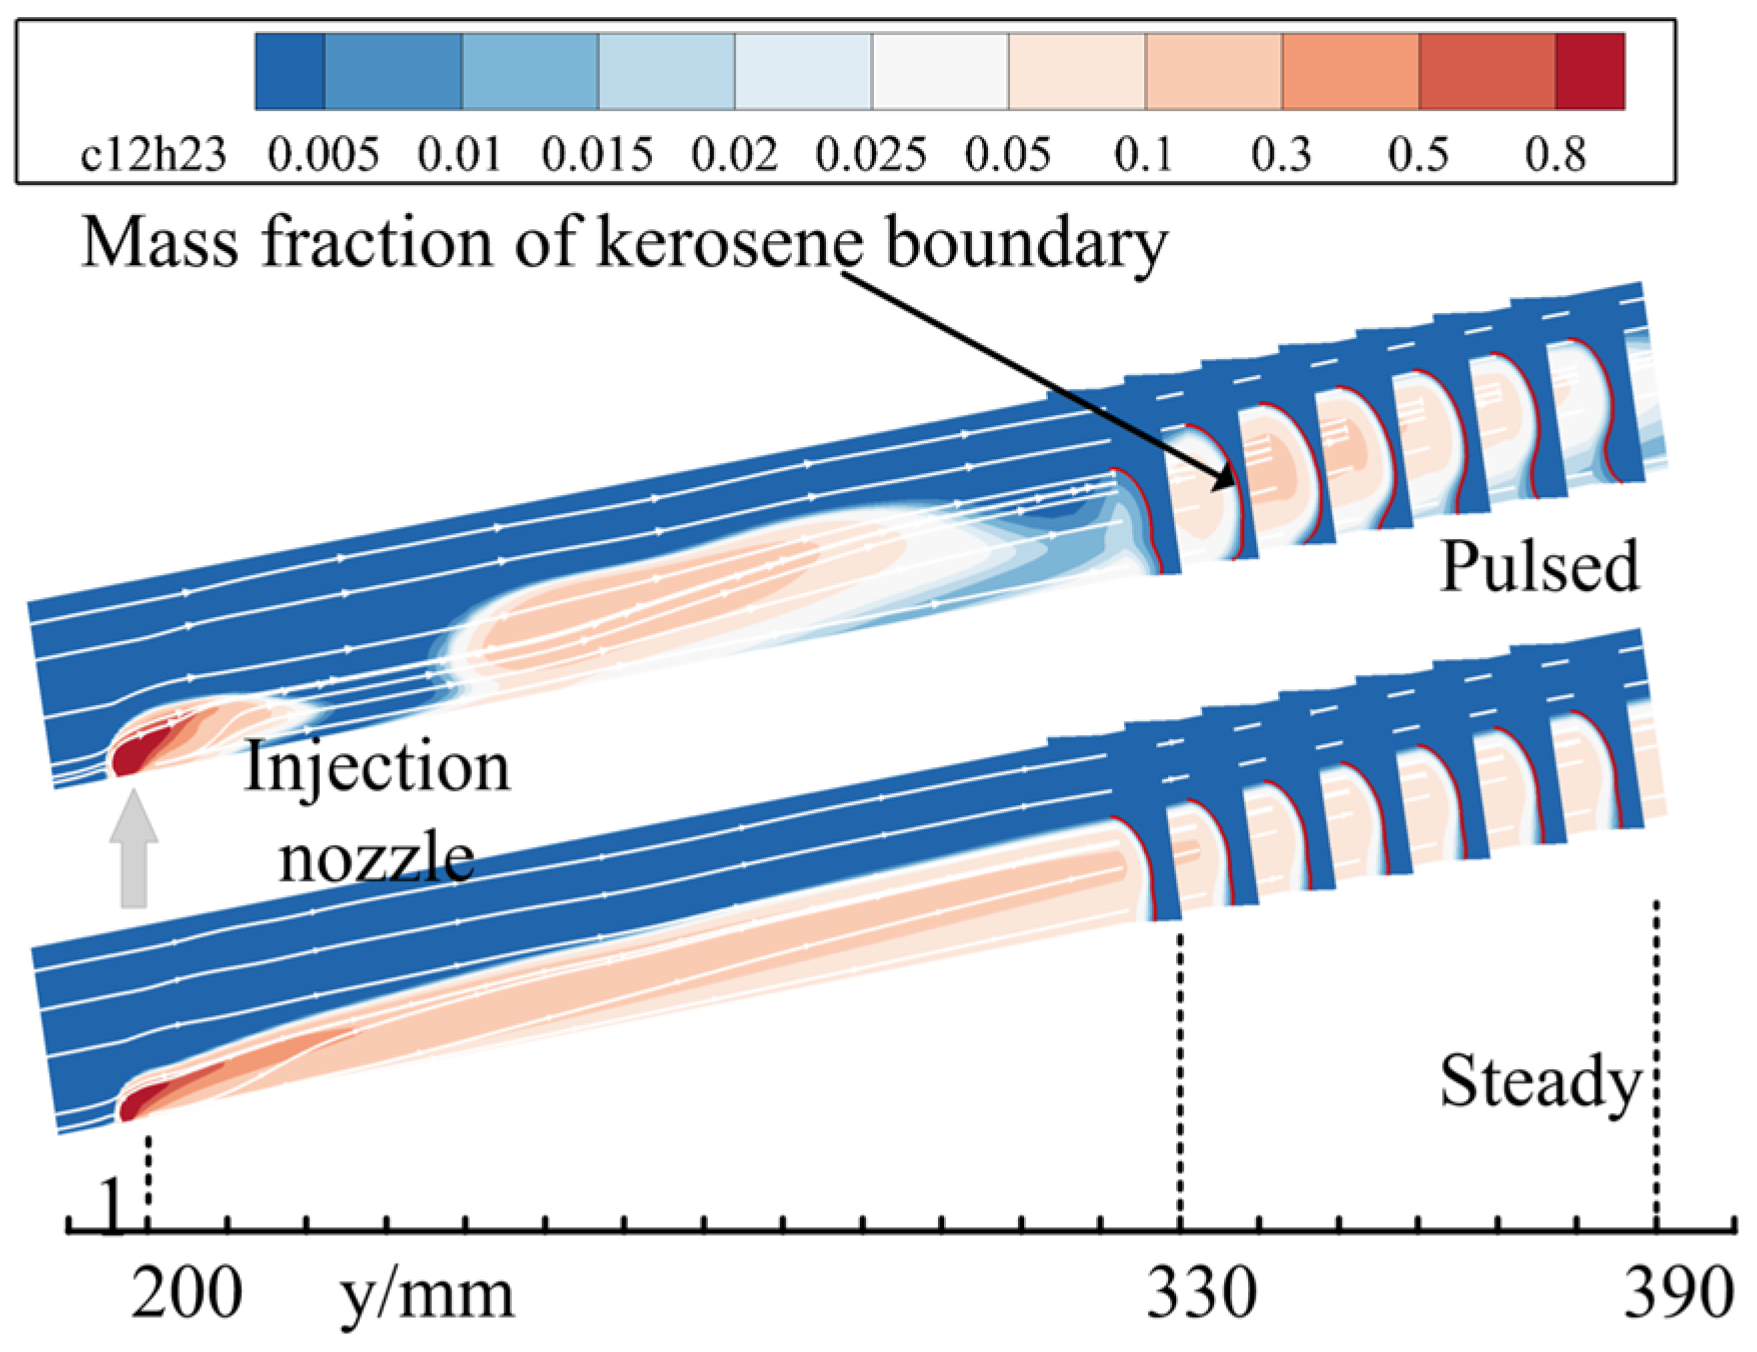
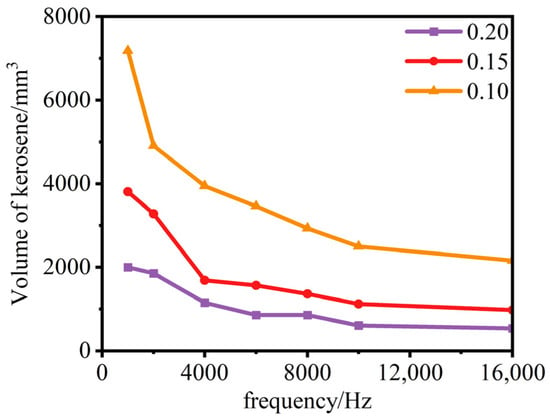
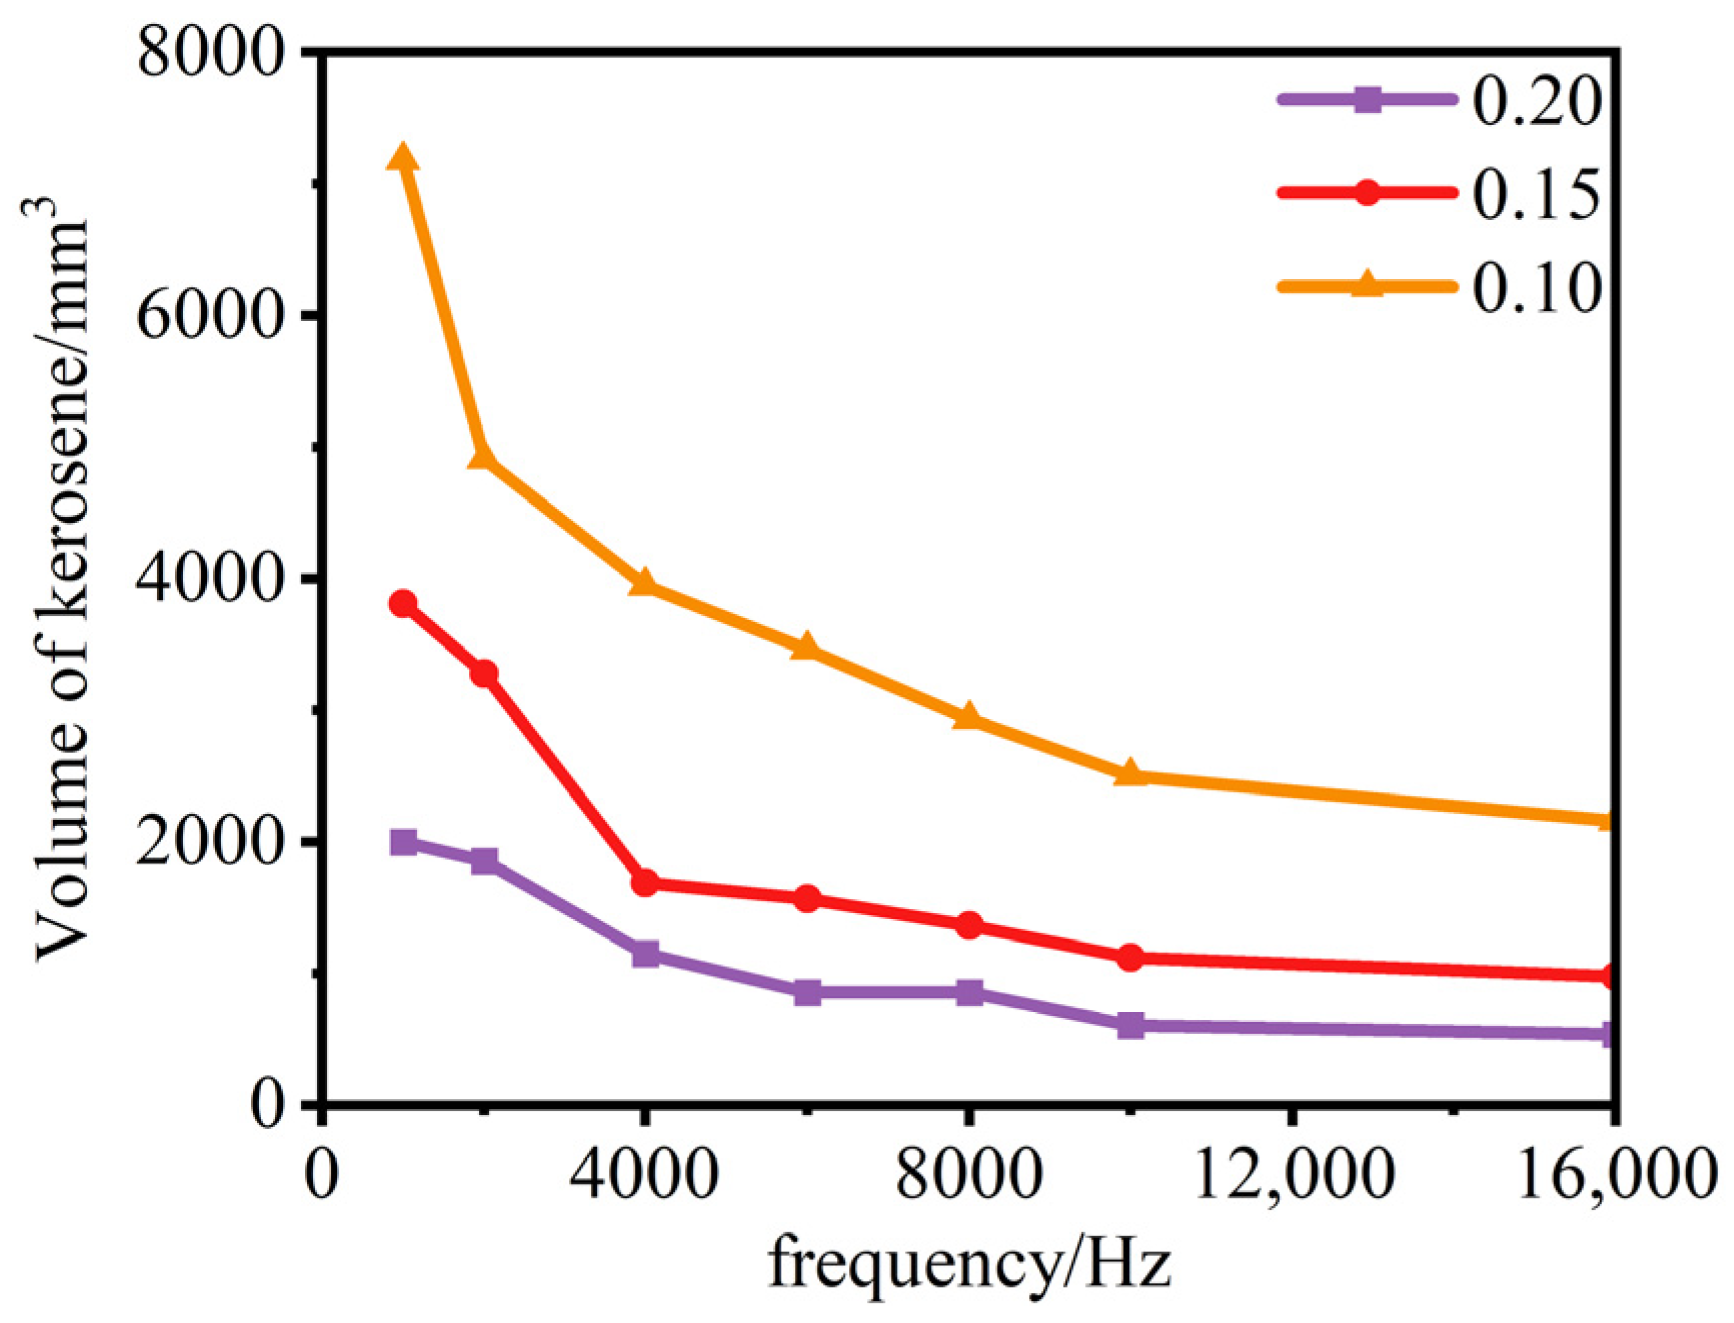
In general, it is expected that the penetration depth and the mixing efficiency of the injection show the same trend. For example, if the penetration depth decreases, the mixing efficiency will also decrease. However, the conclusion obtained in this section is that the penetration depth decreases, and the mixing efficiency increases. This is a reasonable phenomenon. Typically, reducing penetration depth at a fixed kerosene flow rate can reduce the mixing area, so the mixing efficiency decreases. However, for pulse jets, while the penetration depth decreases, they improve the extremely uneven distribution of the kerosene in the flow direction of the pulse jet at 6000 Hz (Figure 11), thereby improving the mixing efficiency. The increase in pulse injection mixing efficiency with frequency is mainly attributed to the division of the kerosene core into a larger number of smaller core regions, which promotes the diffusion of high-concentration kerosene and thereby enhances mixing efficiency. To quantitatively verify this hypothesis, the volume of high-concentration kerosene regions exceeding specified concentration thresholds was calculated from the flow field. Figure 12 shows that these volumes decrease with increasing pulse frequency across different concentration thresholds, quantitatively demonstrating that higher frequencies promote a more uniform fuel distribution and thereby enhance mixing efficiency.
Figure 11.
Comparison of kerosene distribution between pulse injection and steady injection.
Figure 12.
Variation in the volume of high-concentration kerosene regions at different mass fraction thresholds.
3.2. Comparative Analysis of Square-Wave Pulse and Sinusoidal Pulse
In order to compare the mixing characteristics of pulse injection under different waveforms, this section studies the mixing performance of a square-wave pulse with a 0.5 duty cycle and a sinusoidal pulse. According to the above mechanism, the establishment of the flow field structure near the nozzle affects the jet penetration. By comparing differences in flow field structure and mixing performance of pulse injection under different waveforms, the advantages and characteristics of pulse injection with different waveforms are explored. It is further verified that the establishment of the flow field at the nozzle is one of the factors that dominate the mixing performance of pulse injection.
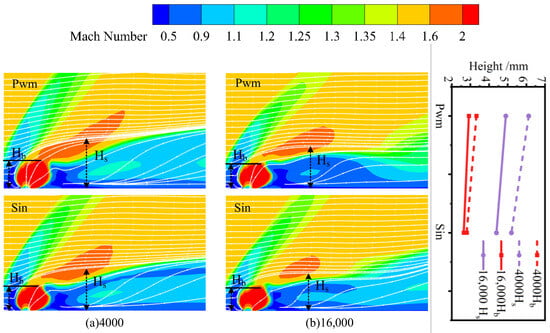
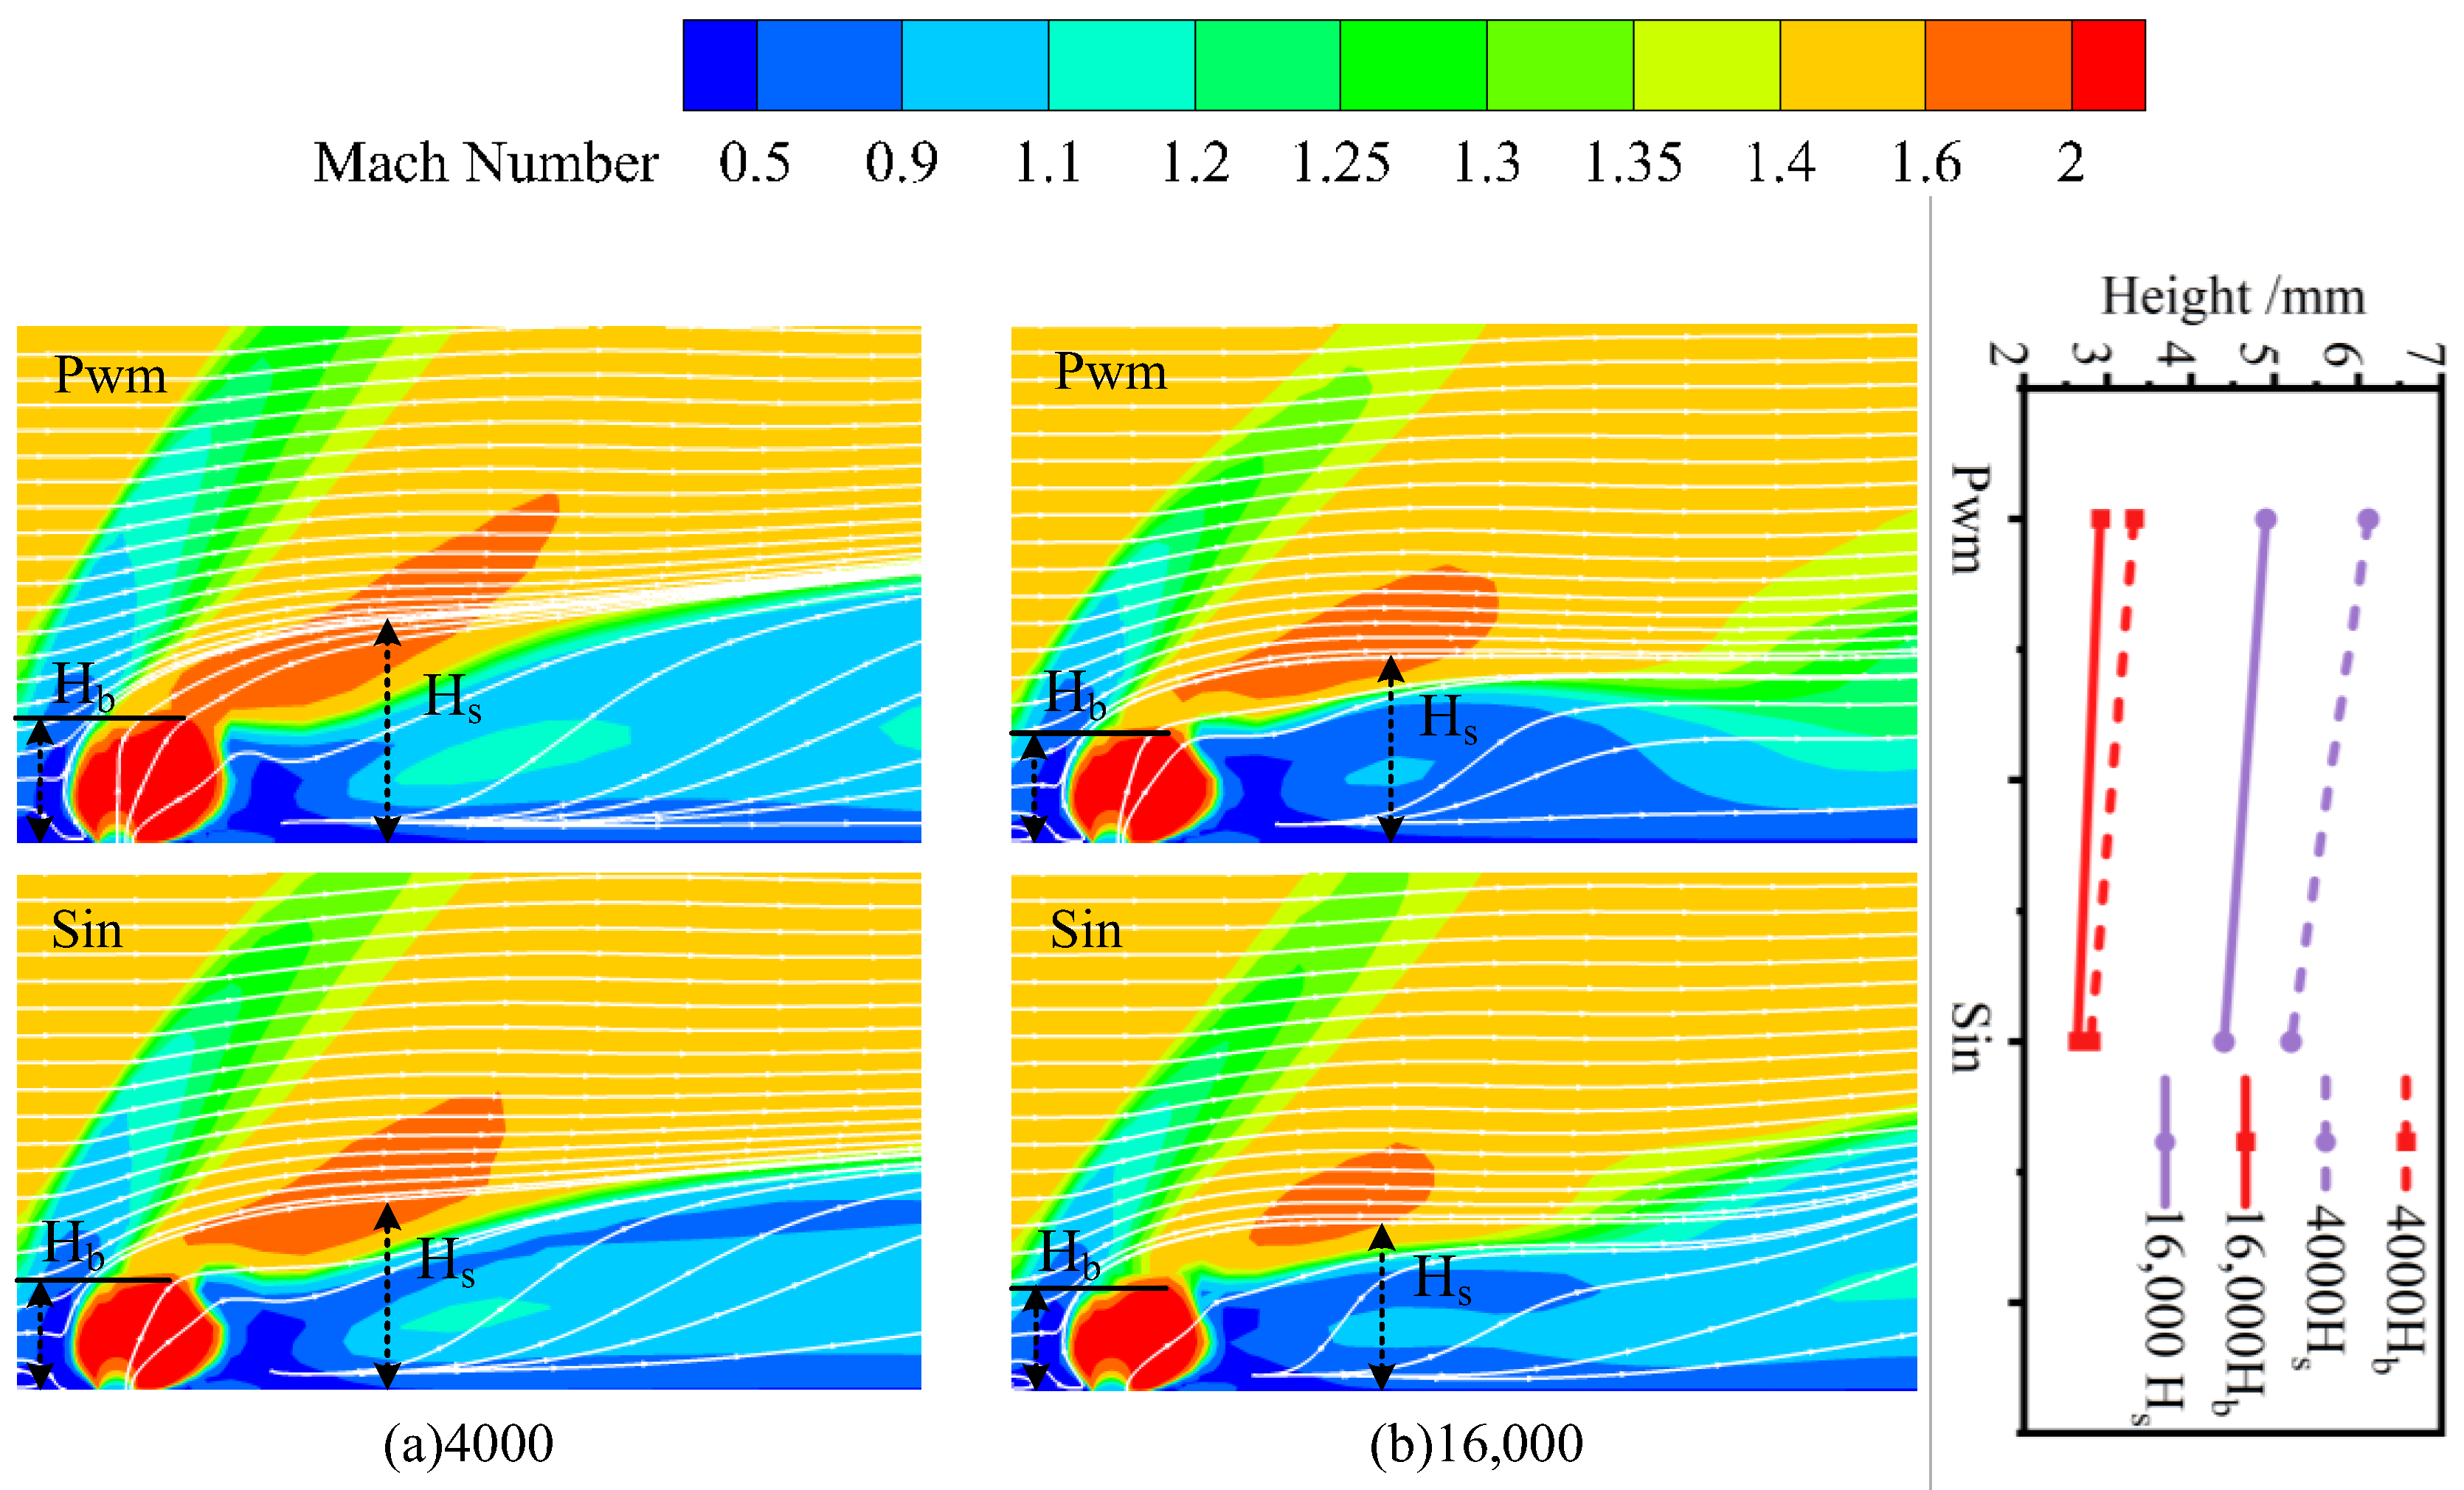
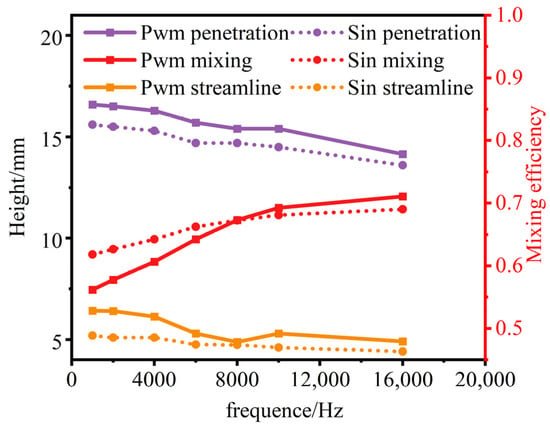
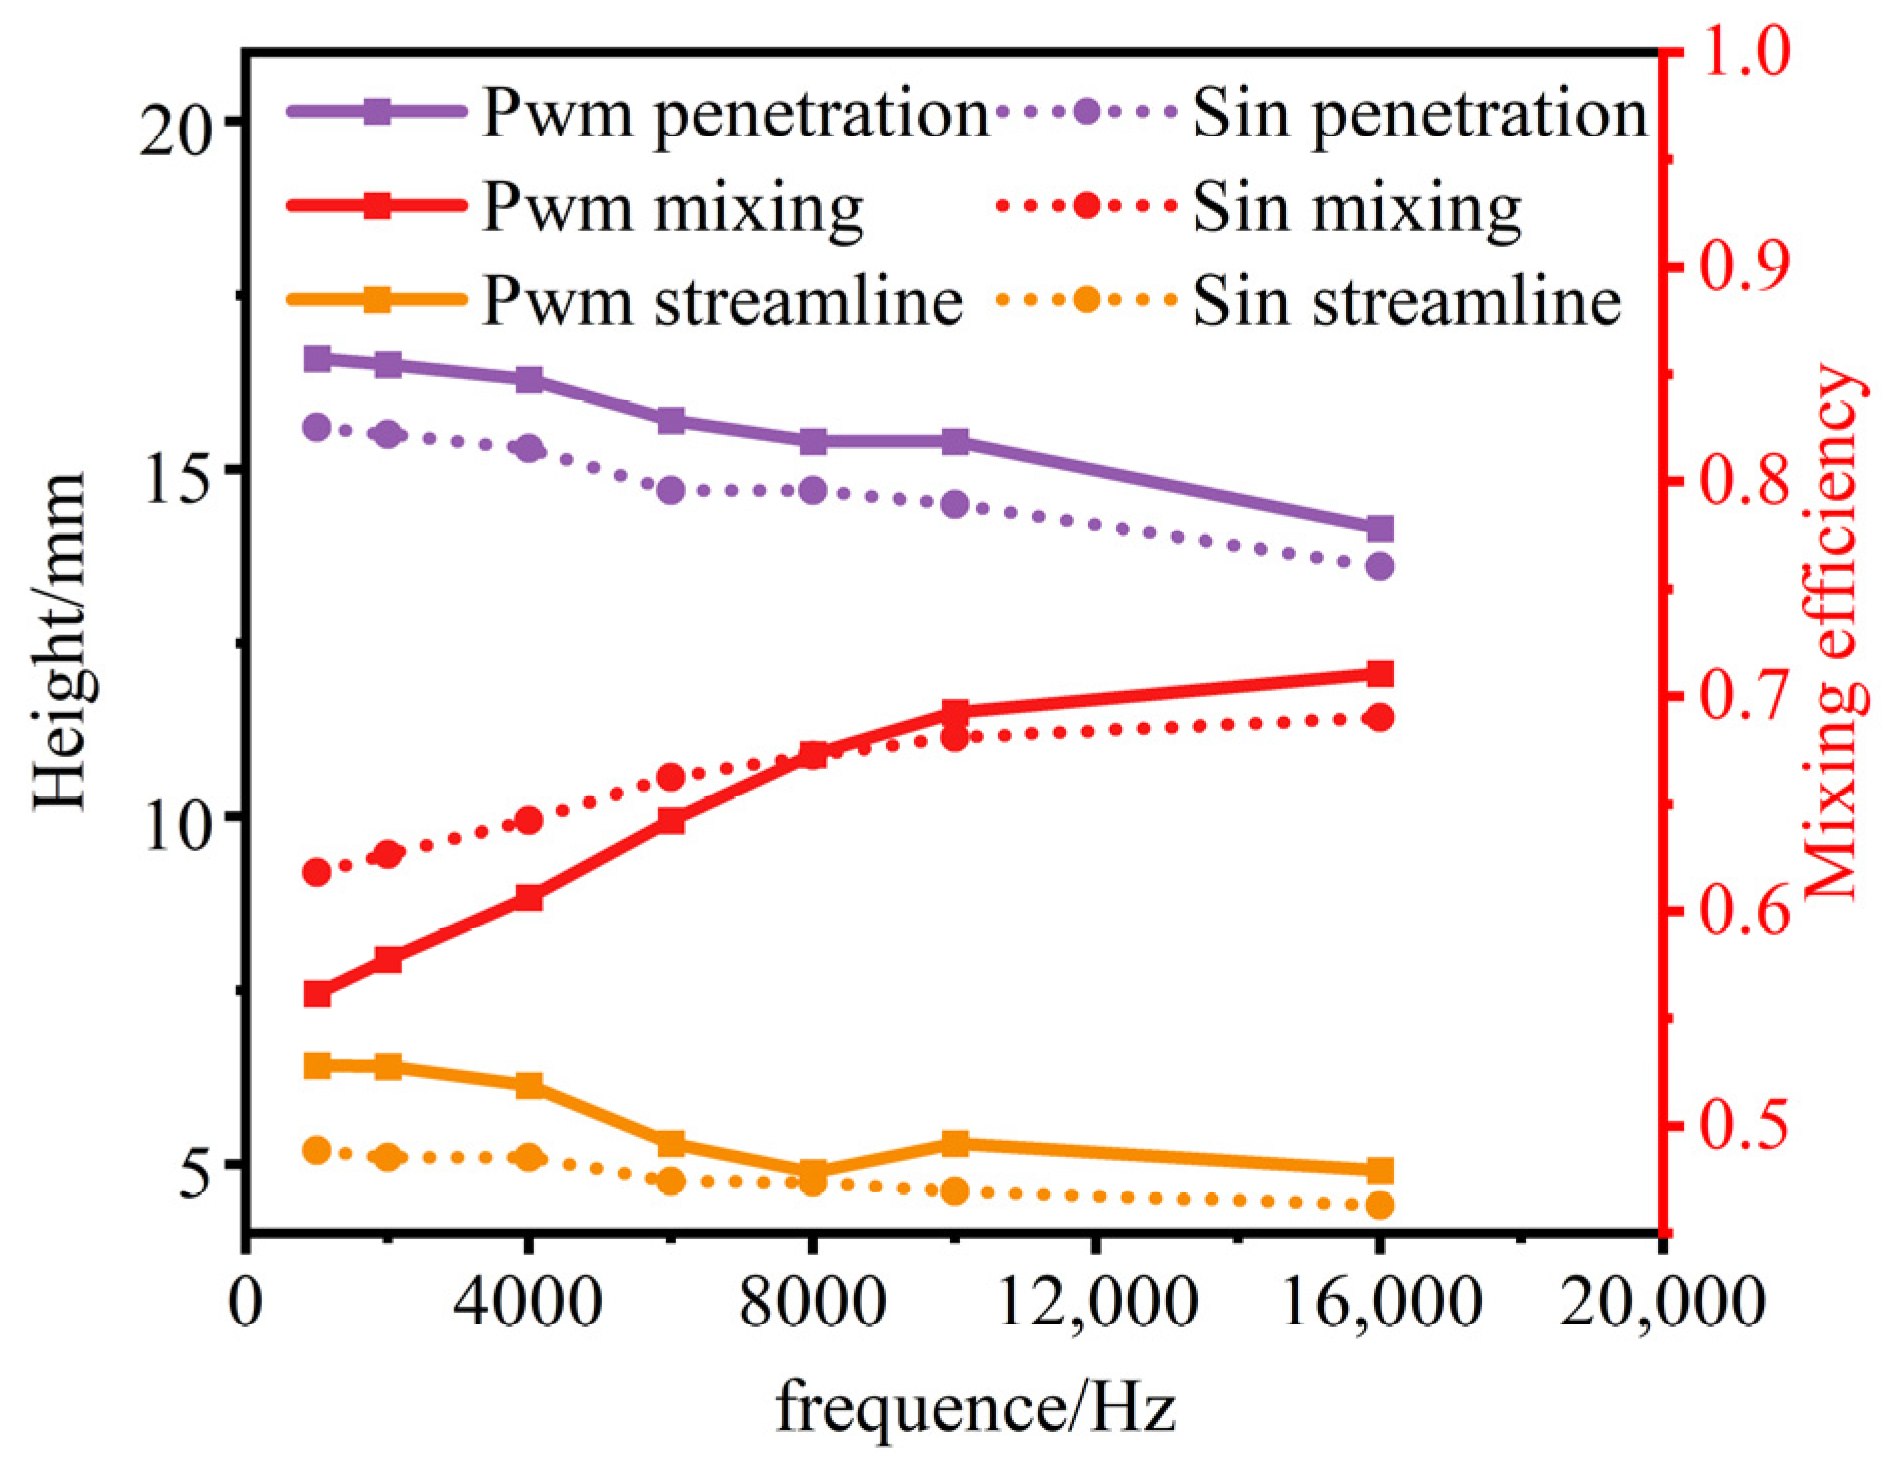
Figure 13 shows the difference in flow field structure near the nozzle under low-frequency and high-frequency pulses. Firstly, the variation trends and correlations of Mach disk height and streamline elevation height with frequency are the same for sinusoidal and square-wave pulses. Secondly, both the Mach disk height and the streamline elevation height are lower for sinusoidal pulsing than for square-wave pulsing. This shows that the ability of the sinusoidal pulse to establish a stable flow field structure near the nozzle is weaker, resulting in a weaker ability of the jet to disturb the crossflow. The square-wave pulse can establish the flow field structure near the nozzle more quickly, enhance the disturbance ability of the jet, and help to improve the mixing performance.
Figure 13.
The Mach number cloud diagram and the height change of the flow field structure under different waveforms.
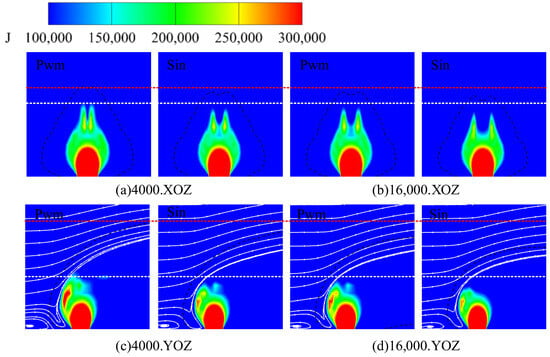
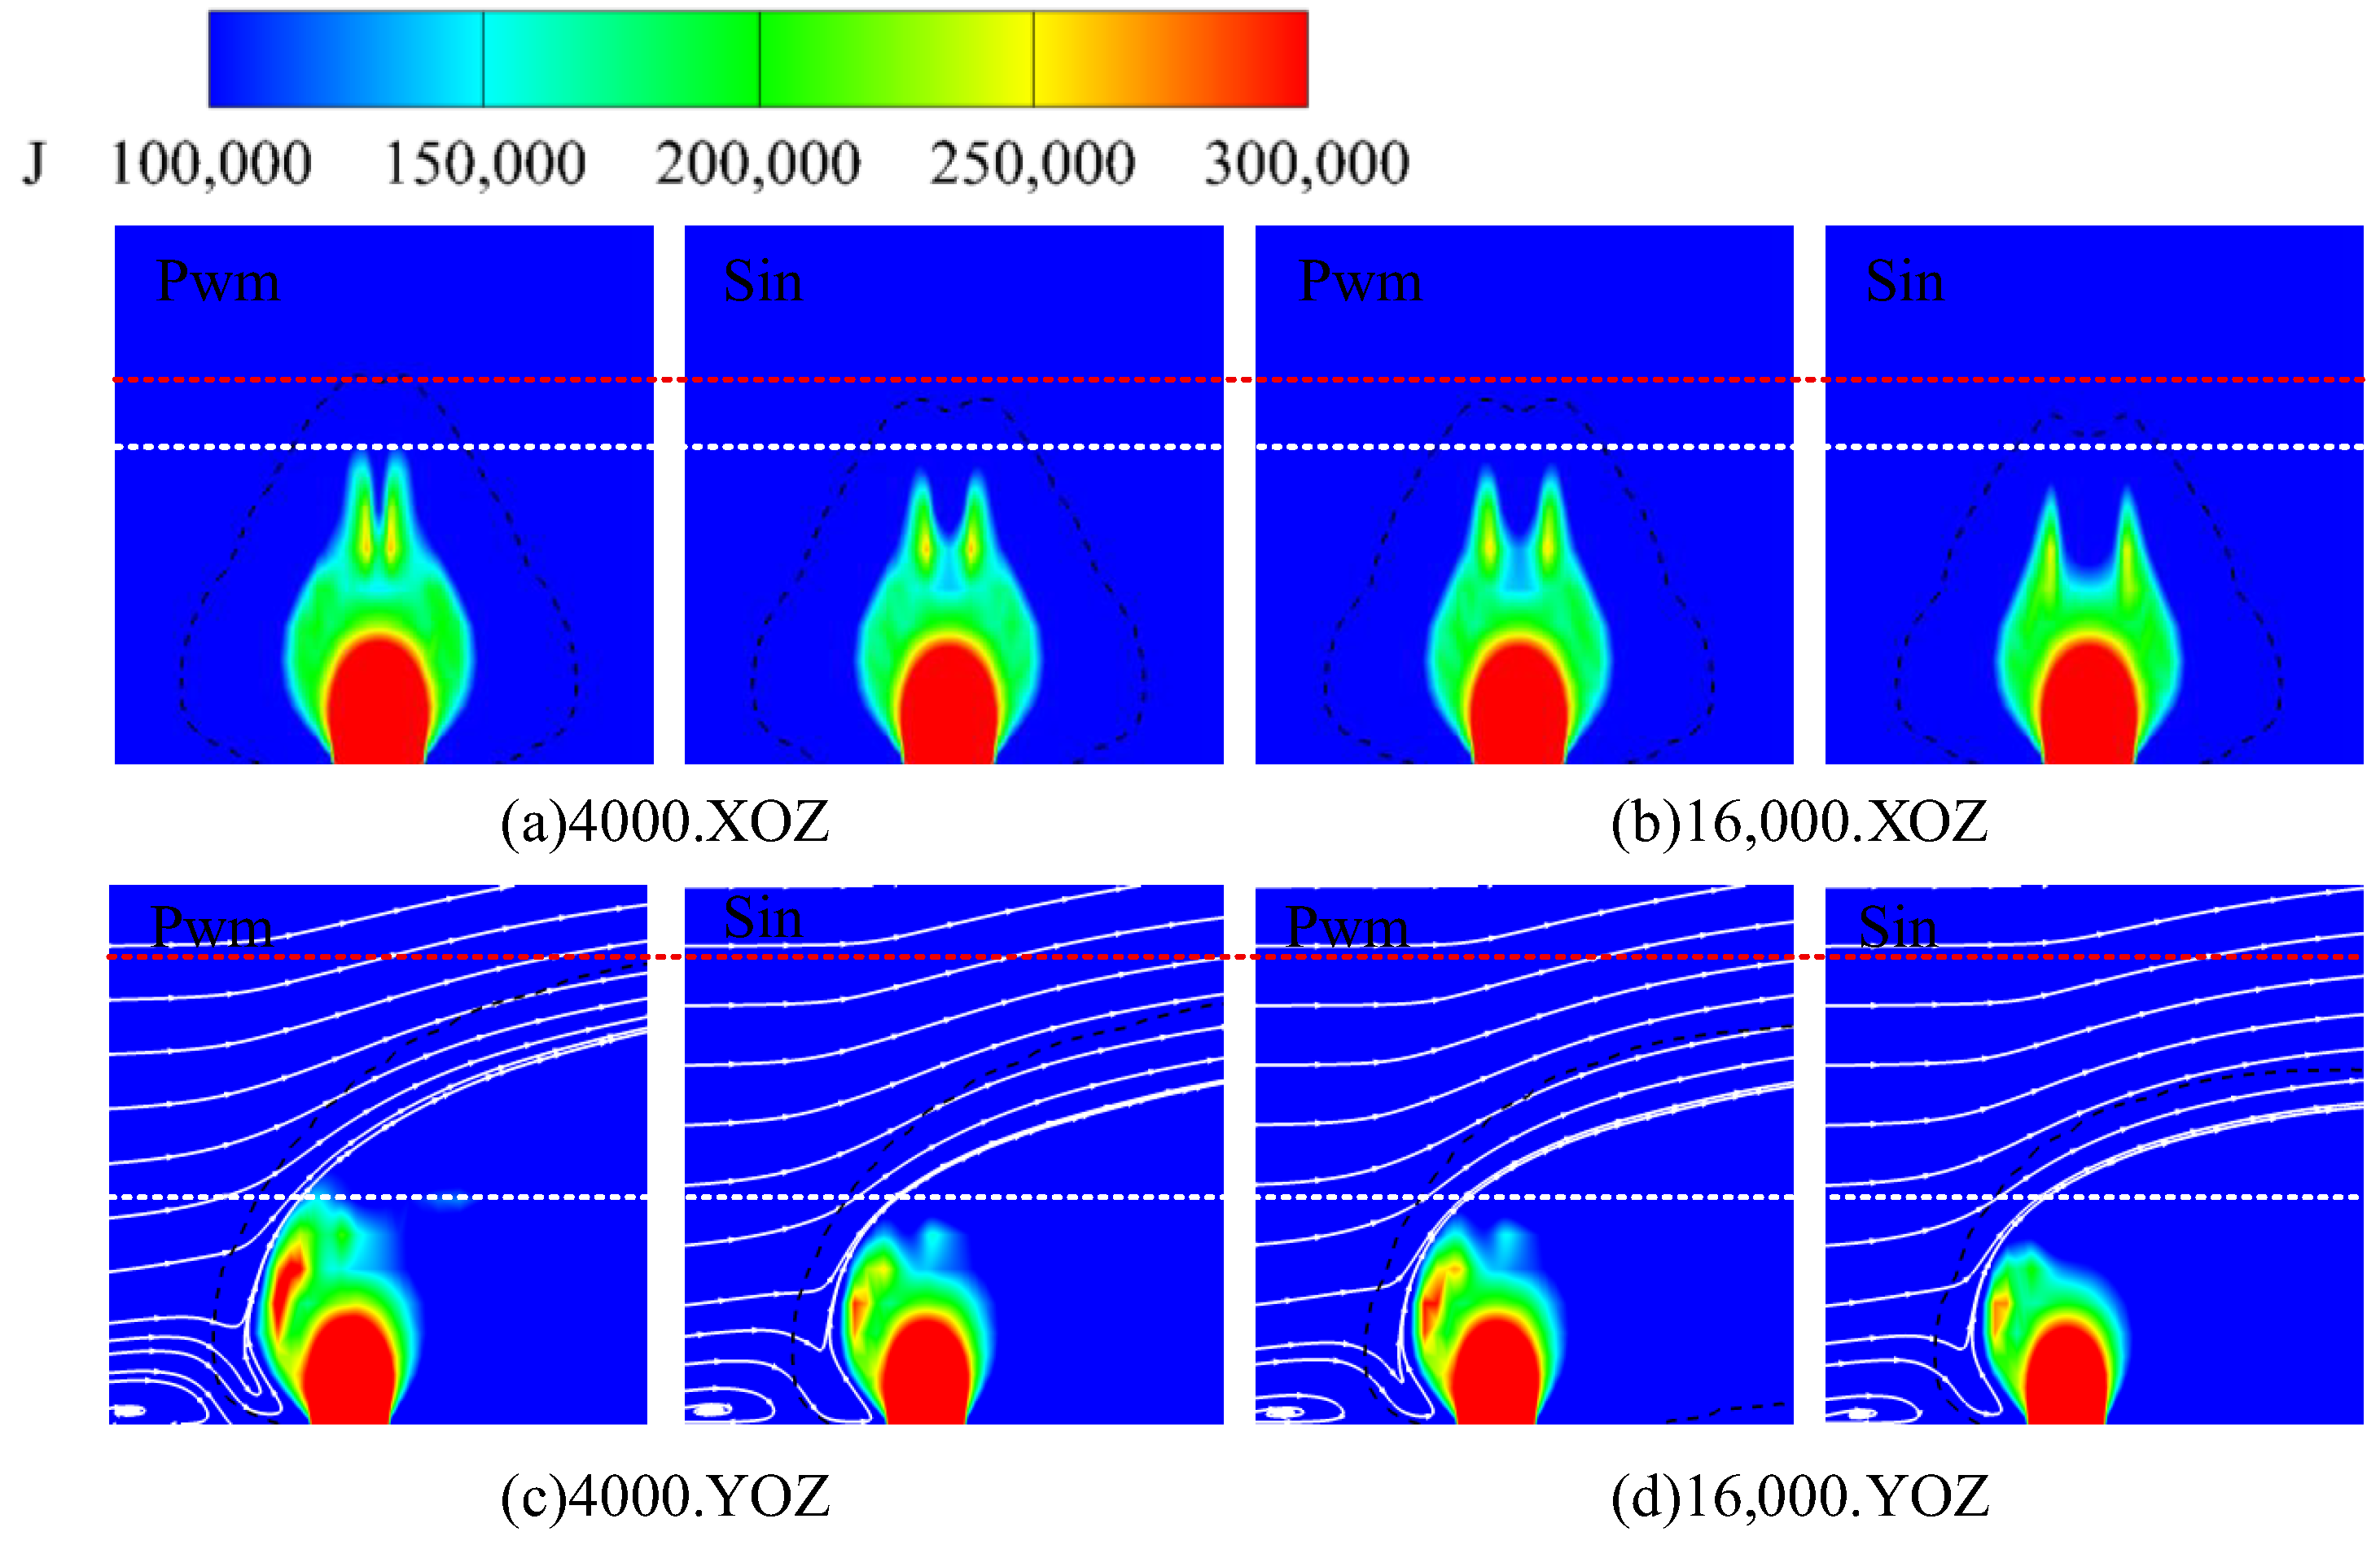
Figure 14 shows the momentum cloud images near the nozzle under different waveforms. As with the flow field structure, the momentum fields of the two waveforms also show similar trends. That is, the different waveforms at the same frequency affect the rate of flow field development. For the high-frequency square-wave pulse, its flow field structure (limited to streamline lifting capacity and Mach disk development) and momentum field are very similar to those of the low-frequency sinusoidal pulse. Therefore, square-wave and sinusoidal pulse injection can be considered to follow similar flow field establishment processes, although the establishment rate differs between the two waveforms.
Figure 14.
Momentum cloud and kerosene concentration isoline near the nozzle under different waveforms.
After discussing the differences in the flow field of different waveforms, it is necessary to further verify the influence of the flow field structure on the mixing effect by comparing the mixing effect of different waveforms. Figure 15 shows the coupling relationship between the flow field structure and the mixing effect of the pulse injection under different waveforms. It can be seen in the figure that the penetration depth of the jet and the height of the streamline elevation have the same trend, which verifies that the establishment of the stable flow field near the nozzle dominates the change in the penetration depth. Although the correspondence between jet lift height and penetration depth is not exact, the two show similar trends across the waveforms. In particular, a pronounced difference is observed at 8000 Hz, which is expected because the near-nozzle flow field is only one of the main influencing factors; there are still reasons, such as shock wave development, that lead to the fluctuation of penetration depth. Therefore, it can still be considered that different waveforms have the same correlation between jet lift height and penetration depth. It is further explained that the difference in waveforms mainly affects the penetration ability by changing the speed of establishing a stable flow field.
Figure 15.
Mixing performance and streamline elevation height under different waveforms.
With the change in frequency, it can be found that the difference in uplift capacity between different waveforms is gradually narrowing, and the difference in penetration depth also has a narrowing trend. For the mixing effect of different waveforms, the square-wave pulse always shows superiority in penetration depth. In terms of mixing efficiency, square-wave pulses exhibit higher mixing performance at medium and high frequencies. This is because the intermittent kerosene injection of the square-wave pulse at low frequencies makes the kerosene distribution too concentrated. In the medium- and high-frequency states, the difference between the sinusoidal and square-wave pulse jets in the kerosene concentration can be ignored. However, the penetration depth of the square-wave pulse injection is higher than that of the sinusoidal pulse injection. Therefore, the mixing efficiency of square-wave pulse jets at medium and high frequencies is higher. In summary, it can be considered that the square-wave pulse relies on the intermittent continuous output of high momentum to quickly establish the flow field structure near the nozzle, thereby obtaining a better penetration ability than the sinusoidal pulse. In particular, the square-wave pulse injection at medium and high frequencies provides advantages in both penetration depth and mixing efficiency.
Initially, the square-wave pulse is stronger than the sinusoidal pulse injection. At much higher frequencies, many studies have pointed out that when the frequency becomes sufficiently high, the flow approaches steady injection. For the penetration depth, it slowly and continuously decreases until it is close to that of steady injection. For the mixing efficiency, it shows a trend of mixing enhancement at a decreasing rate over the explored frequency range, and the mixing efficiency is significantly higher than that of steady injection. This indicates that there is an optimal mixing frequency under the combined effects of improving mixing uniformity and decreasing penetration depth.
3.3. Analysis of Selection Criteria for Mixing Performance of Square-Wave Pulse Injection
One of the core ideas of pulse injection is to increase the penetration depth by increasing the injection pressure under the same kerosene flow rate. However, increasing the injection pressure requires a corresponding reduction in the pulse duty cycle. Limited by the continuity of kerosene in the flow field, the duty cycle cannot be reduced indefinitely.
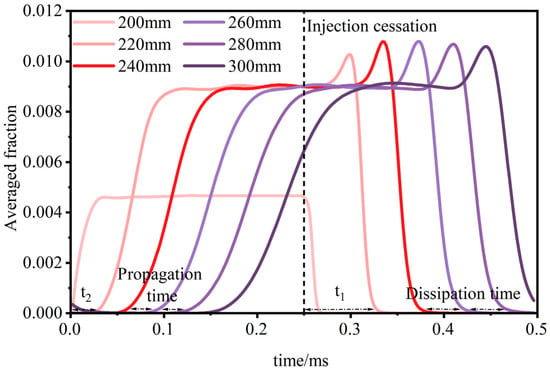
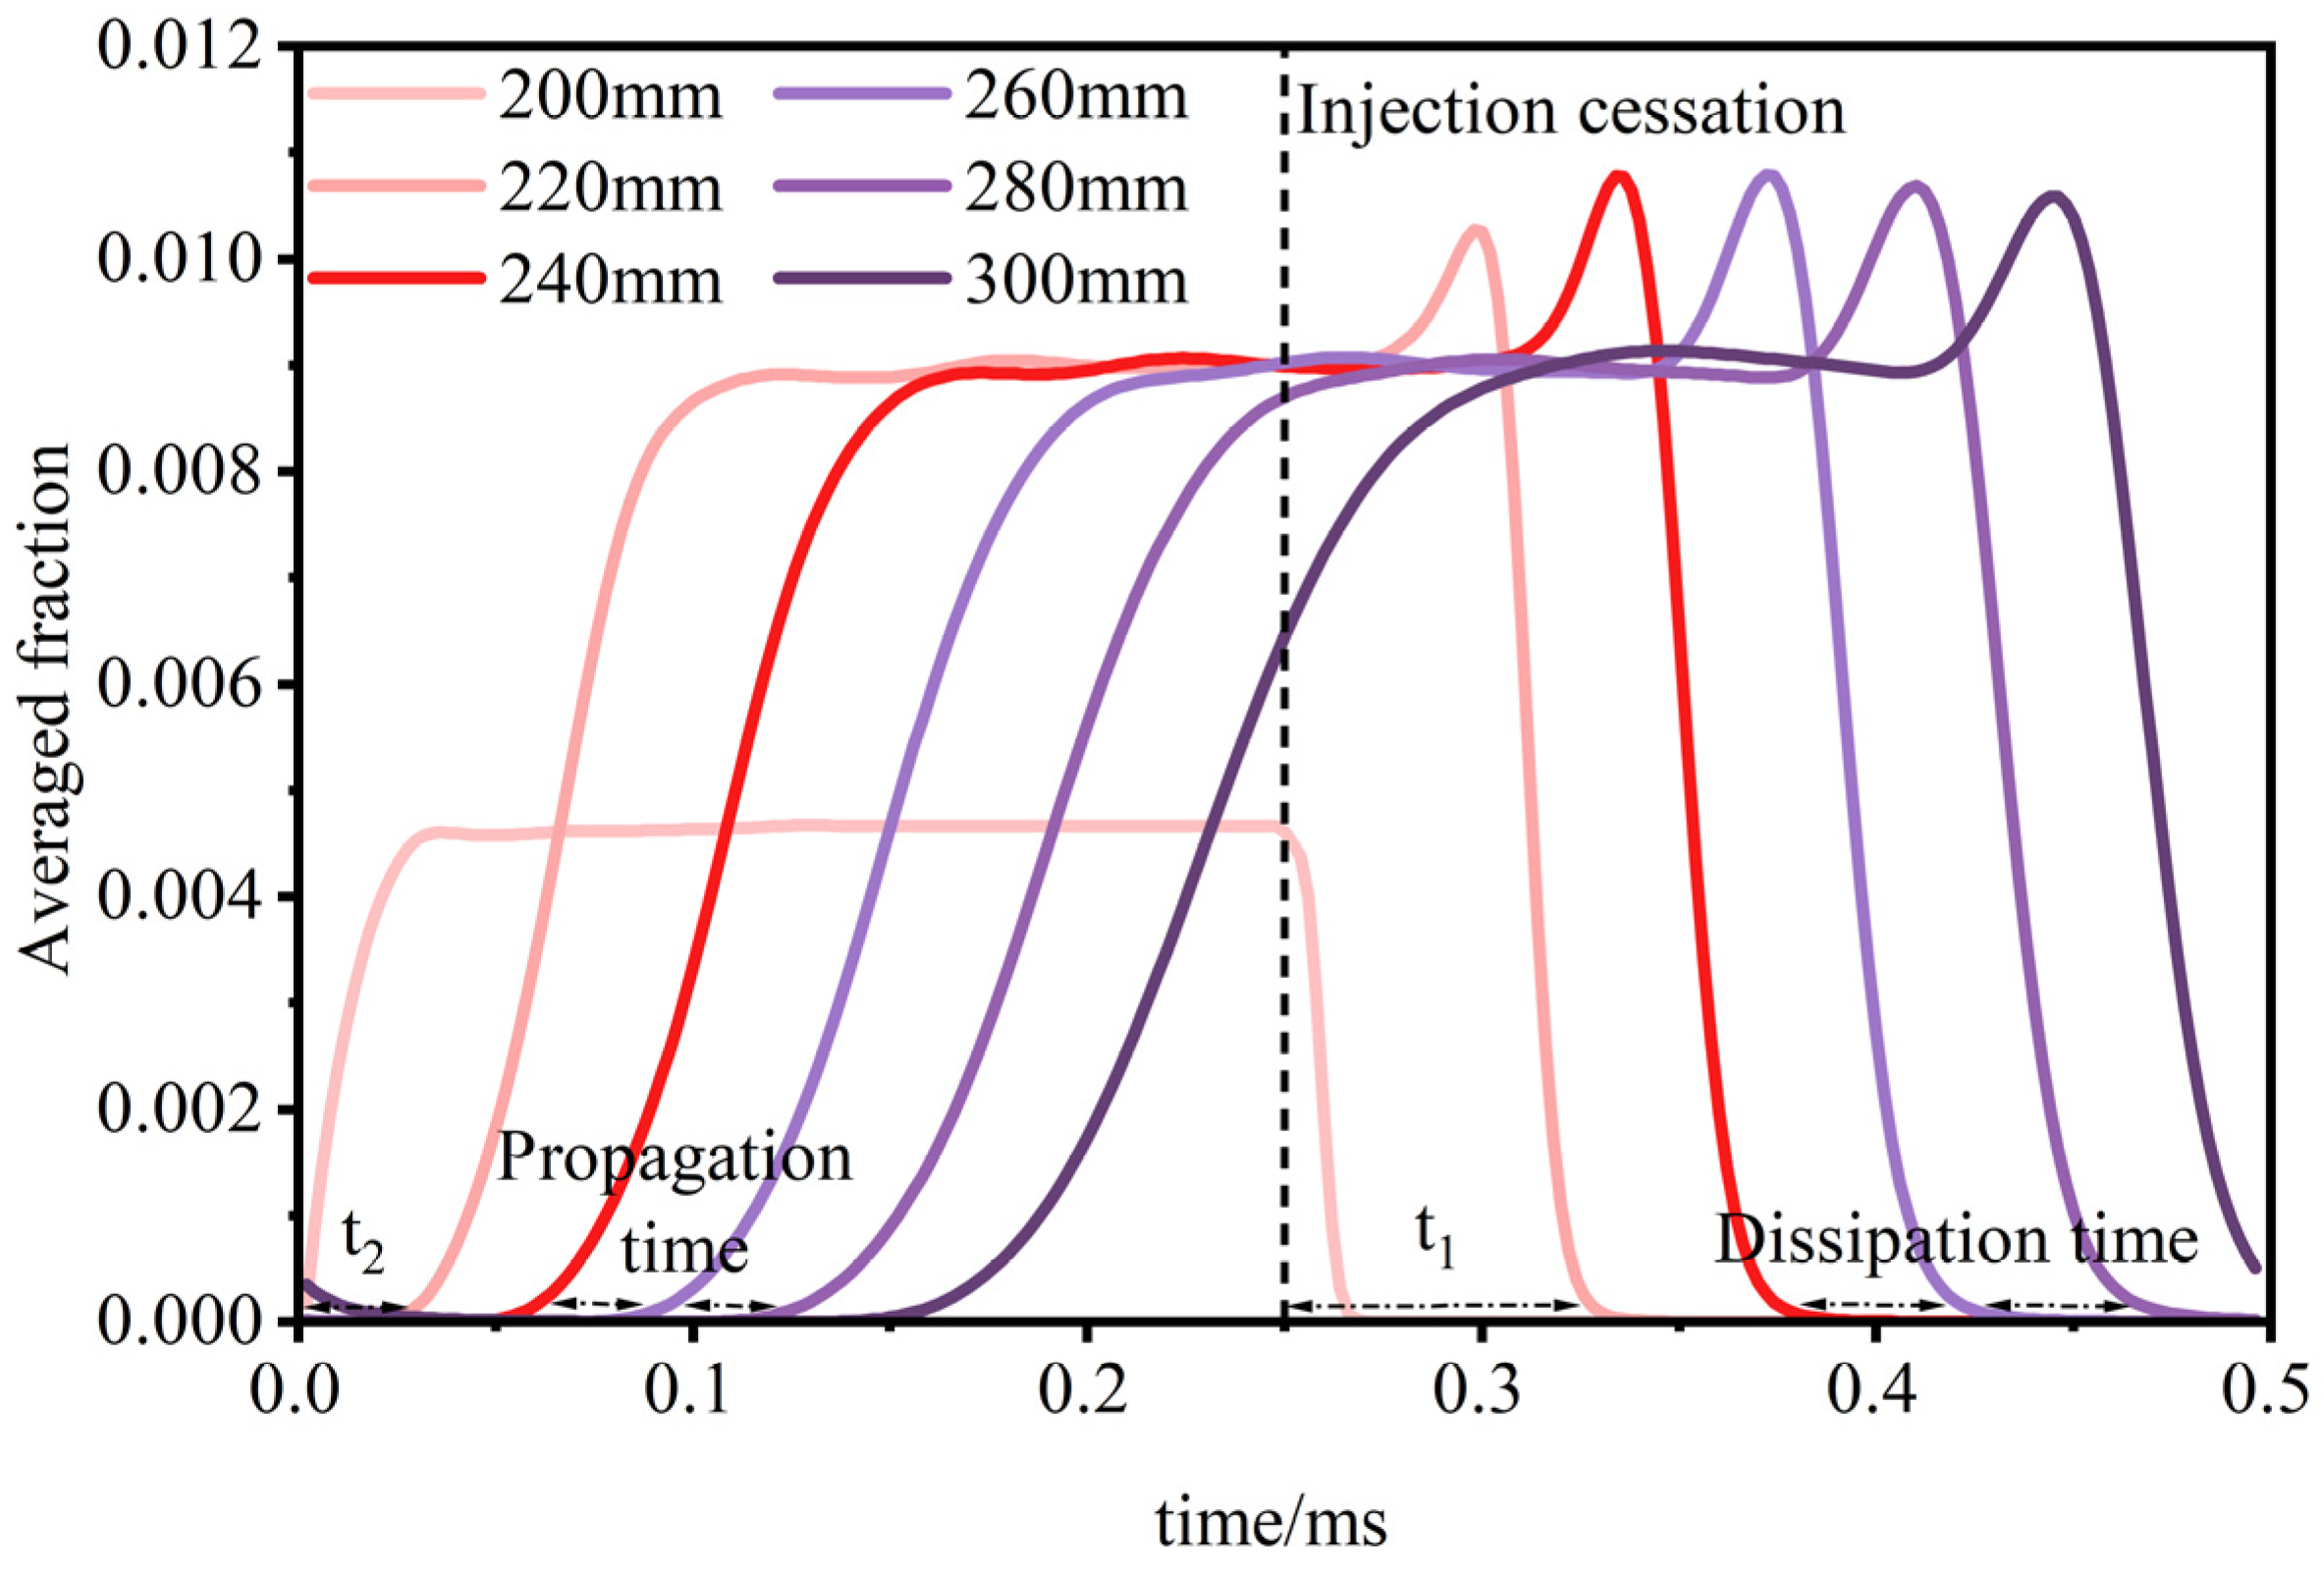
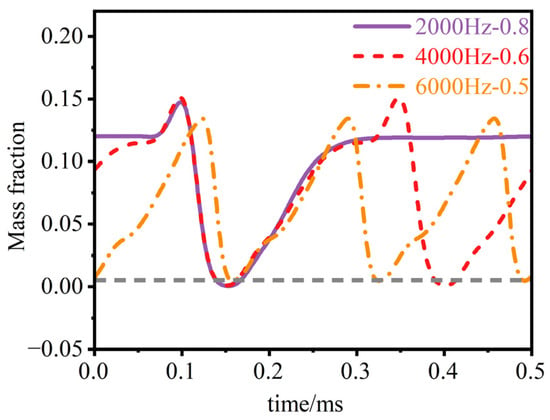
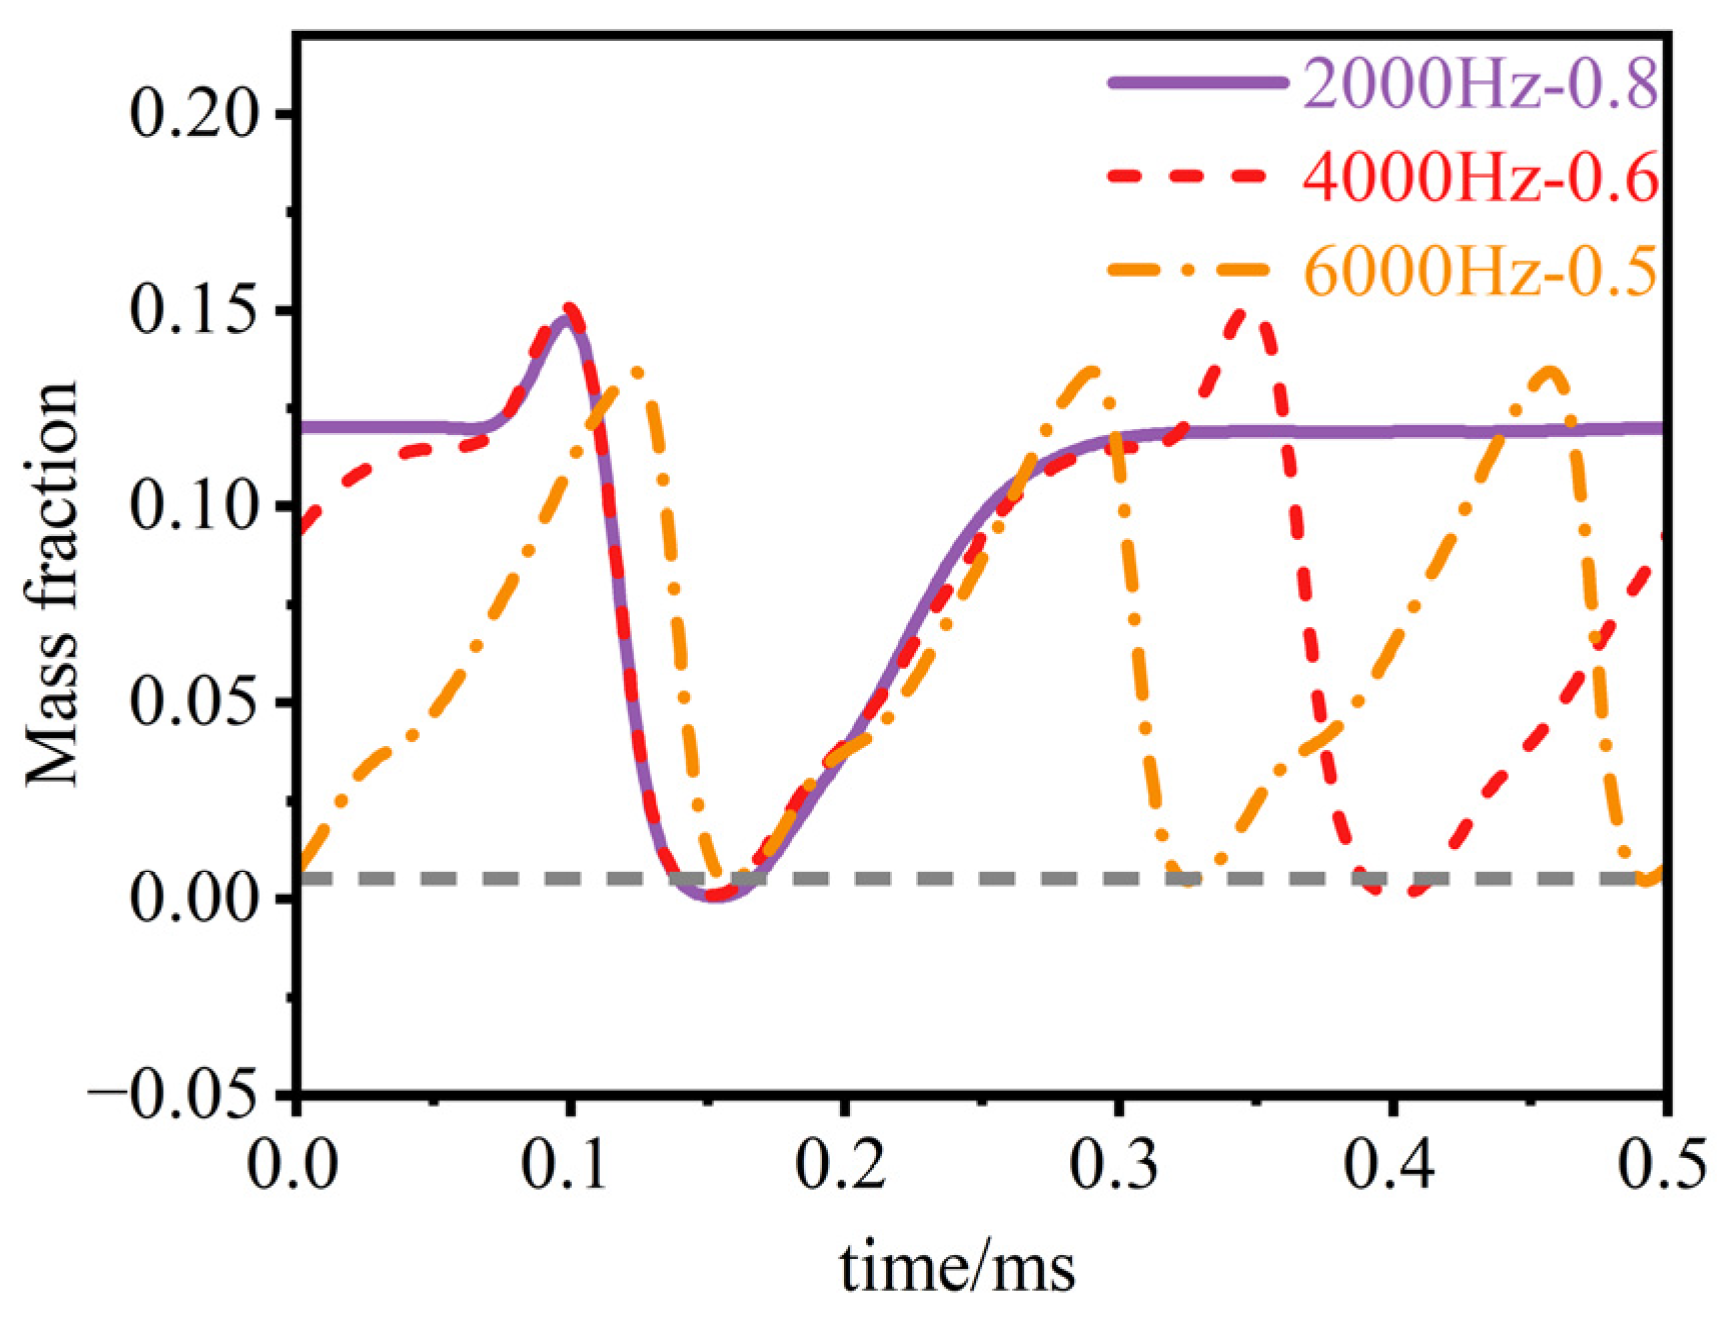
At the jet-continuity limit, the continuity between the two jets is poor and the mutual influence is small. Therefore, before y = 300 mm, the propagation and dissipation of kerosene are the same under different boundary conditions. The flow law associated with this boundary condition can therefore be characterized by examining kerosene propagation and dissipation under discontinuous injection conditions. In order to explore the law of kerosene propagation and dissipation under discontinuous conditions, the average fraction at each of the six sections between y = 200 mm and 300 mm is monitored to represent the kerosene quantity at that section. Figure 16 shows the variation law of the average fraction at each section perpendicular to the flow direction of pulse injection at 2000 Hz. By comparing the propagation time and dissipation time between adjacent sections, it is found that whether it is propagation or dissipation, it takes a certain amount of time for the kerosene to develop to a stable state, and the time required for propagation is significantly less than the time required for dissipation. Between y = 200 and 220 mm, the dissipation speed of kerosene is slower than the subsequent dissipation speed, but as the kerosene develops downstream, the propagation and dissipation speeds tend to be stable, and the dissipation speed of kerosene is significantly lower than the propagation speed of kerosene. This is because there is a high fraction of kerosene between y = 200 mm and 220 mm, and it takes a longer time to disperse the kerosene in this area. It also shows that this area is an important region in which to improve the continuity of pulse injection. With the development of kerosene, the distribution of kerosene shows stable and low-fraction characteristics, so the propagation speed is low and tends to be stable.
Figure 16.
The change in averaged fraction at each section along the flow direction.
Based on the above conclusions, the high-concentration region near the nozzle, extending from y = 200 mm to 220 mm, is represented using a characteristic constant. It can be deduced that the relationship between duty cycle and frequency can be approximated as follows:
It can be seen from the formula that the duty cycle and frequency approximately show a linear relationship with respect to the kerosene continuity limit. To account for effective penetration depth, acceptable continuity is defined as a kerosene mass fraction of no less than 0.005 throughout the entire cycle at the point x = 15 mm, y = 300 mm, and z = 5 mm. The monitoring point is established at x = 15 mm, y = 300 mm, z = 5 mm. Figure 17 shows three sets of data that are more consistent with the continuity boundary based on the working conditions.
Figure 17.
Continuous condition.
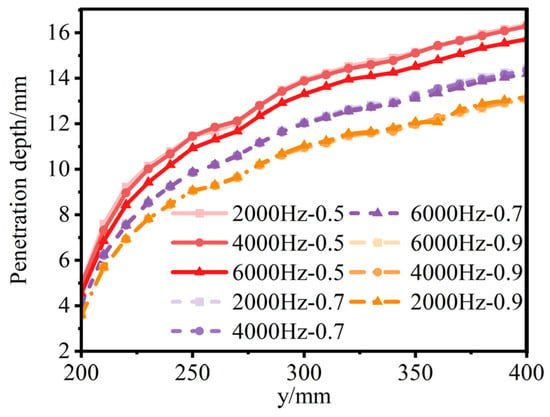
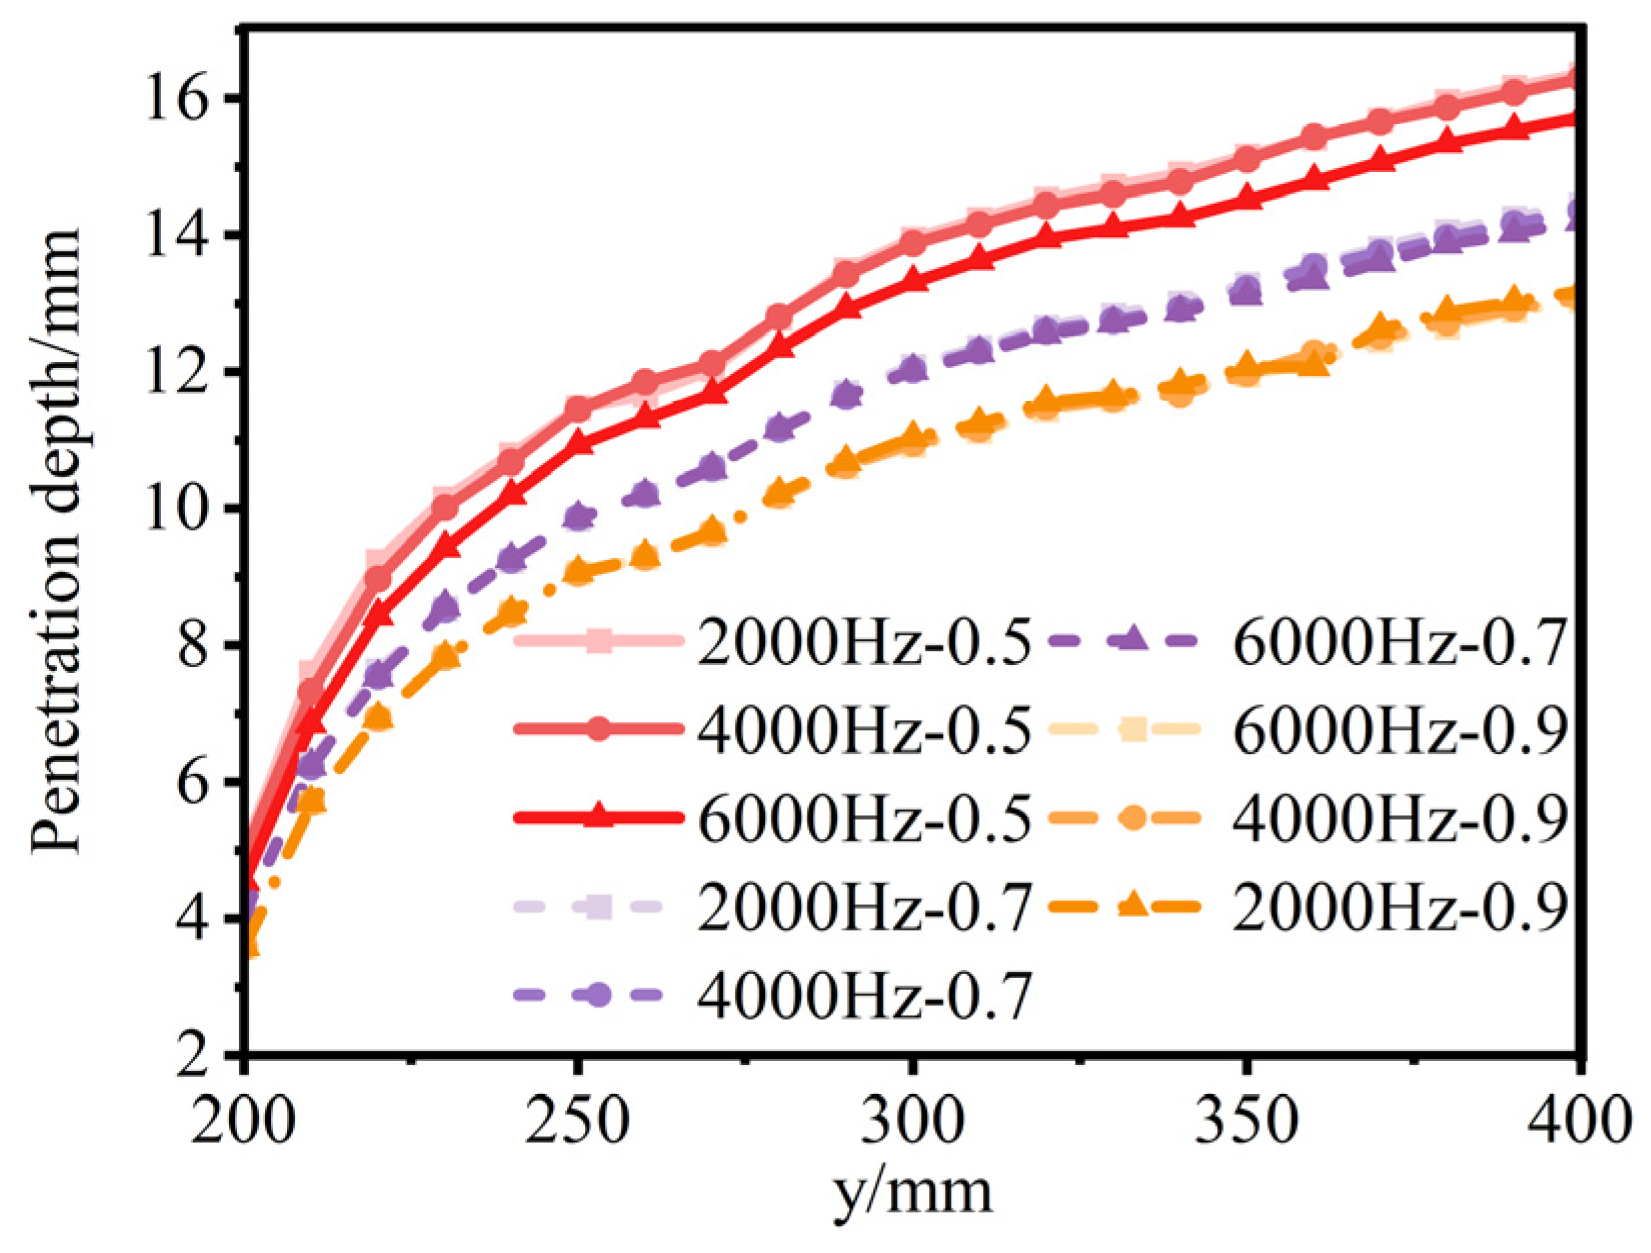
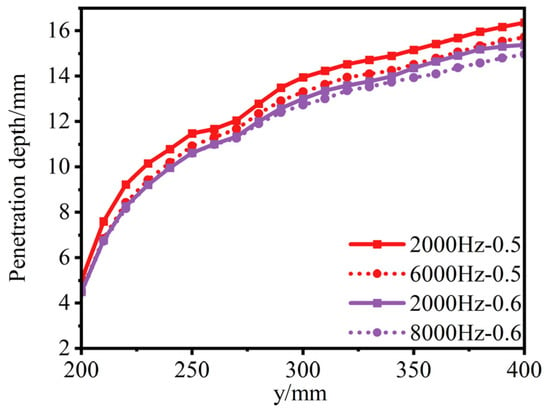
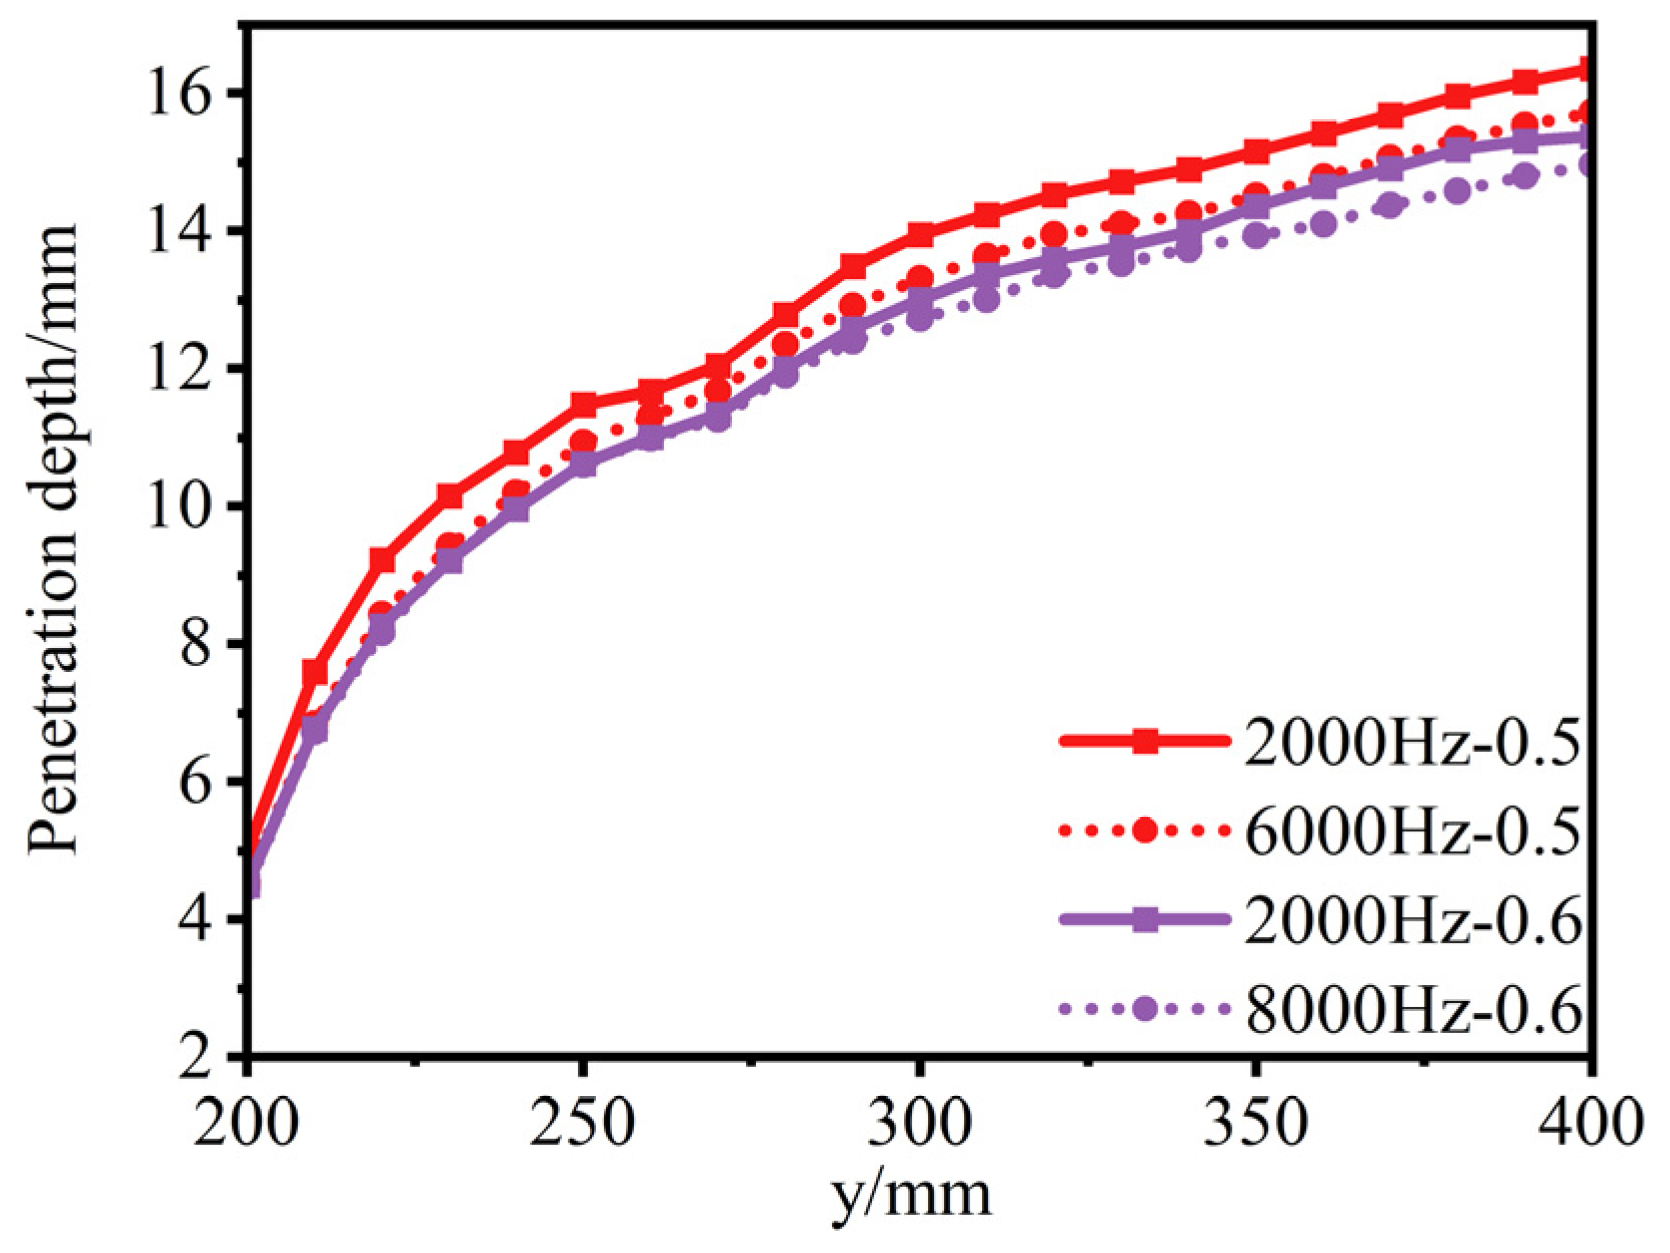
The above discussion proposes that there is a critical frequency at which the penetration depth changes with frequency at a duty cycle of 0.5. When the critical frequency is exceeded, the penetration depth begins to decrease. Figure 18 shows the variation of penetration depth with frequency under different duty cycles. When the duty cycle increases from 0.5 to 0.7, the penetration depth decrease starting at 6000 Hz almost disappears. When the duty cycle reaches 0.9, the decrease in penetration depth has completely disappeared. This is because although the frequency does not change, the increase in the duty cycle increases the establishment time of the flow field near the nozzle, allowing it to fully develop into a stable flow field. Therefore, the penetration depth does not change with the frequency. The critical frequency under different duty cycles can be preliminarily judged based on the mechanism of stable flow field establishment near the nozzle. For example, for a duty cycle of 0.6, the critical frequency should be between 7200 and 7500 Hz. As shown in Figure 19, the critical frequency condition at a duty cycle of 0.6 is obtained by further comparison. It is verified that when the frequency at a duty cycle of 0.6 is 8000 Hz, the weakening of penetration depth is similar to that at a duty cycle of 0.5 and a frequency of 6000 Hz. This shows that the general trend can be predicted according to the establishment time of the flow field.
Figure 18.
The change in pulse jet penetration depth with frequency under different duty cycles.
Figure 19.
The change in pulse jet penetration depth with frequency at 0.5 and 0.6 duty cycles.
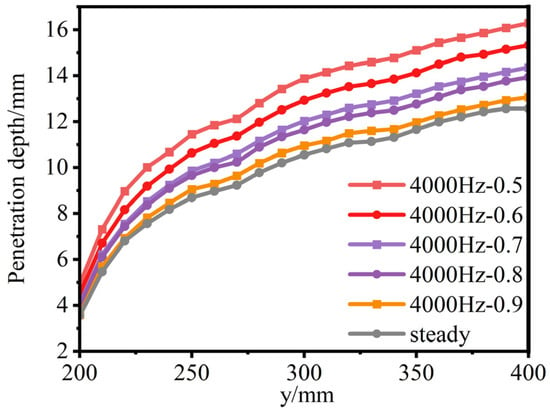
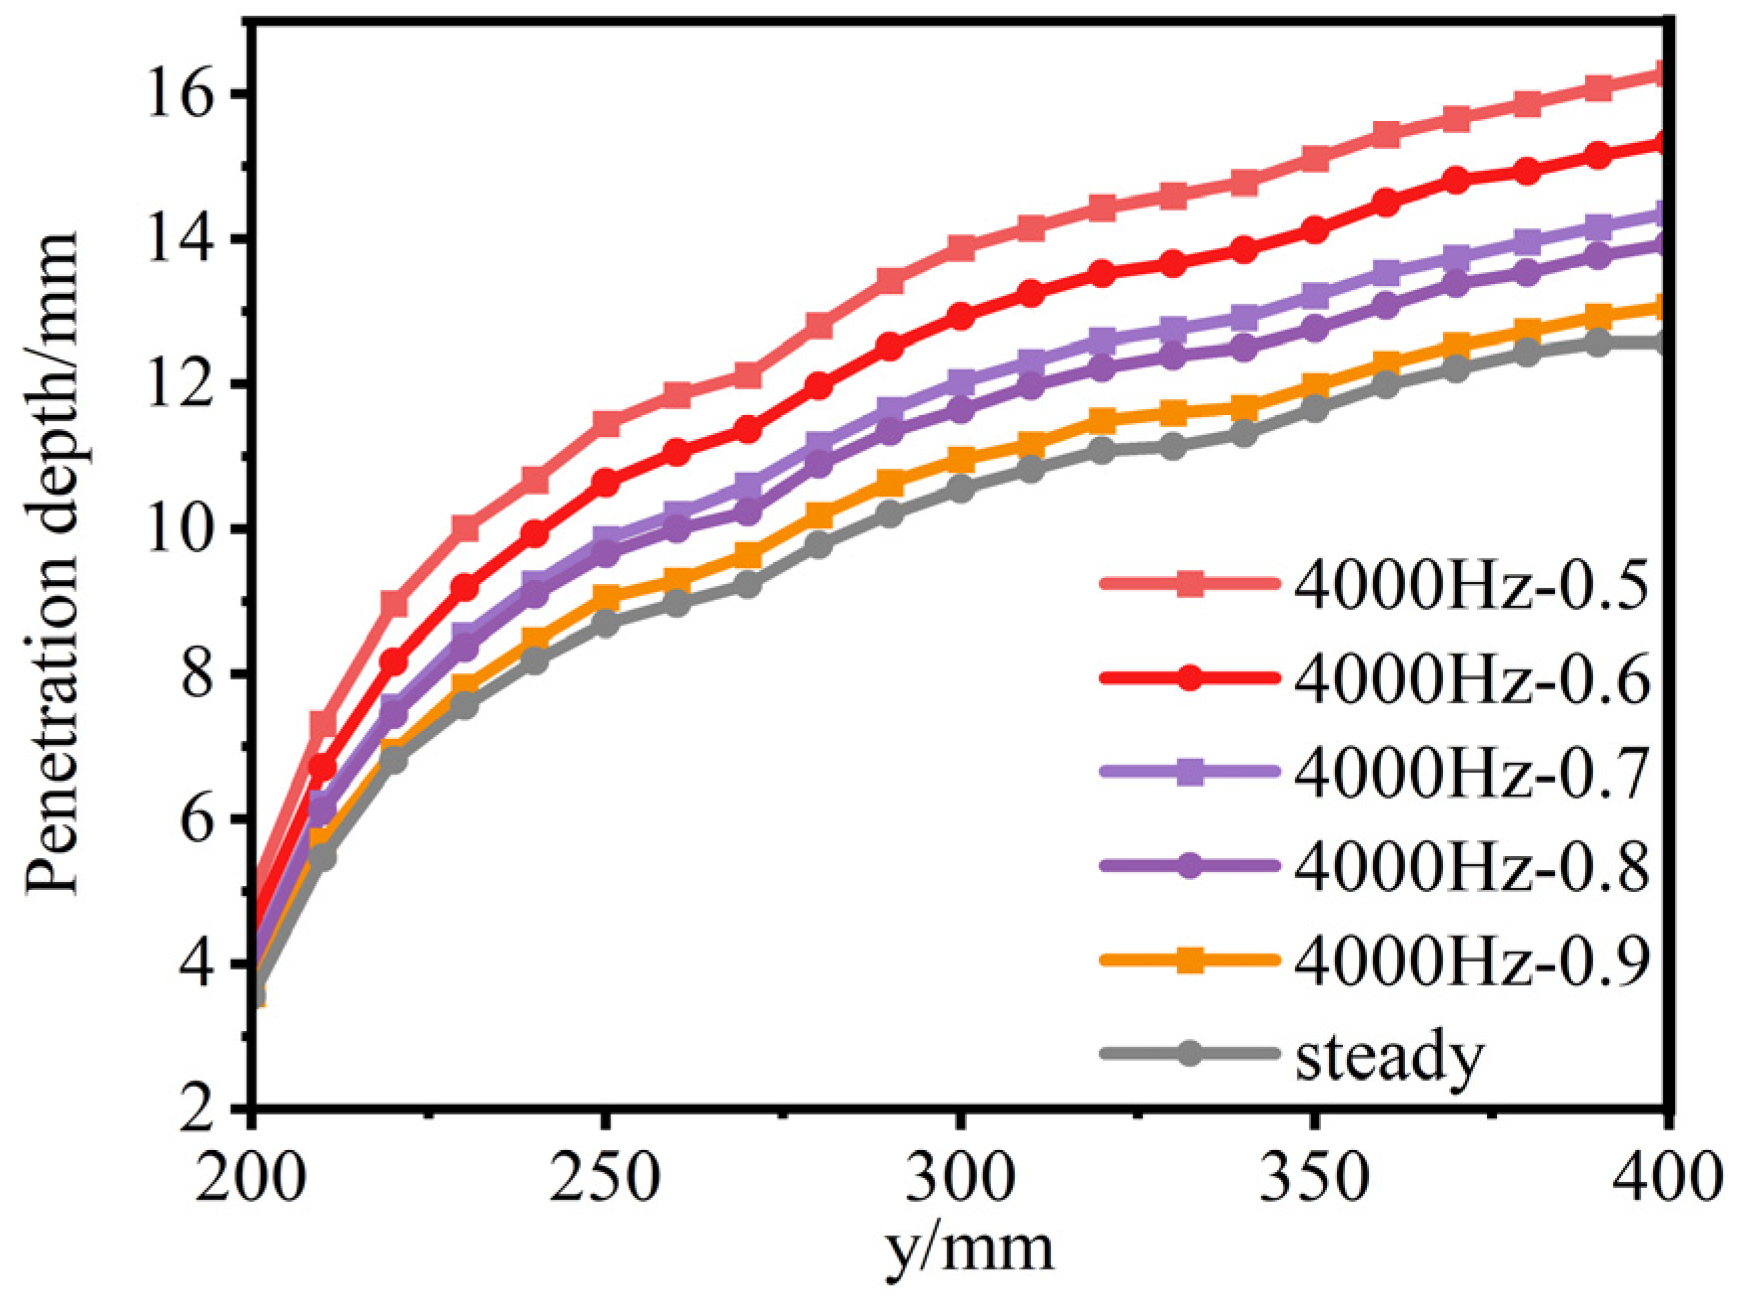
Based on the conclusion that the penetration depth does not change with the change in frequency at low frequencies, Figure 20 shows pulse jet penetration depth at 4000 Hz over different duty cycles, thereby providing a further reference for pulse parameter selection. When the duty cycle changes between 0.5 and 0.6, between 0.6 and 0.7, and between 0.8 and 0.9, the decrease in penetration depth is the same. When the duty cycle changes between 0.7 and 0.8 and between 0.9 and 1, the penetration depth decreases very little. This shows that the penetration depth of pulse injection at a duty cycle of 0.9 is similar to that of steady injection, and the selection of 0.7 and 0.8 duty cycles does not need to consider the change in penetration depth.
Figure 20.
Comparison of pulse penetration depths of different duty cycles in steady state.
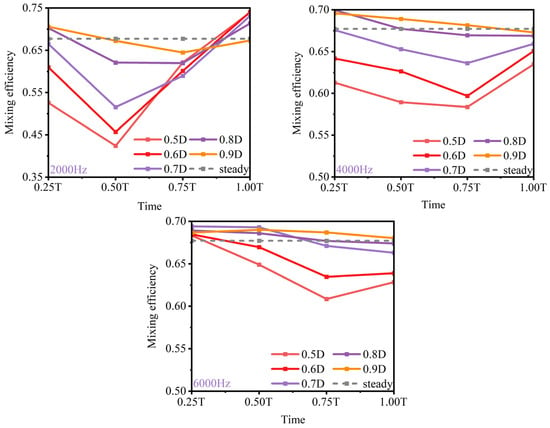
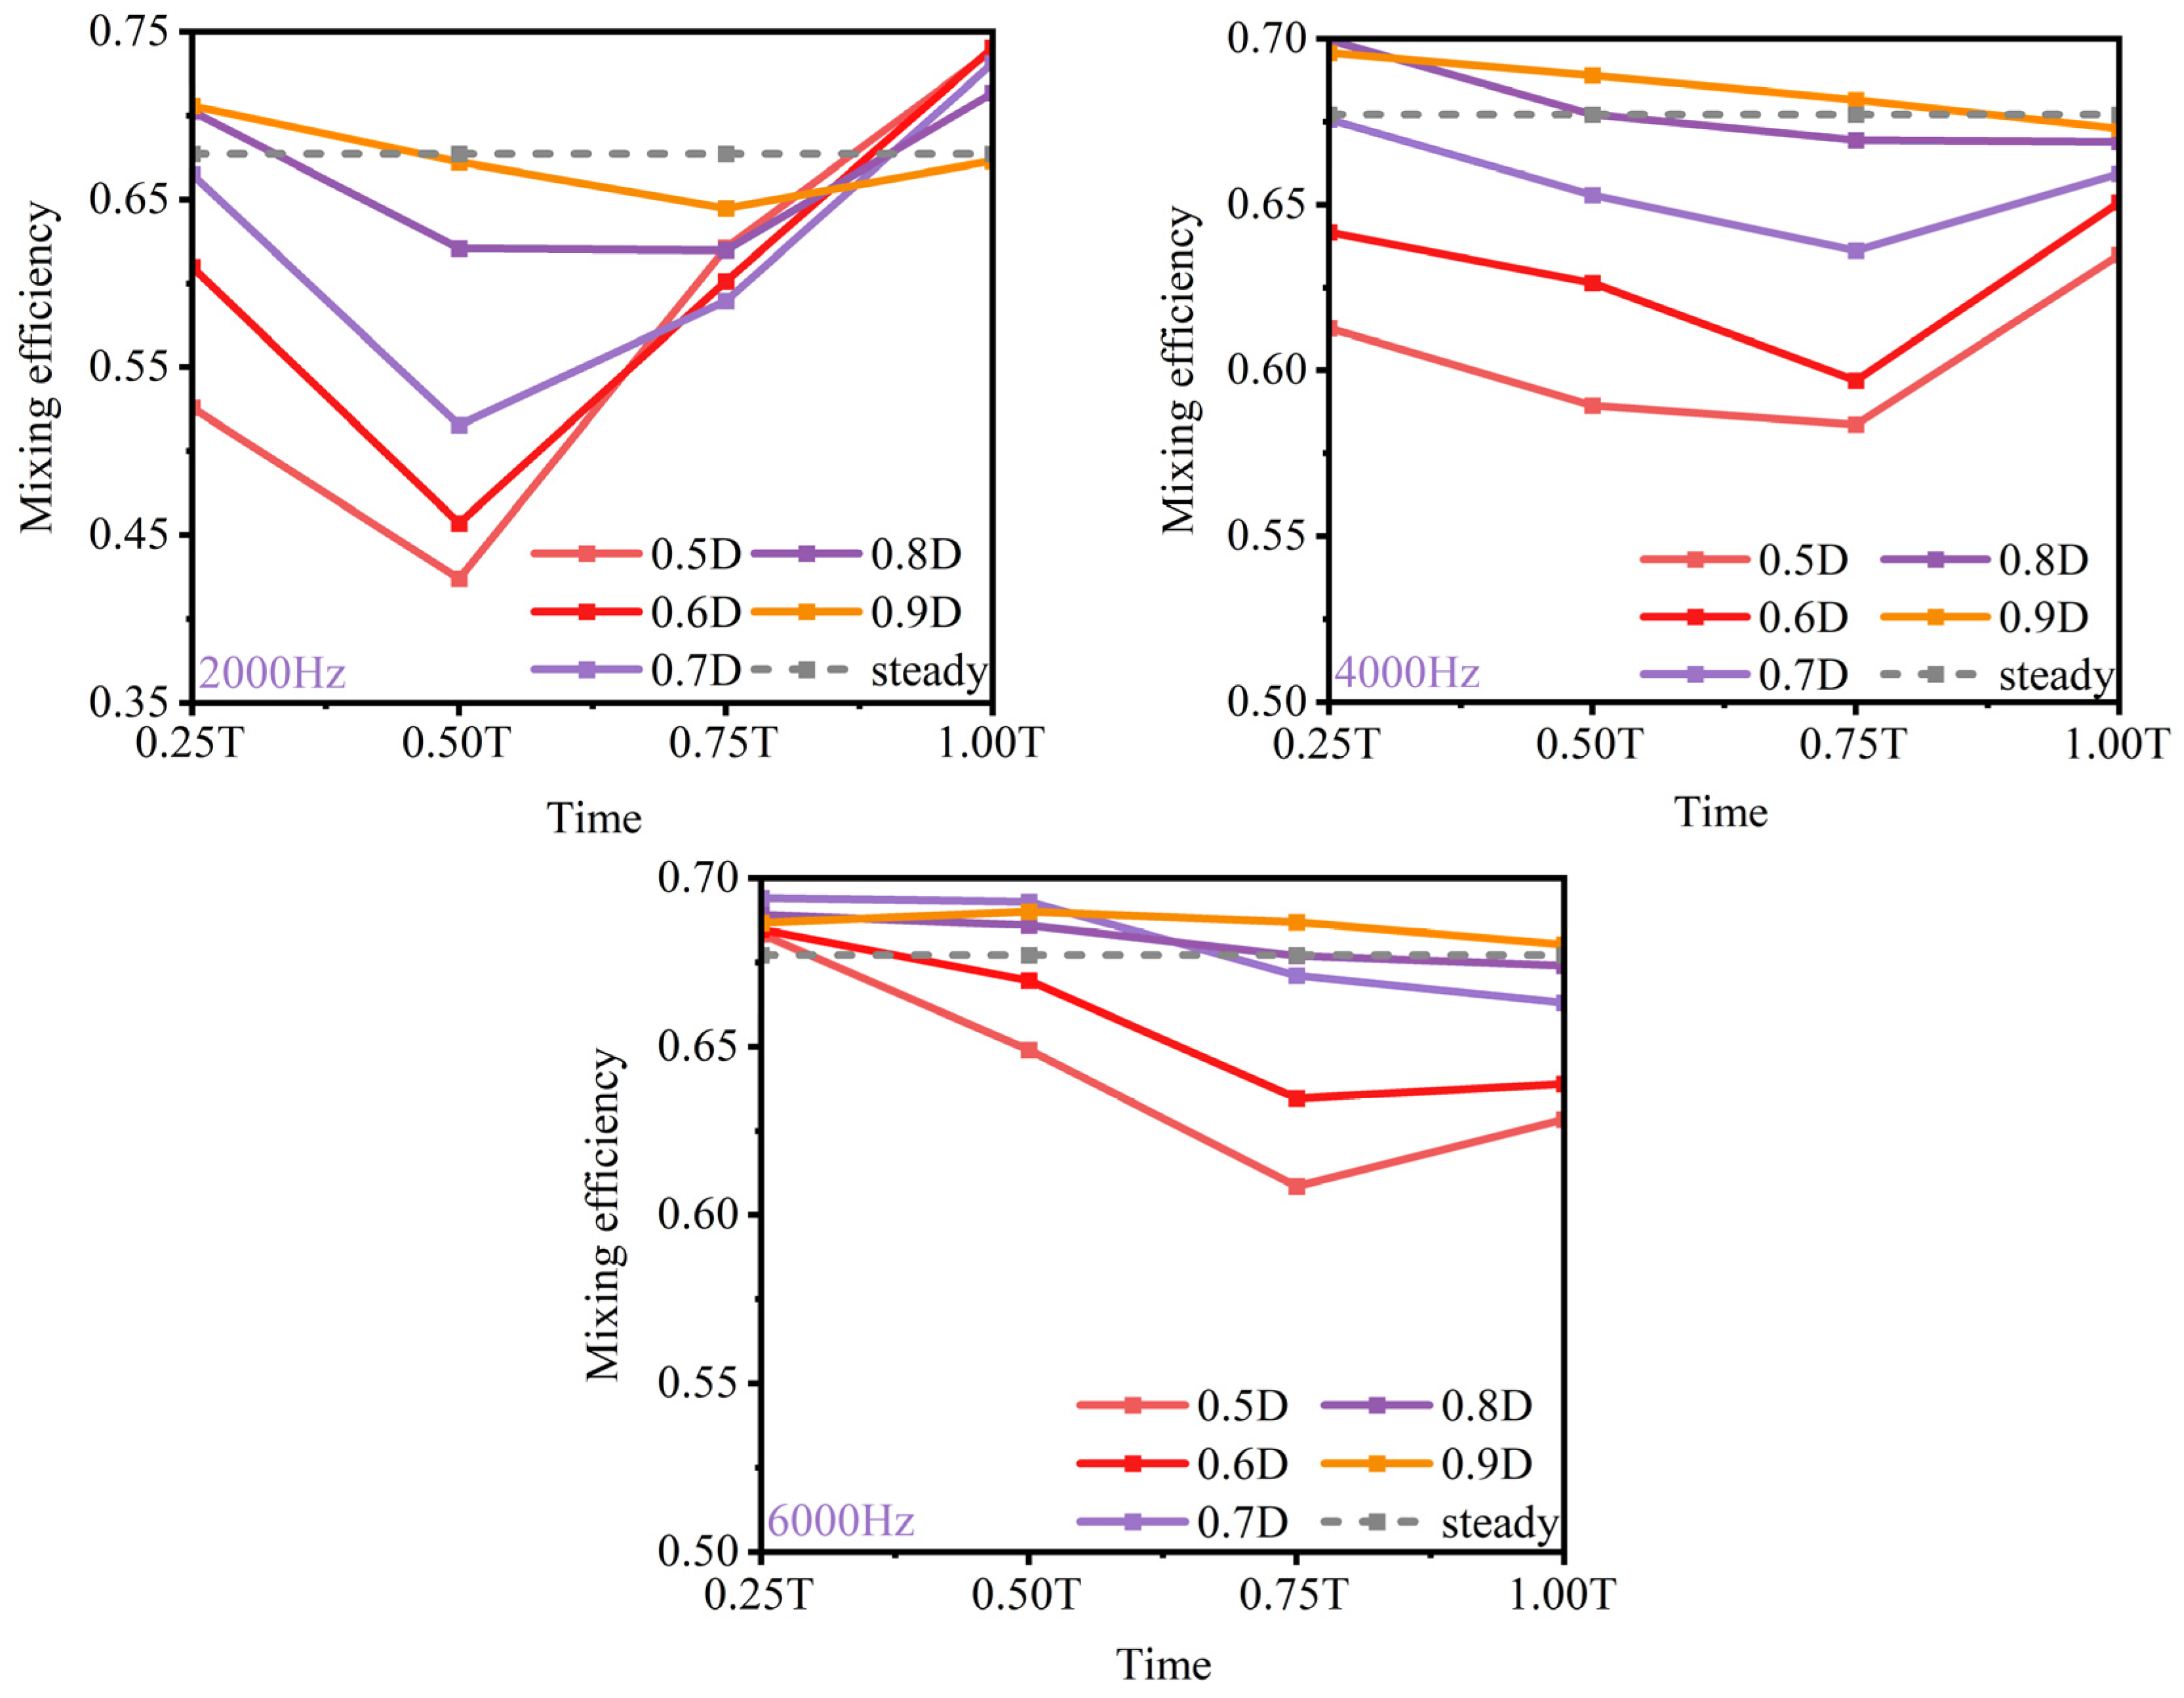
It can be seen in Figure 15 that there is a critical frequency for the mixing efficiency of the pulse jet to reach a peak with the increase in frequency. The critical frequency associated with the increase in pulse jet mixing efficiency is examined under different duty cycles. Figure 21 shows the variation of the global mixing efficiency of the pulse injection with the duty cycle at different frequencies. Overall, with the increase in duty cycle, the mixing efficiency of the jet is significantly improved; however, when it gradually approaches the steady injection level, the gain brought by increasing the duty cycle is obviously weakened. Therefore, it can be considered that there is a critical duty cycle when the mixing efficiency changes with the duty cycle. When the duty cycle reaches the critical value, the mixing efficiency tends to be saturated, and it is difficult to significantly improve the mixing effect by continuing to increase the duty cycle. Taking the working condition of 6000 Hz as an example, when the duty cycle is 0.5, the global mixing efficiency of pulse injection is significantly lower than that of steady injection. When the duty cycle increases to 0.7 and 0.9, the global mixing efficiency is close to that of the steady injection. This shows that for the 6000 Hz working condition, when the duty cycle reaches 0.7, continuing to increase the duty cycle does not significantly improve the mixing efficiency, so 0.7 can be regarded as a better choice. Further comparison of the critical state where the mixing efficiency gain begins to decrease at three frequencies shows that when the frequency is 2000 Hz, the critical duty cycle is about 0.9; when the frequency is 4000 Hz, it is about 0.8; when the frequency is 6000 Hz, it is further reduced to about 0.7. At higher frequencies, the pulse injection enters the mixing efficiency saturation zone earlier. This shows that the critical value of duty cycle decreases with the increase in frequency. A critical duty cycle–frequency curve can therefore be identified, below which the mixing efficiency changes obviously with changes in the pulse parameters. Beyond this critical curve, the mixing efficiency approaches a saturation value. Therefore, from the perspective of changing the duty cycle at a constant frequency, the duty cycle mentioned above is unchanged.
Figure 21.
The change in mixing efficiency of pulse injection with duty cycle at different frequencies.
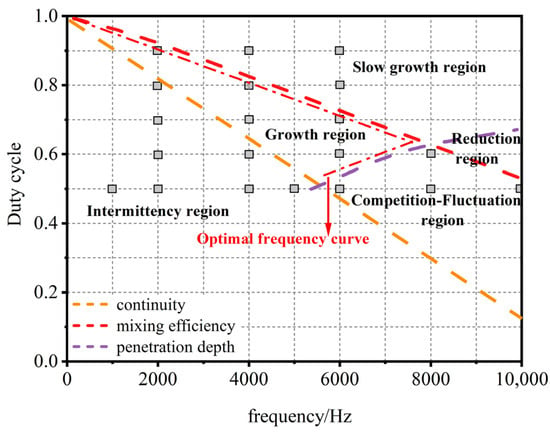
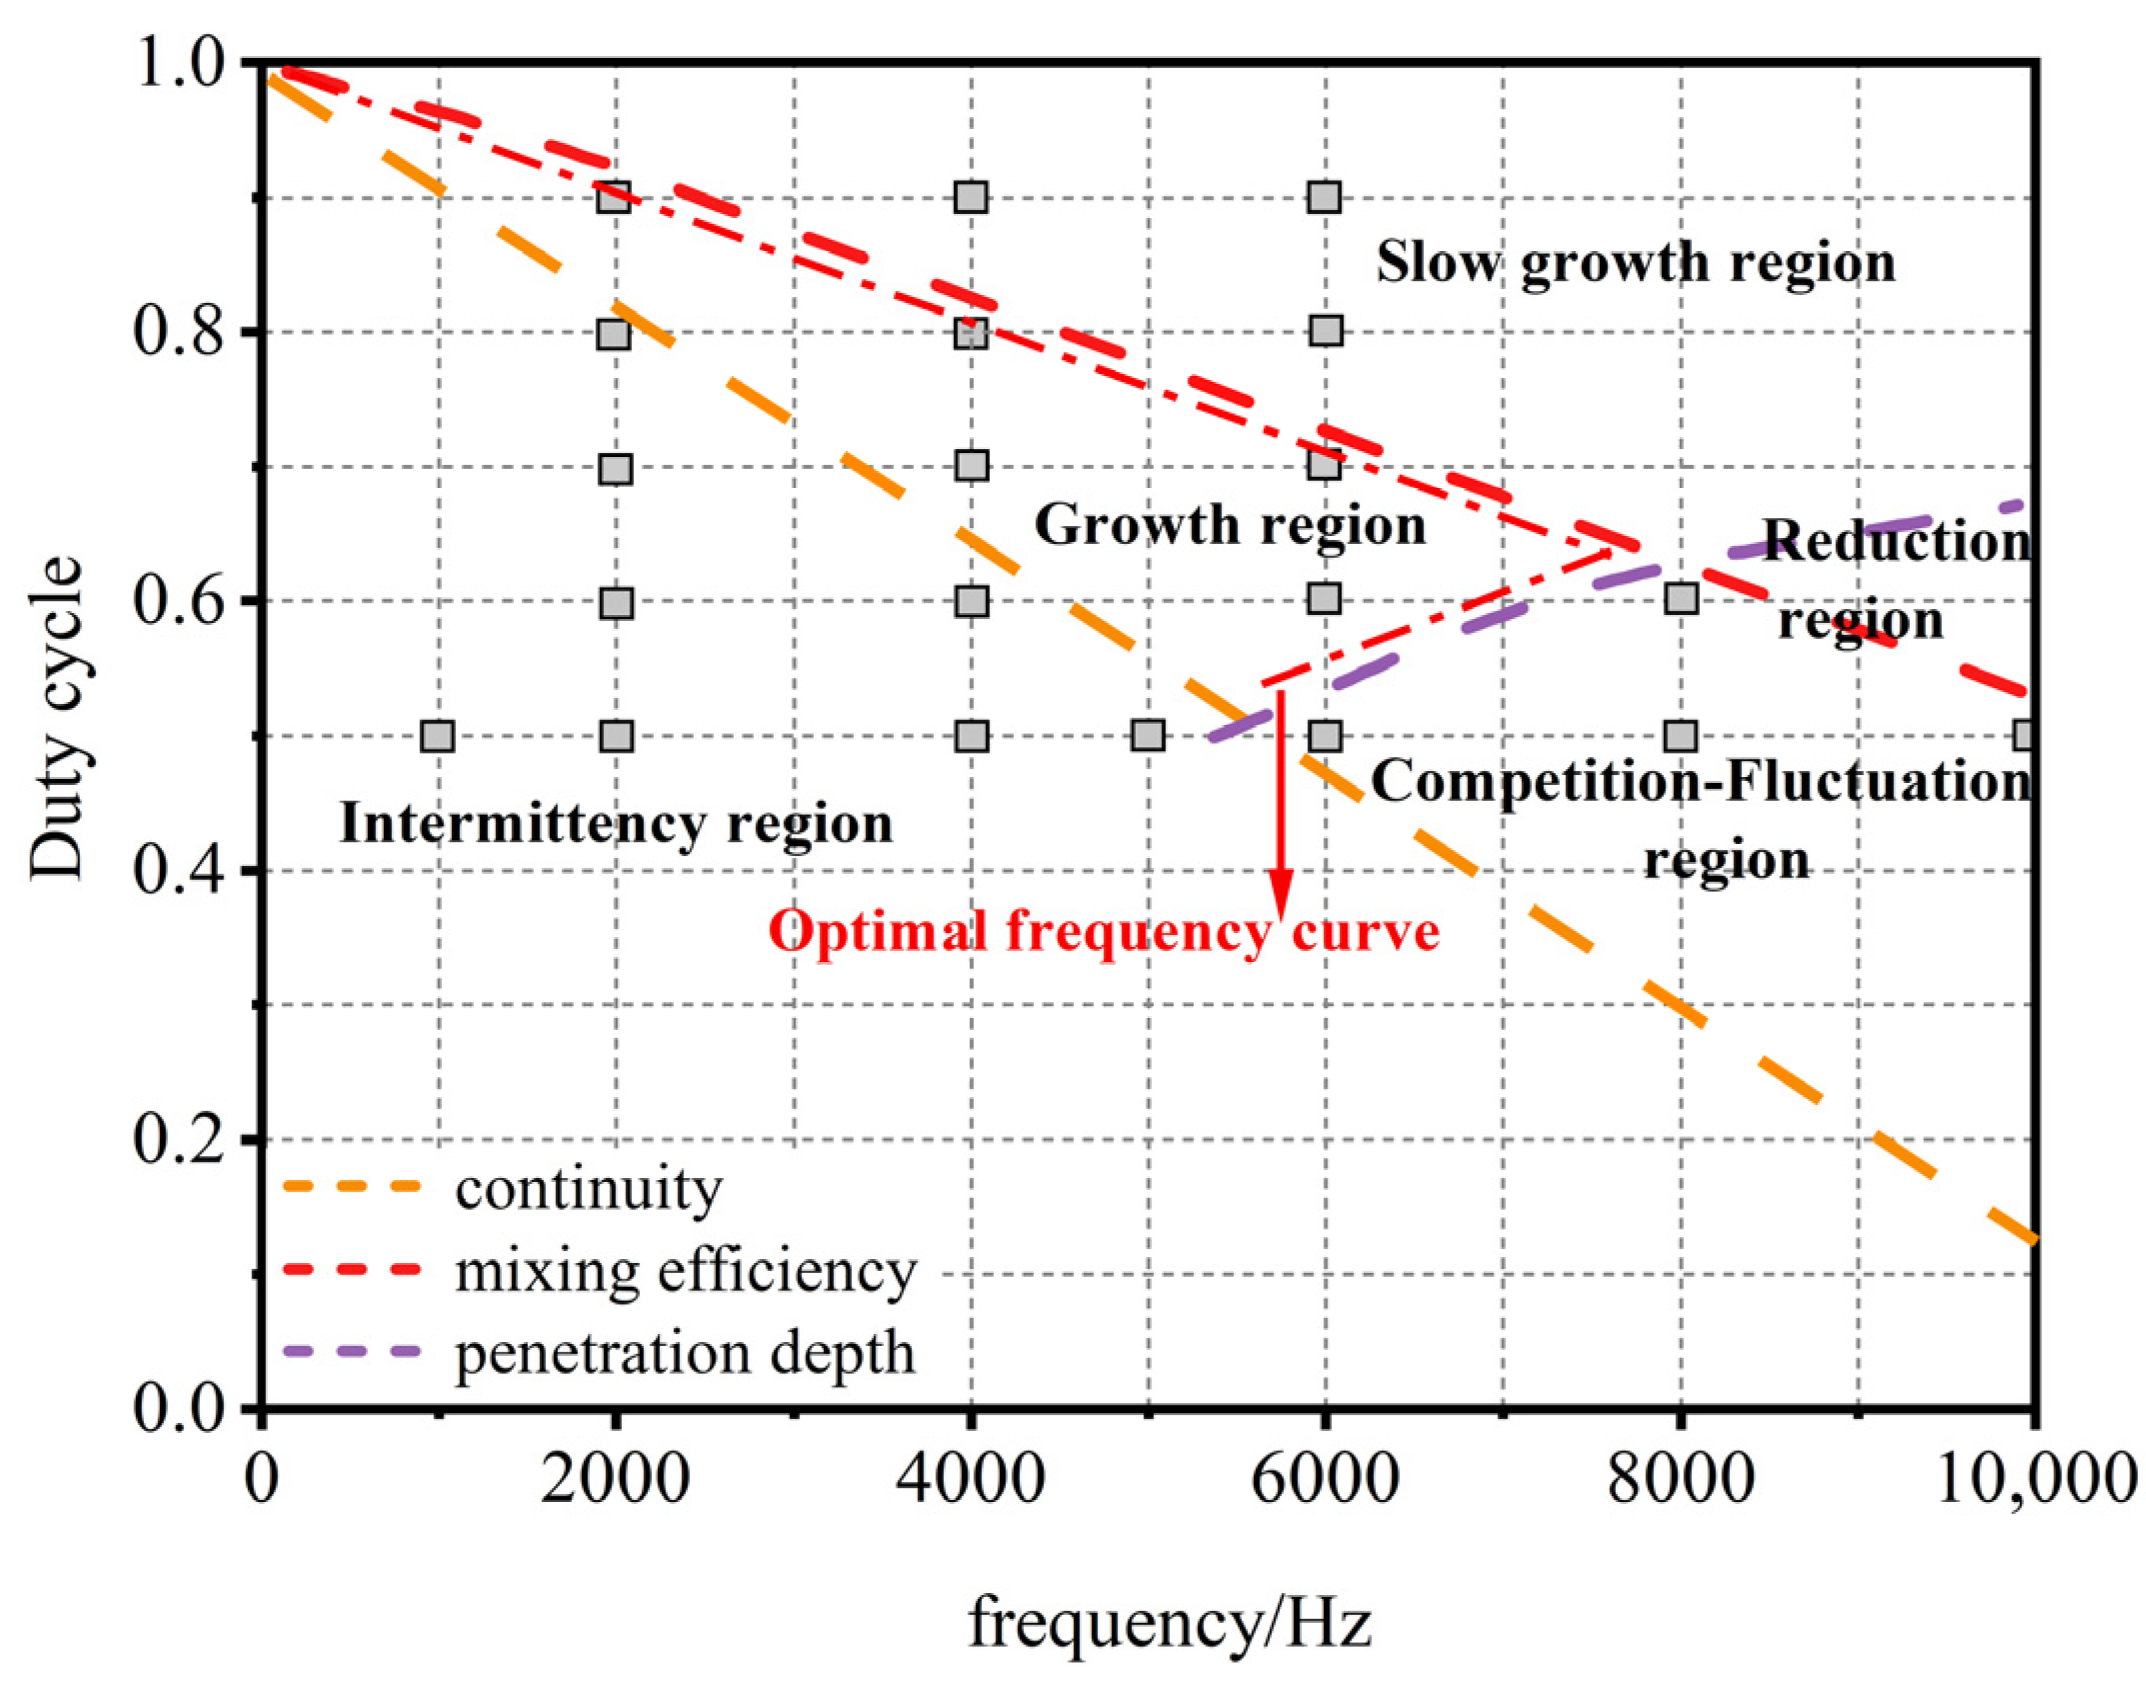
According to the research on the mixing performance of a square-wave pulse jet under different parameters, the pulse parameters can be divided into different regions by using the duty cycle–frequency critical curve, and different regions have different mixing characteristics. In order to further describe the fluctuation and offset trend of the preferred interval, the prediction is carried out after considering the deviation of the boundary example and the judgment threshold. The results are shown in Figure 22. Among them, region 1 (the intermittency region) does not reach basic continuity, involving a wide range of frequencies. In region 2 (the growth region), increasing the frequency in this range can significantly increase the mixing performance. In region 3 (the competition–fluctuation region), as the frequency increases, the mixing efficiency increases, the penetration depth decreases, and the mixing performance shows small fluctuations. In region 4 (the slow-growth region), as the frequency increases, the mixing efficiency approaches a saturation value, the penetration depth remains unchanged, and the mixing performance increases slightly. In region 5 (the reduction region), as the frequency increases, the mixing efficiency decreases from its saturation level, the penetration depth decreases, and the mixing performance decreases with frequency.
Figure 22.
Parameter region classification and optimal frequency curve of square-wave pulse.
The characteristic regions are classified according to the trends in pulse performance. Among them, because of the discontinuity of region 1 and the decrease in mixing performance of region 5, they are directly excluded; however, the mixing performance of region 3 and region 4 has a low response to frequency. It is not necessary to increase the frequency significantly in order to achieve a small increase, so it should be carefully selected. Therefore, the critical curve formed by the intersection of region 2 with region 3 and region 4 should be selected as the optimal performance curve under different duty cycles, which represents the frequency required to achieve the best performance under different duty cycles. At the same time, as the duty cycle increases, this optimal frequency increases first and then decreases, and there is a maximum value as shown in Figure 22.
The frequency-dependent responses identified in this study are not merely based on empirical comparisons among discrete operating conditions. The observed performance transitions and their correlation with the degree of near-nozzle flow field establishment have been further verified under different duty cycles and pulse waveforms. Therefore, the staged transitions observed within the investigated frequency range are supported by a clear underlying physical mechanism, indicating that the selected frequency range adequately covers the major mixing transitions of interest in this study.
4. Conclusions
In this study, numerical simulations were conducted to investigate the mixing characteristics of pulse kerosene injection into a supersonic crossflow, with particular emphasis on the effects of pulse frequency, waveform, and duty cycle on injection performance. The main conclusions are as follows.
- Penetration depth and mixing efficiency exhibit different critical frequency responses. At a duty cycle of 0.5, the penetration depth remains nearly constant in the low-frequency range and begins to decrease at approximately 4 kHz. In contrast, mixing efficiency increases with frequency and gradually approaches a saturation value of 0.711 at approximately 10 kHz, exceeding the steady injection value of 0.677. Increasing the duty cycle shifts the critical frequency for penetration depth to higher values but causes mixing efficiency to reach saturation at lower frequencies. Therefore, the selection of pulse parameters should balance jet penetration capability and improvements in mixing efficiency.
- Jet penetration depth is primarily governed by the establishment of the near-nozzle flow field. At low frequencies, flow structures have sufficient time to develop, thereby maintaining jet penetration capability. At high frequencies, insufficient time available for flow field development leads to increased momentum dissipation and weakened streamline lifting, resulting in reduced penetration depth. Meanwhile, increasing the pulse frequency breaks up the kerosene-rich core into more numerous and smaller regions, improving fuel distribution uniformity and enhancing mixing. Square-wave and sinusoidal pulse injection exhibit similar frequency-dependent responses. However, square-wave injection enables more rapid establishment of the near-nozzle flow field, achieving greater penetration depth and higher mixing efficiency at intermediate and high frequencies.
- Based on the frequency- and duty-cycle-dependent characteristics of square-wave pulse injection, distinct mixing performance regions were identified in the duty cycle–frequency parameter space, and an optimal performance curve was established. The results indicate that pulse parameter selection should not simply be in pursuit of higher frequencies. Instead, the pulse frequency should be selected near the critical condition where mixing efficiency is significantly enhanced while penetration depth has not yet undergone substantial deterioration, thereby achieving a favorable balance between mixing enhancement and jet penetration capability.
Author Contributions
Conceptualization, Z.Y. and J.Z.; methodology, Z.Y.; software, Z.Y. and G.F.; validation, H.T.; formal analysis, H.Q.; investigation, W.B.; resources, J.Z.; data curation, Z.Y.; writing—original draft preparation, Z.Y.; writing—review and editing, Z.Y.; visualization, H.T.; supervision, H.Q.; project administration, G.F.; funding acquisition, J.Z. All authors have read and agreed to the published version of the manuscript.
Funding
This research received no external funding.
Data Availability Statement
The data presented in this study are available from the corresponding author upon reasonable request.
Conflicts of Interest
The authors declare no conflicts of interest.
References
- Luo, S.; Sun, Y.; Liu, J.; Xie, X.; Tian, J.; Song, J. Research Status and Development Trend of Air-Breathing High-Speed Vehicle/Engine Integration. Aerosp. Sci. Technol. 2024, 155, 109675. [Google Scholar] [CrossRef] [Scilit]
- Huang, W.; Du, Z.; Yan, L.; Moradi, R. Flame Propagation and Stabilization in Dual-Mode Scramjet Combustors: A Survey. Prog. Aerosp. Sci. 2018, 101, 13–30. [Google Scholar] [CrossRef] [Scilit]
- Li, K.; Wang, J. Numerical Investigation of the Coupling Effects of Pulse H2 Jets and Nanosecond-Pulse Actuation in Supersonic Crossflow. Aerospace 2025, 12, 44. [Google Scholar] [CrossRef] [Scilit]
- Seleznev, P.K.; Surzhikov, S.T.; Shang, J.S. A Review of the Scramjet Experimental Data Base. Prog. Aerosp. Sci. 2019, 106, 43–70. [Google Scholar] [CrossRef] [Scilit]
- Urzay, J. Supersonic Combustion in Air-Breathing Propulsion Systems for Hypersonic Flight. Annu. Rev. Fluid Mech. 2018, 50, 593–627. [Google Scholar] [CrossRef] [Scilit]
- Wang, H.; Wang, G.; Li, H.; Li, T. Effects of Pulse Discharge on Transverse Jet Mixing in Supersonic Crossflow. AIAA J. 2026, 64, 2538–2550. [Google Scholar] [CrossRef] [Scilit]
- Singh, A.; Mukhopadhyay, S. Enhancement of Combustion Efficiency of Strut-Injection Scramjet Using Ramps. Aerosp. Sci. Technol. 2025, 158, 109928. [Google Scholar] [CrossRef] [Scilit]
- Maikap, S.; Rajagopal, A.K. Mixing Enhancement of Transverse Jets in Supersonic Crossflow Using an Actively Controlled Novel Fluidic Oscillator. Phys. Fluids 2024, 36, 026106. [Google Scholar] [CrossRef] [Scilit]
- Dong, M.-Z.; Liao, J.; Choubey, G.; Huang, W. Influence of the Secondary Flow Control on the Transverse Gaseous Injection Flow Field Properties in a Supersonic Flow. Acta Astronaut. 2019, 165, 150–157. [Google Scholar] [CrossRef] [Scilit]
- Du, Z.-B.; Shen, C.-B.; Huang, W.; Yan, L.; Liang, J.-H.; Choubey, G. Parametric Study on Mixing Augmentation Mechanism Induced by Cantilevered Ramp Injectors in a Shock-Induced Combustion Ramjet Engine. Aerosp. Sci. Technol. 2021, 108, 106413. [Google Scholar] [CrossRef] [Scilit]
- Huang, W.; Wu, H.; Du, Z.-B.; Yan, L.; Choubey, G. Design Exploration on the Mixing Augmentation Induced by the Oblique Shock Wave and a Novel Step in a Supersonic Flow. Acta Astronaut. 2021, 180, 622–629. [Google Scholar] [CrossRef] [Scilit]
- Wang, E.A. Numerical Study on a Novel Device for Hydrogen Mixing Enhancement in a Scramjet Engine: Coaxial Injector. Aerosp. Sci. Technol. 2022, 127, 107680. [Google Scholar] [CrossRef] [Scilit]
- Li, L.; Huang, W.; Fang, M.; Shi, Y.-L.; Li, Z.-H.; Peng, A.-P. Investigation on Three Mixing Enhancement Strategies in Transverse Gaseous Injection Flow Fields: A Numerical Study. Int. J. Heat Mass Transf. 2019, 132, 484–497. [Google Scholar] [CrossRef] [Scilit]
- Huang, W.; Li, S.; Yan, L.; Wang, Z.-G. Performance Evaluation and Parametric Analysis on Cantilevered Ramp Injector in Supersonic Flows. Acta Astronaut. 2013, 84, 141–152. [Google Scholar] [CrossRef] [Scilit]
- Randolph, H.; Chew, L.; Johari, H. Pulse Jets in Supersonic Crossflow. J. Propuls. Power 1994, 10, 746–748. [Google Scholar] [CrossRef] [Scilit]
- Murugappan, S.; Gutmark, E.; Carter, C. Control of Penetration and Mixing of an Excited Supersonic Jet into a Supersonic Cross Stream. Phys. Fluids 2005, 17, 106101. [Google Scholar] [CrossRef] [Scilit]
- Cutler, A.D.; Harding, G.C.; Diskin, G.S. High Frequency Pulse Injection into a Supersonic Duct Flow. AIAA J. 2013, 51, 809–818. [Google Scholar] [CrossRef] [Scilit]
- Shi, H.; Wang, G.; Luo, X.; Yang, J.; Lu, X.-Y. Large-Eddy Simulation of a Pulse Jet into a Supersonic Crossflow. Comput. Fluids 2016, 140, 320–333. [Google Scholar] [CrossRef] [Scilit]
- Chen, S.; Zhao, D. RANS Investigation of the Effect of Pulse Fuel Injection on Scramjet HyShot II Engine. Aerosp. Sci. Technol. 2019, 84, 182–192. [Google Scholar] [CrossRef] [Scilit]
- Du, Z.; Huang, W.; Yan, L.; Li, L.-Q.; Chen, Z.; Li, S.-B. RANS Study of Steady and Pulse Gaseous Jets into a Supersonic Crossflow. Int. J. Heat Mass Transf. 2019, 136, 157–169. [Google Scholar] [CrossRef] [Scilit]
- Zhou, Y.; Tian, Y.; Song, W. Research on the Influence of Injection Locations on Supersonic Combustion Instability in a Scramjet Combustor. Appl. Therm. Eng. 2025, 279, 127851. [Google Scholar] [CrossRef] [Scilit]
- Zhao, M.; Ye, T. URANS Study of Pulse Hydrogen Jet Characteristics and Mixing Enhancement in Supersonic Crossflow. Int. J. Hydrogen Energy 2019, 44, 20493–20503. [Google Scholar] [CrossRef] [Scilit]
- Zhou, Y.-M.; Wu, J.; Huang, W.; Choubey, G. Study on Combustion Characteristics of Sinusoidal Hydrogen Pulse Jet with Different Frequencies in Supersonic Flows. Acta Astronaut. 2024, 214, 389–400. [Google Scholar] [CrossRef] [Scilit]
- Williams, N.J.; Moeller, T.M.; Thompson, R.J. Numerical Simulations of High Frequency Transverse Pulse Jet Injection into a Supersonic Crossflow. Aerosp. Sci. Technol. 2020, 103, 105908. [Google Scholar] [CrossRef] [Scilit]
- Sau, R.; Mahesh, K. Optimization of Pulse Jets in Crossflow. J. Fluid Mech. 2010, 653, 365–390. [Google Scholar] [CrossRef] [Scilit]
- Kouchi, T.; Sakuranaka, N.; Izumikawa, M.; Tomioka, S. Pulse Transverse Injection Applied to a Supersonic Flow. In Proceedings of the 43rd AIAA/ASME/SAE/ASEE Joint Propulsion Conference & Exhibit, Cincinnati, OH, USA, 8–11 July 2007; p. 2007-5405. [Google Scholar] [CrossRef] [Scilit]
- Li, K.; Wang, J. Numerical Analysis of the Three-Dimensional Interaction Between Nanosecond-Pulse Actuation and Pulse H2 Jets in Supersonic Crossflow. Aerospace 2025, 12, 1113. [Google Scholar] [CrossRef] [Scilit]
- Sebastian, R.; Schreyer, A. Forced Injection of a Spanwise-Inclined Jet in Supersonic Crossflow. AIAA J. 2024, 62, 52–64. [Google Scholar] [CrossRef] [Scilit]
- Yan, M.; Tian, Y.; Wang, G.; Le, J. Effects of Pulse Hydrogen Injection on Mixing and Combustion Performance in a Supersonic Flow Field. Phys. Fluids 2023, 35, 105103. [Google Scholar] [CrossRef] [Scilit]
- Zhao, M.; Li, Q.; Ye, T. Investigation of an Optimal Pulse Jet Mixing and Combustion in Supersonic Crossflow. Combust. Flame 2021, 227, 186–201. [Google Scholar] [CrossRef] [Scilit]
- Aso, S.; Kawai, M.; Ando, Y. Experimental Study on Mixing Phenomena in Supersonic Flows with Slot Injection. In Proceedings of the 29th Aerospace Sciences Meeting, Reno, NV, USA, 7–10 January 1991; p. 91-0016. [Google Scholar] [CrossRef] [Scilit]
- Yan, L.; Huang, W.; Zhang, T. Numerical Investigation of the Nonreacting and Reacting Flow Fields in a Transverse Gaseous Injection Channel with Different Species. Acta Astronaut. 2014, 105, 17–23. [Google Scholar] [CrossRef] [Scilit]
Disclaimer/Publisher’s Note: The statements, opinions and data contained in all publications are solely those of the individual author(s) and contributor(s) and not of MDPI and/or the editor(s). MDPI and/or the editor(s) disclaim responsibility for any injury to people or property resulting from any ideas, methods, instructions or products referred to in the content. |
© 2026 by the authors. Licensee MDPI, Basel, Switzerland. This article is an open access article distributed under the terms and conditions of the Creative Commons Attribution (CC BY) license.