


Abstract
Although short-term conflict alert (STCA) is a well-established safety net in air traffic management, STCA tailored to low-altitude urban air mobility (UAM) operations under the provider-of-services-for-UAM (PSU)-centered framework remains underexplored. This study proposes an STCA algorithm for UAM comprising a conflict-prediction module, which detects simultaneous horizontal and vertical separation violations using the closest point of approach, and a conflict-resolution module, which analytically derives alert distances for horizontal turning and vertical climbing in four encounter geometries classified by crossing angle. For each of 25 speed pairs between 180 and 320 km/h, 108 pairwise encounters were simulated. The alert rate increased with intruder speed, whereas the effect of object speed reversed depending on intruder speed. With controller and pilot reaction times sampled from kernel density estimates, the margin distances satisfying the target level of safety of 5 × 10⁻⁹, extrapolated using a generalized Pareto distribution, ranged from 1031 to 1882 m. A sensitivity analysis further showed that the required margin decreased with larger bank angles and climb rates. The proposed algorithm can serve as an alerting function for initial UAM operations involving onboard pilots and the PSU.
1. Introduction
There is an emerging need for future transportation systems to address traffic congestion and environmental pollution caused by urban population growth [1]. Advancements in electric motors, distributed electric propulsion, and low-noise propeller technologies have laid the foundation for electric vertical takeoff and landing (eVTOL) vehicles [2,3]. The emergence of eVTOL vehicles has enabled a new paradigm of low-altitude urban air transportation, referred to as urban air mobility (UAM) [4]. UAM represents an air transportation ecosystem that provides passenger and cargo transport services in and around urban areas. UAM vehicles operate within low-altitude airspace below approximately 1500 feet above ground level [4]. This concept has been extended to a broader framework known as advanced air mobility, which includes both intracity and intercity routes [5,6]. Currently, major countries and global manufacturers are actively pursuing the development and commercialization of UAM, with certain vehicles entering the test flight phase to obtain the necessary certifications; these developments indicate that UAM-related research is also being actively conducted [7].
The Republic of Korea aims to introduce privately led UAM services by 2030. The K-UAM Concept of Operations (ConOps) 1.5 describes the UAM air traffic management (UATM) system that ensures the operational safety of UAM [8]. The UATM incorporates more advanced technologies compared with existing air traffic management (ATM) systems. However, the objectives of the UATM do not differ significantly from those of conventional ATM [9]. Implementing the UATM requires considering complexities arising from low-altitude flight in urban environments and the transition between piloted and unpiloted operations. Challenges, such as (1) preventing collisions between UAM vehicles and (2) preventing collisions between UAM vehicles and obstacles, and (3) expediting and maintaining an orderly flow of UAM traffic, are expected to remain [10].
Maintaining separation between UAM vehicles is a core safety objective. According to the “K-UAM ConOps 1.5,” initial UAM operations are specified to fly within designated areas and routes, or through fixed transit corridors. When operating along designated areas or routes rather than transit corridors, UAM vehicles may be frequently exposed to conflicts. A conflict is defined as a scenario in which horizontal and vertical separation between aircraft are not maintained simultaneously, representing a loss of separation. In the ATM domain, a short-term conflict alert (STCA) is issued to enable controllers to recognize conflicts and take appropriate action. The STCA system generates warnings when potential conflicts are predicted. However, a resolution must be considered following conflict detection (CD), which is referred to as conflict detection and resolution (CD&R), to maintain minimum separation even after controller instructions and pilot actions have been performed. Research on CD&R has been actively conducted in the conventional ATM domain. CD&R is categorized sequentially by the time horizon into long-term (30 min to several days ahead), medium-term (typically within 10–30 min), and short-term (typically within 10 min) CD&R [11].
However, the direct application of existing CD&R methodologies to UAM has limitations because of the flight characteristics of UAM vehicles and constrained maneuvering capability, resulting from urban obstacles. Although UAM seeks to realize fully autonomous flight in the long term, UAM vehicles are expected to be operated by onboard pilots during the initial operational phase. In addition, the responsibility for ensuring separation will rest with the provider of services for the UAM (PSU) [8]. In this transitional environment, warnings must be issued to the PSU at an appropriate time when a conflict is predicted, thereby enabling pilots to perform avoidance maneuvers with adequate time available.
Against this background, this study incorporates a conflict-resolution stage to maintain minimum separation within the existing STCA and proposes an STCA algorithm for UAM operations in low-altitude urban environments. The alert distance, which serves as a criterion for alert issuance, is calculated geometrically for two avoidance scenarios: horizontal turning and vertical climbing. This study addresses pairwise encounters between two vehicles. Subsequently, simulations were conducted for 25 speed combinations ranging from 180 to 320 km/h for the two vehicles to validate the algorithm and execute the process of alert issuance determination and avoidance maneuvers. Through these simulations, trends in alert rates based on UAM vehicle speed combinations were analyzed, followed by an analysis of the overshoot distance with respect to changes in the time variable period, denoted Δt. In addition, the variability of controller and pilot reaction times was incorporated using kernel density estimation (KDE). Finally, margin distances satisfying a target level of safety (TLS) were calculated by extrapolating the tail of the empirical cumulative distribution function (ECDF) of the overshoot distances using a generalized Pareto distribution (GPD). A sensitivity analysis with respect to the bank angle and the rate of climb was also performed.
The remainder of this study is organized as follows: Section 2 reviews the related literature on CD&R. Section 3 describes each stage of the algorithm, and Section 4 analyzes the algorithm’s validity through simulations and presents a sensitivity analysis. Finally, Section 5 presents the conclusions and limitations of the study.
2. Literature Review
In the conventional ATM domain, the STCA system has evolved as a core ground-based safety net that detects the risk of separation minima violations between aircraft in real time and provides timely warnings to controllers [12]. The Eurocontrol Guidelines for Short Term Conflict Alert—Parts I–III established a technical framework that encompasses the concept definition, detailed lifecycle, and optimization and validation of the system [13,14,15]. According to Part III, the STCA is structured fundamentally into three stages: a coarse filter for computational efficiency in detection, a fine filter for detailed analysis, and an alert confirmation stage that minimizes false and nuisance alerts to prevent alert fatigue among controllers. This paper presents the algorithm as guidance material, and it does not provide the specific logic. Therefore, this study designs a detailed logic based on short-term CD&R, based on the algorithm presented by Eurocontrol, and subsequently integrates an alert-generation function.
CD&R research has been conducted using geometric approaches. Bilimoria [16] proposed a geometric optimization approach for conflict resolution in the horizontal plane using the aircraft’s current position and velocity vectors. This study established a protected zone with radius Dsep centered on the intruder, modifying the trajectory so that the relative velocity vectors of the two aircraft did not intrude into the protected zone, satisfying the conflict-avoidance condition. To this end, closed-form analytical solutions that minimize velocity vector changes were derived for three types of maneuvers (heading change, speed change, and combined change); however, only the horizontal plane was considered. Neither vertical separation nor dynamic constraints of the aircraft were considered. Dowek et al. [17] extended this to three dimensions by defining a cylindrical protected zone and predicting conflicts by calculating the time intervals during which the trajectory of the ownship intrudes into the protected zone in a relative coordinate system. In the conflict-resolution stage, this study searched for an optimal velocity vector that did not intrude into the protected zone and derived independent solutions for speed, heading, and altitude changes. However, the recovery process for returning to the original path after the avoidance maneuver was not included. Geser and Muñoz [18] proposed a CD&R algorithm that introduced the concept of path recovery based on a tactical algorithm proposed by Dowek et al. [17]. They derived a solution that prevents conflicts by pairing an avoidance path that does not intrude into the protected zone with a return path to the original waypoint. However, characteristics such as aircraft turning were not considered because straight-line flight was considered for both the avoidance and return processes. Luongo et al. [19] introduced a protected zone called the cylindrical safety bubble and proposed a three-dimensional analytical conflict algorithm. This study derived a closed-form solution minimizing the velocity vector change by applying the Lagrange multiplier method, and verified through Monte Carlo simulation that no collisions occurred in all scenarios. This study targeted unmanned aircraft, and therefore, its direct application to manned environments that require considering human factors is limited.
Recently, there has been an increase in CD&R research utilizing artificial intelligence to optimize collision avoidance, extending beyond geometric approaches. Brittain et al. [20] proposed the deep distributed multi-agent variable framework, which enabled aircraft to autonomously detect surrounding collision risks and ensure separation without controllers. Papadopoulos et al. [21] proposed the ResoLver system, which combined graph convolutional networks with reinforcement learning to support controllers. These studies applied reward functions within the artificial intelligence framework, imposing penalties for violating separation minima or taking unnecessary actions, and derived optimal methods through iterative learning, adopting an approach different from conventional CD&R research. Although artificial intelligence-based approaches demonstrated excellent avoidance capabilities, they inherently exhibited the “black-box phenomenon.” The black-box phenomenon refers to the difficulty or impossibility of understanding the internal workings of complex models in artificial intelligence, particularly in deep learning. Given this phenomenon, the interpretability of the decision-making process is lacking, which still presents challenges for practical adoption in aviation safety certification and PSU operations that require rigorous verification [22].
Furthermore, with the emergence of UAM, the research focus has been shifting from ATM to UATM. Panchal et al. [23] proposed UAM-CAS as a collision avoidance system for noncooperative airspace users by combining the elements of CD&R methodologies. This study categorized surveillance, cooperation, avoidance maneuvers, and authority, and selected four combinations for application to birds and drones. Subsequently, Panchal et al. [24] demonstrated in a follow-up study, through high-speed simulations using the BlueSky simulator, that the system increased the intervehicle distance at the closest point of approach (CPA) by an average of 72% while inducing an acceptable level of delay. However, tactical avoidance in these studies is distinguished from that in CD&R because it operates based on an adaptation of the airborne collision avoidance system (ACAS), whereas CD&R maintains separation through prediction. Moreover, only hovering or rule-based right turns were applied for avoidance, and the operational scenario involving initial pilots and PSU was not considered.
Table 1 summarizes the CD&R studies reviewed above along five dimensions relevant to the present work: the target airspace, the type of resolution maneuver, the treatment of human reaction latency, the provision of a residual safety margin, and the classification of encounter geometry. Learning-based approaches [20,21] are excluded from this comparison, since their resolution behavior is obtained from a trained policy rather than from an explicit maneuver model, and the maneuver type, alert geometry, and residual margin therefore cannot be compared on the same terms. All of the listed studies, including the present one, formulate the problem as a pairwise encounter between two aircraft.
Table 1.
Comparison of existing pairwise CD&R studies and the proposed algorithm.
Meanwhile, the pairwise formulation summarized in Table 1 is not the only line of research in this field. A separate body of work addresses conflicts involving three or more aircraft. Ribeiro et al. [25] surveyed more than one hundred conflict resolution methods and proposed a taxonomy in which the treatment of multi-actor conflicts is one of ten classification dimensions. For distributed methods, they distinguish joint resolution, in which a single maneuver simultaneously resolves every conflict the ownship is involved in, from pairwise sequential and pairwise summed approaches. Their analysis indicates that a resolution computed for one conflict pair neglects the constraints imposed by nearby aircraft not currently involved in that conflict, so that the likelihood of inducing a secondary conflict is never accounted for in the resolution itself; at sufficient traffic density, this produces a chain reaction of conflicts, which they quantify through a domino effect parameter.
The same behavior has been reported in the collision avoidance domain. Chen et al. [26] noted that the existing TCAS resolves a multi-aircraft encounter by decomposing it into a sequence of pairwise conflicts and issuing resolution advisories one after another, and that this decomposition can generate domino conflicts in which the maneuver taken to avoid one intruder places the aircraft in conflict with a third. They further reported that the overwhelming majority of multi-aircraft conflicts involve three aircraft, and proposed a collaborative advisory logic in which the state of a potential second intruder is predicted before the advisory for the first is issued.
Taken together, these studies indicate that a pairwise formulation, although analytically tractable, does not by itself guarantee safety once traffic density becomes high enough that conflicting pairs can no longer be treated as independent of surrounding traffic. Nevertheless, this study limits its scope to pairwise encounters between two UAM vehicles. This scope is consistent with the initial operational phase described in the K-UAM ConOps 1.5, in which traffic along designated corridors is expected to remain at low density and separation responsibility rests with the PSU rather than with the vehicles themselves. Accordingly, cascading conflicts among multiple vehicles and secondary conflicts induced by the resolution maneuver are outside the scope of this study and are left for future research addressing conditions of higher traffic density.
This study differs from previous studies in the following aspects:
- (1)
- Detailed logic incorporating conflict resolution was developed based on the algorithm presented by Eurocontrol. Unlike previous studies, the reliability of the proposed algorithm was enhanced by building on an officially recognized algorithm.
- (2)
- The horizontal avoidance direction was classified according to the crossing angle between the tracks of the vehicles, performing avoidance maneuvers appropriate for each scenario. This approach minimized the turn angle for each crossing angle, thereby ensuring shorter turn times. However, recovery to the original path after turning was assumed to be performed under controller instructions.
- (3)
- The horizontal and vertical avoidance distances were compared to identify the most efficient avoidance option. For vertical avoidance, only climbing avoidance was applied to prevent collisions with obstacles that might result from descending avoidance during low-altitude flight in urban environments.
- (4)
- Reaction times, which were applied as fixed values or were not considered in previous studies, were incorporated as variables. The probability density functions (PDFs) calculated by applying kernel density estimation (KDE) to the controller and the pilot reaction time data measured in previous studies were sampled. The realism of the algorithm was enhanced by applying reaction times as variable values instead of fixed values.
Based on these differentiating aspects, this study proposes an STCA algorithm applicable to the initial UAM operational environment. The algorithm proposed in this study is expected to be suitable for the initial phase, during which PSU and pilot operations are conducted.
3. STCA Algorithm
3.1. Algorithm Flowchart
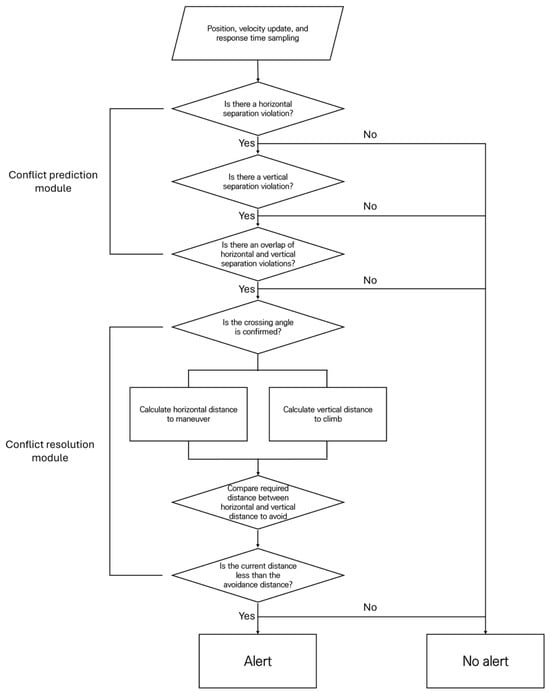
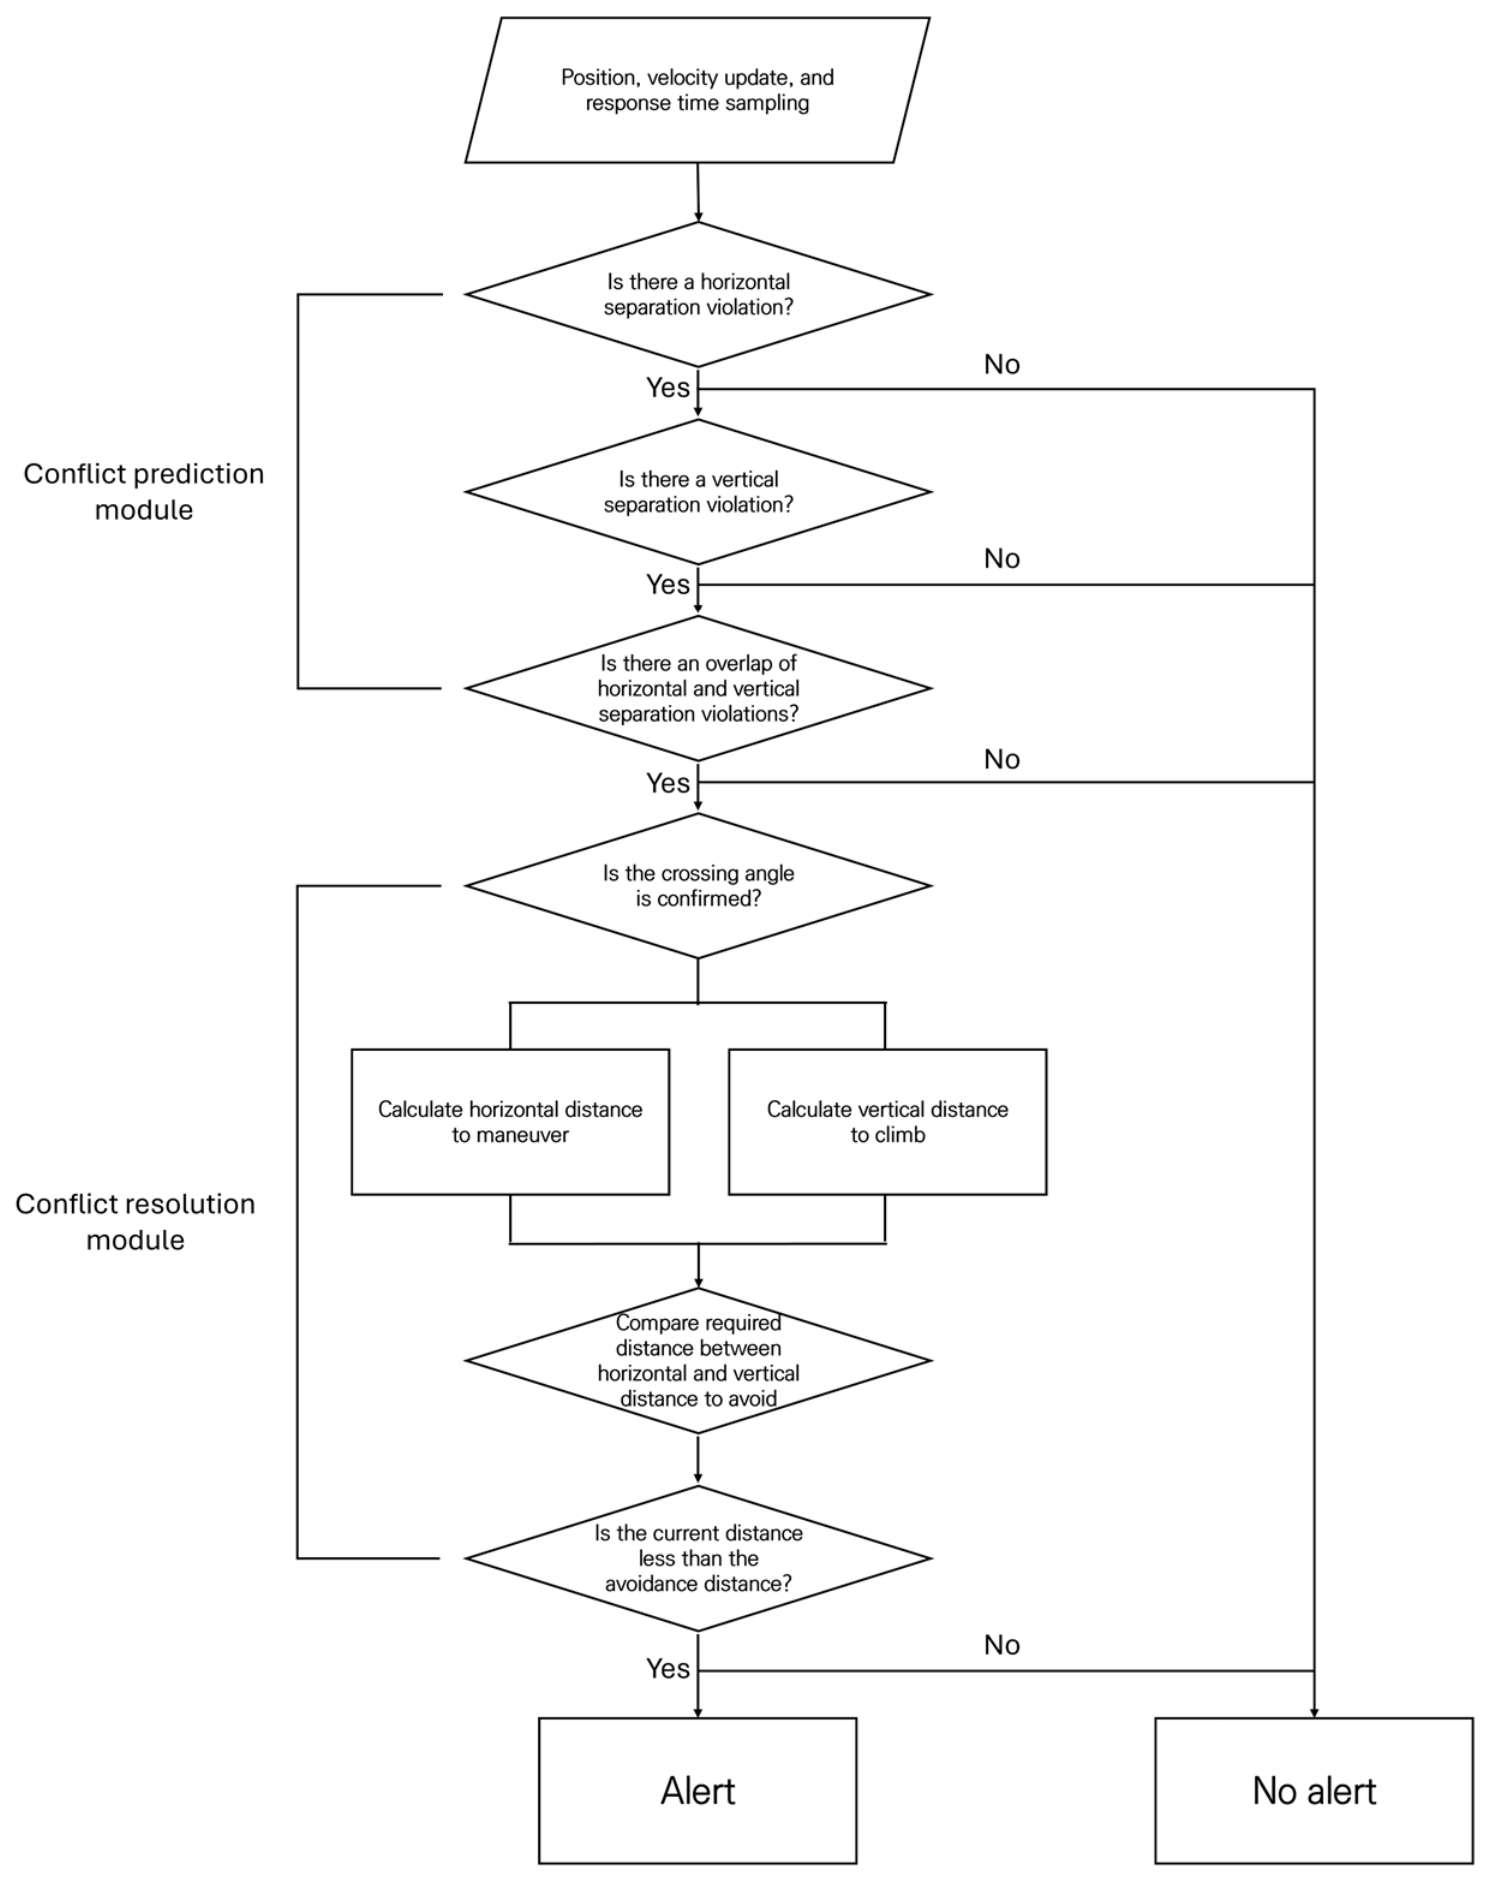
STCA is a concept that provides warnings to controllers rather than a specific system [27]. Accordingly, differences exist in the STCA based on how each ATC system developer implements this concept. This study constructs an algorithm incorporating the detailed avoidance logic by referencing and adapting the Eurocontrol document, as illustrated in Figure 1.
Figure 1.
Flowchart of the proposed STCA algorithm for UAM operation.
This algorithm is divided into conflict-prediction and conflict-resolution modules. The conflict-prediction module comprises the horizontal conflict-prediction stage, vertical conflict-prediction stage, and separation violation overlap verification stage, through which the collision possibility of UAM vehicle pairs is determined. The pair proceeds to the conflict-resolution module when the horizontal and vertical distances between vehicles are predicted to simultaneously fall below their respective separation minima during any interval. In the conflict-resolution module, the crossing angle between two UAM vehicles is determined, and the horizontal and vertical avoidance distances are calculated. Subsequently, an appropriate value is selected from the two distances to determine the optimal avoidance maneuver. Finally, alert issuance is determined by comparing the avoidance distance with the current state of the UAM vehicles.
3.2. Conflict-Prediction Module
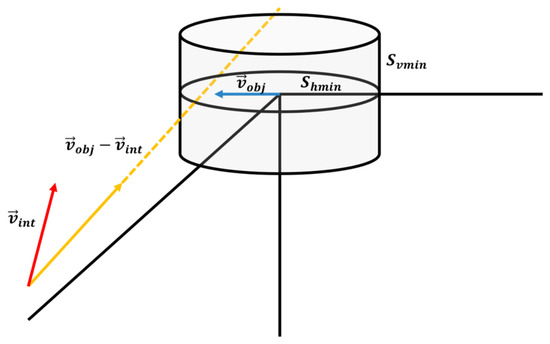
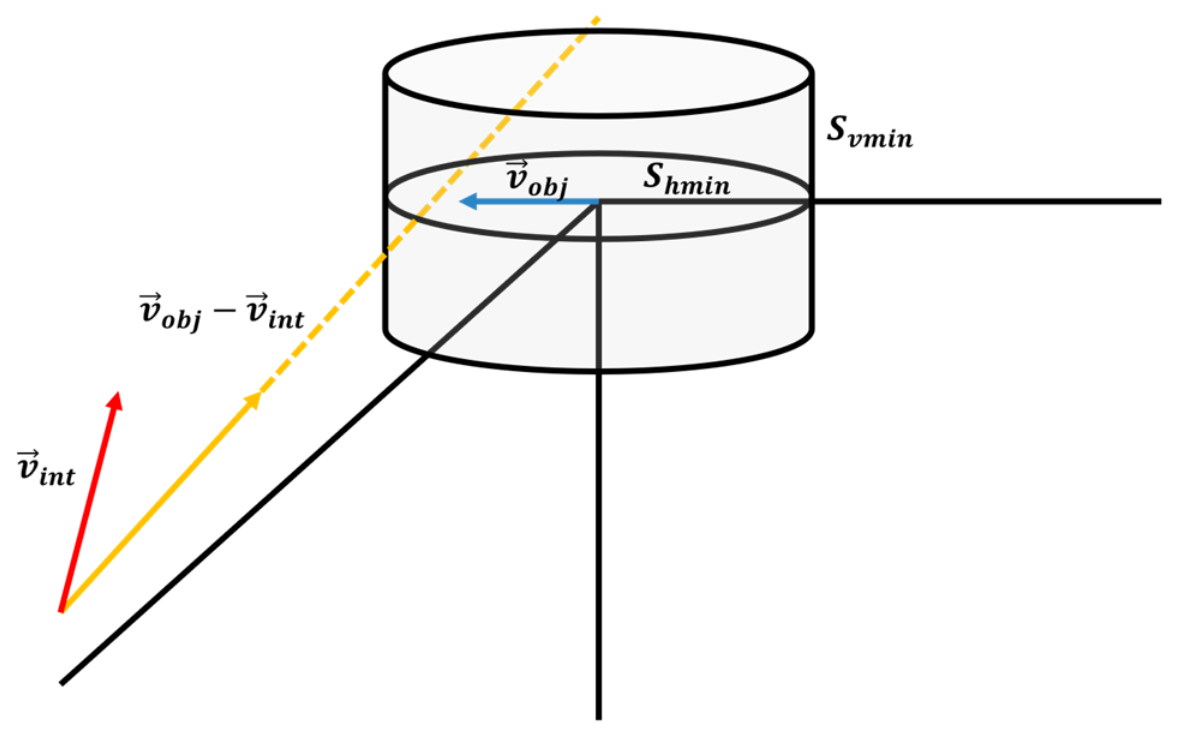
A UAM conflict is defined as a scenario in which the distance between UAM vehicles fails to simultaneously satisfy the prescribed horizontal separation minimum Shmin and vertical separation minimum Svmin. An avoidance maneuver is required when a UAM conflict is predicted. In this context, the UAM vehicle performing the avoidance maneuver is defined as the intruder, and the UAM vehicle continuing along its original path is defined as the object. As illustrated in Figure 2, this scenario can be represented as the intruder entering a cylindrical protected zone defined around the object, where the radius of the cylinder is Shmin and the height is 2⋅Svmin.
Figure 2.
Intrusion of the intruder into the protected zone.
In Figure 2, the red arrow denotes the velocity vector of the intruder aircraft (vint), the blue arrow denotes the velocity vector of the object aircraft (vobj), and the yellow dashed arrow denotes the relative velocity vector (vobj − vint). The gray cylinder represents the protected zone of the object aircraft, defined by the minimum horizontal separation (Shmin) and the minimum vertical separation (Svmin).
In the horizontal conflict-prediction stage, the position of each vehicle was calculated from the initial position coordinates to the prediction time tpred using Equation (1), and the horizontal distance Dh between the vehicles was subsequently computed.
where xobj, yobj, vobj,x, and vobj,y represent the x and y coordinates and the velocity vectors (m/s) of the object, respectively, and xint, yint, vint,x, and vint,y represent the x and y coordinates and velocity vectors (m/s) of the intruder, respectively.
As the time variable t increases, the two vehicles diverge and no alert is necessary when Dh(t) increases. Conversely, the two vehicles converge if Dh(t) decreases. If the distance between the two vehicles is less than Shmin, there is a possibility of a separation violation, and the algorithm must continue to assess this issue. Dh(t) decreased to a local minimum and increased subsequently. The time variable t at which Dh(t) reaches its minimum is defined as tCPA, which is the time of the closest approach between the two vehicles, as indicated in Equation (2).
The horizontal distance at the closest point of approach DCPA can be calculated by substituting tCPA into Equation (1). If DCPA is predicted to be smaller than Shmin, the horizontal separation minimum is determined to be unsatisfactory. Subsequently, the vertical conflict-prediction stage was performed to assess whether a vertical separation violation occurred.
Although the horizontal conflict-prediction stage calculates the conflict risk based on the horizontal distance, the vertical conflict-prediction stage calculates the vertical distance Dv using the altitude difference and vertical velocities of the two vehicles, as indicated in Equation (3).
where zobj and vobj,z represent the altitude and vertical velocity (m/s) of the object, respectively; and zint and vint,z represent the altitude and vertical velocity (m/s) of the intruder, respectively.
Dv(t) = | (zobj − zint) + (vobj,z − vint,z) ⋅ t |,
If Dv is less than Svmin, the minimum vertical separation is determined to be unsatisfactory, and the process proceeds to the overlap verification stage because both the horizontal and vertical separations are predicted to be violated.
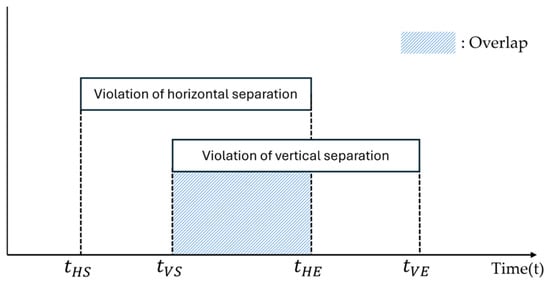
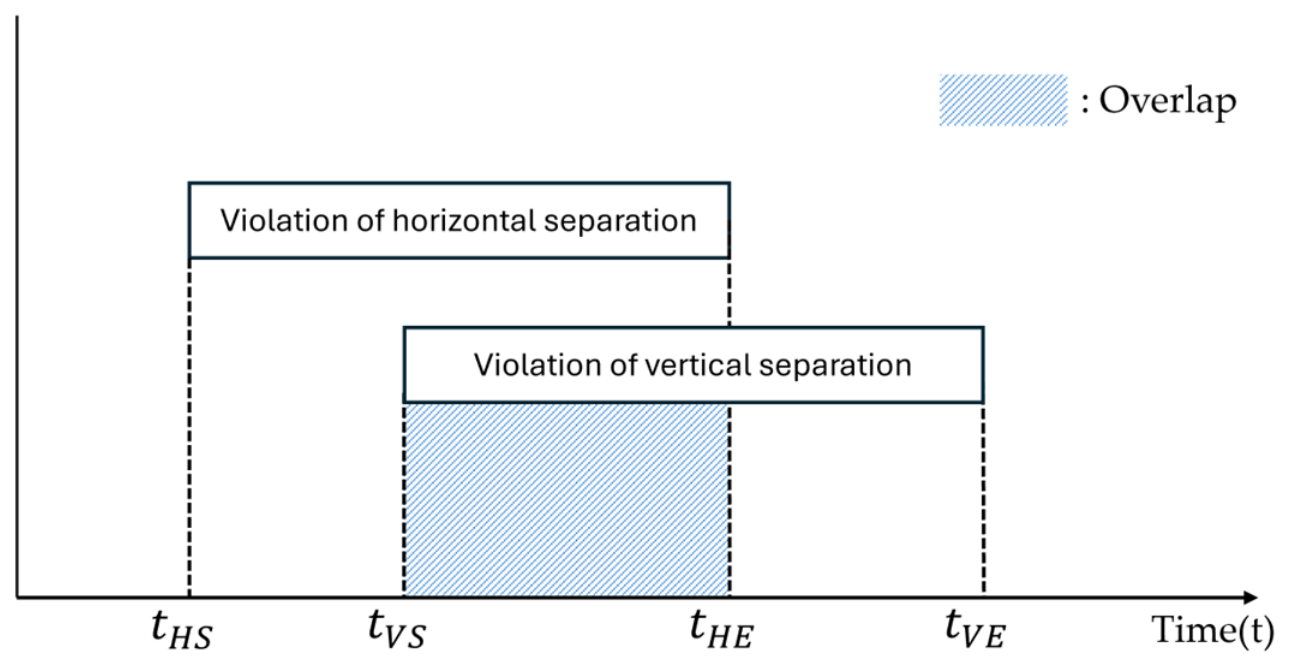
As defined previously, conflict does not occur if either horizontal or vertical separation is maintained. Therefore, as illustrated in Figure 3, the algorithm verifies whether an overlap occurs between the predicted horizontal and vertical separation violations. For example, if a horizontal separation violation occurs first and a vertical separation violation begins subsequently during that interval, this constitutes an overlap of horizontal and vertical separation violations. When such an overlap occurs, the vehicle pair is determined to be in conflict within the prediction time, and the process proceeds to the conflict-resolution module.
Figure 3.
Overlap between horizontal and vertical separation violations.
In the Figure 3, the dashed vertical lines indicate the start and end instants of each separation violation: tHS and tHE denote the start and end of the horizontal separation violation, and tVS and tVE those of the vertical separation violation. The hatched area, which in this example spans from tVS to tHE, denotes the overlap period during which the horizontal and vertical separation minima are violated simultaneously.
3.3. Conflict-Resolution Module
The distance required for conflict avoidance must be calculated for a vehicle pair to resolve a conflict identified by the conflict-prediction module. The intruder can either turn horizontally to satisfy the minimum horizontal separation or change altitude to satisfy the minimum vertical separation.
Three types of turning maneuvers are applied to achieve the minimum horizontal separation. When two vehicles fly in parallel, the intruder performs a turn that does not intrude into the protected zone of the object. In contrast, the intruder turns to avoid intruding into the zone separated by Shmin from the track of the object when the two vehicles fly on crossing tracks. A left turn was applied when two vehicles crossed at an acute angle, and a right turn was applied when they crossed at an obtuse angle.
A climbing-avoidance maneuver was applied to achieve the minimum vertical separation. The adoption of climbing avoidance reflected the characteristics of UAM vehicles operating in low-altitude urban environments. If a descending avoidance maneuver is performed in a low-altitude environment, there is a risk of collision with urban obstacles; therefore, climbing avoidance can enhance safety.
The threshold distance at which an alert must be issued for the intruder to successfully complete an avoidance maneuver and satisfy Shmin is defined as dh_alrt, whereas the threshold distance at which an alert must be issued for the intruder to climb and satisfy Svmin is defined as dv_alrt.
3.3.1. Horizontal Turning Scenarios
This study classified four scenarios based on the crossing angle to ensure efficient avoidance:
- Two vehicles flying in parallel in the same direction (θ = 0°)
- Two vehicles on crossing tracks with an acute crossing angle (0° < θ < 90°)
- Two vehicles on crossing tracks with an obtuse crossing angle (90° ≤ θ < 180°)
- Two vehicles flying in parallel in opposite directions (θ = 180°)
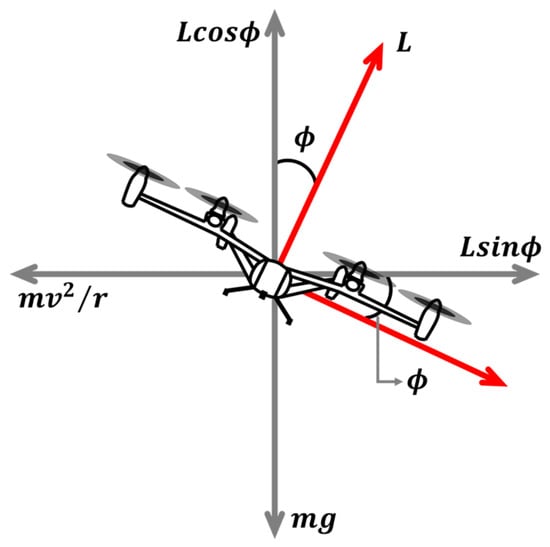
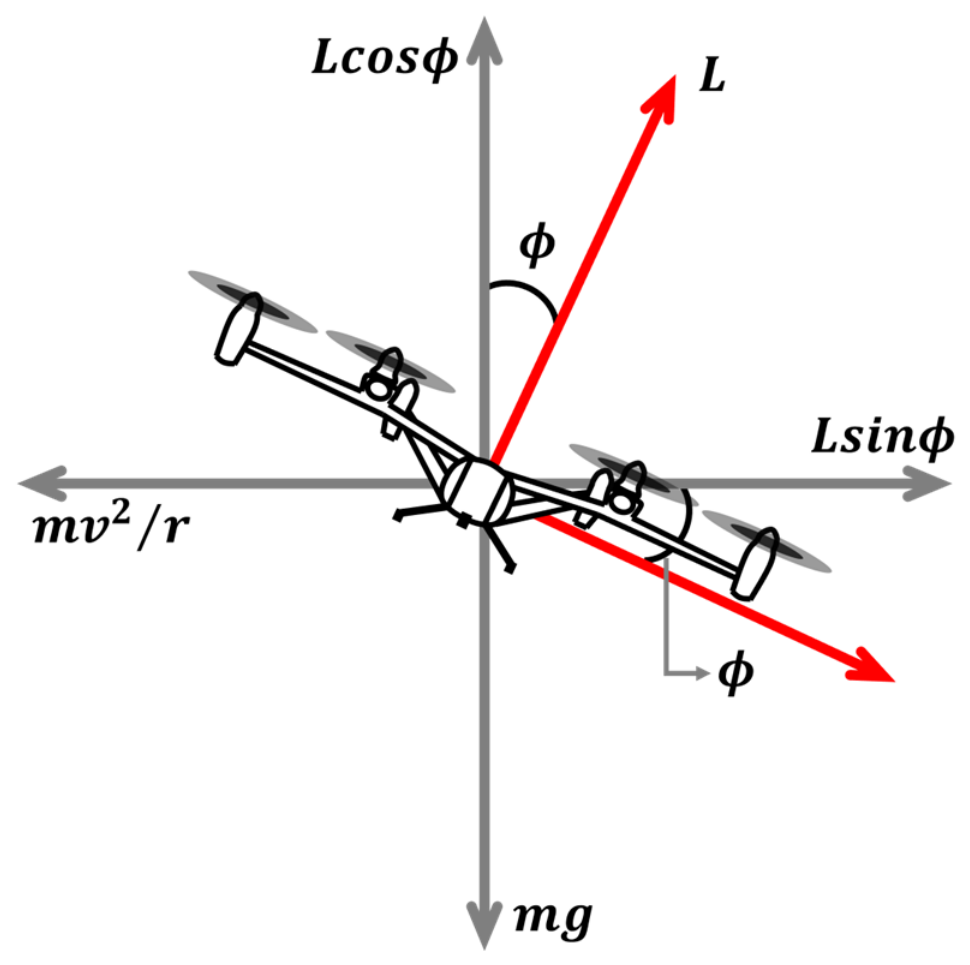
The turning radius of the UAM vehicle (r) must be determined first to perform the horizontal turning maneuvers according to the above scenarios. Subsequently, the horizontal avoidance distance, considering the turning radius, was calculated for each scenario. The turning radius of the UAM vehicle was derived from the turn equations illustrated in Figure 4.
Figure 4.
Forces acting on a UAM vehicle during a turn.
When a UAM vehicle performs a turning maneuver, the basic motion equations expressed in Equations (4) and (5) were established based on the horizontal and vertical components of the lift.
where L, ϕ, m, v, r, and g represent the lift (N), bank angle (deg), mass (kg), speed (m/s), turning radius (m), and gravity (9.80665 m/s2), respectively.
L cosϕ = m ⋅ g,
The relationship among the distance from the center of the turn, speed, and angular velocity is expressed in Equations (6) and (7):
where ω represents the angular velocity (rad/s).
υ = ω ⋅ r,
Using unit conversion, the turn rate R (deg/s) of the UAM vehicle can be computed as shown in Equation (8):
where V represents the speed (km/h).
Based on R, the turning radius r of the vehicle was derived as shown in Equation (9):
where r is expressed in km for V in km/h and R in deg/s.
3.3.2. Horizontal Overtaking and Head-On Scenarios (θ = 0° or 180°)
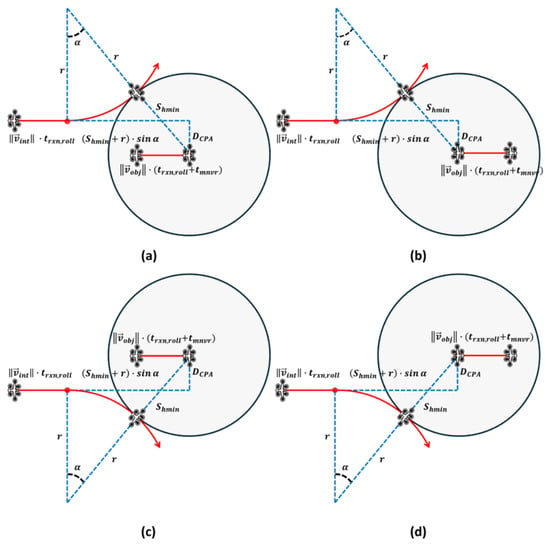
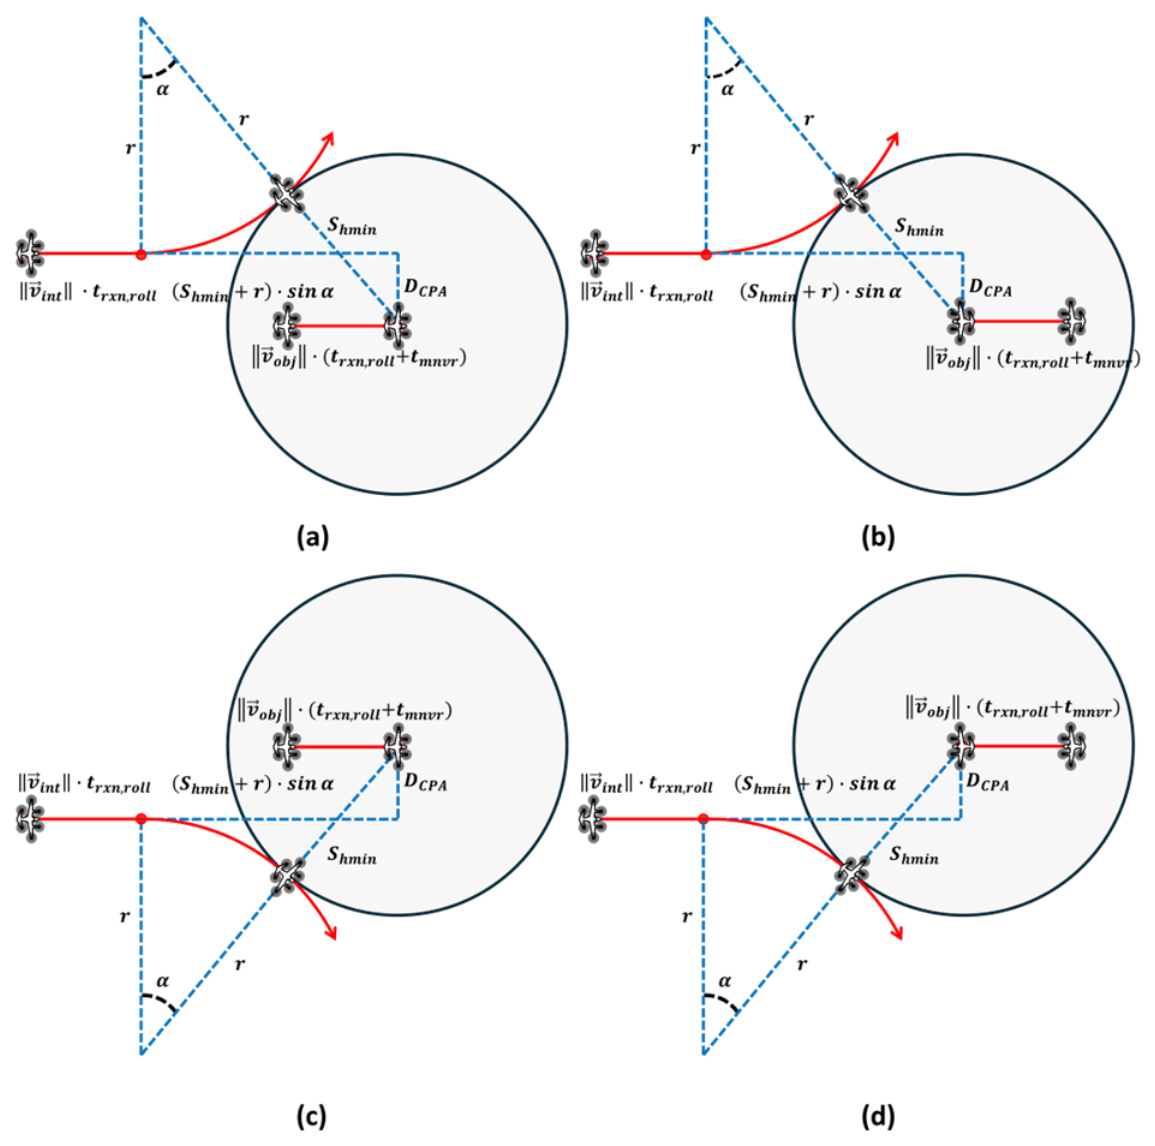
The horizontal overtaking (θ = 0°) and head-on (θ = 180°) conditions are shown in Figure 5. The intruder performs a turn to avoid intrusion into the protected zone of the object when the tracks of the two vehicles are parallel. In Figure 5, the red lines indicate the trajectories s of the vehicles, the blue lines are auxiliary elements used for the distance calculation, and the grey region denotes the protected zone. The same applies to the subsequent scenario figures.
Figure 5.
Plan view of the horizontal alert distance: (a,c) overtaking; (b,d) head-on.
In the horizontal overtaking and head-on scenarios, dh_alrt is determined using Equation (10).
dh_alrt calculates the initial distance between the vehicles required from the moment an alert is issued through controller–pilot communication until the completion of the avoidance maneuver by the intruder. In Equation (10), , , trxn,roll, tmnvr, and α represent the velocity of the intruder (km/h), velocity of the object (km/h), the sum of the controller reaction time and roll response time (s), the time required for the intruder to complete a turn (s), and turn angle (deg), respectively. α, tmnvr, and trxn,roll are, respectively, expressed as Equations (11)–(13)
where tctrl and troll represent the controller reaction and roll response times (s), respectively.
trxn,roll = tctrl + troll,
3.3.3. Horizontal Crossing Scenarios (0° < θ < 180°)
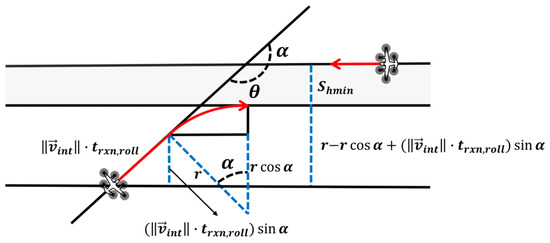
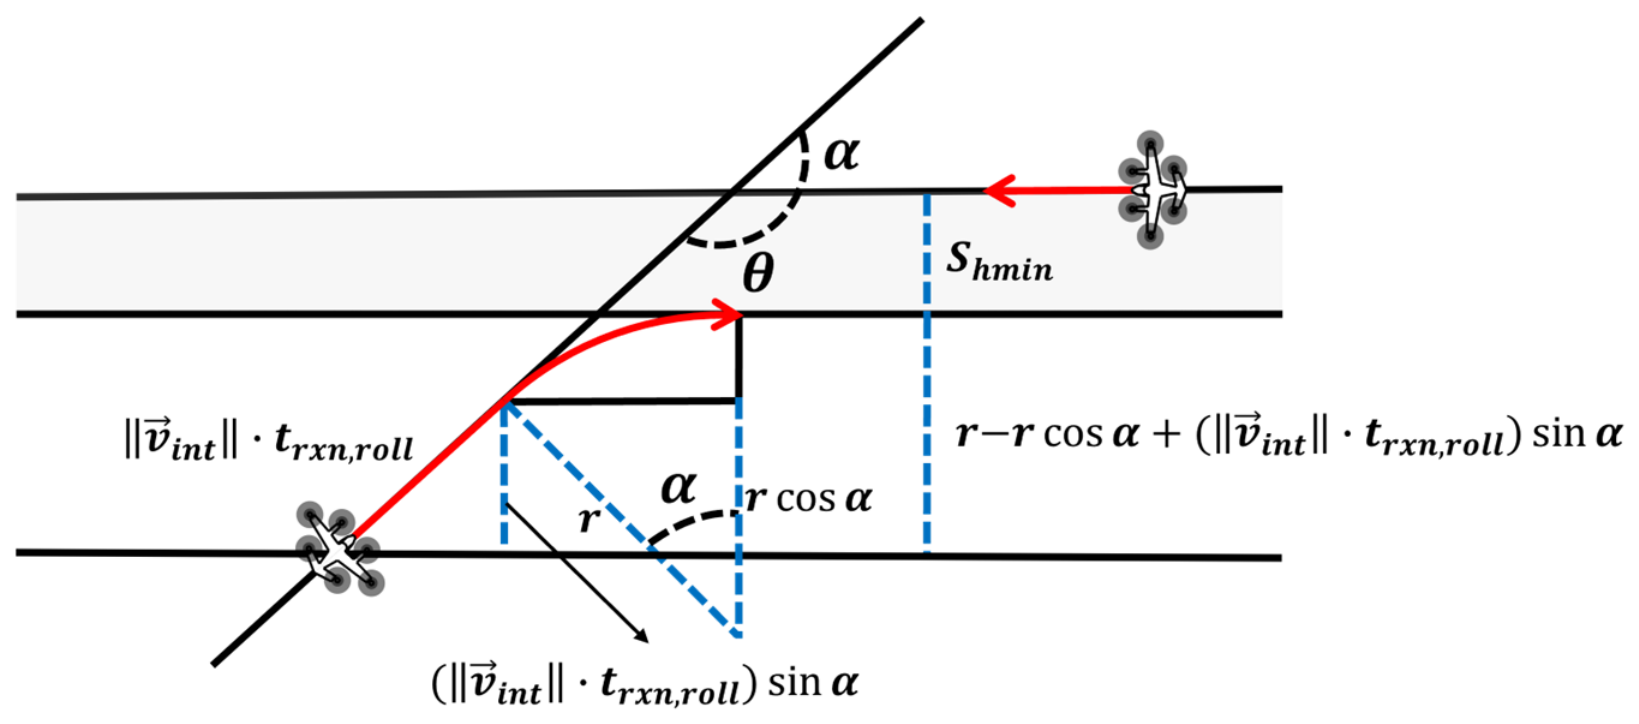
The intruder turns to maintain a safe distance of Shmin from the track of the object when the tracks of the vehicles cross. The horizontal crossing scenarios are classified into acute (0° < θ < 90°) and obtuse (90° ≤ θ < 180°) crossings, with different turn directions applied to each.
- 0° < θ < 90°
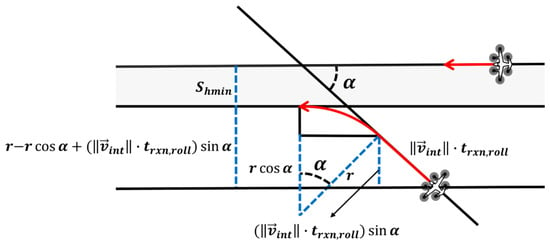
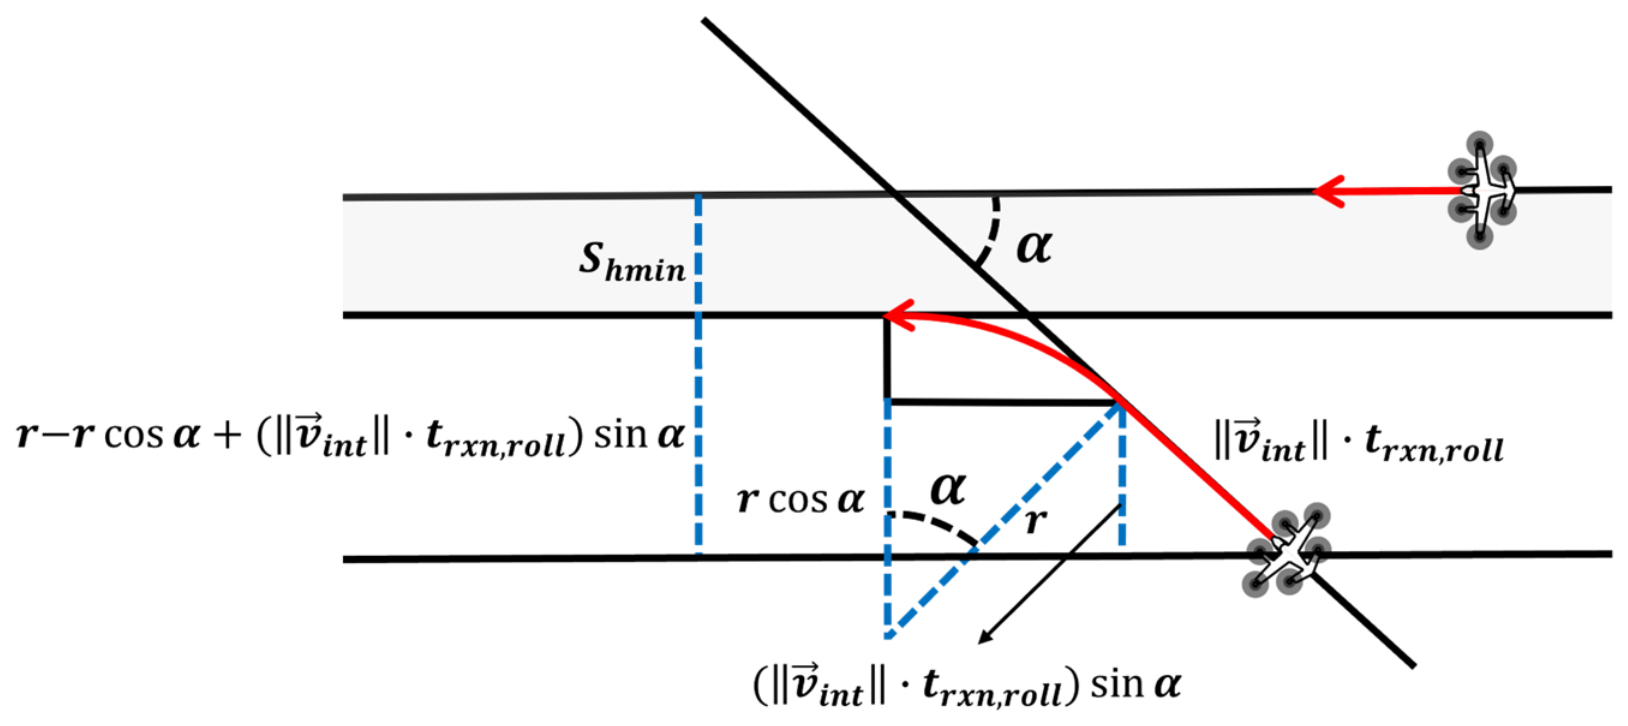
As illustrated in Figure 6, the protected zone is defined as the area within a distance of Shmin from the track of the object when two vehicles cross at an acute angle. The intruder performs a left turn to avoid intrusion into this protected zone. The dh_alrt for this scenario is derived using Equations (14) and (15).
α = θ.
Figure 6.
Plan view of the horizontal alert distance in an acute crossing scenario.
- 90° ≤ θ < 180°
As shown in Figure 7, when the two vehicles cross at an obtuse angle, the protected zones are identical, and the intruder turns right to avoid entering this zone. In this case, dh_alrt is derived using Equations (16) and (17).
α = 180 − θ
Figure 7.
Plan view of the horizontal alert distance in an obtuse crossing scenario.
3.3.4. Vertical Climbing Scenarios
The vertical climbing scenarios are classified into four categories based on the crossing angle, which is identical to the horizontal turning scenarios:
- Two vehicles flying in parallel in the same direction (θ = 0°)
- Two vehicles on crossing tracks with an acute crossing angle (0° < θ < 90°)
- Two vehicles on crossing tracks with an obtuse crossing angle (90° ≤ θ < 180°)
- Two vehicles flying in parallel in opposite directions (θ = 180°)
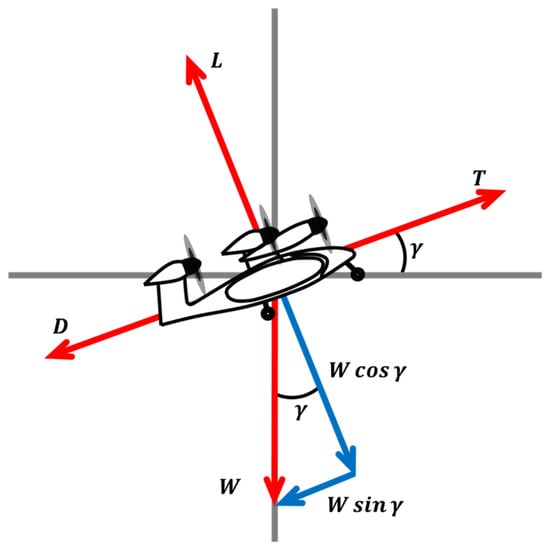
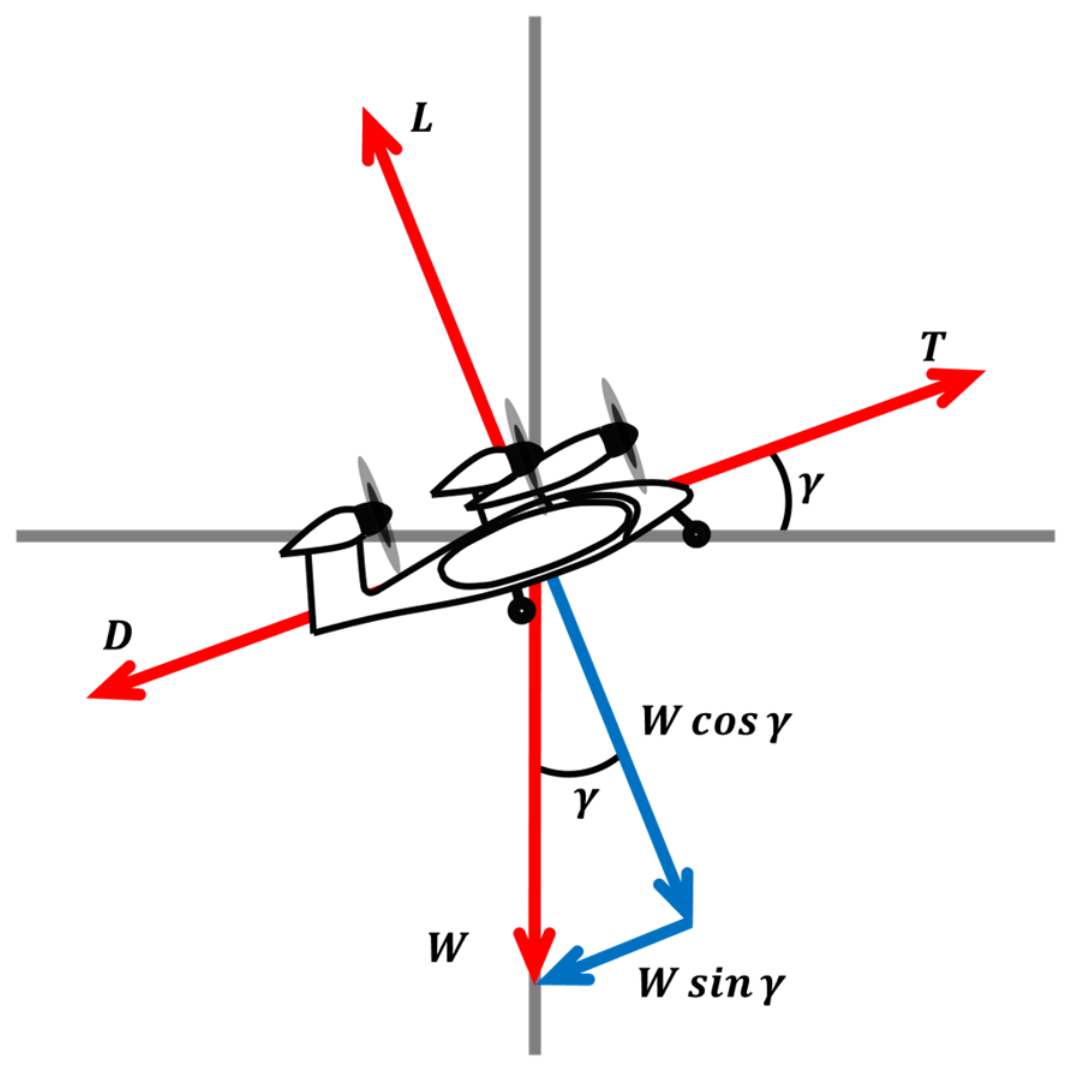
The climb rate of the UAM vehicle must be considered to achieve the minimum vertical separation through climbing. Figure 8 illustrates forces acting on a climbing UAM vehicle.
Figure 8.
Forces acting on a UAM vehicle during a climb.
When a UAM vehicle climbs at a constant speed with a climb angle of γ (deg), the force relationships along the flight direction and the perpendicular direction are, respectively, expressed by Equations (18) and (19):
where T, D, Wsinγ and Wcosγ represent the thrust (N), drag (N), horizontal component of weight along the flight direction (N), and vertical component of weight perpendicular to the flight direction (N), respectively.
T = D + W sinγ,
The rate of climb (C) is a value indicating how much the altitude increases per unit time (m/s), and is calculated using the speed v and climb angle γ as shown in Equation (20):
C = v ⋅ sinγ.
The climb time tclb can be calculated by dividing the required altitude gain Δh by the climb rate as shown in Equation (21):
3.3.5. Vertical Overtaking and Head-On Scenarios (θ = 0° or 180°)
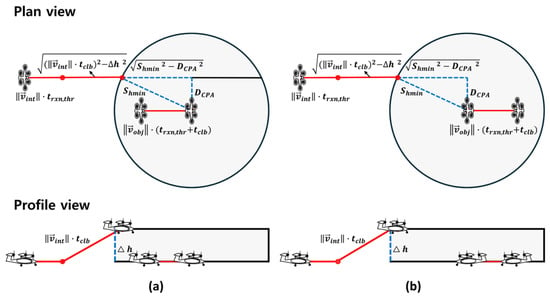
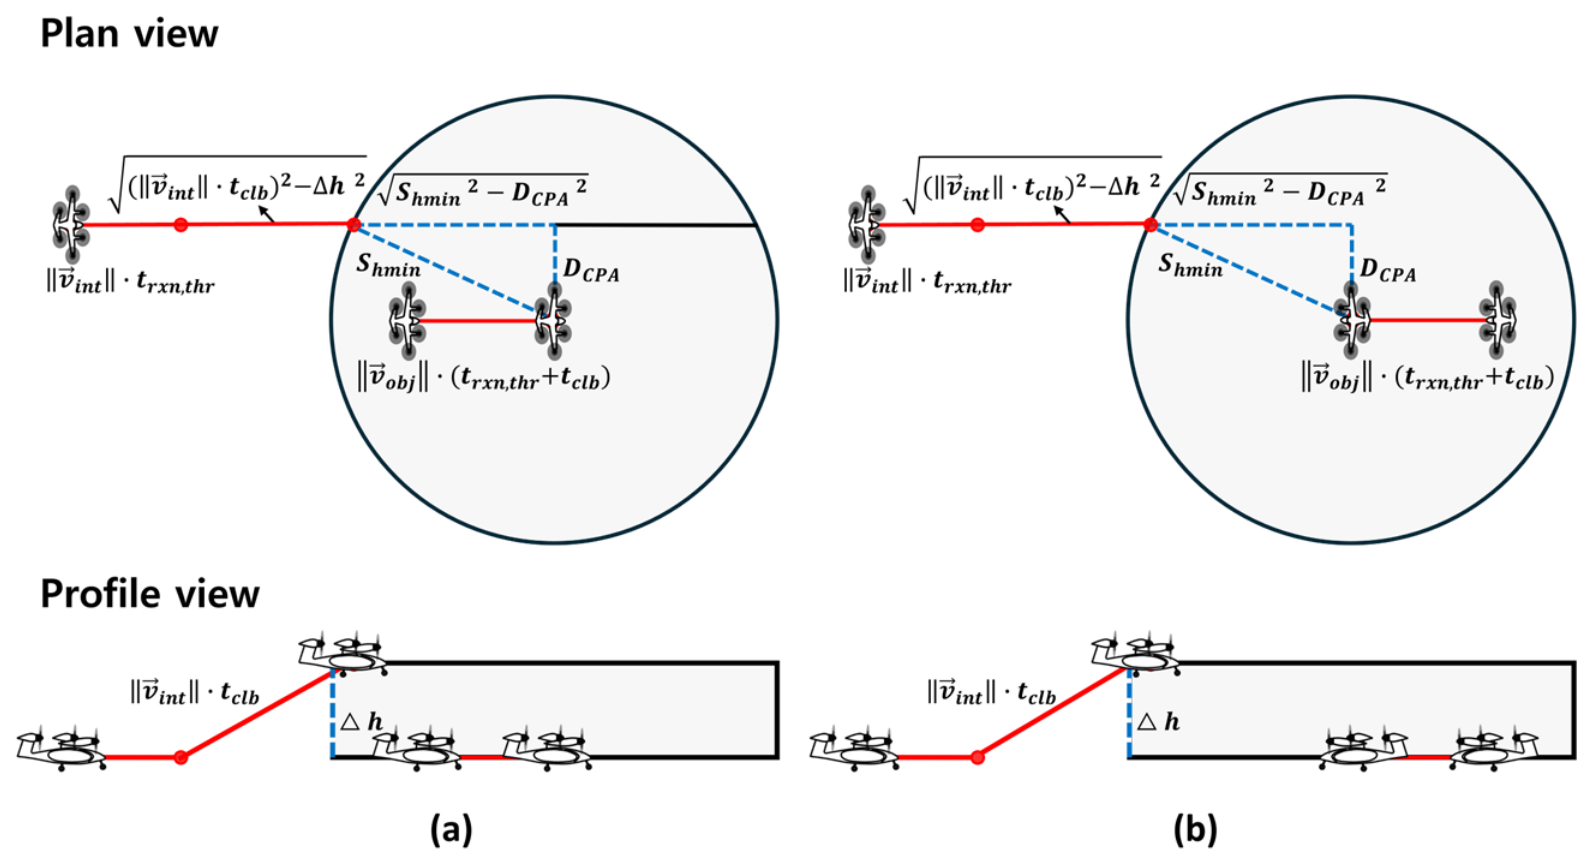
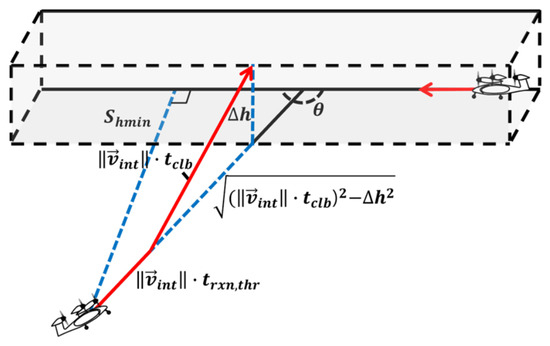
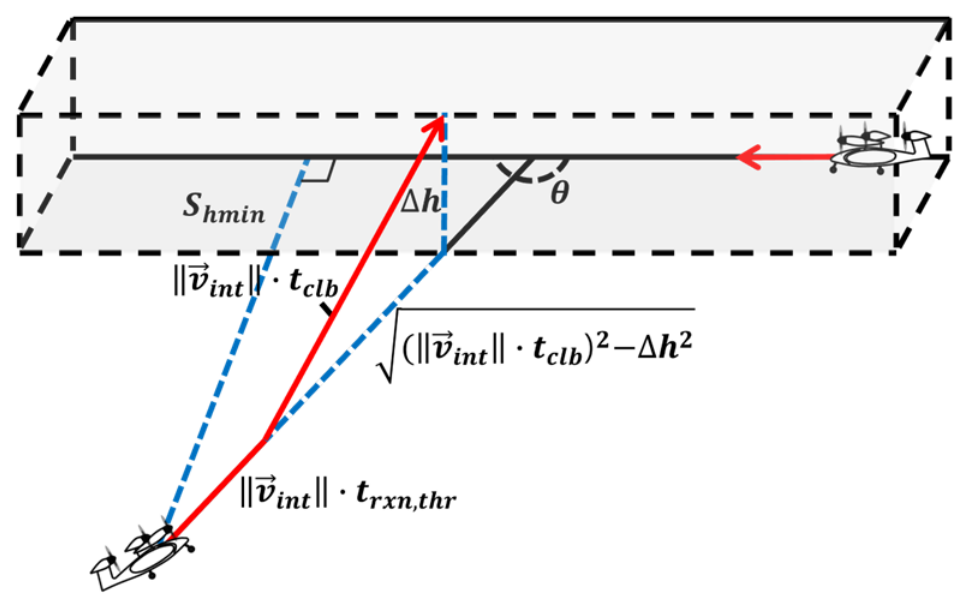
The vertical overtaking and head-on scenarios are shown in Figure 9. The intruder climbs to avoid entering the protected zone of the object, and the horizontal distance between the two UAM vehicles after the climb is set to Shmin.
Figure 9.
Plan and profile views of the vertical alert distance: (a) overtaking; (b) head-on.
In the vertical overtaking and head-on scenarios, dv_alrt is determined using Equation (22):
where lon represents the longitudinal distance between the two vehicles, and lat represents the lateral distance between the two vehicles.
lon is calculated using Equation (23):
where Reaction Phase represents the difference in distance after the two UAM vehicles have traveled during trxn,thr, as expressed by Equation (24):
where Climb Phase represents the difference in horizontal distances traveled by the two vehicles after the intruder has climbed, which is calculated using Equation (25):
where Δh represents the height (m) that the intruder must climb to satisfy Svmin. Buffer represents the distance from the point of entry to the CPA computed using Equation (26):
where trxn,thr represents the sum of the controller reaction time and throttle response time (s), as expressed in Equation (27):
where tthr represents the throttle response time (s).
lon = Reaction phase + Climb Phase + Buffer,
trxn,thr = tctrl + tthr.
lat is the distance between the tracks of the two UAM vehicles, which is equal to DCPA.
lat = DCPA
3.3.6. Vertical Crossing Scenarios (0° < θ < 180°)
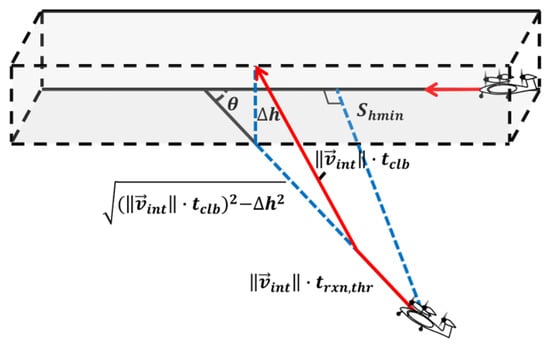
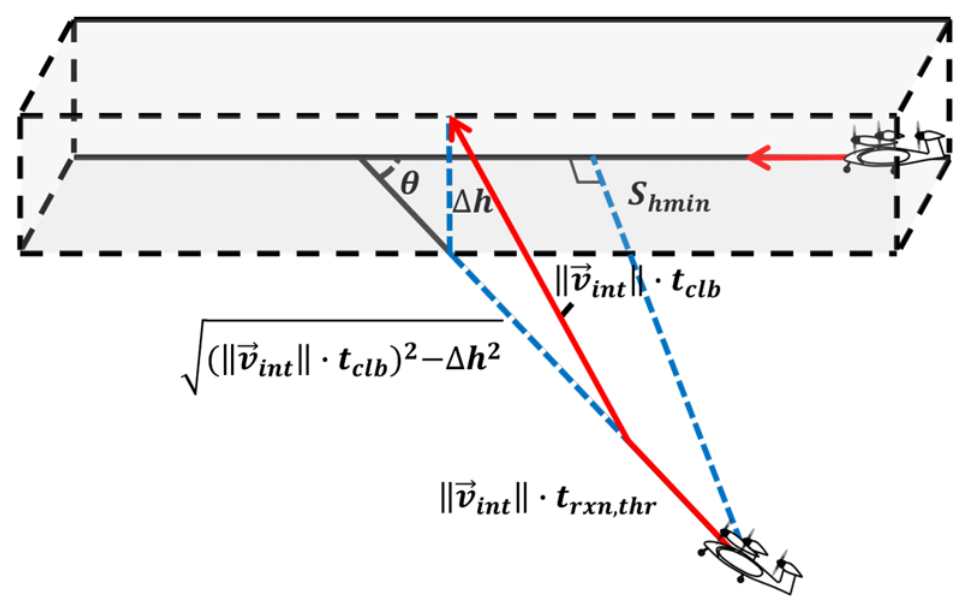
Similar to the horizontal crossing scenarios, the intruder climbs to recover Svmin while maintaining a horizontal distance of at least Shmin from the object track in vertical crossing scenarios. These scenarios are classified into acute and obtuse angles, identical to the horizontal crossing scenarios.
- 0° < θ < 90°
As illustrated in Figure 10, the protected zone is established identically to the horizontal crossing scenario. The horizontal distance between the intruder and the object track after the climb is set to Shmin. The dv_alrt for this scenario is derived using Equation (29).
Figure 10.
Three-dimensional view of the vertical alert distance in an acute crossing scenario.
- 90° ≤ θ < 180°
The obtuse-crossing scenario is illustrated in Figure 11, and the settings are identical to those of the acute-crossing scenario. The dv_alrt for this scenario is derived using Equation (30).
Figure 11.
Three-dimensional view of the vertical alert distance in an obtuse-crossing scenario.
3.4. Determination of the Optimal Avoidance Maneuver and Alert Generation
The more appropriate avoidance maneuver between the two options must be determined after the avoidance distances are calculated for each scenario. In this study, the optimal avoidance maneuver is determined according to the following conditions:
Selecting a longer avoidance distance as the criterion can conservatively enhance safety by advancing the alert issuance timing. However, this may increase the frequency of false alarms in scenarios where there is no actual conflict risk. Furthermore, excessive alerts can induce alert fatigue in controllers, degrading their response capabilities in actual emergency scenarios, which can undermine overall safety.
In contrast, selecting a shorter avoidance distance as the criterion can delay the alert issuance timing, reduce unnecessary alerts, and improve operational efficiency. However, there is a risk that the pilot may not complete the avoidance maneuver within the available response time if the alert issuance timing is excessively delayed.
In this study, the shorter avoidance distance between the two is selected as the alert threshold distance. The shorter avoidance distance implies an efficient maneuver that can restore the minimum separation more rapidly. The possibility of false alerts can be reduced by providing additional time before an alert is issued. In the early UAM operational phase targeted by this study, an onboard pilot is present, and the PSU’s judgment and intervention play a central role. Keeping the alert frequency at a reasonable level is therefore all the more important.
After determining the type of avoidance maneuver, it must be determined whether the current distance between UAM vehicles warrants an alert. The distance criterion for alert issuance is defined differently based on the geometric relationship between the tracks of the two UAM vehicles.
When the UAM tracks are parallel (θ = 0° or 180°), the two vehicles fly in the same or opposite direction, and the horizontal distance Dh between the vehicles serves as a direct indicator of conflict risk. Therefore, the alert issuance is determined by directly comparing the current Dh with the calculated alert distance dh_alrt or dv_alrt.
In contrast, the simple horizontal distance Dh does not serve as an appropriate criterion for alert issuance when the UAM tracks cross (0° < θ < 180°). In crossing scenarios, the intruder’s closeness to the track extension of the object reflects the conflict risk more accurately than the straight-line distance between the vehicles. Accordingly, in crossing scenarios, the perpendicular distance l between the current position of the intruder and the track extension of the object is calculated using Equation (31):
Equation (31) is based on the point-to-line distance formula and expresses the distance between the track extension defined by the velocity vector direction of the object and the intruder as a function of the time variable t.
4. Validation Through Simulation
The algorithm was validated through simulations to verify whether alerts were issued at the appropriate timing. The algorithm was implemented in MATLAB R2024b (The MathWorks, Inc., Natick, MA, USA) on a desktop computer equipped with an Intel® Core™ i7-14700F CPU @ 2.10 GHz (Intel Corp., Santa Clara, CA, USA), 32.00 GB of RAM, and an NVIDIA GeForce RTX 4060 Ti graphics card (NVIDIA Corp., Santa Clara, CA, USA). The average computation time per run was approximately 162 μs. For each of the 25 speed pairs formed from cruise speeds of 180, 220, 250, 280, and 320 km/h, 108 simulations of pairwise encounters were performed. The procedure for each case follows the algorithm flowchart illustrated in Figure 1. The baseline parameters were set to a reaction time of 10 s, a bank angle of 20°, and a climb rate of 900 fpm. In the simulation, the actual reaction time of each case was sampled from the KDE described in Section 4.2.5, and the resulting deviation from the intended separation was measured. The positions and velocity vectors of two randomly generated vehicles are updated, and the conflict-prediction module determines whether the simultaneous violations of the horizontal and vertical separation minima are possible. The conflict-resolution module calculates the horizontal and vertical alert distances based on the crossing angle and determines the alert issuance by comparing the calculated alert distance with the current state when a conflict is predicted. The intruder flies straight during the controller and pilot reaction time when an alert is issued, and then performs a turning maneuver if horizontal avoidance is required or a climbing maneuver if vertical avoidance is required.
Simulation results were analyzed using four indicators: (1) the alert rate is defined as the proportion of cases in which the algorithm issued an alert out of the total cases and was used to analyze the alert trend according to speed combinations; (2) the overshoot rate is defined as the proportion of cases in which the distance between the two vehicles fell below the separation minimum even after the avoidance maneuver, among cases where an alert was issued, and the change was analyzed by reducing Δt; (3) the overshoot distance, defined as the difference between Shmin and the minimum distance between the vehicles after the turning maneuver, was measured using reaction times sampled from the KDE, and the ECDF was derived from these measurements. Based on the ECDF, the margin distance required for each speed pair to avoid violating the separation minima was determined; (4) a sensitivity analysis of the margin distance with respect to the bank angle and the climb rate was performed.
4.1. Assumptions
Simulations were conducted based on the following assumptions:
- The north–east–down (NED) coordinate system was used, where the x-axis represents east, and the y-axis represents north.
- The initial position of each UAM vehicle is randomly generated.
- Each vehicle cruises at a constant altitude on a randomly assigned heading, maintaining that heading until an avoidance maneuver is initiated.
- The velocity of each UAM vehicle remains constant during cruise.
4.2. Simulation Environment Configuration
The simulation results vary based on the parameter values. In this study, the simulations were conducted using the parameters listed in Table 2. All units were converted to the SI unit system before being applied to the equations.
Table 2.
Parameters applied in the simulation.
4.2.1. Prediction Time (tpred)
An appropriate prediction time must be established for STCA alert generation. The computational speed can decrease, and unnecessary predictions may increase if the prediction time is excessively long. Conversely, the time required for the UAM vehicle to perform a sufficient number of turns may not be secured if the prediction time is too short. The Eurocontrol document suggests 80–120 s as an appropriate prediction time. This study adopted the lower bound of the suggested range (80 s) as the prediction time. The speed of UAM vehicles is relatively low, and the traffic volume is not expected to be high during the initial phase. Therefore, 80 s was applied as the default, and it can be adjusted by the user as required.
4.2.2. Cruise Speed
Zewde and Raptis [28] surveyed the currently developing eVTOL-type UAM vehicles and their performance specifications, as presented in Table 3. Examining the maximum speeds of publicly available eVTOL vehicles revealed that the vectored-thrust Joby S4 2.0 (Joby Aviation, Inc., Santa Cruz, CA, USA) exhibited the highest speed at 321.9 km/h, whereas the Lilium Jet (Lilium GmbH, Wessling, Germany) was in the range of 249.4–281.6 km/h. In contrast, the lift-plus-cruise Eve V3 (Eve Air Mobility, Melbourne, FL, USA) and Cora (Wisk Aero LLC, Mountain View, CA, USA) achieved speeds of 241.4 and 177.0 km/h, respectively. Wingless configurations such as the EHang (EHang Holdings Ltd., Guangzhou, China) and Volocopter (Volocopter GmbH, Bruchsal, Germany) series achieved speeds of only 90–102 km/h, suggesting a significant speed variation among vehicles. Considering these vehicle speed performances comprehensively, the viable speed range was determined to be distributed approximately within the 170–320 km/h range. Therefore, in this study, the UAM speeds were set incrementally within this range, with a lower bound of 180 km/h, a median value of 250 km/h, and an upper bound of 320 km/h.
Table 3.
Development status of eVTOL vehicles.
4.2.3. Separation Minima (Shmin, Svmin)
Standard separation minima for UAM operations are yet to be internationally established. According to the Federal Aviation Administration (FAA; UAM ConOps v1.0 and v2.0 [5]), it is expected that pilots will be onboard during the initial UAM operational phase, and operations will be conducted under visual flight rules (VFR). Accordingly, this study adopted the separation minima applied in existing VFR environments to reflect the VFR characteristics of the initial UAM operational environment.
The minimum horizontal separation Shmin was set to 1.5 NM. According to ICAO Doc. 4444, the general horizontal separation minima under radar surveillance-based control environments are 5 NM for en-route airspace and 3 NM for terminal control areas [10]. In contrast, according to FAA Order 7110.65, the VFR aircraft must be separated from VFR and IFR aircraft that weigh more than 19,000 lbs and turbojets by no less than 1.5 NM [29]. This value represents the minimum applicable separation standard currently in effect, and therefore, 1.5 NM was conservatively adopted as the horizontal separation minimum.
The vertical separation minimum Svmin was set to 500 ft. According to ICAO standards, the IFR vertical separation minimum is 1000 ft below FL290 [10]; however, this criterion is predicated on high-altitude aircraft under instrument flight rules. In VFR environments, the FAA applies a vertical separation minimum of 500 ft for VFR aircraft operating within Class B airspace; therefore, this study adopted a vertical separation minimum of 500 ft [29].
However, the separation minima applied in this study are not officially established UAM-specific criteria. These criteria are based on existing air traffic standards for VFR operational environments, and parameter adjustments may be necessary when separation minima suitable for the UAM environment are established in the future.
4.2.4. Bank Angle/Rate of Climb (ϕ, C)
The alert timing is significantly affected by the bank angle and rate of climb. Higher bank angle and rate of climb shorten the time required for avoidance. However, established benchmarks are currently lacking because UAM has not yet been commercialized and is still under development. Therefore, the bank angle specified in the ICAO document was applied for turning, and the helicopter climb rate presented in the Eurocontrol Base of Aircraft Data (BADA) Family H was applied for the rate of climb [30,31].
4.2.5. Pre-Maneuver Reaction Time (trxn.roll, trxn.thr)
This study used the controller reaction time and pilot roll and throttle response time data obtained through the human-in-the-loop process to account for the variability of human factors. The FAA conducted human-in-the-loop experiments to capture actual human response times and behavioral patterns that cannot be reproduced through computer simulation alone. These experiments utilized Airbus A330-200 and Boeing B737-800 simulators to measure controller recognition and pilot response times to hazardous scenarios during simultaneous independent approaches on closely spaced parallel runways [32,33]. Previous studies did not provide specific numerical values for response times; however, these experiments numerically presented the response times of controllers and pilots, facilitating the estimation of PDFs.
Experiments were conducted in two sessions with active FAA controllers monitoring simultaneous approaches on parallel runways spaced 3600 feet apart to measure the controller reaction time. An alert was triggered on the final monitor aid display when one aircraft deviated toward the other with a 30° blunder and violated the no transgression zone, and the time from the moment until the controller pressed the push-to-talk (PTT) button was measured. This was defined as the reaction time of the controller.
The pilots performed simulations of simultaneous Instrument Landing System (ILS) approaches on parallel runways spaced 3000 feet apart to measure the pilot response time. The controller pressed the PTT button to issue an avoidance instruction when a blunder scenario occurred with one aircraft, and the time from that moment until the pilot manipulated the roll or throttle was measured. These were defined as the roll and throttle response times, respectively.
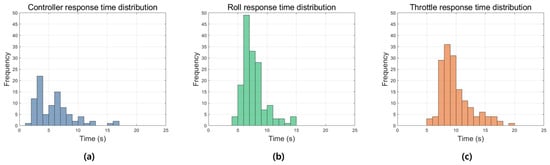
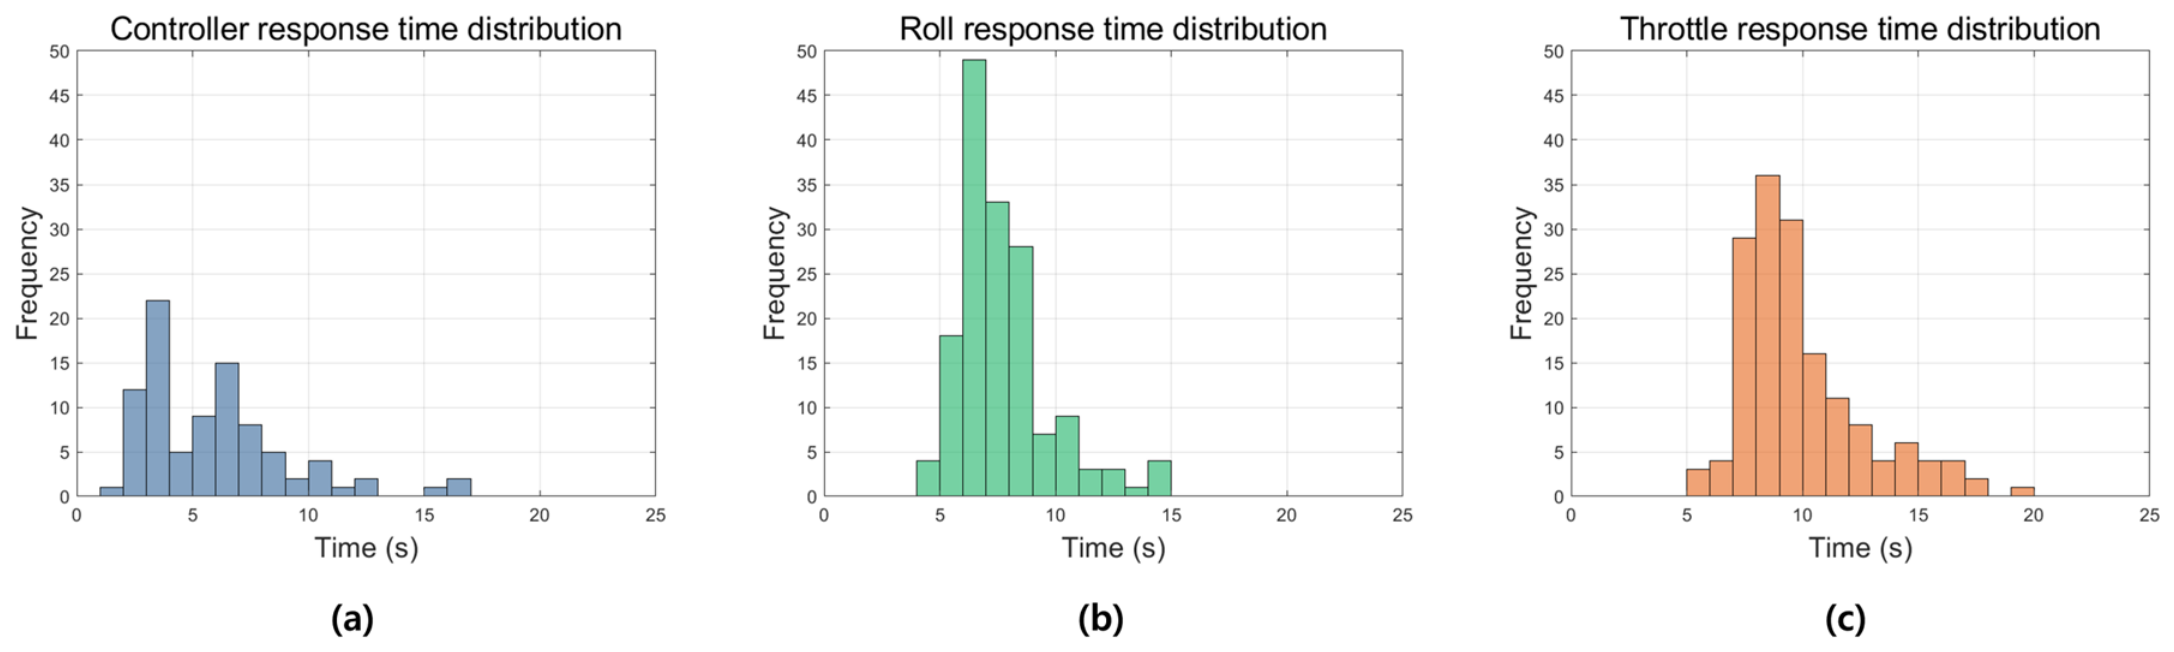
In this study, PDFs were generated based on data derived from previous studies, as shown in Figure 12. The generated PDFs were subsequently used to sample the reaction times for application in the simulations.
Figure 12.
Histograms of response times: (a) controller reaction time, (b) roll response time, and (c) throttle response time.
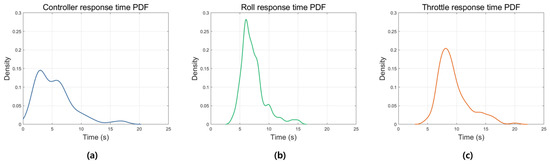
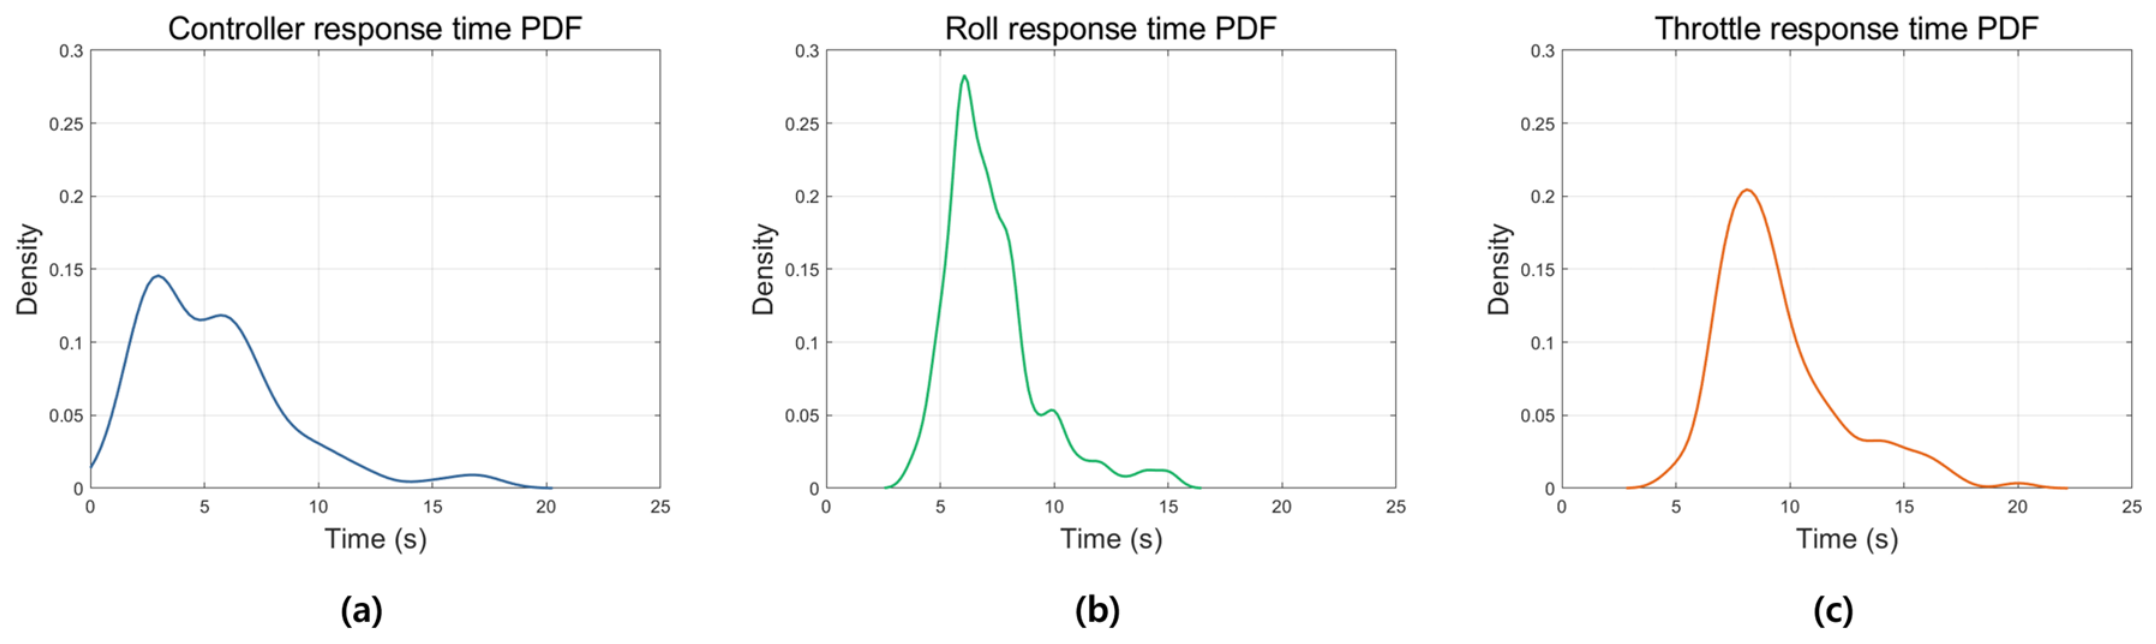
The PDFs for each response time distribution are presented in Figure 13 and were calculated by applying KDE, as shown in Equations (32)–(34).
where fctrl(t; hctrl), nctrl, K, and hctrl represent the PDF of the controller reaction time, the total number of data points for the controller reaction time, kernel function, and bandwidth for calculating fctrl(t; hctrl), respectively.
where froll(t; hroll), nroll, K, and hroll represent the PDF of the roll response time, the total number of data points for the roll response time, kernel function, and bandwidth for calculating froll(t; hroll), respectively.
where fthr(t; hthr), nthr, K, and hthr represent the PDF of the throttle response time, the total number of data points for the throttle response time, kernel function, and bandwidth for calculating fthr(t; hthr), respectively.
Figure 13.
PDFs of response times: (a) controller reaction time, (b) roll response time, and (c) throttle response time.
The bandwidth was determined using Silverman’s rule of thumb, which minimizes the mean integrated squared error, as expressed in Equations (35)–(37) [34].
where σctrl represents the standard deviation of the controller reaction time.
where σroll represents the standard deviation of the roll response time.
where σthr represents the standard deviation of the throttle response time.
4.3. Validation of the Baseline Algorithms
Once the alert conditions defined in Section 3.4 are satisfied, the simulation issues an alert, after which an avoidance maneuver must be performed. The cases in which an alert was issued by the algorithm with the baseline parameters are presented in Table 4.
Table 4.
Cases requiring an alert for conflict avoidance with a Δt of 1 s.
Examining the trend in alert occurrence across speed pairs, the alert rate increased consistently with vint when vobj was held fixed. In contrast, when vint was fixed at a low speed, the alert rate increased with vobj, whereas for vint of 250 km/h and above, the alert rate decreased as vobj increased. This suggests that when vint is low, vobj acts mainly to bring the two vehicles into conflict, whereas when vint is sufficiently high, its role shifts to reducing the occurrence of conflicts between the two vehicles.
For example, when vint was fixed at 180 km/h, 1,895,133 alerts were issued at vobj = 180 km/h, increasing by approximately 10.6% to 2,095,546 at vobj = 250 km/h, and by approximately 17.5% to 2,226,857 at vobj = 320 km/h. In contrast, when vint was fixed at 320 km/h, the number decreased by approximately 8.4% and 14.9% to 3,315,981 and 3,081,295 at vobj = 250 and 320 km/h, respectively.
If an alert was issued and avoidance was performed appropriately, the minimum distance between UAM vehicles should be at or above the separation minimum. However, the simulation results revealed that, at Δt = 1 s, approximately 15–25% of the cases across all speed pairs exhibited protected zone violations, as indicated in Table 5.
Table 5.
Overshoot cases with the baseline parameters (Δt = 1 s).
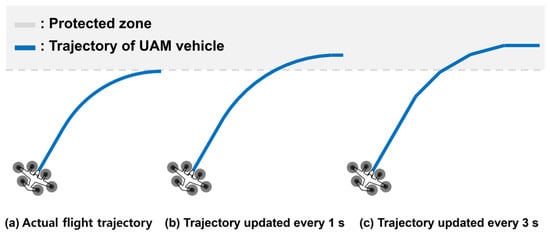
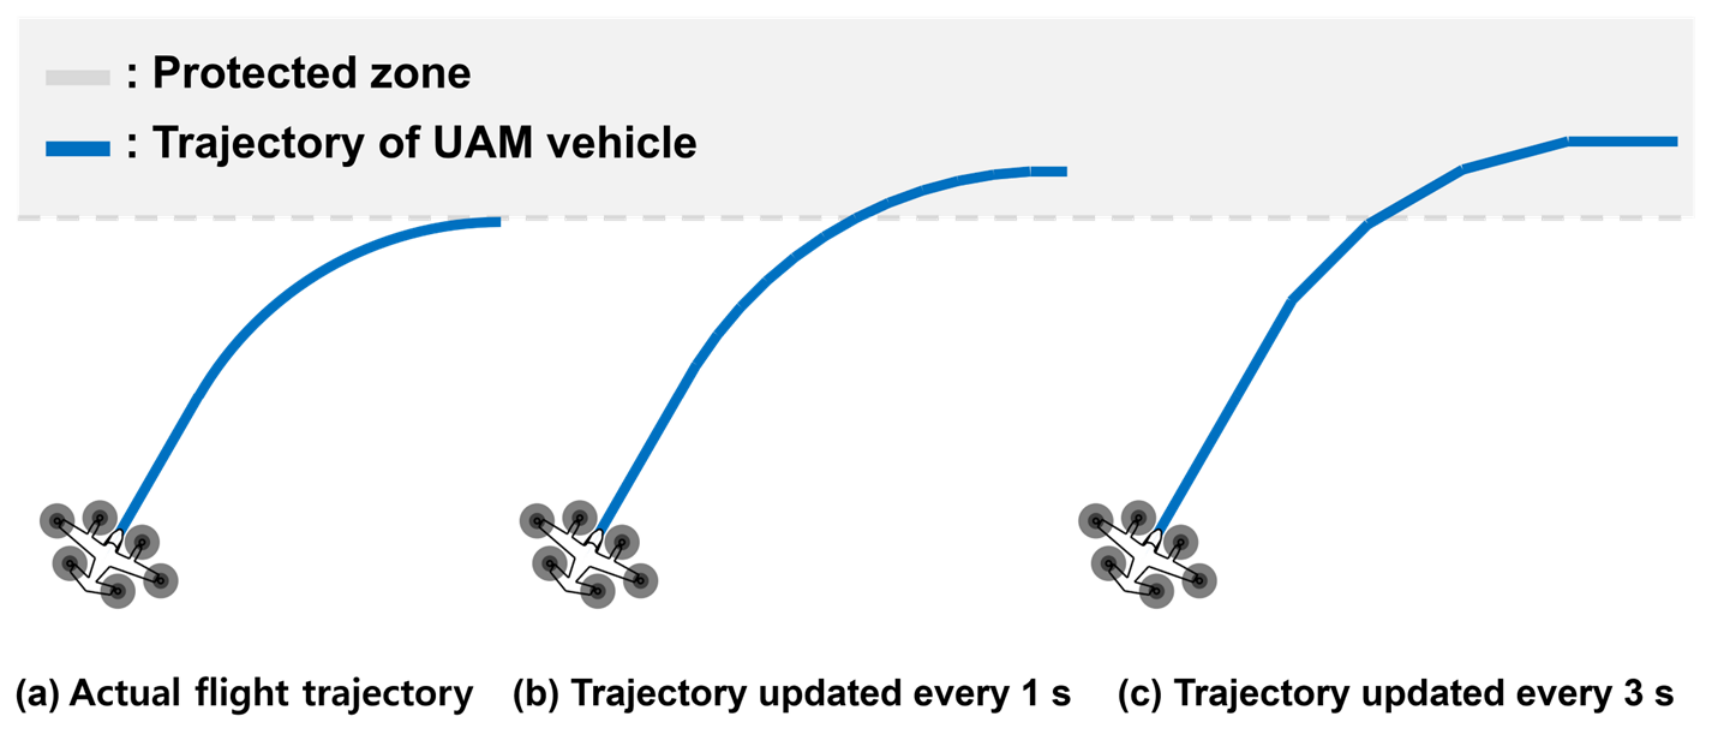
This phenomenon occurs because the time variable t in the algorithm advances in discrete steps of Δt rather than continuously. As shown in Figure 14, an actual aircraft follows a smooth trajectory as shown in Figure 14a. However, a linear movement based on the time variable is assumed owing to the computational characteristics of the simulation, and the error increases as Δt increases from Figure 14b,c. Therefore, the variation in the overshoot distance with Δt was analyzed, where the overshoot distance was computed only for the overshoot cases identified in Table 5.
Figure 14.
Variation in overshoot distance with the Δt: (a) actual flight trajectory, (b) trajectory updated every 1 s, and (c) trajectory updated every 3 s.
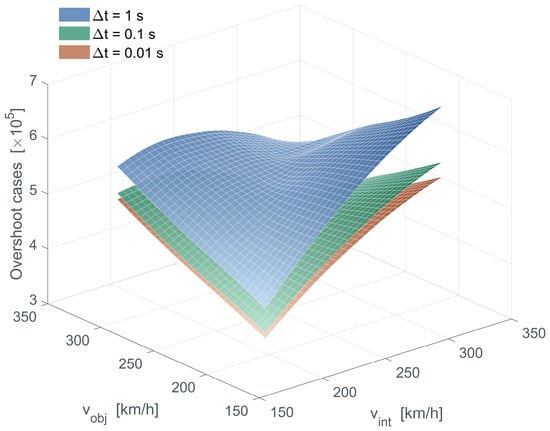
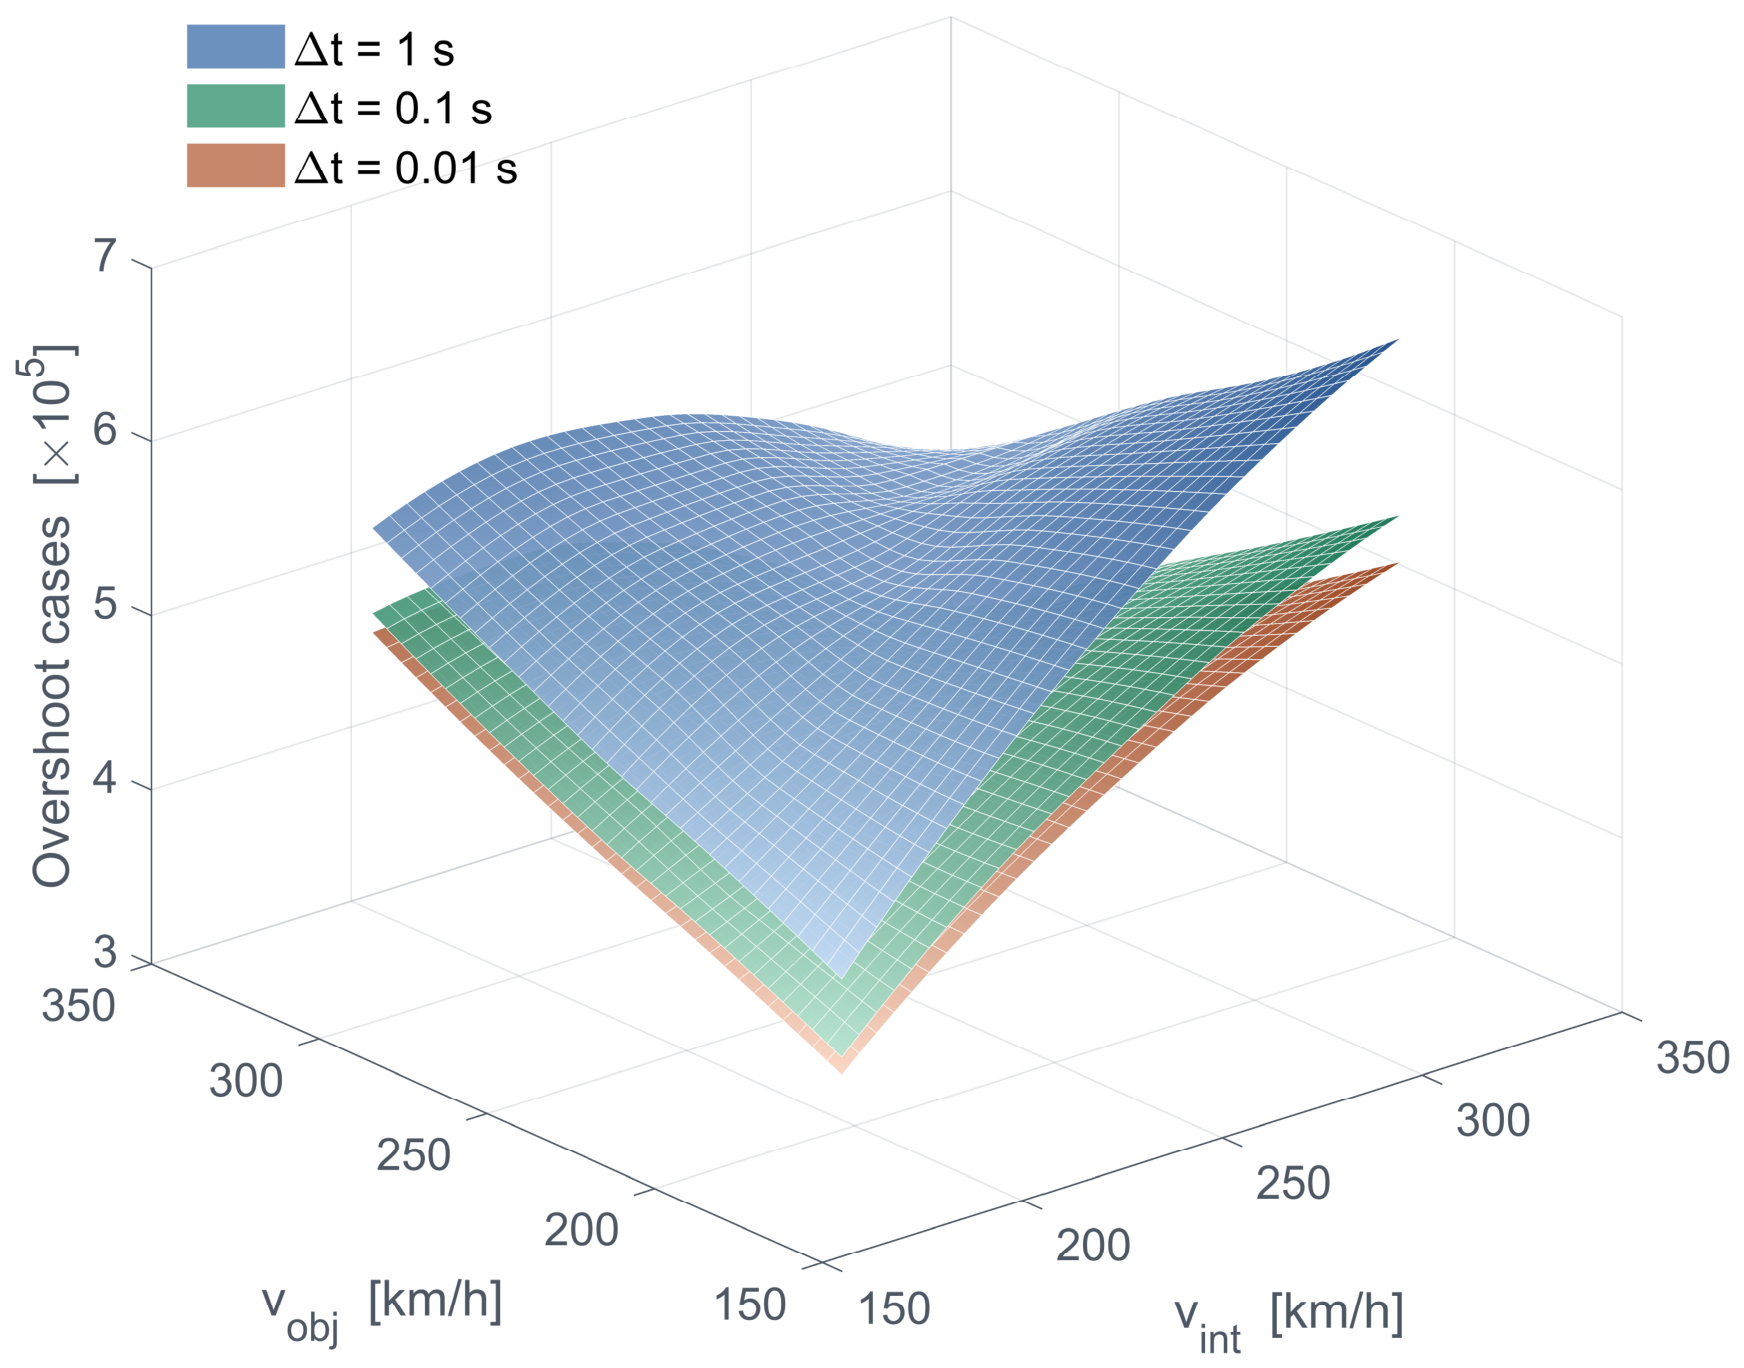
The period Δt is varied from 1 s to 0.1 s and then to 0.01 s, and the changes in overshoot occurrence are analyzed. As indicated in Figure 15, the analysis results confirm that the overshoot rate decreases as Δt decreases across all speed pairs.
Figure 15.
Variation in overshoot cases with a decreasing Δt.
For all Δt, two consistent trends were observed in the overshoot cases. First, for a given vobj, the overshoot rate decreased as vint increased. Second, for a given vint, the overshoot rate decreased as vobj approached vint and increased as vobj exceeded it; consequently, the minimum of each row was located on the diagonal (when vobj = vint). These results suggest that the residual speed difference between the two vehicles after the avoidance maneuver is a key factor in the occurrence of separation violations. After the avoidance maneuver, the intruder flies parallel to the object’s track; when the two speeds are equal, their relative along-track motion vanishes, so the object no longer passes the intruder within the separation minimum.
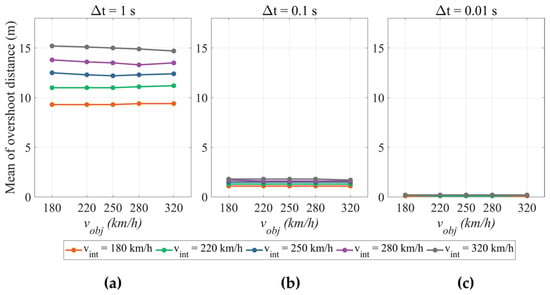
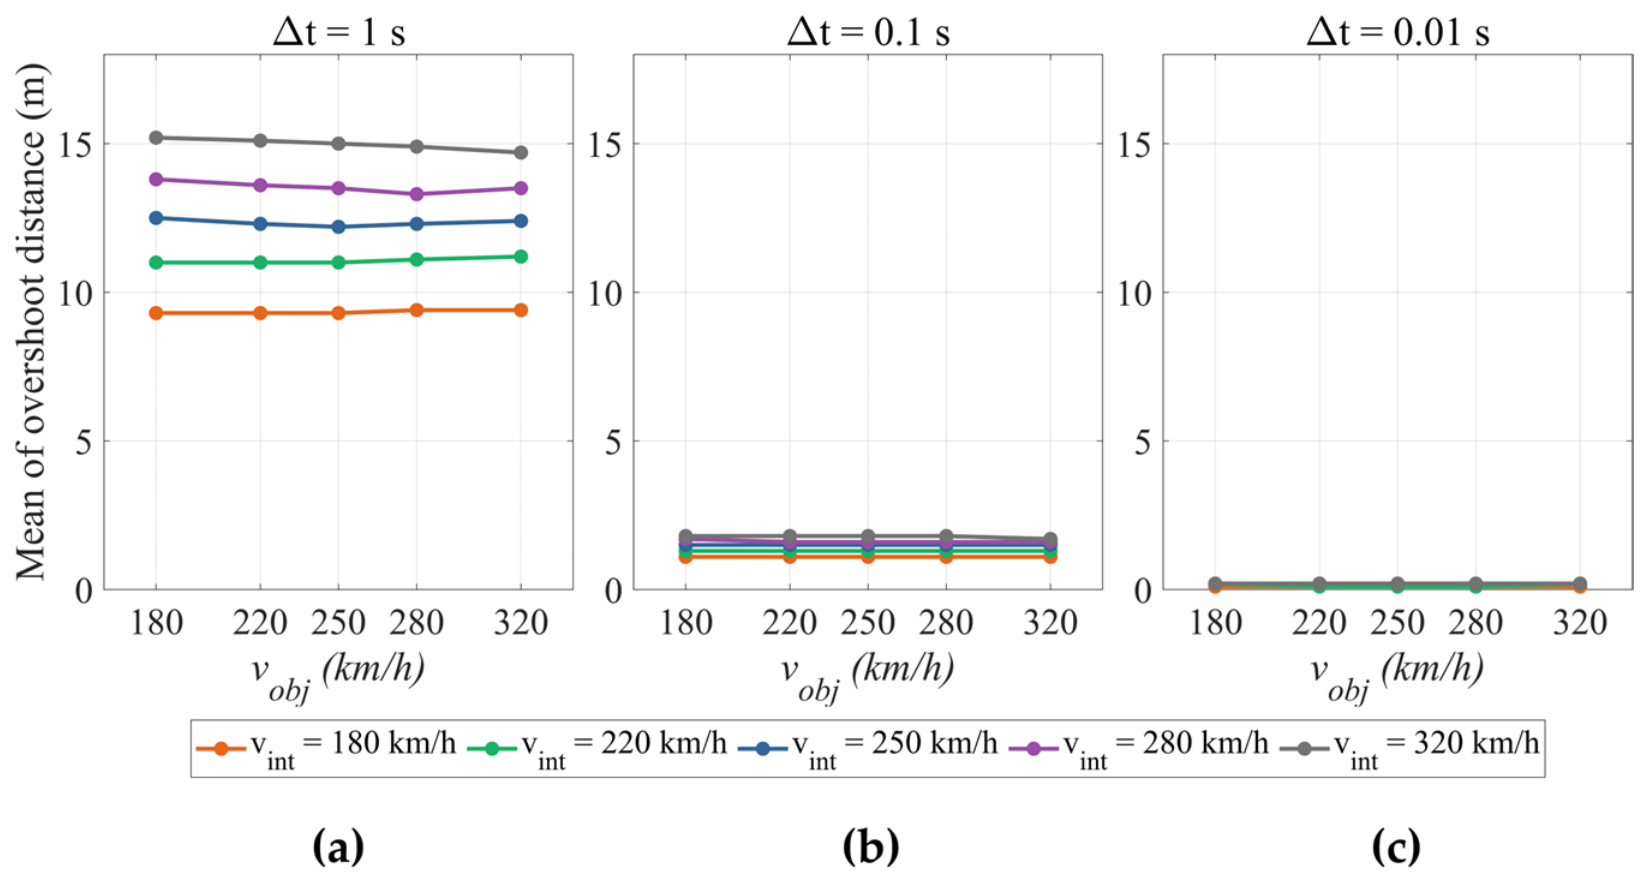
Meanwhile, the improvement obtained by further reducing Δt from 0.1 s to 0.01 s was relatively small compared with that obtained by reducing it from 1 s to 0.1 s. This is because, even when Δt is reduced below a certain level, there remains a fundamental error arising from the linear motion itself over discrete time steps, as shown in Figure 16.
Figure 16.
Variation in the mean overshoot distance with Δt: (a) Δt = 1 s; (b) Δt = 0.1 s; (c) Δt = 0.01 s.
As shown in Figure 16, as Δt decreased from 1 s to 0.01 s, the overshoot distance approached nearly zero. However, this suggests that even if Δt were reduced indefinitely, a minute error would exist between the curved path of an actual aircraft and the straight-line path in the computer calculation. It can also be observed that the overshoot distance is affected by vint regardless of vobj. This is because almost all conflicts occur at crossing angles, in which case the intrusion of the intruder is governed by the perpendicular component of vint, namely vint∙sinθ (or vint∙sin(π − θ) if 90° ≤ θ < 180°). Through this, it was confirmed that the violations that occurred when Δt was 1 s were not errors of the algorithm but limitations of the simulation.
4.4. Incorporation of KDE-Based Reaction Times
The algorithm cannot anticipate the actual human reaction time at the moment an alert is issued. Human reaction times, however, vary from person to person, so the time actually required to initiate an avoidance maneuver may differ from the value assumed in computing the alert distance. To account for this variability, the avoidance maneuver in each simulated case was initiated after a reaction time sampled from the KDE derived in Section 4.2.5. The results of these simulations are presented in Table 6.
Table 6.
Overshoot cases with the sampled reaction times applied (Δt = 1 s).
When the sampled reaction time exceeds the design value, the distance between the vehicles may fall below the separation minima, thereby increasing the risk of a mid-air collision. ICAO generally presents a TLS of 5 × 10⁻⁹ for fatal accidents [35,36]. To determine the margin distance required for each speed pair, the ECDF of the overshoot distance was derived, and the value satisfying the TLS was proposed as the margin distance.
The ECDF is a non-parametric estimator that assigns equal probability mass to each sample and, for any distance d, returns the proportion of samples whose overshoot does not exceed d. It is calculated as shown in Equation (38):
where n denotes the total number of overshoot distances for the speed pair, oi is the overshoot distance of the i-th sample, and 𝟙 is the indicator function, which equals 1 when the specified condition is satisfied and 0 otherwise. When the margin distance is used as a buffer, the probability of an overshoot occurring must be below 5 × 10⁻⁹. Accordingly, the margin distance is calculated as the overshoot distance corresponding to a cumulative probability of p = 1−5 × 10⁻⁹ on the ECDF.
However, the ECDF cannot resolve probabilities smaller than 1/n, where n is the number of overshoot cases; since n is of the order of 106, the ECDF alone cannot reach the target probability of 5 × 10⁻⁹. The GPD is a parametric distribution widely used in extreme value theory to model the tail behavior of data exceeding a high threshold, enabling the estimation of probabilities beyond the observed sample range. The tail of the overshoot distribution was therefore modelled by fitting a GPD to the overshoot distances exceeding a threshold u, set at the 99th percentile, and the margin distance was obtained by extrapolating the fitted tail to the target probability:
where and are the estimated scale and shape parameters, p = 1−5 × 10⁻⁹, and ζu is the proportion of overshoot cases exceeding u. The uncertainty of the extrapolated value was quantified by bootstrap resampling with B = 2000, and the resulting 95% confidence intervals are reported with the margin distances.
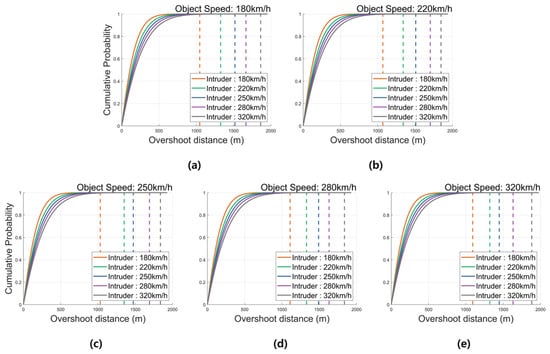
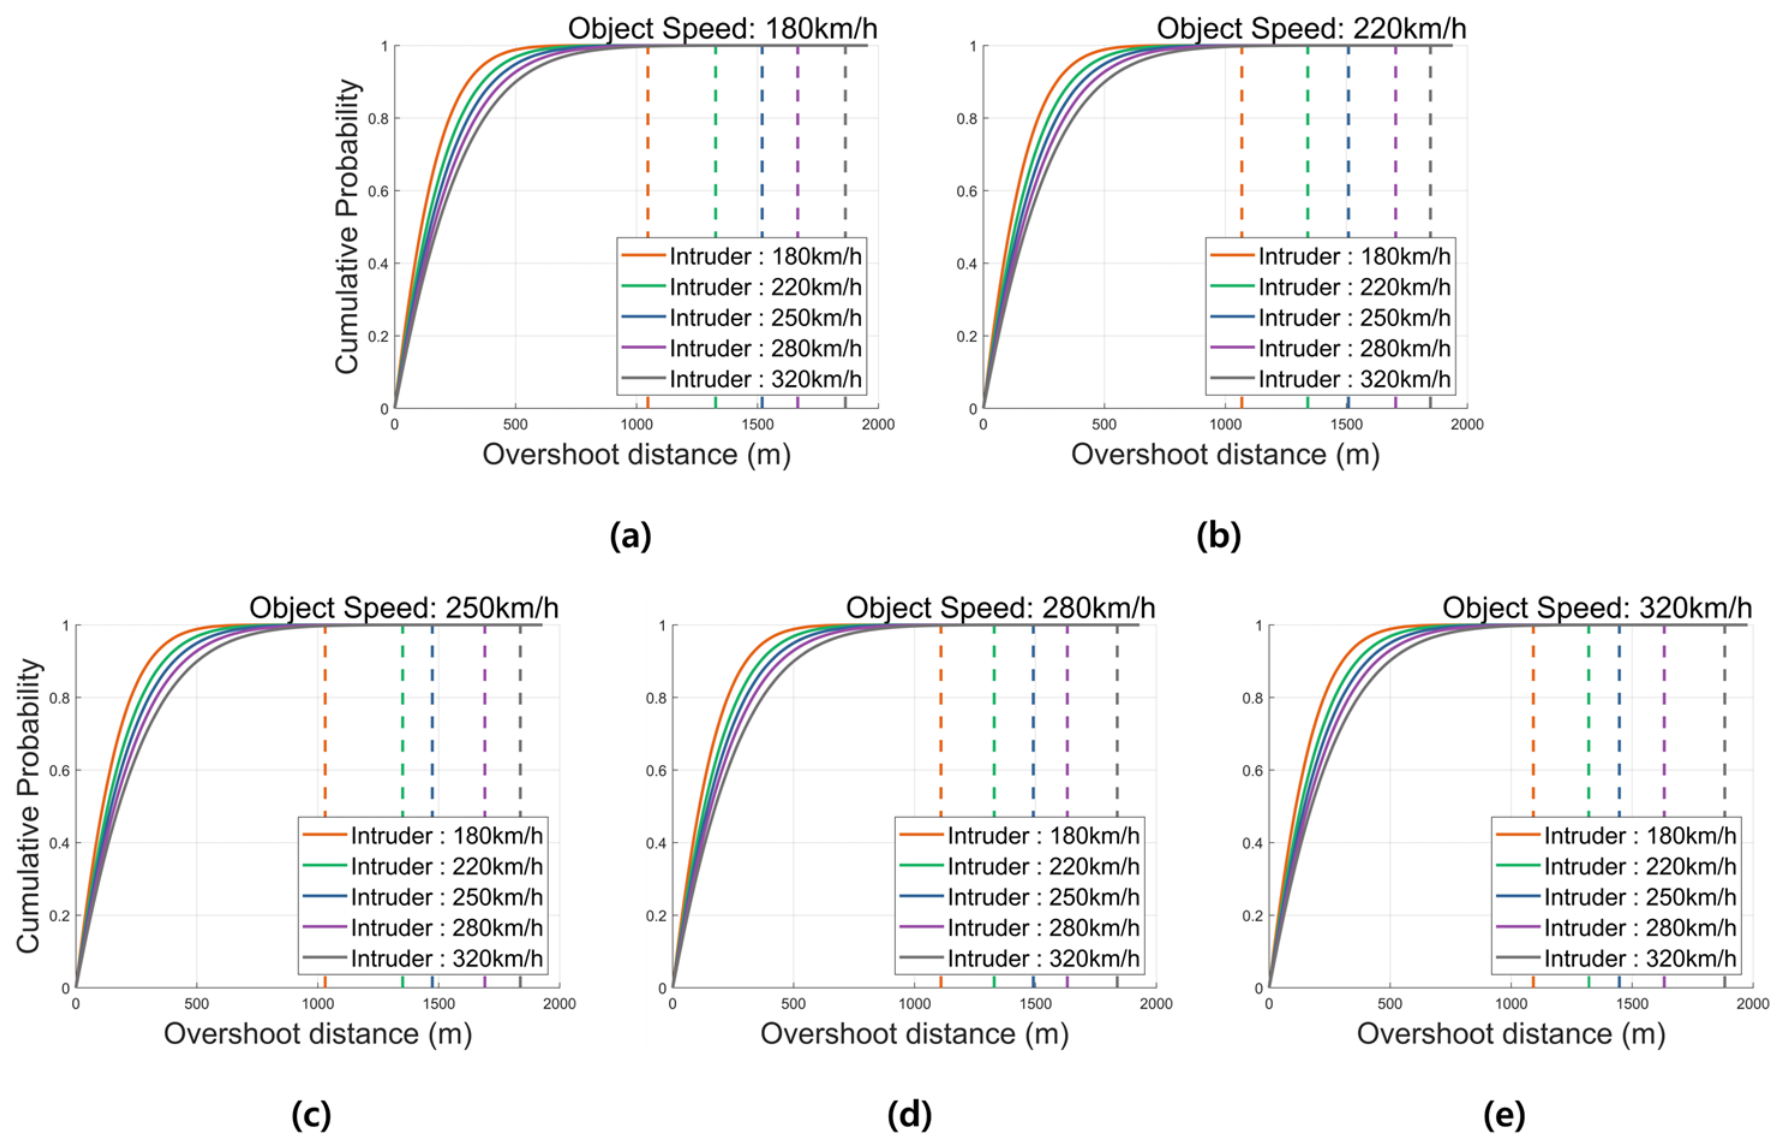
Accordingly, the ECDF derived with the sampled reaction times incorporated at Δt = 1 s is shown in Figure 17.
Figure 17.
ECDF of overshoot distance with Δt of 1 s: (a) object speed: 180 km/h; (b) object speed: 220 km/h; (c) object speed: 250 km/h; (d) object speed: 280 km/h; (e) object speed: 320 km/h.
As shown in Figure 17, the derived margin distance exhibits a pattern similar to the results presented in Figure 16. In each panel, the dashed vertical lines indicate the derived margin distance for the corresponding intruder speed, following the same colour coding as the solid cumulative probability curves. The same convention applies to all subsequent figures presenting cumulative distribution functions. As seen previously, overshoot occurs depending on vint, and consequently the margin distance increases as vint increases. However, owing to the influence of the reaction times sampled from the KDE, the slope of the margin distance with respect to vobj is not close to zero and exhibits irregular values, as presented in Table 7.
Table 7.
Margin distance derived from ECDF with a Δt of 1 s.
These irregularities are consistent with sampling variability: for each vint, the average of the five margin distances across vobj falls within the bootstrap confidence intervals of 24 of the 25 cells, as expected for 95% intervals. They therefore arise from the randomness of the reaction times sampled from the KDE rather than representing a meaningful trend.
4.5. Sensitivity Analysis
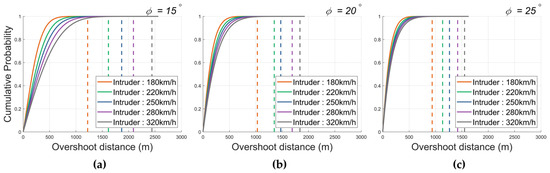
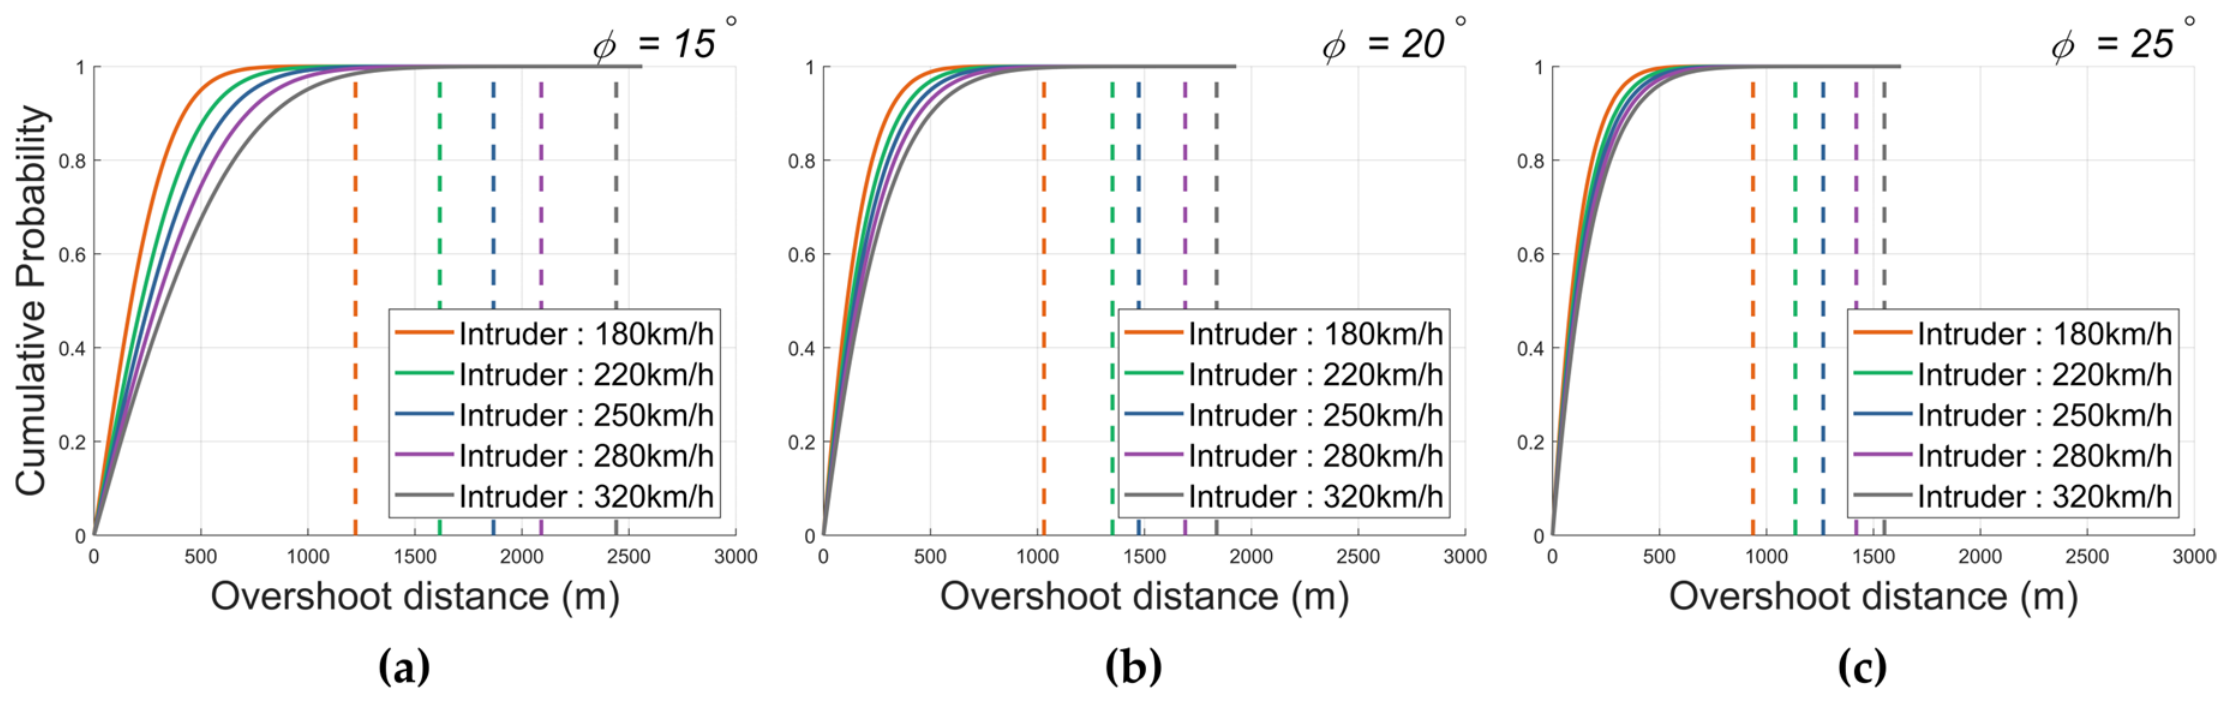
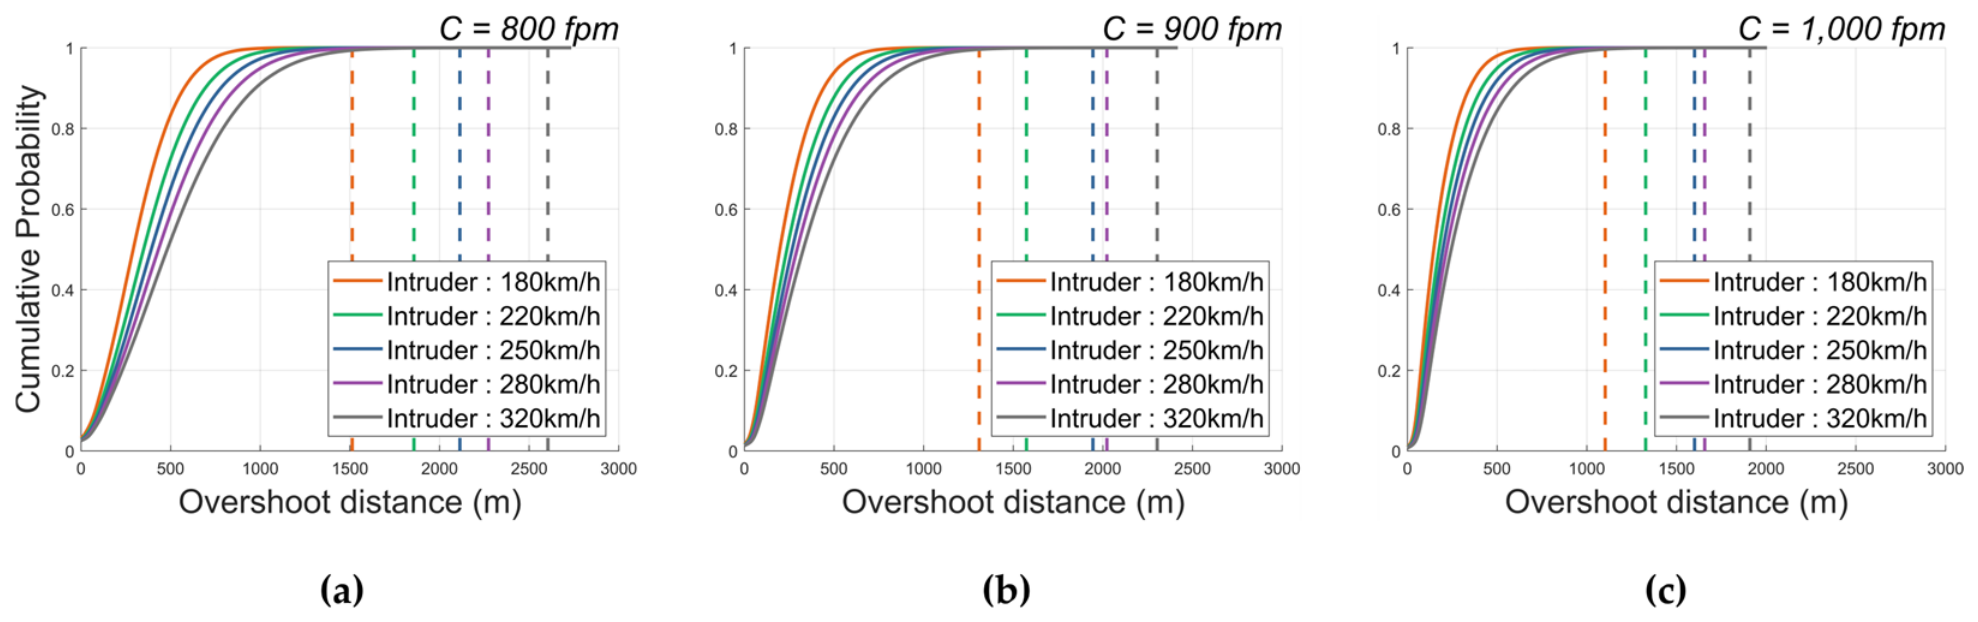
The algorithm computes the alert distances by applying a fixed bank angle and climb rate; however, as with the reaction time, the actual turn and climb may be performed differently from the design values. Therefore, a sensitivity analysis was performed by varying the bank angle over 15°, 20°, and 25° and the climb rate over 800, 900, and 1000 fpm. As shown in the preceding results, the overshoot distance depends on vint; therefore, vobj was fixed at 250 km/h, and the margin distance was derived as a function of vint. The results of the sensitivity analysis with respect to the bank angle are presented in Figure 18.
Figure 18.
Sensitivity analysis of the margin distance with respect to the bank angle (vobj = 250 km/h): (a) bank angle = 15°; (b) bank angle = 20°; (c) bank angle = 25°.
As the bank angle increased from 15° to 25°, the required margin distance decreased. This is because, at the same speed, a larger bank angle yields a higher turn rate, which shortens both the turn radius and the maneuver time tmnvr. This suggests that the risk of separation loss increases when the bank angle actually achieved falls short of the design value, and that the design bank angle should therefore be chosen conservatively; the detailed values are presented in Table 8.
Table 8.
Margin distance by vint with respect to the bank angle (vobj = 250 km/h).
In the baseline algorithm, the same design reaction time of 10 s is applied to both maneuvers; therefore, the values of the reaction-phase terms are identical and do not affect the comparison between the two alert distances. Consequently, the selection is determined by the geometric terms. Comparing Equations (14) and (29) for acute crossings and Equations (16) and (30) for obtuse crossings, and using (1 − cosθ′)/sinθ = tan(θ′/2), dv_alrt becomes shorter than dh_alrt when
where θ′ = θ for acute crossings and θ′ = 180° − θ for obtuse crossings. That is, the horizontal distance travelled during the climb must be shorter than the lateral displacement produced by the turn. Since tan(θ′/2) increases with θ′ and reaches its maximum value of 1 at θ′ = 90°, this condition is least restrictive when the crossing is perpendicular, and it reduces to
At θ′ = 90°, this requires a rate of climb exceeding approximately 1530 fpm at 250 km/h, and approximately 1200 fpm even at 320 km/h. Since these thresholds exceed the 800–1000 fpm range applied in the current algorithm, horizontal avoidance was always selected in the baseline algorithm. Therefore, the sensitivity analysis with respect to the rate of climb was performed with only vertical avoidance applied, in order to evaluate the effect of the rate of climb on the margin distance. The results of this sensitivity analysis are presented in Figure 19.
Figure 19.
Sensitivity analysis of the margin distance with respect to the rate of climb (vobj = 250 km/h): (a) rate of climb = 800 fpm; (b) rate of climb = 900 fpm; (c) rate of climb = 1000 fpm.
As with the bank angle, the required margin distance decreased as the rate of climb increased from 800 fpm to 1000 fpm. A higher rate of climb shortens the horizontal distance travelled during the climb and also reduces the climb time tclb. This result suggests that the rate of climb should also be set conservatively in the design. The detailed values are presented in Table 9.
Table 9.
Margin distance by vint with respect to the rate of climb (vobj = 250 km/h).
5. Conclusions
This study proposed an STCA algorithm suited to UAM operations. Conventional STCA is designed for manned aircraft and does not account for the avoidance maneuver required to maintain separation after an alert, which makes it difficult to apply directly to UAM operating in low-altitude urban airspace. The proposed algorithm therefore comprises a conflict-prediction module and a conflict-resolution module that accounts for the avoidance maneuver, and the alert distances required for horizontal turning and vertical climbing avoidance were derived analytically for each encounter type—overtaking, head-on, acute crossing, and obtuse crossing.
To validate the algorithm, five cruise speeds were selected within the 180–320 km/h range, considering the speeds of UAM vehicles under development, forming 25 speed pairs, and 108 pairwise encounters with random initial positions and headings were simulated for each pair. The baseline parameters were set to a design reaction time of 10 s, a bank angle of 20° based on ICAO PANS-OPS, and a rate of climb of 900 fpm based on BADA Family H.
The principal findings are as follows: (1) For a fixed vobj, the alert rate increased consistently with vint. The effect of vobj, however, depended on vint: at low vint, the alert rate increased with vobj, whereas for vint of 250 km/h and above it decreased. This suggests that the role of vobj shifts from bringing the two vehicles into conflict to reducing the occurrence of conflicts. (2) Under the baseline parameters, reducing Δt from 1 s to 0.01 s decreased both the overshoot rate and the overshoot distance, and at 0.01 s the overshoot distance nearly converged to zero. Furthermore, the overshoot distance was determined by the perpendicular component of the intruder velocity, vint∙sinθ, independently of vobj. (3) When the actual reaction times sampled from the KDE were applied, violations of the separation minima occurred owing to the difference from the design reaction time. The margin distance was derived from the ECDF of the overshoot distance and determined as the value corresponding to the cumulative probability of 1 − 5 × 10⁻⁹, which corresponds to the ICAO target level of safety. At Δt = 1 s, the margin distance was determined to range from 1031 to 1882 m, with confidence half-widths of approximately ±3.5%. (4) The sensitivity analysis showed that the required margin distance decreased as the bank angle increased from 15° to 25° and as the rate of climb increased from 800 to 1000 fpm. This implies that the risk of separation loss increases when the actual maneuver performance falls short of the design values, and suggests that the design bank angle and rate of climb should be set conservatively. Furthermore, when the same design reaction time is applied, vertical avoidance is selected only when the horizontal distance travelled during the climb is shorter than the lateral displacement produced by the turn; since this requires a rate of climb of approximately 1530 fpm or higher at 250 km/h, horizontal avoidance was always selected within the performance range of current vehicles.
Nevertheless, this study has several limitations: (1) Owing to the lack of UAM performance data, the performance of some existing aircraft was applied. As confirmed by the sensitivity analysis, the bank angle and the rate of climb affect the required margin distance; the results should therefore be refined using the performance data that will become available as UAM flight tests are actively conducted. (2) Because the algorithm was applied only to pairwise encounters, secondary conflicts with other UAM that may arise during the avoidance maneuver, and the resulting chain of interactions, were not considered. Since traffic volume will increase once UAM commercialization is established, further research addressing the interactions caused by avoidance maneuvers in environments with multiple UAM is required. (3) Only the climb maneuver was applied for vertical avoidance. This reflects the restriction on descent in low-altitude urban environments densely populated with buildings and other obstacles; the proposed algorithm is therefore intended for low-altitude urban airspace. In suburban airspace free of obstacles, by contrast, descent may also be considered as a means of avoidance. Moreover, although horizontal avoidance was always selected under the conditions of this study, there are situations in which turning is restricted by corridor boundaries or surrounding traffic, or in which climbing is impossible because the vehicle is already at its maximum operating altitude. Further research is therefore needed on vertical avoidance that selectively applies climb or descent depending on the operating environment. (4) The effect of wind was not considered. Urban environments are characterized by spatially and temporally non-uniform winds, such as building-induced winds, channelling between structures, and vertical shear, which may introduce uncertainty into vehicle trajectories and avoidance maneuvers. Capturing the uncertainty of the urban wind field requires a dedicated study coupling an urban wind field model with the vehicle response, which is identified as a principal direction for future work.
Despite these limitations, this study was significant because it proposed a warning system for UAM operations and was expected to be immediately applicable to the initial phase, where operations were conducted by pilots and the PSU. Furthermore, it is expected that the algorithm can also be applied to the transition toward unmanned flight operations in the future through parameter adjustments.
6. Patents
A Korean patent application arising from the work reported in this manuscript was filed on 25 February 2026 by the University-Industry Cooperation Foundation of Korea Aerospace University, with all authors named as inventors. The application is currently under examination and has not yet been granted.
Author Contributions
Conceptualization, M.S.K. and H.K.; methodology, M.S.K., S.-i.C. and H.K.; software, M.S.K. and S.P.; validation, M.S.K., S.-i.C. and J.W.P.; formal analysis, M.S.K.; investigation, M.S.K.; data curation, M.S.K.; writing—original draft preparation, M.S.K.; writing—review and editing, M.S.K., S.-i.C., J.W.P. and H.K.; visualization, M.S.K.; supervision, H.K.; project administration, H.K.; funding acquisition, H.K. All authors have read and agreed to the published version of the manuscript.
Funding
This work was supported by the GRRC program of Gyeonggi Province [(GRRCAerospace 2023-B03), Fusion Technology Research Center for Advanced Air Mobility].
Data Availability Statement
Data are contained within the article.
Acknowledgments
During the preparation of this manuscript, the authors used Gemini 3.1 Pro (Google LLC, Mountain View, CA, USA) for the purposes of writing code for simulations and graph generation. The authors have reviewed and edited the output and take full responsibility for the content of this publication. All authors are named inventors on a Korean patent application covering the algorithm presented in this manuscript, which is currently pending, as stated in the Patents section.
Conflicts of Interest
The authors declare no other conflicts of interest. The funders had no role in the design of the study; in the collection, analyses, or interpretation of data; in the writing of the manuscript; or in the decision to publish the results. Author Sang-il Choi was employed by the company INOSKY Co., Ltd. The remaining authors declare that the research was conducted in the absence of any commercial or financial relationships that could be construed as a potential conflict of interest.
Abbreviations
The following abbreviations are used in this manuscript:
| EVTOL | Electric Vertical Take-Off and Landing |
| UAM | Urban Air Mobility |
| UATM | UAM Air Traffic Management |
| ATM | Air Traffic Management |
| STCA | Short-Term Conflict Alert |
| CD | Conflict Detection |
| CD&R | Conflict Detection and Resolution |
| PSU | Provider of Services for UAM |
| TLS | Target Level of Safety |
| ECDF | Empirical Cumulative Distribution Function |
| GPD | Generalized Pareto Distribution |
| CPA | Closest Point of Approach |
| ACAS | Airborne Collision Avoidance System |
| Probability Density Function | |
| KDE | Kernel Density Estimation |
| FAA | Federal Aviation Administration |
| EUROCONTROL | European Organization for the Safety of Air Navigation |
| NED | North-East-Down |
| VFR | Visual Flight Rules |
References
- Chae, M.; Kim, S.H.; Kim, M.; Park, H.; Kim, S.H. Potential market based policy considerations for urban air mobility. J. Air Transp. Manag. 2024, 119, 102654. [Google Scholar] [CrossRef] [Scilit]
- Pascioni, K.A.; Rizzi, S.A.; Schiller, N.H. Noise Reduction Potential of Phase Control for Distributed Propulsion Vehicles. In Proceedings of the AIAA Scitech 2019 Forum, San Diego, CA, USA, 7–11 January 2019. [Google Scholar] [CrossRef] [Scilit]
- Zhang, J.; Liu, Y.; Zheng, Y. Overall eVTOL aircraft design for urban air mobility. Green Energy Intell. Transp. 2024, 3, 100150. [Google Scholar] [CrossRef] [Scilit]
- Kadhiresan, A.R.; Duffy, M.J. Conceptual Design and Mission Analysis for eVTOL Urban Air Mobility Flight Vehicle Configurations. In Proceedings of the AIAA Aviation 2019 Forum, Dallas, TX, USA, 17–21 June 2019. [Google Scholar] [CrossRef] [Scilit]
- U.S. Department of Transportation, Federal Aviation Administration. Urban Air Mobility (UAM) Concept of Operations 2.0; Federal Aviation Administration: Washington, DC, USA, 2023; pp. 1–42.
- Pak, H.; Asmer, L.; Kokus, P.; Schuchardt, B.I.; End, A.; Meller, F.; Schweiger, K.; Torens, C.; Barzantny, C.; Becker, D.; et al. Can Urban Air Mobility become reality? Opportunities and challenges of UAM as innovative mode of transport and DLR contribution to ongoing research. CEAS Aeronaut. J. 2024, 16, 665. [Google Scholar] [CrossRef] [Scilit]
- Schatzman, N.L.; Weist, L.; Bain, J.J.; Thai, A.D. Acoustic Testing of the Joby Aviation Propeller in the National Full-Scale Aerodynamics Complex 40- by 80-Foot Wind Tunnel. In Proceedings of the AIAA SCITECH 2025 Forum, Orlando, FL, USA, 6–10 January 2025. [Google Scholar] [CrossRef] [Scilit]
- UAM Team Korea. K-UAM Concept of Operations 1.5; Ministry of Land, Infrastructure and Transport: Sejong, Republic of Korea, 2025; p. 11. [Google Scholar]
- Choi, S.; Yang, Y.; Kim, H. Establishing Corridor Design Standards for Operational Safety of Urban Air Mobility Vehicles. Int. J. Aeronaut. Space Sci. 2025, 27, 863, Correction in Int. J. Aeronaut. Space Sci. 2026, 27, 876. https://doi.org/10.1007/s42405-025-00960-4. [Google Scholar] [CrossRef] [Scilit]
- International Civil Aviation Organization (ICAO). Doc 4444: PANS-ATM (Air Traffic Management), 16th ed.; ICAO: Montreal, QC, Canada, 2016; pp. 1–502. [Google Scholar]
- Tang, J. Conflict Detection and Resolution for Civil Aviation: A Literature Survey. IEEE Aerosp. Electron. Syst. Mag. 2019, 34, 20. [Google Scholar] [CrossRef] [Scilit]
- Eurocontrol. Safety Nets-A Guide for Ensuring Effectiveness; European Organization for the Safety of Air Navigation: Brussels, Belgium, 2017; pp. 1–28. [Google Scholar]
- Eurocontrol. EUROCONTROL Guidelines for Short Term Conflict Alert—Part I; European Organization for the Safety of Air Navigation: Brussels, Belgium, 2017; pp. 1–28. [Google Scholar]
- Eurocontrol. EUROCONTROL Guidelines for Short Term Conflict Alert—Part II; European Organization for the Safety of Air Navigation: Brussels, Belgium, 2017; pp. 1–46. [Google Scholar]
- Eurocontrol. EUROCONTROL Guidelines for Short Term Conflict Alert—Part III; European Organization for the Safety of Air Navigation: Brussels, Belgium, 2017; pp. 1–96. [Google Scholar]
- Bilimoria, K.D. A geometric optimization approach to aircraft conflict resolution. In Proceedings of the AIAA Guidance, Navigation, and Control Conference and Exhibit, Denver, CO, USA, 14–17 August 2000. [Google Scholar] [CrossRef] [Scilit]
- Dowek, G.; Geser, A.; Muñoz, C. Tactical Conflict Detection and Resolution in a 3-D Airspace. In Proceedings of the 4th USA/Europe Air Traffic Management R&D Seminar, Santa Fe, NM, USA, 3–7 December 2001. [Google Scholar]
- Geser, A.; Munoz, C. A geometric approach to strategic conflict detection and resolution. In Proceedings of the 21st Digital Avionics Systems Conference, Irvine, CA, USA, 27–31 October 2002. [Google Scholar] [CrossRef] [Scilit]
- Luongo, S.; Corraro, F.; Ciniglio, U.; Di Vito, V.; Moccia, A. A novel 3D analytical algorithm for autonomous collision avoidance considering cylindrical safety bubble. In Proceedings of the 2010 IEEE Aerospace Conference, Big Sky, MT, USA, 6–13 March 2010. [Google Scholar] [CrossRef] [Scilit]
- Brittain, M.W.; Yang, X.; Wei, P. Autonomous Separation Assurance with Deep Multi-Agent Reinforcement Learning. J. Aerosp. Inf. Syst. 2021, 18, 890–905. [Google Scholar] [CrossRef] [Scilit]
- Papadopoulos, G.; Bastas, A.; Vouros, G.A.; Crook, I.; Andrienko, N.; Andrienko, G.; Cordero, J.M. Deep reinforcement learning in service of air traffic controllers to resolve tactical conflicts. Expert Syst. Appl. 2024, 236, 121234. [Google Scholar] [CrossRef] [Scilit]
- Pekka, A.A.; Per, M.; Nagbøl, R.; Penttinen, E.; Rinta-Kahila, T. Challenges of Explaining the Behavior of Black-Box AI Systems. MIS Q. Exec. 2020, 19, 259–278. [Google Scholar] [CrossRef] [Scilit]
- Panchal, I.; Metz, I.C.; Ribeiro, M.; Armanini, S.F. Urban air traffic management for collision avoidance with non-cooperative airspace users. In Proceedings of the 33rd ICAS Congress 2022, Stockholm, Sweden, 4–9 September 2022. [Google Scholar]
- Panchal, I.; Armanini, S.F.; Metz, I.C. Evaluation of collision detection and avoidance methods for urban air mobility through simulation. CEAS Aeronaut. J. 2025, 16, 905–920. [Google Scholar] [CrossRef] [Scilit]
- Ribeiro, M.; Ellerbroek, J.; Hoekstra, J. Review of Conflict Resolution Methods for Manned and Unmanned Aviation. Aerospace 2020, 7, 79. [Google Scholar] [CrossRef] [Scilit]
- Chen, X.; Wan, Y.; Lao, S. Graphical Modeling and Simulation for a Multi-Aircraft Collision Avoidance Algorithm Based on Collaborative Decisions. Symmetry 2020, 12, 985. [Google Scholar] [CrossRef] [Scilit]
- Skybrary. Available online: https://skybrary.aero/articles/short-term-conflict-alert-stca (accessed on 23 September 2026).
- Zewde, L.; Raptis, I.A. Conceptualizing UAM: Technologies and methods for safe and efficient urban air transportation. Green Energy Intell. Transp. 2026, 5, 100265. [Google Scholar] [CrossRef] [Scilit]
- Federal Aviation Administration. Available online: https://www.faa.gov/air_traffic/publications/atpubs/atc_html/ (accessed on 23 September 2026).
- International Civil Aviation Organization (ICAO). Doc 8168: PANS-OPS (Aircraft Operations) Vol II—Construction of Visual and Instrument Flight Procedures, 17th ed.; ICAO: Montreal, QC, Canada, 2020; pp. 87–101. [Google Scholar]
- Mouillet, V.; Phu, D. BADA Family H—A Simple Helicopter Performance Model for ATM Applications. In Proceedings of the 2018 IEEE/AIAA 37th Digital Avionics Systems Conference, London, UK, 23–27 September 2018. [Google Scholar]
- Cox, G.; Yates, I.S.I.; Savage, J. Controller Response Times from the August and December 2010 Human in the Loop Data Collection Efforts; Flight Systems Laboratory: Oklahoma City, OK, USA, 2011; pp. 1–21. [Google Scholar]
- Cox, G.; Yates, I.S.I.; Savage, J. Report on Pilot Response Times from the March 2010 Human in the Loop Data Collection Effort; Flight Systems Laboratory: Oklahoma City, OK, USA, 2011; pp. 1–49. [Google Scholar]
- Silverman, B.W. Density Estimation for Statistics and Data Analysis; CRC Press: Cleveland, OH, USA, 1986; p. 45. [Google Scholar]
- Eurocontrol. Safety Minima Study: Review of Existing Standards and Practices; European Organization for the Safety of Air Navigation: Brussels, Belgium, 2000; pp. 1–44. [Google Scholar]
- Lin, X.; Fulton, N.; Westcott, M. Target level of safety measures in air transportation-review, validation, and recommendations. In Proceedings of the IASTED International Conference MSI 2009, Beijing, China, 12–14 October 2009. [Google Scholar]

Disclaimer/Publisher’s Note: The statements, opinions and data contained in all publications are solely those of the individual author(s) and contributor(s) and not of MDPI and/or the editor(s). MDPI and/or the editor(s) disclaim responsibility for any injury to people or property resulting from any ideas, methods, instructions or products referred to in the content. |
© 2026 by the authors. Licensee MDPI, Basel, Switzerland. This article is an open access article distributed under the terms and conditions of the Creative Commons Attribution (CC BY) license.