


Abstract
Accurate simulation of repetitive aircraft shock is needed to assess the environmental adaptability of aircraft equipment, especially at locations close to the excitation source. Conventional narrowband random-on-random (NOR) testing generates a stationary, approximately Gaussian waveform. Although its power spectral density (PSD) can satisfy the prescribed spectrum, it does not reproduce the high peaks, repeated pulse shape, and high kurtosis observed in near-field aircraft shock. This paper presents a time-domain windowed pulse (TDWP) synthesis method with a time-frequency joint optimization procedure. A stationary random carrier is generated from the initial PSD, and a physically motivated exponential window is used to impose the firing-rate-related pulse pattern. Windowing changes the spectrum, so a regularized spectral equalization is applied in a closed loop to bring the PSD of the final waveform back to the target spectrum. The window decay exponent is selected by minimizing errors in peak and kurtosis while enforcing PSD consistency. One set of field measurements and three laboratory tests were used for validation. Relative to the conventional method, TDWP reduced the absolute error in maximum peak, kurtosis, and fatigue-damage-equivalent response by 46.4, 51.2, and 53.9 percentage points, respectively. The results indicate that preserving the transient pulse sequence can improve the representation of near-source repetitive aircraft shock while maintaining the prescribed spectral requirement under the investigated conditions.
1. Introduction
Repetitive aircraft shock is a recurrent environmental load during flight operations and can affect both the structural integrity and functional reliability of airborne equipment. In contrast to an isolated shock event, the response generated by repeated gunfire is characterized by large amplitudes, short-duration individual events, and successive transient pulses. These features are particularly evident at locations close to the excitation source, where the transmitted shock pulses remain distinguishable and may contribute to chafed wiring, loosened fasteners, intermittent contacts, electrical shorts, and local structural damage [1,2]. With increasing equipment integration and the use of high-rate weapons on modern aircraft platforms, reliable laboratory reproduction of repetitive aircraft shock has therefore become increasingly important. For such environments, a representative test waveform should satisfy not only the prescribed spectral requirement but also the temporal pulse characteristics that govern the local structural response and accumulated damage.
Existing synthesis procedures for repetitive aircraft shock can be broadly classified into time-domain reconstruction and frequency-domain synthesis approaches. The first group uses time-domain models based on shock physics, with damped sinusoids, wavelets, or other physically interpretable basis functions. Examples include orifice-damping shock generators for half-sine pulses [3,4], deep-learning restoration of incomplete shock records [5], and field measurements used as benchmarks for model development [6]. Direct time-waveform replication and statistically generated repetitive pulses described in standards [1,2] closely follow the measured environment [7,8], but they require representative measurements, which are expensive and difficult to obtain during early aircraft development. Other time-domain procedures focus on isolated standard pulses and therefore do not directly address repetitive shock responses composed of repeated transient pulses. The practical difficulties encountered when measured aircraft shock sequences are analyzed and reproduced in the laboratory have also been discussed by Sherf et al. [9].
The second group starts from a frequency-domain specification, usually an SRS or a PSD. Repetitive-SRS and high-level random-vibration procedures are widely used because they can be implemented with existing shaker controllers. Recent studies have addressed time-frequency reconstruction [10], data-driven specification generation [11,12,13,14], response prediction using extended operational transfer path analysis [15,16], and waveform-dictionary assembly of excitation events [17,18,19]. Damage-equivalent synthesis of sine-on-random profiles for accelerated life testing has also been reported [20]. PSD-based procedures generally generate a stationary Gaussian carrier and can reproduce the average spectral energy, but they provide limited direct control of peak values, kurtosis, and pulse timing [21,22,23,24]. This limitation becomes particularly relevant near the excitation source, where individual transient pulses remain visible and the response sequence may have a significant influence on structural fatigue damage [25].
The research gap is therefore not the lack of either time-domain or frequency-domain synthesis techniques, but the absence of a simple parameterized waveform-synthesis framework that can preserve repeated transient pulse characteristics while maintaining compatibility with a prescribed PSD-based test requirement. Direct time-waveform replication can reproduce a measured response sequence with high temporal fidelity, but the resulting test input is strongly dependent on the availability and representativeness of the measured record. Moreover, changing the target environment or measurement location generally requires a new representative record, and the spectral and temporal requirements are not independently parameterized. In contrast, conventional PSD-based synthesis provides explicit control of the target spectral energy and is compatible with established shaker-control procedures, but the resulting stationary waveform does not explicitly preserve the pulse sequence, peak distribution, or higher-order temporal characteristics observed in near-source repetitive aircraft shock. The key challenge is therefore to combine the spectral controllability of frequency-domain synthesis with explicit and physically interpretable control of the repeated transient pulse structure.
To address this gap, the present study proposes a time-domain windowed pulse (TDWP) synthesis procedure with constrained spectral-temporal optimization. The essential difference between TDWP and direct time-waveform replication is that TDWP does not use the measured acceleration record directly as the final test input. Instead, a stationary stochastic carrier is first generated from the target PSD, and an explicitly parameterized exponential pulse window is then introduced to impose the repeated transient pulse structure. Because window modulation redistributes spectral energy, the PSD of the windowed waveform generally deviates from the prescribed target. TDWP therefore introduces a closed-loop frequency-domain compensation procedure that corrects the PSD distortion after windowing and operates on the final synthesized waveform rather than on the unmodulated carrier alone. The decay exponent of the pulse window is identified from measured pulse envelopes and optimized using time-domain pulse features, while the final waveform is constrained simultaneously by PSD consistency, temporal-feature matching, and shaker velocity and displacement limits. In this way, TDWP separates the stochastic spectral carrier from the physically identified pulse envelope and provides independent, interpretable control of the two aspects of the excitation.
The proposed procedure differs from existing approaches in three specific respects. First, unlike direct time-waveform replication, which reproduces a measured record as a whole, TDWP reconstructs the waveform from a target PSD and a parameterized pulse envelope, allowing the spectral and temporal characteristics to be controlled separately. Second, unlike conventional PSD-based synthesis, which primarily constrains average spectral energy, TDWP explicitly identifies the pulse-envelope parameter from the measured transient response and therefore preserves peak and higher-order temporal characteristics while restoring the target PSD after modulation. Third, unlike time-domain randomization and related non-Gaussian synthesis techniques [21,22], in which temporal non-stationarity is generally obtained through iterative statistical matching, TDWP introduces a physically motivated and independently fitted exponential envelope as an explicit waveform parameter. This separation allows the contributions of spectral matching and temporal pulse preservation to be evaluated independently.
Accordingly, the main contribution of this work is a constrained TDWP synthesis procedure that integrates PSD-controlled stochastic excitation, physically identified pulse-envelope modeling, and closed-loop spectral compensation within a unified framework. First, the stochastic carrier is separated from the deterministic pulse envelope, and the PSD distortion introduced by window modulation is explicitly compensated so that the final test input, rather than only the initial carrier, satisfies the prescribed PSD requirement. Second, the pulse decay exponent is identified from measured envelopes and selected through a transparent parameter search based on peak and kurtosis errors rather than fixed a priori. Third, the proposed waveform is evaluated at three levels—acceleration waveform characteristics, PSD consistency, and specimen fatigue response—using one field measurement dataset and three laboratory tests. The method is intended for near-source repetitive aircraft shock environments in which repeated transient pulses remain clearly distinguishable. The novelty therefore lies not in introducing a new optimizer or spectral estimator, but in explicitly separating the spectrally controlled carrier from the physically identified pulse envelope and integrating them through a closed-loop compensation procedure at the level of the final test input.
The remainder of this paper is organized as follows. Section 2 presents the waveform formulation, identification of the pulse-window parameters, joint optimization, and experimental arrangement. Section 3 presents the time-domain, frequency-domain, and response-level comparisons, followed by discussion of the physical interpretation, the distinction between specification error and synthesis error, and the applicability boundaries of the proposed method. Section 4 summarizes the main conclusions.
2. Methods
2.1. Overall Procedure
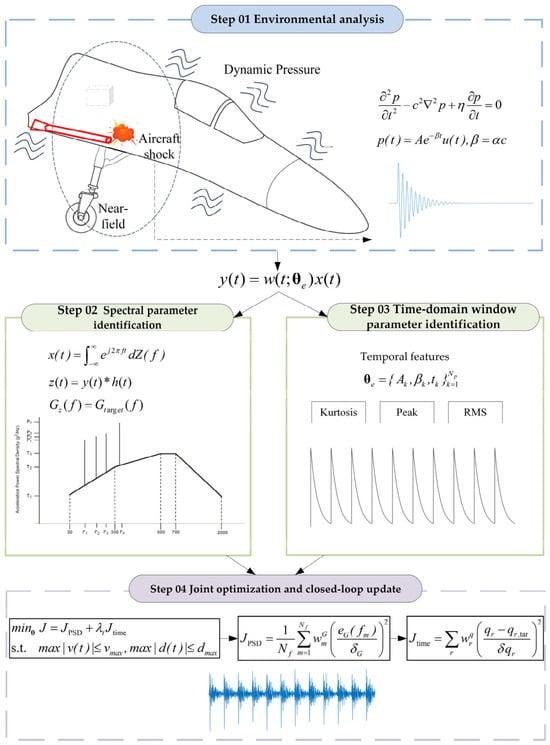
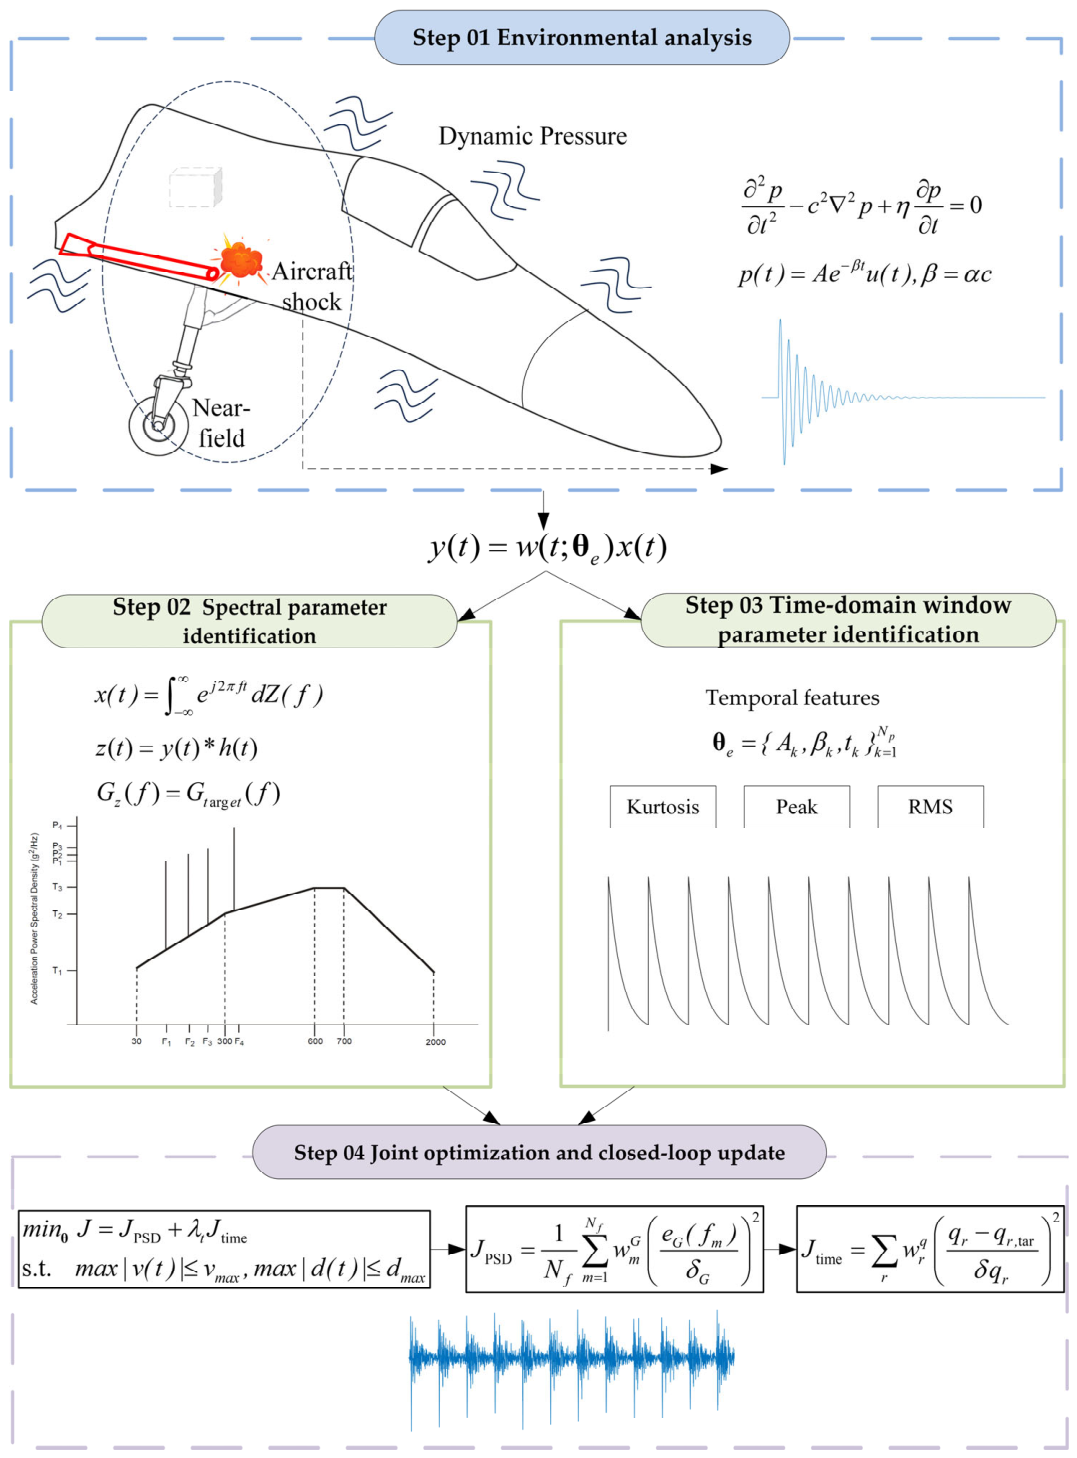
Figure 1 summarizes the synthesis procedure. The aircraft installation environment is first characterized from the dynamic pressure and its attenuation along the propagation path. This analysis motivates the use of an exponentially decaying pulse envelope. The spectral specification is then converted into broadband and narrowband PSD parameters, and a stationary random carrier is generated by spectral representation. In parallel, the pulse-window parameters are obtained from measured envelopes or from scenario estimates. The carrier is multiplied by the window train to create the pulse-bearing waveform. Since this operation redistributes spectral energy, the modulated record is passed through a closed-loop frequency-domain correction so that the PSD of the final record returns to the prescribed target. The window parameters and correction spectrum are updated until the spectral and temporal criteria, together with shaker velocity and displacement limits, are satisfied.
Figure 1.
The aircraft shock synthesis procedure.
The exponential window is applied to a carrier generated from the initial PSD. The carrier and the final waveform therefore have different roles: the carrier supplies the starting spectral realization, whereas the compensated, windowed waveform is the test input and is required to satisfy the target PSD. The window decay parameter mainly changes the concentration of energy in each pulse and consequently affects peak value, RMS, and kurtosis. The compensation loop removes the associated spectral deviation after each window update.
The formulation is intended for locations where successive shock events remain distinguishable. The observed severity depends on the aircraft platform, installation position, excitation energy, propagation distance, and firing rate. These factors influence both the spectral level and the pulse envelope. The method uses the firing rate to set the repetition period and uses the fitted window duration and decay exponent to represent the pulse shape. At locations farther from the source, structural filtering tends to smear the pulses; the window modulation then becomes weak and the method approaches the conventional random-vibration representation.
2.2. Synthesis of Shock Waveforms
The propagation of a blast pressure wave in a dissipative medium is governed by the damped wave equation [26,27]:
where p is the pressure, c is the speed of sound and η is the dissipation coefficient.
The propagation model describes the spatial attenuation and propagation delay separately. The pressure-like transient disturbance is written as [28]:
where p(x,t) is the pressure at propagation distance x and time t; ps(t) is the source transient waveform; c is the propagation velocity, and α is the spatial attenuation coefficient. The exponential term represents the amplitude reduction accumulated along the propagation path, whereas represents the propagation delay.
At a fixed measurement location x0, Equation (2) becomes:
where is the pulse amplitude at x0, is the propagation delay at x0.
Thus, spatial attenuation determines the amplitude scaling at the measurement location, while the temporal decay of an individual measured shock pulse is described separately by a local response envelope:
where A is the pulse amplitude, tk is the pulse arrival time, β is the temporal envelope decay rate, and H(τ) is the Heaviside step function. The parameter β is identified from the measured upper and lower pulse envelopes and therefore represents the decay of the local structural response after pulse arrival. It is not assumed a priori to be equal to αc. This separation avoids conflating propagation attenuation with temporal response decay and provides a directly measurable parameter for the subsequent TDWP construction.
pr(τ) = Ae−βτH(τ), τ = t − tk ≥ 0
2.2.1. Spectral Parameter Identification
The stationary carrier is generated from the target PSD using the discrete spectral representation and random phases. Let x(t) denote the stationary carrier and w(t;θe) the deterministic multi-pulse exponential window. The principal TDWP component before optional low-frequency correction is:
y(t) = w(t;θe)x(t)
Because the deterministic pulse window is time-varying, y(t) is generally non-stationary and, for a periodic pulse train, can be regarded as a cyclostationary process. Therefore, the term PSD used in this work does not denote an ensemble PSD of a stationary output process. Instead, it denotes the finite-record, Welch-estimated time-averaged PSD of the synthesized acceleration record, which is also the spectral quantity used for the closed-loop comparison with the target PSD. For clarity, PSD of the windowed or final waveform throughout this paper refers to its finite-record Welch estimate, unless otherwise stated.
For a finite record of duration T, let WT(f) denote the Fourier transform of the deterministic window. Using the spectral representation
The Fourier transform of the windowed component is:
For the stationary carrier, the spectral increments satisfy:
and therefore the expected finite-record spectral density of the windowed process is:
E{dZ(ν)dZ∗(μ)} = Gx (ν)δ(ν − μ)dνdμ
Defining the spectral redistribution kernel
Equation (10) can be written as
where, (∗) denotes convolution.
Thus, multiplication by the deterministic pulse window in the time domain produces a convolution-type redistribution of the carrier spectral energy in the frequency domain. For an approximately periodic pulse window with repetition frequency fr, , the corresponding time-averaged spectrum can be expressed as
Showing explicitly that the pulse modulation redistributes energy among neighboring frequencies and repetition-frequency harmonics.
In the numerical implementation, the PSD of each finite synthesized record is estimated using Welch averaging:
where K is the number of Welch segments, L is the segment length, and u[n] is the Welch analysis window. This finite-record estimate is the PSD quantity used throughout the optimization and validation.
Window modulation changes the PSD because it transfers energy between neighboring frequencies and between the firing-rate harmonics. A compensation filter is consequently designed so that the corrected waveform has the same target PSD as the original test specification.
where ∗ denotes time-domain convolution and M(f) is the Fourier transform of m(t), Gz(f) is the PSD of z(t).
z(t) = y(t) ∗ m(t)
Gz(f) = Gy(f) ⋅ |M(f)|2 = [Gtarget(f)∗|W(f)|2] ⋅ |M(f)|2
Therefore, the target equation is as follows:
Gz(f) = Gtarget(f)
[Gtarget(f)∗|W(f)|2] ⋅ |M(f)|2 = Gtarget(f)
A regularized frequency-domain compensation is used for the compensation filter to limit amplification at frequencies where the measured or estimated spectrum is small. The regularization term provides a stable solution in the presence of measurement noise and finite-record variability.
where the superscript ∗ denotes complex conjugation and the regularization parameter controls the trade-off between spectral fidelity and noise amplification, and ε prevents excessive amplification near spectral nulls.
2.2.2. Time-Domain Window Parameter Identification
The exponential window is motivated by the decay of a damped structural response after a short pressure or recoil impulse [29,30]. At a fixed measurement location, the pulse amplitude decreases with the combined effects of structural damping and propagation. Under repeated excitation, this response appears as a sequence of similar pulses. The window is therefore parameterized by a decay rate and a finite duration, with the firing rate providing the pulse repetition period.
where θe is the temporal feature vector, Np is the number of pulses, Ak is the pulse amplitude, tk is the pulse arrival time, describe the average decay rate, Hw(t) is a finite-duration pulse window, Tw is the duration of a single pulse window. For the basic TDWP model, all pulses share a common mean shape.
The window parameters are identified from measured records or estimated from the test scenario. Individual pulses are segmented using the measured firing period, and their upper and lower envelopes are fitted by least squares. The median fitted decay rate is used as the common value for the record; the spread of the fitted values is retained as an indicator of pulse-to-pulse variability. This treatment avoids fitting an independent decay constant to every random realization. The fitted exponential exponent in the measured envelope is approximately −5 to −1; therefore, the positive decay-rate parameter used in Equation (21) is bounded by . The window duration is constrained by 0 ≤ Tw ≤ Tr, where Tr is the pulse repetition interval.
2.2.3. Joint Optimization and Closed-Loop Update
The synthesized waveform parameters are determined from a constrained optimization in which the final PSD and the time-domain pulse features are considered simultaneously:
where θ is the vector of design variables, JPSD denotes the spectral matching objective, Jtime represents the time-domain pulse-feature objective, and J is the total objective; λt is the dimensionless weight coefficient used to balance the contribution of the time-domain features; v(t) and d(t) are obtained by single and double numerical integration of the acceleration record, and vmax and dmax denote the allowable shaker limits.
Because both JPSD and Jtime are constructed from tolerance-normalized residuals, their values are dimensionless and can be balanced directly without introducing unit-dependent scaling. To improve reproducibility, λt is selected according to the relative magnitude of the two normalized objective terms at initial waveform. The initial balancing coefficient is calculated as
where θ(0) is the initial waveform parameter vector and εJ is a small positive constant introduced to avoid division by zero. Considering that excessive weighting of either objective may cause deterioration of the other constraint, the final coefficient is limited within a practical range:
A value of λt close to unity indicates approximately equal importance between PSD matching and pulse-feature preservation. A larger value emphasizes transient characteristics, while a smaller value prioritizes spectral consistency. This parameter-selection strategy provides a defined procedure for determining the weighting coefficient for different waveform specifications.
The target PSD Gtarget(f) can be obtained either from measured field vibration data or from an applicable vibration specification. For each candidate waveform, the PSD is estimated using Welch averaging to reduce random estimation errors. The spectral mismatch is expressed in decibel form:
where is the estimated PSD of the synthesized waveform. The logarithmic representation converts the spectral deviation into a dimensionless quantity, allowing errors from different frequency bands to be compared directly.
The PSD objective function is defined as:
where Nf is the number of frequency points, is the frequency-dependent weighting factor, and δG is the allowable PSD tolerance. In this study, δG is typically selected as 3 dB according to commonly used vibration qualification criteria. The weighting coefficient can be adjusted when specific frequency bands require additional emphasis.
The temporal feature vector includes peak acceleration, RMS, and kurtosis; pulse duration and repetition interval can be added when these quantities are available from the field record.
where Nq is the number of time-domain features, is the feature-specific weighting factor, qr and qr,tar are the generated and target values of the r-th feature, respectively, and δqr is its allowable tolerance. The target feature values and their tolerances are obtained from measured records whenever possible. If no field record exists, they are estimated from applicable standards, empirical prediction models, or comparable weapon-system data.
The above weighting strategy makes the selection of λt reproducible while retaining flexibility for different test requirements. In particular, increasing λt within the prescribed range places greater emphasis on preserving transient pulse characteristics, whereas decreasing it gives relatively greater emphasis to matching the target PSD. The shock response spectrum (SRS) is calculated from the final PSD or time history as a response check and is not introduced as a separate correction loop.
The optimization follows an alternating closed-loop update. At iteration i, the current waveform is first evaluated in the frequency and time domains. The PSD residual is used to update the frequency-domain compensation, and the temporal-feature residual is used to update the pulse-window parameters. The updated waveform is then evaluated again, and the total objective is monitored. The iteration is terminated when
where .
2.3. Experimental Measurement Method
2.3.1. Measurement of Field Aircraft Shock
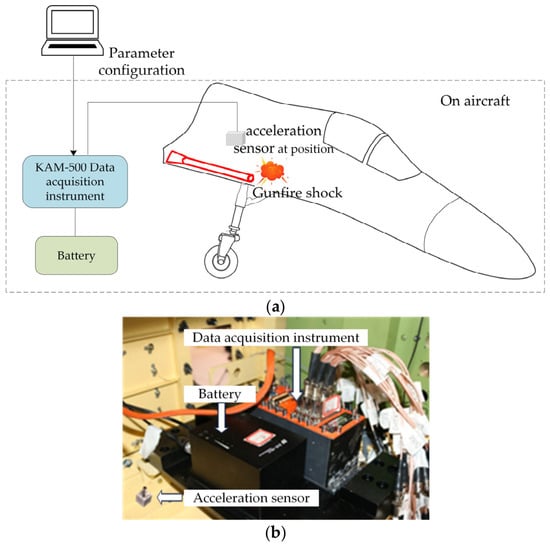
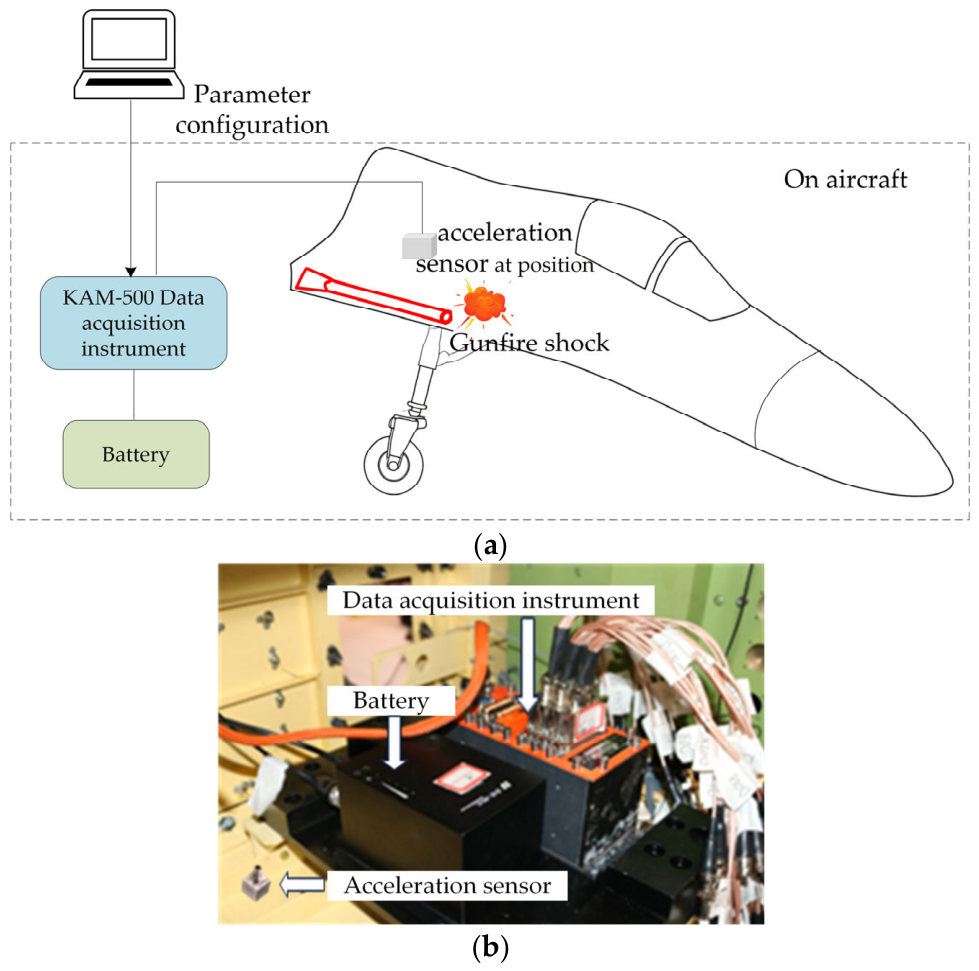
A field measurement was conducted for a specific aircraft type at a firing rate of 27 rounds per minute. The sensor was installed at position A, approximately 1.6 m from the excitation source, at the junction of a fuselage frame and a beam. The relatively high local stiffness at this position allowed the global aircraft-shock response to be recorded. All instruments were calibrated and within their validity periods.
The purpose of the flight measurement was to obtain a reference record for comparing the conventional NOR waveform with the TDWP waveform. Measurements were made in Shenyang, China. Before flight, the acceleration sensor, battery, and acquisition unit were integrated and configured on the ground, as shown in Figure 2 and Table 1. During the sortie, the system operated in autonomous logging mode and recorded the shock response continuously.
Figure 2.
Measurement system for aircraft shock environment. (a) Diagram. (b) Photo.
Table 1.
Measurement instrument parameters.
The field-measured record served as both the source of temporal parameter identification and the reference for evaluating the synthesized waveform in the present study. Pulse envelopes were extracted from the measured record and used to identify the exponential decay characteristic, while the final TDWP waveform was subsequently compared with the same record in terms of time-domain, frequency-domain, and structural-response characteristics. This design was adopted because only one field measurement dataset was available. The resulting comparison should therefore be regarded as a validation under the investigated configuration rather than as an independent out-of-sample assessment. Since the TDWP model uses a small set of parameterized pulse characteristics rather than direct sample-by-sample waveform replication, the calibration process does not reproduce the exact random fluctuations of the measured record. Nevertheless, independent-record validation is required to assess the transferability of the identified parameters and will be considered in future work.
2.3.2. Experimental Validation Method
All three laboratory test runs were conducted over the same frequency range of 10 Hz–2000 Hz, while three different excitation conditions were applied using the same shaker system, the same specimen, and the same measurement configuration. The purpose of using three excitation conditions was to examine the response characteristics of the conventional NOR and proposed TDWP excitations under different prescribed excitation states, rather than to constitute three statistical repetitions of an identical test condition.
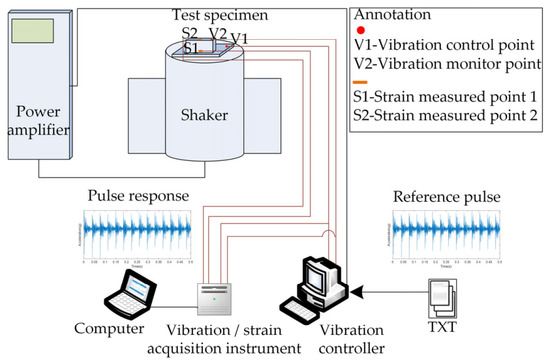
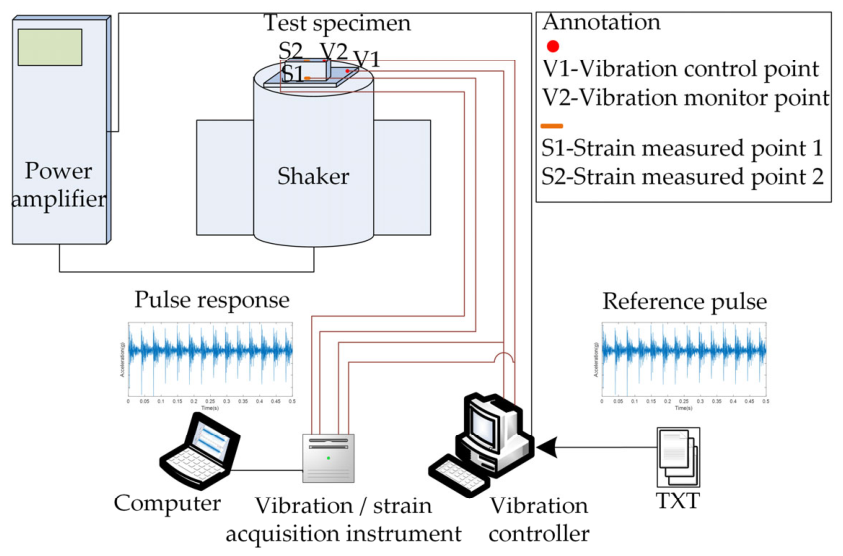
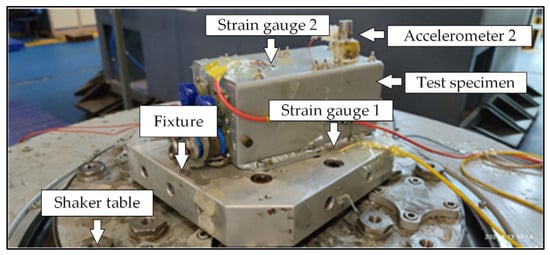
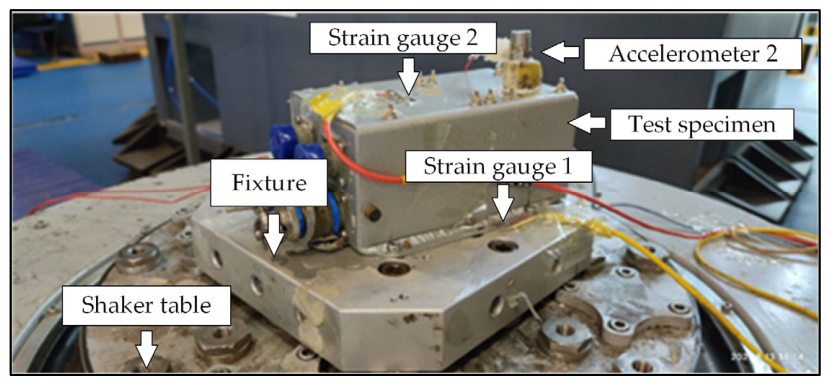
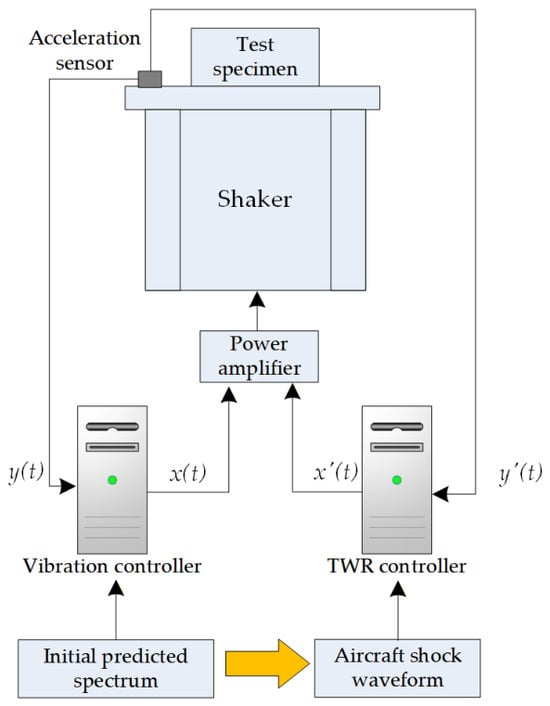
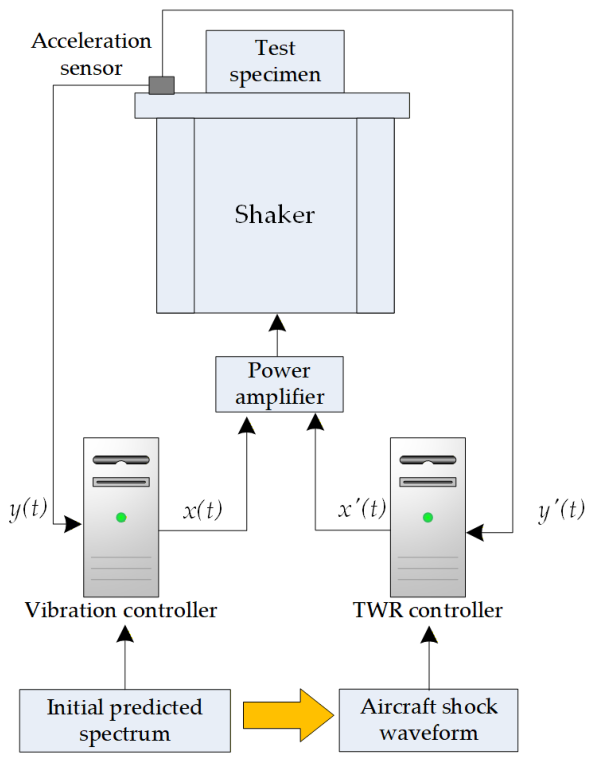
For all three test runs, the specimen installation, shaker, controller, acceleration sensors, strain gauges, and measurement locations were kept unchanged. The schematic diagram of the test principle is shown in Figure 3, and the specimen installation status is shown in Figure 4. Acceleration was measured at the shaker control point V1 and at the specimen monitoring point V2. Synchronous strain measurements were obtained at the lower and upper stress-concentration locations, S1 and S2. These channels provided the acceleration and structural-response data used for evaluating waveform consistency and fatigue-related response differences.
Figure 3.
Schematic diagram of the test principle.
Figure 4.
Specimen installation status.
Because each excitation condition was tested once, the present experiments are intended primarily to evaluate the response under different excitation conditions rather than to provide a statistical estimate of repeatability under an identical condition. Nevertheless, using the same shaker, specimen, installation configuration, and measurement system for all three runs minimizes variations associated with specimen preparation and test configuration and provides a consistent basis for comparison.
The specific excitation conditions are summarized in Table 2, including the excitation waveform, excitation level, test duration, and corresponding test condition. The detailed parameters of the test instruments are listed in Table 3.
Table 2.
Summary of the three laboratory test conditions.
Table 3.
Test instrument parameters.
For the fatigue comparison, the measured strain was converted to stress using the material properties of the critical specimen locations: the specimen material was Q235 structural steel. Before testing, the specimen geometry, surface condition, installation state, and fastening condition were kept consistent among all laboratory runs. The strain gauges were installed at the designated stress-concentration locations S1 and S2. No visible damage or permanent deformation was observed before the start of each test.
The maximum, mean, and RMS stress ranges, together with the damage-equivalent stress range, were then calculated following the standard load-spectrum-based approach used for fatigue life prediction and damage assessment under random loading [25,31].
Fatigue-damage analysis was conducted as a comparative stress-life calculation. The strain histories measured at the critical stress-concentration locations were converted to nominal stress histories using the linear elastic relation:
where E = 206 GPa is the elastic modulus of the Q235 structural steel used in the specimen.
δ(t) = Eε(t)
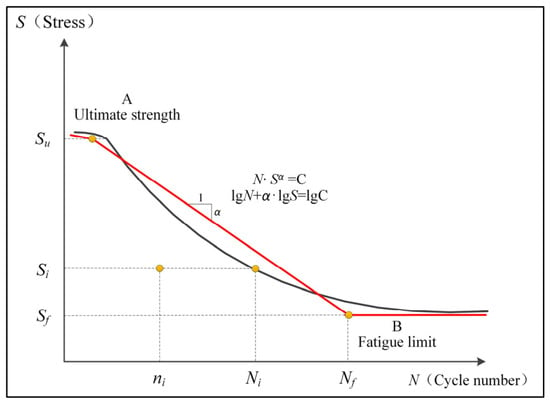
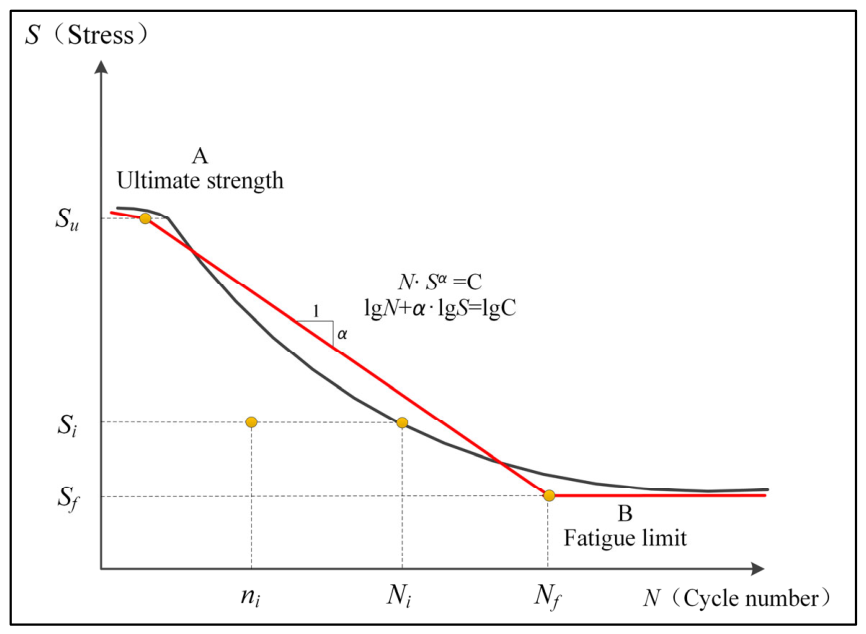
The adopted S–N curve shown in Figure 5 was used to provide a consistent stress-life relationship for comparing the NOR and TDWP excitations under identical specimen and test conditions. No independent constitutive identification of plastic deformation was performed; therefore, plastic strain is not explicitly modeled in the present calculation. The resulting damage-equivalent quantity should accordingly be interpreted as a comparative fatigue-response metric rather than an absolute elastoplastic low-cycle fatigue-life prediction [32].
Figure 5.
Adopted S–N curve for the comparative fatigue-damage analysis.
The resulting stress histories were then segmented into individual response cycles, and the stress-range distribution was obtained for each excitation waveform. The cumulative fatigue damage was evaluated using the adopted S–N relationship in Equations (31)–(33).
where Ncycle is the number of cycles in the plastic deformation interval of the S–N curve, S is the stress amplitude within that interval, and α is the material fatigue exponent, i.e., the absolute slope of the S–N curve in double logarithmic coordinates, C is a constant, Nf is the number of cycles at the fatigue limit Sf, Ni is the fatigue life in cycles corresponding to the stress amplitude Si, and ni is the actual number of cycles counted at that amplitude in the measured or synthesized stress history.
Ncycle ⋅ Sα = C
Nf ⋅ Sfα = C = Ni ⋅ Siα
The pair (Si, ni) is obtained from the stress history by rain-flow counting; the counting is applied to the strain-derived stress record of each pulse sequence, so that the stress-range distribution entering Equation (27) contains both the large cycles associated with the individual pulses and the small cycles contained within each pulse. The cumulative fatigue damage is equal to the sum of all single fatigue damages:
where Di is the fatigue damage caused by the i-th stress-range level; Da is the total accumulated fatigue damage calculated by Miner’s linear cumulative damage rule; and m is the number of stress-range levels.
It should be noted that the present calculation is intended to quantify relative fatigue-damage equivalence between the two excitation waveforms, rather than to provide an absolute elastoplastic low-cycle fatigue-life prediction. The linear strain-to-stress conversion is therefore used as a nominal stress transformation under the adopted elastic modulus. No independent constitutive identification of plastic deformation was performed in the present study. Accordingly, the calculated damage-equivalent quantity should be interpreted as a comparative response metric for evaluating whether the temporal pulse structure of the synthesized waveform produces a fatigue response closer to that associated with the measured repetitive aircraft shock.
Let Pi and Vi denote the positive peak and absolute valley of the i-th measured pulse, and let pi and vi denote the corresponding quantities from the synthesized record. Errors in the maximum pulse peak, mean pulse peak, kurtosis, and cumulative fatigue damage are calculated from these sets. The four error metrics of Equations (36)–(39) are all non-negative relative errors and are to be read as absolute-value forms.
The NOR and TDWP excitations were evaluated using the same shaker system, specimen configuration, measurement arrangement, initial PSD specification, and signal-processing procedure. Both excitation records were processed over the same frequency range of 10–2000 Hz before comparison. Acceleration was measured at both the shaker control point V1 and the specimen monitoring point V2, while synchronous strain measurements were obtained at S1 and S2. The use of the same hardware and specimen configuration minimizes experimental variability between the two excitation methods. However, the two methods employ different controller strategies, namely spectrum-based control for NOR and time-waveform replication for TDWP. Therefore, the present comparison evaluates the combined effect of excitation waveform synthesis and its associated control implementation. The measured V1 signal represents the realized shaker control-point acceleration and is distinguished from the commanded waveform.
3. Results and Discussion
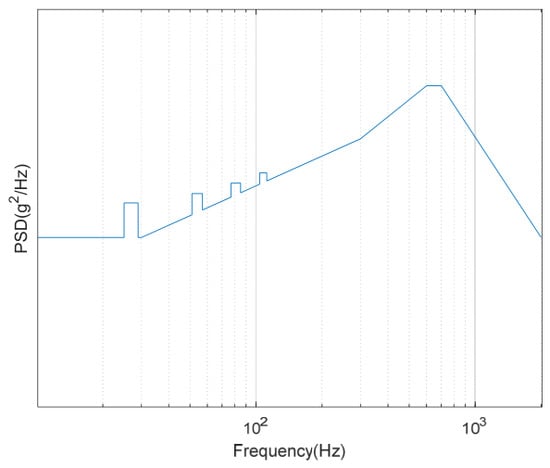
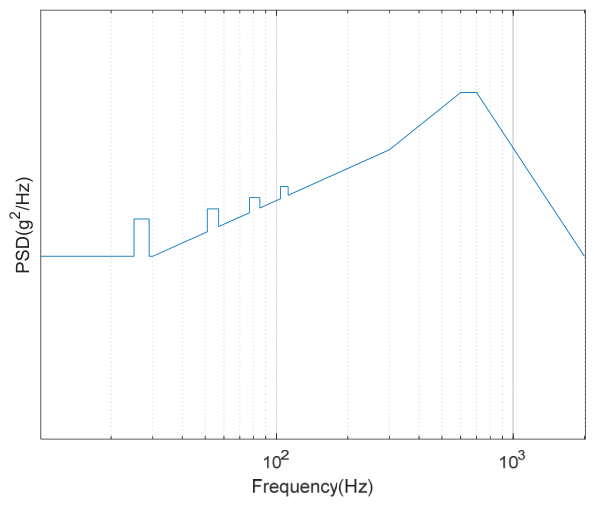
The broadband and narrowband components of the initial spectrum were calculated from the pulse rate, equipment mass, standoff distance, and vector distance using the empirical relations for broadband and narrowband gunfire vibration given in MIL-STD-810H Method 519 and GJB 150.20A [1,2]. The resulting spectrum is shown in Figure 6.
Figure 6.
Initial spectrum.
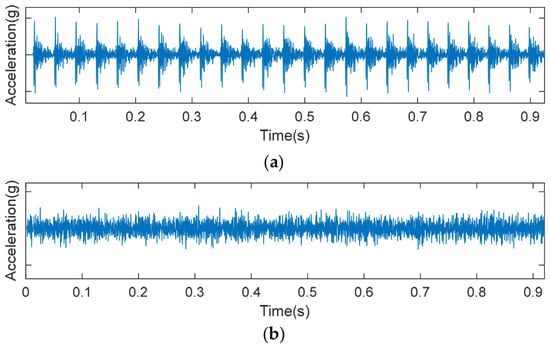
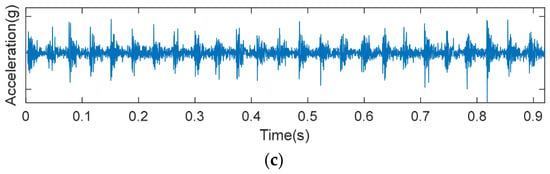
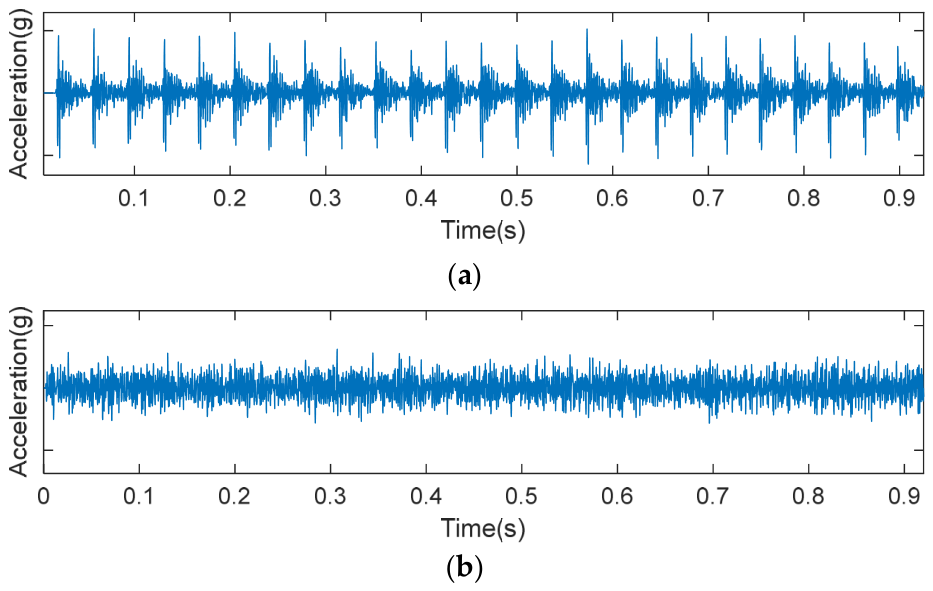
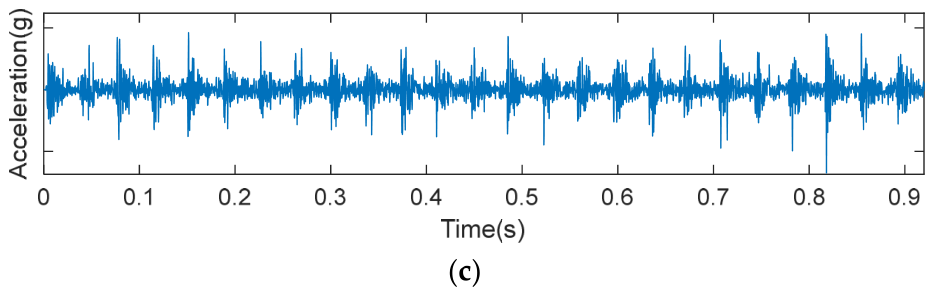
Using the same initial spectrum, the conventional NOR procedure and the TDWP procedure were used to generate continuous-shock time histories. After band-pass filtering from 10 to 2000 Hz, the records were compared with the field measurement in terms of peak, RMS, kurtosis, PSD, and fatigue damage. The acceleration histories at position A are shown in Figure 7.
Figure 7.
Comparison of the acceleration time waveforms. (a) The field measured waveform at position A; (b) the conventional NOR waveform; (c) the TDWP waveform proposed in this work.
3.1. Analysis of Time-Domain Characteristics
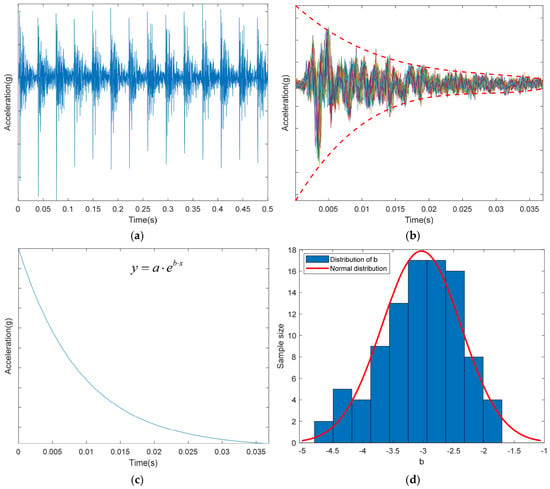
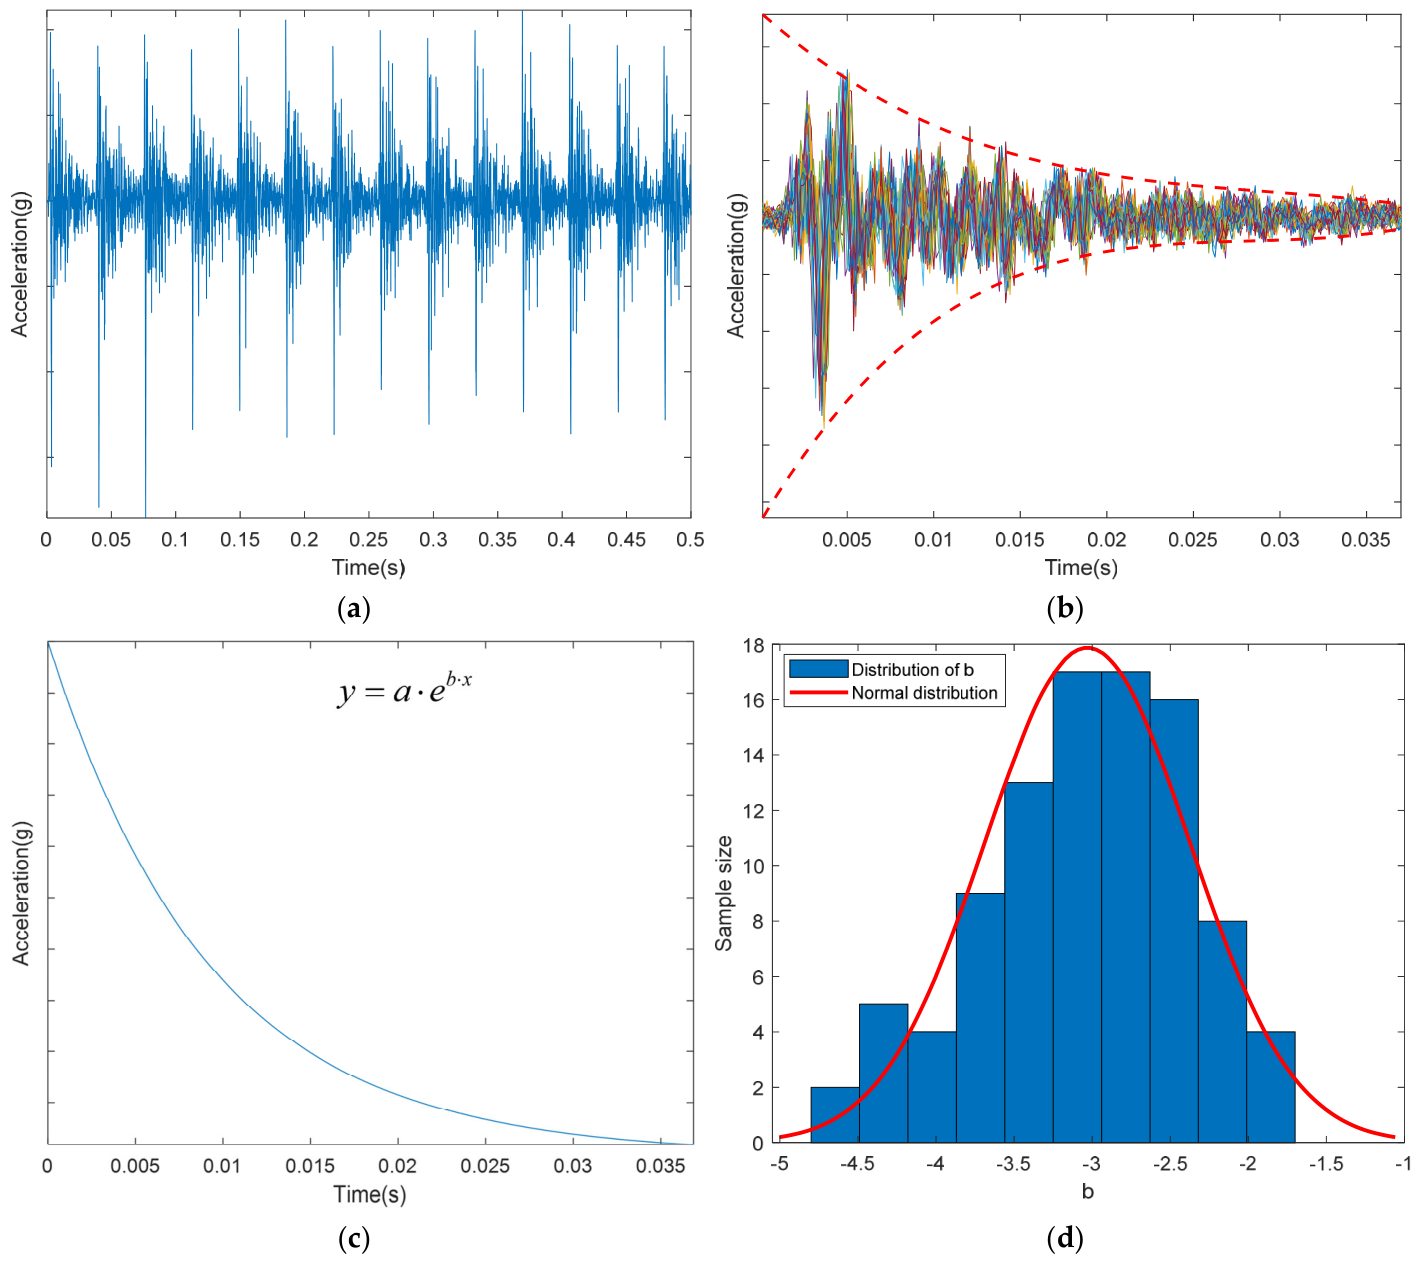
A typical field-measured aircraft shock waveform is presented in Figure 8a. Each individual pulse exhibits a consistent duration and a pronounced decaying trend. The upper and lower envelopes of the time-domain waveform can be extracted, as illustrated in Figure 8b. These envelopes resemble an exponential window, as shown in Figure 8c. The record is statistically symmetric about zero: the upper and lower envelopes have comparable magnitudes and comparable decay rates, so the same window shape can be applied to the positive and the negative half-cycles of the signal. The points (xi, yi) on the envelope curve are fitted using the least-squares method according to the following equations:
y = a ⋅ eb⋅x
ln y = ln a + b ⋅ x
Y = ln y, A = ln a, Y = A + b ⋅ x
Figure 8.
Comparison of the envelope with the exponential window. (a) Typical repetitive aircraft shock waveform. (b) Envelope of the shock pulse, where the different colored solid lines represent the repeated pulses recorded within a single test run, and the red dashed lines denote the upper and lower envelope curves. (c) Single exponential window. (d) Distribution of b.
The fitted decay exponent generally lies between −5 and −1 (Figure 8d). Its variation from pulse to pulse is consistent with the stochastic nature of the structural response. Faster decay is associated with stronger damping or a longer propagation path, whereas slower decay is expected closer to the excitation source. This physical interpretation supports using the fitted exponent as the principal window parameter in the optimization.
The fitted range should be read with caution. It was obtained from a single configuration, one measurement position and one firing rate, and the number of segmented pulses is limited, so the interval −5 ≤ b ≤ −1 describes the present dataset rather than the complete family of repetitive aircraft shock environments. Faster decay, and therefore lower b, would be expected at positions further from the source or on softer structural paths, whereas slower decay is expected very close to the excitation. Extending the fitted range will require measurements on other platforms, positions and firing rates, and the value of b should in each case be re-identified rather than extrapolated.
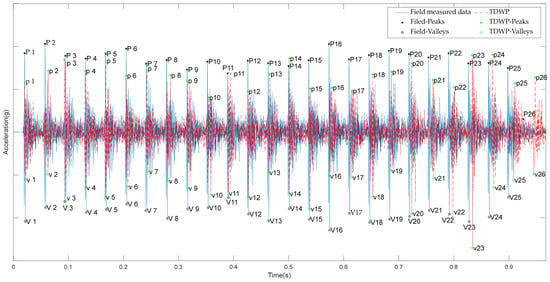
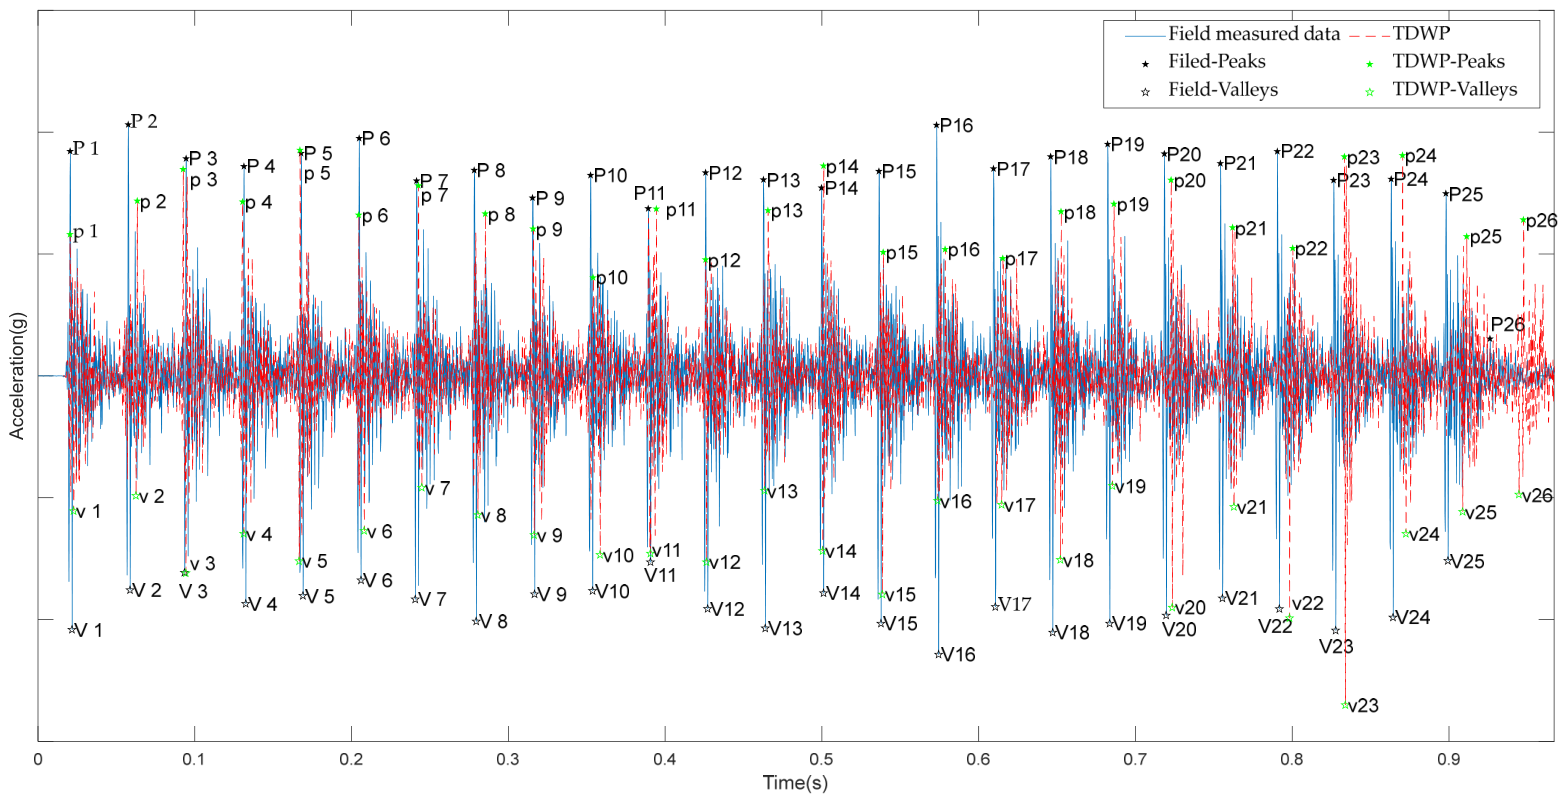
Repetitive aircraft shock is described here by the individual pulse peaks and valleys, together with the record-level RMS and kurtosis. The field and TDWP records were segmented into individual pulses, and the resulting peak and valley sequences at position A are compared in Figure 9.
Figure 9.
Comparison of the pulse peak (Pi) and valley (Vi) sequences of the field measurement at position A with the corresponding sequences (pi, vi) of the synthesized TDWP waveform. Each sequence is identified in the legend.
3.2. Analysis of Frequency-Domain Characteristics
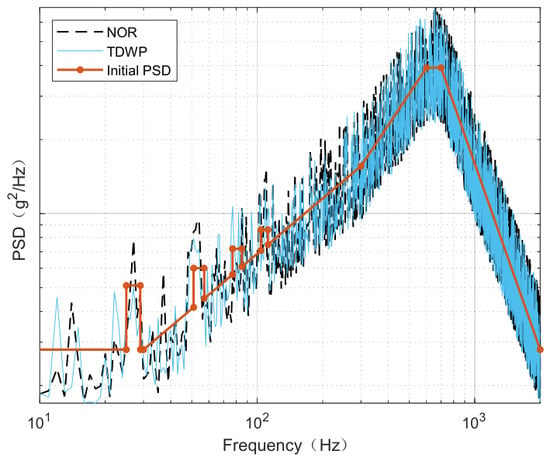
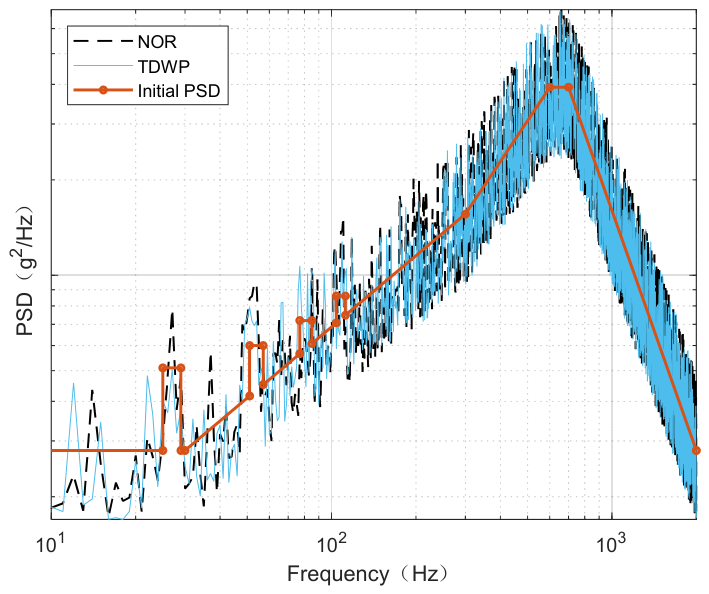
The PSDs of the NOR and TDWP records were estimated using the same Welch procedure and are compared with the prescribed target PSD in Figure 10. The comparison is performed over the 10 Hz–2000 Hz frequency range used in the laboratory validation.
Figure 10.
Acceleration PSD at position A. The initial target spectrum, and the PSDs of the NOR and TDWP records are shown together.
Both NOR and TDWP remain within the prescribed ±3 dB tolerance band relative to the target PSD. For a quantitative assessment, the PSD residual defined in Equation (26) is used to calculate the mean absolute error (MAE), root-mean-square error (RMSE), and the percentage of frequency points within the ±3 dB tolerance band:
The corresponding quantitative results are summarized in Table 4. These indicators provide a direct numerical measure of the spectral agreement and complement the visual comparison in Figure 10. The NOR waveform gives a PSD MAE of 1.18 dB and an RMSE of 1.36 dB, whereas the corresponding values for TDWP are 1.12 dB and 1.30 dB, respectively. Thus, the TDWP waveform reduces the MAE by approximately 5.1% and the RMSE by approximately 4.4% relative to NOR. For both waveforms, 100% of the evaluated frequency points fall within the prescribed ±3 dB tolerance band.
Table 4.
Quantitative comparison of PSD matching performance.
The relatively small difference between the two PSD error levels indicates that introducing the exponential pulse window does not cause a substantial deterioration in the frequency-domain agreement after compensation. This is an important feature of the TDWP procedure because the window modulation is intentionally introduced to reproduce the repeated transient pulse characteristics in the time domain, which inevitably redistributes spectral energy. The subsequent closed-loop frequency-domain compensation effectively offsets this redistribution and restores the final TDWP waveform to the target PSD. Therefore, the improved temporal characteristics of TDWP are obtained without sacrificing compliance with the prescribed spectral requirement.
It is also noteworthy that the PSD improvement of TDWP over NOR is modest compared with the much larger differences observed in the time-domain peak and kurtosis characteristics. This result is consistent with the intended role of the proposed method. The primary advantage of TDWP is not to replace the conventional PSD-matching capability, but to retain the same level of spectral consistency while introducing explicit control of the transient pulse structure. In this sense, the PSD results provide evidence that the time-domain windowing operation and the frequency-domain compensation can be effectively integrated within a single synthesis framework.
3.3. Comparison with the Conventional Method
The comparison considers both signal-level and response-level errors. Signal-level quantities include the maximum and average pulse peaks, RMS acceleration, and kurtosis. Response-level quantities include the maximum, average, and RMS stress ranges and the cumulative damage equivalent. These measures capture the characteristics that are most affected when a repetitive aircraft shock response with repeated transient pulses is represented by a stationary random waveform.
To distinguish absolute error from error reduction, the absolute error of each response quantity is defined in Equations (36)–(39), and the reduction in absolute error is defined as:
where ΔEabs represents the reduction in error in percentage points, rather than a relative percentage reduction.
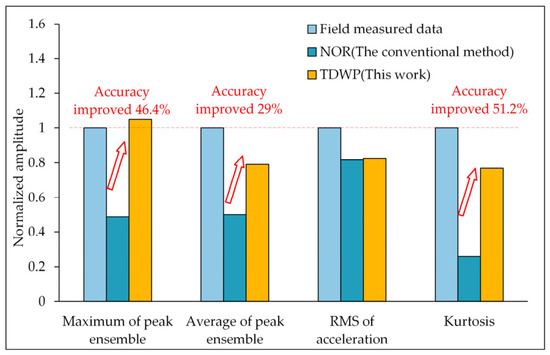
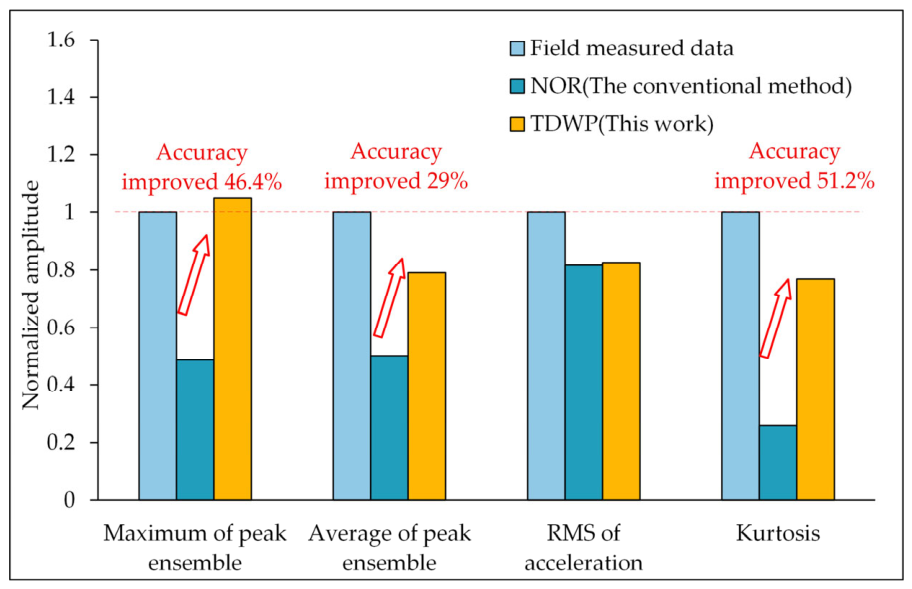
The time-domain features of the NOR and TDWP acceleration records were calculated and compared with the field measurement; the results are listed in Table 5 and plotted in Figure 11. For the maximum pulse peak, the absolute error decreases from 51.4% for NOR to 5.1% for TDWP, corresponding to a reduction of 46.4 percentage points. For the average pulse peak, the corresponding absolute error decreases from 49.9% to 20.9%, giving a reduction of 29.0 percentage points. For RMS acceleration, the absolute error changes only slightly, from 18.4% to 17.4%, corresponding to a reduction of 1.0 percentage point. For kurtosis, the absolute error decreases from 74.3% to 23.1%, corresponding to a reduction of 51.2 percentage points.
Table 5.
Comparison of acceleration time-domain characteristics.
Figure 11.
Histogram of time-domain features of acceleration.
The observed discrepancies have two sources. The first is specification error: the prescribed spectrum is a specification-based target derived from the applicable empirical relationships and environmental parameters, and it may not coincide point-by-point with the PSD measured at a specific aircraft location. The second is synthesis error: two waveforms with the same PSD can have different peak statistics, kurtosis, stress histories, and fatigue damage. The TDWP procedure addresses this second source by adjusting the window exponent and restoring the final PSD after modulation.
At position A, TDWP gives closer estimates of the measured peak level, and kurtosis than NOR. The improvement is most evident for the maximum pulse peak and kurtosis, which are poorly represented by a stationary Gaussian record.
The acceleration-level results in Table 5 show that the effects of TDWP are not uniform across different statistical measures. The maximum pulse peak and kurtosis exhibit much larger reductions in absolute error than RMS acceleration. This difference can be explained by the fact that the PSD and the time-domain pulse envelope constrain different aspects of the signal. For an acceleration signal with a consistent frequency range, the RMS value is related to the integrated PSD according to:
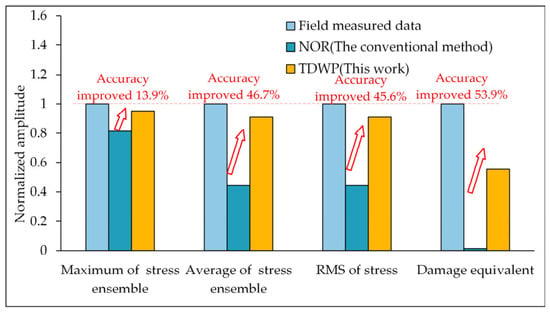
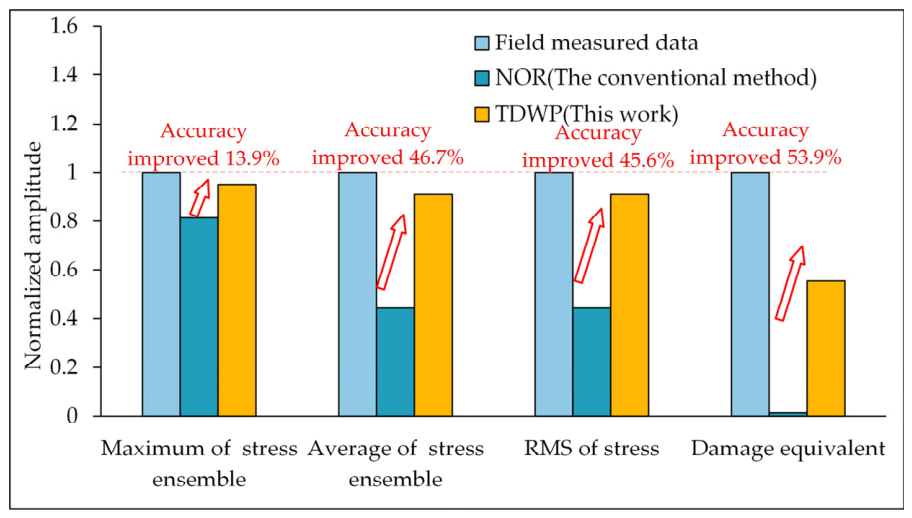
The strain histories obtained under the three excitation conditions were segmented over the repetitive shock duration. For each pulse, the corresponding stress range was determined, and the maximum, mean, and RMS stress levels were calculated. The resulting quantities were then compared across the three test conditions (Table 6 and Figure 12). For each excitation condition, the corresponding NOR and TDWP responses were compared using the same stress-range and fatigue-damage calculation procedure.
Table 6.
Comparison of stress time-domain characteristics.
Figure 12.
Histogram of stress time-domain features.
It should be emphasized that these values represent absolute-error reductions in percentage points. They should not be interpreted as relative percentage reductions unless explicitly normalized by the corresponding NOR error. The results therefore show that the TDWP waveform provides smaller absolute discrepancies with respect to the field-measured response for most of the investigated time-domain and structural-response quantities. The TDWP excitation produces stress levels and a damage-equivalent response that are closer to the field-measured values under the investigated conditions. However, the damage-equivalent absolute percentage error remains 44.7%, indicating that the fatigue response is not reproduced with high quantitative accuracy. The result therefore supports the interpretation that retaining the repeated pulse structure improves the representation of fatigue-driving characteristics, rather than fully reproducing the cumulative fatigue response.
The fatigue-damage-equivalent result requires a different interpretation. Although TDWP substantially reduces the damage-equivalent absolute percentage error relative to NOR, the residual error remains 44.7%. This residual discrepancy should be explicitly considered when interpreting the fatigue result. Cumulative fatigue damage is determined by the complete stress-range distribution and its accumulation, rather than by a limited set of acceleration-level descriptors alone. In the present formulation, the temporal optimization is based primarily on acceleration-level pulse features such as peak value, RMS, and kurtosis, whereas the fatigue calculation is performed after the excitation is transferred through the specimen and converted into a stress history. Consequently, improved matching of the acceleration pulse characteristics does not uniquely determine the resulting stress-range distribution or cumulative damage.
The control strategies illustrated in Figure 13 also help explain the observed differences. In the conventional NOR procedure, the shaker is controlled in the frequency domain through spectrum-based inverse Fourier synthesis. The controller continuously adjusts the excitation to satisfy the prescribed PSD, but the instantaneous temporal organization of the waveform is not an explicit control variable. In the TDWP procedure [33], the stochastic carrier is first combined with the pulse envelope and its spectral distortion is corrected offline through the closed-loop compensation procedure. The resulting pulse-bearing waveform is then supplied to the shaker through time-domain waveform replication. Thus, the two procedures impose the spectral requirement in different ways: NOR enforces the PSD directly during frequency-domain control, whereas TDWP first constructs the desired transient structure and then compensates the resulting PSD deviation before waveform replication. The latter strategy allows the temporal pulse characteristics to be modified without relaxing the final PSD requirement. Because the two excitation methods employ different controller implementations, the present comparison does not completely isolate waveform-synthesis effects from controller-related effects. Nevertheless, both methods were evaluated under the same hardware, specimen, nominal spectral requirement, frequency range, and signal-processing conditions.
Figure 13.
The difference in test implementation between the conventional and proposed methods.
Overall, the results indicate that the principal contribution of TDWP is not to substantially change the total spectral energy or RMS level, but to control the temporal organization of that energy. The PSD constraint determines the overall frequency-domain energy content and thereby strongly constrains RMS, whereas the explicitly identified pulse envelope provides additional information needed to reproduce the peak and higher-order temporal characteristics of repetitive aircraft shock. The remaining fatigue-damage-equivalent discrepancy further indicates that structural damage depends on response information beyond the acceleration PSD and a limited set of temporal features. Therefore, the present results support a hierarchical interpretation of the synthesis problem: PSD matching controls the global spectral energy, pulse-envelope optimization controls transient amplitude statistics, and structural-response or damage constraints are required for more complete reproduction of fatigue behavior.
3.4. Applicability and Parameter Boundary Discussion
The proposed waveform optimization method is developed for reproducing aircraft gunfire shock environments, particularly for locations close to the gun muzzle where the structural response is dominated by high-intensity and repeated transient shock pulses. The applicability of the proposed framework is therefore mainly determined by whether the measured response exhibits significant continuous pulse characteristics rather than by the aircraft platform itself.
For the considered gunfire shock environment, the proposed method is applicable when the measured acceleration response simultaneously satisfies the following characteristics:
- (1)
- Significant transient pulse behavior. The response contains distinguishable shock pulses with clear peak acceleration characteristics, rather than purely stationary random vibration.
- (2)
- Continuous pulse occurrence. The shock response contains repeated or quasi-periodic transient pulses, such that both the overall energy distribution and pulse-related temporal characteristics need to be preserved.
- (3)
- Dominant broadband shock response. The excitation contains broadband frequency components, and the PSD alone cannot fully describe the transient response characteristics.
Under these conditions, the proposed joint optimization framework can effectively balance the frequency-domain energy distribution and time-domain pulse characteristics through the combined objectives of PSD matching and temporal feature preservation.
The applicable parameter boundaries can be summarized as follows. The target-dependent parameters, including the target PSD Gtarget(f), peak acceleration, RMS value, kurtosis, pulse duration, and pulse interval, should be obtained from measurements at the specific installation location. Since the gunfire shock response is strongly affected by the distance from the muzzle, structural transmission path, and equipment installation configuration, these parameters need to be reidentified when the measurement location or aircraft configuration changes.
The system-dependent constraints, including allowable acceleration, velocity, and displacement limits of the shaker system, are determined by the laboratory excitation capability and remain unchanged for the same test setup.
max|a(t)| ≤ amax, max|v(t)| ≤ vmax, max|d(t)| ≤ dmax
The algorithmic parameters, including the weighting coefficient between PSD and time-domain objectives, control the balance between spectral consistency and transient pulse preservation. Since the two objective terms are normalized by their corresponding tolerances, the time-domain weighting coefficient can be selected within 0.5 ≤ λt ≤ 2.0 with the initial value determined from the relative magnitude of the normalized objective functions.
It should be emphasized that the proposed method is not intended for environments dominated by stationary random vibration, isolated single shocks without repetitive pulse characteristics, or low-level vibration conditions where transient features are insignificant. For such cases, conventional PSD-based reproduction methods may be sufficient. The proposed approach is specifically designed for severe gunfire shock environments with continuous pulse responses, where both spectral energy distribution and transient response characteristics are critical.
The present validation rests on one aircraft type, one measurement position and a relatively small set of pulses, and the fatigue metric used here is a damage-equivalent stress rather than a measured life. Extending the method to other platforms, installation positions and firing rates, quantifying the test-to-test variability explicitly, and replacing the exponential envelope by a non-exponential or multi-modal envelope where the measurements require it are the natural next steps. Because each laboratory excitation condition was tested only once, the present study does not provide a statistical estimate of test-to-test repeatability or confidence intervals for the reported performance metrics.
4. Conclusions
A time-domain windowed pulse (TDWP) procedure was developed for the synthesis of repetitive aircraft shock with repeated transient pulse characteristics. The method starts from a prescribed or measured PSD, introduces a physically identified exponential pulse envelope, and subsequently restores the PSD through closed-loop frequency-domain compensation. The proposed procedure was evaluated using one field measurement dataset and three laboratory test conditions conducted with the same shaker, specimen, and measurement configuration. The main findings are as follows:
- (1)
- The proposed TDWP framework provides a means of jointly controlling spectral and temporal characteristics. The target PSD is used as the primary frequency-domain constraint, while the pulse-window parameters are identified from the measured transient response. The closed-loop compensation restores the PSD after window modulation, allowing the final synthesized waveform to retain repeated transient pulse characteristics without relaxing the prescribed spectral requirement.
- (2)
- The main improvement of TDWP is observed in transient and higher-order time-domain characteristics rather than in RMS. Under the same PSD constraint, the RMS level is inherently constrained by the integrated spectral energy, whereas peak value and kurtosis are additionally influenced by the temporal concentration and intermittency of the excitation. In the present validation, TDWP reduced the absolute errors in maximum peak and kurtosis by 46.4 and 51.2 percentage points, respectively, while the reduction in RMS absolute error was only 1.0 percentage point. These results support the interpretation that explicit pulse-envelope control provides temporal information that is not uniquely determined by the PSD.
- (3)
- The structural-response comparison indicates that preserving the repeated transient pulse structure can influence the stress response and fatigue-damage-equivalent response. Compared with NOR, TDWP reduced the absolute errors in maximum stress, average stress, RMS stress, and damage-equivalent response by 13.9, 46.7, 45.6, and 53.9 percentage points, respectively. The fatigue-damage results should be interpreted with caution. TDWP reduces the absolute percentage error of the damage-equivalent metric relative to NOR, but the remaining error is 44.7%, indicating that the complete fatigue response is not reproduced with high quantitative accuracy. The present results therefore provide preliminary evidence that preserving the repeated transient pulse structure improves the representation of fatigue-driving characteristics, while direct structural-response or damage constraints would be required for more complete fatigue-response reproduction.
- (4)
- The applicability of the present method is limited to the investigated class of repetitive aircraft shock environments and should not yet be regarded as universally validated. The method is primarily intended for near-source locations where successive transient pulses remain clearly distinguishable. Because the present validation is based on one aircraft type, one field measurement location, and a relatively small number of laboratory test conditions, the quantitative parameter ranges and performance observed here should be regarded as specific to the investigated configuration. Further validation using different aircraft configurations, installation locations, structural transmission paths, excitation levels, and pulse repetition conditions is required to assess the robustness and broader applicability of the proposed framework.
Overall, the present study provides preliminary experimental evidence that combining PSD control with explicit temporal pulse-envelope modeling can improve the reproduction of repetitive aircraft shock characteristics while maintaining the prescribed spectral requirement. Future work should extend the validation dataset and investigate non-exponential pulse envelopes, broader structural configurations, and direct structural-response or damage constraints to further improve the generality and fidelity of the method.
Author Contributions
Conceptualization, J.X.; methodology, J.X. and H.J.; validation, J.X. and J.Z.; formal analysis, J.X. and J.S.; writing—original draft preparation, J.X.; writing—review and editing, J.X., S.Y. and Z.L.; funding acquisition, J.X. and Y.F. All authors have read and agreed to the published version of the manuscript.
Funding
This research was funded by the Aeronautical Science Foundation of China (202400020S5001).
Institutional Review Board Statement
Not applicable.
Informed Consent Statement
Not applicable.
Data Availability Statement
The data presented in this study were obtained from a flight measurement campaign on an aircraft platform and from laboratory tests and are subject to confidentiality restrictions imposed by the project sponsor. The data are available from the corresponding author on reasonable request and with the approval of the sponsoring organization. The anonymized target PSD, the identified pulse envelope and window parameters, the objective-function weights and tolerances, and the complete synthesis algorithm are provided in this article.
Acknowledgments
The authors thank the staff of the measurement team for their support during the flight and laboratory tests.
Conflicts of Interest
The authors declare no conflicts of interest.
Nomenclature
| Ak | Amplitude of R, g |
| Bj | Effect of vector distance from the excitation source to the materiel location, dB |
| D | The distance parameter |
| Da | Cumulative fatigue damage |
| E | Blast energy of excitation, J |
| Fi | Frequency, Hz |
| G | PSD value of each frequency point, g2/Hz |
| H | Effect of distance from the excitation, dB |
| J | Effect of the materiel’s location relative to the air vehicle’s skin, dB |
| Ki | Effect of vector distance on each vibration peak, dB |
| M | Effect of excitation location, dB |
| N | The maximum number of closely spaced pulse excitation together |
| N1 | The number of pulses in the repetitive aircraft shock waveforms |
| N2 | The number of cycles in the plastic deformation interval of the S–N curve |
| Pi | Test value of narrowband random vibration, g2/Hz |
| qi | Peaks of the synthesized repetitive aircraft shock, g |
| Qi | Peaks of the measured repetitive aircraft shock, g |
| R | The time waveforms of repetitive aircraft shock, g |
| Rs | The depth parameter |
| S | The stress amplitude in the plastic deformation interval of the S–N curve |
| Sf | Fatigue limit of the material |
| Su | Ultimate strength of the material |
| T | The duration of a single shock pulse |
| Tj | Test value of broadband random vibration, g2/Hz |
| vi | Valleys of the synthesized repetitive aircraft shock, g |
| Vi | Valleys of the measured repetitive aircraft shock, g |
| we | Exponential window |
| W | Effect of weight, dB |
| ∆f | Frequency resolution, Hz |
| α | Material fatigue exponential |
| φk | Random phase |
Abbreviations
The following abbreviations and nomenclature are used in this manuscript:
| TDWP | Time domain windowed pulse |
| PSD | Power spectral density |
| SRS | Shock response spectrum |
| SOR | Sine-on-random |
| NOR | Narrowband random-on-random |
| Probability density function | |
| RMS | Root mean square |
References
- MIL-STD-810H; Environmental Engineering Considerations and Laboratory Tests Method 519.8 Gunfire Shock. U.S. Department of Defense: Washington, DC, USA, 2019; pp. 519.8C-2–519.8C-10.
- GJB 150.20A; Laboratory Environmental Test Methods for Military Materiel—Part 20: Gunfire Vibration Test. General Equipment Department of the Chinese People’s Liberation Army: Beijing, China, 2009; pp. 29–36.
- Yang, Q.; Bai, C.; Liu, X.; Chang, X.; Liu, C. Design and application of a dedicated shock waveform generator. Aeronaut. Sci. Technol. 2020, 31, 48–54. [Google Scholar] [CrossRef]
- Cai, H.X.; Yuan, H.J.; Xu, J. A new laboratory simulation method of gunfire vibration. Struct. Environ. Eng. 2022, 49, 52–57. [Google Scholar] [CrossRef]
- Yang, Y.; Du, H.; Guo, J.; Wang, R. A deep learning-based reconstruction method for incomplete shock wave signals. J. North Univ. China (Nat. Sci. Ed.) 2024, 45, 687–694. [Google Scholar] [CrossRef]
- Naval Surface Warfare Center Dahlgren Division. Dahlgren Division Engineers Capture Live-Fire Data of Projectile–Shock Wave Interaction for the First Time. Sea Power Magazine. Available online: https://archive.org/details/DTIC_ADA307675 (accessed on 2 July 2026).
- Ren, S.; Chen, H.; Zheng, R. Modified time domain randomization technique for multi-shaker non-stationary non-Gaussian random vibration control. Mech. Syst. Signal Process. 2024, 213, 111311. [Google Scholar] [CrossRef] [Scilit]
- Fiore, A.; Sardone, L.; Greco, R.; Cucuzza, R.; Marano, G.C. Numerical method for non-stationary covariance analysis in linear random vibrations applied to a multi-storey building under seismic action. Int. J. Struct. Stab. Dyn. 2025, 25, 2650198. [Google Scholar] [CrossRef] [Scilit]
- Sherf, Z.; Hopstone, P.; Ostrovski, G.; Klein, R.; Yehuda, D. Problems in the analysis of a shock sequence with application to gunfire analysis and simulation. J. IEST 2002, 45, 161–177. [Google Scholar] [CrossRef] [Scilit]
- China Aero-Polytechnology Establishment. Shock Environment Waveform Reconstruction Method and System for Aircraft Gun Simulation Test. Chinese Patent CN117744324B, 17 March 2026. [Google Scholar] [PubMed]
- Li, Y.; Li, K.; Bai, C.; Liu, J. Application of shock response spectrum compilation method in gunfire environment. Chin. J. Appl. Mech. 2024, 41, 1027–1033. [Google Scholar] [CrossRef]
- Song, W.; Wang, R.; Lin, P.; Liu, M.; Wu, J.; Zhang, B.; Gu, Y.; Xie, P. Research on optimal algorithm for time-domain synthesis of shock response spectrum based on continuous second derivative. Proc. IOP Conf. Ser. Earth Environ. Sci. 2021, 632, 032039. [Google Scholar] [CrossRef] [Scilit]
- Wei, X.S.; Chen, Z.W.; Li, C. Research on shock response spectrum calculation and time domain waveform synthesis algorithm. Mach. Tool Hydraul. 2021, 49, 1–6. [Google Scholar] [CrossRef]
- Zhang, F.; Li, K.; Bai, C.; Liu, J.; Li, Y. Determination method of gunfire vibration environment spectrum based on genetic algorithm. J. Vib. Meas. Diagn. 2024, 44, 589–593+625. [Google Scholar] [CrossRef]
- Li, Y.; Chen, Y.; Li, K.; Bai, C.; Liu, X. Prediction and validation of aircraft structural gunfire vibration response based on measured shock response spectrum. Acta Aeronaut. Astronaut. Sin. 2026, 47, 232327. [Google Scholar] [CrossRef]
- Wang, X.; Liu, W.; Ding, J.; Sun, Y.; Dang, Y. Pyroshock response prediction of spacecraft structure in wide frequency domain based on acceleration FRF. Aerospace 2022, 9, 54. [Google Scholar] [CrossRef] [Scilit]
- Yan, Y.; Li, Q.M. Design and implementation of net zero displacement filter for the synthesis of a mechanical shock signal under specified shock response spectrum. Mech. Syst. Signal Process. 2021, 147, 107105. [Google Scholar] [CrossRef] [Scilit]
- Yan, Y.; Ruan, J.; Li, Y. Synthesis of gunfire shock signals with controllable temporal features based on shock response spectrum. Chin. J. Aeronaut. 2025, 39, 103906. [Google Scholar] [CrossRef] [Scilit]
- Yan, Y.; Li, Q.M. Predictive model and physical interpretation of asymmetric features in pyroshock signals. Mech. Syst. Signal Process. 2023, 199, 110447. [Google Scholar] [CrossRef] [Scilit]
- Angeli, A.; Cornelis, B.; Troncossi, M. Synthesis of sine-on-random vibration profiles for accelerated life tests based on fatigue damage spectrum equivalence. Mech. Syst. Signal Process. 2018, 103, 340–351. [Google Scholar] [CrossRef] [Scilit]
- Jiang, Y.; Tao, J.Y.; Wang, D.Z.; Chen, X. A novel method for the numerical simulation of non-Gaussian random vibration. J. Vib. Shock 2012, 31, 169–173. [Google Scholar] [CrossRef]
- Jiang, Y.; Chen, X.; Tao, J.Y. Study on the generation of super-Gaussian and true-random drive signals using time domain randomization. J. Vib. Eng. 2005, 18, 491–494. [Google Scholar] [CrossRef]
- García-Pérez, A.; Ravanbakhsh, A.; Sorribes-Palmer, F.; Alonso, G. Structural shock verification by numerical analysis of the EPD payload units on board Solar Orbiter spacecraft. Acta Astronaut. 2020, 168, 282–292. [Google Scholar] [CrossRef] [Scilit]
- Monti, R.; Gasbarri, P. Dynamic load synthesis for shock numerical simulation in space structure design. Acta Astronaut. 2017, 133, 222–231. [Google Scholar] [CrossRef] [Scilit]
- Wu, Q.; Zhao, Y.X.; Liu, X.T. Fatigue life prediction of metal materials under random loads based on load spectrum extrapolation. Int. J. Fatigue 2024, 187, 108473. [Google Scholar] [CrossRef] [Scilit]
- Stokes, G.G. On the theories of the internal friction in fluids in motion, and of the equilibrium and motion of elastic solids. Trans. Camb. Philos. Soc. 1845, 8, 287–342. [Google Scholar]
- Rayleigh; Strutt, J.W.; Baron. The Theory of Sound, 2nd ed.; Macmillan: London, UK, 1896; Volume 1–2, Available online: https://archive.org/details/theoryofsound02raylrich. (accessed on 2 August 2026).
- Aki, K.; Richards, P.G. Quantitative Seismology, 2nd ed.; University Science Books: Sausalito, CA, USA, 2002. [Google Scholar]
- Zhang, X.; Dang, H.; Li, B. Prediction of aircraft surface noise in supersonic cruise state. Aerospace 2023, 10, 439. [Google Scholar] [CrossRef] [Scilit]
- Yalçinkaya, T.; Gürsoy, B. Numerical validation of a pyroshock test system and application to qualification tests. Aerospace 2022, 9, 400. [Google Scholar] [CrossRef] [Scilit]
- Wu, Y.; Ren, Z. Fatigue damage assessment of a metro vehicle bogie frame based on measured field load. Machines 2025, 13, 306. [Google Scholar] [CrossRef] [Scilit]
- Ge, C.Y.; Song, Z.; Zhou, C.; Guo, H.; Zhu, D.; Wang, B. A novel accelerated fatigue test method of mission synthesis considering the segmented S-N curve. Int. J. Fatigue 2025, 193, 108789. [Google Scholar] [CrossRef] [Scilit]
- Hale, M.T. Synthesis of a time history based on the sine-on-random prediction methodology defined in MIL-STD-810 method 519. J. IEST 2017, 60, 31–41. [Google Scholar] [CrossRef] [Scilit]

Disclaimer/Publisher’s Note: The statements, opinions and data contained in all publications are solely those of the individual author(s) and contributor(s) and not of MDPI and/or the editor(s). MDPI and/or the editor(s) disclaim responsibility for any injury to people or property resulting from any ideas, methods, instructions or products referred to in the content. |
© 2026 by the authors. Licensee MDPI, Basel, Switzerland. This article is an open access article distributed under the terms and conditions of the Creative Commons Attribution (CC BY) license.