


Abstract
Flexible ribbons mounted immediately downstream of a projectile operate in a strongly nonuniform forebody wake, limiting the applicability of conventional free-stream drag models. Wind-tunnel experiments and Arbitrary Lagrangian–Eulerian (ALE) fluid–structure interaction simulations were conducted for a projectile–dual-ribbon system over Ma = 0.3–0.85. After subtracting the forebody drag, numerical predictions differed from the measurements by 2.50% and 4.75% for the two ribbon configurations. Parametric analyses show that areal density has the strongest influence on mean drag in uniform flow, whereas forebody–wake shielding reduces ribbon drag and shifts the dominant sensitivity toward ribbon length; the areal-density-induced drag-coefficient variation decreases from 32.2% to 12.1%, while feedback on forebody drag remains below 2%. The enhanced length sensitivity arises because longer ribbons extend farther into the wake-recovery region and experience higher effective dynamic pressure. An engineering mean-drag model incorporating skin friction, wake shielding, fluctuation-induced drag, and flexibility corrections is developed. Independent validation over 24 cases at Ma = 0.4–0.7 gives a mean absolute percentage error of 2.33% and a maximum error of 8.72%.
1. Introduction
Flexible aerodynamic drag devices, such as ribbons and parachutes, are widely used to provide deceleration and attitude stabilization by increasing aerodynamic drag and generating restoring effects. Unlike conventional rigid aerodynamic components, flexible structures undergo persistent large deformations and unsteady motion, while their instantaneous shapes in turn modify the surrounding flow and aerodynamic loads. This behaviour constitutes a strongly nonlinear fluid–structure interaction (FSI) problem. In a projectile–flexible ribbon configuration, the incoming flow first passes around the forebody and forms a near wake characterized by a marked velocity deficit and pronounced spatial nonuniformity. The downstream ribbons therefore operate under local inflow conditions that differ substantially from those of an isolated ribbon in a uniform free stream. Accurately characterizing the effects of forebody interference on ribbon deformation and mean aerodynamic loads is thus important for the aerodynamic layout and stabilization design of such systems.
For conventional aircraft and projectiles, recent studies have addressed unsteady CFD/RBD coupling, aeroelasticity, free flight, ballistic stability, reduced-order modelling, and data-driven aerodynamic prediction [1,2,3,4,5,6,7,8]. These approaches can describe the coupling among rigid-body motion, small-deformation structural response, and unsteady aerodynamic loads with increasing computational efficiency and engineering accuracy. Flexible fabrics, however, exhibit stronger geometric nonlinearities and shape feedback, and their aerodynamic behavior cannot be represented directly by conventional rigid-body models.
Existing studies of flexible aerodynamic drag devices have focused primarily on large-scale decelerators such as parachutes. Moving-mesh, ALE, immersed-interface, and high-fidelity FSI approaches have been applied to investigate canopy inflation, fabric stiffness, porosity effects, wake interference, and aerodynamic loads at high speeds [9,10,11,12,13,14,15]. These studies show that material properties, transient shape, and upstream flow conditions can substantially affect the mean drag, load fluctuations, and structural response while also demonstrating the capability of high-fidelity FSI methods for large-deformation fabric problems. Nevertheless, parachutes rely on inflation to generate an effective projected area, and their geometry and loading mechanisms differ fundamentally from those of narrow ribbons aligned with the flow.
For flags and flexible ribbons, wind-tunnel, free-fall, live-fire, and image-based experiments have systematically examined the effects of inflow velocity, geometric dimensions, material mass and stiffness, mounting configuration, and boundary conditions on drag and flapping behavior. These efforts have also led to empirical and engineering relations for estimating the drag of flags, ribbons, and ribbon stabilizers [16,17,18,19,20,21,22,23,24,25]. In general, the drag of a flexible fabric is not simply proportional to its planar area but is closely related to the flapping amplitude, twisting, mode transitions, and instantaneous projected configuration. Existing engineering models are attractive because of their simplicity and low computational cost, but most have been derived for specific configurations under low-speed uniform-flow conditions, which limits their applicability to variations in material properties and nonuniform inflow environments.
With the development of numerical methods, research on flexible flags and ribbons has progressed from linear stability analysis, inviscid theory, and low-order vortex models to three-dimensional viscous FSI simulations, immersion methods, and ALE large-deformation analyses [26,27,28,29,30,31,32,33,34,35]. These studies have identified the mass ratio, bending stiffness, Reynolds number, viscous separation, and structural reconfiguration as important parameters governing instability, flapping mode, and aerodynamic loading. ALE simulations of flexible ribbons have also begun to address the effects of material density, elastic modulus, ribbon length, and configuration on mean drag. However, most available studies still consider isolated flexible bodies in uniform free streams.
When a forebody or another structure is located upstream of a flexible body, its wake further modifies the motion and loading of the downstream structure. Studies of tandem flexible plates, flexible flags, and flexible structures in bluff-body wakes have shown that upstream vortical structures, streamwise spacing, stiffness, and geometry can jointly alter the flapping amplitude, motion mode, and drag distribution [36,37,38,39,40,41,42,43]. Accordingly, for flexible ribbons mounted immediately downstream of a flight vehicle, drag relations obtained for isolated ribbons in uniform flow may not represent the actual aerodynamic environment.
Studies of subsonic bluff bodies near wakes further show that recirculation, low-speed regions, and separated shear layers constitute the dominant near-wake structures, with their local scales and flow states varying with the inflow conditions. The experimental results also indicate a degree of similarity in the normalized near-wake velocity and turbulence statistics over certain subsonic ranges when appropriate characteristic scales are used [44,45]. For engineering prediction of mean aerodynamic loads, the forebody wake can therefore be regarded as a nonuniform inflow environment with a relatively persistent large-scale structure, a pronounced axial velocity deficit, and a downstream recovery process. Ribbons of different lengths consequently occupy different fractions of the near-wake region, which may strongly affect their mean drag and parameter sensitivity.
In summary, substantial progress has been made in the unsteady aerodynamics of conventional flight vehicles, high-fidelity parachute FSIs, flapping mechanisms of isolated flags and ribbons, and fundamental wake-interference problems. Nevertheless, systematic studies remain limited for short-aspect-ratio flexible ribbons mounted immediately downstream of a forebody in the subsonic to high-subsonic regime, particularly with respect to wake shielding, geometric and material effects, and engineering drag prediction. The present study therefore combines wind-tunnel experiments with ALE FSI simulations to investigate the mean aerodynamic response of a projectile–flexible ribbon system over Ma = 0.3–0.85. The effects of the ribbon length, areal density, and equivalent Young’s modulus on the mean drag are quantified, the shielding effect of the forebody near the wake is characterized, and an engineering mean–drag model incorporating forebody interference and flexibility—parameter corrections is established.
2. Physical Model and Experimental Methods
2.1. Wind-Tunnel Facility and Test Environment
The wind-tunnel experiments were conducted in the HG-4 facility at Nanjing University of Science and Technology. HG-4 is a blow-down, closed-test-section wind tunnel covering subsonic, transonic, and supersonic regimes. The test section has a cross-sectional area of 0.300 × 0.300 m2 and a length of 0.6 m. Optical-glass windows measuring 0.290 × 0.16 m2 are installed on both sides of the test section for model observation and schlieren imaging. The Mach number is varied by replacing the two-dimensional solid-block nozzle.
2.2. Experimental Models
The aerodynamic loads were measured using a Φ14B internal single-arm six-component strain-gauge balance. The X-channel was used for the axial-force measurements considered in the present study. Its design load and calibration load are both 160 N, with a zero drift of 0.04%, an absolute error of 0.24 N, and an overall accuracy of 0.08%. The installation location of the force balance is indicated in Figure 1a. The settling-chamber total pressure and freestream static pressure were measured using pressure transducers with an accuracy of 0.05%.
Figure 1.
Wind-tunnel experimental setup and test-model configuration: (a) installation of the test model; (b) schematic and principal dimensions of the projectile–dual-ribbon model.
The tests were conducted at a fixed Mach number Ma (). After the model was installed, data acquisition was initiated once the tunnel total pressure had stabilized. The Mach number Ma was then changed sequentially until all the prescribed conditions were met. For each run, the aerodynamic data were averaged over a stable portion of the recorded signal. The data were reduced in the wind-axis system. The moments were referenced to the model center of gravity, and the corresponding moment coefficients were therefore defined about this point.
The investigated Mach numbers were 0.3, 0.4, 0.5, 0.6, 0.7, and 0.85. The overall static drag coefficient was measured at a pitch angle of 0° using both the isolated projectile and the projectile equipped with dual ribbons.
The forebody has a rounded rectangular cross-section of 22.4 mm × 51 mm with a corner radius of 2 mm. Four mutually perpendicular rectangular fins are mounted at the four corners of the aft body, with a length, width, and thickness of 25 mm, 15 mm, and 0.75 mm, respectively. The flexible ribbon has a width of 20 mm and an exposed single-side length of 160 mm for the wind-tunnel configurations considered here. The principal dimensions of the test article are indicated in Figure 1b. The freestream direction is defined from left to right in both panels.
The blockage ratio was evaluated from the maximum frontal projected area of the test article normal to the freestream. It is defined as , where is the maximum frontal projected area of the test article and is the cross-sectional area of the wind-tunnel test section. For the present test section, , resulting in a blockage ratio of .
A single continuous ribbon passes through a slot in the projectile base and is clamped at the aft end, leaving two exposed branches of equal length. The ribbon material is a woven synthetic-fibre flag fabric. Two fabrics with different thicknesses were cut to the same width 20 mm, and the remaining parameters are listed in Table 1. The aspect ratio (AR) reported in the table refers to the exposed length of one ribbon branch rather than to the entire continuous ribbon.
Table 1.
Parameters of the flexible ribbons used in the wind-tunnel tests.
The material and geometric parameters of the ribbons used in the wind-tunnel experiments were primarily determined by practical constraints of the actual system. The ribbon design must satisfy both the total-mass requirement of the projectile system and the limited internal storage volume of the launcher. Therefore, lightweight and thin woven synthetic-fibre fabrics were selected. With the ribbon width fixed at 20 mm, the exposed single-side length was set to 160 mm according to the available storage space and model installation constraints, corresponding to an aspect ratio of AR = 8. The two test fabrics have different thicknesses and areal densities, providing a comparison of aerodynamic responses within the allowable engineering design range. Thus, the ribbon material and geometric parameters adopted here represent practical design constraints rather than aerodynamically optimized values.
The two test fabrics differ in both areal density and thickness. Accordingly, the aerodynamic differences observed in the wind tunnel tests reflect changes in the combined material properties and cannot be interpreted strictly as an isolated areal density effect. In the subsequent numerical parametric study, the areal density, equivalent Young’s modulus, and ribbon length are varied independently via a one-factor-at-a-time strategy to quantify their effects on the mean aerodynamic response within the present equivalent-continuum model.
The measured Reynolds number, total pressure, and dynamic pressure for the different Mach-number conditions are listed in Table 2.
Table 2.
Freestream conditions of the wind-tunnel tests.
2.3. Experimental Results and Uncertainty Analysis
Figure 2 presents the wind-tunnel measurements obtained with the same projectile model fitted with different ribbons. Cases 1, 2, and 3 denote the isolated projectile, the projectile with Ribbon 2, and the projectile with Ribbon 1, respectively, and the projectile with Ribbon 2, respectively. The drag coefficient is calculated as
Figure 2.
Aerodynamic drag characteristics of the test models: (a) axial drag force; (b) drag coefficient. Error bars represent the experimental uncertainty; error bars smaller than the plotting symbols are not visible.
The corresponding drag coefficient is calculated from the measured drag force , the freestream dynamic pressure , and the reference area . The projectile frontal area is used as the reference area; therefore, the resulting coefficient represents the total drag coefficient on the basis of the projectile cross-sectional area.
For each test condition, data were acquired after the tunnel total pressure reached a steady level, and the measurements were averaged over a stable time interval to reduce the influence of instantaneous flow fluctuations and measurement noise on the mean aerodynamic loads. The model axial force was measured via a six-component strain-gauge balance, for which the absolute error of the axial-force component was 0.24 N. The settling-chamber total pressure and the freestream static pressure were measured via pressure transducers with an accuracy of 0.05%. Because the drag coefficient depends on the axial force, dynamic pressure, and reference area, its measurement uncertainty was estimated via standard error propagation, yielding
where , , and denote the standard uncertainties in the axial force, freestream dynamic pressure, and reference area, respectively.
As shown in Figure 2a, the measured axial force increases markedly with the Mach number for all three configurations, rising from only a few newtons at the lower Mach numbers to several tens of newtons at the upper end of the test range. Consequently, for a fixed absolute balance error, the relative uncertainty is greater at low Mach numbers and decreases as the axial force increases. By comparison, the 0.05% pressure-measurement uncertainty makes only a minor contribution to the overall drag coefficient uncertainty. Together with the averaging over the stable data interval, these uncertainty levels do not alter the differences in the mean drag among the configurations or the overall trends with the Mach number considered in this study.
Figure 2b shows the distinct Mach number dependences of the drag coefficient for the three test configurations. For the isolated projectile (Case 1), the drag coefficient generally increases with the Mach number. With Ribbon 2 installed, the Case 2 drag coefficient first decreases and then increases, exhibiting a clear minimum within the investigated range. For the heavier and thicker Ribbon 1, the total drag coefficient of Case 3 still increases with the Mach number but at a lower rate than that of the isolated projectile. Although the absolute drag contributed by the flexible ribbons continues to increase with increasing inflow velocity, its growth rate is lower than that of the freestream dynamic pressure, resulting in an overall decrease in the incremental ribbon drag coefficient. This behavior indicates that the aerodynamic response of the flexible ribbon is not simply proportional to the dynamic pressure but is jointly governed by its deformation state and FSI motion.
3. Numerical Method and Model Setup
3.1. Numerical Methods
The numerical simulations were performed via LS-DYNA. The fluid domain was discretized via the arbitrary Lagrangian–Eulerian (ALE) formulation. Unlike purely Lagrangian or Eulerian descriptions, the ALE formulation allows the computational mesh to move independently of the material motion, thereby avoiding severe mesh distortion while tracking the large-deformation FSI interface.
Under the ALE description, the relationship between material motion and mesh motion is expressed for an arbitrary flow variable through the following mapping between the material and spatial time derivatives:
where denotes the Lagrangian reference coordinate (material coordinate), is the Eulerian spatial coordinate, is the absolute fluid—particle velocity, and is the ALE mesh velocity. The last term on the right-hand side, , represents the convective correction associated with the relative motion between the material and the mesh.
By applying ALE mapping to the fluid density, momentum, and energy, the conservation equations for a viscous compressible fluid can be written as
where the subscript denotes a spatial direction, represents the time derivative in the ALE moving reference frame, is the fluid density, is the absolute fluid velocity component, is the mesh velocity component, and is the fluid velocity relative to the moving mesh. denotes the body-force component per unit mass, and is the specific internal energy.
The fluid Cauchy stress tensor for a compressible Newtonian fluid is expressed as
where is the static pressure, is the dynamic viscosity, and is the Kronecker delta. The final term accounts for the volumetric dilatational viscosity associated with compressibility. Because the compressible conservation equations are not closed, an equation of state is required to relate pressure , density , and specific internal energy e. In the present study, air is represented via a linear-polynomial equation of state:
where is the volumetric strain parameter, is the initial reference density of air, is the internal energy per unit volume, and denotes the polynomial coefficient. The coefficients are selected so that the gas behaves as an ideal gas, with and , where is the specific heat ratio of air and is set to 1.4.
The present numerical formulation is intended for the subsonic to high-subsonic regime investigated in this study ,. Because the ALE fluid solver is based on the compressible conservation equations of mass, momentum, and energy, together with an equation of state relating pressure, density, and internal energy, the increase in compressibility effects with Mach number is retained in the governing formulation. The coupled system is advanced using explicit time integration with a stability-controlled time step. The applicability of the present formulation over the investigated Mach-number range is further assessed through direct comparison with the wind-tunnel measurements, including the upper-limit condition at . The present validation therefore supports the use of the method for the subsonic and high-subsonic conditions considered here; however, its applicability to transonic or supersonic regimes is beyond the scope of the present study and is not assumed.
The ALE–Lagrange formulation adopted in this study does not employ an explicit turbulence model. The numerical framework is primarily used to address the large-deformation FSI response of thin flexible ribbons undergoing unconstrained, high-frequency motion in a nonuniform forebody wake. Accordingly, the quantities of primary interest are the time-averaged aerodynamic loads and the large-scale velocity-deficit and recovery characteristics governing the forebody–ribbon interaction. The aerodynamic accuracy of the present formulation is quantitatively evaluated against wind-tunnel measurements in Section 3.4.
The flexible ribbons undergo large deformations and exhibit strongly nonlinear structural dynamics. They are therefore described via a conventional Lagrangian formulation, for which the structural momentum equation can be written as
where is the structural density, is the displacement component in the i direction, is the Cauchy stress tensor in the solid, and is the body-force component per unit mass.
At the fluid–structure interface, both kinematic compatibility and dynamic equilibrium must be satisfied to capture the strongly nonlinear interaction between the flow and the large-deformation flexible structure.
Under no-slip conditions, the fluid velocity at the interface must equal the structural velocity (kinematic compatibility). In addition, the aerodynamic traction exerted by the fluid on the structure must be equal and opposite to the reaction exerted by the structure on the fluid (dynamic equilibrium):
where is the fluid velocity component at the interface and where and are the outwards unit-normal components of the fluid and solid domains, respectively.
Because the Eulerian/ALE fluid mesh and the Lagrangian structural mesh are nonconforming, interface forces are transferred through a penalty-based coupling formulation. The algorithm tracks the relative displacement between structural nodes and the fluid-mesh surface (i.e., the penetration depth). When a Lagrangian node penetrates the fluid boundary, an interface contact force is generated via an equivalent spring mechanism.
where is the scalar penalty stiffness determined from the contact-surface characteristics and material properties, including the density and bulk modulus.
The coupled system is spatially discretized according to the principle of virtual work and integrated explicitly in time via a central difference scheme. After finite element discretization, the nodal motion is updated as
where is the nodal velocity at the next half-time step, is the inverse lumped diagonal mass matrix, and and are the external and internal force vectors, respectively, with the former including the interface penalty force. Aerodynamic loading and structural deformation are advanced explicitly and alternately in time, enabling stable flow–structure interactions without the severe fluid–mesh distortion associated with large structural deformation.
3.2. Computational Mesh and Boundary Conditions
The computational domain is rectangular, with an inlet and outlet at the upstream and downstream boundaries, respectively, and slip conditions on the four lateral boundaries. The inlet and outlet treatments are prescribed using *BOUNDARY_PRESCRIBED_MOTION_SET and *BOUNDARY_NON_REFLECTING, respectively. The domain volume is . Air is defined using *MAT_NULL with room-temperature properties. All fluid cells are orthogonal hexahedra. To reduce the computational cost, local refinement is applied in the central region. Along the direction, two refined zones are defined around the rigid projectile and the flexible ribbons, as shown in Figure 3. The forebody refinement zone adjacent to the inlet uses a cell size of over a length of , whereas the downstream ribbon refinement zone uses a cell size of over the same length . The light blue region in Figure 3 denotes a transition zone in which the cell size increases with a growth ratio of =1.05 in the directions indicated by the black arrows, with the innermost cells matching the refined zone spacing.
Figure 3.
Computational domain and mesh of the projectile–flexible ribbon system: (a) computational domain and streamwise refinement regions; (b) cross-sectional view of the mesh-refinement regions; (c) overall computational mesh and enlarged views of the local mesh.
Similarly, in the plane, a central refined core is used with a uniform cell size of . The black arrows indicate the refinement directions from the outer coarse mesh toward the central core.
The mesh used in the coupled simulations is shown in Figure 3(c), where the dashed boxes provide enlarged views of the corresponding local mesh. The deployed fins are retained in the numerical model with the same number, arrangement, and principal dimensions as those of the wind-tunnel model. The geometric simplification is limited to the shallow fin-storage grooves remaining on the aft body after fin deployment; these small local recesses are removed from the computational geometry. The nose geometry is also simplified from a spherical to a cylindrical surface for computational efficiency. The ribbon thickness and in-plane anisotropy are neglected, and the ribbons are modelled with shell elements via *MAT_ORTHOTROPIC_ELASTIC.
In the ALE FSI simulations, coupling between the ALE fluid and the Lagrangian flexible structure is implemented through *CONSTRAINED_LAGRANGE_IN_SOLID. The Lagrangian structural mesh is not finer than the local Eulerian fluid mesh; the ribbon element size is therefore matched to the corresponding fluid-cell size. A time-step scale factor is used to maintain the stability of the explicit integration, and no mass scaling is applied. Because the ribbons can undergo pronounced bending, twisting, and local curling, automatic single-surface contact is activated to prevent nonphysical self-penetration during large deformation.
The inlet velocities correspond to the wind-tunnel conditions at Ma = 0.3, 0.4, 0.5, 0.6, 0.7, and 0.85 and are prescribed to the first row of inlet nodes. The ribbon tensile force is obtained from the nodal forces at the ribbon root via *DATABASE_NODAL_FORCE_GROUP, whereas the aerodynamic force on the rigid projectile is obtained by integrating the fluid pressure over the solid surface through *DATABASE_FSI.
3.3. Computational Cases
Because real woven fabrics exhibit yarn-scale architecture, anisotropy, and nonlinear constitutive behaviour, the present numerical model represents their global flexibility via an equivalent continuous shell. Accordingly, is treated as an effective parameter for controlling the overall structural compliance rather than as the true tensile modulus in the warp or weft direction. The Poisson’s ratio is fixed at 0.3, and parametric calculations are performed over the prescribed equivalent-modulus range with a baseline value of . The ribbon length and areal density are varied independently, resulting in six ribbon configurations denoted Cases 2–7. Cases 2 and 3 correspond to the wind-tunnel configurations, and the complete parameter matrix is listed in Table 3.
Table 3.
Numerical cases and flexible-ribbon parameters.
3.4. Mesh Independence, Time-Step Sensitivity, Domain-Size Sensitivity, and Validation
To assess mesh dependence in the FSI simulations, the Eulerian cell size in the core region is varied. Two additional models with in-plane mesh sizes and in the plane are compared with the baseline grid, yielding total cell counts of and , respectively. The mesh study is conducted at with a ribbon length of , areal density of , and angle of attack of . The resulting drag coefficients are summarized in Table 4.
Table 4.
Grid-independence assessment based on projectile and ribbon drag coefficients.
The results show progressive convergence with mesh refinement. Compared with the finer 1.5 mm grid, the selected 2.0 mm grid gives differences of approximately 1.36% and 1.52% in the projectile and ribbon drag coefficients, respectively. These small differences indicate that further mesh refinement has only a limited influence on the mean aerodynamic quantities of interest. Considering both computational accuracy and cost, the 2.0 mm core mesh is therefore adopted for the subsequent simulations.
During the calculations, the kinematic continuity and load transfer across the ALE–Lagrange coupling interface were also monitored, and no evident fluid leakage, abnormal structural penetration, or coupling-induced nonphysical oscillation was observed.
The coupled calculations are advanced via the explicit central-difference scheme. The stable time step is determined automatically by LS-DYNA from the minimum element characteristic length and the material wave speed. To evaluate the time-step sensitivity, TSSFAC values of 0.9, 0.75, and 0.6 are considered, corresponding to the respective fractions of the critical stable time step. The results are listed in Table 5.
Table 5.
Comparison of drag coefficients for different time-step scale factors.
Considering both the numerical accuracy and computational cost, is selected as the time-step scale factor for the subsequent calculations.
To evaluate the influence of the downstream boundary on the ribbon wake and aerodynamic loads, an additional domain-size sensitivity simulation was performed for Ma = 0.6, L = 160 mm, and E = 0.3 GPa. The inlet location, lateral domain dimensions, local mesh resolution, refinement strategy, and all other numerical settings were kept unchanged, while the streamwise domain length was increased from 0.8 m to 1.45 m. The additional downstream extent is 0.65 m, corresponding to approximately four single-side ribbon lengths. The mean ribbon drag obtained with the original and extended domains was 11.14 N and 11.32 N, respectively, giving a relative difference of only 1.6%.
Figure 4 compares the normalized axial-velocity fields obtained with the two computational domains. Within the common region, the near-wake structure behind the projectile, the flow structures around the flexible ribbons, and the downstream velocity-recovery pattern remain essentially unchanged. The additional downstream extent mainly allows the wake to relax further and does not noticeably influence the upstream flow field. These results indicate that the original downstream boundary has a negligible effect on the aerodynamic quantities and near-wake characteristics considered in this study, confirming that the original computational domain is sufficiently large for the subsequent simulations.
Figure 4.
Comparison of normalized axial-velocity fields obtained with the original and extended downstream computational domains at Ma = 0.6, L = 160 mm, and E = 0.3 GPa: (a) extended domain; (b) original domain.
The wind-tunnel configurations described in Section 2 are then simulated via the numerical procedure above. All drag coefficients are referenced to the frontal area of the forebody, which is consistent with the experimental data. The comparisons are shown in Figure 5.
Figure 5.
Comparison between wind-tunnel measurements and numerical results: (a) total drag coefficient; (b) incremental drag coefficient of the flexible ribbons.
Figure 5a compares the measured and computed drag coefficients of the isolated projectile (Case 1). The average discrepancy is approximately 11.14%. The projectile contains slender fins and curved surfaces, and the inclined fins cannot be represented exactly by the orthogonal structured fluid mesh, resulting in a stair-step discretization that tends to overpredict the drag. The mesh-independence study above shows that the differences between the selected and finer grids are below approximately 1.6% for the mean drag quantities, indicating that the larger discrepancy in the absolute forebody drag is mainly associated with the geometric representation rather than insufficient grid resolution. Nevertheless, the overall trend is reproduced. The present study focuses on the relative influence of the forebody wake on the downstream ribbons rather than on high-accuracy prediction of the absolute forebody drag. Although a systematic bias remains in the forebody drag, the same forebody discretization is used in all subsequent ribbon-parameter comparisons, so the associated geometric-discretization error is largely consistent across the relative analyses.
Figure 5b compares the incremental drag coefficients obtained by subtracting the Case 1 result from Cases 2 and 3. Once the forebody contribution is removed, the computed ribbon drag agrees more closely with the measurements. The differences between the simulation and experimental results are approximately 2.50% and 4.75% for the two ribbon configurations, respectively. These results provide a quantitative assessment of the overall aerodynamic accuracy of the present ALE formulation for the mean ribbon loads and confirm that the main Mach-number-dependent trend is adequately captured under the present test conditions.
3.5. Use of Generative AI
During the preparation of this manuscript, the authors used ChatGPT 5.5Luna for language editing and formatting assistance. The authors reviewed and revised all generated content and take full responsibility for the final manuscript.
4. Results and Discussion
4.1. Effects of Geometric and Material Parameters on the Ribbon Mean Drag
The aerodynamic response of a flexible fabric ribbon depends jointly on its material properties and geometry. To establish the intrinsic aerodynamic behaviour of the ribbons without forebody–wake interference, Cases 2–7 are simulated as isolated dual-ribbon configurations in a uniform free stream via the numerical method described in Section 3. The effects of the areal density, single-sided ribbon length, and equivalent Young’s modulus on the mean drag are examined while all other conditions are held fixed. The results are presented in Figure 6a.
Figure 6.
Ribbon drag coefficients for different geometric and material parameters: (a) uniform free-stream conditions; (b) forebody–wake interference conditions.
Figure 6a presents the drag coefficients of Cases 2–7 under uniform free-stream conditions. For all configurations, the drag coefficient generally decreases with increasing Mach number. This trend indicates that the aerodynamic loading increases more slowly than the corresponding increase in freestream dynamic pressure over the investigated Mach-number range. Within the present equivalent-shell model and under otherwise identical conditions, increasing the areal density from 27 g/m2 to 41 g/m2 increases the mean drag coefficient by approximately 32.2%. The change in areal density modifies the balance between structural inertia and aerodynamic forcing, thereby affecting the mean deformation and effective projected state of the ribbon. Among the material parameters examined under uniform free-stream conditions, the areal density therefore has the strongest influence on the mean ribbon drag coefficient. The ribbon length also affects the drag coefficient, although its influence within the present parameter range is weaker than that of the areal density. This result indicates that the aerodynamic response of a flexible ribbon is governed not only by its geometric dimensions but also by its effective projected configuration after deformation. With all other parameters fixed, the drag coefficient generally increases with the equivalent Young’s modulus. Raising the modulus from 0.3 to 0.7 GPa increases the drag coefficient by approximately 9.0%, indicating a measurable but weaker sensitivity to stiffness than to areal density. This trend is consistent with the observations of Tan and Ruan for flexible-ribbon stiffness effects [35]. In addition to the mean aerodynamic loads, the ribbons exhibit pronounced large deformation responses. To compare the structural loading and deformation patterns associated with different geometric scales, is selected, and the von Mises stress fields of ribbons with different lengths are shown at representative instants in Figure 7.
Figure 7.
Temporal evolution of von Mises stress distributions for ribbons with different lengths at Ma = 0.6 in a uniform free stream.
As shown in Figure 7, both ribbon branches undergo pronounced three-dimensional deformation under unsteady aerodynamic loading. Their instantaneous shapes are not geometrically symmetric, and the motion clearly exhibits asymmetry. Unlike the relatively regular in-plane oscillation reported for some high-aspect-ratio flexible strips at low speed, the present ribbons exhibit coupled bending, twisting, and local curling. The instantaneous configurations are strongly irregular and cannot be adequately described by a single oscillation plane or a simple periodic pattern.
The von Mises stress field is also strongly nonuniform. Most of each ribbon remains at relatively low stress, whereas moderate-to-high stress is concentrated in regions undergoing stronger local bending, twisting, or folding. As the instantaneous configuration evolves, these higher-stress regions migrate along the ribbon, demonstrating close coupling between local structural loading and three-dimensional deformation. A clear length dependence is also observed: for L = 120 mm, moderate-to-high stress appears from approximately the mid-span region, whereas for L = 160 and 200 mm, the corresponding regions are generally shifted farther downstream toward the free end. The ribbon length therefore affects not only the mean aerodynamic drag but also the spatial distribution of structural loading.
Overall, in the investigated subsonic range, the absolute drag of a flexible ribbon in a uniform free stream increases with the Mach number, whereas the drag coefficient generally decreases. All three geometric and material parameters affect the mean drag, with the areal density producing the strongest effect and the equivalent Young’s modulus and ribbon length showing weaker sensitivities. These results provide the free-stream baseline for the subsequent analysis of forebody–wake interference.
4.2. Bidirectional Aerodynamic Interference Between the Projectile and Ribbons
In the actual projectile–ribbon configuration, flexible ribbons are mounted immediately downstream of the projectile and therefore do not experience a uniform free stream. Flow separation around the forebody produces a near wake with a pronounced velocity deficit and unsteady disturbance, resulting in a local flow environment that differs substantially from that of the isolated ribbons. Conversely, the large deformation of the flexible ribbons may also feed back on the forebody flow and loads. To quantify this bidirectional interference, the projectile is added to the isolated dual-ribbon models of Section 4.1, and Cases 2–7 are recomputed under otherwise identical conditions.
Figure 6b shows the ribbon drag coefficient as a function of Mach number when forebody interference is included. Relative to the uniform free-stream results, the forebody wake markedly modifies the sensitivity of the drag coefficient to the geometric and material parameters. Relative to the uniform free-stream results, the forebody changes the sensitivity of the mean drag to these design parameters.
For the areal-density cases, increasing the areal density while keeping the ribbon length and equivalent Young’s modulus fixed increases the ribbon drag coefficient in the forebody wake by only approximately 12.1%, substantially less than the approximately 32.2% increase obtained in the uniform free stream. The forebody wake therefore weakens the sensitivity of the mean drag to the areal density.
In contrast, the effect of the ribbon length becomes considerably stronger under forebody interference. As the single-side length increases from 120 to 160 and 200 mm, the drag coefficient changes markedly, making ribbon length the dominant geometric variable governing the mean aerodynamic response downstream of the forebody within the present parameter range. This behavior differs from the relatively weak length dependence observed in uniform flow and indicates that the forebody wake changes not only the magnitude of the ribbon loads but also the relative importance of the design parameters.
The equivalent-Young’s modulus cases retain a trend similar to that in the uniform free stream. The mean drag increases with the equivalent Young’s modulus, with an overall variation of approximately 12.9%. Compared with the areal density and ribbon length, the sensitivity to material stiffness is therefore less strongly modified by the forebody wake.
To quantify the drag reduction caused by the forebody, the isolated dual-ribbon and projectile–dual-ribbon configurations are compared under identical geometric, material, and inflow conditions. The relative drag change due to forebody interference is defined as
where is the ribbon drag coefficient in the uniform free stream and where is the corresponding value with forebody interference.
Across all the Mach numbers, the flexible ribbons experience substantially greater drag in the uniform free stream than behind the forebody. The ratio between the two conditions is approximately constant for a given configuration but varies systematically with the ribbon parameters. In particular, the relative difference decreases as the ribbon length (and hence AR) increases. Areal density introduces a smaller secondary variation, whereas the equivalent Young’s modulus has only a limited effect on this ratio.
As shown in Figure 8a, the mean ribbon drag is lower with the forebody present for every Mach number and parameter combination considered, demonstrating a persistent and pronounced aerodynamic shielding effect of the forebody near the wake. The magnitude of this shielding varies with the ribbon parameters, and the length effect is particularly strong. For L = 120, 160, and 200 mm, the drag coefficients in the uniform free stream are on average 173.07%, 115.56%, and 64.33% greater, respectively, than those under forebody interference. The relative difference therefore decreases continuously with increasing ribbon length. Changes in areal density produce a moderate adjustment, whereas changes in the equivalent Young’s modulus have only a minor influence on the difference between the two inflow conditions.
Figure 8.
(a) Relative changes in ribbon drag induced by forebody–wake interference for different cases. (b) Mean aerodynamic drag of the forebody for different ribbon configuration.
These results show that the forebody wake does more than apply a uniform drag reduction to the downstream ribbons. It also changes the parameter sensitivity: areal density is the more influential parameter in the uniform free stream, whereas ribbon length becomes markedly more important under forebody interference. The wake effect is therefore closely coupled to the spatial extent of the ribbon.
The total drag of the coupled configuration is further decomposed into the forebody and ribbon contributions, and the mean forebody drag is compared across the different ribbon configurations, as shown in Figure 8b.
Changing the ribbon areal density, length, or equivalent Young’s modulus produces only a slight change in the mean forebody drag, with variations below 2% for all the cases. Within the present parameter range, the feedback of the downstream flexible ribbons on the mean forebody aerodynamic load can therefore be neglected for engineering purposes.
The mean aerodynamic interference in the projectile–ribbon tandem system is therefore strongly directional: the forebody wake substantially alters the mean drag of the downstream ribbons, whereas the feedback of the ribbons on the mean forebody drag is weak. The forebody also changes the relative sensitivity of the ribbon drag to the geometric and material parameters, with the enhanced length effect being particularly noteworthy. The physical origin of this behavior is examined in the following section via the forebody near-wake velocity field.
4.3. Forebody Near-Wake Velocity Deficit and Ribbon Mean-Drag Response
The results of Section 4.2 show that the forebody substantially modifies the mean drag of the downstream ribbons and that the magnitude of this interference strongly depends on the ribbon length. In particular, the sensitivity of the mean drag to the ribbon length is enhanced relative to the uniform free-stream condition. To explain this behavior, the present section examines the axial velocity deficit and downstream recovery of the forebody near the wake and relates these features to the spatial extent of ribbons of different lengths. Because the ribbon feedback on the mean forebody drag is weak, the following discussion focuses on the one-way influence of the forebody wake on the downstream ribbons.
Taking as a representative condition, Figure 9 illustrates the axial-velocity-deficit structure downstream of the forebody. A pronounced low-velocity region forms immediately behind the base, accompanied by local reverse flow, while the axial velocity gradually recovers farther downstream. This spatial variation provides the physical basis for representing the near wake by two characteristic regions in the engineering model: an equivalent wake-shielded region and a wake-recovery region.
Figure 9.
Axial-velocity field and schematic representation of the equivalent wake-shielded and wake-recovery regions.
The equivalent wake-shielded region represents the portion of the near wake in which the effective dynamic pressure acting on the ribbons is strongly reduced, whereas the wake-recovery region represents the downstream portion in which the axial velocity progressively recovers. Because the present flow field is three-dimensional and strongly unsteady, these regions are introduced as equivalent descriptions of the dominant wake influence rather than as instantaneous geometric boundaries. Their purpose is to characterize the integrated effect of the nonuniform wake on the mean aerodynamic loading of ribbons with different lengths.
Previous studies have shown that at high Reynolds numbers in subsonic flow, the normalized large-scale structure of a bluff body near the wake is only moderately sensitive to the Mach number, and its characteristic scales vary gradually [44,45]. To assess the present forebody, Figure 10 compares the normalized axial velocity distributions at different Mach numbers. For Ma = 0.3–0.85, all the cases exhibit a similar large-scale pattern consisting of a pronounced near-field velocity deficit followed by downstream recovery. Although the local velocity levels and the detailed recovery process vary with the inflow conditions, these differences are smaller than the overall velocity deficit produced by the forebody. Accordingly, for engineering prediction of the mean drag, the model developed below uses a single equivalent wake-shielding length and a representative velocity-reduction factor to characterize the mean wake effect.
Figure 10.
Normalized axial-velocity distributions in the forebody near wake at different Mach numbers.
As shown in Figure 10, all the cases where Ma = 0.3–0.85 exhibit a pronounced near-field velocity deficit, followed by recovery with increasing axial distance. Although the local velocity levels differ among the Mach numbers, the overall trends of the normalized axial velocity distributions remain similar. Therefore, a unified equivalent shielding length and a representative velocity—reduction factor are adopted for the engineering mean–drag model. This treatment retains the dominant wake-shielding effect while limiting the number of model parameters.
The mean axial velocity distribution provides a direct spatial explanation for the change in length sensitivity identified in Section 4.2. For a given forebody and inflow condition, ribbons of different lengths occupy different fractions of the near wake. A short ribbon lies predominantly within the low-velocity wake-shield region, leading to a low mean effective dynamic pressure and a strong forebody–shielding effect. Figure 11 illustrates this relationship for single-sided ribbon lengths of 120, 160, and 200 mm.
Figure 11.
Spatial relationship between ribbons of different lengths and the forebody near-wake region.
As the single-side ribbon length increases from 120 to 160 and 200 mm, the added downstream portion extends progressively into the wake-recovery region, where the local velocity is higher. Because the local aerodynamic load scales with the dynamic pressure, this added area is exposed to a higher effective aerodynamic loading. The enhanced length effect under forebody interference therefore cannot be attributed solely to the increase in the geometric area. This results from the combined increase in the loaded area within the recovery region and the higher mean velocity acting on that area. This spatial interpretation is consistent with the change in length sensitivity observed in Section 4.1 and Section 4.2. In a uniform free stream, ribbons of different lengths are exposed to nearly the same inflow, and the length primarily changes the geometric area and deformation state. Behind the forebody, however, the ribbon length also affects the relative portions located in the low-speed shielding region and the downstream recovery region. The resulting coupling between the ribbon extent and the spatially nonuniform wake makes the mean drag substantially more sensitive to the ribbon length.
By comparison, changes in the areal density and equivalent Young’s modulus do not directly alter the axial extent of the ribbon within the forebody near the wake. These effects arise primarily through changes in structural inertia, bending resistance, and the mean deformation state. Consequently, within the parameter range considered, the forebody wake modifies the sensitivity to the ribbon length more strongly than the sensitivities to the two material parameters.
These results identify the axial velocity deficit and spatial nonuniformity of the forebody near the wake as key factors governing the mean drag of the flexible ribbons. An effective-dynamic-pressure correction is therefore introduced into the conventional free-stream ribbon-drag relation to represent wake shielding and to construct an engineering mean-drag model for the projectile–flexible ribbon configuration.
5. Engineering Drag Correction Model Under Forebody—Wake Shielding
The results of Section 4 demonstrate that the flexible ribbons exhibit markedly different mean aerodynamic behaviours in a uniform free stream and in the forebody wake. For the tandem projectile–ribbon configuration considered here, the velocity deficit in the near wake substantially reduces the mean ribbon drag, and the magnitude of this reduction strongly depends on the ribbon length. The actual density and equivalent Young’s modulus also affect the mean aerodynamic response. A conventional flag-drag relation derived for a uniform free stream is therefore insufficient for the present configuration. On the basis of the FSI results of Section 4, the classical engineering drag formulation for flexible flags is extended by introducing a forebody–wake shielding correction. A fluctuation-induced drag ratio is used to represent the additional drag associated with flexible deformation and material properties, yielding an engineering mean–drag model for the projectile—dual–ribbon configuration.
5.1. Baseline Ribbon–Drag Model
Previous studies of flexible flag aerodynamics have shown that the drag of a streamwise-aligned flexible fabric includes not only viscous skin friction but also an additional contribution associated with deformation and flapping [16,18,19,20,21,25]. This additional drag is influenced by the fabric mass and geometric scale.
Following this drag-decomposition concept, the mean aerodynamic drag of a single free ribbon is written as the sum of the skin-friction drag and flapping-induced additional drag. For subsequent engineering corrections, the dimensionless additional-drag ratio is defined as
where is the skin friction drag on the ribbon surface and where is the additional drag caused by flexible deformation, flapping, and the accompanying flow separation. The total ribbon drag can therefore be written as
For the dual-ribbon configuration considered here, each exposed ribbon branch has a length and width , resulting in two free branches. Let denote the mean turbulent skin friction coefficient for one surface. For a fully developed turbulent boundary layer over a smooth flat plate, the coefficient is evaluated via a modified Prandtl–Schlichting relation:
where the Reynolds number is based on the ribbon length , i.e., .
Because the two ribbons provide four frictional surfaces in total, the baseline mean drag of the dual-ribbon configuration in a uniform free stream is
where is the freestream dynamic pressure.
This formulation separates ribbon drag into two contributions with clear physical meanings: represents viscous skin friction, whereas represents the additional drag associated with flexible deformation and flapping.
The total drag of a flexible fabric can substantially exceed the skin-friction drag of a flat plate of comparable size [16,18,19,20,21,25]. However, the areal density, geometric scale, and material stiffness modify the flapping and deformation state, so should not be treated as a universal constant. In the present model, is used as an equivalent engineering parameter for the additional drag and is identified from the experimentally validated ALE FSI results.
5.2. Forebody–Wake Shielding Correction
The baseline relation in Equation (18) assumes that the entire ribbon is exposed to a uniform free stream. In the present configuration, however, the ribbon is located directly downstream of the projectile and experiences a strongly nonuniform wake. As shown in Section 4.3, the near wake is characterized by a pronounced velocity deficit followed by downstream recovery. For engineering prediction of the mean ribbon drag, this spatially varying wake is represented by an equivalent wake-shielded region and a wake-recovery region.
The equivalent shielding length is introduced to characterize the axial extent over which the wake produces a strong reduction in the effective aerodynamic loading. is an equivalent model parameter identified from the mean-drag response of ribbons with different lengths rather than a direct geometric measurement from a particular instantaneous flow structure. Together with the recovery-region velocity-reduction factor , it provides an integrated representation of the wake-induced dynamic-pressure deficit experienced by the ribbon. The contribution of the equivalent shielded region to the mean axial aerodynamic load is represented by , while the representative velocity in the recovery region is written as .
For a ribbon with a single-sided length and accounting for the quadratic dependence of the dynamic pressure on the velocity, the effective-dynamic-pressure correction for the entire ribbon is expressed as
This relation shows that, for a fixed wake structure, a larger fraction of a short ribbon lies within the shielded region and therefore experiences a lower mean effective dynamic pressure. As the ribbon length increases, the fraction extending into the wake—recovery region increases, and the mean effective aerodynamic loading increases accordingly. This trend is consistent with the 120, 160, and 200 mm cases discussed in Section 4.
5.3. Flexibility Parameter Correction Based on
The free-stream and forebody interference results in Section 4 show that the areal density, equivalent Young’s modulus, and ribbon length affect the mean aerodynamic drag. The areal density and equivalent Young’s modulus primarily modify the fluctuation-induced additional drag by changing the structural inertia, deformation, and flapping behaviour. The ribbon length influences both the fraction of the ribbon exposed to different wake regions and the intrinsic deformation and fluctuation-induced drag of the ribbon. Accordingly, the fluctuation-induced drag ratio is used to provide a unified correction for these flexibility parameters.
Using the baseline areal density , equivalent Young’s modulus , and single-sided ribbon length , power-law corrections are introduced for the areal density and equivalent Young’s modulus. For the ribbon length, the nondimensional length deviation is defined as
and a first-order length correction function is introduced as
The equivalent fluctuation-induced drag ratio for arbitrary geometric and material parameters is then expressed as
where is the equivalent fluctuation-induced drag ratio for the baseline material configuration; and are the sensitivity exponents for the areal density and equivalent Young’s modulus, respectively; and are the length-correction coefficients; is the ribbon areal density; and is the ribbon Young’s modulus. Case 3 is used as the baseline configuration, with a single-sided ribbon length of 160 mm, an areal density of 41 g/m2, and an equivalent Young’s modulus of 0.3 GPa. The corresponding coefficients are calibrated from the ALE results in Section 5.5.
The wake-induced spatial effect of the ribbon length is therefore represented by , the effects of the areal density and equivalent Young’s modulus on the additional flexible drag are represented by , and the intrinsic length dependence of the fluctuation-induced drag is represented by the length-correction function .
5.4. Combined Mean–Drag Model
Combining smooth-plate skin friction, forebody–wake shielding, and fluctuation-induced additional drag, the mean drag of the dual flexible ribbons is expressed as
Equation (23) constitutes the engineering mean—drag correction model for the dual-ribbon configuration under forebody–wake shielding. The terms , , and represent viscous flat-plate skin friction, the effective-dynamic-pressure deficit caused by the forebody wake, and the additional drag associated with ribbon flapping, respectively. The ribbon drag coefficient is defined as
where is the reference area of the two flexible ribbons, which is consistent with the reference area used for the ribbon drag coefficients in Section 4.
Section 4 further shows that, within the present parameter range, the downstream ribbons change the mean forebody drag by less than 2%. This feedback can therefore be neglected for engineering purposes, and the total drag of the projectile–ribbon system may be approximated as the linear sum of forebody drag and ribbon drag.
5.5. Model Calibration and Independent Validation
The model parameters are identified via a three-stage procedure: validation of the ALE method against wind-tunnel data, parameter calibration from ALE results, and independent validation via numerical cases excluded from the calibration. As shown in Section 4, after the forebody drag is subtracted, the simulated ribbon drag differs from the measurements by approximately 2.50% and 4.75% for the two ribbon configurations. The validated ALE model is therefore used to provide the calibration data. To preserve independence between calibration and validation, only the end-point conditions Ma = 0.3 and 0.85 are used for parameter identification, whereas all cases at Ma = 0.4, 0.5, 0.6, and 0.7 are reserved for validation.
The baseline fluctuation-induced drag ratio is first obtained from the ALE results for isolated ribbons in a uniform free stream. The baseline model in Section 4.1 can be recovered from the mean drag of the isolated dual-ribbon configuration as
where is the ALE-predicted mean drag of the isolated dual ribbons. The resulting characterizes the intrinsic fluctuation-induced additional drag associated with different geometric and material conditions and provides a reference basis for subsequent wake-parameter calibration. Notably, , obtained from the free-stream cases, serves as a reference quantity for the calibration procedure, whereas the baseline ratio in the combined model is an equivalent engineering parameter identified after introducing the forebody–wake correction and using the baseline forebody–interference cases. The two quantities share the same physical basis of additional drag but correspond to different calibration conditions. The final combined model therefore uses as the baseline parameter.
The forebody–wake parameters are calibrated via forebody interference cases with different ribbon lengths. On the basis of the near-wake analysis in Section 4, the velocity-reduction factor in the equivalent wake-shielded region is set to . The wake model therefore contains only two free parameters: the equivalent shielding length and the recovery-region velocity-reduction factor . Cases 5, 3, and 4, corresponding to single-side lengths of 120, 160, and 200 mm, respectively, are used at Ma = 0.3 and 0.85, yielding six calibration points. The ALE mean drag under forebody interference is taken as the target quantity, and and are determined simultaneously via a physically constrained least-squares fit. The objective function is
where is the number of calibration cases and where and are the engineering model and ALE drag values for the th case, respectively. The optimization yields an equivalent shielding length and a recovery-region velocity-reduction factor , with a minimum objective value of . Thus, the calibrated represents the equivalent axial scale required for the reduced-order wake model to reproduce the mean drag response across ribbons of different lengths.
Using the calibrated wake parameters, the baseline fluctuation-induced drag ratios obtained from Case 3 at Ma = 0.3 and 0.85 are 17.167 and 17.119, respectively. Because the difference is small, their mean is adopted as a single baseline value over the investigated Mach-number range: .
After the equivalent wake parameters and baseline fluctuation-induced drag ratio are determined, the flexibility parameter corrections in Section 4.3 are calibrated from the Ma = 0.3 and 0.85 cases. The areal-density correction is identified from Cases 2 and 3, giving the areal-density sensitivity exponent .
The equivalent-Young’s modulus correction is identified from Cases 3, 6, and 7, yielding the stiffness sensitivity exponent .
The free-stream results also show clear differences in the fluctuation-induced drag ratios among the 120, 160, and 200 mm ribbons, indicating that length affects not only the spatial wake-shielding fraction but also the intrinsic fluctuation-induced drag of the ribbon. Using the length-correction relation introduced in Section 4.3, with as the baseline length, the 120 mm and 200 mm cases at the two-endpoint Mach numbers are used for calibration, yielding and . The resulting correction factors for L = 120, 160, and 200 mm are 1.357, 1.000, and 0.970, respectively. The complete set of calibrated engineering model parameters is summarized in Table 6.
Table 6.
Main parameters of the engineering mean-drag model.
After calibration, the parameters are substituted into the combined mean‒drag model of Section 5.4. All cases at Ma = 0.4, 0.5, 0.6, and 0.7, which were not used in parameter identification, are then used for independent validation. The mean absolute relative error for each case is listed in Table 7.
Table 7.
Independent validation errors of the engineering model for different cases.
The overall predictive accuracy is evaluated via the mean absolute percentage error (MAPE):
where is the number of validation cases. For the 24 independent cases at Ma = 0.4, 0.5, 0.6, and 0.7, the overall MAPE of the engineering model is .
The maximum pointwise relative error is 8.72%, occurring for Case 7 at Ma = 0.4. A comparison between the engineering model predictions and the ALE results is shown in Figure 12.
Figure 12.
Independent validation of the engineering correction model: (a) comparison of mean drag; (b) absolute relative errors.
As shown in Figure 12, the engineering model agrees well with the ALE FSI results above Ma = 0.4–0.7, none of which were used for parameter calibration. For the two length-variation cases, Cases 4 and 5, the mean absolute relative errors are 1.73% and 1.36%, respectively, indicating that the combination of forebody–wake spatial shielding and intrinsic ribbon-length correction captures the drag differences caused by length variation. The mean error is 0.99% for the areal density case (Case 2) and 3.06% and 5.44% for the equivalent-Young’s modulus cases (Cases 6 and 7), respectively. Across all 24 independent validation cases, the MAPE is 2.33%, and the maximum absolute relative error is 8.72%. These results demonstrate that the proposed engineering correction model provides accurate mean-drag prediction within the parameter range considered.
6. Discussion
Wind-tunnel experiments and ALE FSI simulations were used to investigate the aerodynamics of a projectile–flexible ribbon system over Ma = 0.3–0.85. The effects of flexibility parameters and forebody–wake interference on the mean drag were quantified, and an engineering mean-drag model was developed for the coupled configuration. The main conclusions are as follows.
The ALE FSI method provides reliable predictions of the mean aerodynamic loading on flexible ribbons. After the forebody drag is subtracted, the mean differences between the numerical and wind-tunnel results for the two ribbon configurations are 2.50% and 4.75%, respectively, providing the validation basis for the subsequent parametric analysis and model development.
Under uniform free-stream conditions, flexible ribbons clearly exhibit geometric and material sensitivities. The absolute drag increases with the Mach number, whereas the drag coefficient generally decreases. Increasing the areal density from 27 to 41 g/m2 increased the mean drag coefficient by approximately 32.2%, making the areal density the most influential parameter within the range considered. Increasing the equivalent Young’s modulus from 0.3 to 0.7 GPa increases the drag coefficient by approximately 9.0%, whereas the free-stream sensitivity to the ribbon length is comparatively weak.
The forebody near the wake substantially modifies both the mean ribbon drag and its parameter sensitivity. With the forebody present, the increase in the drag coefficient associated with the areal-density variation decreases from approximately 32.2% in uniform flow to approximately 12.1%, whereas the length effect becomes markedly stronger. For single-side ribbon lengths of 120, 160, and 200 mm, the free-stream drag coefficients are on average 173.07%, 115.56%, and 64.33% greater, respectively, than those under forebody interference. The feedback of the downstream ribbons on the mean forebody drag remains below 2%, demonstrating strongly directional aerodynamic interference within the tandem configuration.
The enhanced sensitivity to the ribbon length under forebody interference is closely associated with the spatial nonuniformity of the near-wake axial velocity field. A short ribbon lies predominantly within the low-speed shielded region and therefore experiences a low mean effective dynamic pressure. As the ribbon length increases, the added downstream portion extends into regions with stronger velocity recovery, increasing both the effectively loaded area and the local dynamic pressure. The length effect under forebody interference is therefore governed by the coupling between the ribbon spatial extent and the near-wake velocity distribution rather than by the geometric area alone.
The engineering mean—drag model developed from these response characteristics provides good predictive accuracy within the investigated range. The model combines flat-plate skin friction, the effective-dynamic pressure deficit induced by the forebody wake, and fluctuation-induced additional drag, together with corrections for areal density, the equivalent Young’s modulus, and the ribbon length. After calibration at Ma = 0.3 and 0.85, the model yields an overall MAPE of 2.33% for 24 independent cases at Ma = 0.4–0.7, with a maximum pointwise absolute relative error of 8.72%. The model therefore enables low-cost prediction of the mean-drag variations associated with forebody–wake interference and flexibility parameters within the present design space.
Overall, forebody–wake shielding not only reduces the mean drag of the flexible ribbons but also reorganizes the relative importance of the geometric and material parameters. The coupling between the ribbon length and the spatial structure of the near wake is the dominant factor behind this change. The proposed engineering formulation translates this FSI effect into a compact mean—drag correction suitable for rapid aerodynamic assessment and design of flexible ribbon deceleration and stabilization devices.
Author Contributions
S.W.: methodology, investigation, numerical simulation, data analysis, visualization, writing—original draft. H.W.: conceptualization, supervision, methodology, writing—review and editing. W.R.: supervision, resources, writing—review and editing. All authors have read and agreed to the published version of the manuscript.
Funding
This research received no external funding. The APC was funded by the authors.
Data Availability Statement
The datasets generated and/or analysed during the current study are available from the corresponding author on reasonable request.
Conflicts of Interest
The authors declare no competing interests.
References
- Kassem, A.; Romeo, S.A.S.; Tiwari, B.; San, O.; Kara, K. Data-driven reduced-order modeling framework for blunt-body aerodynamic characterization. Aerosp. Sci. Technol. 2026, 171, 111615. [Google Scholar] [CrossRef] [Scilit]
- Lai, J.; Zhao, Z.; Wang, X.; Li, H.; Li, Q. Numerical investigation of pitch motion induced unsteady effects on transverse jet interaction. Aerosp. Sci. Technol. 2020, 105, 106005. [Google Scholar] [CrossRef] [Scilit]
- Li, H.; Ye, Z. Numerical investigation on aerodynamic and inertial couplings of flexible spinning missile with large slenderness ratio. Aerosp. Sci. Technol. 2020, 99, 105582. [Google Scholar] [CrossRef] [Scilit]
- Xing, B.; Du, C.; Du, Z.; Yang, W. Robust optimization design of the aerodynamic shape and external ballistics of a pulse trajectory correction projectile. Appl. Sci. 2023, 13, 7007. [Google Scholar] [CrossRef] [Scilit]
- Ji, W.; Gong, C.; Jia, X.; Li, C.; Wang, G. Unsteady aerodynamic modeling and flight trajectory simulation of dual-spin projectile based on DNN and transfer-learning. Aerosp. Sci. Technol. 2024, 155, 109711. [Google Scholar] [CrossRef] [Scilit]
- Dean, H.V.; Decker, K.; Robertson, B.E.; Mavris, D.N. A reduced order modeling approach to blunt-body aerodynamic modeling. In Proceedings of the AIAA SCITECH 2024 Forum, Orlando, FL, USA, 8–12 January 2024. AIAA Paper 2024-1914. [Google Scholar] [CrossRef] [Scilit]
- Shen, J.; Fan, S.-B.; Ji, Y.-X.; Zhu, Q.-Y.; Duan, J. Aerodynamics analysis of a hypersonic electromagnetic gun launched projectile. Def. Technol. 2020, 16, 753–761. [Google Scholar] [CrossRef] [Scilit]
- Liang, Y.; Li, G.; Xu, M.; Zhao, J.; Hao, F.; Shi, H. An intelligent control method based on artificial neural network for numerical flight simulation of the basic finner projectile with pitching maneuver. Def. Technol. 2024, 32, 663–674. [Google Scholar] [CrossRef] [Scilit]
- Tezduyar, T.; Osawa, Y. Fluid-structure interactions of a parachute crossing the far wake of an aircraft. Comput. Methods Appl. Mech. Eng. 2001, 191, 717–726. [Google Scholar] [CrossRef] [Scilit]
- Zhou, Y.; Zhao, S.; Jia, H.; Bao, W.; Rong, W.; Zou, T.; Wang, Q.; Xue, X. Influence mechanism of fabric stiffness on transonic aerodynamic performance of Mars exploration parachutes. Aerosp. Sci. Technol. 2026, 177, 112244. [Google Scholar] [CrossRef] [Scilit]
- Tezduyar, T.E.; Sathe, S.; Pausewang, J.; Schwaab, M.; Christopher, J.; Crabtree, J. Interface projection techniques for fluid-structure interaction modeling with moving-mesh methods. Comput. Mech. 2008, 43, 39–49. [Google Scholar] [CrossRef] [Scilit]
- Li, G.; Zhang, S.; Jiang, P. Numerical study of a cross parachute using fluid–structure interaction method. In Mechanical and Aerospace Engineering: Proceedings of the 15th Asia Conference on Mechanical and Aerospace Engineering (ACMAE 2024); Guan, B., Ed.; IOS Press: Amsterdam, The Netherlands, 2025; pp. 663–670. [Google Scholar] [CrossRef] [Scilit]
- Xue, X.; Jia, H.; Rong, W.; Jiang, W.; Bao, W.; Wang, Z.; Zou, T.; Dai, Y.; Zhou, Y. Review of high-speed flexible aerodynamic decelerators key technologies. Acta Aeronaut. Astronaut. Sin. 2025, 46, 631677. (In Chinese) [Google Scholar] [CrossRef]
- Li, Y.; Han, C.; Zhan, Y.; Li, S. Study of parachute inflation process using fluid–structure interaction method. Chin. J. Aeronaut. 2014, 27, 272–279. [Google Scholar] [CrossRef] [Scilit]
- Boustani, J.; Barad, M.F.; Kiris, C.C.; Brehm, C. An immersed interface methodology for simulating supersonic spacecraft parachutes with fluid–structure interaction. J. Fluids Struct. 2022, 114, 103742. [Google Scholar] [CrossRef] [Scilit]
- Carruthers, A.C.; Filippone, A. Aerodynamic drag of streamers and flags. J. Aircr. 2005, 42, 976–982. [Google Scholar] [CrossRef] [Scilit]
- Carruthers, A.; Filippone, A. Aerodynamic drag of streamers, parafoils and loops. In Proceedings of the 43rd AIAA Aerospace Sciences Meeting and Exhibit, Reno, NV, USA, 10–13 January 2005. AIAA Paper 2005-856. [Google Scholar] [CrossRef] [Scilit]
- Auman, L.; Dahlke, C. Drag characteristics of ribbons. In Proceedings of the 16th AIAA Aerodynamic Decelerator Systems Technology Conference and Seminar, Boston, MA, USA, 21–24 May 2001. AIAA Paper 2001-2011. [Google Scholar] [CrossRef] [Scilit]
- Auman, L.; Wilks, B. Application of fabric ribbons for drag and stabilization. In Proceedings of the 18th AIAA Aerodynamic Decelerator Systems Technology Conference and Seminar, Munich, Germany, 23–26 May 2005. AIAA Paper 2005-1618. [Google Scholar] [CrossRef] [Scilit]
- Carruthers, A.C.; Filippone, A. Drag and flutter characteristics of loop membranes. J. Aircr. 2007, 44, 317–322. [Google Scholar] [CrossRef] [Scilit]
- Virot, E.; Amandolese, X.; Hémon, P. Fluttering flags: An experimental study of fluid forces. J. Fluids Struct. 2013, 43, 385–401. [Google Scholar] [CrossRef] [Scilit]
- Pepper, W.B.; Post, H.N. Wind-tunnel tests of small decelerator stabilizers. J. Aircr. 1971, 8, 120–121. [Google Scholar] [CrossRef] [Scilit] [PubMed]
- Özkan, M.; Erkan, O.; Basaran, S. Flag fluttering-triggered piezoelectric energy harvester at low wind speed conditions. Energy Technol. 2024, 12, 2301194. [Google Scholar] [CrossRef] [Scilit]
- Raynaud, G.; Mulleners, K. On the wake and flapping dynamics of different aspect ratio flags. arXiv 2026, arXiv:2602.06237. [Google Scholar] [CrossRef] [Scilit]
- Hoerner, S.F. Fluid-Dynamic Drag: Practical Information on Aerodynamic Drag and Hydrodynamic Resistance, 2nd ed.; S.F. Hoerner: Midland Park, NJ, USA, 1958. [Google Scholar]
- Pao, H.P. Dynamical stability of a towed thin flexible cylinder. J. Hydronautics 1970, 4, 144–150. [Google Scholar] [CrossRef] [Scilit]
- Alben, S.; Shelley, M.J. Flapping states of a flag in an inviscid fluid: Bistability and the transition to chaos. Phys. Rev. Lett. 2008, 100, 074301, Erratum in Phys. Rev. Lett. 2008, 101, 119902. [Google Scholar] [CrossRef] [Scilit] [PubMed]
- Afanaseva, A.; Gouskov, A.; Panovko, G. Non linear dynamics of a thin narrow ribbon in an airflow. Vibroeng. Procedia 2020, 32, 105–110. [Google Scholar] [CrossRef] [Scilit]
- Tavallaeinejad, M. Nonlinear Dynamics of Inverted Flags: A Theoretical and Experimental Investigation. Ph.D. Thesis, McGill University, Montreal, QC, Canada, 2020. [Google Scholar]
- Huang, W.-X.; Sung, H.J. Three-dimensional simulation of a flapping flag in a uniform flow. J. Fluid Mech. 2010, 653, 301–336. [Google Scholar] [CrossRef] [Scilit]
- Michelin, S.; Llewellyn Smith, S.G.; Glover, B.J. Vortex shedding model of a flapping flag. J. Fluid Mech. 2008, 617, 1–10. [Google Scholar] [CrossRef] [Scilit]
- Connell, B.S.H.; Yue, D.K.P. Flapping dynamics of a flag in a uniform stream. J. Fluid Mech. 2007, 581, 33–67. [Google Scholar] [CrossRef] [Scilit]
- Griffith, B.E.; Patankar, N.A. Immersed methods for fluid-structure interaction. Annu. Rev. Fluid Mech. 2020, 52, 421–448. [Google Scholar] [CrossRef] [Scilit] [PubMed]
- Nawafleh, A.; Xing, T.; Durgesh, V.; Padilla, R. Fluid-structure interaction simulation of a flapping flag in a laminar jet. J. Fluids Struct. 2023, 119, 103869. [Google Scholar] [CrossRef] [Scilit]
- Tan, H.; Ruan, W. Fluid-structure interaction study on drag characteristics of flexible ribbon. J. Phys. Conf. Ser. 2023, 2660, 012011. [Google Scholar] [CrossRef] [Scilit]
- Tang, L.; Païdoussis, M.P. The coupled dynamics of two cantilevered flexible plates in axial flow. J. Sound Vib. 2009, 323, 790–801. [Google Scholar] [CrossRef] [Scilit]
- Ristroph, L.; Zhang, J. Anomalous hydrodynamic drafting of interacting flapping flags. Phys. Rev. Lett. 2008, 101, 194502. [Google Scholar] [CrossRef] [Scilit] [PubMed]
- Latif, U.; Dowell, E.H.; Uddin, E.; Younis, M.Y.; Frisch, H.M. Comparative analysis of flag based energy harvester undergoing extraneous induced excitation. Energy 2024, 295, 130995. [Google Scholar] [CrossRef] [Scilit]
- Lee, M.; Jung, C.; Lee, J.; Kim, D. Gravity-coupled flutter and contact of a flag near a wall. J. Fluid Mech. 2023, 977, A2. [Google Scholar] [CrossRef] [Scilit]
- Anjum, M.; Ben Ayed, S.; Shahid, H.; Uddin, E.; Abdelkefi, A. Insights on the effects of aspect ratio and presence of bluff body on the dynamics and characteristics of flexible flags. Ocean Eng. 2026, 348, 124067. [Google Scholar] [CrossRef] [Scilit]
- Najafpour, S.; Bahrami, M. Interaction between inverted flags: Application in heat transfer enhancement. Int. J. Heat Mass Transf. 2026, 255, 127868. [Google Scholar] [CrossRef] [Scilit]
- Jiang, H.; Pfister, J.-L.; Huang, D.Z.; Cao, S. Koopman reduced-order modeling and analysis of flag flapping in the wake of a cylinder. Phys. Rev. E 2025, 111, 045101. [Google Scholar] [CrossRef] [Scilit] [PubMed]
- Wang, H.; Zhai, Q.; Zhang, J. Numerical study of flow-induced vibration of a flexible plate behind a circular cylinder. Ocean Eng. 2018, 163, 419–430. [Google Scholar] [CrossRef] [Scilit]
- Merz, R.A.; Page, R.H.; Przirembel, C.E.G. Subsonic axisymmetric near-wake studies. AIAA J. 1978, 16, 656–662. [Google Scholar] [CrossRef] [Scilit]
- Saile, D.; Kühl, V.; Gülhan, A. On the subsonic near-wake of a space launcher configuration with exhaust jet. Exp. Fluids 2019, 60, 165. [Google Scholar] [CrossRef] [Scilit]
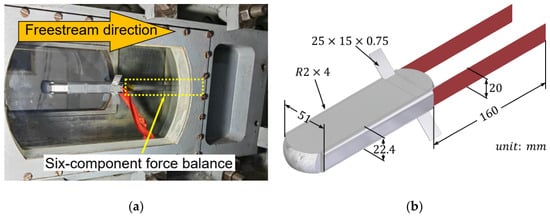
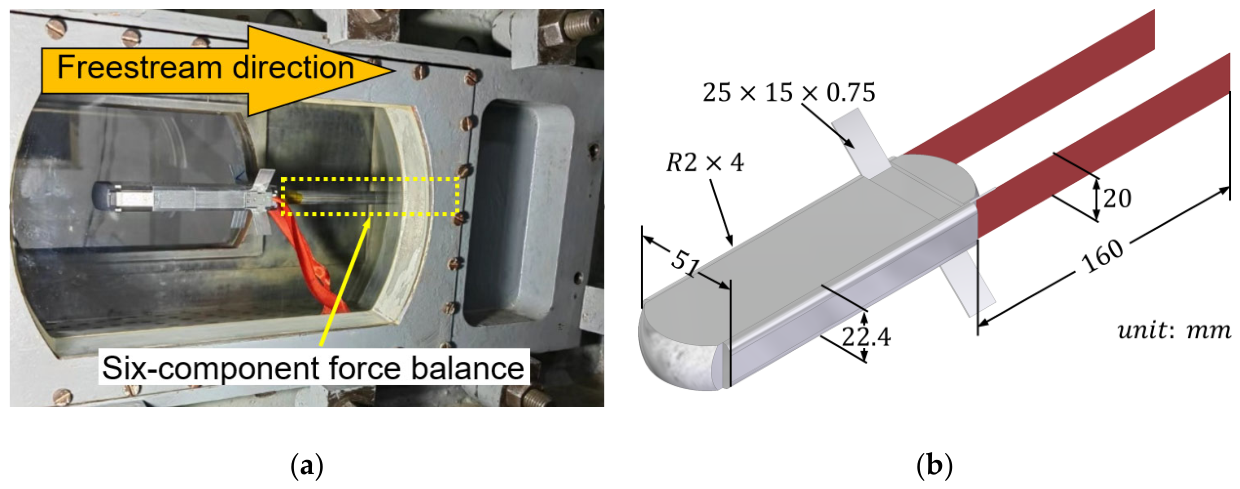
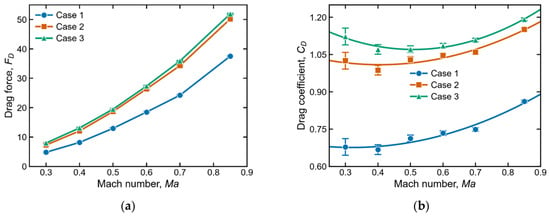
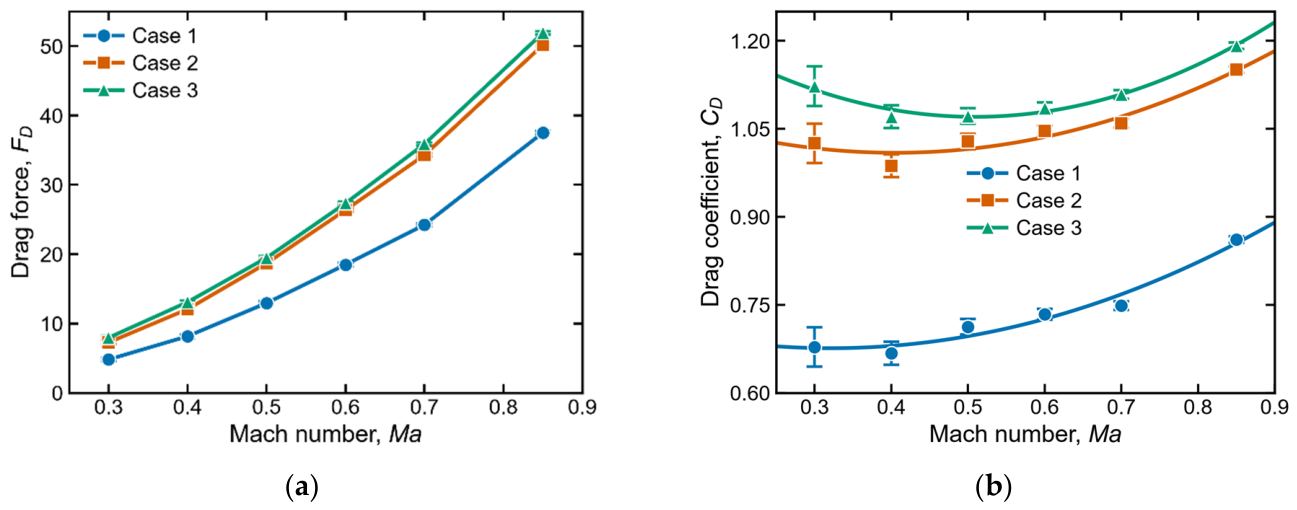
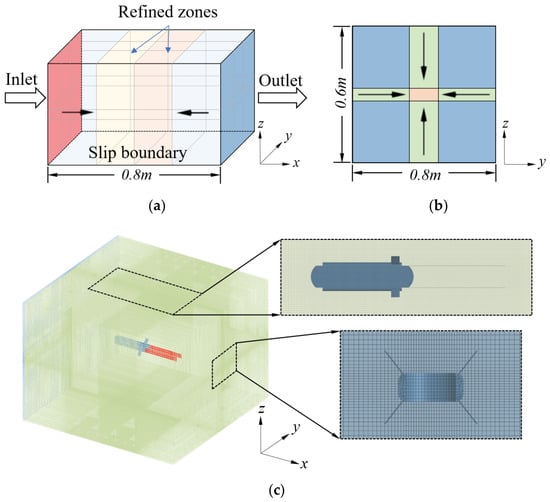
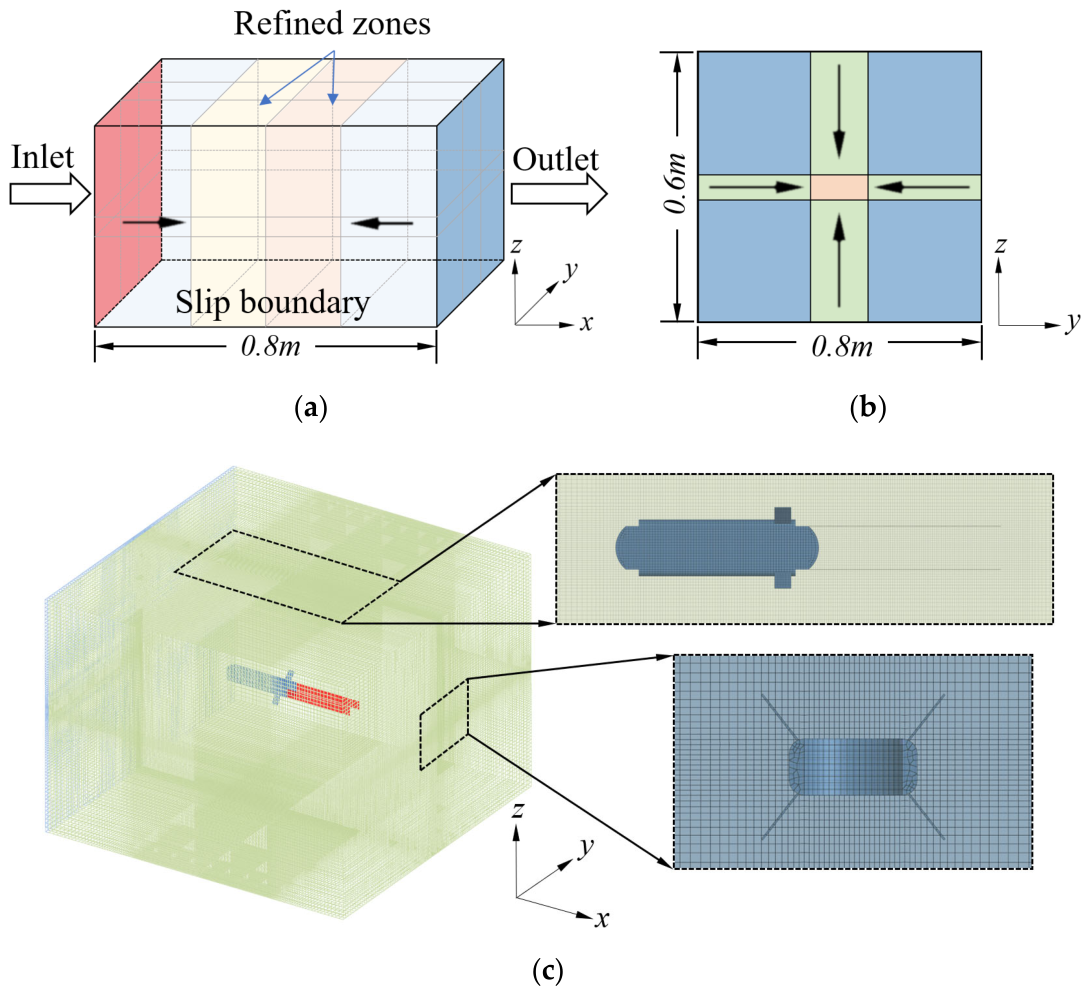
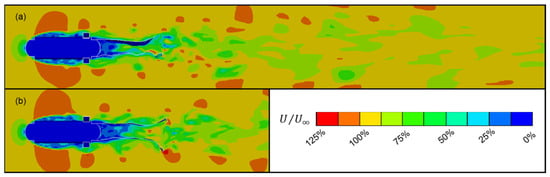
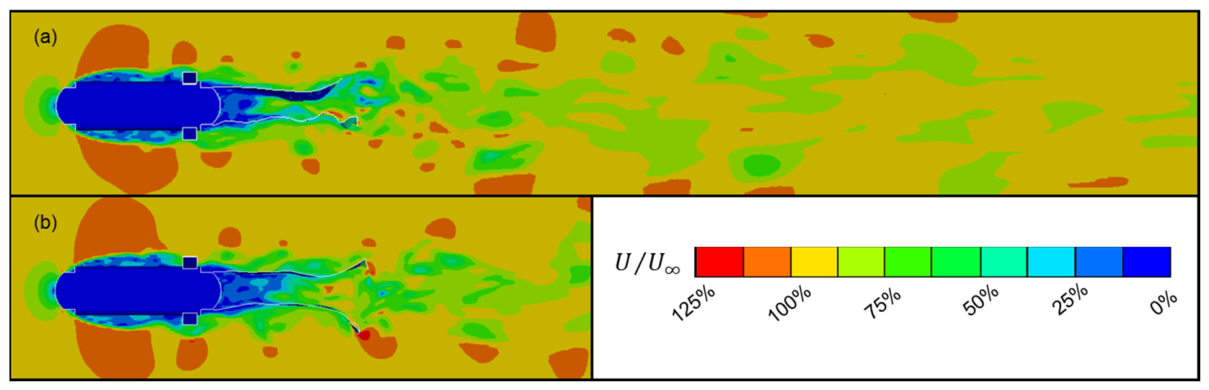
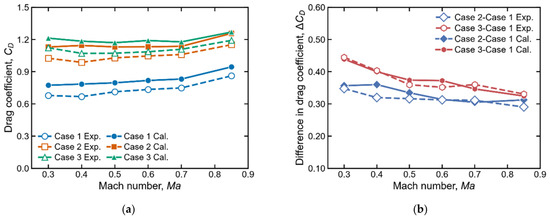
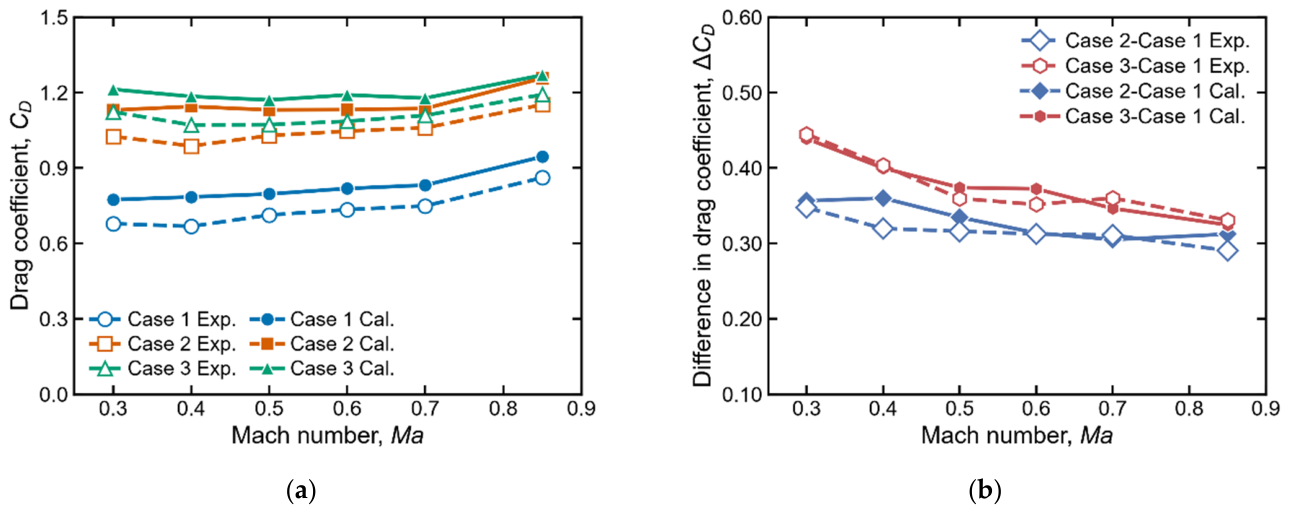
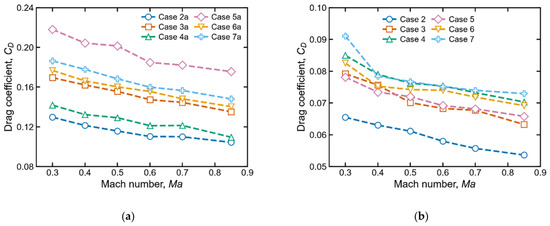
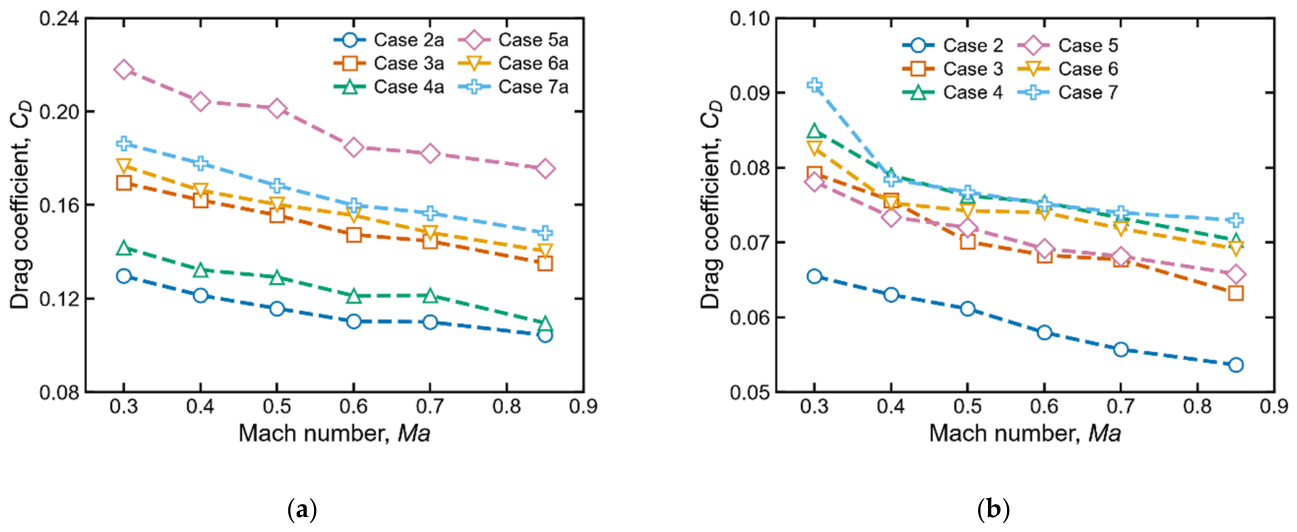
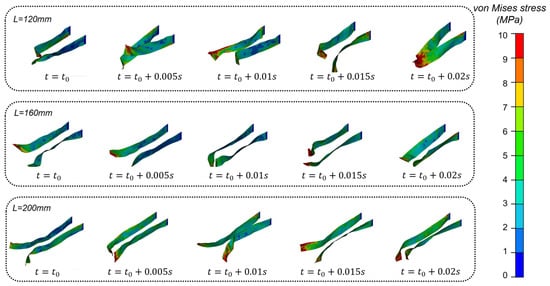
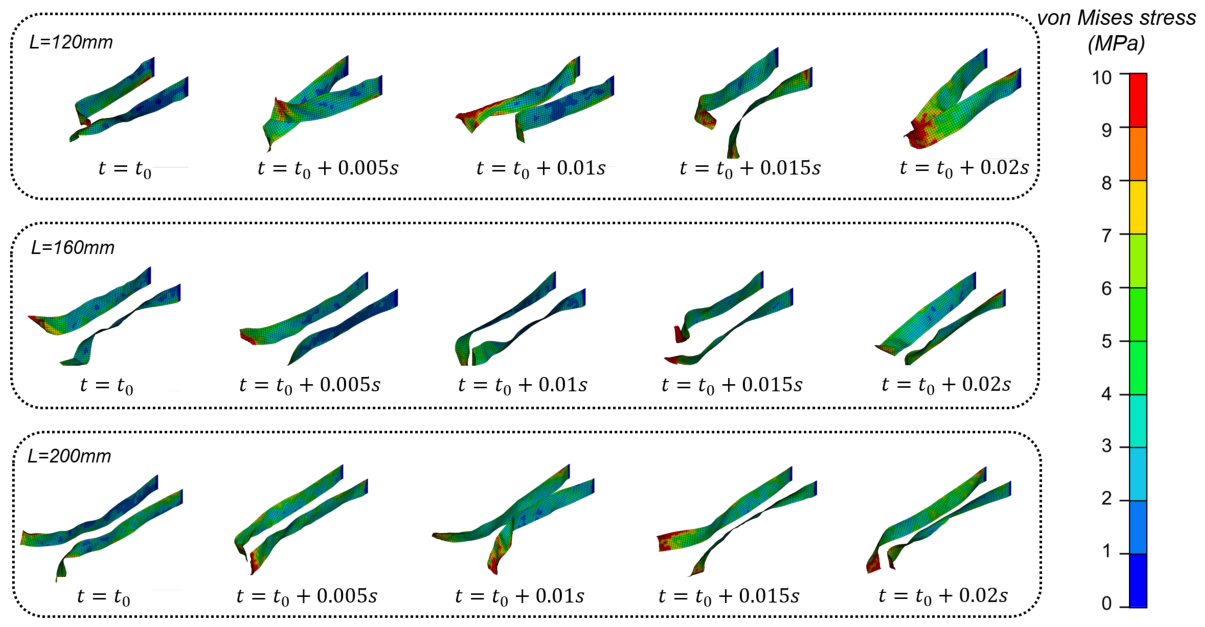
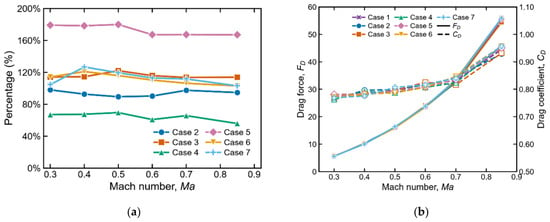
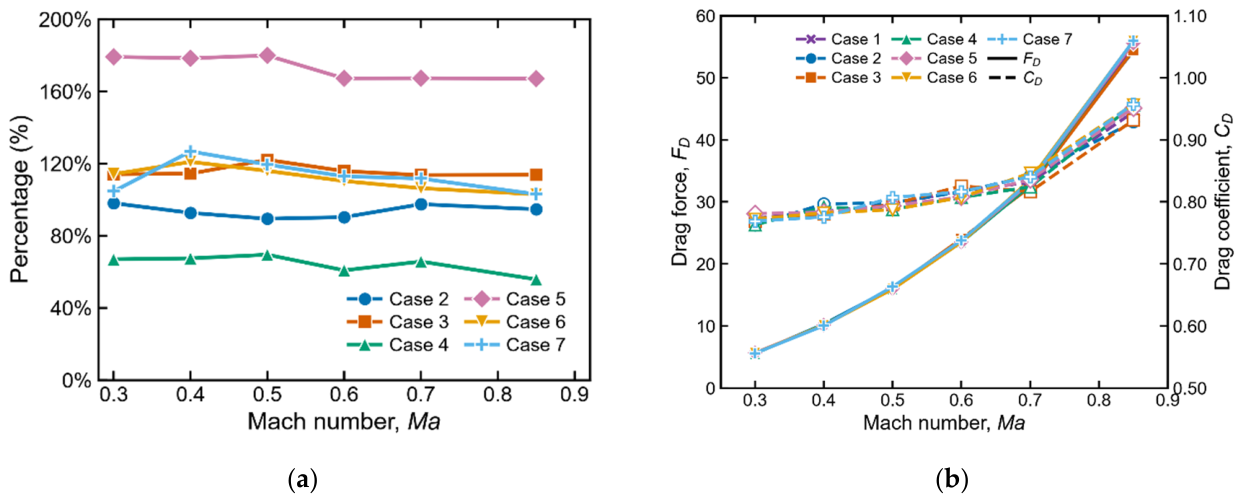
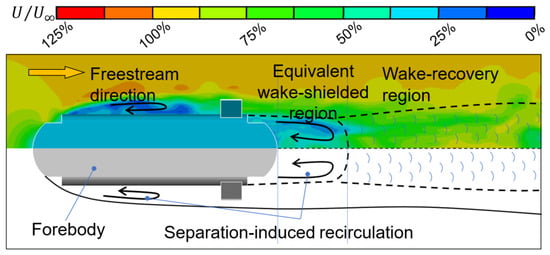
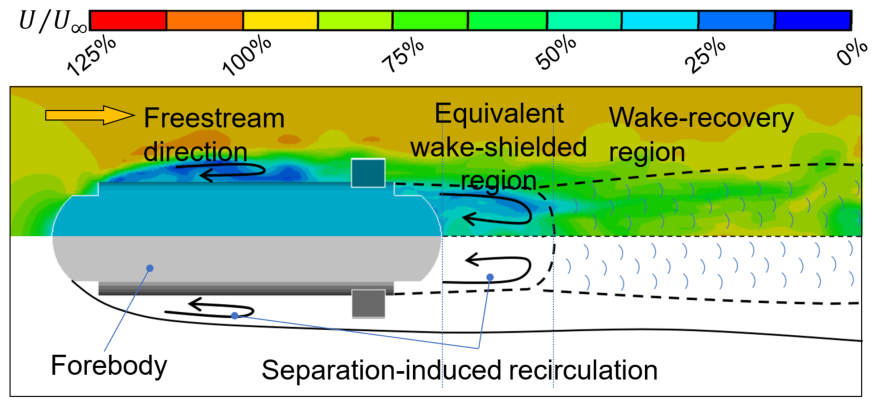
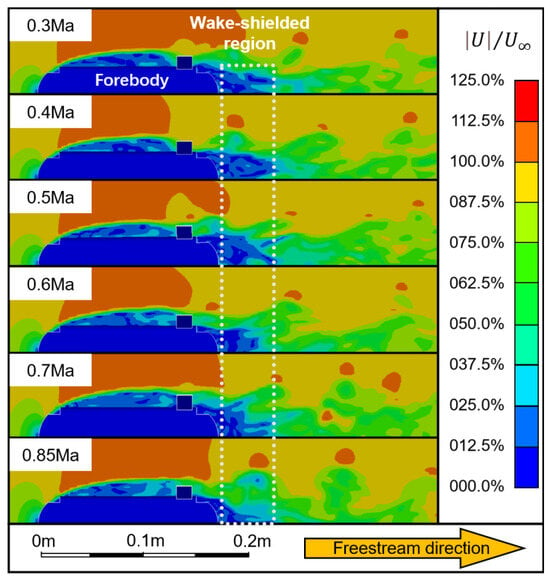
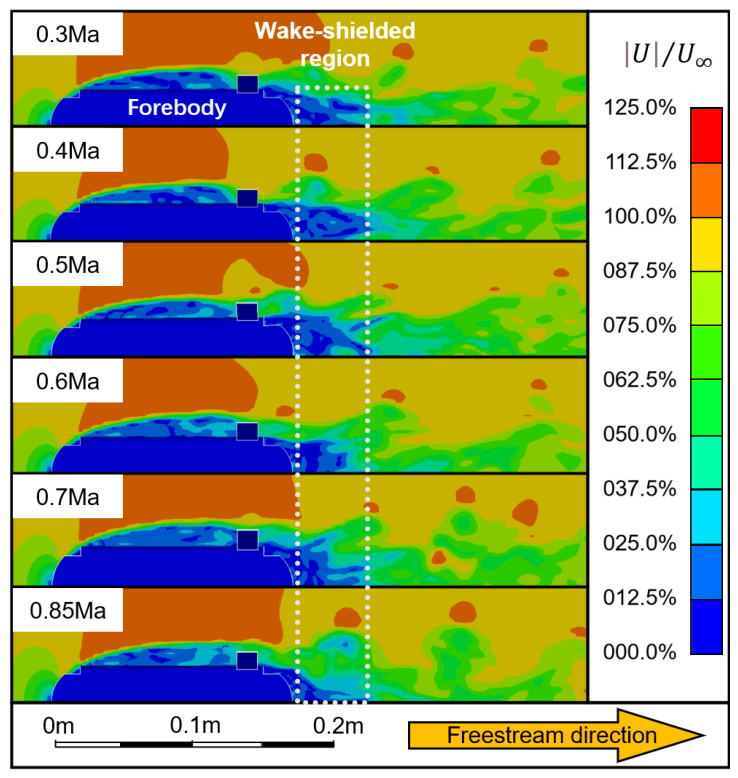
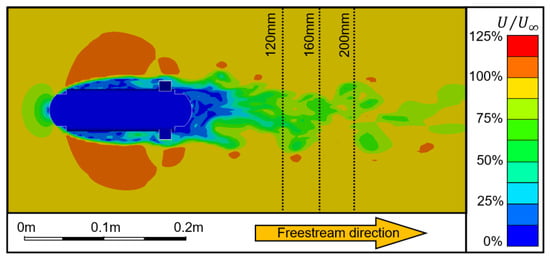
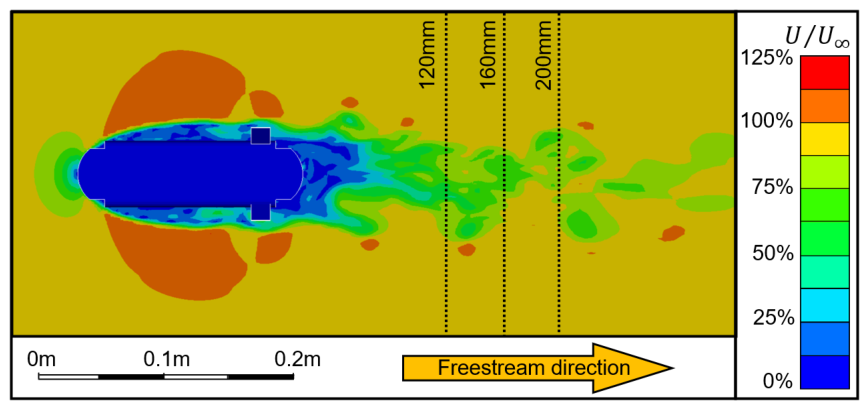
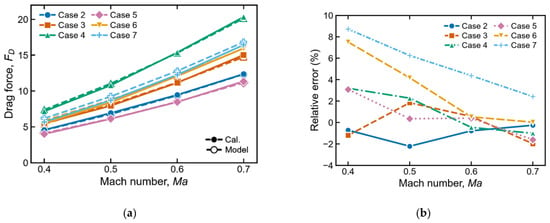
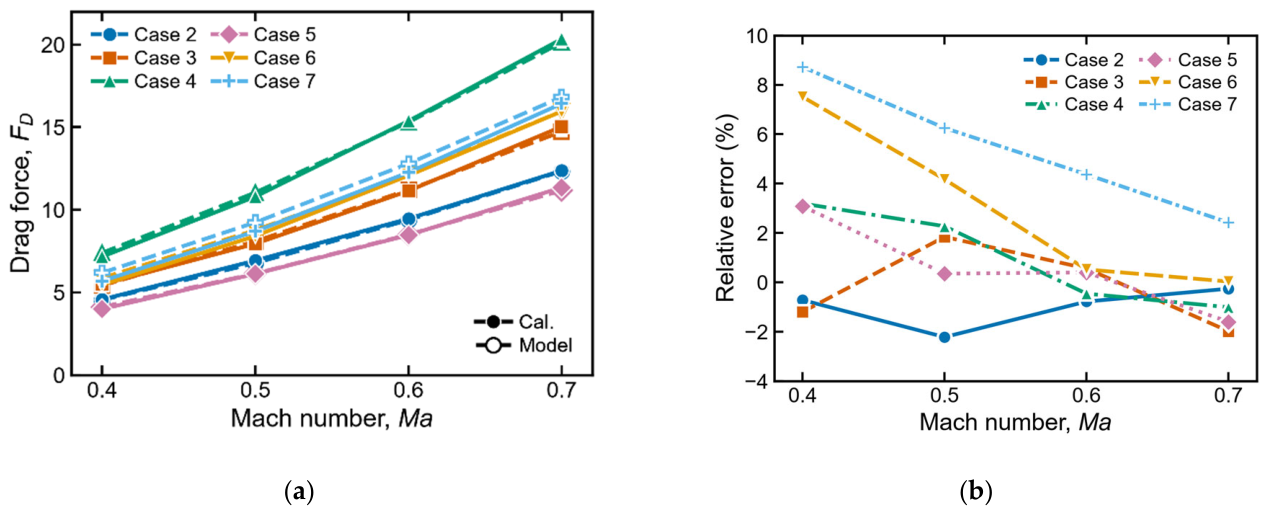

Disclaimer/Publisher’s Note: The statements, opinions and data contained in all publications are solely those of the individual author(s) and contributor(s) and not of MDPI and/or the editor(s). MDPI and/or the editor(s) disclaim responsibility for any injury to people or property resulting from any ideas, methods, instructions or products referred to in the content. |
© 2026 by the authors. Licensee MDPI, Basel, Switzerland. This article is an open access article distributed under the terms and conditions of the Creative Commons Attribution (CC BY) license.