


Abstract
Urban drone logistics face significant challenges in long-distance delivery due to limited drone endurance, making reasonable vertiport siting and air-route planning a critical research problem. Existing studies typically treat facility siting and route configuration as independent or sequential decisions, leading to suboptimal network efficiency and empty-haul wastage. This study proposes an integrated bi-layer optimization framework that integrates vertiport location and air-route planning for urban UAV logistics networks. The upper-level model optimizes vertiport placement and tiered capacity sizing using an improved genetic algorithm (GA) with Halton sequence initialization and a memory bank mechanism, while the lower-level path planning model designs delivery routes via a Greedy-Embedded Ant Colony Optimization (GACO) algorithm. Unlike conventional approaches, the proposed framework establishes a closed-loop iterative coordination mechanism that feeds routing costs back into siting decisions, introduces a hierarchical vertiport deployment scheme dynamically matching facility capacity with regional demand density, and implements a semi-open routing policy that allows cross-station landings to reduce empty-haul flights. Numerical experiments based on real operational data from Shanghai demonstrate that the proposed framework achieves an 8.75% total cost reduction over the traditional sequential location-then-routing strategy. In addition, the hierarchical vertiport construction strategy contributes 4.49% cost savings compared to non-hierarchical schemes, while maintaining strong robustness, with facility overcapacity strictly below 5% under routine demand disturbances up to 10%. These results confirm the effectiveness of the proposed framework in improving the economic efficiency and operational adaptability of urban UAV delivery networks.
1. Introduction
With the rapid development of e-commerce and the emergence of new distribution methods, the number of parcel distribution methods shows a continuous growth trend. In this context, transportation systems utilizing unmanned aerial vehicles (UAVs) have consequently emerged as a transformative development. Accompanied by the significant improvement in endurance, automatic navigation systems and payload performances of UAVs, coupled with the gradual improvement of the industry’s regulatory system, the research and application of UAVs in the fields of emergency rescue [1], medical services [2], and logistics and distribution [3,4] have continued to deepen. At present, Amazon Prime Air [5], Jingdong [6], Jizhi Technology, SF Express and other enterprises have carried out relevant pilot operations [7].
Research on multi-UAV urban logistics primarily encompasses two interdependent decisions: vertiport site selection and UAV route planning. While fundamentally coupled in physical deployment, these two domains have predominantly evolved along separate trajectories. Regarding vertiport location and facility deployment, relevant studies have advanced across model refinement [8,9,10], algorithmic design [11,12,13], and application scenarios [14,15,16,17]. Brühl et al. [9] introduced a hierarchical classification of vertiport types, tailored to service capacity and urban class, while Shavarani et al. [10] advanced facility location by modeling continuously distributed demand along network edges. Brunelli et al. [11] conducted a systematic review on vertiport siting constraints, highlighting the critical role of capacity thresholds in urban air mobility networks. Methodologically, exact solvers, Benders decomposition [12], and enhanced genetic algorithms (GAs) [13] have been widely utilized to optimize facility placement and multi-depot redundancy. Furthermore, studies have investigated travel demand clustering [14], mid-way charging network deployment [15], and commuting-based aerial infrastructure sizing [16]. In addition, Jeong et al. [17] investigated a truck–drone hybrid delivery system, explicitly incorporating payload-dependent energy consumption dynamics and no-fly zone restrictions into flight routing optimization. Vertiport siting methodologies frequently draw upon established principles from ground logistics facility layout planning [18,19,20]. Nonetheless, most existing facility location models either focus on passenger eVTOL transit—which exhibits distinct spatial–temporal patterns from parcel delivery—or treat logistics vertiports as homogeneous single-tier nodes, overlooking the efficiency gains achievable through tiered capacity scaling matched with heterogeneous drone fleets.
Operating downstream from physical vertiport infrastructure, UAV route planning governs the tactical execution of last-mile delivery, where optimization models typically seek to minimize the flight distance, operational duration, energy expenditure, or ground risk [21]. Traditional pathfinding techniques, such as rapidly exploring random trees (RRT) [22], the A* search algorithm [23,24], and the artificial potential field method [25], frequently suffer from computational intractability and suboptimal trajectories in complex low-altitude urban airspace. It is worth emphasizing that intelligent optimization algorithms demonstrate a superior performance in handling highly complex optimization problems and have gradually emerged as a mainstream approach for addressing such challenges. Pustokhina et al. [26] developed an energy-efficient neuro-fuzzy clustering and metaheuristic routing algorithm, which reduces energy consumption through intelligent clustering and heuristic path planning, though its computational overhead remains high for real-time applications. Shi et al. [27] formulated a recharging-dependent routing problem as a mixed-integer nonlinear program (MINLP) that is expressive yet computationally challenging. Han et al. [28] integrated a rolling horizon framework with an enhanced Particle Swarm Optimization (PSO) algorithm, which explicitly models energy consumption and recharging to significantly reduce the mission makespan under dynamic task allocation and path planning. Similarly, other nature-inspired swarm intelligence techniques, such as the Bee Algorithm (BA) [29], have demonstrated pronounced efficacy in solving complex kinematic and robotic trajectory optimization problems. Among various metaheuristics, Ant Colony Optimization (ACO) [30] has gained widespread adoption due to its inherent parallelism, positive feedback mechanism, and strong robustness. To overcome ACO’s inherent search blindness and vulnerability to premature stagnation, numerous scholars have proposed hybrid modifications and improvements [31,32]. For instance, Duan et al. [31] employed a differential evolution algorithm to strengthen the positive feedback mechanism and optimize the pheromone update trajectory, thereby accelerating convergence. Furthermore, modified ACO formulations have demonstrated superior effectiveness in optimizing energy consumption and boundary touring under constrained network environments [33], as well as in handling complex nonlinear parameter optimization and system control [34]. However, when scaling up to large-scale urban delivery networks under tight customer time windows and battery depletion constraints, standard metaheuristics still exhibit slow early exploration and low search efficiency. Moreover, existing routing algorithms predominantly assume rigid closed-loop paths returning to the original departure depot, thereby neglecting the significant energy and fleet savings achievable through cross-station recovery.
To resolve the operational divide between strategic infrastructure siting and downstream flight execution, the recent literature has recognized the intrinsic coupling inherent in integrated location-routing problems (LRPs). Notable contributions, such as those from Zhang et al. [35] and Jiang et al. [36], have investigated integrated VTOL airport and UAV logistics network planning. Despite these valuable advances, existing aerial logistics formulations suffer from three coupled limitations that hinder system-wide optimality. First, most methodologies treat facility siting and route planning as a unidirectional sequential pipeline lacking tactical flight feedback, frequently causing siting decisions to misalign with localized demand variations and resulting in severe service overlap and capacity bottlenecks. Second, prevailing studies almost universally treat vertiports as homogeneous single-tier nodes, overlooking the substantial capital waste incurred when uniform facility scales are deployed across spatially heterogeneous demand landscapes. Third, conventional routing models enforce rigid closed-loop paths that mandate drones to return to their original departure stations, which induces extensive deadhead return flights and severe battery depletion under geographically skewed demand distributions.
To overcome these coupled limitations, this study develops an integrated bi-level optimization framework for vertiport siting and air-route planning in urban low-altitude logistics networks. Compared with previous works, the primary methodological additions of this study lie in establishing a closed-loop Stackelberg coordination mechanism that feeds tactical routing feedback directly into strategic siting decisions to resolve the spatial-routing decoupling inherent in sequential planning, formulating a hierarchical vertiport deployment model that dynamically aligns tiered facility capacities with regional demand density to eliminate structural infrastructure redundancy, and implementing a semi-open routing policy that permits cross-station landings and opportunistic recharging to break rigid origin-return constraints and curtail empty-haul flight wastage. Together with the customized Enhanced GA and GACO algorithms, this framework provides a scalable, robust, and cost-effective planning methodology for urban drone delivery networks.
2. Mathematical Model
The integrated vertiport location and air-route planning problem is modeled as a canonical bi-level programming hierarchy governed by a Stackelberg leader–follower game. At the strategic upper level, the central planner acts as the leader to determine the spatial siting, tiered capacity sizing of vertiports, and primary trunk transit routes from the central warehouse. At the tactical lower level, the localized distribution system acts as the follower, optimizing last-mile delivery trajectories and scheduling for lightweight UAV fleets within the regional clusters established by the leader. The follower’s realized operational cost dynamically feeds back into the upper level, ensuring coordinated global system-cost minimization rather than suboptimal sequential planning.
2.1. Problem Description
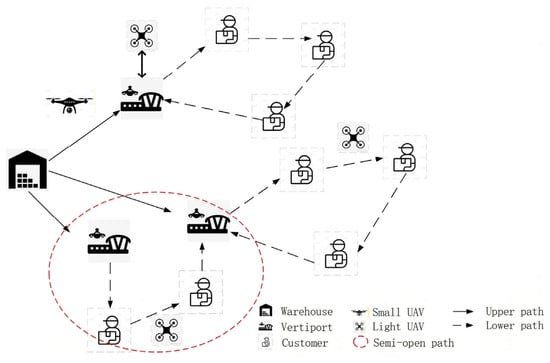
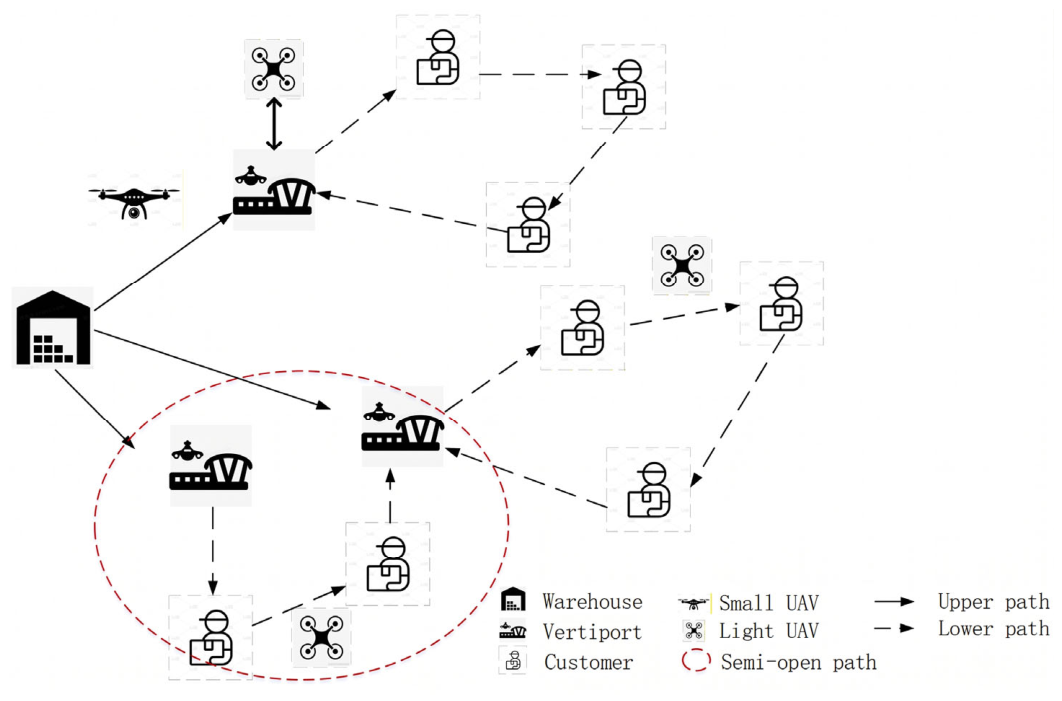
Due to the limited endurance and payload capacity of drones, it is challenging to directly employ logistics UAVs for long-distance delivery between distribution warehouse and demand points. In this study, we establish vertiports with varying capacity scales based on the number of covered demand points to facilitate parcel reception, temporary storage, and UAV recharging. The long-distance logistics transportation can be split into two parts, warehouse-to-vertiport and vertiport-to-demand point. Small drones are deployed for warehouse-to-vertiport transportation, while light drones handle the vertiport-to-demand-point delivery, as shown in Figure 1. Small UAVs can reduce the number of transport batches by carrying a higher single-load capacity. Lightweight UAVs avoid payload redundancy. Therefore, the problem solved in this paper can be formulated as follows. Given the locations and demand volumes of ground-based demand points, we aim to determine the optimal placement and hierarchical scaling of vertiports to establish an economically viable, practical, and equitable logistics drone-receiving station siting scheme. Based on the location results, a public air route network is planned to ensure safe and efficient logistics drone operations. Additionally, the experiment verifies the robustness of the logistics network based on the bi-layer model.
Figure 1.
Two-stage path scenarios.
2.2. Model Assumptions
In order to clarify the application boundary of the model and simplify the calculation logic, the following basic assumptions are set in this study:
- Regardless of the inventory problem, only a central warehouse with an assumed unlimited supply is set up;
- The drone is charged to full power at the distribution station, which is not included in the charging time, and only the charging problem of the lower path is considered;
- Assuming that the UAVs of the upper and lower paths are not serial, the UAVs in the same path scenario are exactly the same;
- Conflict or obstacle-avoidance problems arising from the process of drone delivery are not considered;
- The geographical location of a point is known, and the distance between nodes is known and remains the same;
- Ignore the impact of external factors such as obstacles and airspace conflicts on drones.
2.3. Bi-Layer Model
The integrated vertiport location and UAV air-route planning problem is formulated as a Stackelberg bi-level programming framework under unified scalar cost criteria. The upper-level leader establishes the strategic infrastructural layout and primary trunk transport routes, while the lower-level follower provides the optimal tactical last-mile flight response under the leader’s spatial configurations.
To maintain consistent mathematical rigor across the two-echelon low-altitude network, the node and fleet sets are defined as follows:
- denotes the central warehouse node;
- denotes the set of candidate vertiports;
- denotes the set of ground customer demand points;
- denotes the tiered vertiport capacity classifications;
- and denotes the fleets of small trunk UAVs and lightweight delivery UAVs, respectively;
- represents the complete node set for trunk logistics transit;
- represents the complete node set for tactical last-mile delivery operations.
Following the bi-level programming formulation for urban low-altitude logistics networks [36], the general mathematical formulation is defined as follows:
where represents the leader’s joint decision vector governing vertiport siting, tiered capacity selection, and trunk small-UAV routing, subject to facility and trunk operational constraints . represents the follower’s optimal routing response satisfying flight operational constraints . and represent the upper-level and lower-level cost functions, respectively.
2.3.1. Upper-Layer Model: Vertiport Location Model
This model determines the optimal number and locations of vertiports within a predefined candidate set, as well as the primary trunk flight routes connecting the central warehouse with active vertiports. As the leader in the Stackelberg formulation, the upper-level decision vector is , where binary variable indicates whether candidate vertiport is established as a level- facility (), and binary variables indicate whether small trunk UAV traverses route segment (0, i) or (i, r). The leader evaluates the capital construction costs and total trunk transportation costs (including flight distance costs and fixed vehicle dispatch costs). The upper-level objective function is defined as
where denotes the construction cost for the vertiport of level . and respectively represent the unit flight transport cost per kilometer and the fixed sortie dispatch cost for small trunk UAVs. and denote the flight distances from warehouse 0 to vertiport i, and between vertiports and , respectively.
To prevent resource redundancy and establish an unambiguous structural tier, each candidate vertiport can be configured with at most one capacity tier:
Note that denotes a macroscopic customer-to-vertiport assignment indicator determined by spatial proximity to aggregate regional demand for vertiport capacity sizing, whereas the microscopic flight trajectories and visit sequences are optimized in the lower-level model. Adapted from the vertiport capacity and demand allocation framework established by Zhang et al. [35], the facility capacity constraint ensures that the aggregate customer demand handled by vertiport i does not exceed its maximum processing throughput:
where refers to the maximum throughput capacity of a level-l vertiport, and means logistics demand at customer point .
The vertiport service range constraint strictly verifies that each customer is served exclusively by an active facility within its tiered operational coverage boundary. It can be formulated as
where denotes the fixed maximum service radius of a level-l vertiport, and represents the Euclidean distance between vertiport i and customer node j.
The trunk origin–destination constraint requires each small UAV to depart from and return to the central warehouse at most once, ensuring depot route continuity and fleet dispatch bounds. It could be expressed as
The range limit constraint restricts the maximum operational flight range within battery endurance thresholds, which is formulated as
where refers to the maximum flight range of a small trunk UAV.
The trunk payload constraint limits vehicle departures within the maximum permissible carrying capacity throughout transport, which is expressed as
where refers to the remaining cargo load of small UAV u departing node , is the maximum payload capacity threshold for a small UAV, and represents the parcel demand delivered to vertiport via UAV .
2.3.2. Lower-Layer Model: UAV Air-Route Planning Model
Conditioned on the vertiport locations, tiered capacities, and customer clusters established by the upper-level leader, the lower-level follower optimizes the tactical last-mile delivery trajectories of lightweight UAVs to fulfill customer demands within each service cluster. The lower-level objective minimizes the sum of flight mileage costs, light UAV fixed dispatch expenses, and time-window violation penalties. The objective function is expressed in
where is the subordinate path distribution cost, is the drone fixed input cost, and is the time window penalty cost. and denote the flight cost per kilometer and the fixed dispatch fee per sortie for light UAVs, respectively. and represent the penalty coefficients for early and late arrivals, respectively. is the arrival and service start time of light UAV at customer node . And defines the expected service time window at customer node . The lower-level constraint set enforces operational feasibility on the network topology instantiated by .
The customer visit constraint guarantees that each demand point is visited and departed by a lightweight delivery UAV exactly once, which is expressed as
where indicates that light UAV traverses arc (i, j). Coupled with the cumulative payload conservation in Equation (12), this constraint strictly ensures that each customer is served by a continuous flight sequence without subtours or split deliveries.
The semi-open route policy allows lightweight UAVs to conclude deliveries at an alternative operational vertiport, eliminating rigid closed loops and mitigating empty-haul flight wastage, which is expressed as
Building upon canonical load-flow formulations in capacitated routing models [37], the post-delivery payload constraint enforces onboard package mass tracking across successive customer stops to prevent aerial overload, which is expressed as
where indicates the remaining onboard payload mass of light UAV departing node , and represents the maximum payload capacity threshold of a lightweight UAV. is the delivery demand at customer node j, and M is a sufficiently large positive constant.
Adapted from canonical Big-M temporal propagation models in the VRPTW literature [38], the flight arrival, service, and waiting dynamics at demand nodes are formulated as
where refers to the cruising speed of the light UAV, indicates the time when the light UAV leaves node , and is the fixed service time of the light UAV.
Time-window compliance restricts serviceable demand points within temporal windows , which is expressed as
where refers to the fixed loading time of small UAVs, indicates the time when the small UAV u departs from the warehouse 0, is the flight speed of small UAVs, and indicates the customer time-window closing threshold at node j.
Building upon battery state-of-charge (SoC) depletion formulations in electric vehicle and drone routing literature [39], the flight endurance constraint ensures that remaining energy along any delivery tour never drops below the critical reserve threshold,
where indicates the remaining state of charge (SoC) of light UAV k departing node , is the maximum flight range of light UAVs, and E0 refers to the minimum secure battery threshold.
3. Algorithm Design
3.1. Vertiport Location Based on GA
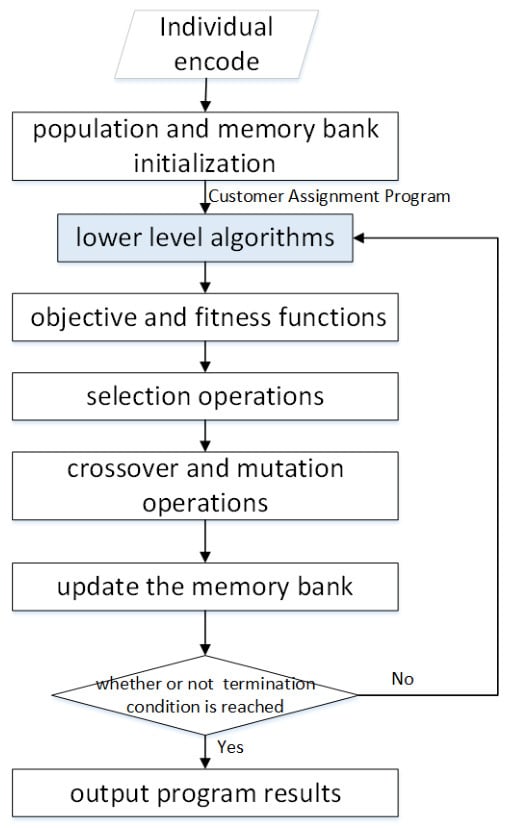
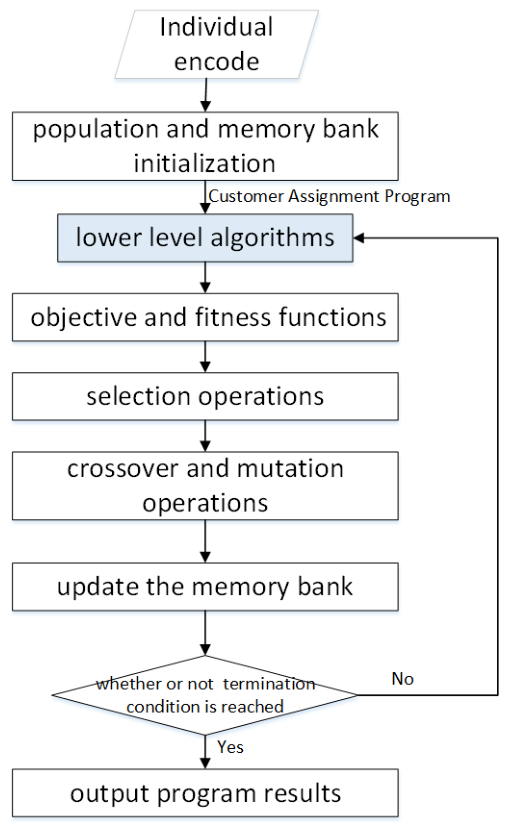
The genetic algorithm is an optimization methodology that simulates the process of biological evolution. It iteratively refines candidate solutions through selection, crossover, and mutation operations. In facility location problems, the algorithm encodes combinations of locations into chromosomes, employs cost minimization or coverage maximization as fitness criteria, and efficiently converges to near-optimal siting configurations through evolutionary iteration. Halton quasi-random sequence initialization proposed by Maaranen et al. [40] is referenced. Specifically, their work provides validation for genetic algorithms in solving upper-layer site selection models. Halton quasi-random sequence initialization is unlike conventional genetic algorithms that employ purely random initialization, potentially yielding low-quality initial populations. The paper utilizes Halton low-discrepancy sequences to generate initial solutions. This approach ensures a uniform distribution of solutions throughout the search space while enhancing initial population diversity. Halton sequences generate using coprime bases. It exhibits superior uniformity in two-dimensional spaces, making them particularly suitable for location problems. For memory bank operation, the algorithm implements an elite solution archive to preserve the optimal individual from each generation. During crossover operations, parent selection is performed from this memory bank with a probability of p-memory rather than through completely random selection. The memory bank operates on a first-in-first-out principle, with its capacity set at 10% of the population size. This mechanism prevents the loss of high-quality genetic material and accelerates convergence velocity, as shown in Figure 2.
Figure 2.
Flow chart of upper-layer algorithm for vertiport location problem.
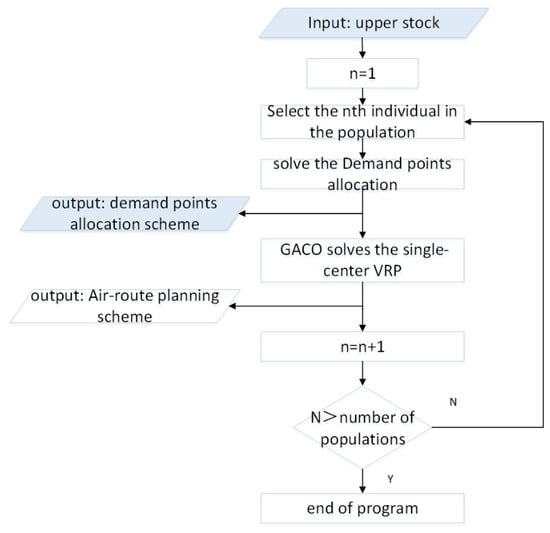
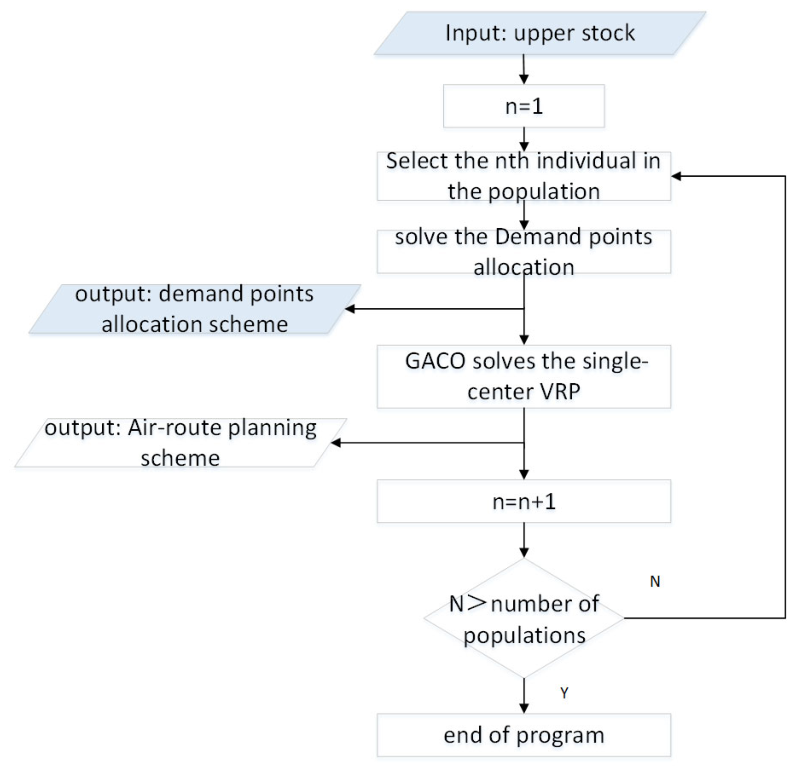
The processes of single-air-route planning can be described as follows, as shown in Figure 3.
Figure 3.
Flow chart of lower-layer algorithm for air-route planning problem.
Step 1: Each chromosome represents a vertical take-off and landing field site selection scheme, with genes valued 0–3 (0 = no selection and 1–3 = rank). The chromosome length equals the number of alternative sites.
Step 2: Use Halton’s random sequence method to select individuals from the solution space, creating initial population diversity from n alternative sites with m selection options.
Step 3: Adaptability evaluation. The upper-level planning’s objective function serves as the fitness function, with genes sorted by adaptability.
Step 4: Employ roulette wheel selection based on inverse fitness probabilities to retain better individuals.
Step 5: Crossover judgment via random number comparison. Single-point crossover at a randomly selected boundary. Feasibility check to cancel invalid crossovers.
Step 6: Mutation judgment via random number comparison, and two-point mutation by swapping values at randomly selected positions.
Step 7: Preserve each generation’s optimal solution by directly passing it to the next generation, preventing quality solution loss.
3.2. Air-Route Planning Based on GACO
For tactical last-mile air-route optimization, a Greedy-Embedded Ant Colony Optimization (GACO) algorithm is employed. Prior to ant colony exploration, a nearest-neighbor greedy heuristic constructs an initial feasible flight sequence satisfying payload, battery range, and temporal constraints, establishing high-quality initialization for the pheromone matrix. Subsequently, a dynamic pheromone evaporation mechanism adaptively balances global exploration and local exploitation based on evaluated path costs.
To enhance the search efficiency, a dynamic pheromone update mechanism is introduced. This approach incorporates a path quality evaluation function that dynamically adjusts the pheromone evaporation coefficient ρ according to the cost of each path. High-quality paths are assigned a lower ρ value to retain more pheromone, whereas lower-quality paths receive a higher ρ to expedite their elimination. The detailed steps of the proposed improved greedy-embedded ant colony algorithm are summarized in Figure 3.
Step1: Set initial values for key algorithm parameters, including crossover operation setting , .
Step2: Place m ants at different landing sites, and create a taboo table for each ant recording their starting positions.
Step3: Filter nodes meeting UAV constraints. With greedy probability, select the optimal node; otherwise, use the traditional transfer probability via a roulette. Update the taboo table and repeat until all vertices have been visited.
Step4: Determine pheromone levels on edges based on the path quality, and then retire the ant.
Step5: Repeat ant path construction and pheromone update for all m ants , and update the pheromone matrix . Check termination conditions, output optimal path or continue iterating.
3.3. Vertiport and Air-Route Planning Flow
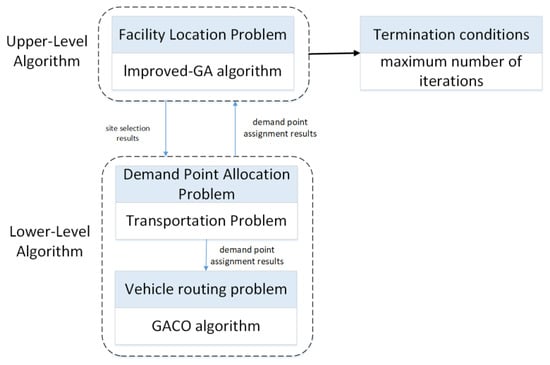
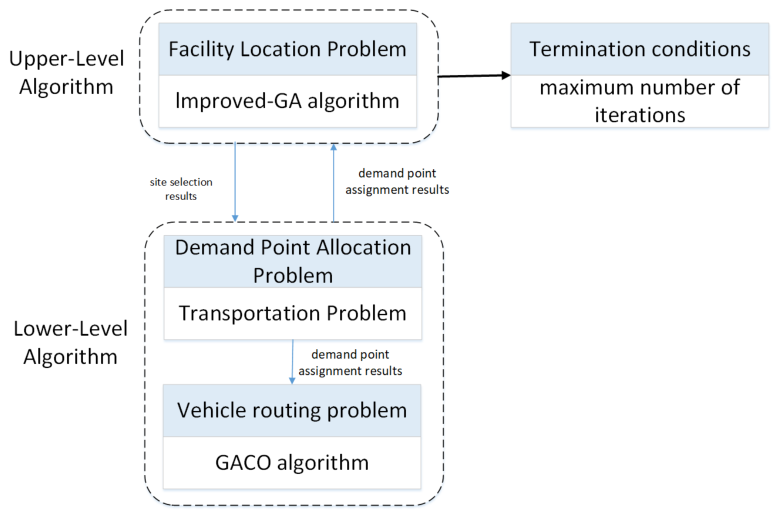
The pseudo-code and algorithm flow chart of the proposed genetic algorithm—Greedy-Embedded Ant Colony Optimization (Enhanced GA and GACO)—are shown in Algorithm 1 and Figure 4, which explicitly specify the detailed offspring reproduction operators, memory bank update rules, dynamic pheromone adjustments, and hierarchical feedback loops to guarantee full algorithmic reproducibility. The upper-level model employs the improved GA to solve the vertiport location and trunk transportation routing problem, utilizing Halton quasi-random sequences for population initialization and a Memory Bank mechanism to preserve elite solutions across generations [26,41]. The resulting vertiport configuration and trunk flight routes are then passed to the lower-level model, constituting a Multi-Depot Location-Routing Problem (MDLRP), which consists of two subproblems: demand point allocation, solved using a deterministic nearest-assignment method, and a Single-Depot Vehicle Routing Problem (SDVRP), solved using the GACO algorithm. Unlike conventional approaches that treat location and routing as independent or sequential decisions, the proposed framework establishes an explicit hierarchical Stackelberg iterative coordination mechanism in which the lower-level routing cost is fed back to the upper level to guide subsequent site selection adjustments. This closed-loop interaction, detailed below, ensures that the final solution achieves system-wide optimality rather than suboptimal sequential optimization. The GACO algorithm integrates a greedy strategy for initial path construction and leverages the pheromone mechanism of ACO to escape local optima, thereby improving both convergence speed and solution quality.
Figure 4.
Frame of integral algorithm for open location routing problem.
Notably, the proposed framework does not simply pass location results in a one-way manner. Instead, it incorporates an iterative closed-loop coordination mechanism between the leader and follower: each upper-level candidate scheme X instantiates the active vertiport network and customer clusters, while the lower-level GACO optimizes delivery trajectories and feeds the realized routing cost back to the upper level. Governed by a single scalar monetary criterion, chromosome fitness is directly evaluated from total expenditures combining vertiport construction, trunk transit, lower-level operational feedback, and penalty terms. During population evolution, the upper level updates via elitism and the Memory Bank, utilizing archived historical elite solutions to guide crossover and avoid premature convergence. The bi-level optimization terminates through hierarchical stopping criteria: the lower-level GACO terminates upon reaching its maximum iteration limit for each evaluated scheme, while the upper-level GA terminates after reaching the preset maximum generations, outputting the converged system-optimal vertiport configuration and flight routes.
| Algorithm 1 Collaborative Enhanced GA–GACO Bi-Level Optimization Framework. | |
| Input: Candidate vertiport set , customer set , warehouse 0, and algorithmic parameters. | |
| Output: Optimal configuration and last-mile delivery routes . | |
| Initialize upper population P0 via Halton sequences | 1 |
| Initialize elite Memory Bank (capacity Nmem) | 2 |
| For generation t1 = 1 to do | 3 |
| for each chromosome v in do | 4 |
| Decode v into | 5 |
| Partition into active clusters via Equations (4) and (5) | 6 |
| Initialize pheromone τij τ0, inner-best cost ∞ | 7 |
| for iteration t2 = 1 to do | 8 |
| Update dynamic evaporation rate ρ(t2) | 9 |
| for each ant k = 1 to Nant do | 10 |
| Construct route meeting constraints (10)–(15) | 11 |
| Choose next node via greedy rule (prob. q0) | 12 |
| or via roulette wheel selection (prob. 1 − q0) | 13 |
| end for | 14 |
| Update inner-best path argmink | 15 |
| Reinforce pheromones on : τij (1 − ρ)τij + Δτbest | 16 |
| end for | 17 |
| Receive optimal lower routing cost | 18 |
| Evaluate Fitnessv = 1/[] | 19 |
| end for | 20 |
| Archive top 10% elites of into | 21 |
| Retain Nelite solutions directly into (Elitism preservation) | 22 |
| while |Pt1| < Npop do | 23 |
| Select Parent 1 from or via roulette wheel | 24 |
| Select Parent 2 from via roulette wheel | 25 |
| Offspring TwoPointCrossover(Parent 1, Parent 2, Pc) | 26 |
| Offspring SingleGeneMutation(Offspring, Pm) | 27 |
| Insert Offspring to | 28 |
| end while | 29 |
| end for | 30 |
| Return Optimal decision and corresponding routing schedule . | 31 |
4. Case Validation
4.1. Case Description
To evaluate the performance of the proposed model and algorithms, numerical simulations of the vertiport location and path planning for logistics UAV were conducted in an urban district of Shanghai. The enhanced genetic algorithm (GA) was applied to optimize vertiport locations, while the Greedy-Embedded Ant Colony Optimization (GACO) algorithm was utilized for lower-level path planning.
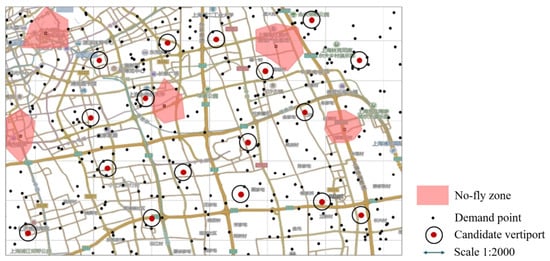
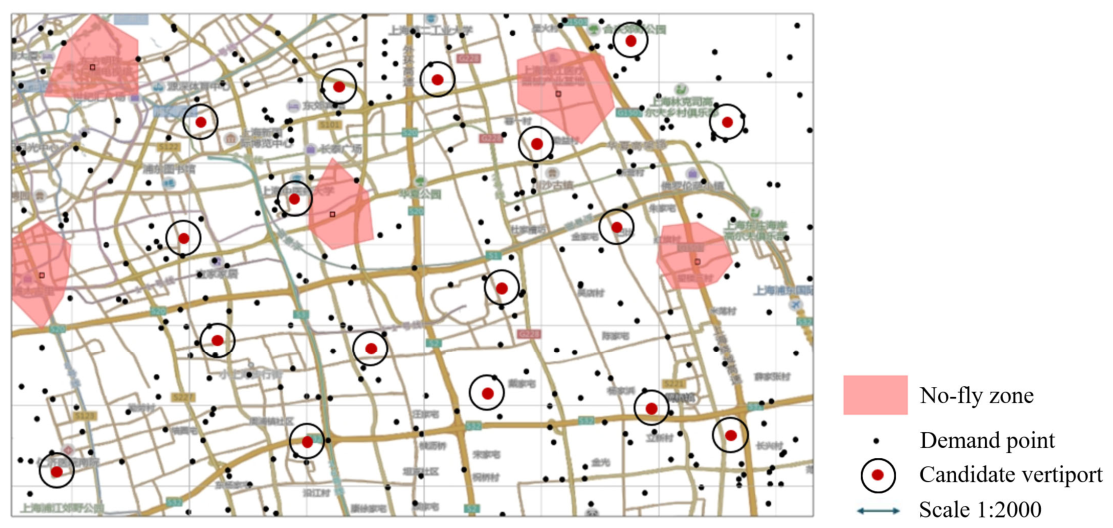
This study utilizes operational data from a logistics company in China, assuming all delivery tasks are performed by rotary-wing UAVs. The input dataset comprises geographical coordinates for 290 demand points and 17 candidate vertiports in Shanghai. As depicted in Figure 5, restricted airspace (no-fly zones) is delineated by red shaded polygons, while candidate vertiports are marked by red dots circumscribed by black circles. Demand points are indicated by black dots.
Figure 5.
Geographic distribution of the vertiports.
The parameters of small and light UAVs are adopted from [25] for simulation purposes. Table 1 and Table 2 summarize the key configurations of the three-tier vertiport system. The three-level classification scheme (Levels 1, 2, and 3), functional tiering logic, and service radius relationships are adapted from the urban logistics vertiport planning framework established by Feng [42] and Zhang [43], with numerical values tailored to the lightweight UAV-based last-mile delivery setting. This multi-tier strategy contributes to more flexible resource utilization and greater practical viability in urban operations.
Table 1.
Case parameter configuration.
Table 2.
Parameters for the classification of vertiport.
To ensure experimental reproducibility without introducing unsubstantiated hyperparameter assumptions, the computational settings for the case study are instantiated as follows based on the algorithmic formulations in Section 3.3. The termination thresholds are configured with generations for the upper-level GA and iterations for the lower-level GACO. The elite Memory Bank archives the top 10% best-performing chromosomes under the FIFO policy, and all candidate schemes are evaluated under the unified scalar metric (CNY). All structural genetic operators and ant state transitions are executed in strict accordance with Algorithm 1.
4.2. Numerical Validation
4.2.1. Sensitivity Analysis of the Algorithm Parameters
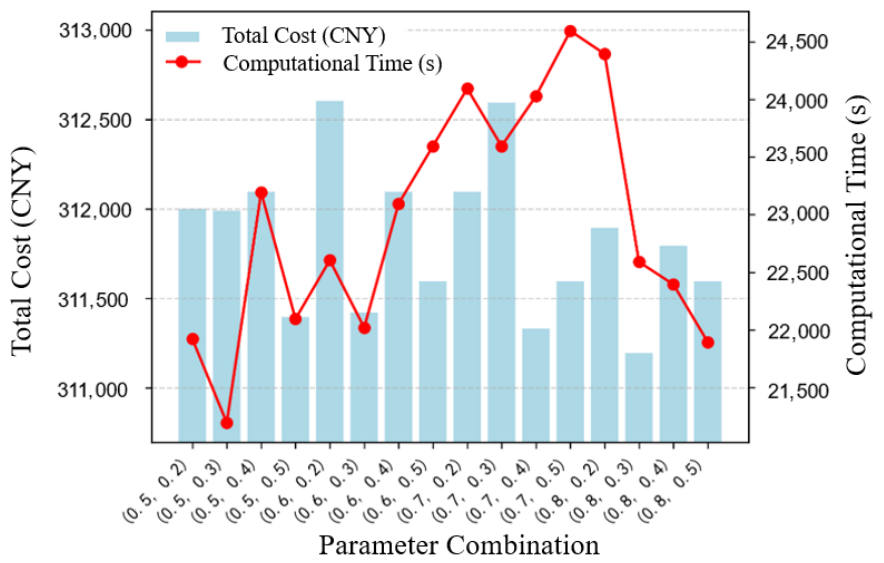
The bi-level algorithm designed for the path planning problem consists of an enhanced genetic algorithm (GA) for solving the upper-level siting model and Greedy-Embedded Ant Colony Optimization (GACO) for solving the lower-level model. The genetic algorithm employed in the upper layer constitutes a critical component of the overall bi-level optimization framework, and its parameter configuration significantly influences the computational efficiency and solution quality. Key parameters evaluated include the crossover probability and mutation probability. In this study, the crossover probability was tested across a set of values (0.5, 0.6, 0.7, 0.8), and the mutation probability was similarly varied among values (0.2, 0.3, 0.4, 0.5). The algorithm was executed under all 16 parameter combinations to systematically assess their impact on solution quality and total cost.
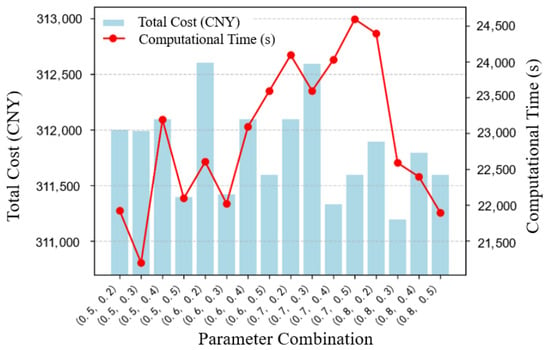
Figure 6 illustrates the comparative performance of the algorithm. The bar chart depicts the optimal objective function values under different parameter combinations, while the line chart indicates the computational time required to reach the optimum. Since minimizing total cost is the primary objective, the optimal objective value was prioritized as the key selection criterion. Accordingly, the combination of (0.8, 0.3) was selected, where the crossover probability and mutation probability were set to 0.8 and 0.3, respectively. The maximum number of iterations was set to 100 for all experiments.
Figure 6.
Comparison of parameters combinations.
4.2.2. Comparative Analysis with Benchmark Model
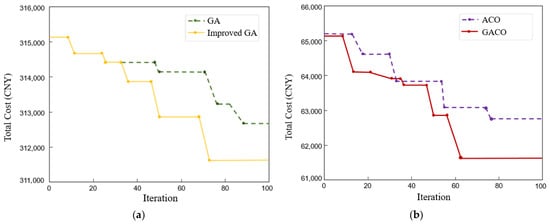
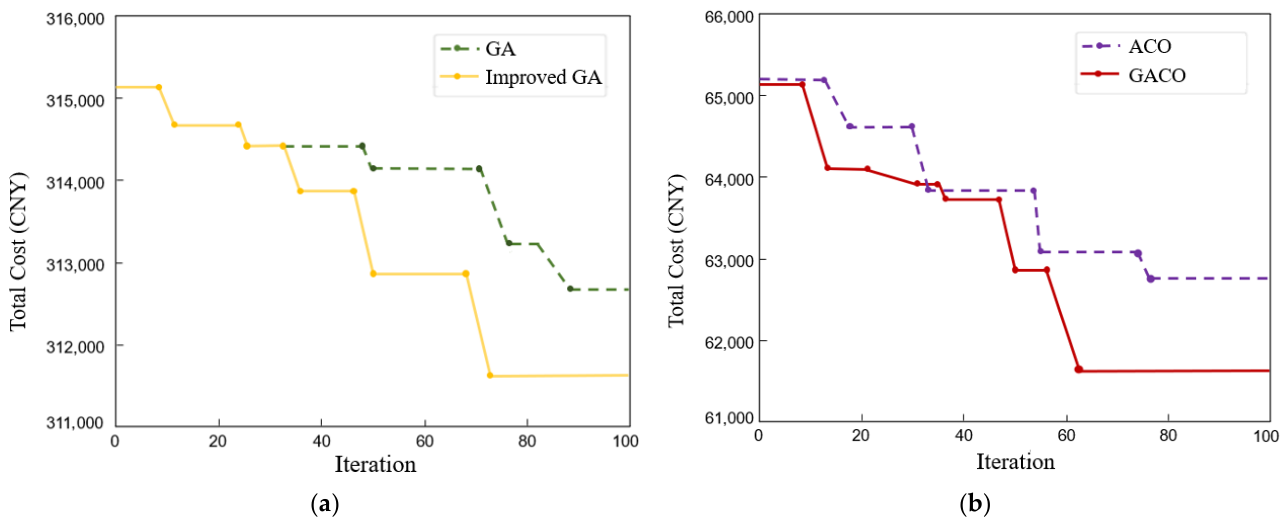
As shown in Figure 7, the objective function values for both the upper- and lower-layer models decrease significantly from their initial states as iterations progress, demonstrating an effective global search capability. In Figure 7a, the upper-layer Improved GA achieves a faster convergence rate and superior final solution quality compared to the GA. Specifically, the Improved GA undergoes major cost reductions around the 48th and 72nd iterations, achieving full convergence by the 73rd generation. In contrast, the traditional GA stabilizes much later (around the 89th iteration) at a higher cost level. Similarly, in Figure 7b, the lower-layer GACO algorithm demonstrates a superior optimization performance over the standard ACO. A pronounced drop in route cost occurs between the 47th and 63rd iterations, with the GACO model reaching final convergence around the 63rd generation. The strong synchronization in descent dynamics between the upper and lower layers confirms that improved vertiport siting at the upper level effectively opens up better opportunities for lower-level air-route optimization, ultimately yielding an optimal global solution.
Figure 7.
Comparison chart of iterative optimization of algorithms. (a) Comparison curves of upper-layer model algorithm. (b) Comparison curves of lower-layer model algorithm.
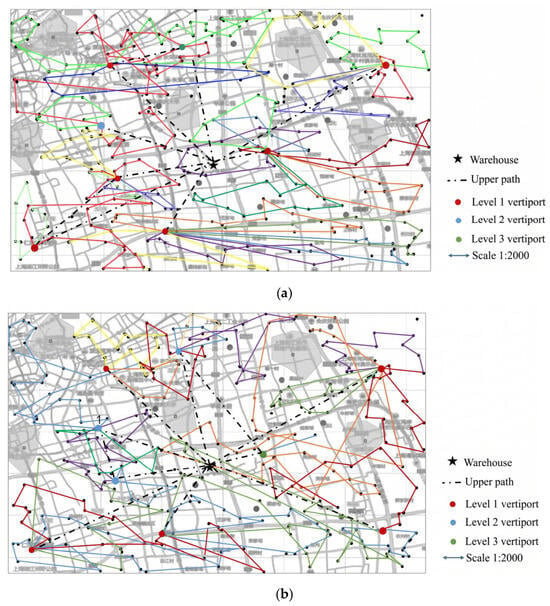
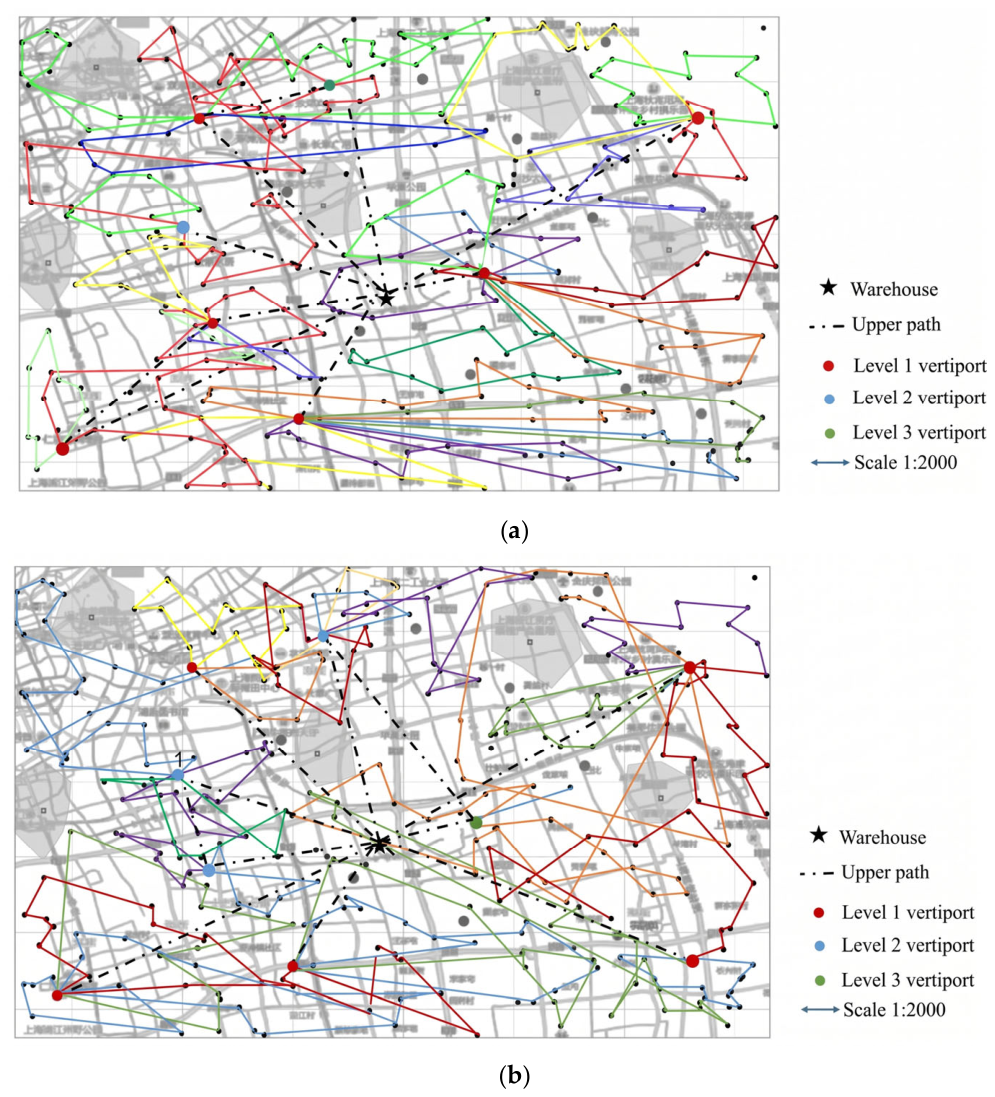
The results of the bi-layer optimization are summarized in Figure 8a, and Table 3. In the figure, colored lines represent lower-level paths connecting vertiports and demand points to indicate specific delivery relationships, while black dashed lines denote the routes of upper-level small UAVs traveling from warehouses to vertiports. The solution selected eight vertiports in total, including six Level-1 vertiports, one Level-2 vertiport and one Level-3 vertiport. The corresponding air route scheme consists of two components, warehouse-to-vertiport and vertiport-to-demand point routes. In contrast to conventional point-to-point delivery models [35,36], this study introduces a cooperative multi-task scheduling model in which drones return to vertiports after completing sequential delivery tasks, not necessarily their origin. As shown in Table 3, small drones operate during business hours, with their flight durations and usage frequencies determined by both the light drone scheduling results and the upper-layer routing time requirements. The departure time of the first small drone is derived by backtracking from the earliest service start time among lower-layer customer assignments.
Figure 8.
Comparison of vertiport layouts and two-tier distribution networks: (a) proposed bi-layer optimization model using Enhanced GA and GACO; (b) traditional two-stage sequential strategy with location selection followed by routing.
Table 3.
Validation of Enhanced GA and GACO for Bi-layer Model.
Furthermore, it is worth noting that the spatial configuration of vertiports across hierarchical levels is highly aligned with the demand points. Specifically, the level-1 vertiports (depicted as red dots) feature the densest downstream routes, each supporting four sub-routes that collectively serve 10–20 demand points per route. These vertiports account for over 70% of the total logistics demand in the urban area, corresponding closely to the high-density demand characteristic of the commercial districts. With regard to the level-2 vertiports (blue dots), they display a moderate route density, with two sub-routes per site, and handle 14.18% of the urban logistics demand, functioning as intermediate hubs that connect the core with peripheral zones. In contrast, the level-3 vertiports (green dots) exhibit the sparsest route coverage, serving only a limited number of marginal demand points and accommodating 6.41% of the total demand, which is consistent with the lower population density and commercial activity.
Because commercial exact branch-and-cut solvers (such as Gurobi or CPLEX) suffer from combinatorial explosion and memory exhaustion on the 290-node network due to discrete routing variables () that preclude standard KKT or duality reformulations, exact global optimums are computationally inaccessible. Therefore, to rigorously evaluate the structural advantage of the proposed bi-level coordination, a two-stage sequential strategy of site selection followed by path planning is designed as a baseline under the identical scenario setup shown in Figure 8b. In this benchmark approach, the location, number, and tiers of vertiports are determined initially, after which UAV route optimization is conducted to calculate the total system cost. As shown in Figure 10, the sequential strategy establishes nine vertiports, including five level-1, three level-2, and one level-3 facility. The corresponding light drone routes for the proposed and sequential strategies are detailed in Table 3 and Table 4, respectively. The proposed bi-layer framework outperforms the two-stage optimization strategy in overall flight efficiency and total distribution cost. Governed by the mandatory customer visit constraint, both the proposed framework and the sequential baseline strictly achieve all ground customer points within the feasible airspace. However, the collaborative bi-layer approach completes this total coverage with a shorter coverage distance, thereby substantially reducing distribution costs.
Table 4.
Validation of GA and ACO for traditional two-stage sequential strategy.
Specifically, the bi-level collaborative optimization approach achieves systematic cost reductions across both decision tiers. In the upper tier, eliminating the underutilized Vertiport No. 9 and optimizing facility capacities yield significant infrastructural and trunk flight savings. In the lower tier, exploiting semi-open routing allows drones to return directly to alternative stations, increasing cross-vertiport return trips from 5% to 30% and cutting empty-haul distances. These joint spatial and routing efficiencies collectively achieve a mathematically verified overall system cost reduction of 8.75%.
Figure 9 compares the local networks generated by the proposed bi-layer scheme and the traditional sequential site-selection-then-routing strategy. Figure 9a illustrates the flight path associated with Vertiport No. 4 under the bi-layer model, whereas Figure 9b depicts service arrangements of demand points for the corresponding region under the sequential strategy. As shown in Figure 9a, a single vertiport (No. 4) is sufficient to cover the entire demand cluster, as it is precisely positioned at the geometric center of the demand distribution. All demand points, including C69, C41 and C38, lie within a 0.8 km service radius. It should be mentioned that a light drone dispatched from this vertiport (indicated by the blue line) travels approximately 3.2 km in total, serving an average of eight demand points per sortie. The resulting route layout is highly compact with no evident backtracking. Furthermore, only one upper-level transport route is required to connect the central warehouse to the vertiport, significantly reducing scheduling complexity and flight costs.
In contrast, Figure 9b reveals that two vertiports (No. 4 and No. 9) are required under the sequential strategy. The additional vertiport increases upper-level routes from one to two, adding about 12.2 km in flight distance and raising upper-level logistics costs by 15%. Moreover, Vertiport No. 9 is located on the periphery of demand points, with straight-line distances from demand points such as C195 and C250 exceeding 1.5 km. The total length of lower-level delivery routes (red and blue lines) reaches 5.7 km, with each route covering merely five demand points on average. This fragmentation reduces delivery efficiency by approximately 37.5%. In addition, demand points such as C58 and C66 lie in the overlapping service areas of the two vertiports. Such redundant coverage further increases the average delivery distance per demand point by roughly 0.6 km.
This comparative analysis confirms that the sequential site-selection-then-routing strategy yields a distribution network with intrinsically dispersed routes, whereas the bi-layer programming produces a logistics network with concentrated vertiport coverage and highly efficient routes. Consequently, the proposed location-routing bi-layer optimization scheme demonstrates a superior performance in improving the economic efficiency of the UAV delivery network.
Figure 9.
Comparison between the bi-layer optimization and traditional strategy. (a) Local routing diagram of bi-layer model; (b) local routing diagram of independent location-routing strategy.
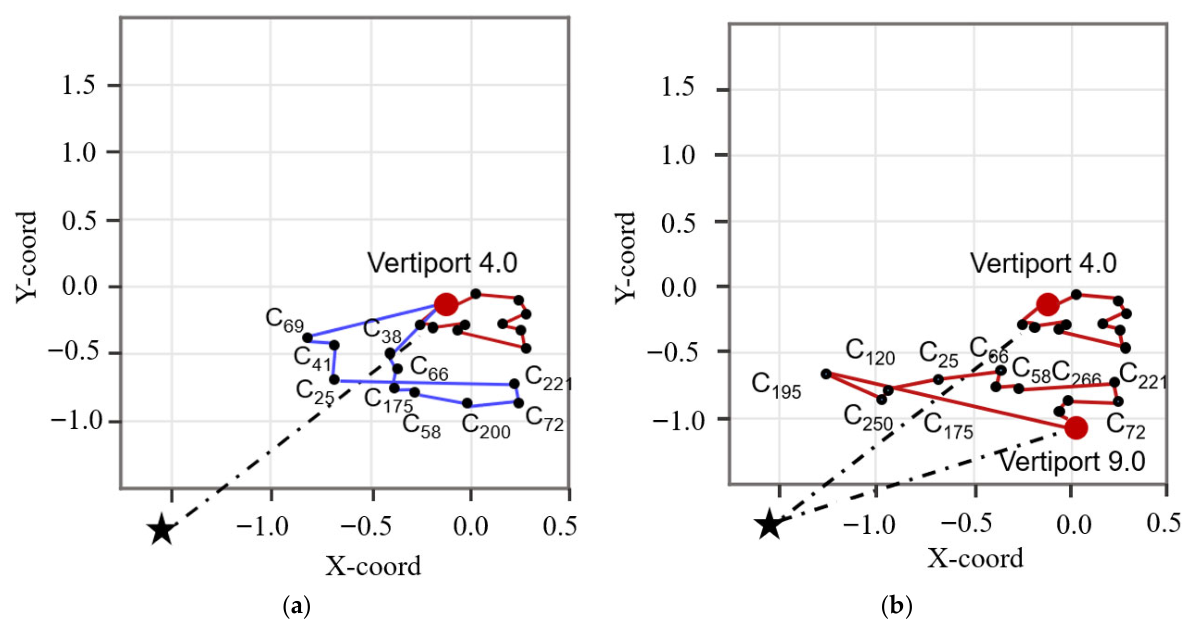
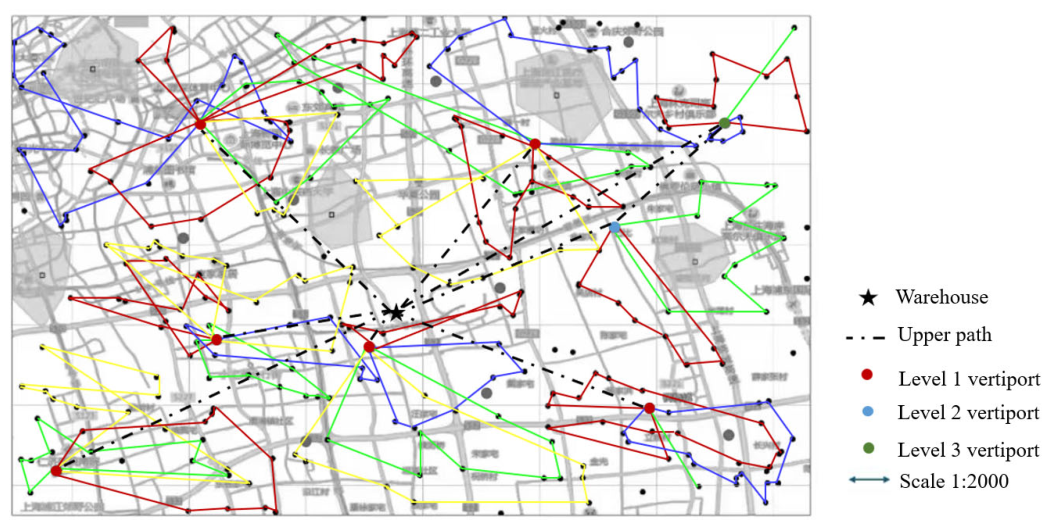
Figure 10.
Layout of vertiports and two-tier distribution network generated by the classical bi-layer GA.
4.2.3. Comparison with Classical Bi-Layer Algorithm
To further evaluate the performance of the proposed bi-layer framework, a comparative experiment was conducted against a classical bi-layer genetic algorithm (Bi-layer GA) model widely adopted in the previous literature [36]. Unlike the proposed Enhanced GA and GACO framework, the classical model employs standard genetic algorithms for both decision layers without incorporating Halton sequence quasi-random initialization, memory bank mechanisms, or greedy-embedded ant colony search strategies. Experimental results indicate that the proposed methodology achieves an average total system cost reduction of 8.5% compared to the classical bi-layer model, with total costs of 311,194.56 CNY for the proposed framework versus 340,182.34 CNY for the classical bi-layer GA. This cost efficiency is primarily attributed to superior spatial alignment in vertiport placement. Under the classical algorithm, Level-1 vertiports exhibit a scattered distribution with insufficient anchoring in high-density demand zones, leading to an 18.0% service area overlap among lower-tier facilities. Conversely, the proposed framework accurately anchors primary vertiports within core demand clusters while strategically positioning secondary and tertiary facilities across peripheral areas, successfully reducing the service area overlap to 7.3%.
In addition to facility layout optimization, the proposed framework demonstrates substantial improvements in lower-tier routing efficiency and airspace safety mitigation. Under the classical bi-layer GA, Level-3 vertiports connect to only one or two delivery paths, with an average coverage of 5.1 demand points per route, causing capacity utilization to drop below 40.0%. In contrast, the proposed GACO algorithm reorganizes delivery paths into compact, high-density loops that serve an average of 11.2 demand points per route, thereby suppressing the lower-path crossing rate to 8.0% and reducing the detour flight ratio to 6.0%. Consequently, this comparative analysis confirms that the integrated bi-layer framework achieves superior demand coverage, route compactness, and operational economy over conventional bi-layer optimization algorithms.
Taken together, these comparative evaluations systematically decouple the distinct structural, algorithmic, and operational mechanisms governing the 8.75% total system cost reduction. At the structural level, the bi-level architecture per se resolves the spatial-routing decoupling penalty inherent in sequential planning by embedding follower feedback directly into leader siting decisions, thereby eliminating myopic vertiport placement and securing foundational capital savings (e.g., through coordinated facility capacity sizing and trunk transport consolidation). At the algorithmic level, given the severe non-convexity of nested bi-level optimization, the customized heuristic operators (Halton sequence initialization, elite FIFO Memory Bank, and dynamic GACO evaporation) serve as the essential computational driver that overcomes premature stagnation, unlocking an 8.50% cost reduction over the classical bi-layer GA baseline and suppressing facility overlap to 7.3%. Meanwhile, the semi-open routing policy effectively curbs empty-haul deadhead flights across tactical delivery tours, while the complementary cost benefits of tiered vertiport sizing are further dissected in the subsequent sensitivity analysis. This synthesis confirms that the closed-loop architecture establishes the vital structural prerequisite for coordinated network planning, which is systematically realized and compounded by the proposed search operators and operational policies.
5. Results and Discussion
5.1. Sensitivity Analysis of the Vertiport Grade
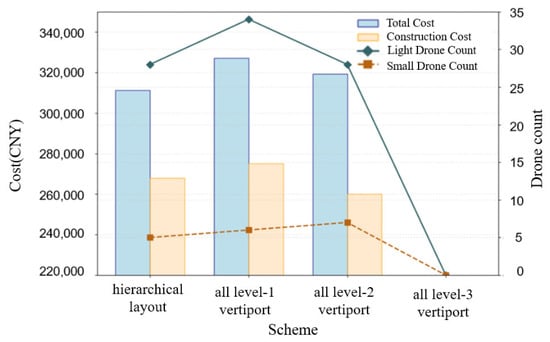
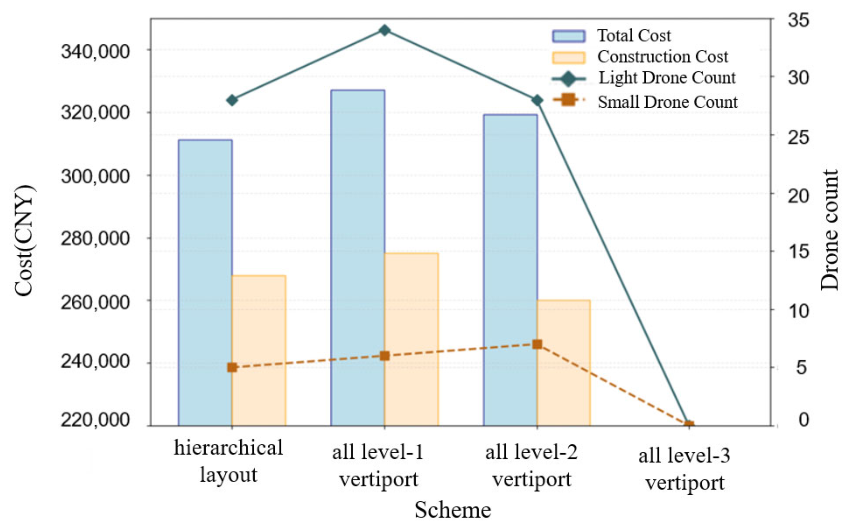
Building upon the framework of Zhang et al. [35], this study incorporates a hierarchical vertiport configuration governed by Tiered Capacity Constraints (TCCs), as formulated in Equation (4). Systematic experiments were conducted to evaluate the performance trade-offs in cost efficiency and resource allocation across different tiering strategies. As illustrated in Figure 11, a configuration consisting solely of Level-3 vertiports fails to satisfy total customer demand due to strict facility capacity limits and battery endurance constraints. In contrast, the proposed tiered strategy achieves total system cost reductions of 4.49% and 2.52% compared to the all-Level-1 (325,824.00 CNY) and all-Level-2 (319,250.00 CNY) configurations, respectively. Quantitatively, matching facility tiers dynamically with regional demand density achieves an optimal total expenditure of 311,194.56 CNY, eliminating capacity redundancy while maintaining operational resilience under spatial demand variations.
Figure 11.
Diagram of the effects of hierarchical and same-level vertiport.
This cost reduction stems from the varying matching efficiency among facility capacity, service radius, and UAV performance, which directly governs fleet sizing. Hierarchical vertiport deployment enables precise alignment between facility tiers and heterogeneous UAV fleets, thereby yielding a balanced and non-redundant fleet composition. In the all-Level-1 scenario where facility coverage is dense, the required number of small UAVs decreases while that of lightweight UAVs increases compared to the all-Level-2 scheme. Under the all-Level-2 scenario, the required quantities for both UAV types exceed those of the proposed tiered scheme. Consequently, dynamically matching facility tiers with regional demand density effectively optimizes both capital construction and daily operational expenses, preventing resource redundancy while maintaining network resilience under demand variations.
5.2. Sensitivity Analysis of the Demand Point Scale
To evaluate the adaptability and scalability of the proposed bi-layer framework across varying problem sizes, three demand scenarios, namely small (90 points), medium (190 points), and large (290 points), were constructed based on the baseline case study. Each scenario was independently executed 30 times, and the averaged key operational metrics are summarized in Table 5. As presented in Table 5, the bi-layer optimization model consistently outperforms the conventional two-stage sequential strategy across all demand scales. Although the percentage of cost reduction slightly decreases from 17.21% to 8.75% as network density and spatial uniformity expand, the proposed integrated approach maintains a substantial and stable cost-saving advantage over the sequential baseline.
Table 5.
Comparison of results between two optimization algorithms.
This scale-dependent performance can be attributed to the differing sensitivity of route planning to vertiport location decisions. In small-scale scenarios, the spatial placement of a single vertiport exerts a profound global impact on customer allocation and route structure, enabling the joint GA-GACO framework to achieve significant path shortening through coordinated site-route adjustments. In contrast, large-scale networks exhibit a higher demand density and spatial uniformity, where relocating a single facility predominantly influences localized sub-routes rather than the global network topology. Consequently, while the marginal sensitivity of route planning to site selection slightly weakens at larger scales, the proposed bi-layer framework consistently yields superior system-wide cost savings and fleet utilization.
5.3. Robustness Test on Demand Data Noise
Considering that actual logistics demand fluctuations typically follow a normal distribution with random variations concentrated near the mean [44], the present study evaluates the robustness of the proposed bi-layer drone logistics network under stochastic demand . Multiple perturbed datasets were generated by introducing Gaussian noise at varying levels () to the historical mean demand μ. Monte Carlo simulations consisting of 30 independent runs per noise level were conducted to evaluate the adaptability of the predetermined vertiport layout. Statistical results confirm that the layout derived from the bi-layer model effectively accommodates stochastic demand variations, demonstrating strong network stability.
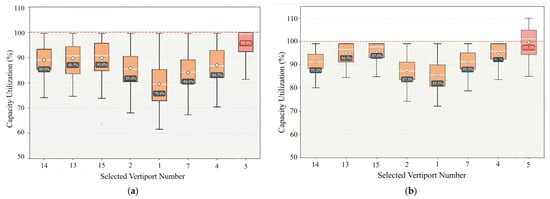
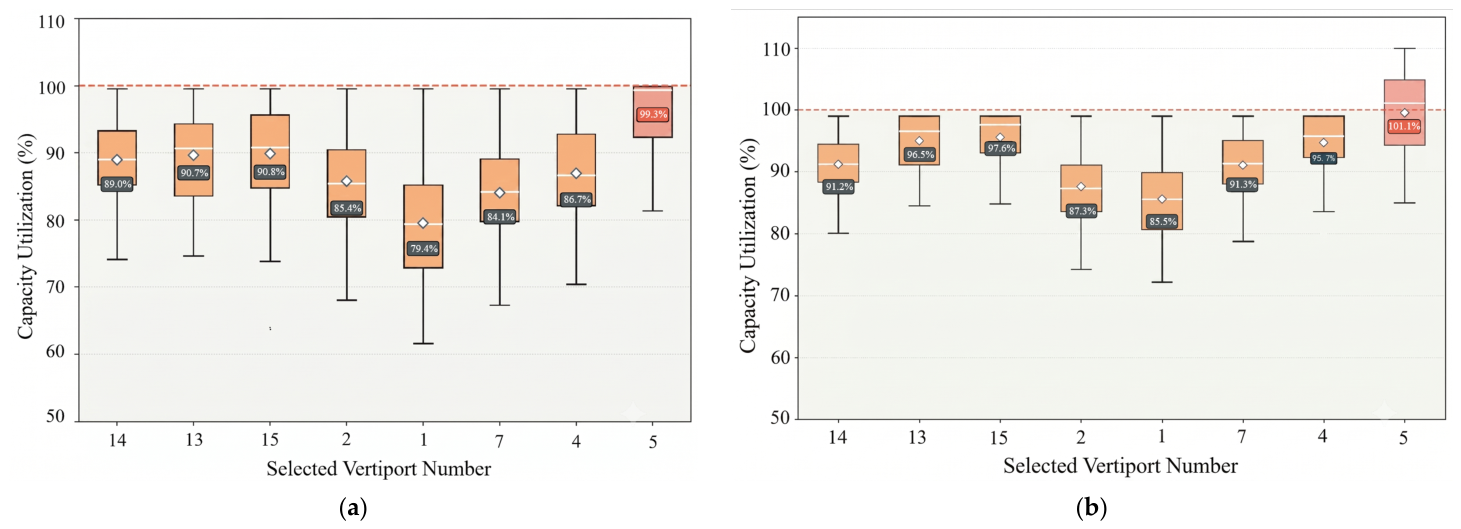
Based on the baseline scenario results shown in Figure 8a, stochastic Gaussian noise was added to each demand point to observe individual vertiport reliability. Figure 12 presents the capacity utilization across selected vertiports under demand fluctuations. When the demand fluctuation coefficient , the bi-layer network system remains structurally stable by leveraging facility capacity and route planning flexibility, maintaining an overload probability below 5%. This result clearly demonstrates that the designed delivery network possesses good robustness within the scope of routine operations. That is, it can effectively respond to normal demand disturbances without incurring additional investment, thereby ensuring service stability [45]. However, when σ increases to , capacity breakthrough occurs at Vertiport No. 5, indicating a single point of failure risk under extreme fluctuations. Although the overall network design incorporates redundancy, some critical nodes may still become the bottleneck of the system due to excessive concentration of demand. To mitigate this risk, reserving a 10% dynamic capacity buffer or establishing temporary transshipment mechanisms [46] is recommended for high-risk nodes during extreme events.
Figure 12.
Robustness testing of bi-layer logistics networks. (a) Landing field utilization at δ = 0.1μ fluctuation level. (b) Landing field utilization at fluctuation level.
The network’s resilience against demand disturbances is driven by three interacting architectural factors. First, bi-level coordination provides operational routing elasticity, where the lower-level GACO planner dynamically resequences customer stops to absorb localized variations before they impact facility limits. Second, hierarchical vertiport deployment offers structural capacity cushioning by matching facility scale with regional demand density, naturally maintaining operational margins across stations against routine surges. Third, the semi-open routing policy enables spatial load sharing by allowing UAVs to land at neighboring vertiports, effectively mitigating localized fleet and payload congestion. However, this robustness is bounded rather than absolute. Under severe tail-risk fluctuations, core hubs inevitably face capacity saturation, demonstrating that physical topological design must be coupled with operational transshipment or reserve capacity buffers to withstand extreme conditions.
6. Conclusions
This study presented a bi-level optimization framework integrating optimization of logistics drone vertiport location and air-route planning in urban networks. The upper-level model, solved by an enhanced genetic algorithm, determines optimal vertiport siting and tiered capacity sizing, while the lower-level model, solved by a Greedy-Embedded Ant Colony Optimization (GACO) algorithm, designs tactical last-mile delivery routes. Based on extensive simulation experiments using empirical logistics data from Shanghai, the main findings are summarized as follows:
- (1)
- Compared with the traditional sequential location-then-routing strategy, the proposed bi-layer optimization model achieves an 8.75% reduction in total system cost, enabled by the joint coordination of vertiport deployment, trunk logistics, and tactical last-mile routing. Concurrently, the semi-open routing policy increases cross-vertiport return flights from 5% to 30%, substantially curtailing the empty-haul flight distance and improving fleet operational efficiency.
- (2)
- Compared to the classical bi-layer GA benchmark, the proposed Enhanced GA and GACO framework delivers an average 8.50% reduction in total system cost. Furthermore, by precisely anchoring primary vertiports within core demand clusters, facility service overlap is dramatically suppressed from 18.0% to 7.3%, accompanied by a drop in the detour flight ratio to 6.0%.
- (3)
- The hierarchical vertiport configuration strategy yields cost savings of 4.49% and 2.52% compared to uniform all-Level-1 and all-Level-2 schemes, respectively, by dynamically matching facility throughput with regional demand density. Across expanding network scales ranging from 90 to 290 demand nodes, the proposed framework consistently maintains an 8.75% to 17.21% cost-saving advantage over sequential planning, confirming robust network scalability.
- (4)
- The proposed network demonstrates strong robustness against demand fluctuations, maintaining structural stability with an overcapacity probability below 5% for fluctuations of up to 10%. To counter single-point failure risks during even more extreme events, a capacity buffer of equal magnitude is a recommended safeguard.
Future work will extend the current framework in several directions, including coupling this strategic off-line planning model with an on-line rolling-horizon reactive dispatching module for real-time trajectory adjustments under dynamic disruptions, conducting systematic benchmarking against other metaheuristics such as PSO, SSO, WOA, and BA to evaluate algorithmic efficiency, extending the current two-dimensional spatial model into dynamic three-dimensional airspace incorporating wind perturbations and obstacle avoidance, and investigating adaptive planning strategies for time-varying demand patterns in real-world logistics scenarios.
Author Contributions
Conceptualization, L.W.; methodology, S.C., J.Z. and P.Z.; software, Z.S. and P.Z.; writing—original draft preparation, L.W. and S.C.; writing—review and editing, J.Z. All authors have read and agreed to the published version of the manuscript.
Funding
This research is financially supported by the Major Science and Technology Special Project of Yunnan Province (Grant No. 202602AD080014), the Sichuan Science and Technology Program (2026YFHZ0195), and the Civil Aviation Flight University of China, a Program of Sichuan Flight Engineering Technology Research Center (No. GY2025-05B). This research is partially funded by the Basic Research Program of Jiangsu (BK20251405), the Fundamental Research Funds for the Central Universities (No. NJ2025046), and the Jiangsu Funding Program for Excellent Postdoctoral Talent.
Data Availability Statement
The original contributions presented in this study are included in the article. Further inquiries can be directed to the corresponding author.
Conflicts of Interest
Author Suyin Cui was employed by the company Hoymiles Power Electronics Inc. The remaining authors declare that the research was conducted in the absence of any commercial or financial relationships that could be construed as a potential conflict of interest.
Abbreviations
The following abbreviations are sequentially used in this paper:
| UAV | Unmanned Aerial Vehicle |
| VTOL | Vertical Take-Off and Landing |
| 2D | Two-Dimensional |
| 3D | Three-Dimensional |
| HLO | Human Learning Optimization |
| EENFC-MRP | Energy-Efficient Neuro-Fuzzy Clustering-based Topology Construction and Metaheuristic Route Planning |
| IUASC | International Unmanned Aircraft Systems Consortium |
| SDVRP | Single-Depot Vehicle Routing Problem |
| GACO | Greedy-Ant Colony Optimization |
| LRP | Location-Routing Problem |
| GA | Genetic Algorithm |
| GACO | Greedy-Embedded Ant Colony Optimization |
| CNY | Chinese Yuan |
| TCCs | Tiered Capacity Constraints |
References
- Silvagni, M.; Tonoli, A.; Zenerino, E.; Chiaberge, M. Multipurpose UAV for search and rescue operations in mountain avalanche events. Geomat. Nat. Hazards Risk 2016, 8, 18–33. [Google Scholar] [CrossRef] [Scilit]
- Kim, S.J.; Lim, G.J.; Cho, J.; Côté, M.J. Drone-aided healthcare services for patients with chronic diseases in rural areas. J. Intell. Robot. Syst. 2017, 88, 163–180. [Google Scholar] [CrossRef] [Scilit]
- Tsou, J.Y. Advancing social equity in urban UAV logistics: Insights from the academic literature and social media. Drones 2024, 8, 128. [Google Scholar] [CrossRef] [Scilit]
- Li, S.; Zhang, H.; Li, Z.; Liu, H. An air route network planning model of logistics UAV terminal distribution in urban low altitude airspace. Sustainability 2021, 13, 13079. [Google Scholar] [CrossRef] [Scilit]
- Amazon.com Inc. Amazon Prime Air. Available online: http://www.amazon.com/b?node=8037720011 (accessed on 12 June 2021).
- Zhao, J.; Xie, F. Cognitive and artificial intelligence system for logistics industry. Int. J. Innov. Comput. Appl. 2020, 11, 84–88. [Google Scholar] [CrossRef] [Scilit]
- Wen, X.; Wu, G. Heterogeneous multi-drone routing problem for parcel delivery. Transp. Res. Part C Emerg. Technol. 2022, 141, 103763. [Google Scholar] [CrossRef] [Scilit]
- Brühl, R.; Lindner, M.; Fricke, H. Locating Air Taxi Infrastructure in Regional Areas—The Saxony Use Case; Deutsche Gesellschaft für Luft-und Raumfahrt-Lilienthal-Oberth eV: Bonn, Germany, 2023. [Google Scholar]
- Shavarani, S.M.; Nejad, M.G.; Rismanchian, F.; Izbirak, G. Application of hierarchical facility location problem for optimization of a drone delivery system: A case study of Amazon Prime Air in the city of San Francisco. Int. J. Adv. Manuf. Technol. 2018, 95, 3141–3153. [Google Scholar] [CrossRef] [Scilit]
- Cao, J.J.; Huang, F. An improved genetic algorithm with density-guiding operator based on the location selection model of emergency logistics center. J. Phys. Conf. Ser. 2023, 2665, 012015. [Google Scholar] [CrossRef] [Scilit]
- Brunelli, M.; Ditta, C.C.; Postorino, M.N. New infrastructures for Urban Air Mobility systems: A systematic review on vertiport location and capacity. J. Air Transp. Manag. 2023, 112, 102460. [Google Scholar] [CrossRef] [Scilit]
- Zhao, J.; Yu, L.; Xie, B. An ellipse-based locating method for flexible deployment of emergency UAVs. Socio-Econ. Plan. Sci. 2024, 96, 102049. [Google Scholar] [CrossRef] [Scilit]
- Hu, L.; Liu, H.; Ying, C. Construction of hub location model based on genetic algorithm. Transp. Res. Rec. 2025, 2679, 403–420. [Google Scholar] [CrossRef] [Scilit]
- Bulusu, V.; Onat, E.B.; Sengupta, R.; Yedavalli, P.; Macfarlane, J. A traffic demand analysis method for urban air mobility. IEEE Trans. Intell. Transp. Syst. 2021, 22, 6039–6047. [Google Scholar] [CrossRef] [Scilit]
- Pinto, R.; Lagorio, A. Point-to-point drone-based delivery network design with intermediate charging stations. Transp. Res. Part C Emerg. Technol. 2022, 135, 103506. [Google Scholar] [CrossRef] [Scilit]
- Daskilewicz, M.; German, B.; Warren, M.; Garrow, L.A.; Boddupalli, S.-S.; Douthat, T.H. Progress in vertiport placement and estimating aircraft range requirements for eVTOL daily commuting. In 2018 Aviation Technology, Integration, and Operations Conference; American Institute of Aeronautics and Astronautics, Inc.: Reston, VA, USA, 2018; p. 2884. [Google Scholar]
- Jeong, H.Y.; Song, B.D.; Lee, S. Truck-drone hybrid delivery routing: Payload-energy dependency and no-fly zones. Int. J. Prod. Econ. 2019, 214, 220–233. [Google Scholar] [CrossRef] [Scilit]
- Deutsch, Y.; Golany, B. A parcel locker network as a solution to the logistics last mile problem. Int. J. Prod. Res. 2018, 56, 251–261. [Google Scholar] [CrossRef] [Scilit]
- Melo, M.T.; Nickel, S.; Saldanha-da-Gama, F. Facility location and supply chain management—A review. Eur. J. Oper. Res. 2009, 196, 401–412. [Google Scholar] [CrossRef] [Scilit]
- Morganti, E.; Seidel, S.; Blanquart, C.; Dablanc, L.; Lenz, B. The Impact of E-commerce on Final Deliveries: Alternative Parcel Delivery Services in France and Germany. Transp. Res. Procedia 2014, 4, 178–190. [Google Scholar] [CrossRef] [Scilit]
- Damilano, L.; Guglieri, G.; Quagliotti, F.; Sale, I.; Lunghi, A. Ground Control Station Eembedded Mission Planning for UAS. J. Intell. Robot. Syst. 2013, 69, 241–256. [Google Scholar] [CrossRef] [Scilit]
- Yang, K.; Keat, G.S.; Sukkarieh, S. A Gaussian Process-based RRT Planner for the Exploration of an Unknown and Cluttered Environment with a UAV. Adv. Robot. 2013, 27, 431–443. [Google Scholar] [CrossRef] [Scilit]
- Jason, K.; Timonthy, W.; Michael, A. Learning Real—Time A* Path Planner for Unmanned Air Vehicle Target Sensing. J. Area Comput. 2006, 3, 108–122. [Google Scholar] [CrossRef] [Scilit]
- Du, Y. Multi-UAV search and rescue with enhanced A algorithm path planning in 3D environment. Int. J. Aerosp. Eng. 2023, 2023, 8614117. [Google Scholar] [CrossRef] [Scilit]
- Jayaweera, H.M.; Hanoun, S.; Sukkarieh, S. UAV Path Planning for Reconnaissance and Look-Ahead Coverage Support for Mobile Ground Vehicles. Sensors 2021, 21, 4595. [Google Scholar] [CrossRef] [Scilit] [PubMed]
- Pustokhina, I.V.; Pustokhin, D.A.; Lydia, E.L.; Elhoseny, M.; Shankar, K. Energy efficient neuro-fuzzy cluster based topology construction with metaheuristic route planning algorithm for unmanned aerial vehicles. Comput. Netw. 2021, 196, 108214. [Google Scholar] [CrossRef] [Scilit]
- Shi, J.; Mao, H.; Zhou, Z.; Zheng, L. Adaptive large neighborhood search algorithm for the unmanned aerial vehicle routing problem with recharging. Appl. Soft Comput. 2023, 147, 110831. [Google Scholar] [CrossRef] [Scilit]
- Han, Z.; Guo, W. Dynamic UAV task allocation and path planning with energy management using adaptive PSO in rolling horizon framework. Appl. Sci. 2025, 15, 4220. [Google Scholar] [CrossRef] [Scilit]
- Kadhim, R.A.; Kadhim, M.Q.; Al-Khazraji, H.; Humaidi, A.J. Bee Algorithm Based Control Design for Two-Links Robot Arm Systems. IIUM Eng. J. 2024, 25, 367–380. [Google Scholar] [CrossRef] [Scilit]
- Shafiq, M.; Ali, Z.A.; Alkhammash, E.H. A cluster-based hierarchical-approach for the path planning of swarm. Appl. Sci. 2021, 11, 6864. [Google Scholar] [CrossRef] [Scilit]
- Duan, H.; Yu, Y.; Zhang, X.; Shao, S. Three-dimension path planning for UCAV using hybrid meta-heuristic ACO-DE algorithm. Simul. Model. Pract. Theory 2010, 18, 1104–1115. [Google Scholar] [CrossRef] [Scilit]
- Mai, X.; Dong, N.; Liu, S.; Chen, H. UAV path planning based on a dual-strategy ant colony optimization algorithm. Intell. Robot. 2023, 3, 666–684. [Google Scholar] [CrossRef] [Scilit]
- Mohammed, H.; Ibrahim, M.; Raoof, A.; Jaleel, A.; Al-Dujaili, A.Q. Modified Ant Colony Optimization to Improve Energy Consumption of Cruiser Boundary Tour with Internet of Underwater Things. Computers 2025, 14, 74. [Google Scholar] [CrossRef] [Scilit]
- Mahmood, N.S.; Humaidi, A.J.; Al-Azzawi, R.S. Nonlinear PD State Feedback Control for Electronic Throttle Valve Based on Ant Colony Optimization. In Proceedings of the 2023 IEEE 11th Conference on Systems, Process & Control (ICSPC), Malacca, Malaysia, 16 December 2023; pp. 320–325. [Google Scholar]
- Zhang, H.; Wang, F.; Feng, D.; Du, S.; Zhong, G.; Deng, C.; Zhou, J. A logistics UAV parcel-receiving station and public air-route planning method based on bi-layer optimization. Appl. Sci. 2023, 13, 1842. [Google Scholar] [CrossRef] [Scilit]
- Jiang, H.; Wang, J.; Ren, X. Location-route planning for VTOL airport and UAV urban logistics network—A case study of Tianjin. Promet-Traffic Transp. 2025, 37, 456–476. [Google Scholar] [CrossRef] [Scilit]
- Verma, A. Electric Vehicle Routing Problem with Time Windows, Recharging Stations and Battery Swapping Stations. EURO J. Transp. Logist. 2018, 7, 415–451. [Google Scholar] [CrossRef] [Scilit]
- Solomon, M.M. Algorithms for the Vehicle Routing and Scheduling Problems with Time Window Constraints. Oper. Res. 1987, 35, 254–265. [Google Scholar] [CrossRef] [Scilit]
- Murray, C.C.; Chu, A.G. The Flying Sidekick Traveling Salesman Problem: Optimization of Drone-Assisted Parcel Delivery. Transp. Res. Part C Emerg. Technol. 2015, 54, 86–109. [Google Scholar] [CrossRef] [Scilit]
- Maaranen, H.; Miettinen, K.; Mäkelä, M.M. Quasi-random initial population for genetic algorithms. Comput. Math. Appl. 2004, 47, 1885–1895. [Google Scholar] [CrossRef] [Scilit]
- Colson, B.; Marcotte, P.; Savard, G. An overview of bilevel optimization. Ann. Oper. Res. 2007, 153, 235–256. [Google Scholar] [CrossRef] [Scilit]
- Feng, D. Research on Layout Planning Method of Urban Logistics UAV Vertiports. Master’s Thesis, Nanjing University of Aeronautics and Astronautics, Nanjing, China, 2022. [Google Scholar]
- Zhang, H.H.; Feng, D.K. Urban logistics unmanned aerial vehicle vertiports layout planning. J. Transp. Syst. Eng. Inf. Technol. 2022, 22, 207–214. [Google Scholar]
- Cheng, C.; Adulyasak, Y.; Rousseau, L.M. Robust facility location under demand uncertainty and facility disruptions. Omega 2021, 103, 102429. [Google Scholar] [CrossRef] [Scilit]
- IATA. Airport Handling Manual (AHM), 11th ed.; International Air Transport Association: Montreal, QC, Canada, 2023. [Google Scholar]
- ASTM F3548-21; Standard Specification for UAS Traffic Management (UTM) UAS Service Supplier (USS) Interoperability. ASTM International: West Conshohocken, PA, USA, 2021.

Disclaimer/Publisher’s Note: The statements, opinions and data contained in all publications are solely those of the individual author(s) and contributor(s) and not of MDPI and/or the editor(s). MDPI and/or the editor(s) disclaim responsibility for any injury to people or property resulting from any ideas, methods, instructions or products referred to in the content. |
© 2026 by the authors. Licensee MDPI, Basel, Switzerland. This article is an open access article distributed under the terms and conditions of the Creative Commons Attribution (CC BY) license.