


Abstract
The preparation of water-bearing regolith analogues supports laboratory investigations relevant to lunar polar exploration. This study investigates a flow-field overlap method in which mechanically agitated regolith particles are exposed to water vapor under low-temperature conditions. Four independent preparation runs were conducted at a target water content of 0.5 wt%. Oven-drying gravimetric measurements at ten sampling positions within each batch yielded mean water contents of 0.5072, 0.4981, 0.5444, and 0.5234 wt%, with within-batch standard deviations ranging from 0.0510 to 0.0658 wt%. Cryo-electron microscopy provided qualitative observations of particle-surface features interpreted as deposited ice. These measurements characterize the water contents and variability of the samples obtained under the tested conditions. The results provide an initial assessment of the preparation method at a target water content of 0.5 wt%. Performance at higher target water contents and suitability for infrared-sensor calibration require further experimental evaluation.
1. Introduction
As science and technology continue to develop, humans have begun to explore extraterrestrial spaces, conducting surveys of the Moon, Mars, and other celestial bodies [1]. The lunar soil is a finely graded material. After analysis, its average particle size ranges from approximately 40 to 800 µm, with an average value around 70 µm [2], and its regolith is primarily composed of loose particulate matter with particle sizes below 1 mm. This fine powdery substance possesses a large specific surface area, and can readily act as a deposition and adsorption carrier for water molecules within lunar permanently shadowed regions (PSRs), thus forming lunar water-bearing soil. With technological advances, increasing evidence of water existing on the Moon has been discovered [3,4,5,6,7,8]. Researchers are committed to verifying the existence of in situ water ice in lunar polar PSRs via various detection means. Infrared spectral sensors are widely adopted as core scientific instruments in deep space exploration missions [9,10,11,12,13,14]. Such sensors enable non-contact measurements, light weight, and high detection precision, and are applicable to identify water ice within PSRs. Nevertheless, systematic laboratory experiments are indispensable to verify the detection reliability of infrared spectral sensors for lunar water ice. Accordingly, the water content and its variation within laboratory ice-soil simulants require characterization before these materials are used in infrared measurements. The results of this study can provide ice-soil simulation materials for the scientific payload experiments of China’s Chang’e lunar exploration project. At the same time, it provides a material basis for spectral payloads for other deep space exploration tasks, such as asteroid exploration and comet exploration, etc.; their suitability for specific payload experiments remains to be established.
There exist diverse hypotheses concerning the existing state of ice-soil substances in lunar PSRs. Some scholars have prepared ice-soil simulants by blending granular raw materials with solid water ice fragments [15,16,17,18,19]. A second method that mixes liquid water with solid particles followed by cooling treatment can enhance the mechanical strength of ice-soil simulants, rendering them applicable to the testing of force load envelope curves under engineering loading conditions. However, this preparation route differs from vapor deposition under low-pressure conditions, and its suitability for a particular spectroscopic application requires separate evaluation [20,21]. Tiny water droplets and water vapor can condense and adsorb onto particle surfaces, which facilitates the formation of ice-soil simulants [22,23,24]. Temperature is the primary factor determining the crystallographic phase of ice grown from the H2O phase at low pressures [25]. When the pressure is maintained at less than 6 × 10⁻⁴ Pa and the temperature is lower than 130 K, the water ice deposited on the solid surface under ultra-high vacuum conditions mainly exists in the form of amorphous solid water (ASW) [26]. A high-density amorphous state of water ice can be obtained at 30 K, whereas a low-density amorphous state is deposited at temperatures ranging from 30 K to 130 K. As the temperature increases further, the ice film on particle surfaces sublimes into gaseous water molecules. The temperature-dependent sublimation rate of water ice has been quantified under specific vacuum conditions [27]. Based on this, researchers from Harbin Institute of Technology have simulated the surface frost layer inside the cold trap of lunar PSRs using the cold trap capture method and characterized its surface morphology via freeze scanning electron microscopy (SEM) [28].
Several approaches have been reported for preparing icy regolith simulants, including rapid freezing of wet simulants in liquid nitrogen [29], mixing prefabricated ice particles with dry regolith [30], and producing micrometer-sized ice grains for planetary analogue research [31]. These approaches provide different routes for incorporating ice into particulate materials. For preparation by vapor deposition, the distribution of deposited water within the resulting material requires experimental characterization.
In this study, we investigate a flow-field overlap method that combines mechanical agitation of regolith particles with exposure to water vapor under low-temperature conditions. Mechanical agitation is intended to rotate and reorient the particles during deposition, allowing different regions of their surfaces to come into contact with water vapor. Four independent preparation runs were conducted at a target water content of 0.5 wt%. Oven-drying gravimetric measurements at multiple sampling positions and cryo-electron microscopy are used to characterize the resulting water contents, within-batch variability, and particle-surface morphology. No matched control experiments were performed; therefore, the present results do not establish improved uniformity or preparation efficiency relative to existing approaches. Infrared characterization remains a potential future application requiring separate experimental validation.
2. Materials and Methods
2.1. Simulation Principles
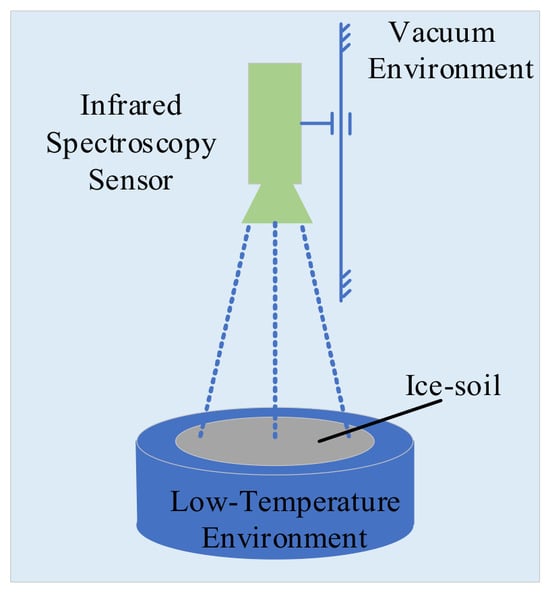
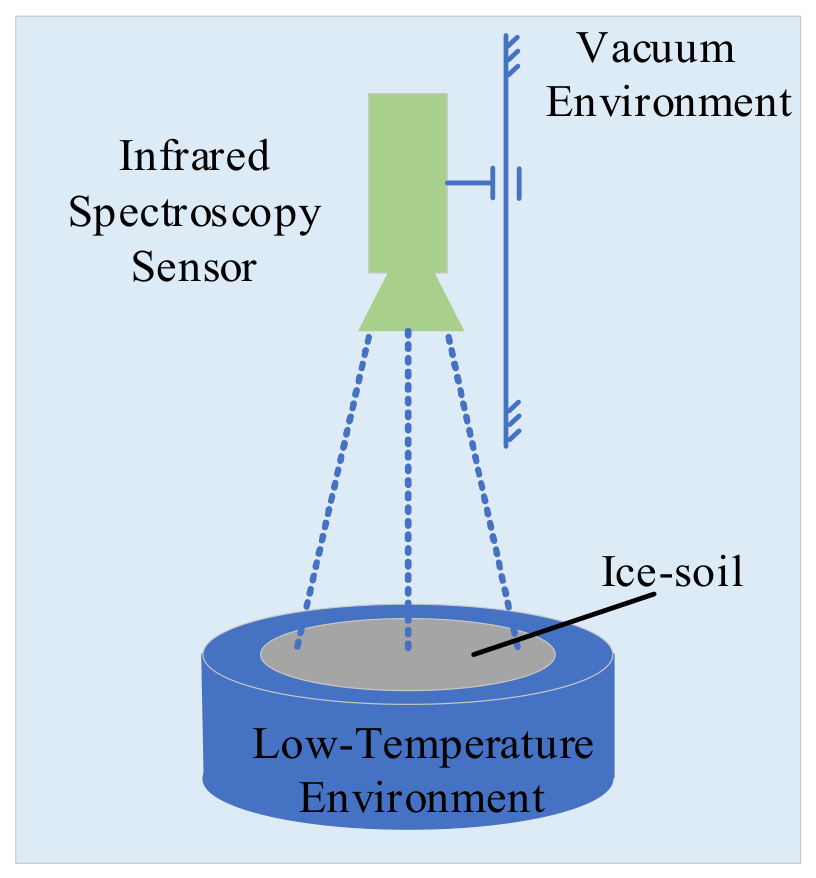
As illustrated in Figure 1, the schematic diagram shows a possible configuration for infrared spectroscopic measurements of lunar ice-soil simulants. In this configuration, the material is laid flat on a cold plate in a vacuum environment to provide an observation area. The present study concerns sample preparation and characterization; the spectroscopic measurements depicted in Figure 1 were not performed in this study.
Figure 1.
Conceptual configuration for potential future infrared spectroscopic measurements of ice-soil simulants. These measurements were not performed in the present study.
The cold-trap method described in Ref. [28] was used to prepare surface frost layers. The present study investigates the incorporation of mechanical agitation into vapor deposition and characterizes the resulting samples. Differences in preparation efficiency and spatial variability between the two methods require evaluation under matched experimental conditions.
Current scientific consensus suggests that water ice in PSRs forms via the long-term accumulation of water molecules based on the cold trap capture principle.
The lunar environment differs substantially from the Earth’s environment due to low gravity, high radiation, extremely low temperatures, and high vacuum conditions. Among these environmental factors, vacuum and low temperature serve as the primary factors affecting lunar water ice.
Simulating the complete lunar environment on the Earth is technically challenging and cost-intensive. Therefore, a simulation principle of “equivalent physical composition and approximation of environmental parameters based on the formation laws of ice-soil” is proposed in this study.
2.2. Characteristics of Lunar Soil Particles
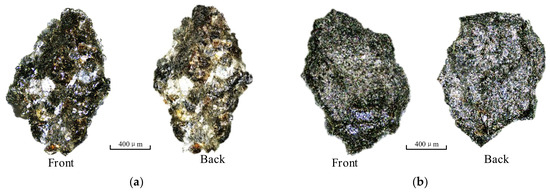
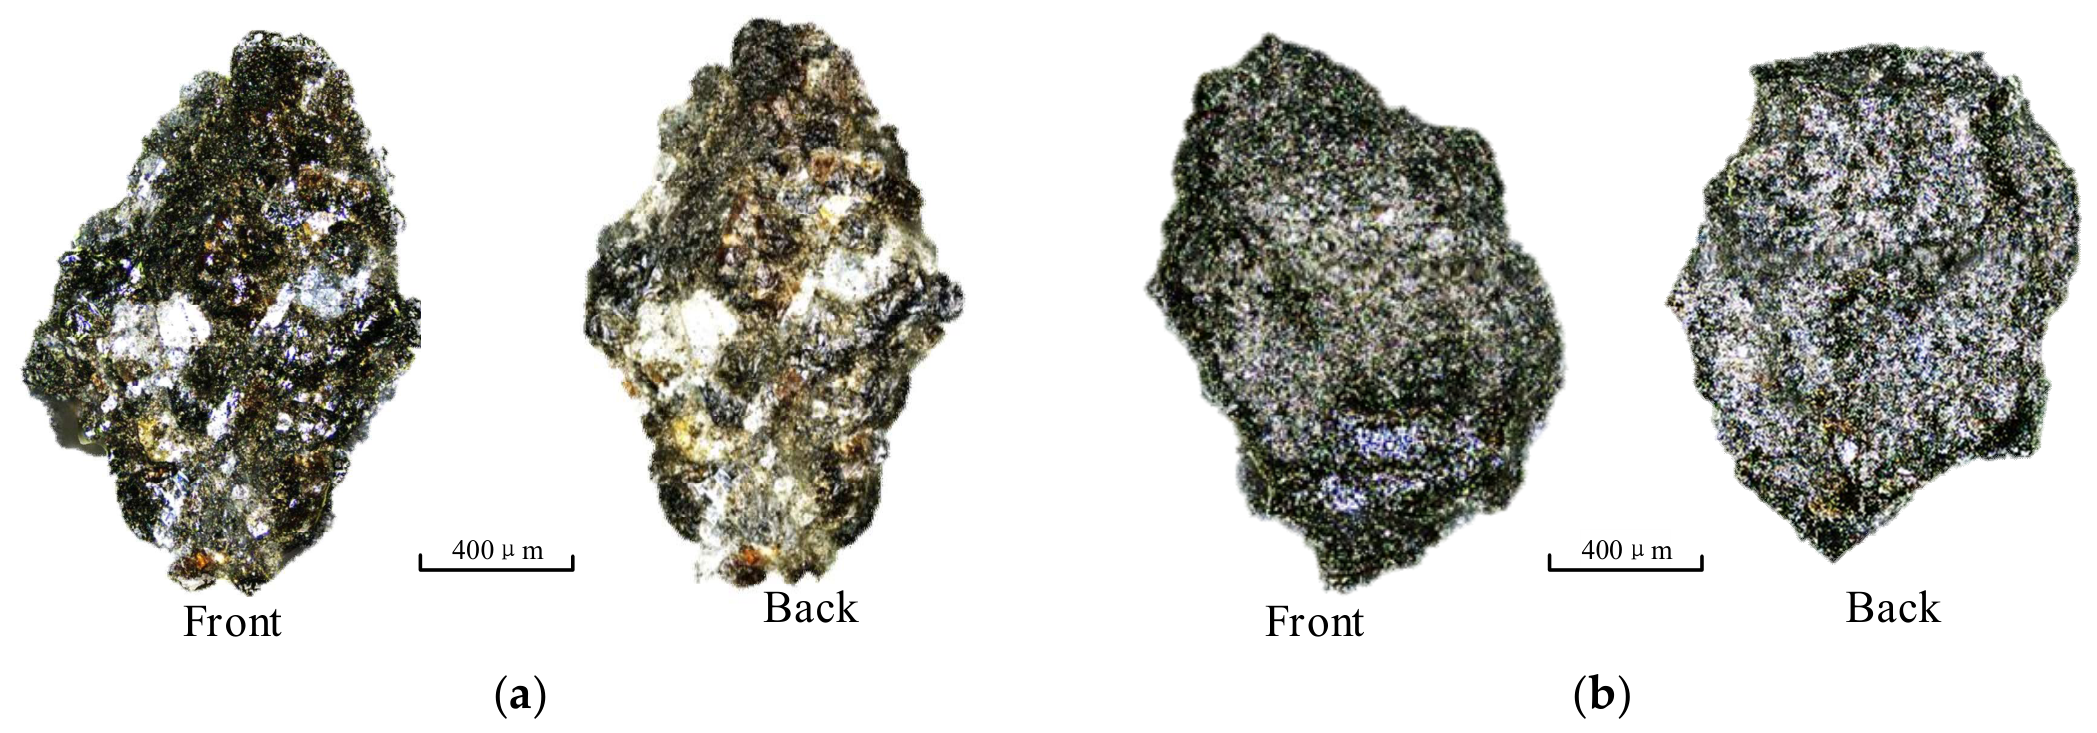
Figure 2 displays the front and back mirror images of particles numbered C2-KL-P1 and C2-KL-P2. These particles are derived from Chang’e-5 lunar samples (No. CE5C0600YJFM00404H), which are powdery lunar soil acquired via scraping sampling during the Chang’e-5 exploration mission. Observation under optical microscopy reveals that lunar soil particles feature highly irregular shapes and contours with prominent surface roughness. Scholars [32,33,34,35,36] investigated the particle size distribution of lunar soil samples, and the results indicate that their particle sizes are mainly distributed within the range of 3.2 μm to 1 mm.
Figure 2.
Images of the lunar soil from Chang’e-5: (a) number C2-KL-P1; (b) number C2-KL-P2.
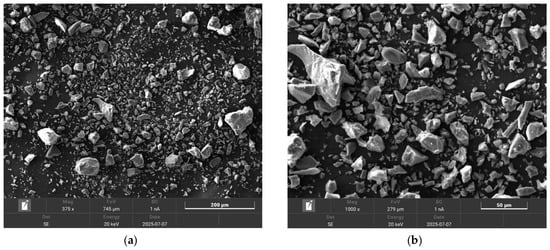
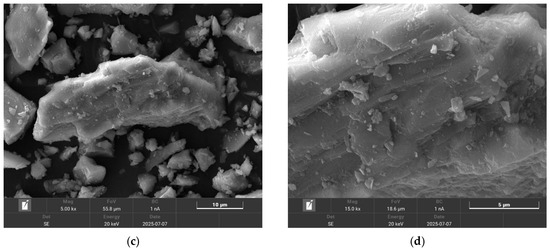
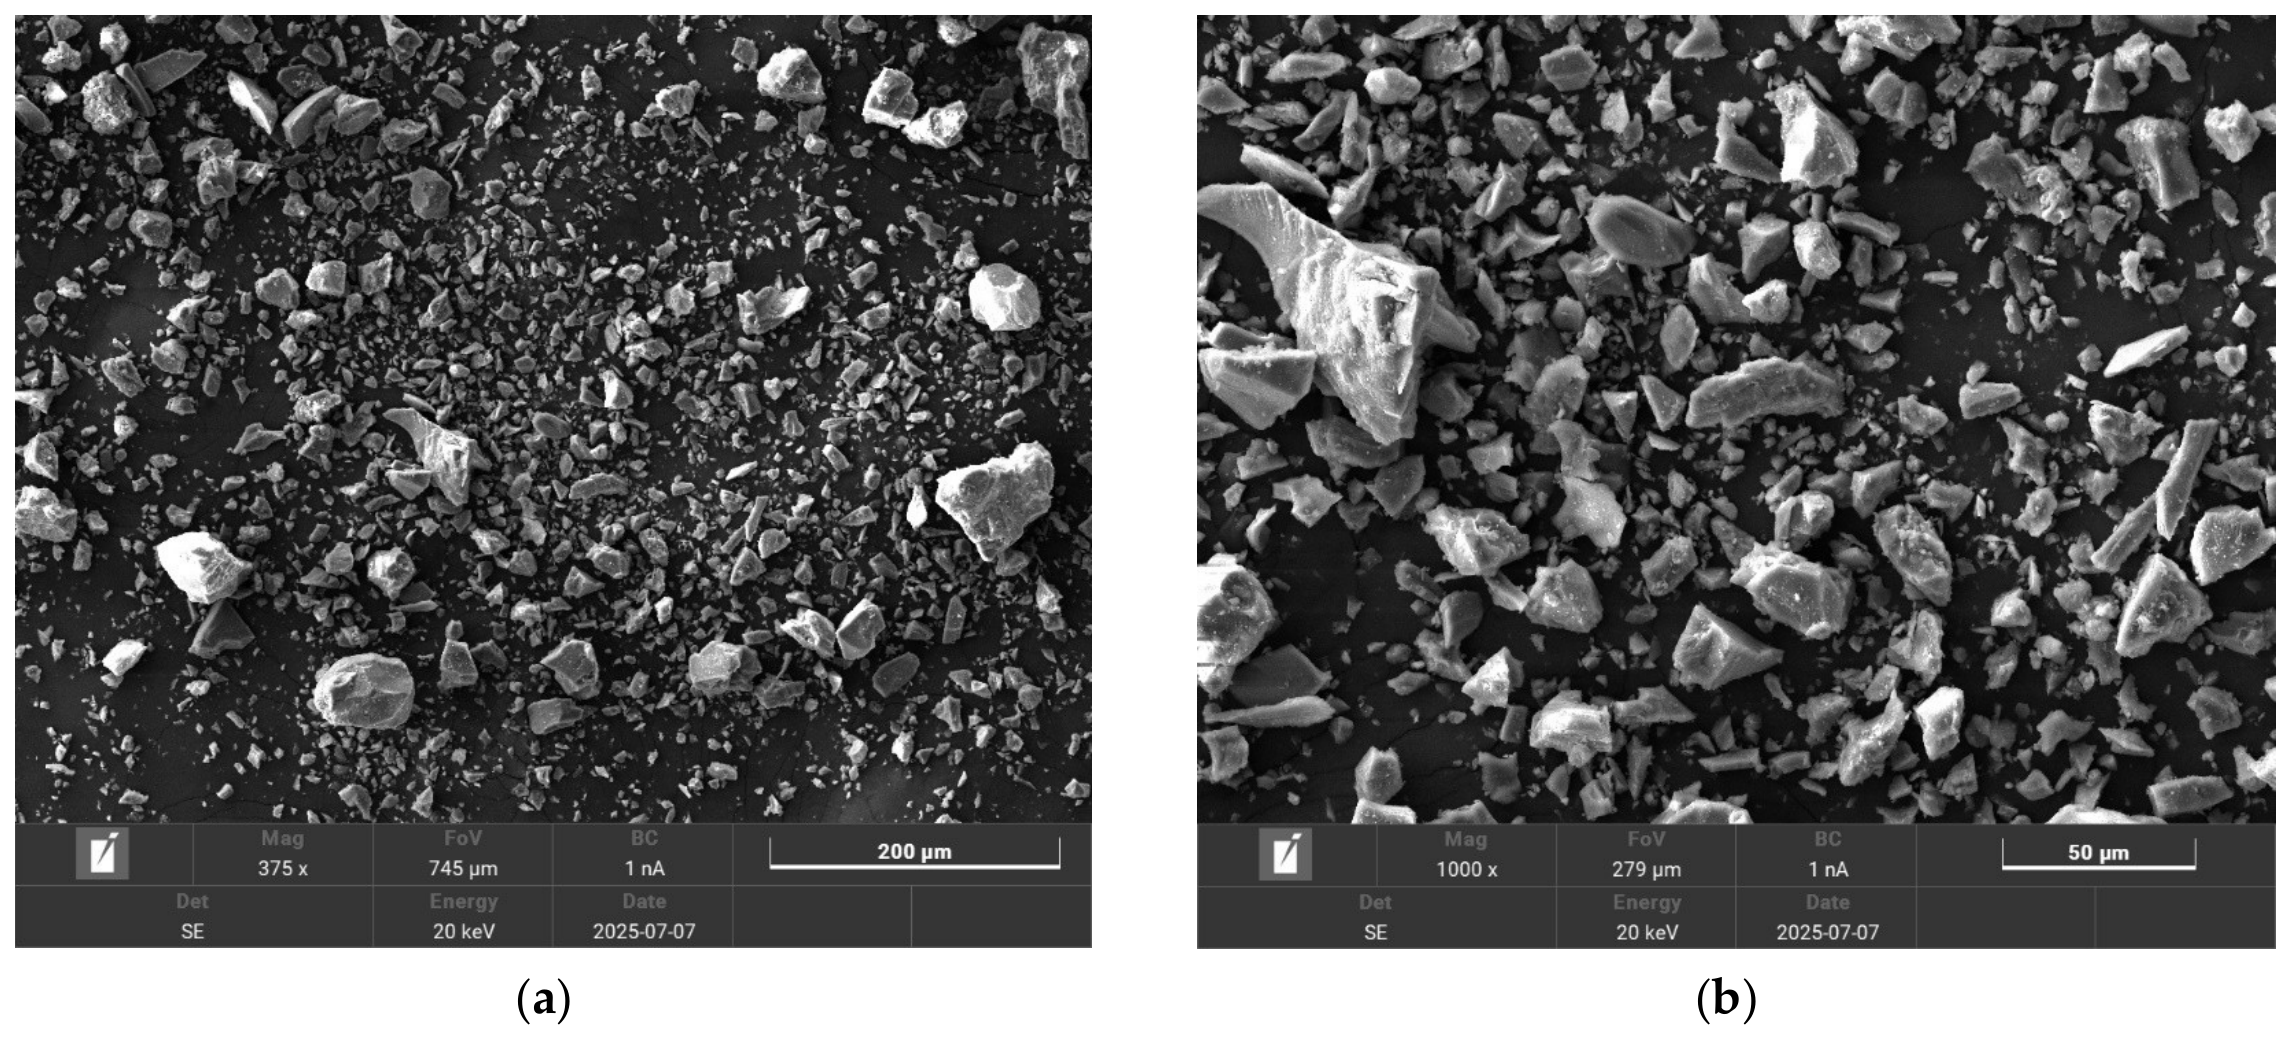
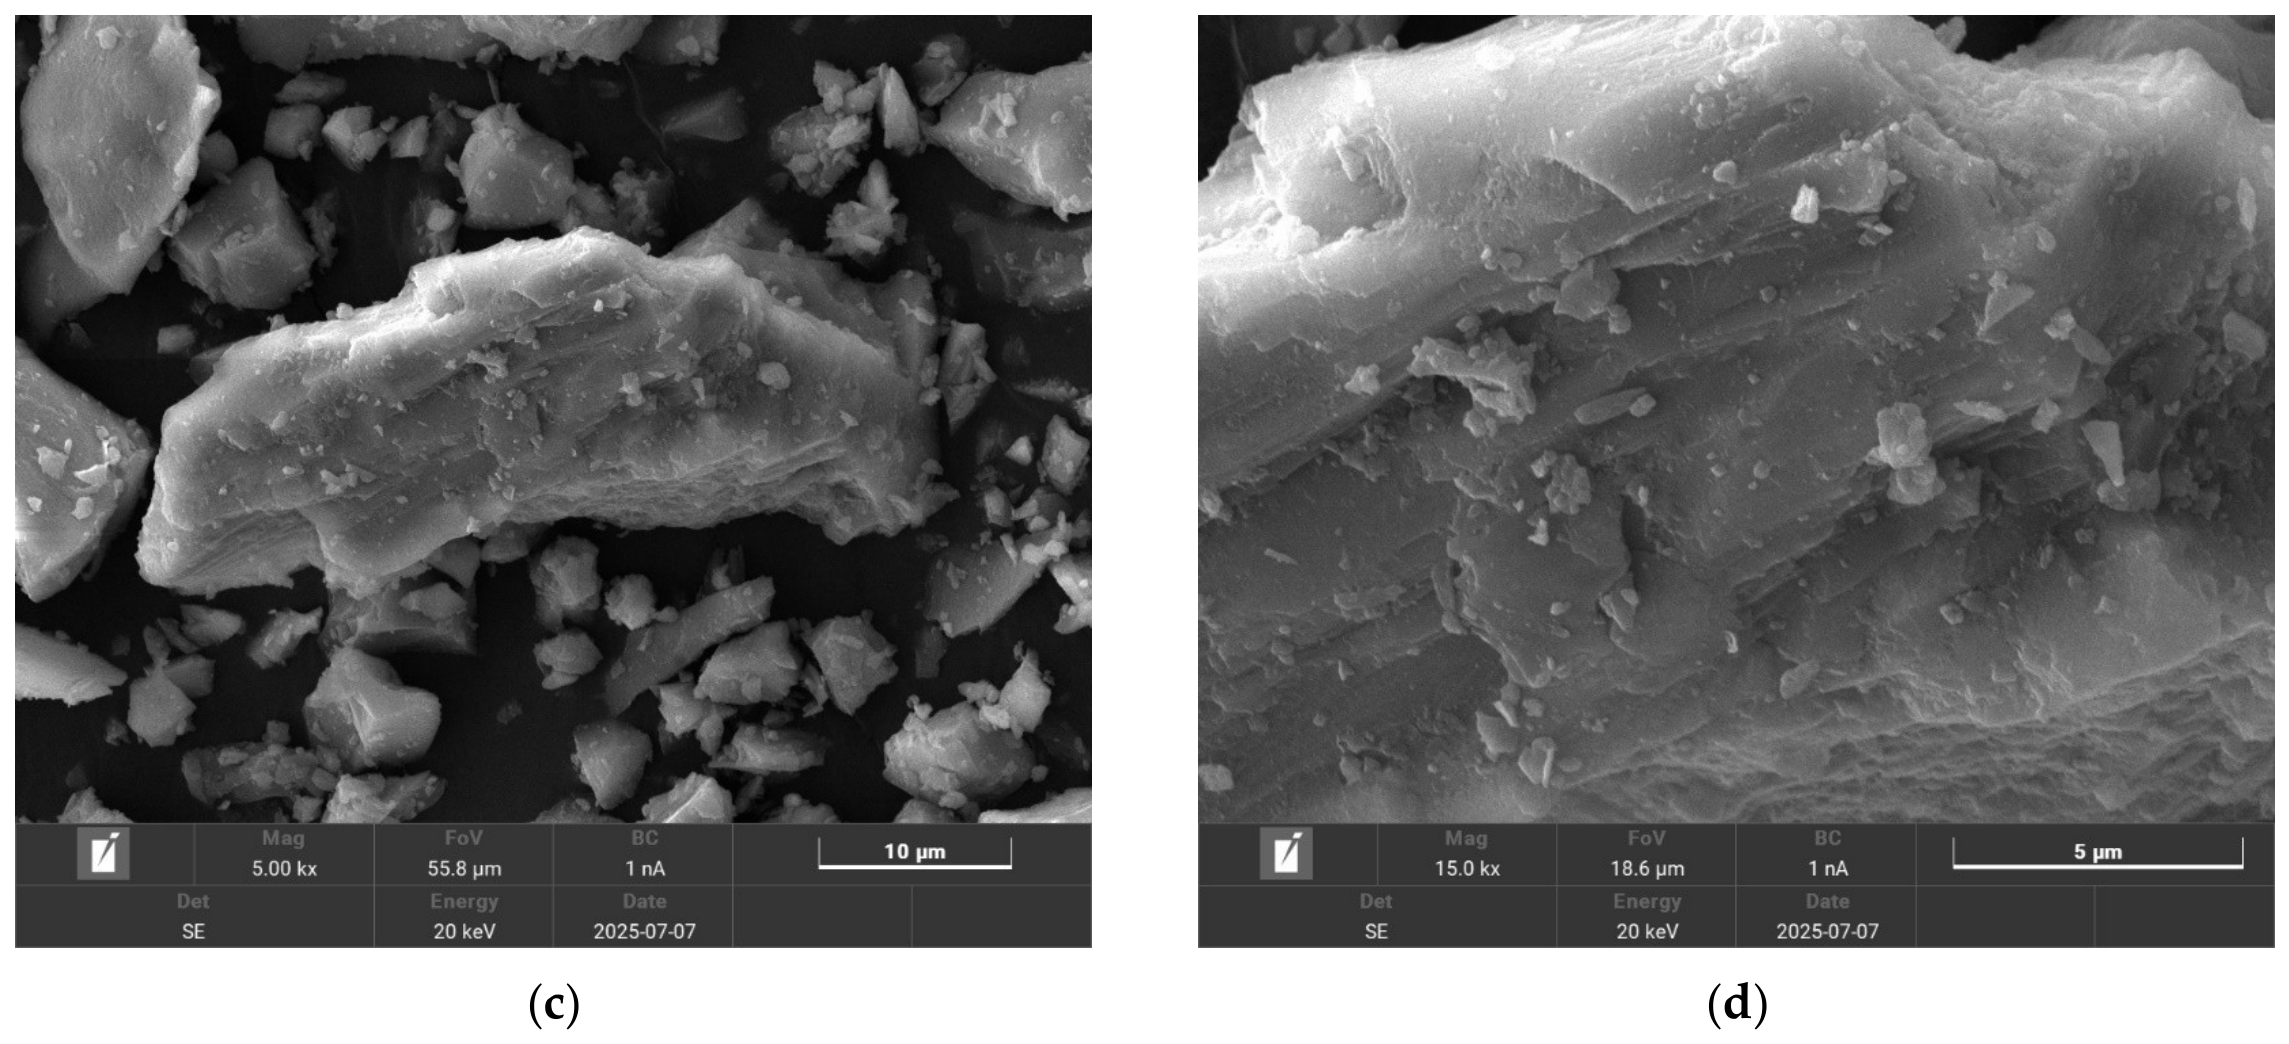
Lunar soil samples are scarce and precious. Therefore, simulants are commonly adopted as lunar soil. The solid particles of the simulated lunar soil used in this study were provided by Jilin University and possess a mineral and chemical composition similar to that of soils in lunar polar regions. The microstructure of the simulated lunar soil observed via SEM is presented in Figure 3. It can be observed that the particles are predominantly angular in morphology, with numerous microstructural planes distributed on their surfaces. The particle size distribution of the simulated lunar soil employed in the experiment is consistent with that of real lunar soil [37]. The particle size distribution of these particles, characterized separately, is presented later.
Figure 3.
SEM images of simulated lunar soil particles: (a) 375× magnification; (b) 1000× magnification; (c) 5000× magnification; (d) 15,000× magnification.
To improve the authenticity of lunar polar ice-soil simulants, it is essential to approximately reproduce the actual formation and evolution processes of lunar polar ice and soil [38,39,40,41,42,43,44]. Among the proposed formation mechanisms for water ice in lunar PSRs, the cold-trapping of migrating water molecules is widely considered to be the primary long-term accumulation process. Water ice undergoes a three-stage “solid–gas–solid” state transition. The initial stage corresponds to solid ice, which simulates the existence of solid water ice on extraterrestrial celestial bodies. The second stage involves the sublimation of ice into gaseous water molecule flows, which simulates the vaporization of ice into water vapor under specific environmental conditions. The final stage refers to the condensation of water molecules on particle surfaces to form ice films, which simulates the capture process in cold traps within lunar polar shadow pits that enables the deposition and adsorption of water molecules.
2.3. Environmental Parameter Approximation
A vacuum and low-temperature environment was established to investigate water-vapor deposition onto regolith simulant particles. This laboratory configuration approximates selected aspects of cold trapping rather than the complete environment of lunar PSRs.
The temperature of permanently shadowed craters in lunar polar regions ranges from 20 K to 110 K [45]. Previous studies have examined the behavior of ice under low-temperature, low-pressure conditions [46]. A liquid nitrogen bath, with a temperature of approximately 77 K, was used to cool the sample container. This bath temperature is a boundary condition and does not establish a uniform temperature throughout the particles, chamber walls, and vapor.
The liquid nitrogen bath and evacuation provided the laboratory conditions for cold trapping. An indicated pressure of approximately 10−3 Pa was recorded before deposition; pressure readings changed during sublimation, as discussed in Section 2.4.4. Considering the dynamic transformation characteristics of lunar soil, the contact probability between soil particle surfaces and water molecules remains stable over time. These conditions provide a laboratory analogue of selected aspects of cold trapping, but do not reproduce the full range of thermal, pressure, molecular-transport, or surface conditions in lunar permanently shadowed regions. The measured water contents and within-batch variability therefore characterize the samples prepared under the tested laboratory conditions. It must be emphasized, however, that this uniformity assumption is a deliberate simplification for laboratory convenience and is not inferred from any direct lunar ground-truth data.
Variation in the water content of simulants is relevant to subsequent infrared measurements and therefore requires experimental characterization. In the present study, overlapping particle and water-vapor flows are used to prepare ice-soil simulants, and the resulting bulk water content and within-batch variability are evaluated experimentally.
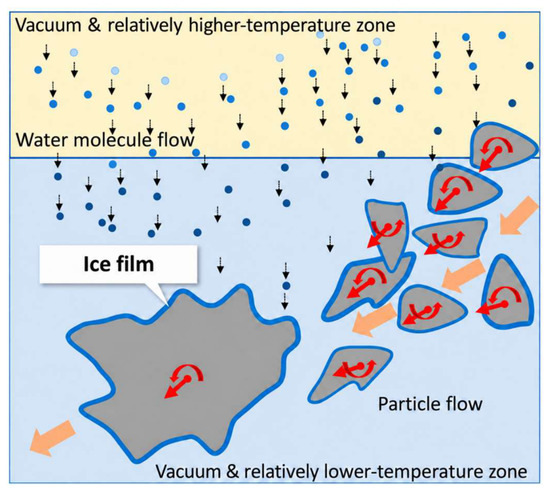
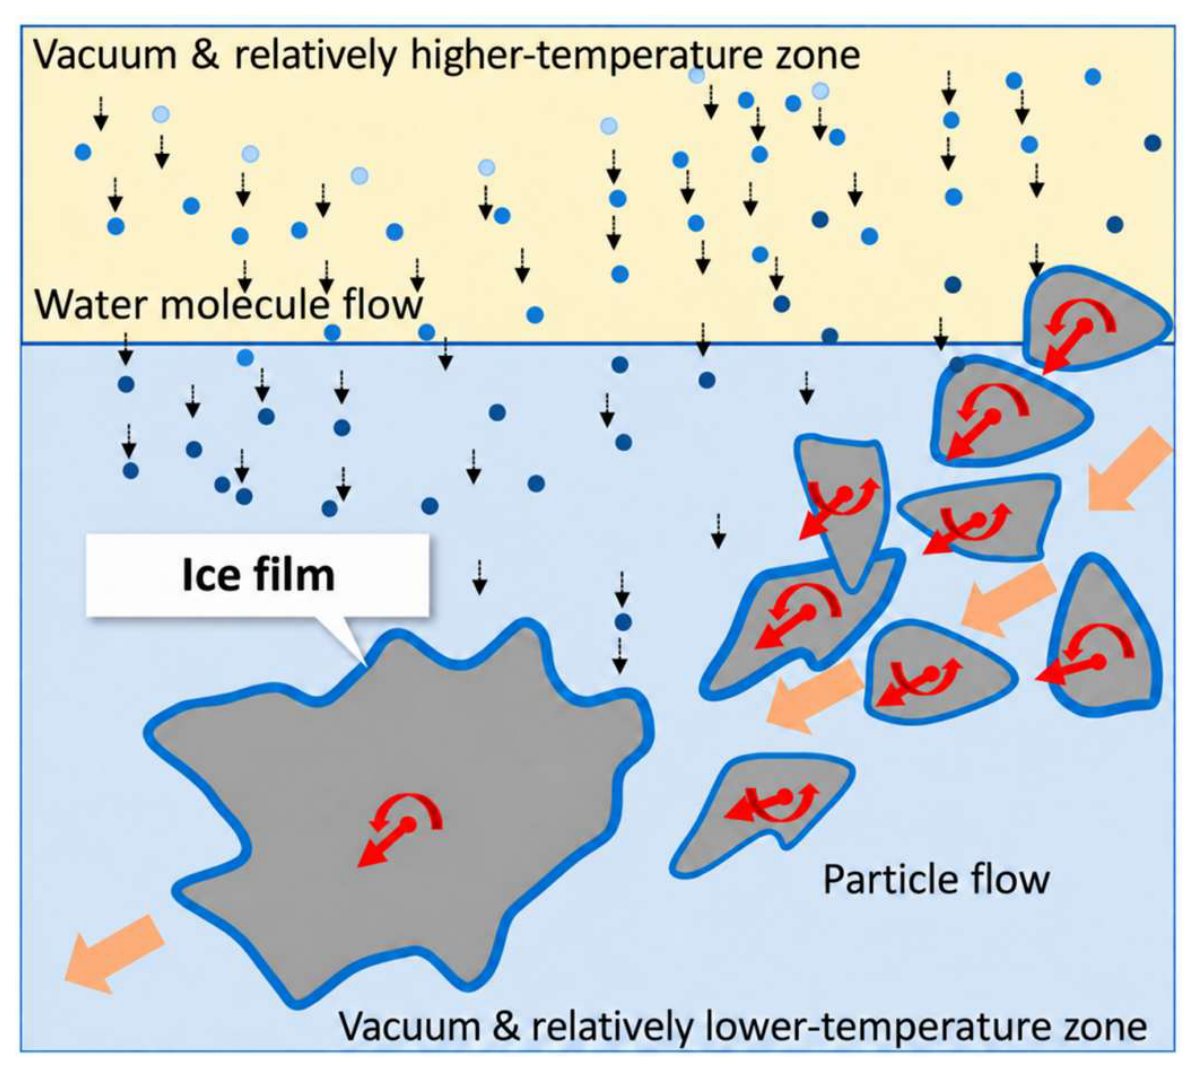
Figure 4 illustrates the experimental concept of the flow-field overlap method, in which mechanically agitated regolith simulant particles are exposed to water vapor under low-temperature conditions. Particle rotation and reorientation are intended to bring different surface regions into contact with the vapor. The relatively higher- and lower-temperature zones in the diagram are qualitative representations and do not constitute a measured temperature-field map.
Figure 4.
Conceptual illustration of particle motion and water-vapor exposure in the flow-field overlap method. The arrows schematically indicate vapor movement and particle motion, rather than measured trajectories. Blue contours represent hypothesized surface ice deposition; the single-coating depiction does not imply a molecular monolayer or experimentally established coating continuity, thickness, or uniformity. The temperature zones are qualitative. The different colored dots in the picture all refer to water vapor.
The blue contours labeled “Ice film” schematically represent hypothesized ice deposition on particle surfaces. Their depiction as a single coating is a graphical simplification and does not establish a molecular monolayer, continuous surface coverage, or uniform film thickness. The present measurements provide water-content estimates from oven-drying gravimetry and qualitative observations of particle-surface morphology. They do not resolve successive film-growth stages, preferential accumulation at specific surface features, or individual molecular trajectories. Whether particle reorientation improves surface coverage uniformity remains to be tested.
2.4. Laboratory Fabrication Protocol
Based on the aforementioned generation and evolution mechanism of lunar PSR ice-soil, a five-step laboratory preparation process was employed to physically simulate the ice-soil. This process is illustrated in Figure 5.
Figure 5.
Simulation steps.
2.4.1. Step One: Selection and Mixing
It is generally acknowledged that the mineral composition of lunar polar soil resembles that of lunar highland soil. The Apollo 16 landing site in the lunar highlands yielded both surface and core soil samples, which serve as reliable references for determining the mineral composition, particle size distribution and microscopic morphology of solid particles. Referencing these findings, lunar soil analog particles are fabricated with consistent mineral components, particle size distribution and microscopic morphology. Lunar polar soil is mainly derived from local bedrock and adjacent areas, with a minimal proportion of foreign materials transported over long distances.
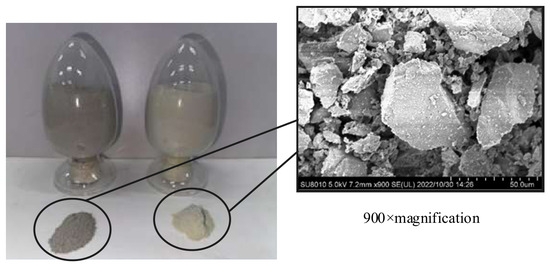
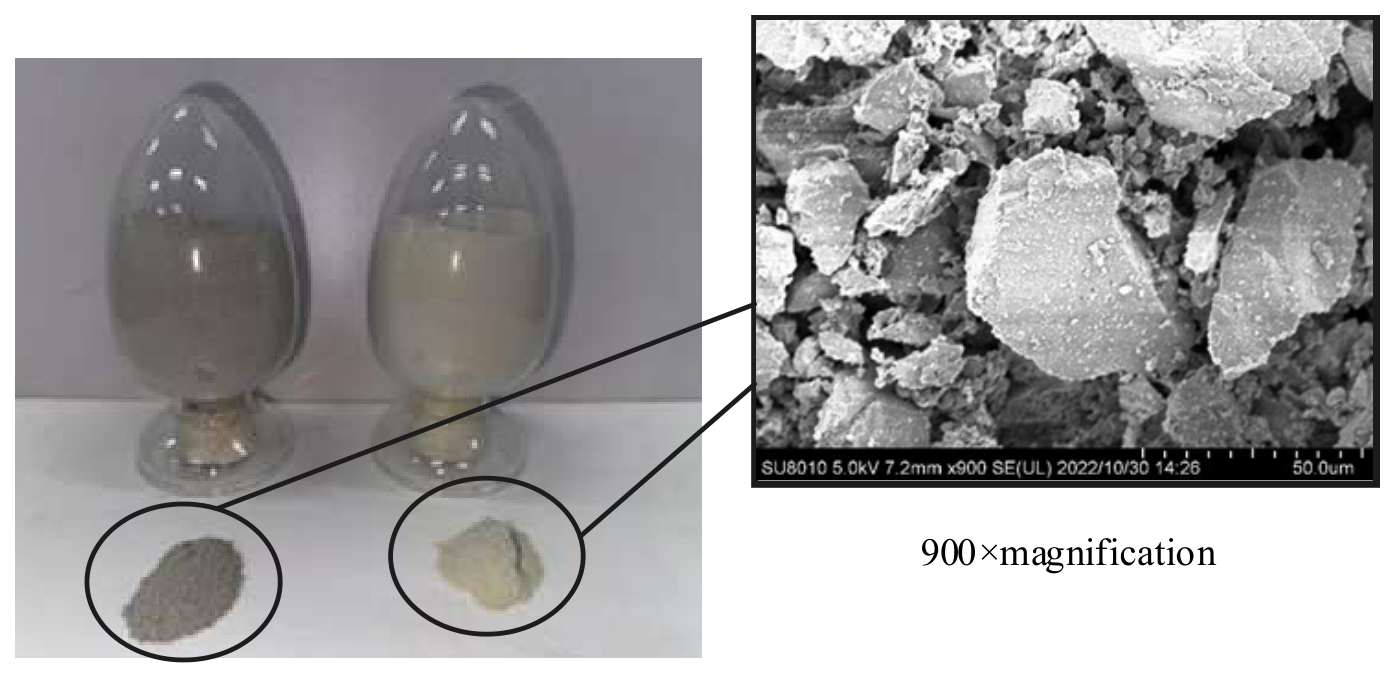
Labradorite and basalt, with particle diameters less than 1 mm, were selected, and a blending ratio of 7:3 by mass was used for labradorite and basalt [19]. The raw materials of labradorite and basalt are depicted in Figure 6. The mixed lunar soil simulant appears as a powder material. When magnified beyond 900 times, the microscopic morphology of the particles can be clearly observed.
Figure 6.
Images of these raw materials and the 900-times magnified SEM view of the surfaces of these particles.
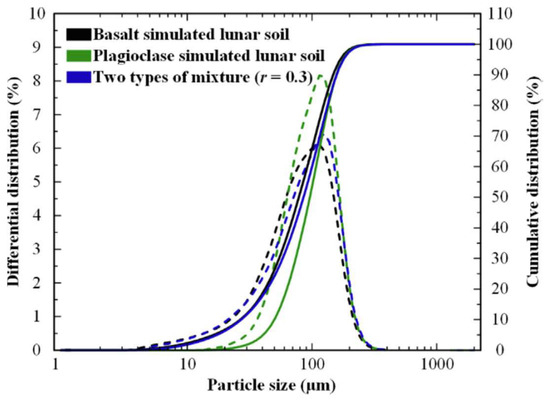
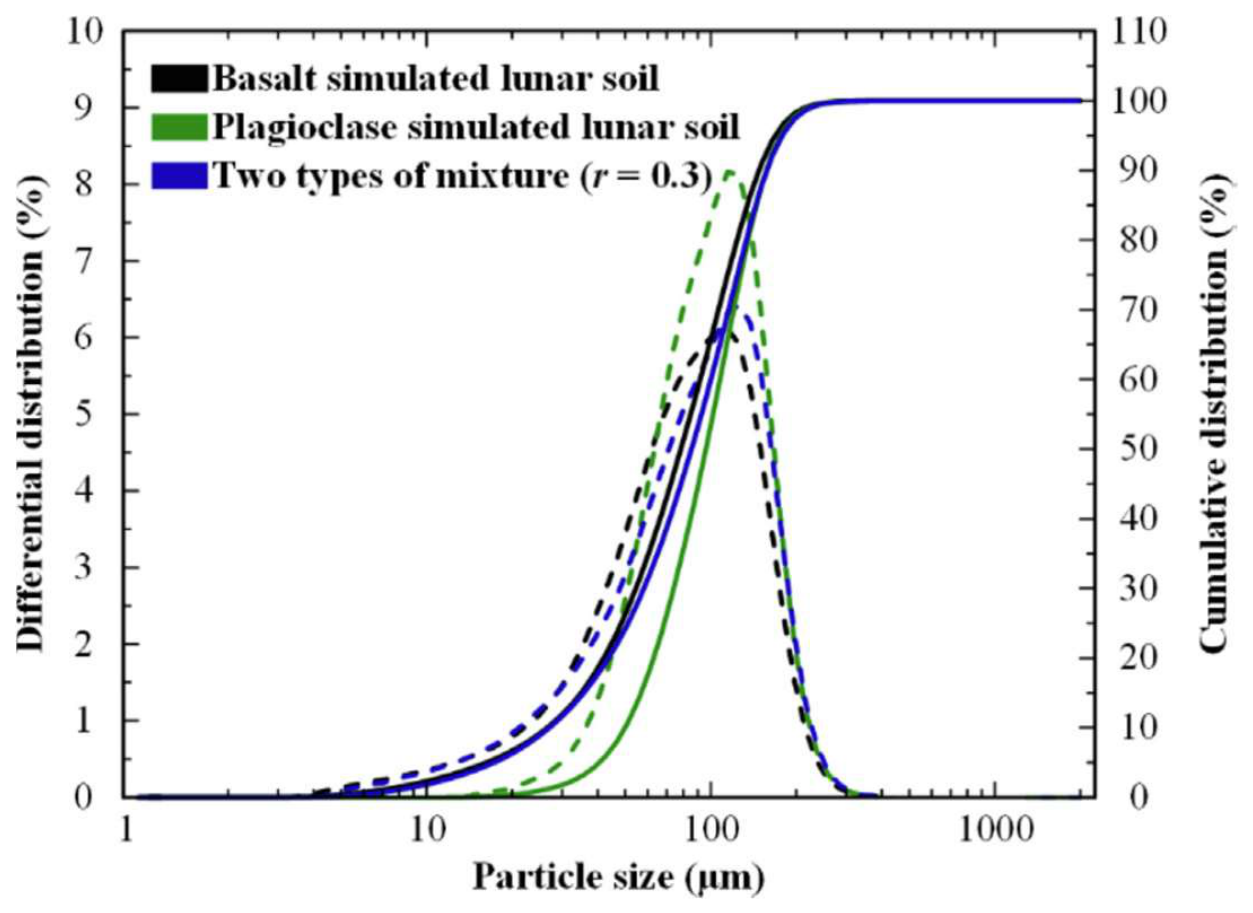
A particle size test was conducted on the two types of basic raw materials and their mixtures, and the results are displayed in Figure 7. The median particle size of the basalt and anorthosite simulated mixture was 85.57 μm.
Figure 7.
Particle size distribution. The left axis represents the differential distribution, and the right axis represents the cumulative distribution. The dotted line represents the differential distribution, while the solid line represents the cumulative distribution.
2.4.2. Step Two: Absolute Drying
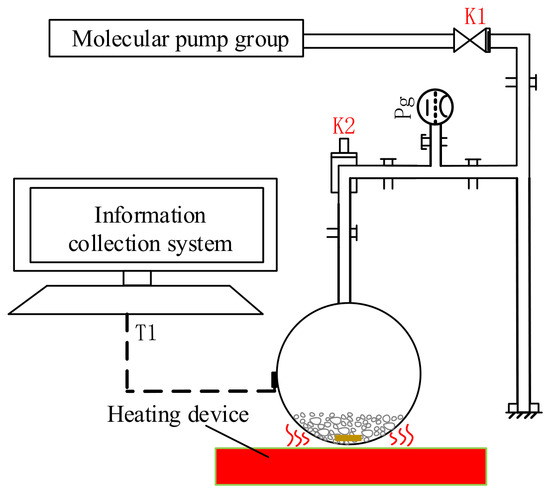
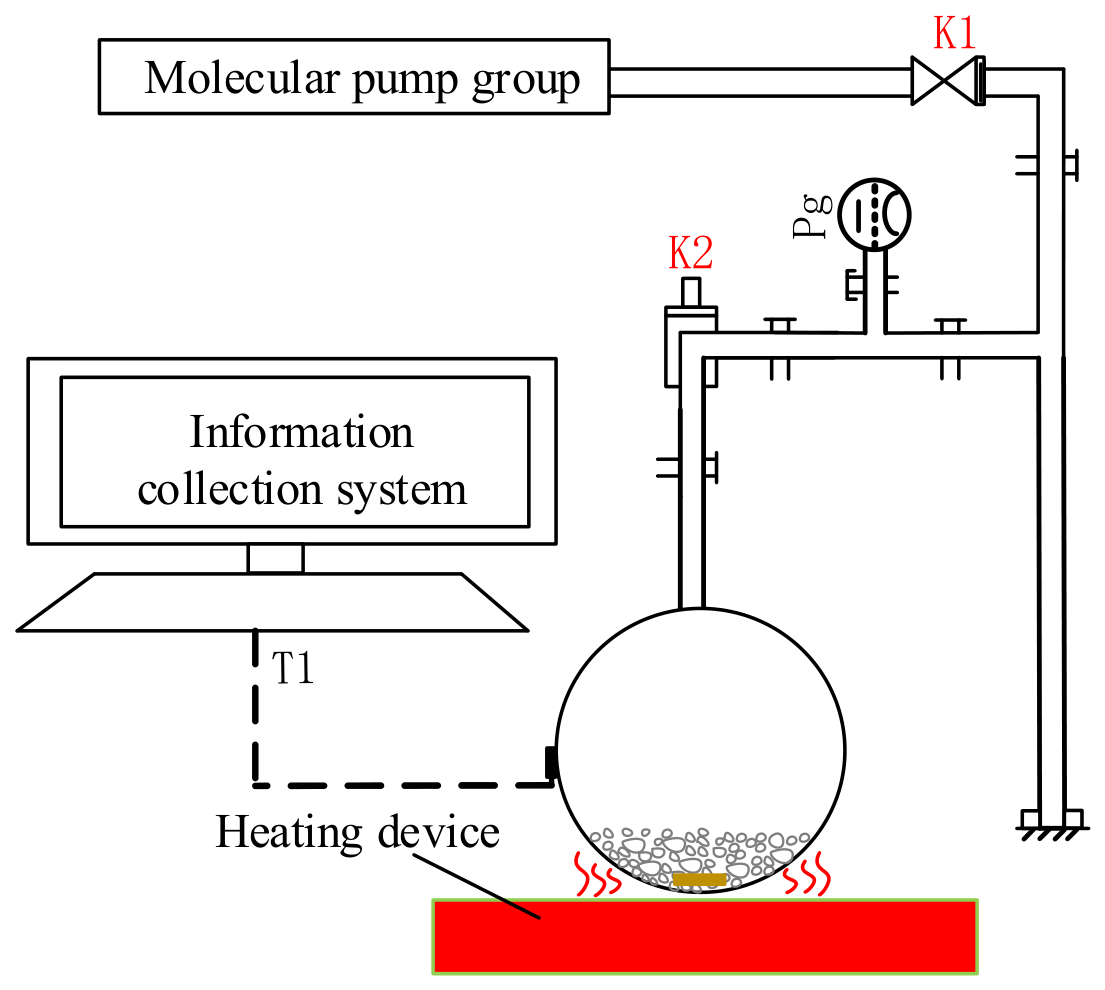
The process of Step Two is illustrated in Figure 8. The heating temperature for drying the raw regolith simulant was set to 473 K, while the vacuum gauge indicated approximately 10−2 Pa in the flask container.
Figure 8.
Working principle of absolute drying stage. The regolith simulant in the flask is heated by an external heat source. At the same time, the vacuum pump removes the air inside the system through the upper port, thereby eliminating excess water vapor.
2.4.3. Step Three: Water Vapor Preparation
Based on the targeted water content of the simulated ice-soil simulants, the required water mass was calculated. The nominal target water content of 0.5 wt% was specified for preparation. Ultrapure water was dispensed using a pipette with a stated accuracy of ±0.01 mL in a high-purity nitrogen glove box. On this basis, the ideal water addition required to reach a specified target under complete water retention is given by Equation (1). The final sample water contents were determined independently by oven-drying gravimetric measurements and were not inferred from Equation (1).
where mw is the amount of water (g) that needs to be added to prepare the target moisture content sample; m0 is the mass of lunar soil (g); w0 is the initial water content (wt%) of the lunar soil; and w1 is the target water content (wt%) of the prepared samples.
2.4.4. Step Four: Cold Trap Capture
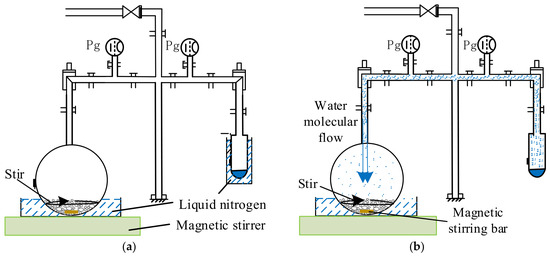
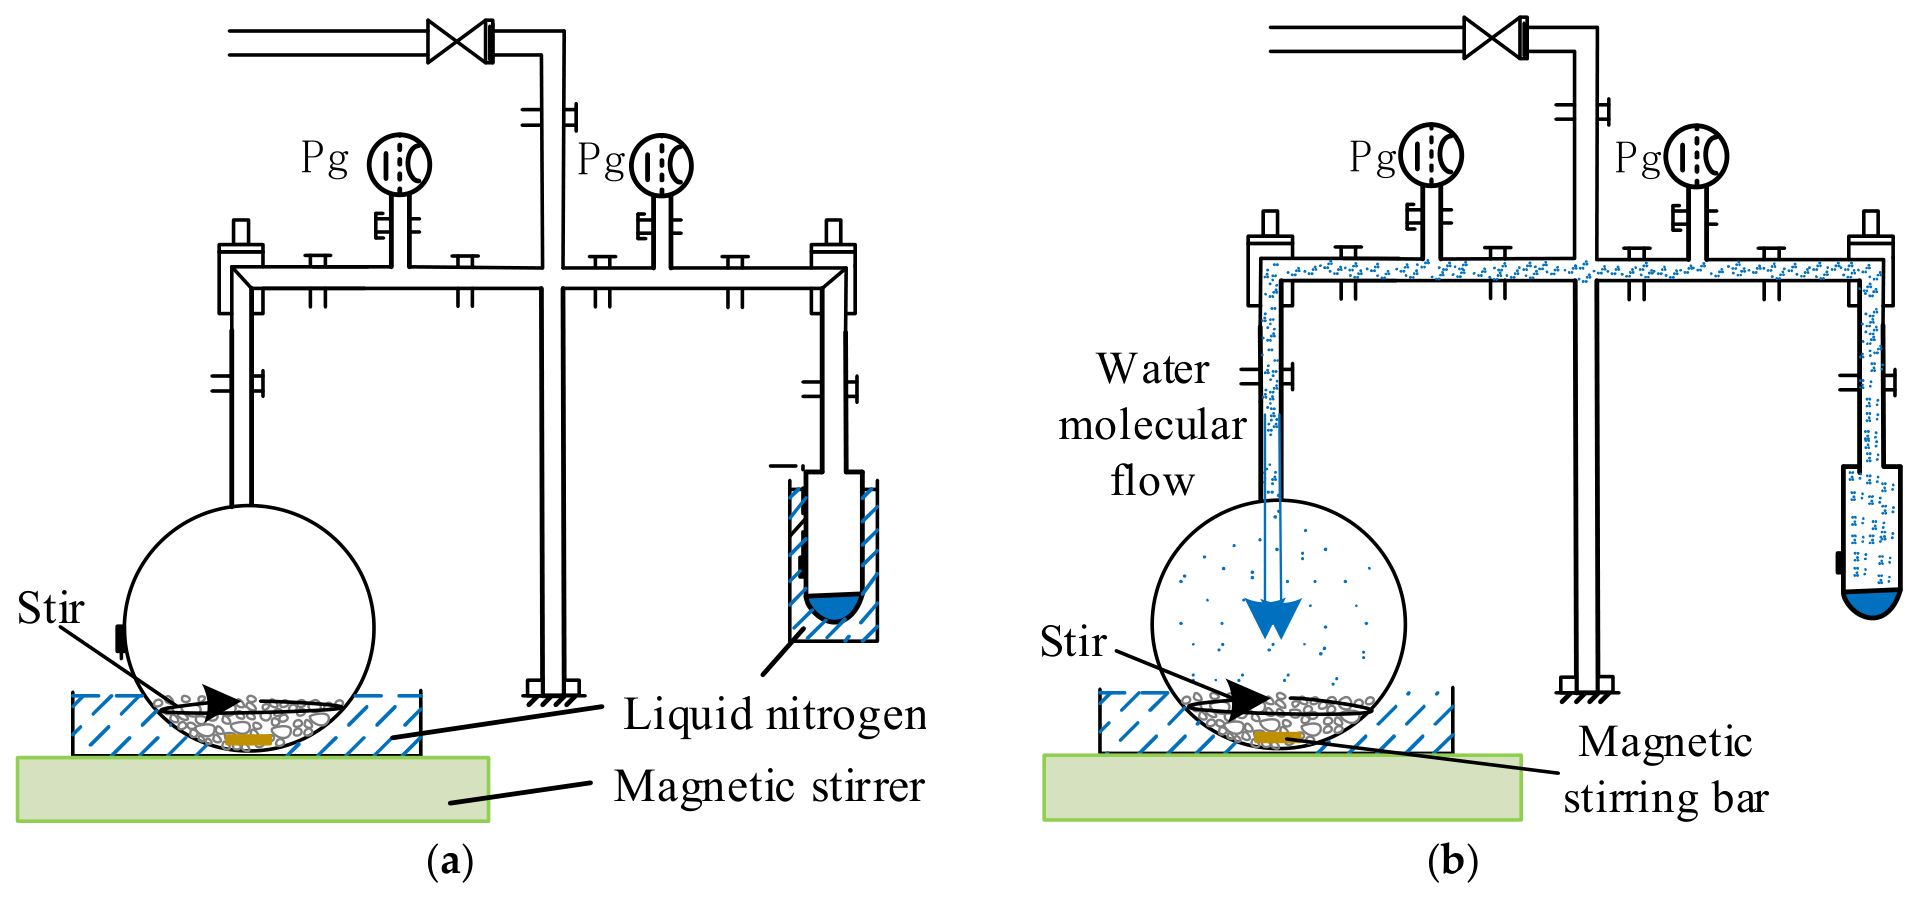
As demonstrated in Figure 9a, the water was cooled to form solid ice. A vacuum pump was then employed to reduce the vacuum level in the container containing the ice. As depicted in Figure 9b, by raising the ambient temperature of the water ice, it sublimated into water molecules in the vacuum environment.
Figure 9.
(a) Working principle of cold trap preset: submerge both the flask and the test tube in liquid nitrogen to pre-cool their internal environments to the target temperature for the experiment. (b) Working principle of water vapor preparing: The liquid nitrogen was removed from the test tube section, and the tube was subsequently left to equilibrate to room temperature. Upon warming, the water ice sublimated, and the water vapor was transported toward the cooler flask, where it re-adsorbed onto the simulant. The stirring bar, 50 mm long and 15 mm in diameter, was positioned at the bottom of the sample flask and driven by an external magnetic stirrer beneath the flask. The arrows in the picture indicate the rotation direction of the stirring-bar.
Table 1 summarizes the nominal preparation parameters used in the four independent runs. The apparatus configuration, stirring-bar geometry, source-to-sample arrangement, and cooling and source-warming procedures were kept unchanged between runs. Together with the specified material mass, water charge, stirrer speed setting, and deposition duration, these conditions provided a common operational basis for comparing the resulting samples. Water-vapor flux at the particle bed and cumulative vapor exposure were not directly quantified; therefore, the comparisons reflect preparation under a common nominal protocol rather than experimentally verified equivalent vapor exposure.
Table 1.
The parameters of flow-field overlap.
2.4.5. Step Five: Characterization and Measurement
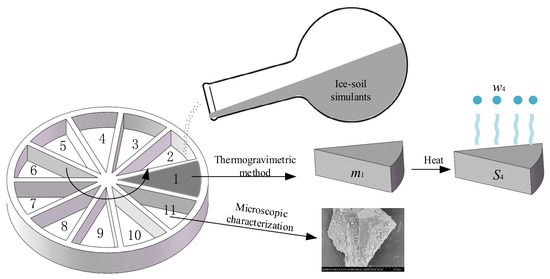
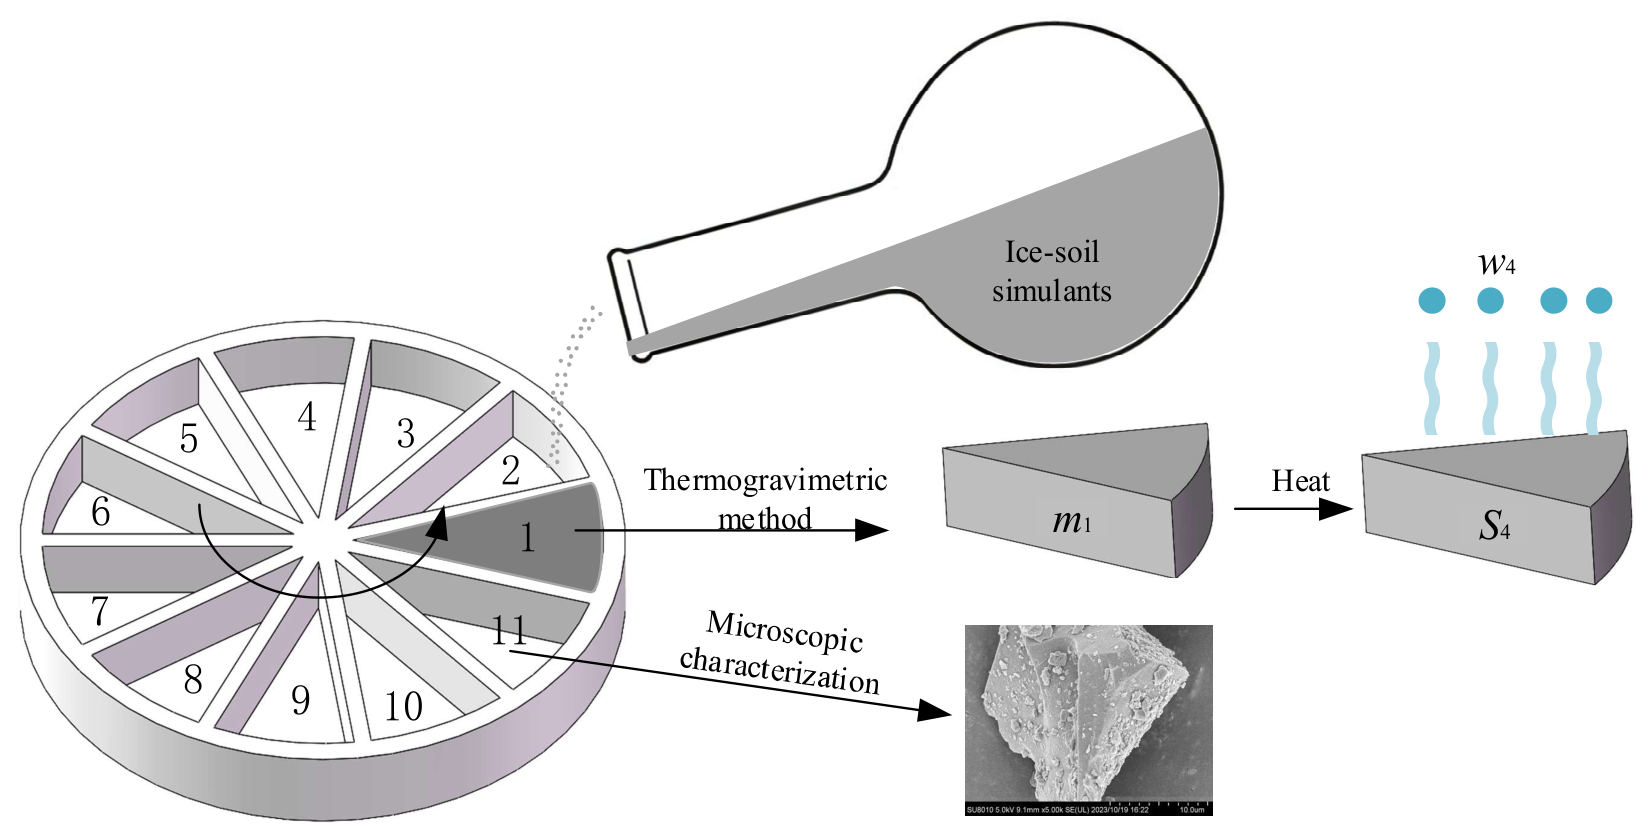
Each batch was divided into 11 portions according to the sampling scheme shown in Figure 10. Ten portions were analyzed by the oven-drying gravimetric, and the remaining portion was reserved for microscopic characterization. For presentation in Table 2, the ten measured water contents were sorted in ascending order separately within each batch. The reported ranks therefore do not correspond to the numbered sampling positions in Figure 10, and equal ranks in different batches do not identify a common spatial position.
Figure 10.
Sampling scheme for experimental samples. Positions 1–10 designate portions for thermogravimetric analysis; position 11 designates the portion for microscopic characterization. These spatial labels are distinct from the within-batch ranks used in Table 2.
Table 2.
Test results. Measured water contents for four independent preparation runs at the target of 0.5 wt%. Ranks 1–10 are ascending water-content ranks within each batch, not spatial positions. Statistics are calculated from the values displayed.
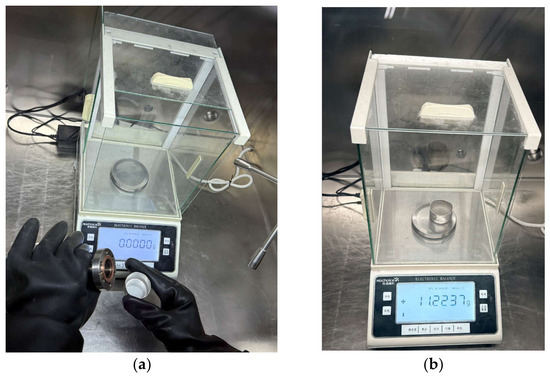
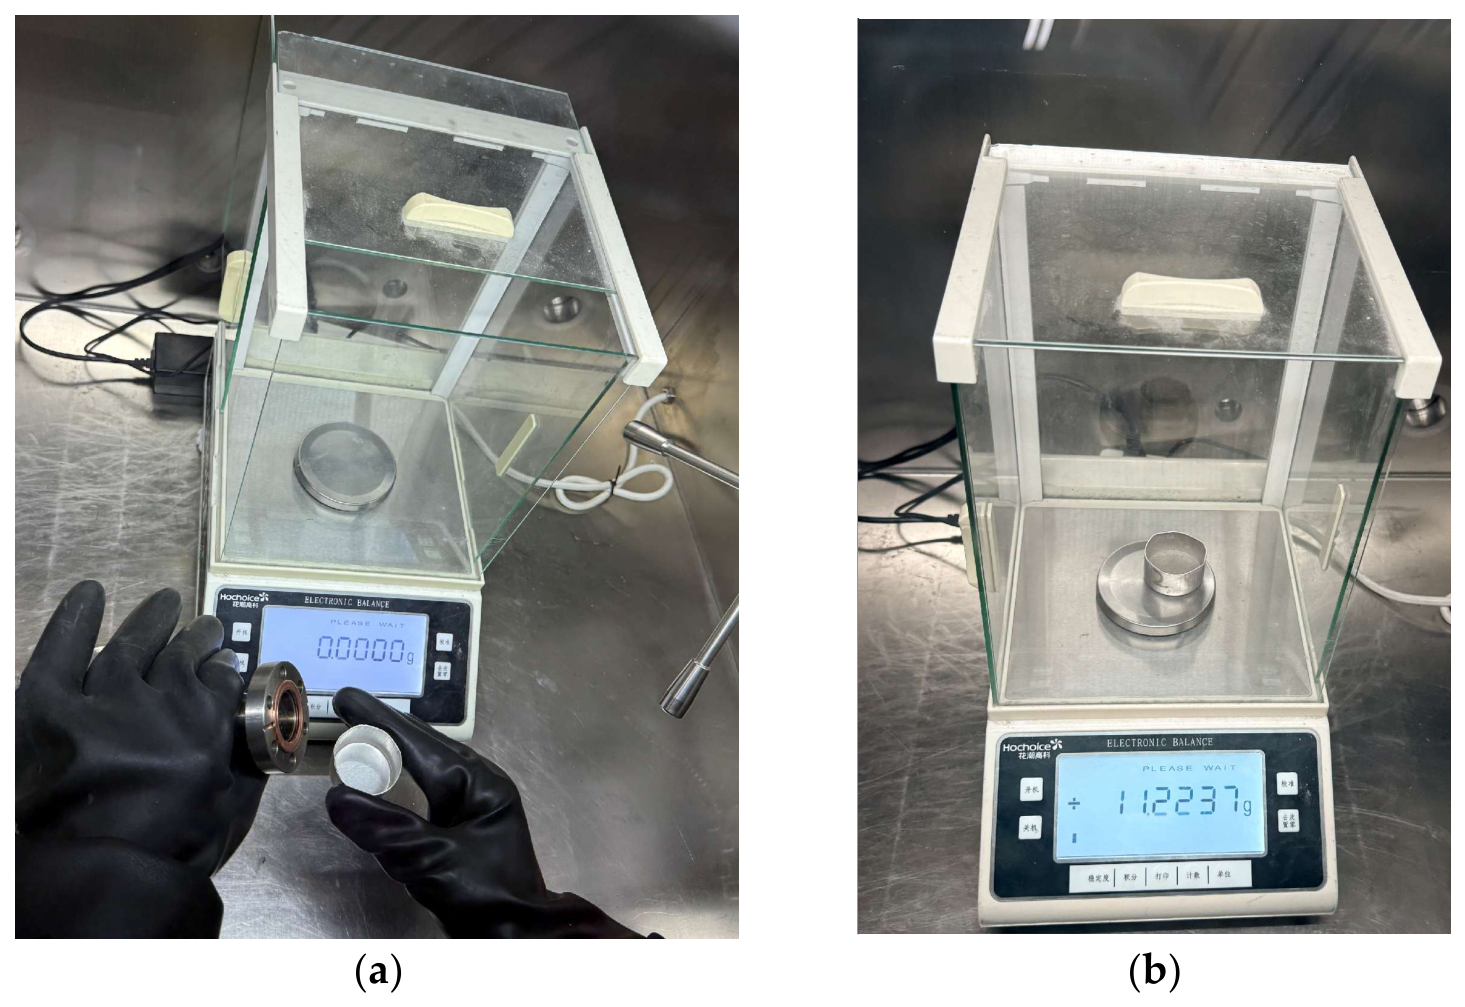
After the source ice had completely sublimated, the flask containing the ice-soil simulant was sealed and transferred, together with the liquid nitrogen bath, into an anhydrous, nitrogen-filled glove box. As shown in Figure 11, the sealing flange was removed inside the glove box, and the simulant was transferred into a pre-cooled container. Ten portions were collected according to the sampling scheme shown in Figure 10. Each portion, with an initial mass of approximately 4–6 g, was placed in an individual weighing container and weighed using an HC3204 balance (Huachao Gaoke, Shanghai, China) with a readability of 0.0001 g.
Figure 11.
(a) Disassemble the sealing flange; (b) weighing in the box.
After the initial masses of all ten portions had been recorded, the samples were heated in an electrically heated forced-air drying oven at a set temperature of 473 K for 2 h in ambient air. The samples were weighed directly after heating and water content was determined using this oven-drying gravimetric method and calculated on a dry-mass basis:
where mi and mf are the sample masses before and after heating, respectively, excluding the weighing container. The post-drying mass was used as the dry-mass reference. No repeated drying and weighing to verify constant mass, blank correction, or independent analytical repeatability assessment was performed.
2.4.6. Pressure Monitoring of Each Stage
The pressure measurements were not used to determine water capture efficiency or close the water mass balance. Water retained on apparatus surfaces and other water inventories or losses were not quantified separately. Consequently, neither the fraction of the initial water charge incorporated into the regolith nor the fraction retained elsewhere in the apparatus can be determined from the present measurements.
Given that the vapor deposition system operates under a low-pressure vacuum environment with rarefied gas molecules, and that the slow sublimation rate of water ice leads to low water vapor concentration and a low molecular collision frequency, the sublimation resistance primarily originates from the interfacial forces between water molecules and the solid surface. Therefore, this sublimation stage can be reasonably approximated as an equilibrium process. This relationship is expressed by the following equation:
where P represents the pressure (Pa); V the volume of gas (m3); T the temperature (K); n the amount of gas (mol); R the molar gas constant (J mol−1 K−1).
Based on the analysis of the formation principles of lunar polar ice-soil, a laboratory experiment for water molecule vapor deposition was proposed. Equipment was designed and constructed to prepare a sufficient quantity of simulated lunar ice and soil material, with the expectation of meeting the requirements of subsequent spectral experiments.
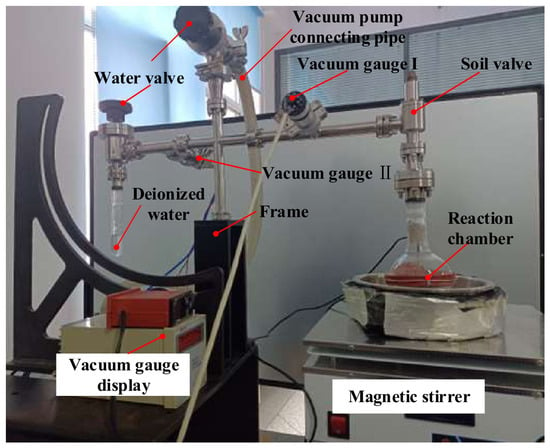
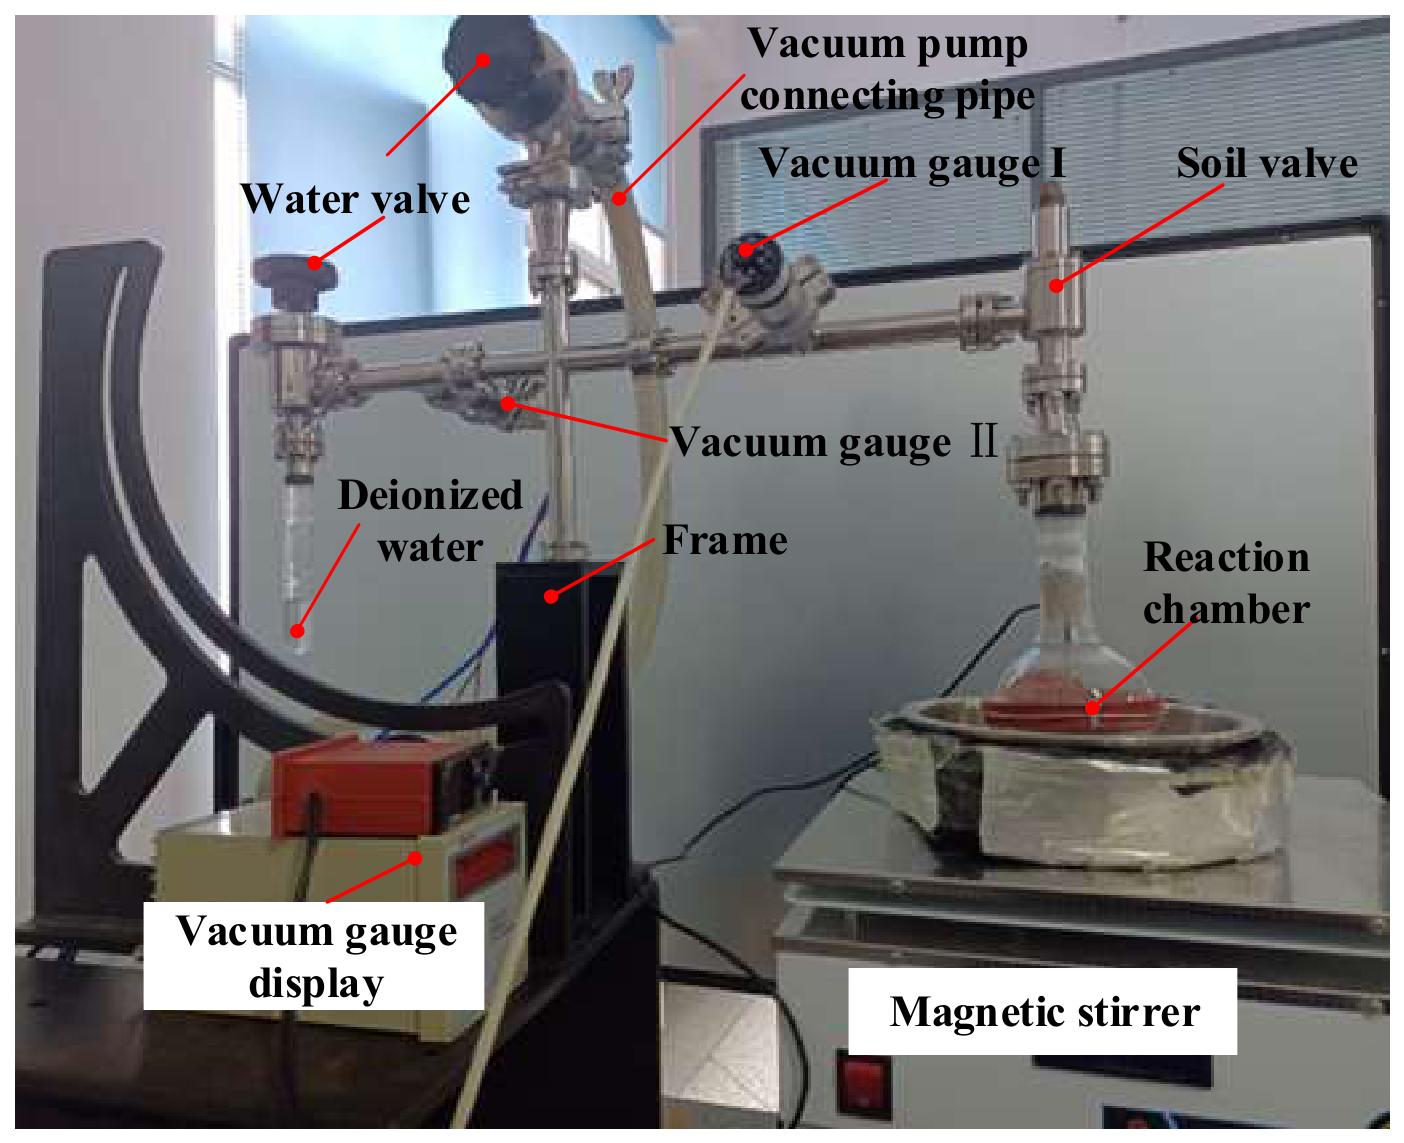
Figure 12 illustrates that the equipment primarily comprised a reaction chamber, vacuum valve, vacuum gauge, magnetic stirrer, and data acquisition system, among other components.
Figure 12.
Picture of the testing device.
Absolute drying stage
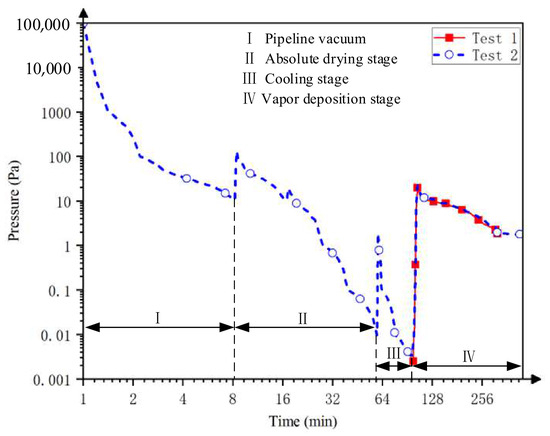
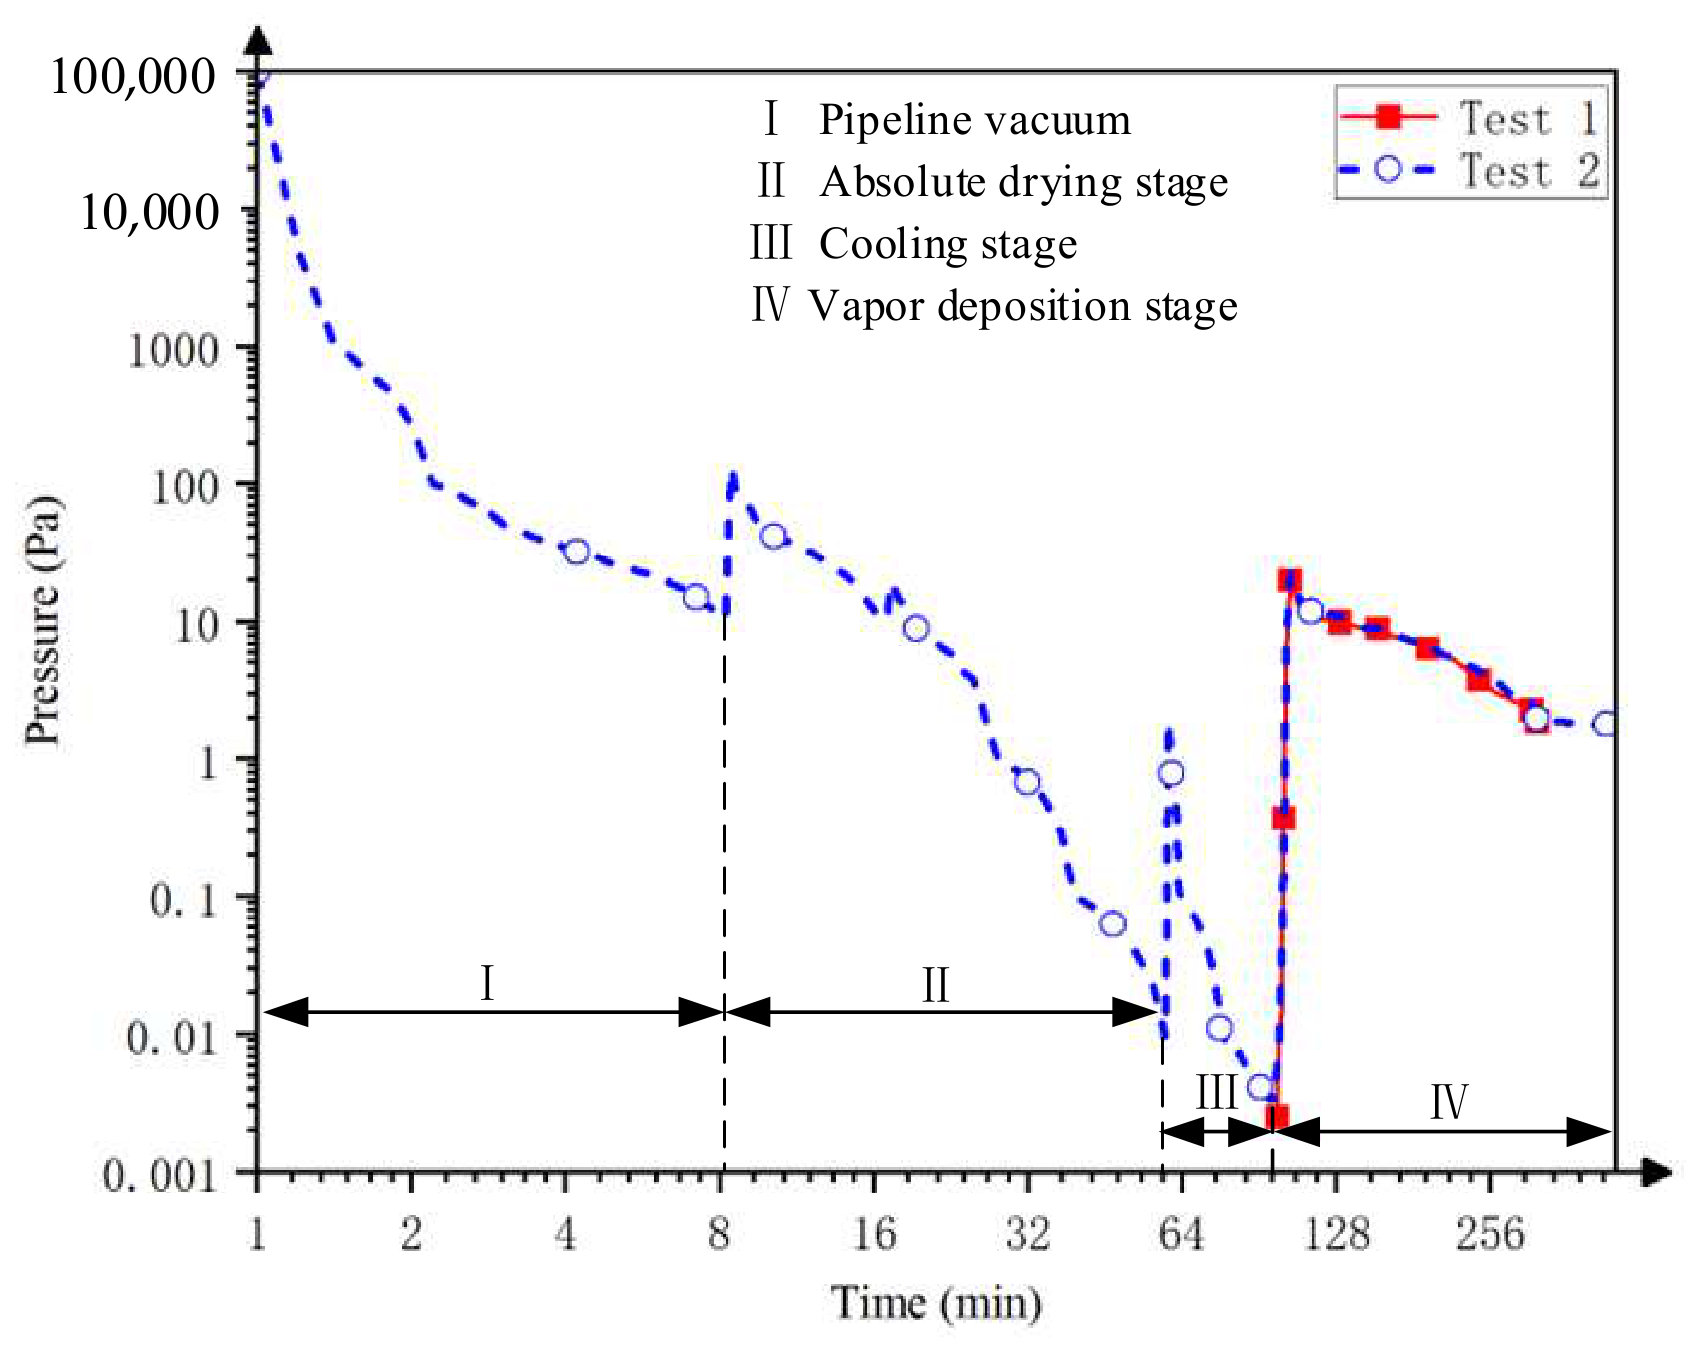
Pressure was monitored throughout sample preparation using a Pirani–cold-cathode composite vacuum gauge operated with its factory calibration. Gauge readings were recorded during evacuation, heating, cooling, and vapor deposition, as shown in Figure 13. The measurements are reported as indicated pressures without an H2O-specific sensitivity correction. The area I represents the pipeline gauge reading before the drying stage (Stage II). The soil valve was opened, and the water valve was closed, while a molecular pump was used to evacuate the system. During the vacuum-drying stage, the measured particle-bed temperatures actually measured during heating ranged from 473 to 550 K. These measurements represent the temperatures recorded during the process, whereas the 473 K specified in Section 2.4.2 refers to the heating setpoint. After 64 min of heating and evacuation, the indicated pressure decreased to approximately 0.01 Pa.
Figure 13.
Vacuum-gauge readings during preparation. The ordinate reports indicated pressure under factory calibration; no H2O-specific correction was applied. The curve is used to describe the operating stages and is not a quantitative record of water-vapor partial pressure.
Cooling stage
During this stage, a liquid nitrogen bath is used to cool the outside of the flask, thus cooling the dry simulated lunar soil to create a cold trap environment, known as Stage III. Simultaneously, the side containing deionized water undergoes cooling using a liquid nitrogen bath. After establishing the cold trap, a molecular pump vacuums the deionized water. When the indicated pressure reached 10−3 Pa, as shown in Figure 13, the molecular pump is turned off.
Vapor deposition stage
Once the cold trap was pre-set, the liquid nitrogen bath surrounding the source water ice was removed, allowing the ice to warm and sublimate. The resulting water vapor was supplied to the cooled, mechanically agitated regolith particles.
During sublimation of the source ice, the indicated pressure increased from approximately 0.1 Pa to 60 Pa and subsequently decreased to approximately 5–10 Pa, as shown in Figure 13 (Stage IV). During this stage, water vapor was supplied to the regolith particles in the cooled container.
Comparability among the four preparation runs was based on the use of the same apparatus configuration and nominal operating protocol. Each run used 100 g of regolith simulant, a nominal water charge of 0.5 g, a magnetic stirrer speed setting of 1200 rpm, and a deposition duration of 5 h. The stirring-bar geometry, source-to-sample arrangement, and cooling and source-warming procedures were kept unchanged between runs. These conditions provided a common operational basis for comparing the resulting samples. However, the water-vapor flux at the particle bed and the cumulative vapor exposure were not directly quantified. Equivalent vapor exposure between runs was therefore not established, and the results characterize preparation outcomes under the specified nominal conditions.
3. Results
The prepared samples were characterized using macroscopic and microscopic methods to determine water content and examine particle-surface morphology.
Microscopically, the sample was characterized using cryo-electron microscopy to examine surface features interpreted as deposited ice. These observations provide qualitative morphological evidence and do not quantify film thickness or water distribution throughout the batch.
Macroscopically, the oven-drying gravimetric was adopted, whereby the simulated object was placed in the oven-drying gravimetric to determine its water content through mass differences. This method provided evidence of the water in the simulated object.
LCROSS ejecta observations and subsequent modeling indicate water at the impact site, with inferred concentrations dependent on the assumed regolith properties [47]. Measurements from the Lunar Exploration Neutron Detector (LEND) aboard the Lunar Reconnaissance Orbiter (LRO) provided indirect constraints on hydrogen abundance in the lunar south polar region [48]. A nominal target water content of 0.5 wt% was selected for the preparation runs reported here. This value is a laboratory preparation target rather than a direct estimate of the water concentration at the LCROSS impact site. The four runs characterize a single low-water-content condition; preparation capability, stability, and the applicable range at higher target water contents, including 8 wt%, remain unverified.
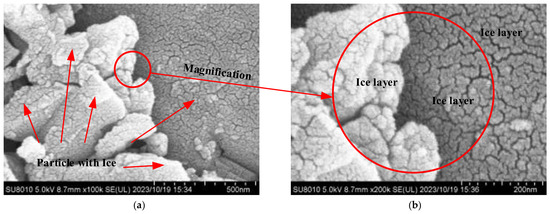
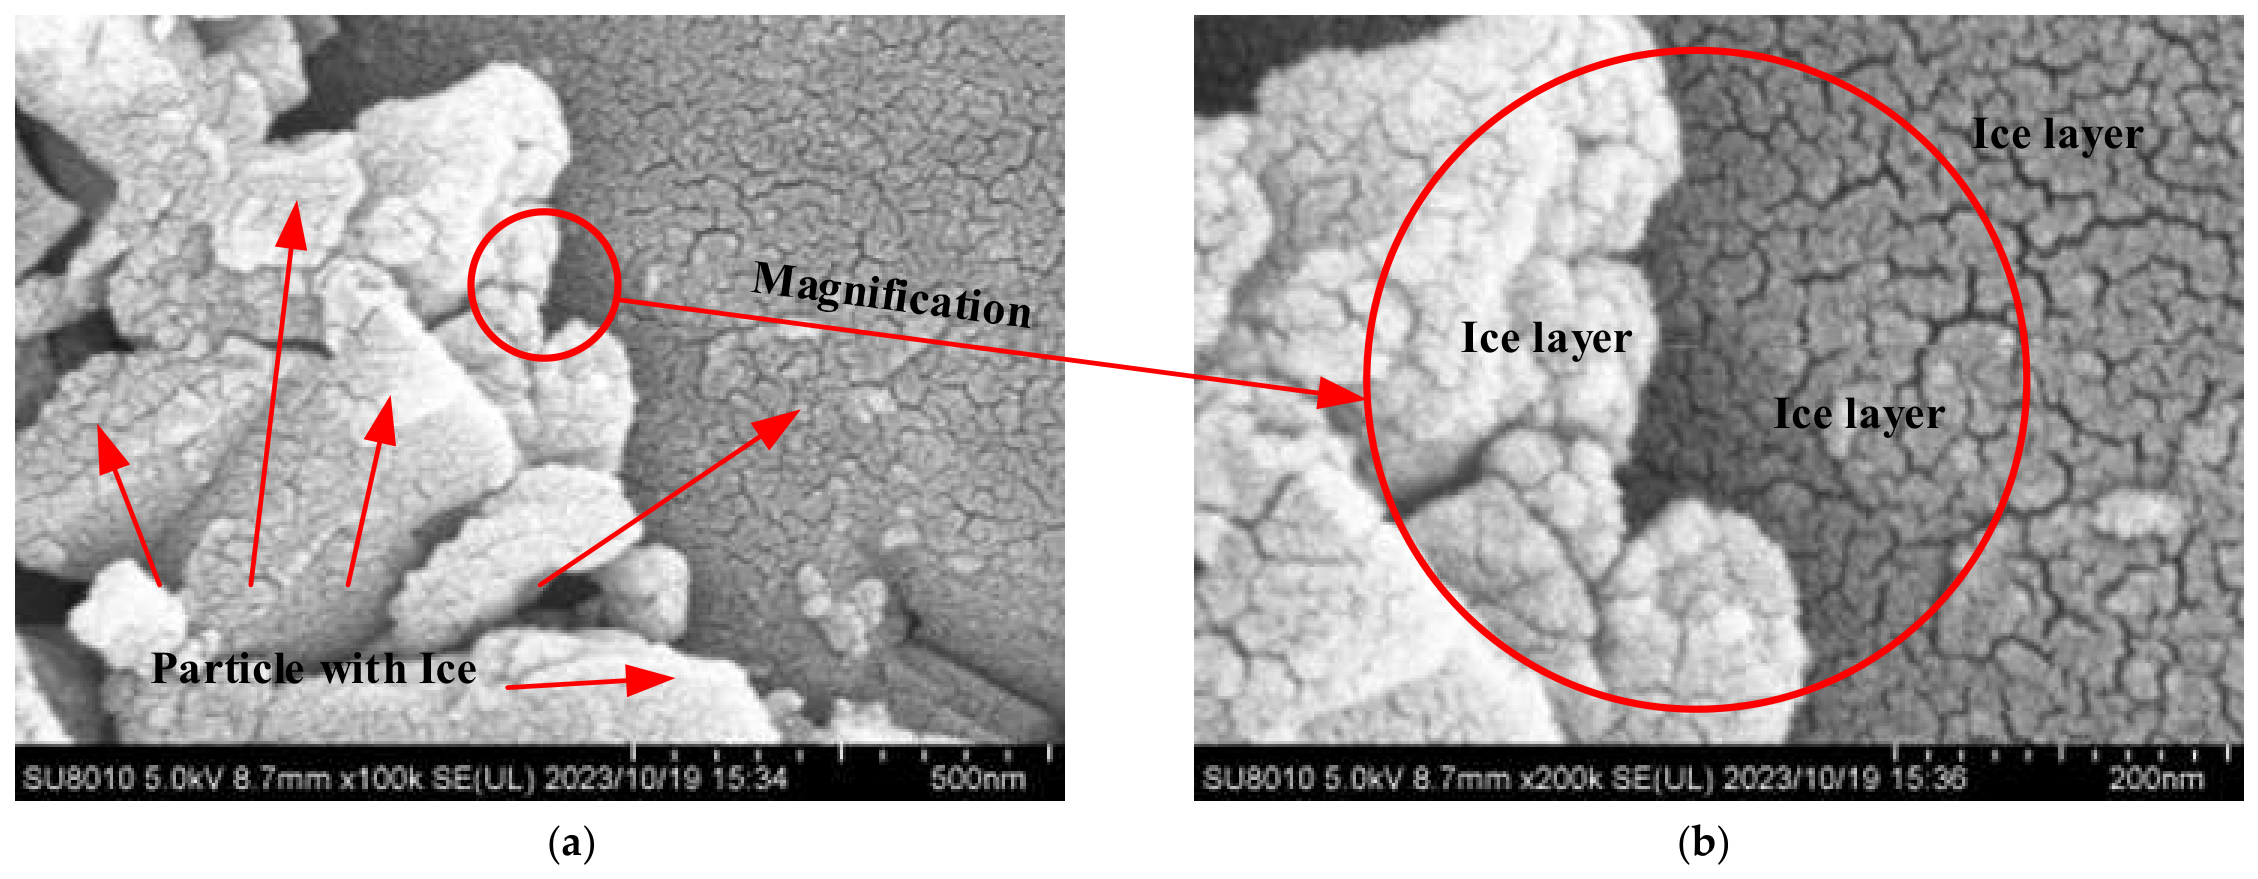
As presented in Figure 14a, the morphology of the ice film on the surface of the particles was observed using a cryo-electron microscope at a magnification of 100,000×. The figure clearly reveals the distribution of the water ice film across the surface of the particles, appearing as a bright coloration.
Figure 14.
Ice distribution on particle surface by flow-field overlap method: (a) 100,000× magnification; (b) 200,000× magnification.
As depicted in Figure 14b, the interface between dust particles for magnification observation was randomly selected. At a magnification of 200k, it is observed that the ice film formed by water molecules wraps around the edges of the dust particles, presenting a smooth contour.
For each batch, the mean measured water content was compared with the nominal target of 0.5 wt%. Within-batch variability was assessed from the ten portions analyzed by thermogravimetry. The batch mean, deviation from the target, and within-batch standard deviation describe different aspects of the preparation outcome.
According to the standard deviation Equation (4), the within-batch sample standard deviations for ice-soil simulants, target 0.5 wt% were calculated.
where xi is the water content of the sample; x is the average water content of the sample; and n = 10. The variation among independent batch means is evaluated separately in Section 4.2.
As shown in Table 2, four tests of lunar ice-soil material with 0.5 wt% water content yielded average values of 0.5072 wt%, 0.4981 wt%, 0.5444 wt%, and 0.5234 wt%, with corresponding standard deviations of 0.0593 wt%, 0.0572 wt%, 0.0658 wt%, and 0.0510 wt%, respectively. The agreement between the measured batch means and the nominal target characterizes the preparation outcomes under the tested conditions but does not demonstrate complete transfer of the initial water charge or establish the water capture efficiency.
4. Discussion
The performance testing of infrared spectral payloads involves measurements of the moisture content simulated ice-soil. Variation in water content within the simulants can affect spectral calibration. Characterizing this variation is therefore necessary before their suitability for a particular spectroscopic application can be assessed.
Although this study focuses on sample preparation and characterization rather than direct infrared spectroscopy, the implications of the measured water content variability for infrared-sensor calibration remain to be established. Variations in water–ice distribution can affect scattering and absorption within the sensor’s field of view, potentially complicating spectral interpretation. The present measurements quantify this variability under the tested preparation conditions; however, no infrared measurements or application-specific acceptance criteria are available to determine whether the samples meet calibration requirements. Detailed infrared characterization of these samples will be reported in subsequent studies. Furthermore, the environmental conditions during spectroscopic measurements, particularly stress states and thermal gradients, may influence the spectral signatures of ice films. In this context, combining the preparation protocol with the geotechnical magnetic–similitude–gravity model testing (GMMT)-based gravity simulation system [49,50] could support further investigation of ice-soil spectral properties under controlled stress and thermal conditions.
The following analysis distinguishes qualitative surface morphology, within-batch water-content dispersion, and variation among independent batch means.
4.1. Qualitative Comparison of the Surface Morphology of Particles at the Microscopic Level
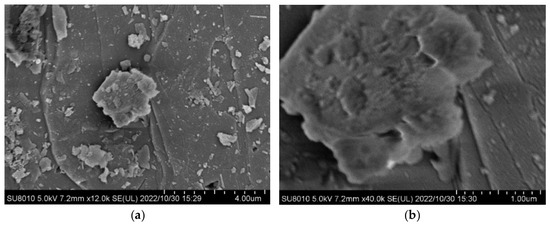
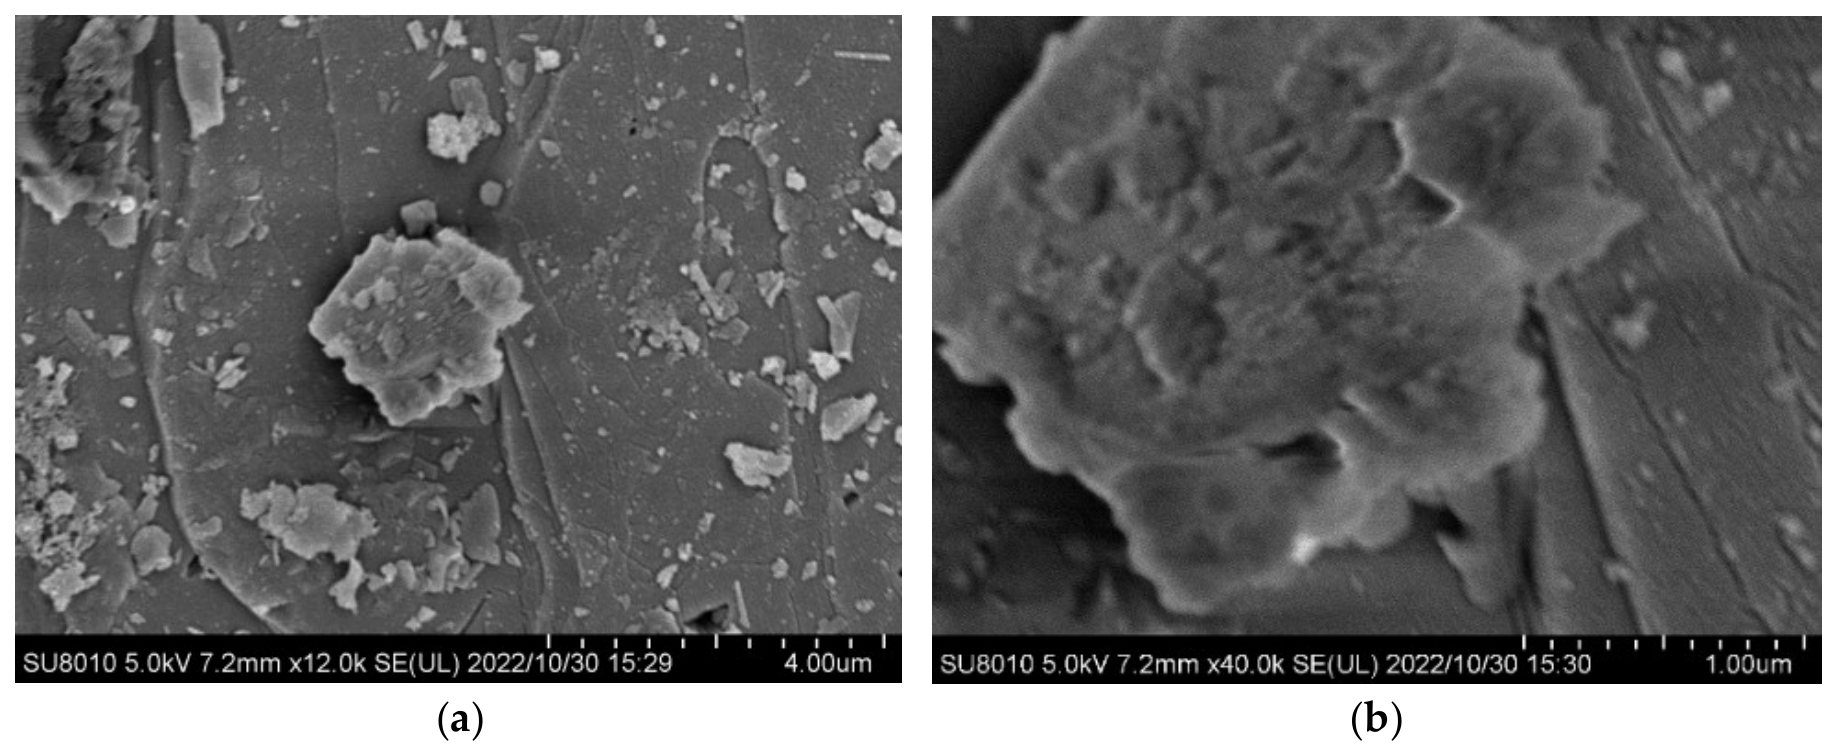
The microstructure of lunar soil particle simulants post-drying was evaluated. As depicted in Figure 15a,b, within the magnifications of 12k and 40k, the particle surfaces predominantly exhibited a gray hue. The particles featured smooth surfaces with distinct edges and a generally gray coloration. Scattered micro- and nano-level dust across the particle surfaces displayed inconspicuous bright colors, indicating that no significant ice film remained on the surfaces after drying.
Figure 15.
SEM images of lunar soil particles simulant after drying: (a) 12,000× magnification; (b) 40,000× magnification.
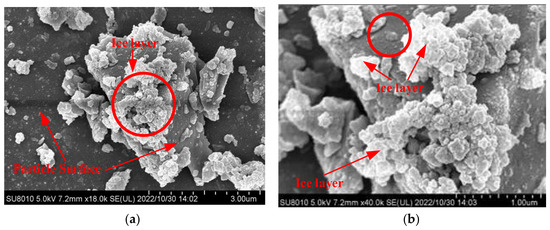
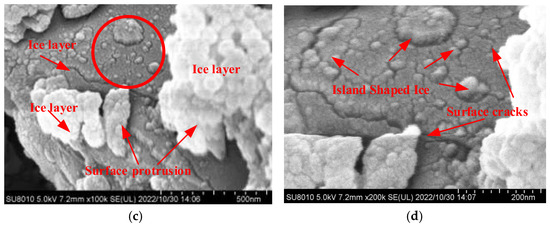
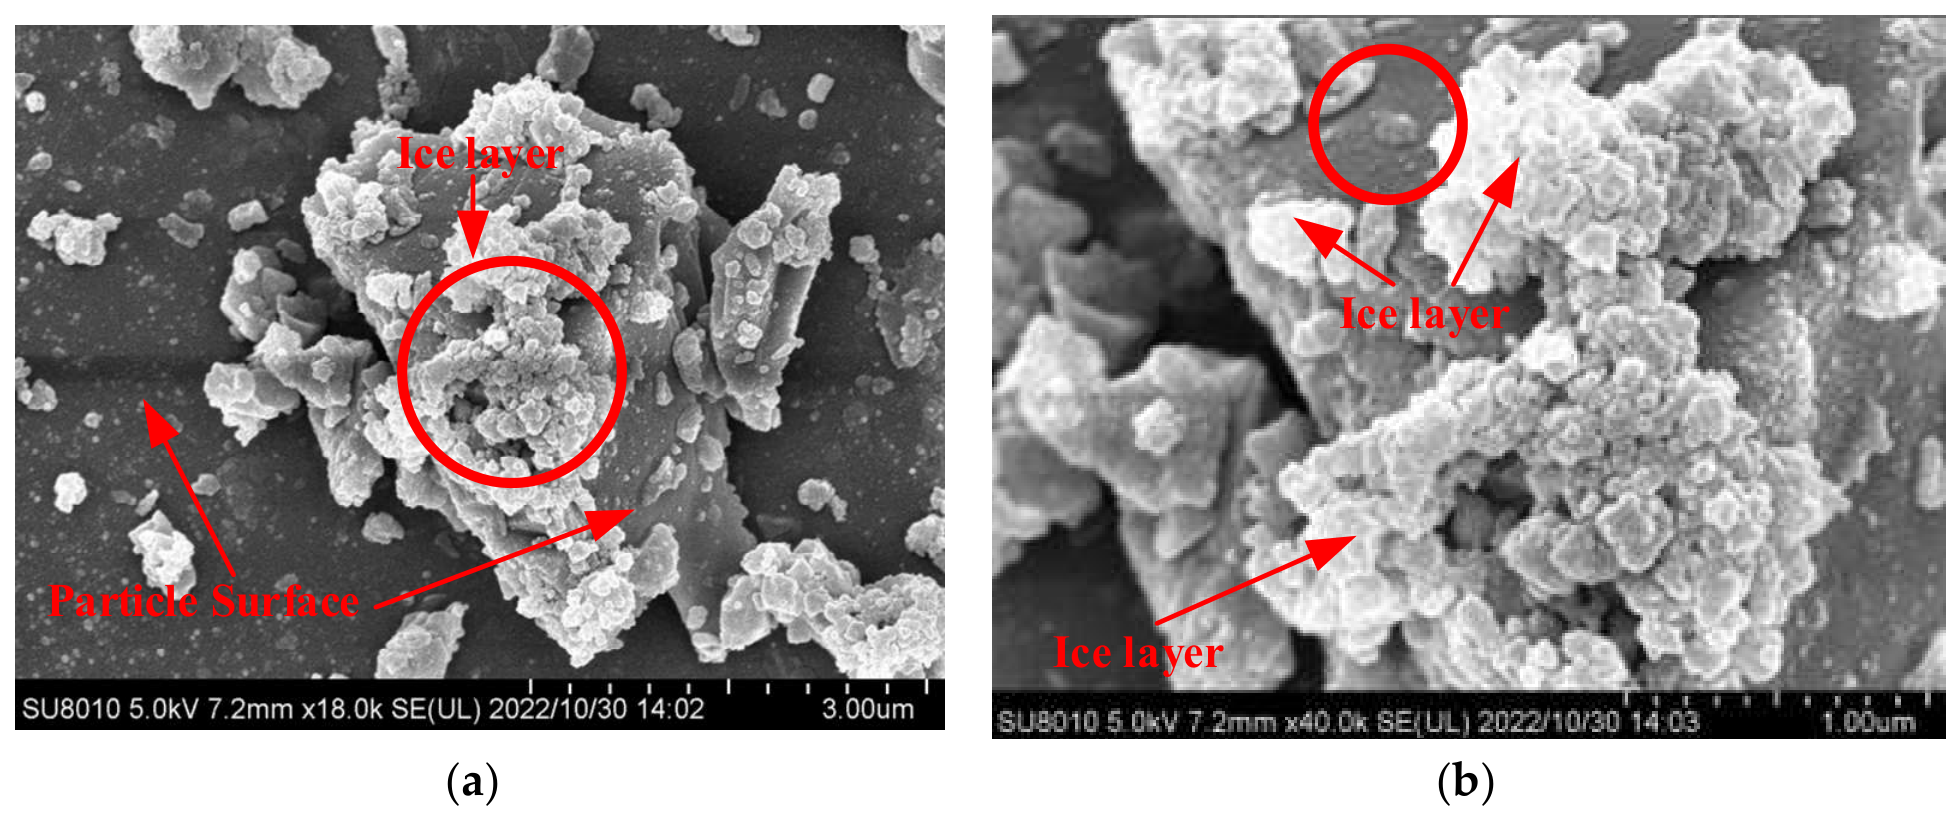
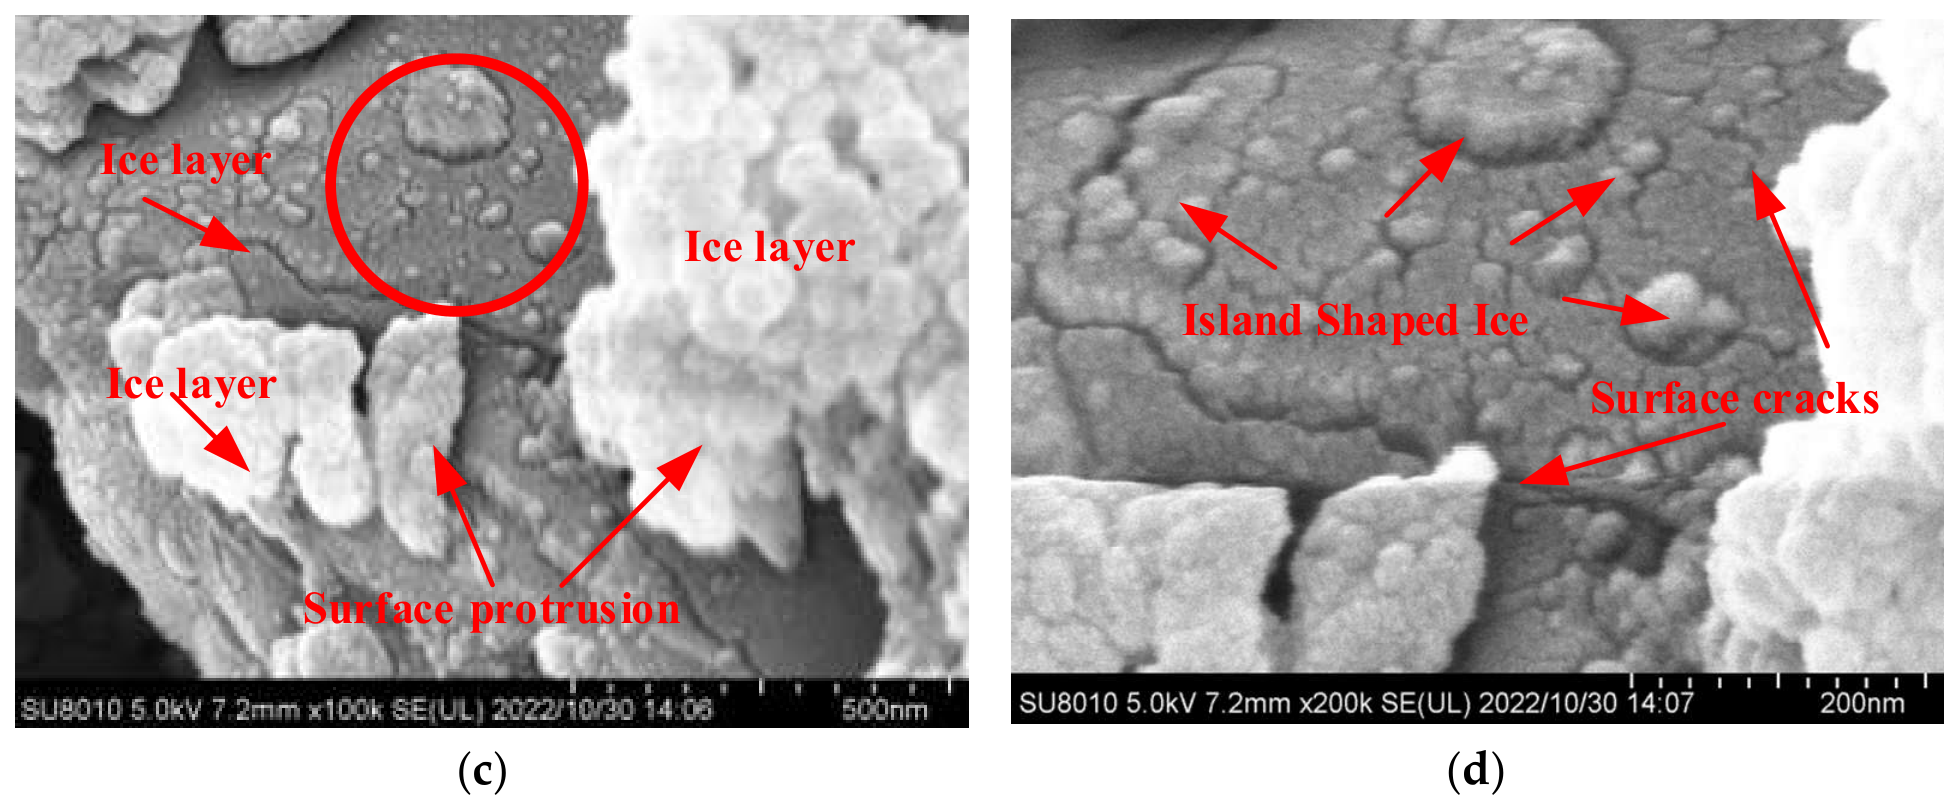
The microscopic characterization images in Figure 16a–c, which demonstrate frost layer samples simulated using a previously described method [28], reveal that ice aggregated at high structural barrier positions on the particle surfaces. The ice layers on flat particle surfaces were relatively thin and sparse, as observed in Figure 16b,c. Additionally, Figure 16d illustrates that the ice layer formed island-shaped formations with noticeable surface cracks.
Figure 16.
SEM images of the frost layer samples simulated by method of reference paper [28]: (a) 18,000× magnification; (b) 40,000× magnification; (c) 100,000× magnification; (d) 200,000× magnification.
The images of frost-layer samples prepared using the method described in Ref. [28] are included as a qualitative morphological reference. A controlled comparison with matched starting materials, water loading, thermal history, vapor exposure, particle-size distribution, and imaging conditions was not established in this study. The images also span different magnifications and selected fields of view. Consequently, the observed morphological differences cannot be attributed solely to the preparation method and do not establish the superiority of the present method.
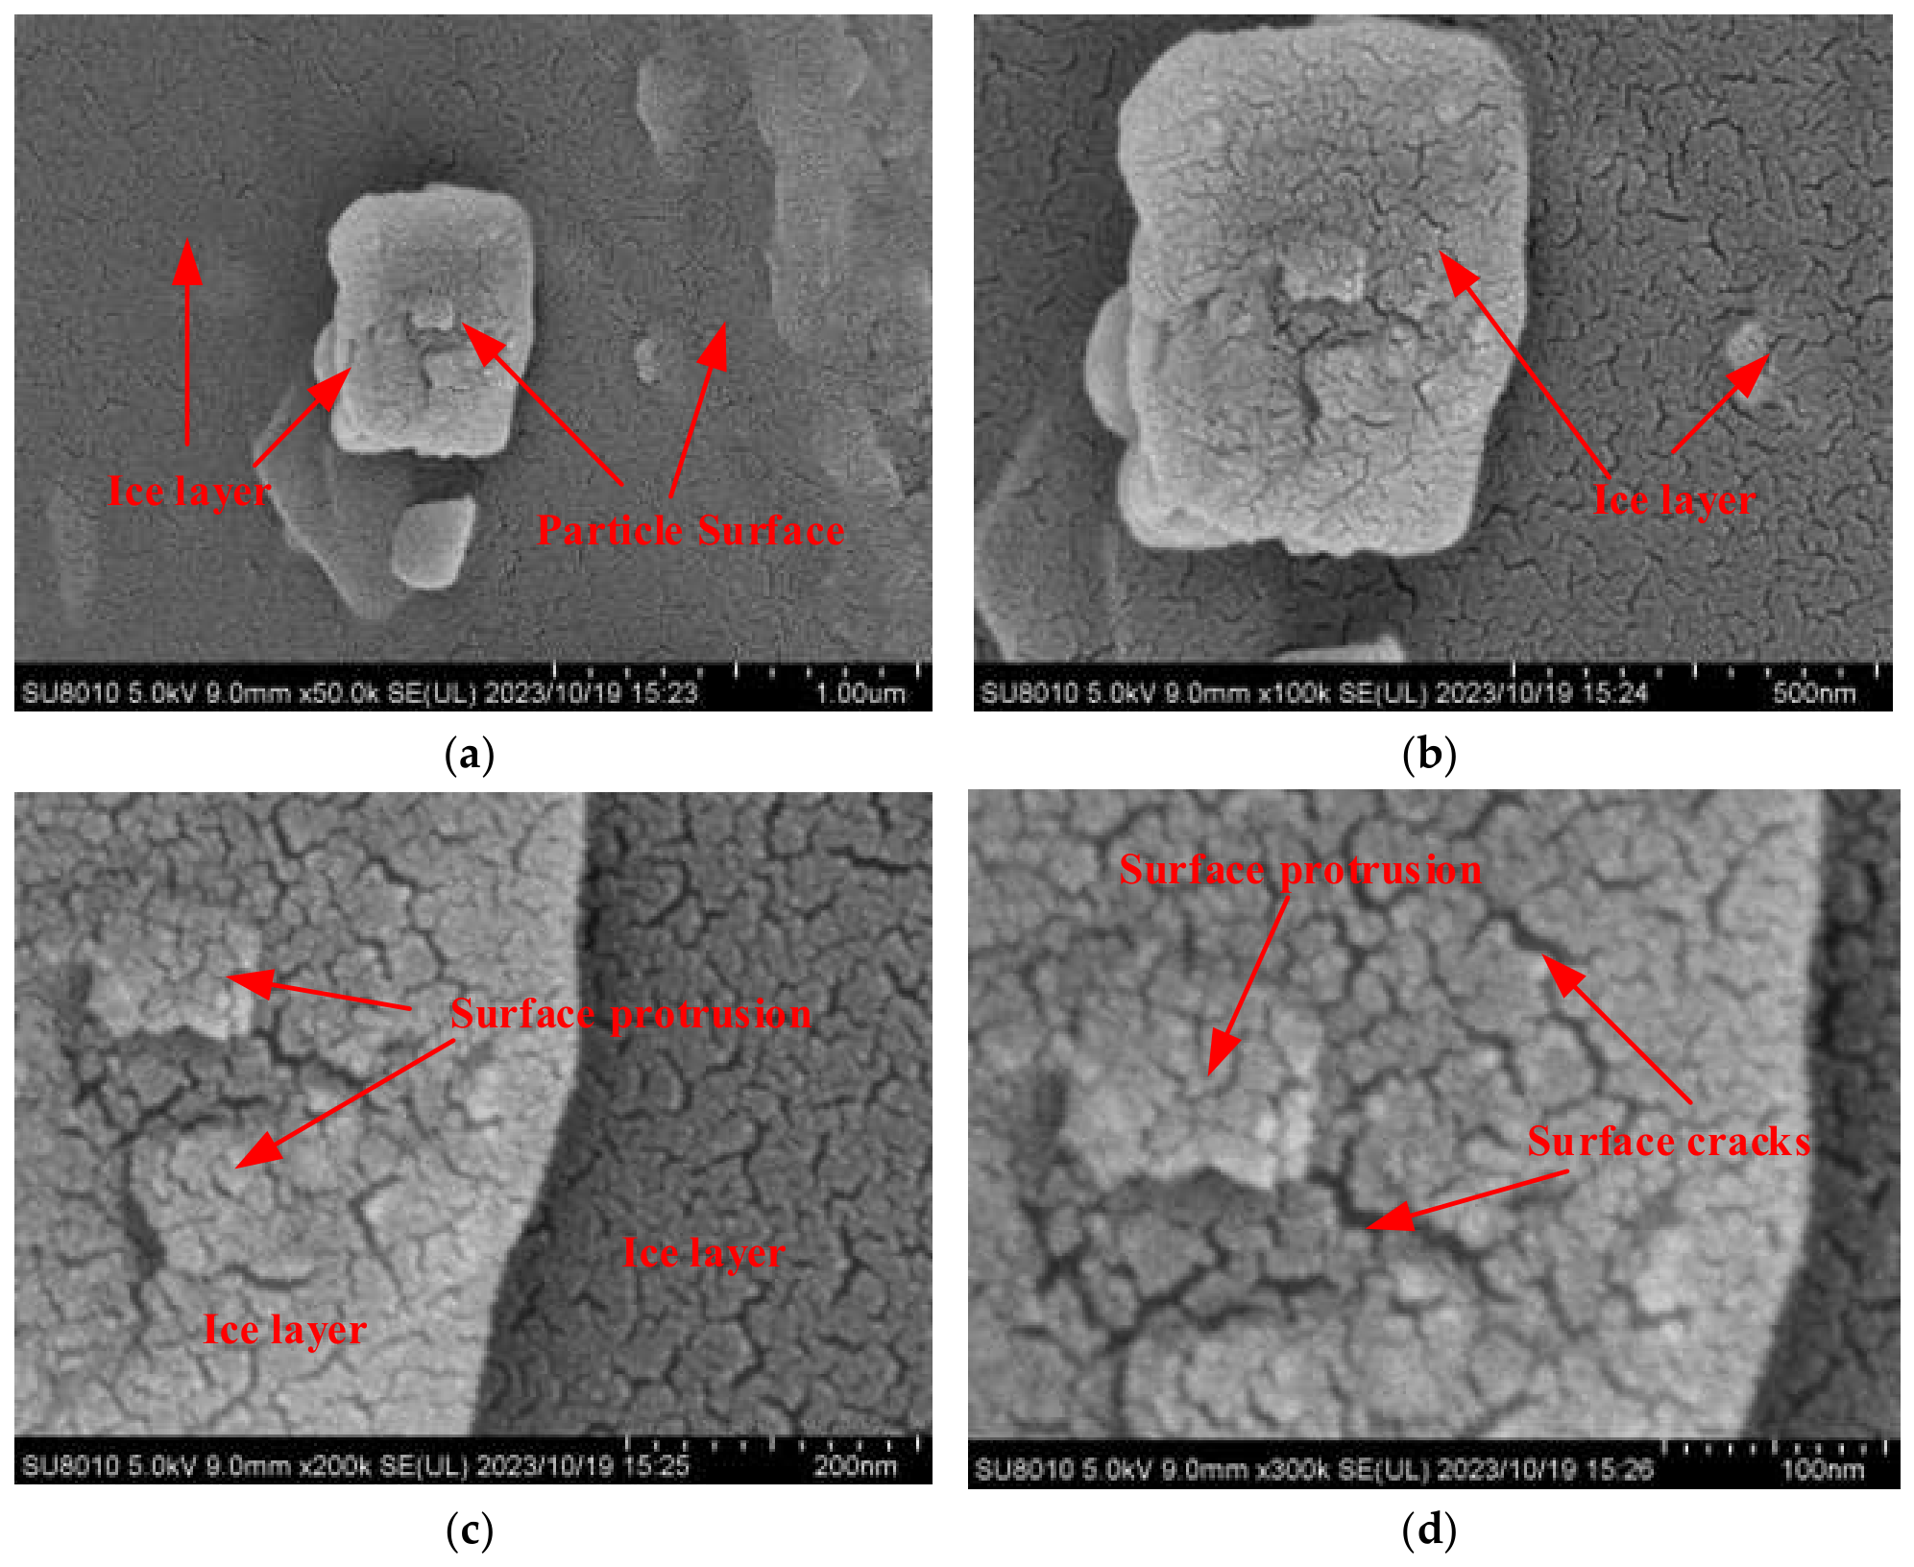
Samples prepared according to the method outlined in this study are depicted in Figure 17a–d. Surface features interpreted as ice films are visible in the selected fields of view. No pronounced ice accumulation is evident at the surface irregularities shown, but these local observations do not establish uniform coverage or film thickness across all particles.
Figure 17.
Particle-surface morphology after preparation by the flow-field overlap method: (a) 50,000× magnification; (b) 100,000× magnification; (c) 200,000× magnification; (d) 300,000× magnification.
Differences in crack appearance are visible between the selected images of the present samples and those of the frost-layer samples. However, these qualitative observations do not establish differences in film thickness or thickness uniformity, because film thickness was not quantified.
Mechanical agitation is intended to rotate and reorient particles during vapor exposure, allowing different surface regions to contact water vapor. The selected microscopic images provide qualitative observations of particle-surface morphology but do not establish equal vapor exposure, uniform film thickness, or uniform water distribution throughout the batch. Within-batch water-content variability is therefore evaluated separately using the oven-drying gravimetric measurements discussed in Section 4.2.
4.2. Error Analysis and Homogeneity Evaluation of Sample Water Content
Microscopic characterization methods enable visual observation of the state of the ice film on particle surfaces, thereby confirming the presence of the ice film. However, these methods cannot ascertain the uniformity of the internal water content within the sample composed of particle groups.
To verify the stability of the water content in the ice-soil simulants prepared using the flow-field overlap method, the macroscopic oven-drying gravimetric has been employed to measure the water content. Statistical methods were used to plot water content curves for each sampling point for comparative analysis.
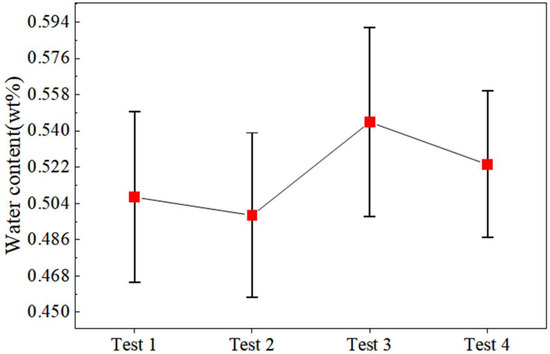
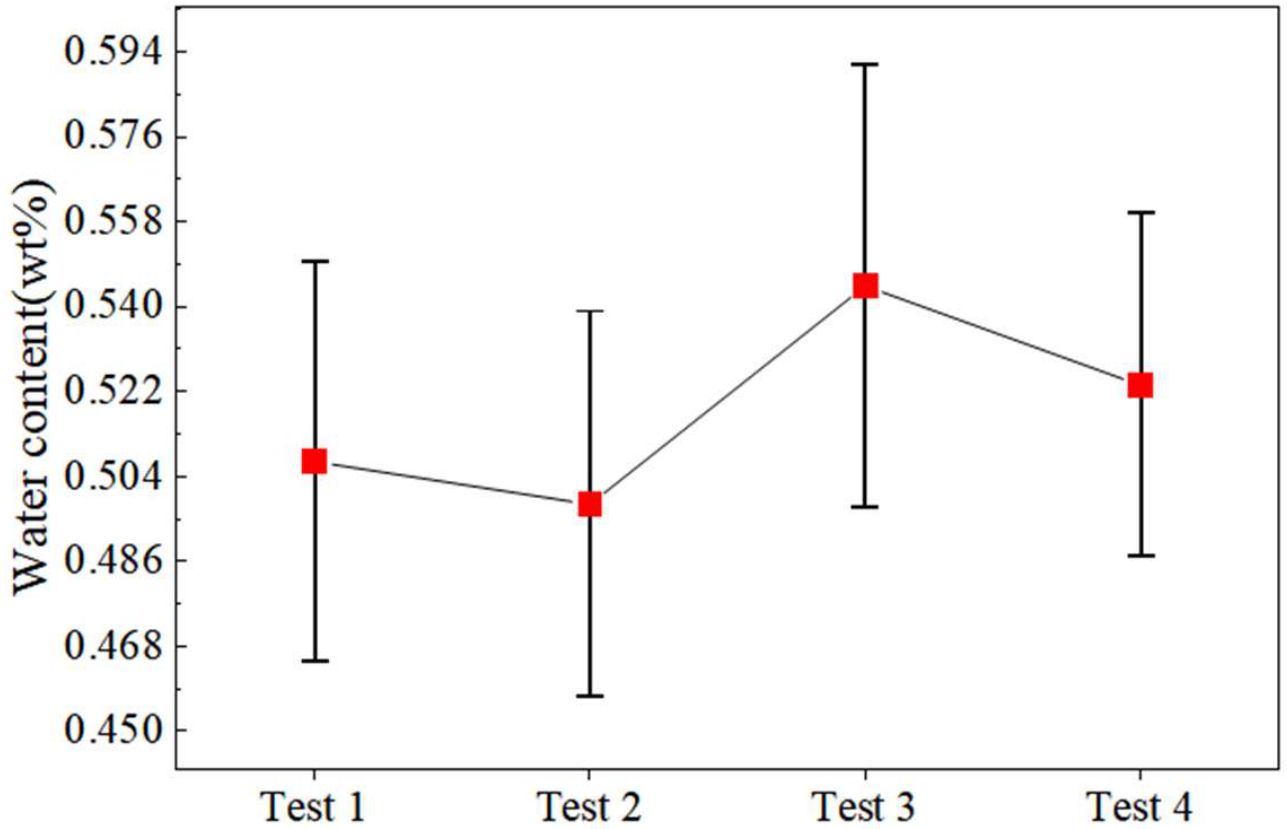
As Figure 18 illustrates, across the four independent preparation runs at the nominal target water content of 0.5 wt%, the batch mean water contents ranged from 0.4981 to 0.5444 wt%, and the within-batch sample standard deviations ranged from 0.0510 to 0.0658 wt%. Test 3 exhibited the largest within-batch standard deviation. These statistics describe the measured variability under the tested laboratory conditions; they do not establish whether this variability is acceptable for infrared sensor calibration.
Figure 18.
Mean water contents of the four independent preparation runs at a nominal target of 0.5 wt% on a dry-mass basis. Symbols represent the mean of ten measured portions per batch, and error bars indicate 95% confidence intervals for the batch means.
Table 3 presents the within-batch statistics calculated from the water contents of the ten portions analyzed in each preparation run. Table 4 summarizes between-batch variability based on the mean water content of each of the four independent runs.
Table 3.
Descriptive within-batch statistics calculated from the ten measured portions in each batch. The 95% confidence intervals refer to the mean water content of each batch.
Table 4.
Descriptive statistics of batch mean water contents from four independent preparation runs at the target water content of 0.5 wt%. The sample standard deviation refers to the four-batch means.
The Christensen uniformity coefficient (CH) was used as a descriptive indicator of dispersion in water content among the ten measured portions within each preparation run. Values closer to 1 indicate smaller absolute deviations from the batch mean relative to that mean. In this study, CH summarizes variability among the measured portions and is not used as an application-specific acceptance criterion or as evidence of suitability for infrared sensor calibration. The within-batch standard deviations describe variability among the measured portions, whereas the standard deviation of the four-batch means describes between-run variability in mean water content.
For the four independent preparation runs at a nominal target water content of 0.5 wt%, CH was calculated using Equation (5), and the water-content range was defined using Equation (6). As reported in Table 5, the CH values for Tests 1–4 were 0.901, 0.901, 0.913, and 0.921, respectively. These values describe the measured within-batch variability under the tested laboratory conditions.
where CH represents the Christensen coefficient of uniformity; wi represents the water content at each sampling point; w is the average water content; Rw is the maximum difference in water content; wmax is the maximum water content; and wmin is the minimum water content.
Table 5.
Christensen uniformity coefficient values.
5. Conclusions
Under the tested laboratory conditions, four independent preparation runs at a nominal target water content of 0.5 wt% were evaluated using oven-drying gravimetric measurements of ten portions per batch. These measurements characterized bulk water-content repeatability across runs and within-batch variability among the sampled portions. Cryo-electron microscopy provided complementary qualitative observations of particle-surface morphology.
A nominal target water content of 0.5 wt% on a dry-mass basis was selected to evaluate the preparation method under a specified laboratory condition. At the target water content of 0.5 wt%, the four independent preparation runs yielded mean water contents of 0.4981–0.5444 wt%. Within-batch sample standard deviations ranged from 0.0510 to 0.0658 wt%, whereas the sample standard deviation of the four-batch means was 0.0203 wt%. The Christensen coefficients were 0.901–0.921, and describe dispersion among the measured portions rather than spatial gradients.
The method combines mechanical agitation with water-vapor deposition, allowing particles to rotate and reorient during vapor exposure. The available results do not establish improved uniformity or preparation efficiency relative to conventional methods. Validation is limited to a nominal target of 0.5 wt%; performance at higher water contents, including 8 wt%, remains unverified. Water capture efficiency and the overall water mass balance were not determined, so quantitative control of water incorporation is not established. Uncorrected vacuum-gauge readings describe operating stages but do not quantify vapor concentration or water loss. Direct infrared measurements are required before the suitability of these simulants for spectroscopic calibration can be assessed.
Author Contributions
Conceptualization, Y.T. and J.T.; methodology, Z.L.; validation, Y.T. and W.Z.; formal analysis, S.C.; resources, A.L.; data curation, M.Z. (Meng Zou); writing—original draft preparation, M.Z. (Minghui Zhuang); project administration, S.J.; funding acquisition, Y.T. and J.T. All authors have read and agreed to the published version of the manuscript.
Funding
This research was funded by Provincial Key Research and Development (R&D) Plan Projects of Heilongjiang (No. 2024ZXDXB52). National Key R&D Program of China (No. 2025YFF0510801). Harbin University of Commerce Industrialization Project Support Plan (No. XL0092), China Postdoctoral Science Foundation (No. 2021M690828), Heilongjiang Postdoctoral (No. LBH-Z20145), and Self Planned Task (No. SKLRS202113B) of the State Key Laboratory of Robotics and System (HIT). Natural Science Foundation of Heilongjiang Province of China (No. PL2026E059, YQ2025E010).
Data Availability Statement
The raw data supporting the conclusions of this article will be made available by the authors on request.
Acknowledgments
During the preparation of this study, the authors used the lunar samples provided by the National Space Administration (lunar sample provided by China National Space Administration, NO. CE5C0600YJFM00404H).
Conflicts of Interest
The authors declare no conflicts of interest.
Abbreviations
The following abbreviations are used in this manuscript:
| PSRs | Permanently shadowed regions |
| ASW | Amorphous solid water |
| SEM | Scanning electron microscopy |
| CH | The Christensen uniformity coefficient |
| LCROSS | Lunar CRater Observation and Sensing Satellite |
| GMMT | Geotechnical magnetic–similitude–gravity model testing |
References
- Dobrzański, L.A. Significance of Materials Science for the Future Development of Societies. J. Mater. Process Technol. 2006, 175, 133–148. [Google Scholar] [CrossRef] [Scilit]
- McKay, D.S.; Heiken, G.; Basu, A.; Blanford, G.; Simon, S.; Reedy, R.; French, B.M.; Papike, J. The Lunar Regolith, in Lunar Sourcebook; Heiken, G.H., Vaniman, D.T., French, B.M., Eds.; Cambridge University Press: Cambridge, UK, 1991; pp. 285–356. [Google Scholar]
- Gu, J.P.; Qian, X.Y.; Liu, Y.W.; Wang, Q.G.; Zhang, Y.Y.; Ruan, X.; Deng, X.J.; Lu, Y.W.; Song, J.; Zhang, H.; et al. Charging Properties and Particle Dynamics of Chang’e-5 Lunar Sample in an External Electric Field. Engineering 2024, 42, 267–277. [Google Scholar] [CrossRef] [Scilit]
- Feldman, W.C.; Maurice, S.; Binder, A.B.; Barraclough, B.L.; Elphic, R.C.; Lawrence, D.J. Fluxes of Fast and Epithermal Neutrons from Lunar Prospector: Evidence for Water Ice at the Lunar Poles. Science 1998, 281, 1496–1500. [Google Scholar] [CrossRef] [Scilit]
- Jin, S.F.; Hao, M.N.; Guo, Z.N.; Yin, B.H.; Ma, Y.X.; Deng, L.J.; Chen, X.; Song, Y.P.; Cao, C.; Chai, C.; et al. Evidence of a Hydrated Mineral Enriched in Water and Ammonium Molecules in the Chang’e-5 Lunar Sample. Nat. Astron. 2024, 8, 1127–1137. [Google Scholar] [CrossRef] [Scilit]
- Colaprete, A.; Schultz, P.; Heldmann, J.; Wooden, D.; Shirley, M.; Ennico, K.; Hermalyn, B.; Marshall, W.; Ricco, A.; Elphic, R.C.; et al. Detection of Water in the LCROSS Ejecta Plume. Science 2010, 330, 463–468. [Google Scholar] [CrossRef] [Scilit]
- Mandt, K.E.; Mousis, O.; Hurley, D.; Bouquet, A.; Retherford, K.D.; Magaña, L.O.; Luspay-Kuti, A. Exogenic Origin for the Volatiles Sampled by the Lunar CRater Observation and Sensing Satellite Impact. Nat. Commun. 2022, 13, 642. [Google Scholar] [CrossRef] [Scilit]
- Zhou, C.J.; Tang, H.; Li, X.Y.; Zeng, X.J.; Mo, B.; Yu, W.; Wu, Y.X.; Zeng, X.D.; Liu, J.Z.; Wen, Y.Y. Chang’E-5 Samples Reveal High Water Content in Lunar Minerals. Nat. Commun. 2022, 13, 5336. [Google Scholar] [CrossRef] [Scilit]
- Licandro, J.; Campins, H.; Kelley, M.; Hargrove, K.; Pinilla-Alonso, N.; Cruikshank, D.; Rivkin, A.S.; Emery, J. (65) Cybele: Detection of Small Silicate Grains, Water-Ice, and Organics. Astron. Astrophys. 2011, 525, A34. [Google Scholar] [CrossRef] [Scilit]
- Flahaut, J.; van der Bogert, C.H.; Crawford, I.A.; Vincent-Bonnieu, S. Scientific Perspectives on Lunar Exploration in Europe. npj Microgravity 2023, 9, 50. [Google Scholar] [CrossRef] [Scilit]
- Wu, Y.Z.; Hapke, B. Spectroscopic Observations of the Moon at the Lunar Surface. Earth Planet. Sci. Lett. 2018, 484, 145–153. [Google Scholar] [CrossRef] [Scilit]
- Verma, P.A.; Chauhan, M.; Chauhan, P. Lunar Surface Temperature Estimation and Thermal Emission Correction Using Chandrayaan-2 Imaging Infrared Spectrometer Data for H2O & OH Detection Using 3 μm Hydration Feature. Icarus 2022, 383, 115075. [Google Scholar] [CrossRef] [Scilit]
- Kloos, J.L.; Moores, J.E.; Godin, P.J.; Cloutis, E. Illumination Conditions within Permanently Shadowed Regions at the Lunar Poles: Implications for in-Situ Passive Remote Sensing. Acta Astronaut. 2021, 178, 432–451. [Google Scholar] [CrossRef] [Scilit]
- Basilevsky, A.T.; Keller, H.U.; Nathues, A.; Mall, U.; Hiesinger, H.; Rosiek, M. Scientific Objectives and Selection of Targets for the SMART-1 Infrared Spectrometer (SIR). Planet. Space Sci. 2004, 52, 1261–1285. [Google Scholar] [CrossRef] [Scilit]
- Piquette, M.; Horányi, M.; Stern, S.A. Laboratory Experiments to Investigate Sublimation Rates of Water Ice in Nighttime Lunar Regolith. Icarus 2017, 293, 180–184. [Google Scholar] [CrossRef] [Scilit]
- KopystyńSki, J.L.; Maeno, N. Ice/Rock Porous Mixtures: Compaction Experiments and Interpretation. J. Glaciol. 1993, 39, 643–655. [Google Scholar] [CrossRef] [Scilit][Green Version]
- Yoldi, Z.; Pommerol, A.; Jost, B.; Poch, O.; Gouman, J.; Thomas, N. VIS-NIR Reflectance of Water Ice/Regolith Analogue Mixtures and Implications for the Detectability of Ice Mixed within Planetary Regoliths. Geophys. Res. Lett. 2015, 42, 6205–6212. [Google Scholar] [CrossRef] [Scilit]
- Atkinson, J. Penetration investigations in lunar regolith and simulants. In Handbook of Space Resources, 1st ed.; Badescu, V., Zacny, K., Bar-Cohen, Y., Eds.; Springer Nature: San Diego, CA, USA, 2023; Volume 15, pp. 521–579. [Google Scholar] [CrossRef] [Scilit]
- Yang, K.; Schmidt, J.; Feng, W.M.; Liu, X.D. Distribution of Dust Ejected from the Lunar Surface into the Earth-Moon System. Astron. Astrophys. 2022, 659, A120. [Google Scholar] [CrossRef] [Scilit]
- Liu, J.W.; Wang, E.L.; Tian, Y.; Liu, X.C.; Tang, L.; Cui, J.L.; Tao, L.J.; Ge, T.L.; Lu, Z.X.; Zhang, W.W.; et al. Fabric simulation and mechanical characteristics test and analysis of icy lunar regolith. J. Deep. Space Expl. 2022, 9, 134–140. [Google Scholar] [CrossRef]
- Liu, J.W.; Zhang, W.W.; Tian, Y.; Tao, L.J.; Li, P.; Jiang, S.Y. Analysis and Prediction of Uniaxial Compressive Strength of Icy Lunar Regolith under Extreme Temperature. Adv. Space Res. 2022, 69, 4391–4407. [Google Scholar] [CrossRef] [Scilit]
- Pitcher, C.; Kömle, N.; Leibniz, O.; Morales-Calderon, O.; Gao, Y.; Richter, L. Investigation of the Properties of Icy Lunar Polar Regolith Simulants. Adv. Space Res. 2016, 57, 1197–1208. [Google Scholar] [CrossRef] [Scilit]
- Pitcher, C.; Gao, Y. Analysis of Drill Head Designs for Dual-Reciprocating Drilling Technique in Planetary Regoliths. Adv. Space Res. 2015, 56, 1765–1776. [Google Scholar] [CrossRef] [Scilit]
- Ogishima, A.; Saiki, K. Development of a Micro-Ice Production Apparatus and NIR Spectral Measurements of Frosted Minerals for Future Lunar Ice Exploration Missions. Icarus 2021, 357, 114273. [Google Scholar] [CrossRef] [Scilit]
- Baragiola, R.A. Water Ice on Outer Solar System Surfaces: Basic Properties and Radiation Effects. Planet. Space Sci. 2003, 51, 953–961. [Google Scholar] [CrossRef] [Scilit]
- Cartwright, J.H.E.; Escribano, B.; Sainz-Díaz, C.I. Ice Films Follow Structure Zone Model Morphologies. Thin Solid Films 2010, 518, 3422–3427. [Google Scholar] [CrossRef] [Scilit]
- Murphy, D.M.; Koop, T. Review of the Vapour Pressures of Ice and Supercooled Water for Atmospheric Applications. Q. J. R. Meteor. Soc. 2005, 131, 1539–1565. [Google Scholar] [CrossRef] [Scilit]
- Tian, Y.; Tang, J.Y.; Jiang, S.Y.; Zhang, W.W.; Pang, Y.; Jiang, J.H.; Liu, Z.H.; Li, Y.; Zou, M.; Wang, D.S. Lunar Regolith Water Ice Simulation Method and Characterization. Icarus 2024, 417, 116119. [Google Scholar] [CrossRef] [Scilit]
- Šļumba, K.; Sargeant, H.M.; Britt, D.T. Development of Icy Regolith Simulant for Lunar Permanently Shadowed Regions. Adv. Space Res. 2024, 73, 3222–3234. [Google Scholar] [CrossRef] [Scilit]
- Wache, H.; Kiewiet, L.; Zabel, P.; Blum, J. Investigation of the Thermal Conductivity of Dry and Icy Lunar Regolith Simulants. J. Geophys. Res. 2025, 130, e2025JE009084. [Google Scholar] [CrossRef] [Scilit]
- Kreuzig, C.; Bischoff, D.; Molinski, N.S.; Brecher, J.N.; Kovalev, A.; Meier, G.; Oesert, J.; Gorb, S.N.; Gundlach, B.; Blum, J. Micrometre-Sized Ice Particles for Planetary Science Experiments—CoPhyLab Cryogenic Granular Sample Production and Storage. RAS Tech. Instrum. 2023, 2, 686–694. [Google Scholar] [CrossRef] [Scilit]
- Katagiri, J.; Matsushima, T.; Yamada, Y.; Tsuchiyama, A.; Nakano, T.; Uesugi, K.; Ohtake, M.; Saiki, K. Investigation of 3D grain shape characteristics of lunar soil retrieved in Apollo 16 using image-based discrete-element modeling. J. Aerosp. Eng. 2015, 28, 04014092. [Google Scholar] [CrossRef] [Scilit]
- Li, C.L.; Hu, H.; Yang, M.-F.; Pei, Z.-Y.; Zhou, Q.; Ren, X.; Liu, B.; Liu, D.W.; Zeng, X.G.; Zhang, G.L.; et al. Characteristics of the Lunar Samples Returned by the Chang’E-5 Mission. Natl. Sci. Rev. 2021, 9, nwab188. [Google Scholar] [CrossRef] [Scilit]
- Wilkerson, R.P.; Rickman, D.L.; McElderry, J.R.; Walker, S.R.; Cannon, K.M. On the Measurement of Shape: With Applications to Lunar Regolith. Icarus 2024, 412, 115963. [Google Scholar] [CrossRef] [Scilit]
- Zhang, H.; Zhang, X.; Zhang, G.; Dong, K.Q.; Deng, X.J.; Gao, X.S.; Yang, Y.D.; Xiao, Y.; Bai, X.; Liang, K.X.; et al. Size, Morphology, and Composition of Lunar Samples Returned by Chang’E-5 Mission. Sci. China Phys. Mech. Astron. 2021, 65, 229511. [Google Scholar] [CrossRef] [Scilit]
- Wang, S.Y.; Jiang, M.J. Lunar regolith simulations with discrete element method based on Chang’e-5 mission’s lunar soil particle morphology. Chin. J. Geotech. Eng. 2024, 46, 833–842. [Google Scholar] [CrossRef]
- Zhang, Z.H.; Chi, G.X.; Tang, J.Y.; Jiang, S.Y.; Tian, Y.; Zhang, W.W.; Liu, Z.H. Soil Flow Behavior in Baffled Rotary Drum Based Icy Lunar Regolith Simulant Preparation. Powder Technol. 2025, 451, 120460. [Google Scholar] [CrossRef] [Scilit]
- Sunshine, J.M.; A’Hearn, M.F.; Groussin, O.; Li, J.-Y.; Belton, M.J.S.; Delamere, W.A.; Kissel, J.; Klaasen, K.P.; McFadden, L.A.; Meech, K.J.; et al. Exposed Water Ice Deposits on the Surface of Comet 9P/Tempel 1. Science 2006, 311, 1453–1455. [Google Scholar] [CrossRef] [Scilit]
- Hendrix, A.R.; Hurley, D.M.; Farrell, W.M.; Greenhagen, B.T.; Hayne, P.O.; Retherford, K.D.; Vilas, F.; Cahill, J.T.S.; Poston, M.J.; Liu, Y. Diurnally Migrating Lunar Water: Evidence from Ultraviolet Data. Geophys. Res. Lett. 2019, 46, 2417–2424. [Google Scholar] [CrossRef] [Scilit]
- Hayne, P.O.; Greenhagen, B.T.; Foote, M.C.; Siegler, M.A.; Vasavada, A.R.; Paige, D.A. Diviner Lunar Radiometer Observations of the LCROSS Impact. Science 2010, 330, 477–479. [Google Scholar] [CrossRef] [Scilit]
- He, C.D.; Li, Y.S.; Wen, Z.; Zhang, X.; Yin, Z.H. Research progress of lunar surface water ice detection and occurrence form. Vac. Cryog. 2021, 27, 589–600. [Google Scholar] [CrossRef]
- Li, Y.S.; Wen, Z.; He, C.D.; Wei, Y.J.; Gao, Q. The Mechanism for the Barrier of Lunar Regolith on the Migration of Water Molecules. J. Geophys. Res. Planets 2023, 128, e2022JE007254. [Google Scholar] [CrossRef] [Scilit]
- Lin, H.L.; Li, S.; Xu, R.; Liu, Y.; Wu, X.; Yang, W.; Wei, Y.; Lin, Y.T.; He, Z.P.; Hui, H.; et al. In Situ Detection of Water on the Moon by the Chang’E-5 Lander. Sci. Adv. 2022, 8, eabl9174. [Google Scholar] [CrossRef] [Scilit]
- Du, Y.; Sheng, L.Y.; Zhang, H.; Ma, J.N.; Zhang, H.; Li, F.; Wu, K. Analysis of the occurrence mode of water ice on the moon and the prospect of in-situ lunar exploration. Spacecr. Environ. Eng. 2019, 36, 607–614. [Google Scholar]
- Williams, J.-P.; Mahanti, P.; Robinson, M.S.; Wagner, R.V.; Chertok, M.; Schörghofer, N.; Mazarico, E.; Denevi, B.W.; Li, S.; Paige, D.A. The Fausini permanently shadowed region on the Moon. Planet. Sci. J. 2024, 5, 209. [Google Scholar] [CrossRef] [Scilit]
- Ehrenfreund, P.; Fraser, H.J.; Blum, J.; Cartwright, J.H.E.; García-Ruiz, J.M.; Hadamcik, E.; Levasseur-Regourde, A.C.; Priceg, S.; Prodih, F.; Sarkissian, A. Physics and chemistry of icy particles in the universe: Answers from microgravity. Planet. Space Sci. 2003, 51, 473–494. [Google Scholar] [CrossRef] [Scilit]
- Luchsinger, K.M.; Chanover, N.J.; Strycker, P.D. Water within a Permanently Shadowed Lunar Crater: Further LCROSS Modeling and Analysis. Icarus 2021, 354, 114089. [Google Scholar] [CrossRef] [Scilit]
- Mitrofanov, I.G.; Sanin, A.B.; Boynton, W.V.; Chin, G.; Garvin, J.B.; Golovin, D.; Evans, L.G.; Harshman, K.; Kozyrev, A.S.; Litvak, M.L.; et al. Hydrogen mapping of the lunar south pole using the LRO neutron detector experiment LEND. Science 2010, 330, 483–486. [Google Scholar] [CrossRef] [Scilit]
- Li, R.L.; Zhou, G.Q.; Yan, K.; Jun, C.; Chen, D.Q.; Cai, S.Y.; Mo, P.Q. Preparation and characterization of a specialized lunar regolith simulant for use in lunar low gravity simulation. Int. J. Min. Sci. Technol. 2022, 32, 1–15. [Google Scholar] [CrossRef] [Scilit]
- Li, R.L.; Chen, J.; Zhang, J.R.; Chen, D.Q.; Zhao, X.D.; Mo, P.Q.; Zhou, G.Q. Cone penetration resistance of CUMT-1 lunar regolith simulant under magnetic-similitude lunar gravity condition. Acta Geotech. 2023, 18, 6725–6744. [Google Scholar] [CrossRef] [Scilit]



Disclaimer/Publisher’s Note: The statements, opinions and data contained in all publications are solely those of the individual author(s) and contributor(s) and not of MDPI and/or the editor(s). MDPI and/or the editor(s) disclaim responsibility for any injury to people or property resulting from any ideas, methods, instructions or products referred to in the content. |
© 2026 by the authors. Licensee MDPI, Basel, Switzerland. This article is an open access article distributed under the terms and conditions of the Creative Commons Attribution (CC BY) license.