


Abstract
Accurate prediction and inversion of time-dependent gap deformation between a passenger aircraft door and its frame remain difficult under slowly varying pressurization because the response is governed by coupled geometry, lock restraint, and nonlinear contact. This study develops a digital-twin-driven inversion framework for door–frame gap deformation. A physics-based parametric twin is established using feature associations and a unified assembly datum, and the outer skin, stiffeners, load-bearing frame, inner panel, locks, and door frame are represented in a nonlinear quasi-static finite-element model. Geometric nonlinearity and a separable door–frame contact are retained so that load-dependent opening, local slip, and constraint effects can be captured. A full-scale test platform with binocular vision provides three-directional relative-displacement measurements. The numerical model is updated through equivalent-stiffness correction, local nodal adjustment, and global scaling, with physical restrictions imposed on the adjustable region and correction amplitudes to avoid unconstrained point-wise fitting; corrected simulation and experimental data are then fused for surrogate training. An improved Gaussian process regression model uses the normalized pressure level, spatial coordinates of the registered key-point pairs, and displacement-direction encoding as inputs and the corresponding fused directional gap displacement as the output; a squared-exponential kernel and input-dependent noise model represent nonlinear response and uncertainty. Under an identical within-profile training–validation partition, the reported GPR implementation yields lower aggregate error than the corresponding RBF-NN and random-forest benchmark runs, with a root-mean-square error of 0.21, a mean relative error of 2.8%, and a coefficient of determination of 0.985. These metrics quantify interpolation within the calibrated slowly varying quasi-static loading domain rather than validated extrapolation to an independent unseen load history. The framework provides a mechanism-consistent route for virtual–physical updating and surrogate-based inversion of aircraft door–frame gap states.
1. Introduction
Passenger aircraft doors are primary load-carrying structures in fuselage-opening regions. Under the combined action of cabin pressurization and other time-varying loads, the clearance between the door and its frame evolves dynamically. From the perspective of structural safety, a nonuniform gap distribution can cause abnormal local contact and stress concentration, thereby reducing the load-carrying capacity of the assembly. From the perspective of sealing performance, excessive gap deformation may lead to cabin-pressure leakage and, in severe cases, endanger occupant safety. Characterizing the deformation of the door–frame gap is therefore important for improving structural safety margins and ensuring reliable sealing performance.
Existing approaches for inverting passenger aircraft door-gap deformation can be broadly classified into analytical-model-based methods, finite-element-based methods, ground-test and measurement-data-driven methods, and digital-twin-based methods.
Analytical-model-based approaches derive the displacement and gap variation at critical door locations by establishing local or global equilibrium equations and incorporating elasticity, contact mechanics, and geometric constraints [1,2,3]. Three representative routes are commonly adopted. The first is an analytical deflection method based on thin-walled structural bending theory, in which typical boundary conditions, such as simply supported, clamped, or partially constrained edges, are imposed on plate or shell differential equations to estimate gap changes caused by torsion, bending, and pressure differential. The formulation of Amirpour et al. [4] relies strongly on idealized geometry and boundary assumptions and is therefore difficult to apply accurately to structures with complex constraints and material nonuniformity. The inverse finite-element method reported by Khalid et al. [5] is sensitive to sensor density and measurement quality; noise contamination or insufficient measurement points can introduce inversion error and reduce reconstruction stability. The second route is the Rayleigh–Ritz method based on energy variation, which approximates the displacement field by constructing a total-potential-energy functional and selecting suitable trial functions. Kumar [6] systematically reviewed its application to static, dynamic, and buckling analyses of beams, plates, and shells, showing that solution accuracy and convergence depend markedly on the choice of trial functions. Stamatelos and Labeas [7] applied the method to buckling analysis of anisotropic stiffened laminates; however, trial-function construction becomes increasingly difficult for complex stiffener configurations and strongly anisotropic material distributions, and exact satisfaction of boundary conditions remains challenging. The third route is a simplified dynamic method based on modal superposition, in which dominant deformation modes under different excitation patterns are extracted and superposed to reconstruct the surrounding deformation field. Nieto et al. [8] showed that modal-participation-factor-based reduced-order models can efficiently identify dominant modes and rapidly approximate structural responses, but modal truncation may neglect higher-order contributions and reduce accuracy under complex or transient loading. Bouckaert et al. [9] further improved modal superposition for structures containing discontinuities; nevertheless, truncation errors may remain significant when strong local nonlinearities or enhanced modal coupling are present.
Finite-element-based inversion methods construct high-fidelity three-dimensional numerical models to simulate door-gap deformation under representative operating conditions and establish a mapping among load, structural response, and gap variation for unknown-condition inversion [10,11,12]. Three implementation strategies are frequently used. First, multi-condition static simulations fit displacement responses under representative load combinations to generate condition–gap response surfaces. Fiačan et al. [13] focused primarily on static conditions and did not fully account for time-varying loads or dynamic coupling during flight, which limits the prediction of gap evolution in complex service environments. Chen et al. [14] relied on discrete representative conditions, which cannot completely cover a continuously varying high-dimensional load space; moreover, response-surface accuracy and extrapolation capability may deteriorate as the number of parameters increases. Second, sensitivity-based or gradient-based inversion methods solve a sensitivity matrix that relates gap response to structural parameters or loads. Yang and Peng [15] reported that reduced-order finite-element sensitivity results are strongly influenced by linearity assumptions and parameter-perturbation ranges, particularly under strong nonlinearity or large deformation. Jiang et al. [16] applied sensitivity analysis to reliability optimization of an aircraft door-lock mechanism, but constructing the sensitivity matrix is computationally expensive and may become ill-conditioned as parameter dimensionality and load complexity increase. Third, reduced-order modeling extracts dominant deformation features and constructs a low-dimensional gap-response model. Mufti et al. [17] proposed a multi-fidelity reduced-order framework for high-dimensional inputs, although its accuracy depends on consistency between the high- and low-fidelity datasets. Medeiros et al. [18] compared several reduction techniques for a large-deformation wing box and showed that a truncated set of dominant modes may not fully represent the structural response.
Ground-test and measurement-data-driven methods learn response patterns under different loads, attitudes, and boundary conditions from historical samples and thereby construct empirical or statistical inversion frameworks driven by physical measurements [19,20,21]. One route extracts features, suppresses noise, and performs regression on large test datasets to map load and strain variables to characteristic gap features. Yan et al. [22] used dimension-reduction-based regression to extract key features and predict responses from multisource data, but the method remains dependent on assumptions of linear correlation. Duma et al. [23] introduced kernel methods to improve nonlinear feature representation, although overfitting and instability may occur. A second route uses machine learning to fuse multisource measurements, including displacement, strain, and temperature, and directly maps observed responses to gap deformation. Visser et al. [24] proposed strain-gauge-based compensation for digital image correlation, but its data-driven capability is limited for direct high-dimensional nonlinear inversion of complex structural gaps. Mallya et al. [25] reviewed DIC applications in aerospace structural health monitoring and identified continuing limitations associated with illumination, measurement noise, and computational cost, all of which can impair generalization.
A digital twin is treated here as an updatable virtual representation of a physical structure that maintains correspondence among the physical entity, its physics-based model, measurement data, and the evolving structural state. In structural monitoring and model updating, this concept therefore extends a stand-alone finite-element model by incorporating measurement registration, calibration, uncertainty treatment, and predictive or inverse inference. In aerospace applications, recent digital-twin studies have demonstrated online deformation prediction, full-field reconstruction, structural-strength assessment, and deformation monitoring through continuous virtual–physical updating [26,27,28,29,30]. These developments position the digital twin as a mechanism for connecting physics-based simulation with measured structural response rather than as a static numerical replica.
Against this background, this study develops a digital-twin-driven inversion method for the gap deformation of a passenger aircraft door–frame assembly under time-varying loading. The novelty lies not in introducing finite-element analysis, data fusion, or Gaussian process regression individually but in their problem-specific integration. First, a unified-datum, feature-associated parametric twin is established so that geometry, assembly relationships, and functional components can be updated coherently. Second, a hierarchical physics-preserving update combines equivalent-stiffness correction, local nodal adjustment, and global scaling to reconcile sparse full-scale measurements with the finite-element displacement field while retaining the principal load-transfer mechanism. Third, an uncertainty-aware Gaussian process inversion model is trained on fused virtual–physical data; its input-dependent noise description and covariance-weighted inverse inference are used to represent nonlinear load–structure–gap mapping and reduce sensitivity to locally uncertain data. The resulting workflow couples mechanics-based modeling and experimental feedback with surrogate-based probabilistic inversion within the calibrated quasi-static operating domain. Independent validation under a completely different load history remains necessary before extrapolation to unseen operational profiles or real-time deployment can be claimed.
2. High-Fidelity Parametric Modeling of the Passenger Aircraft Door–Frame Assembly
To support rapid design and iterative updating of the door–frame model, a feature-association and unified-datum parameter-driven strategy is adopted, as illustrated in Figure 1. A key geometric parameter system, including dimensional, shape, and spatial-position parameters, is first defined to generate the basic geometric features. Geometric constraints and mathematical expressions are then used to establish dependencies among the parameters. Together with a unified assembly datum defined by the fuselage-opening and the door-lock system, these relations enable parametric representation and automatic updating of the complete door–frame model.
Figure 1.
Parametric modeling workflow for the passenger aircraft door–frame assembly.
For direct traceability between mathematical symbols and the physical assembly, Table 1 summarizes the principal geometric and assembly parameters, their physical meaning, specification or governing relation, and structural location. The notation in the subsequent equations is kept consistent with this summary.
Table 1.
Summary of principal geometric and assembly parameters used in the parametric door–frame model.
A unified and complete geometric parameter system is required for parametric modeling of the passenger aircraft door–frame structure. According to structural characteristics and engineering significance, the parameters are divided into three groups. Dimensional parameters describe the basic scales of the fuselage opening, door frame, load-bearing frame, and stiffeners; shape parameters describe curvature, fillets, and contour features; and positional parameters define the spatial distribution of locks, stiffeners, and other structural components.
A unified assembly datum is essential for maintaining geometric consistency and assembly compatibility in a multicomponent model. The fuselage opening is selected as the primary datum, and a hierarchical datum system comprising reference lines and surfaces is established. The reference lines are defined primarily by the geometric centerline of the fuselage opening and the lock rotation axes, whereas the reference surfaces are generated from the opening boundaries and structural contours. The lock-hole pattern is then incorporated to form a one-surface/multiple-hole datum system, allowing the door frame and its related components to be positioned and constrained within a common reference system.
Parameter-driven adaptive updating requires explicit associations among geometric features. Geometric constraints, design tables, and mathematical expressions are used to build a dependency network. Geometric constraints describe topological relations such as surface contact, coincidence, and surface continuity; design tables provide centralized parameter management and rapid reuse; and mathematical expressions define functional relations among key parameters. These elements form a parameter–feature–geometry association mechanism through which feature regeneration and geometric reconstruction are automatically triggered when a parameter changes.
After the parameter system and feature associations have been established, the model is generated using a master-driven/dependent-response strategy. The load-bearing frame serves as the master structure and is directly driven by the fuselage-opening parameters. The outer skin, inner panel, and stiffeners are created as dependent features associated with the master structure through predefined constraints.
Automatic model updating is implemented through the parameter-driven mechanism. When a key parameter changes, the associated features are adjusted according to the predefined constraints and mapping relationships, and the geometry is reconstructed automatically. This coordinated response of parameter and feature constraints reduces the risk of model instability caused by local modification and improves update efficiency and reliability.
Once the component-level parametric models have been completed, the full assembly is constructed from their spatial relationships. Assembly constraints, including coaxiality, coincidence, and positioning constraints, are introduced to register and integrate the door, frame, and functional components into a complete assembly model.
2.1. Parametric Modeling Method
2.1.1. Baseline Parameter Determination
A stable parametric model with clear engineering meaning requires design variables that exert dominant effects on geometry and structural performance. These variables are selected in accordance with aircraft structural-design principles, representative passenger aircraft dimensions, and relevant design handbooks. In this study, the fuselage-opening dimensions and lock dimensions are selected as baseline parameters for the door–frame model, and their values are determined as follows. The analytical relations that follow serve as physically constrained parameter initialization rather than as an independent gap-displacement solution.
The fuselage diameter is a primary descriptor of fuselage cross-sectional geometry and determines the curvature of the door outer skin and the overall door contour. Modern transport aircraft fuselages generally use thin-walled stiffened cylindrical shells with approximately circular or elliptical cross-sections to obtain a relatively uniform hoop-stress distribution and efficient pressure-load carrying. A representative single-aisle aircraft with five abreast seats is considered, as shown in Figure 2.
Figure 2.
Representative five-abreast seat layout.
The equivalent diameter of the fuselage cross-section is calculated using Equation (1):
where is the maximum width of the abreast seat group; is the clearance between the armrest and sidewall, ranging from 25 to 75 mm; is the cabin trim thickness, ranging from 17 to 35 mm; and is the fuselage-frame depth, taken as 85 mm.
Airworthiness requirements generally specify that a standard passenger-door opening on a transport aircraft should not be smaller than approximately 810 mm × 1830 mm to allow rapid emergency evacuation. Consistent with common single-aisle aircraft practice, a nominal opening of 3 ft × 6 ft, approximately 915 mm × 1830 mm, is adopted.
The corner regions of a fuselage opening are geometric discontinuities that experience marked stress concentration under internal pressure and are common fatigue-crack initiation sites. A suitable corner radius is therefore required to reduce stress concentration, improve the load-transfer path, and extend structural life. Based on representative civil aircraft opening designs, the corner radius is selected as a proportion of the opening width:
Within the door structural system, the locks provide closure and local load transfer, and their diameter directly affects load-carrying capacity and safety margin. Under cabin pressure differential, the separation load is transmitted through two main paths: direct surface contact between the door frame and the load-bearing frame; and the door-frame–lock–load-bearing-frame path, in which the locks carry localized concentrated loads. The locks therefore carry only the residual separation load after the contact interface has transferred its share. Their main functions are positional restraint, prevention of inadvertent opening, and local load transfer. An empirical load-distribution factor is introduced. In the adopted arrangement, locks are placed at the geometric centers of the upper and lower surfaces of the load-bearing frame. One lock is placed at the geometric center of each side surface, and additional locks are arranged symmetrically in the longitudinal direction about each central side lock. Because the locks are nonuniformly distributed, the side locks mainly carry shear load whereas the upper and lower locks primarily provide restraint. A distribution coefficient is therefore introduced, and the total load carried by the upper and lower locks is
The total load carried by the left and right locks is
The lock diameter is designed using a single-shear-plane strength criterion. Because the lock transfers load mainly in shear, the critical section is located at the contact interface between the lock and the door frame or load-bearing frame. The diameter of an upper or lower lock is therefore
For a left or right side lock, the required diameter is
After a lock is inserted into its corresponding hole, the load is transferred primarily through bearing contact. The lock thickness is therefore determined from the bearing-strength criterion:
where is the allowable bearing stress of the lock material.
2.1.2. Parameter Constraint Relationships
To maintain compatibility between the door structure and the fuselage load-carrying system and to preserve a continuous stress-flow path around the opening, the fuselage dimensions are used as the baseline design parameters for defining the load-bearing-frame constraints. The overall dimensions of the load-bearing frame are determined from the opening dimensions and the outward extension width, as given by Equations (9) and (10):
where is the outward extension of the load-bearing frame beyond the opening boundary and is determined by the recovery of the hoop-load path and equivalent-stiffness compensation:
The load-bearing-frame thickness is determined using an equivalent-stiffness requirement: the bending stiffness provided by the frame should not be lower than the equivalent bending stiffness of the fuselage skin removed by the opening. Because the opening region exhibits complex stress redistribution and structural coupling, a stiffness-matching coefficient is introduced to correct the stiffness relation between the frame and the weakened fuselage skin. This coefficient accounts for nonuniform load transfer and the required safety margin. To obtain engineering-practical dimensions, a reduction factor is additionally applied to the theoretical thickness:
where is the engineering correction factor.
The load-bearing-frame wall thickness directly influences load-carrying capacity, stiffness, and the overall safety margin. According to the Aircraft Design Handbook [31] and representative civil aircraft practice, the frame wall thickness is not selected independently but is related to the fuselage outer-skin thickness through Equation (13), thereby maintaining a coordinated balance between stiffness and strength.
As the primary load-carrying member surrounding the opening, the load-bearing frame must follow the opening contour to preserve the continuity of the load-transfer path and the compatibility of structural stiffness. This requirement is particularly important at the corners, where geometric continuity strongly affects the stress concentration, strength, and fatigue performance. Accordingly, the frame corner radius is set equal to the fuselage-opening corner radius:
The outer skin directly carries the cabin pressure differential and also provides the transition between the load-bearing frame and the fuselage structure. Its dimensions are therefore coupled to those of the load-bearing frame. To maintain structural integrity and continuous load transfer, the outer-skin dimensions are constrained by
where is the overlap length, comprising the sealing region, connection region, and structural allowance.
Because the curvature variation across the door is small relative to the overall fuselage curvature and the outer-skin thickness is much smaller than its characteristic dimensions, the skin can be approximated as a thin curved membrane under internal pressure. The minimum skin thickness is derived by requiring the membrane stress to remain below the allowable material stress:
To maintain geometric and mechanical consistency with the surrounding fuselage shell, the circumferential curvature of the door’s outer skin is set equal to that of the fuselage skin at the opening. Hence, the circumferential radius of the outer skin is
The outer skin acts as both a load-carrying and sealing member over the load-bearing frame, and its corner geometry must match the frame boundary to ensure assembly fit and structural continuity. Because the frame corner radius is uniquely determined by the fuselage opening, the skin corner radius is set equal to both the frame and opening corner radii:
The stiffeners reinforce the outer skin and must remain compatible with the overall dimensions and boundary features of the load-bearing frame. The transverse-stiffener length is governed primarily by the frame width, whereas the longitudinal-stiffener length is governed by the frame height. To avoid geometric interference and satisfy joining requirements, an installation clearance or overlap allowance is reserved at both ends. The effective stiffener lengths can therefore be expressed as the corresponding frame dimension minus two end corrections.
The effective length of a transverse stiffener is
The effective length of a longitudinal stiffener is
where and are the manufacturing allowances or installation clearances at the ends of the transverse and longitudinal stiffeners, respectively; their values depend on the joining method and assembly requirements.
For the representative 3 ft × 6 ft passenger door, the larger vertical dimension and the transverse transmission of the pressure load through the skin motivate the use of transverse stiffeners distributed along the height to improve the primary load-carrying stiffness. Longitudinal stiffeners are added across the width to increase secondary-direction stiffness and improve load uniformity. Considering the aspect ratio, load path, and engineering practice, three uniformly spaced transverse stiffeners and two uniformly spaced longitudinal stiffeners are selected as the preliminary configuration.
After the stiffener numbers have been determined, the spacing between adjacent stiffeners is parameterized to divide the skin’s load-carrying region rationally. Initial spacing values are obtained by uniformly partitioning the overall door dimensions.
The spacing between adjacent transverse stiffeners is
The spacing between adjacent longitudinal stiffeners is
After determining the stiffener numbers and spacings, the stiffener widths are constrained using the skin–stiffener cooperative load-carrying principle. The transverse- and longitudinal-stiffener widths are related to their corresponding adjacent spacings by
These theoretical values do not account for material thickness, local-stability requirements, or manufacturing limitations and may lead to local instability or unnecessary weight. Engineering bounds are therefore imposed on the stiffener widths:
The stiffener-height constraints are subsequently derived by treating each stiffener as a fixed–fixed beam and applying Euler buckling theory. The critical buckling stress is required to satisfy the allowable-stress criterion, giving
Once the lock diameter and thickness have been defined, the spatial arrangement of the locks on the load-bearing frame must also be parameterized because it strongly affects load distribution and structural compatibility. The upper and lower locks are located at the geometric centers of the corresponding frame surfaces. Their distances from the outer surface of the load-bearing frame are therefore
The center-to-center spacing of the upper or lower locks is
The distance from a central left or right lock to the outer surface of the load-bearing frame is
The distance from a central left or right lock to the upper surface of the load-bearing frame is
For the arrangement in which the central side lock is used as the symmetry reference and locks are placed symmetrically on each side, the lock’s center spacing is
The inner-panel width and height are generally matched to the corresponding surfaces of the load-bearing frame to obtain full contact, a continuous load-transfer path, and increased assembly stiffness. Small dimensional corrections may be introduced to accommodate assembly and welding processes.
Based on this principle, the inner-panel dimensions are expressed quantitatively as
where and are the welding-shrinkage compensation values in the width and height directions, respectively.
Because the inner panel and outer skin jointly carry membrane and bending loads, an equal-thickness design is adopted:
The door frame represents the equivalent boundary of the surrounding fuselage opening and therefore extends beyond the outer-skin planform. The frame dimensions are not smaller than the outer-skin dimensions, and an equivalent fuselage extension length is introduced to prevent artificially high stiffness caused by placing the finite-element boundary too close to the opening. The frame width and height are thus
where is the equivalent fuselage extension length.
According to opening-disturbance theory for thin-walled shells, the influence of the door opening on the fuselage decays exponentially in the radial direction, as expressed by Equation (40). Assuming an exponential stress-recovery law, the distance at which the stress reaches 95% of the far-field value is defined as the effective disturbance range and is used as the equivalent extension length.
where is the distance from the opening boundary; is the opening-disturbance coefficient, which depends on the opening size; is the characteristic decay length; and is the stress in the intact fuselage.
The equivalent extension length derived from this assumption is
In the door region, the total radial thickness of the fuselage is approximated as the sum of the outer-skin thickness, load-bearing-frame height, and inner-panel thickness. The door-frame thickness is therefore
2.2. High-Fidelity Digital-Twin Model of the Passenger Aircraft Door–Frame Assembly
Using the fuselage-opening datum surface as the common reference, parametric models of the load-bearing frame, outer skin, stiffeners, inner panel, and locks are created from the constraint relationships. The initial load-bearing-frame surface is generated by sweeping a profile along a guide curve and is then thickened and filleted to form a hollow solid. The outer skin is constructed from the contact surface between the frame and skin through parametric thickening and circumferential extension, with fillet transitions providing geometric continuity and reducing stress concentration. The transverse and longitudinal stiffeners are generated by projecting their profiles onto the skin and thickening them according to the arrangement and dimensional constraints. The inner panel is similarly thickened from its contact surface with the load-bearing frame and completed with edge fillets. Lock solids are generated from the lock-design parameters and associated constraints. Finally, Boolean operations integrate the components about the load-bearing frame, merge the outer skin and stiffeners, and accurately embed the inner panel and locks. The resulting parametric door model satisfies geometric consistency and structural continuity, as shown in Figure 3.
Figure 3.
Geometric model of the passenger aircraft door.
The previously defined door-frame constraints express the frame width, height, and thickness in terms of the outer-skin dimensions, ensuring dimensional and topological compatibility among the frame, skin, and load-bearing frame. The outer surface of the skin is selected as the reference surface, and the door-frame contour is generated from the constraint relations. The contour is thickened along the fuselage as usual to create an initially closed-frame solid. A Boolean subtraction operation then uses the door model as the cutting body to remove the corresponding region and generate a frame opening that matches the door geometry, as shown in Figure 4.
Figure 4.
Geometric model of the passenger aircraft door frame.
During construction of the door–frame assembly, each constraint is defined according to structural function and load-transfer mechanism. A unified principle of load-path consistency and assembly-geometry compatibility is followed, while different structural interfaces are represented by interface-specific constraints.
At the interface between the load-bearing frame and the door frame, structural continuity and complete load transfer are the principal requirements. Because the connection is effectively rigid, coincident-surface constraints or equivalent rigid-contact constraints are used to align the supporting surface of the load-bearing frame with the corresponding door-frame region and to ensure effective load transfer along the intended path.
The interface between the inner surface of the outer skin and the door frame primarily controls sealing contact and clearance rather than providing a rigid connection. A surface-to-surface contact constraint is therefore used to control the normal separation and represent the fit and sealing condition of the closed door. This treatment avoids the excessive rigid coupling introduced by a fully coincident constraint and supports subsequent analysis of gap evolution and deformation compatibility.
The lock-hole connection is a positioning joint that carries load mainly in shear. Coaxial positioning is imposed through an axis-coincident constraint, and contact constraints limit the relative displacement of the mating surfaces. This representation captures the principal load direction while avoiding excessive restriction of non-load-carrying degrees of freedom. The resulting door–frame assembly model and its representative constraints are shown in Figure 5.
Figure 5.
Passenger aircraft door–frame assembly model.
3. Simulation of Passenger Aircraft Door–Frame Gap Deformation
To characterize the gap deformation of the passenger aircraft door under time-varying cabin pressurization, the high-fidelity assembly model developed above is analyzed using a quasi-static approach. Because the applied load changes slowly during pressurization, the structural response is treated as a time-evolving sequence of equilibrium states.
Under the quasi-static assumption, inertia and damping effects are neglected because the load varies slowly, and the structural dynamic equilibrium equation is reduced to the nonlinear static form:
where is the stiffness matrix, is the nodal displacement vector, and is the time-dependent load vector.
Quasi-static analysis is an incremental–iterative nonlinear static procedure. To capture the nonlinear response accurately, the complete loading history is divided into a sequence of increments. At each increment, the equilibrium equation is solved using a Newton–Raphson-type iterative algorithm, yielding the displacement evolution throughout the loading process:
Although the loading is treated as quasi-static, the analysis is not a linear-static strength calculation. The nonlinear response is captured from three sources: large-displacement kinematics through geometric nonlinearity, unilateral opening and closing at the door–frame contact interface, and tangential stick–slip represented by the penalty-friction contact law. At each load increment, the contact status and tangent stiffness are updated within the Newton–Raphson iterations until equilibrium is satisfied. Consequently, the effective stiffness and local gap state can change with the loading path, allowing load-dependent opening, local constraint release, and redistribution of deformation to be represented. The quasi-static assumption is appropriate for the slowly varying pressurization sequence considered here; high-frequency vibration, impact, and aeroelastic transient effects are outside the scope of the present validation.
Here, the analysis time is a load-history parameter rather than a physical dynamic time coordinate. We let denote the characteristic time over which the applied pressurization changes and a dominant structural vibration period; the quasi-static approximation requires . In the stepped full-scale test, each load level is held until the measured displacement reaches a stable plateau. Inertia and material/structural damping therefore mainly influence the short transition immediately after a load change, whereas the stabilized equilibrium gap used for model comparison is governed by the nonlinear stiffness, contact state, and constraints. In Abaqus, the prescribed amplitude history advances the load factor and loading sequence, while each increment is iterated to static equilibrium with the current geometric and contact nonlinearities. Thus, the terms “time-dependent” and “time-varying” in this study refer to path-dependent evolution along the imposed slowly varying load history and not to a vibration-resolved dynamic response.
where is the structural displacement increment in the -th load increment, and is the load increment in the -th step.
We let the position vectors of corresponding measurement points on the door and frame be and , respectively. The instantaneous gap is defined as the projection of their relative displacement onto the local normal direction:
where is the local unit normal vector.
In Abaqus, measurement points are distributed around representative circumferential locations of the door. The X-, Y-, and Z-direction displacement components are extracted at these points, and the relative displacement of each door-edge node with respect to the corresponding frame node is calculated to quantify the load-dependent door–frame gap.
The extracted three-directional gap-displacement features are used to analyze the spatial distribution and evolution mechanism at both global and local scales. The global analysis considers the complete displacement field and overall gap trend, whereas the local analysis focuses on the corners, lock-constrained regions, and other critical locations where deformation differs markedly.
3.1. High-Fidelity Finite-Element Model
A finite-element model is established from the high-fidelity door–frame digital-twin geometry to investigate the mechanical response under representative loading. The material properties and section characteristics of each component are first defined to represent its fundamental mechanical behavior. The properties of the 2024 aluminum alloy used in the model are listed in Table 2.
Table 2.
Material properties of 2024 aluminum alloy.
To ensure the reproducibility and numerical reliability of the finite-element model, further details regarding the element type, mesh discretization, interaction definitions, loading method, and boundary conditions are provided. The aircraft door–frame assembly was mainly discretized using eight-node linear brick elements with reduced integration (C3D8R), as shown in Figure 6. Considering the significant differences in geometric scale and local stress gradients among different structural components, a nonuniform meshing strategy was adopted. Specifically, a characteristic mesh size of 80 mm was used for the door frame, outer skin, inner skin, and primary load-carrying beams, while a finer mesh size of approximately 25 mm was adopted for the stiffening structures. Since the locking mechanism and lock-hole regions contain relatively small geometric features and exhibit pronounced local contact effects and stress gradients, these regions were further refined using a mesh size of approximately 3 mm. This hierarchical mesh refinement strategy ensures sufficient numerical accuracy in mechanically critical regions while maintaining reasonable overall computational efficiency.
Figure 6.
Finite-element mesh of the passenger aircraft door–frame assembly.
The analysis uses a Static General (version: Abaqus 2024) step with geometric nonlinearity enabled. The time-history load shown in Figure 7 is defined through an amplitude function and applied normally to the outer surface of the skin in piece-wise-increasing stages, as shown in Figure 8. This procedure maps the slowly varying service load to a sequence of equilibrium states while retaining the nonlinear contact history. The converged state of each increment supplies the initial state for the next increment, so changes in contact status and structural stiffness are propagated through the complete loading path.
Figure 7.
Time-history loading profile.
Figure 8.
Applied loading condition.
Because the connection between the door frame and the surrounding fuselage is assumed to have high stiffness, all translational and rotational degrees of freedom at the outer frame boundary are constrained, as shown in Figure 9, to represent fixed fuselage support. No additional displacement constraint is applied to the door itself; its motion and deformation are governed by the door–frame contact and lock connections.
Figure 9.
Boundary conditions.
To evaluate the sensitivity of the finite-element results to mesh size, and to ensure the numerical reliability of the high-fidelity finite-element model used for subsequent digital-twin analysis and surrogate-model training, a mesh-independence study was conducted. Under identical material properties, contact definitions, boundary conditions, and loading conditions, three mesh levels—namely coarse, medium, and fine meshes—were established, with the corresponding mesh sizes listed in Table 3.
Table 3.
Mesh sizes of different structural components at different refinement levels.
The displacement components in the X, Y, and Z directions at the same representative measurement point on the aircraft door were selected as the mesh-convergence indicators, and the results obtained using the three mesh levels were compared. As shown in Table 4, the structural responses gradually converged with mesh refinement, and the differences in the key displacement responses between the medium and fine meshes were within 5%, indicating that the numerical results had essentially achieved mesh independence. Considering both computational accuracy and efficiency, the medium mesh scheme was adopted for the subsequent analyses.
Table 4.
Mesh-independence verification results at node 10.
3.2. Simulation Results Under Time-Varying Loading
The response over the complete loading history is solved incrementally using the quasi-static procedure. Iteration at each load increment provides the displacement field at successive loading stages, and the overall deformation at the final load level is extracted for analysis.
As shown in Figure 10, the global deformation under a uniformly distributed pressurization load is approximately symmetric. This behavior originates from the symmetry of the geometry, stiffener layout, and boundary conditions. Door-edge deformation is restricted by the frame and lock constraints, and the maximum displacement in these regions is 0.82 mm. The corner regions combine geometric transition and boundary-stiffness discontinuity and therefore exhibit localized deformation and stress concentration, with a maximum displacement of 2.4 mm. Between adjacent stiffeners in the central door region, the lack of direct local reinforcement produces larger bending deformation, reaching 3.2 mm. The characteristic response is therefore one of small edge deformation, concentrated corner deformation, and relatively large deformation in the central regions between stiffeners.
Figure 10.
Quasi-static displacement contour of the passenger aircraft door–frame model. The colors represent the displacement magnitude, with blue indicating lower displacement values and red indicating higher displacement values.
To quantify the evolution of door–frame gap deformation, key measurement points are selected around the door perimeter, with additional points placed near the corners to capture local response gradients, as shown in Figure 11.
Figure 11.
Locations of the key measurement points. The numbers in the figure represent the node IDs.
Taking the frame as the reference, the three displacement components of each point are extracted, and the relative displacement between corresponding door-edge and frame nodes is calculated. The resulting three-directional gap deformations are presented in Figure 12.
Figure 12.
Simulated three-directional gap-deformation curves at key points.
Figure 12 and Table 5 show that the time-varying-load response is direction dependent and spatially nonuniform. The X-direction displacement is dominant and ranges from approximately 0.6 to 2.3 mm, with a peak-to-valley difference of about 1.5 mm. Multiple local peaks occur near the door corners and in regions between stiffeners, whereas the central constrained regions and boundary-adjacent locations exhibit lower displacement, demonstrating the suppression of in-plane opening deformation by local restraints. The Y-direction displacement is smaller, ranging from approximately −0.3 to 0.5 mm, and displays a weak antisymmetric pattern associated with coupled in-plane shear and torsion. The Z-direction displacement ranges mainly from −0.5 to 0.6 mm and alternates between positive and negative local peaks, indicating alternating outward bulging and inward indentation in the normal direction.
Table 5.
Simulated three-directional gap deformation at key measurement points.
4. Experimental Characterization of Passenger Aircraft Door–Frame Gap Deformation
A full-scale test platform is constructed to measure the door–frame gap response under time-varying loading, as shown in Figure 13. The test uses an actual aircraft with the door and frame retained in their installed state, eliminating the need for additional support or equivalent boundary fixtures. A servo-controlled hydraulic actuator placed inside the door applies a controllable outward normal load to the inner surface, thereby representing the cabin pressure differential. The actuator provides stable force control and suitable dynamic response for stepped and quasi-static loading, with a maximum force range of 0–50 kN, force-control accuracy better than ±1%, and an operating-frequency range of 0–5 Hz. A binocular stereo-vision acquisition system is positioned outside the door. Targets attached to the door and frame are imaged synchronously and reconstructed in three dimensions to obtain the three-directional relative displacements. The imaging resolution exceeds five megapixels, the spatial-displacement accuracy is better than 0.01 mm, and the sampling frequency is 10–50 Hz, satisfying the requirements for global and local gap-deformation measurement.
Figure 13.
Experimental system for passenger aircraft door–frame gap-deformation measurement.
The service loading is reproduced as a quasi-static time-varying sequence using the hydraulic actuator. The pressure-differential history is discretized into stepped load levels. The first stage is set to 25% of the design load, followed by 50%, 75%, and 100%. Each level is held briefly to allow the structural response to stabilize, while the three-directional displacements and gap variations in critical door regions are recorded synchronously. This loading program captures the temporal evolution and nonlinear response of the gap at different load levels.
Pairs of measurement points are arranged along the door and frame edges, at the corners, and near the lock connections. The binocular stereo-vision system records the three-directional displacement histories of each paired point throughout loading. The displacement of the frame point is subtracted from that of the corresponding door point to obtain the local relative displacement, defined here as the gap deformation. The resulting X-, Y-, and Z-direction curves are shown in Figure 14.
Figure 14.
Measured three-directional gap-deformation curves at key points.
According to Figure 14 and Table 6, the measured X-direction displacement is predominantly positive and ranges from approximately −0.05 to 2.16 mm. Pronounced peaks occur at several locations, including nodes 10, 15, 16, and 24, with the largest values near nodes 10 and 15. The X direction is therefore the dominant component and represents marked opening or offset along the principal load direction. At strongly constrained or locally stiff regions, including nodes 104, 109, and 185, the displacement is close to zero or slightly negative, indicating small local retraction or assembly-restraint effects.
Table 6.
Measured three-directional gap deformation at key measurement points.
The measured Y-direction displacement is substantially smaller, ranging from −0.33 to 0.36 mm, and most values are concentrated near zero. The response is therefore characterized by low-amplitude shear or transverse disturbance rather than a dominant deformation mode. Relatively high positive values occur near nodes 3, 8, 20, and 24, whereas negative values occur near nodes 4, 15, and 16. This distribution indicates limited torsional and asymmetric-shear behavior while confirming the generally weak transverse deformation.
The measured Z-direction displacement exhibits the greatest scatter, ranging from approximately −0.72 to 0.81 mm, with alternating upward and downward warping and local bulging or indentation. Nodes 35 and 38 exhibit relatively large negative displacement and local inward deformation, whereas nodes 8, 10, 127, and 130 exhibit large positive displacement associated with local outward bulging of the outer skin under the combined effects of pressure loading and structural restraint.
5. Virtual–Physical Data Fusion and Gap-Deformation Inversion
To reduce the systematic discrepancy between the mechanics-based model and the full-scale test while retaining physical interpretability, the virtual–physical fusion process is organized in four stages: (1) spatial registration and point-to-node mapping, (2) mechanics-preserving model updating, (3) weighted virtual–physical data fusion, and (4) probabilistic inversion. The first stage establishes a common coordinate system and a one-to-one correspondence between the experimental targets and the finite-element nodes at the same nominal key locations. The second stage corrects localized and global model bias without replacing the finite-element model by a purely empirical fit. The third stage combines the corrected finite-element responses with the registered experimental responses using fixed weighting coefficients. The resulting fused three-directional gap-displacement data are then used as the output targets for GPR training and subsequent inverse inference. The overall digital-twin-driven fusion, updating, and inversion workflow is illustrated in Figure 15.
Figure 15.
Digital-twin-driven framework for virtual–physical data fusion, model updating, and aircraft door–frame gap-deformation inversion.
5.1. Spatial Registration and Mechanics-Preserving Model Updating
At each loading state, the finite-element model provides a complete three-dimensional nodal displacement field UFE ∈ R^(NFE × 3), where NFE is the total number of finite-element nodes and the three columns correspond to the X-, Y-, and Z-direction displacement components. The experimental system provides sparse three-dimensional displacement measurements at the same predefined key locations. As shown in Figure 11, 28 door–frame point pairs are distributed around the door perimeter, with additional concentration near the corner and lock-constrained regions to capture larger local displacement gradients. Each pair contains one door-side point and one frame-side point; therefore, the raw experimental sampling at a loading state consists of 56 target points with three displacement components, while the derived door–frame gap response is represented by a 28 × 3 matrix.
Because the binocular-vision measurement coordinate system differs from the finite-element coordinate system, the experimental target coordinates are first registered to the finite-element model using a least-squares rigid transformation. We let and denote the corresponding reference-point sets in the experimental and finite-element coordinate systems, respectively. The rotation matrix R and translation vector t are obtained by minimizing the sum of squared Euclidean distances between and , and the optimum transformation is solved by singular value decomposition (SVD). After registration, each transformed experimental target is mapped to the finite-element node at the same predefined nominal key location; when a small coordinate mismatch remains, the node with the minimum Euclidean distance within the corresponding local key-point region is selected. Thus, the i-th experimental door-side/frame-side point pair is associated with the i-th finite-element door-side/frame-side node pair. For each data source, the local three-directional gap-displacement vector is obtained by subtracting the frame-side displacement from the corresponding door-side displacement. The resulting registered experimental gap matrix—GExp and the extracted finite-element gap matrix—GFE therefore have the same dimension, expressed as GExp, GFE ∈ R^(28 × 3), and the same row-wise physical meaning.
After spatial registration, systematic discrepancies between simulation and experiment are corrected locally while preserving the global mechanical consistency of the model. The updating objective is to minimize the residual between the simulated and measured gaps through a hierarchical, region-specific parameter-adjustment strategy. Because the physical actuation system is located on the inner surface near the left lock region, its restraining and additional-load effects are represented by an equivalent linear elastic support. The equivalent reaction force applied at node i is
where is the displacement of door node i, is the prescribed displacement associated with the actuation-system constraint, and is the equivalent stiffness to be identified. After this force term is incorporated into the finite-element equilibrium equation, the updated governing equation becomes
where K is the original structural stiffness matrix, and is the equivalent actuator stiffness matrix, which is nonzero only for degrees of freedom associated with the left lock region. The equivalent stiffness is identified by minimizing the squared residual between the updated simulated gap and measured gap , as expressed in Equation (49). This local correction more accurately represents the participation of the actuation system in the deformation compatibility of the door.
Because the effect of the actuation system is spatially localized, a local nodal correction is applied to a limited number of key points in the regions before node 112 and after node 96 without changing the global stiffness or boundary conditions. A displacement correction term is introduced at node j:
where and are local correction coefficients controlling the adjustment amplitude.
For the remaining nodes, where the systematic discrepancy is small and approximately uniform, a global scaling factor is introduced to correct the simulated response efficiently:
The factor is determined by minimizing the global residual as follows.
To prevent the local correction from degenerating into unconstrained point-wise fitting, the updating variables are restricted by physical and mathematical constraints. The equivalent actuator stiffness is required to remain positive and is varied only within the physically admissible range of the support system; the corresponding actuator-stiffness matrix remains nonzero only for the predefined degrees of freedom in the left lock region. For the local correction, the affected points are selected a priori from the actuator/lock geometry rather than from the residual magnitude, and the correction coefficient is bounded by so that the update cannot overshoot the measured residual. The same is used throughout the loading history rather than being re-identified independently at each load increment, and neighboring correction coefficients are regularized to vary smoothly along the door edge. For the unaffected region, only one global factor β is used and is constrained to a narrow neighborhood of unity, , where is prescribed from the admissible global simulation–experiment discrepancy before parameter identification. The geometry, element connectivity, material properties, contact definitions, and prescribed boundary conditions are therefore kept unchanged. These constraints limit both the number and the amplitude of correction degrees of freedom and preserve the original load-transfer mechanism.
5.2. Virtual–Physical Data Fusion and GPR-Based Gap-Deformation Inversion
The combined equivalent-stiffness correction, local nodal adjustment, and global scaling compensation first produce a corrected finite-element gap response GFE,corr that is spatially aligned with the registered experimental response GExp. A fixed weighted fusion is then applied component-wise to the X-, Y-, and Z-direction gap displacements at every matched key-point pair. In the present implementation, the corrected finite-element response is assigned a weight of 0.7 and the experimental response a weight of 0.3, with the two weights summing to unity. Hence, the fused response is defined as . The same weighting coefficients are used for all three displacement directions, all 28 key-point pairs, and all loading states. The larger finite-element weight preserves the spatial continuity and mechanics-based consistency of the numerical field, while the experimental contribution introduces physical measurement information and compensates for systematic model bias without allowing sparse measurement noise to dominate the fused response. The resulting fused matrix Gfus ∈ R(28×3) constitutes the virtual–physical response dataset used for subsequent surrogate modeling.
After the digital-twin model has been calibrated, a Gaussian process regression (GPR) framework is developed for rapid and accurate inversion under unknown operating conditions. GPR is a nonparametric method with favorable small-sample performance and can learn a complex nonlinear relation between multisource inputs and gap response without prescribing an explicit functional form. Conventional GPR, however, generally uses a single covariance kernel and a homoscedastic Gaussian-noise assumption, which limits its ability to represent both the global smoothness and localized variations in the spatial gap field and reduces its adaptability to fused multisource data. An improved GPR model is therefore constructed for passenger aircraft door-gap inversion.
During flight, the door is subjected to time-varying aerodynamic or pressurization loads and structural coupling. In the present study, only one nominal door–frame configuration is considered; the geometry, material properties, contact definitions, and prescribed boundary conditions are held fixed. Accordingly, the GPR is formulated as one shared scalar-output surrogate that maps the operating load, the spatial location of a selected door–frame key-point pair, and the displacement direction to one fused directional gap-displacement value, as expressed in Equation (53). Separate GPR models are not trained for individual key points or displacement components. For each loading condition, the 28 matched key-point pairs and three displacement directions provide 28 × 3 = 84 scalar response targets. The shared GPR is evaluated over all 84 key-point–direction combinations and the predictions are reshaped into a 28 × 3 directional response matrix. These predicted directional relative displacements are subsequently used to obtain the gap-width and step-deformation values at the same 28 key locations. Therefore, the surrogate predicts selected door–frame gap quantities rather than the complete finite-element nodal deformation field. Five training loading states, corresponding to pressure levels of 2, 4, 11, 43, and 56 kPa, are used, giving 5 × 28 × 3 = 420 scalar training observations from the weighted virtual–physical fused response.
Here, x is a seven-dimensional input vector. Its components are: (i) the pressure level normalized by the 56 kPa calibration full-load value (one component); (ii) the normalized X, Y, and Z coordinates assigned to the corresponding registered door–frame key-point pairs (three components); and (iii) a three-component one-hot direction code, namely [1,0,0], [0,1,0], or [0,0,1], for the X-, Y-, or Z-displacement components, respectively. The key-point coordinates are min–max normalized over the 28 pair locations. The scalar output y is the corresponding weighted virtual–physical fused directional gap displacement, obtained from fixed weights of 0.7 for the corrected finite-element response and 0.3 for the registered experimental response, and ε denotes the observation noise. Because the nominal structure is fixed, geometric dimensions, material properties, contact parameters, and boundary-condition parameters are not included in x. All 420 observations generated from the five training loading states are used for GPR training and hyperparameter identification. A completely separate 10 kPa loading condition is excluded from training, model updating, and hyperparameter optimization and provides 28 × 3 = 84 directional observations for independent validation. No additional test subset is introduced in the present study. For comparison with RBF-NN and RF, the same 420-sample training set and the same independent 84-sample validation set are used for all three regression models.
In contrast to the conventional homoscedastic assumption, the heteroscedastic noise model is introduced so that the noise variance changes with the input. The functional form in Equation (54) represents the uncertainty of the fused dataset more accurately and adapts to different noise levels under different operating conditions.
where denotes the parameters to be optimized.
The target function is assumed to follow a Gaussian process prior:
where is the mean function, which is set to zero to simplify the model, and is the covariance function. The squared-exponential (SE) kernel was selected on the basis of the regularity of the stabilized quasi-static response rather than simply as a default covariance function. Although the door–frame contact introduces a nonlinear dependence on load, each prescribed load level is held until a stable equilibrium state is reached, and the registered and fused gap responses vary continuously over the sampled pressure levels and key-point coordinates. The SE kernel therefore provides a physically consistent smooth prior while retaining the ability to represent nonlinear input–response relationships.
where is the process variance, and is the length-scale matrix used to quantify the influence of each input parameter on the response.
Matérn-3/2, Matérn-5/2, and rational-quadratic (RQ) kernels were also considered as reasonable model-form alternatives for the present problem. The Matérn kernels impose rougher priors and are generally more suitable when the response contains sharp local variations or limited differentiability, whereas the RQ kernel can be interpreted as a scale mixture of SE kernels and is useful when several distinct correlation length scales coexist. In the present quasi-static dataset, the dominant pressure–gap relationship is smooth, while the localized effects associated with locks and contact remain continuously varying at the selected key points. A rougher prior is therefore not required by the observed response regularity, and the additional scale-mixture flexibility of the RQ kernel would introduce an extra hyperparameter that is only weakly constrained by the relatively small training set. On this basis, the SE-ARD kernel was retained as the most parsimonious covariance model for the calibrated operating domain.
An inversion framework is constructed from the probabilistic inference capability of the trained forward GPR model. For the fused virtual–physical training dataset , is the input vector at the -th sample and is the corresponding gap response at the -th sample. After introducing heteroscedastic noise, the observation covariance matrix is
where is the covariance matrix obtained from the squared-exponential kernel, and is the input-dependent noise covariance matrix.
For an arbitrary test input , the corresponding predictive distribution is
where is the predictive mean, and is the predictive uncertainty.
For a prescribed measured gap-deformation response , the posterior distribution constructed from the GPR model is used to estimate the most probable input parameters, thereby performing inverse inference from response to parameters.
According to Bayes’ theorem, the posterior probability can be expanded as
where is the likelihood of observing the current deformation for the specified input parameters, and is the prior distribution.
The inverse problem is recast as an optimization problem that minimizes the discrepancy between the predicted and measured responses while accounting for model uncertainty:
The first term is a weighted error that measures the discrepancy between predicted and measured deformation and is weighted by the covariance matrix , thereby reducing the influence of regions with high uncertainty. The second term penalizes uncertainty and discourages overfitted solutions in poorly supported regions, improving inversion stability and reliability.
5.3. Predictive Performance Evaluation and Benchmark Comparison
The predictive accuracy and generalization of the improved GPR model are evaluated using the root-mean-square error (RMSE), coefficient of determination (), and mean relative error (MRE):
where and are the measured and predicted values for sample i, respectively; is the sample mean; and N is the number of validation samples.
To assess the advantage of the GPR surrogate, two widely used engineering regression models are considered for comparison: a radial basis function neural network (RBF-NN) and random-forest regression (RF). All three models are trained and evaluated using the same dataset and identical training–validation partitions. Their predictive accuracy, generalization, and stability are compared in Table 7.
Table 7.
Comparison of the performance metrics of the three regression models.
To make the benchmark comparison reproducible and to ensure that the performance differences are not caused by unequal data exposure, the three regressors use the same seven-dimensional input representation and the same 420 fused samples from the five calibration loading states. The RMSE, MRE, and R2 values reported in Table 7 are obtained under the same five-fold grouped cross-validation protocol and therefore represent internal benchmark performance rather than the external 10 kPa test. For full reproducibility, the benchmark-model settings used in the final calculations are reported as follows. The RBF-NN consists of a Gaussian radial-basis hidden layer with 30 basis functions. The radial-basis centers are determined using K-means clustering, and the Gaussian spread is set to 0.8. A linear output layer with L2 regularization () is adopted. The random-forest model consists of 300 regression trees, with a maximum tree depth of 10, three candidate features considered at each split, and a minimum leaf size of 2. Hyperparameters for both the RBF-NN and RF models are selected by a grid search combined with the five-fold grouped cross-validation using only the 420-sample calibration dataset, with RMSE adopted as the model-selection criterion. The independently withheld 10 kPa dataset is not used in this benchmark-tuning process and is reserved exclusively for the final external validation of the GPR model.
5.4. Robustness Verification Under an Independent Loading Condition
To further assess the generalization capability of the proposed GPR model, a completely independent loading condition was introduced as an unseen test case and was excluded from model updating, training, validation partition selection, and hyperparameter identification. In addition to adopting a different nonuniform loading sequence, the load magnitude of the independent condition was also changed from that used for model calibration. Specifically, whereas the calibration condition was established with a full-load pressure of 56 kPa, the independent condition adopted 10 kPa as the load level. The measured three-directional gap deformations obtained under this new condition were used exclusively for external generalization validation and were not incorporated into the fused training dataset.
After the digital-twin updating parameters and GPR hyperparameters had been fixed, the trained GPR model was directly applied to the independent 10 kPa loading condition without any additional model correction or retraining. At each unseen load level, the predicted X-, Y-, and Z-direction gap deformations were compared with the corresponding results obtained from the analytical design stage and the finite-element simulations at the same key measurement locations, as shown in Table 8.
Table 8.
Quantitative comparison of three-directional gap-displacement results from different approaches.
The predicted responses reproduced the overall deformation evolution and spatial variation obtained from the finite-element model. The resulting RMSE, MRE, and , calculated between the GPR predictions and the finite-element simulation results, were 0.031 mm, 3.4%, and 0.962, respectively. In addition to these global error metrics, the deformation directions, spatial distributions, and locations of the dominant extrema were also compared to evaluate the physical consistency of the predictions. The agreement under a loading condition with both a different loading sequence and a substantially different maximum pressure indicates that the proposed GPR model is not limited to interpolation of the calibration samples, but retains predictive capability under an independent unseen quasi-static operating condition.
As shown in Table 9, the prediction error is concentrated mainly in the X direction, for which the RMSE is 0.05295 mm and R2 is 0.9067, whereas the Y- and Z-direction responses show substantially smaller errors and R2 values above 0.999. Accordingly, the independent 10 kPa result provides quantitative evidence that the model can reproduce the sign and spatial response pattern of an unseen operating condition without parameter re-identification. The claim is intentionally limited to condition-level generalization within the calibrated pressure range; validation of a completely different full loading history and extrapolation outside the trained pressure domain remain outside the present evidence.
Table 9.
Independent 10 kPa validation performance of the GPR model.
6. Conclusions
(1) A unified parametric digital-twin model of the passenger aircraft door–frame assembly was established on the basis of a common fuselage-opening datum, feature associations, and parameter–constraint relationships. The model integrates the outer skin, load-bearing frame, stiffeners, inner panel, locks, and door frame within a consistent assembly reference system, enabling coordinated parameter-driven geometric reconstruction and providing a physics-based foundation for subsequent nonlinear simulation, experimental registration, and model updating.
(2) A nonlinear quasi-static finite-element analysis strategy was developed to represent the slowly varying pressurization history as a sequence of incrementally solved equilibrium states. Geometric nonlinearity, unilateral door–frame contact, and frictional stick–slip were retained so that load-dependent opening and constraint redistribution could be captured. Under the representative pressure loading, the global response was approximately symmetric: the maximum displacement was about 0.82 mm near the constrained door edges, 2.4 mm in the corner regions, and 3.2 mm in the central regions between adjacent stiffeners. At the selected door–frame key-point pairs, the simulated X-, Y-, and Z-direction relative displacements were approximately 0.6–2.3 mm, −0.3–0.5 mm, and −0.5–0.6 mm, respectively, showing a dominant X-direction opening response with smaller transverse and normal local variations.
(3) A full-scale experimental system combining quasi-static hydraulic loading and binocular stereo-vision measurement was established to characterize the physical door–frame response. Twenty-eight matched door–frame point pairs were distributed around the perimeter, including the corner and lock-constrained regions, and three-directional relative displacements were obtained from the synchronized measurements. The measured X-, Y-, and Z-direction gap deformations ranged from approximately −0.05 to 2.16 mm, −0.33 to 0.36 mm, and −0.72 to 0.81 mm, respectively. The X direction remained the dominant opening component, whereas the Z direction exhibited stronger localized bulging and indentation, confirming the spatially nonuniform effect of structural restraint and local stiffness.
(4) A mechanics-preserving virtual–physical updating and fusion procedure was constructed to establish direct correspondence between the finite-element and experimental responses. The binocular-vision coordinates were registered to the finite-element coordinate system by a least-squares rigid transformation solved using SVD, after which the 28 experimental point pairs were mapped to the corresponding finite-element node pairs. Systematic discrepancies were then corrected through equivalent-stiffness compensation in the actuator/left lock region, bounded local nodal adjustment, and a global scaling factor, while the geometry, mesh connectivity, material properties, contact definitions, and prescribed boundary conditions remained unchanged. The corrected finite-element response and registered experimental response were fused using fixed weights of 0.7 and 0.3, respectively, producing a 28 × 3 virtual–physical gap-response matrix for surrogate modeling.
(5) For the single nominal door–frame configuration considered in this study, an improved shared GPR surrogate was constructed using a seven-dimensional input composed of normalized pressure, the normalized X-, Y-, and Z-coordinates of the selected key-point pair, and a three-component one-hot displacement-direction code; geometric dimensions, material properties, contact parameters, and boundary-condition parameters were therefore not treated as varying GPR inputs. Five calibration pressure levels (2, 4, 11, 43, and 56 kPa) provided 420 fused scalar observations for training. With a squared-exponential ARD kernel and input-dependent noise model, the GPR achieved an RMSE of 0.21, an MRE of 2.8%, and an R2 of 0.985 under the same five-fold grouped cross-validation protocol used for the RBF-NN and RF benchmarks, outperforming the two comparison models. The analytical design relations were retained as geometry, strength, and stiffness constraints rather than as a direct gap-displacement solver.
(6) Robustness was further verified under a completely independent 10 kPa loading condition with a different nonuniform loading sequence, which was excluded from model updating, GPR training, validation-partition selection, and hyperparameter identification. Without any additional correction, retraining, or parameter re-identification, the model achieved an RMSE of 0.031 mm, an MRE of 3.4%, and an R2 of 0.962 relative to the finite-element results, while reproducing the deformation directions and spatial response patterns. The added value of this check is that it moves the evidence beyond internal cross-validation and demonstrates that the reported accuracy is not merely attributable to interpolation within the calibration samples. It therefore provides quantitative evidence of condition-level generalization and increases confidence in applying the digital twin to previously unseen loading histories within the calibrated pressure range.
(7) The computational efficiency and real-time applicability of the proposed GPR-based digital-twin framework were evaluated using 420 training samples on a workstation equipped with an AMD Ryzen 9 7945HX processor (16 cores) and 16 GB DDR5-5200 RAM. The complete GPR training process, including hyperparameter optimization, required 4 min 28 s, whereas the average prediction time for the three-directional gap-deformation response under a single operating condition was only 37 ms, corresponding to an inference rate of approximately 27 Hz. Because the proposed framework adopts an offline-training/online-prediction architecture, the relatively high training cost does not directly affect the online response latency. Moreover, the GPR inference rate exceeds the 20 Hz sampling frequency of the binocular stereo-vision system, whose acquisition interval is 50 ms. Therefore, the trained surrogate can complete one gap-deformation prediction within each measurement cycle, demonstrating that the proposed framework has sufficient computational efficiency to support frame-by-frame real-time gap-deformation monitoring and digital-twin updating under the current experimental configuration.
Future developments will extend the framework beyond the present single nominal door–frame configuration and condition-level validation. First, fully independent loading histories, wider pressure ranges, and extrapolation outside the calibrated domain will be examined to establish the applicability boundaries of the model. Second, variations in door geometry, material properties, contact and friction parameters, and boundary conditions will be introduced as explicit surrogate inputs to evaluate cross-configuration generalization. Third, sparse or incremental GPR, online uncertainty monitoring, and adaptive model updating will be investigated so that the digital twin can assimilate newly acquired measurement data without repeated full offline retraining. Finally, long-duration full-scale tests and integration with aircraft ground-test or maintenance-monitoring systems will be undertaken to assess prediction stability, computational robustness, and engineering deployment reliability.
Author Contributions
Conceptualization, Z.Y. and H.X.; methodology, Z.Y. and H.X.; software, J.Z.; validation, J.Z.; resources, Z.Y. and J.Z.; data curation, Z.Y. and J.Z.; writing—original draft preparation, Z.Y. and J.Z.; writing—review and editing, J.Z., W.H., N.H., H.X., H.Z., G.Z., W.Y. and Z.Z.; funding acquisition, Z.Y. and H.X. All authors have read and agreed to the published version of the manuscript.
Funding
This research was funded by the National Natural Science Foundation of China, grant numbers U2341275 and 52175461; the Natural Science Foundation of Hebei Province, grant number E2025202164; the National Defense Basic Scientific Research Program of China, grant number JCKY2024204A005; and the Hebei University of Technology Interdisciplinary Graduate Training Program, grant number XKJC-2025032.
Institutional Review Board Statement
Not applicable. This study did not involve human participants or animals.
Informed Consent Statement
Not applicable.
Data Availability Statement
The data that support the findings of this study are available from the corresponding author upon reasonable request.
Conflicts of Interest
The authors declare no conflicts of interest. The funders had no role in the design of the study; in the collection, analyses, or interpretation of data; in the writing of the manuscript; or in the decision to publish the results.
Abbreviations
The following abbreviations are used in this manuscript:
| DIC | Digital image correlation |
| FE | Finite element |
| GPR | Gaussian process regression |
| MRE | Mean relative error |
| RBF-NN | radial basis function neural network |
| RF | Random forest |
| RMSE | Root-mean-square error |
| SVD | Singular value decomposition |
References
- Wang, Q.; Hou, R.; Li, J.; Ke, Y. Analytical and experimental study on deformation of a thin-walled panel with non-ideal boundary conditions. Int. J. Mech. Sci. 2018, 149, 298–310. [Google Scholar] [CrossRef] [Scilit]
- Algül, İ.; Oktem, A.S. Analytical and numerical solutions to static analysis of moderately thick cross-ply plates and shells. Appl. Sci. 2022, 12, 12547. [Google Scholar] [CrossRef] [Scilit]
- El Yaakoubi-Mesbah, C.; Mittelstedt, C. Closed-form analytical solution for local buckling of omega-stringer-stiffened composite panels under compression. Compos. Struct. 2025, 353, 118716. [Google Scholar] [CrossRef] [Scilit]
- Amirpour, M.; Das, R.; Flores, E.I.S. Bending analysis of thin functionally graded plates under in-plane stiffness variations. Appl. Math. Model. 2017, 44, 481–496. [Google Scholar] [CrossRef] [Scilit]
- Khalid, I.; Qureshi, Z.A.; Oterkus, S.; Oterkus, E. Structural health monitoring of aerospace thin plate and shell structures using the inverse finite element method (iFEM). Thin-Walled Struct. 2025, 209, 112923. [Google Scholar] [CrossRef] [Scilit]
- Kumar, Y. The Rayleigh–Ritz method for linear dynamic, static and buckling behavior of beams, shells and plates: A literature review. J. Vib. Control 2018, 24, 1205–1227. [Google Scholar] [CrossRef] [Scilit]
- Stamatelos, D.G.; Labeas, G.N. Buckling analysis of laminated stiffened plates with material anisotropy using the Rayleigh–Ritz approach. Computation 2023, 11, 110. [Google Scholar] [CrossRef] [Scilit]
- Nieto, M.G.; Babu, S.S.; ElSayed, M.S.; Mourad, A.H.I. A comparative analysis of response-tracking techniques in aerospace dynamic systems using modal participation factors. Appl. Mech. 2023, 4, 1038–1065. [Google Scholar] [CrossRef] [Scilit]
- Bouckaert, I.; Piedboeuf, A.; Godio, M.; de Almeida, J.P. Modal analysis and superposition for dynamic response of structures with discontinuities using HybriDFEM. Finite Elem. Anal. Des. 2025, 249, 104360. [Google Scholar] [CrossRef] [Scilit]
- Morris, B.K.; Davis, R.B. Aeroelastic analysis of an idealized landing-gear door in subsonic potential flow. J. Fluids Struct. 2020, 99, 103163. [Google Scholar] [CrossRef] [Scilit]
- Franke Goularte, B.; Zatko, V.; Lion, A.; Johlitz, M. Elastomeric door-seal analysis under aircraft cabin pressure. J. Rubber Res. 2021, 24, 301–318. [Google Scholar] [CrossRef] [Scilit]
- Zhang, C.; Liu, R.; Tao, C.; Zhang, C.; Ji, H.; Qiu, J. Design, construction, and modeling of an aircraft door sealing plate based on shape-memory alloys. Int. J. Smart Nano Mater. 2022, 13, 481–503. [Google Scholar] [CrossRef] [Scilit]
- Fiačan, J.; Jenis, J.; Čechmánek, D.; Hrček, S.; Michal, P. Structural design and safety verification of a service hatch used at airports by FEM analysis. Infrastructures 2023, 8, 73. [Google Scholar] [CrossRef] [Scilit]
- Chen, Z.; Li, H.; Li, Z.; Chen, Y.; Chen, J.; Li, X. Structural lightweight design and experimental validation for an aerospace sealed cabin. Front. Mech. Eng. 2023, 9, 1265734. [Google Scholar] [CrossRef] [Scilit]
- Yang, Q.; Peng, X. Sensitivity analysis using a reduced finite element model for structural damage identification. Materials 2021, 14, 5514. [Google Scholar] [CrossRef] [Scilit] [PubMed]
- Jiang, D.; Cui, W.; Wan, F.; Han, Y.; Wang, X.; Jiang, C. Sensitivity analysis and reliability optimization method based on an aircraft cabin-door lock mechanism. In Proceedings of the 2022 Global Reliability and Prognostics and Health Management Conference (PHM-Yantai), Yantai, China, 13–16 October 2022; pp. 1–7. [Google Scholar]
- Mufti, B.; Perron, C.; Mavris, D.N. Multifidelity methodology for reduced-order models with high-dimensional inputs. AIAA J. 2024, 62, 3932–3947. [Google Scholar] [CrossRef] [Scilit]
- Medeiros, R.R.; Cesnik, C.E.S.; Stodieck, O.; Calderon, D.E.; Cooper, J.E.; Coetzee, E.B. Comparison of structural model-reduction methods applied to a large-deformation wing box. Aeronaut. J. 2021, 125, 1687–1709. [Google Scholar] [CrossRef] [Scilit]
- Zhao, X.; Zhang, C.; Xu, L.; Wang, T.; Li, P.; Zhang, H.; Yang, J. Gap measurements in aerospace engineering. Sensors 2025, 25, 3059. [Google Scholar] [CrossRef] [Scilit] [PubMed]
- Yang, R.; Li, Y.; Zeng, D.; Guo, P. Deep DIC: Deep-learning-based digital image correlation for end-to-end displacement and strain measurement. J. Mater. Process. Technol. 2022, 302, 117474. [Google Scholar] [CrossRef] [Scilit]
- Liu, Y.; Yan, D.; Li, L.; Lin, X.; Guo, L. Three-dimensional mapping technology for structural deformation during aircraft assembly. Photonics 2023, 10, 318. [Google Scholar] [CrossRef] [Scilit]
- Yan, Q.; Yang, C.; Wan, Z. A comparative regression analysis between principal-component and partial-least-squares methods for flight-load calculation. Appl. Sci. 2023, 13, 8428. [Google Scholar]
- Duma, Z.S.; Susiluoto, J.; Lamminpää, O.; Sihvonen, T.; Reinikainen, S.P.; Haario, H. KF-PLS: Optimizing kernel partial least squares with kernel flows. Chemom. Intell. Lab. Syst. 2024, 254, 105238. [Google Scholar] [CrossRef] [Scilit]
- Visser, C.H.; Venter, G.; Neaves, M. A strain-gauge-based method for compensation of out-of-plane motions in 2D digital image correlation. Math. Comput. Appl. 2023, 28, 40. [Google Scholar] [CrossRef] [Scilit]
- Mallya, R.; Uchil, A.K.; Shenoy, S.B.; Pai, A. Application of digital image correlation in aerospace engineering: Structural health monitoring of aircraft components. Aerosp. Syst. 2024, 7, 663–675. [Google Scholar] [CrossRef] [Scilit]
- Geng, B.; Yue, C.; Xia, W.; Jia, R.; Xu, Y. Research on online prediction of deformation of thin-walled parts based on digital twin technology. Int. J. Adv. Manuf. Technol. 2024, 133, 1365–1378. [Google Scholar] [CrossRef] [Scilit]
- Tian, K.; Xu, Z.; Sun, Z.; Hu, X.; Zhang, P.; Zhou, Z. A general digital twin modeling framework for full-field structural strength assessment and prediction. Aerosp. Sci. Technol. 2026, 173, 111766. [Google Scholar] [CrossRef] [Scilit]
- Chen, Q.; Zhang, Y.; Dong, X.; Cui, J.; Lu, Y.; Zheng, P.; Liu, W. A high-accuracy shape sensing method for deformation digital twin monitoring of thin-walled aircraft structures. Aerosp. Sci. Technol. 2026, 168, 110960. [Google Scholar] [CrossRef] [Scilit]
- Chen, H.; Chen, J.; Li, Z.; Liu, Y.; Wang, J. Digital twin modeling enabling structure full field data reconstruction by variable fidelity data fusion. Mech. Syst. Signal Process. 2025, 230, 112619. [Google Scholar] [CrossRef] [Scilit]
- Gao, T.; Huang, Y.; Hu, X.; Yu, K.; Ge, M.; Tian, K. Digital twin for synchronous full-field deformation reconstruction of composite trusses under dynamic load. Compos. Part B Eng. 2026, 313, 113338. [Google Scholar] [CrossRef] [Scilit]
- Editorial Committee of Aircraft Design Handbook. Aircraft Design Handbook, Volume 7: Preliminary Civil Aircraft Configuration Design and Integrated Propulsion System Design; Aviation Industry Press: Beijing, China, 2000. [Google Scholar]
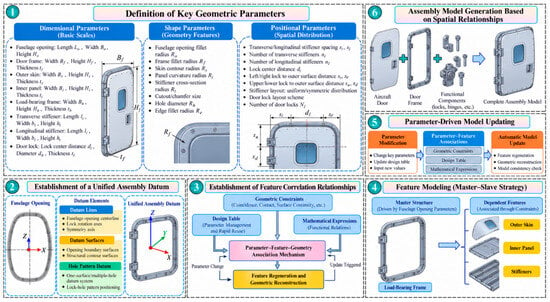
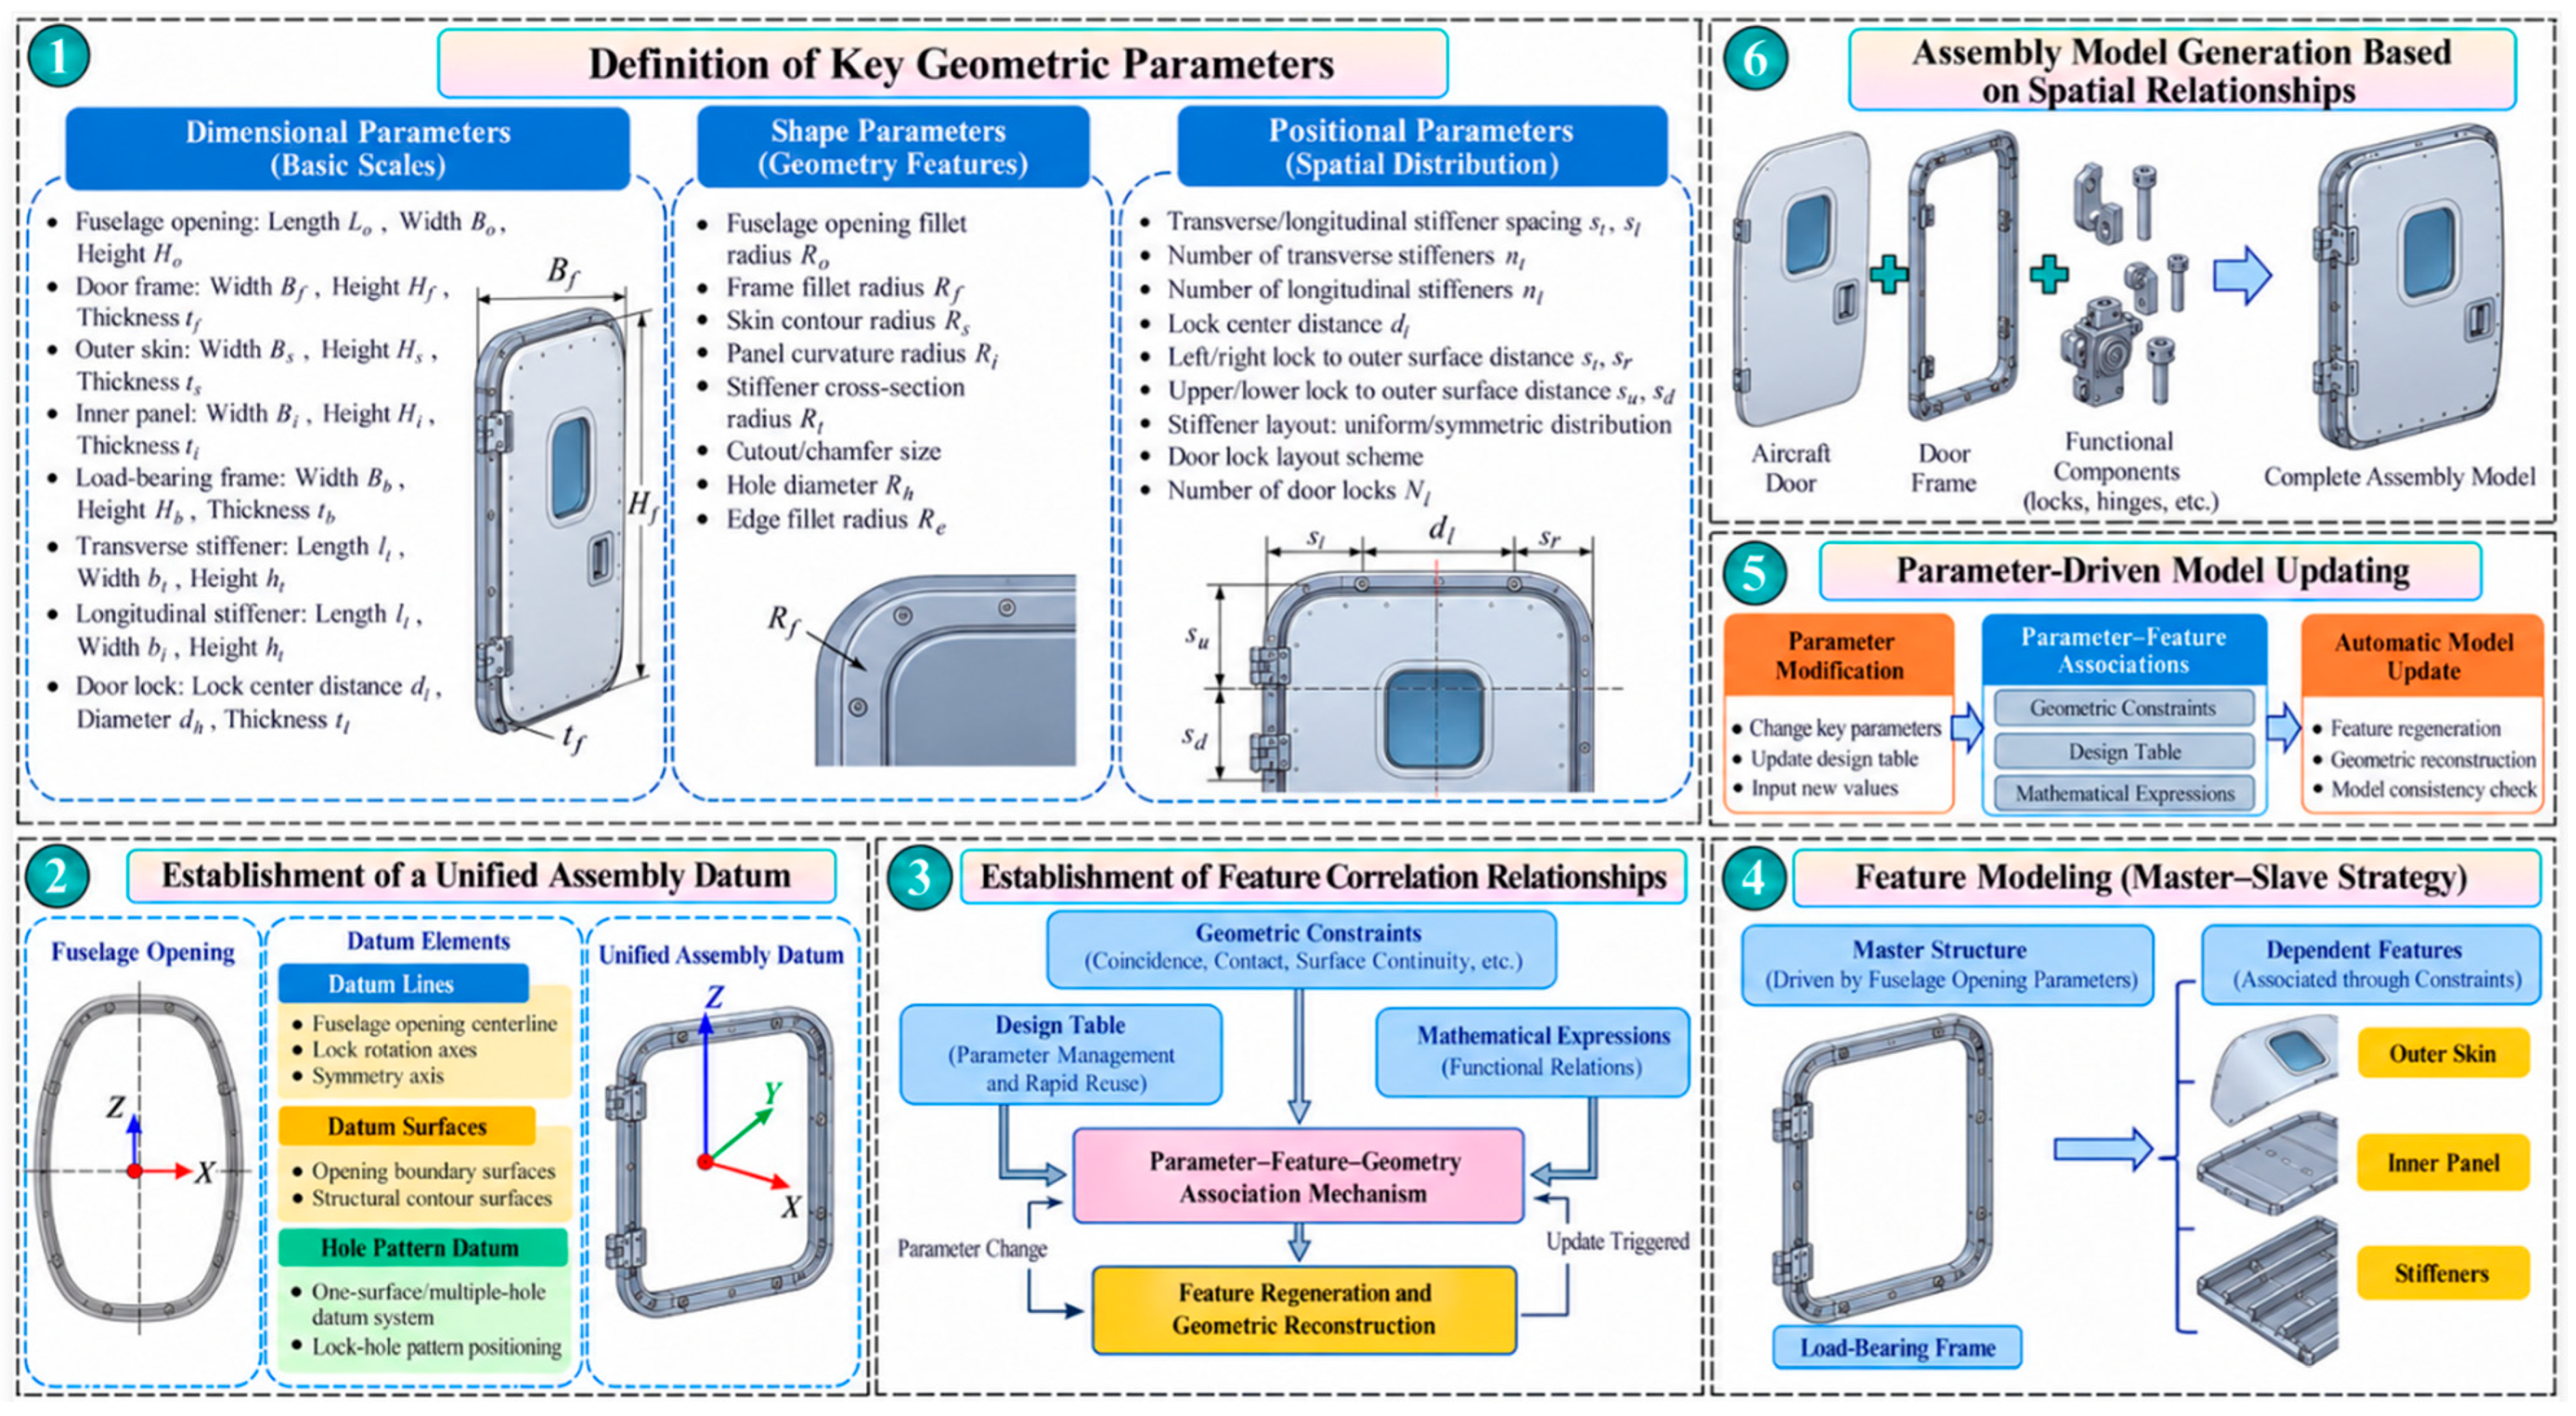
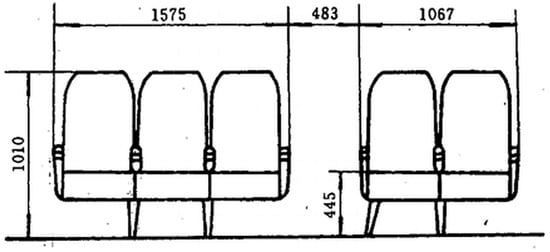
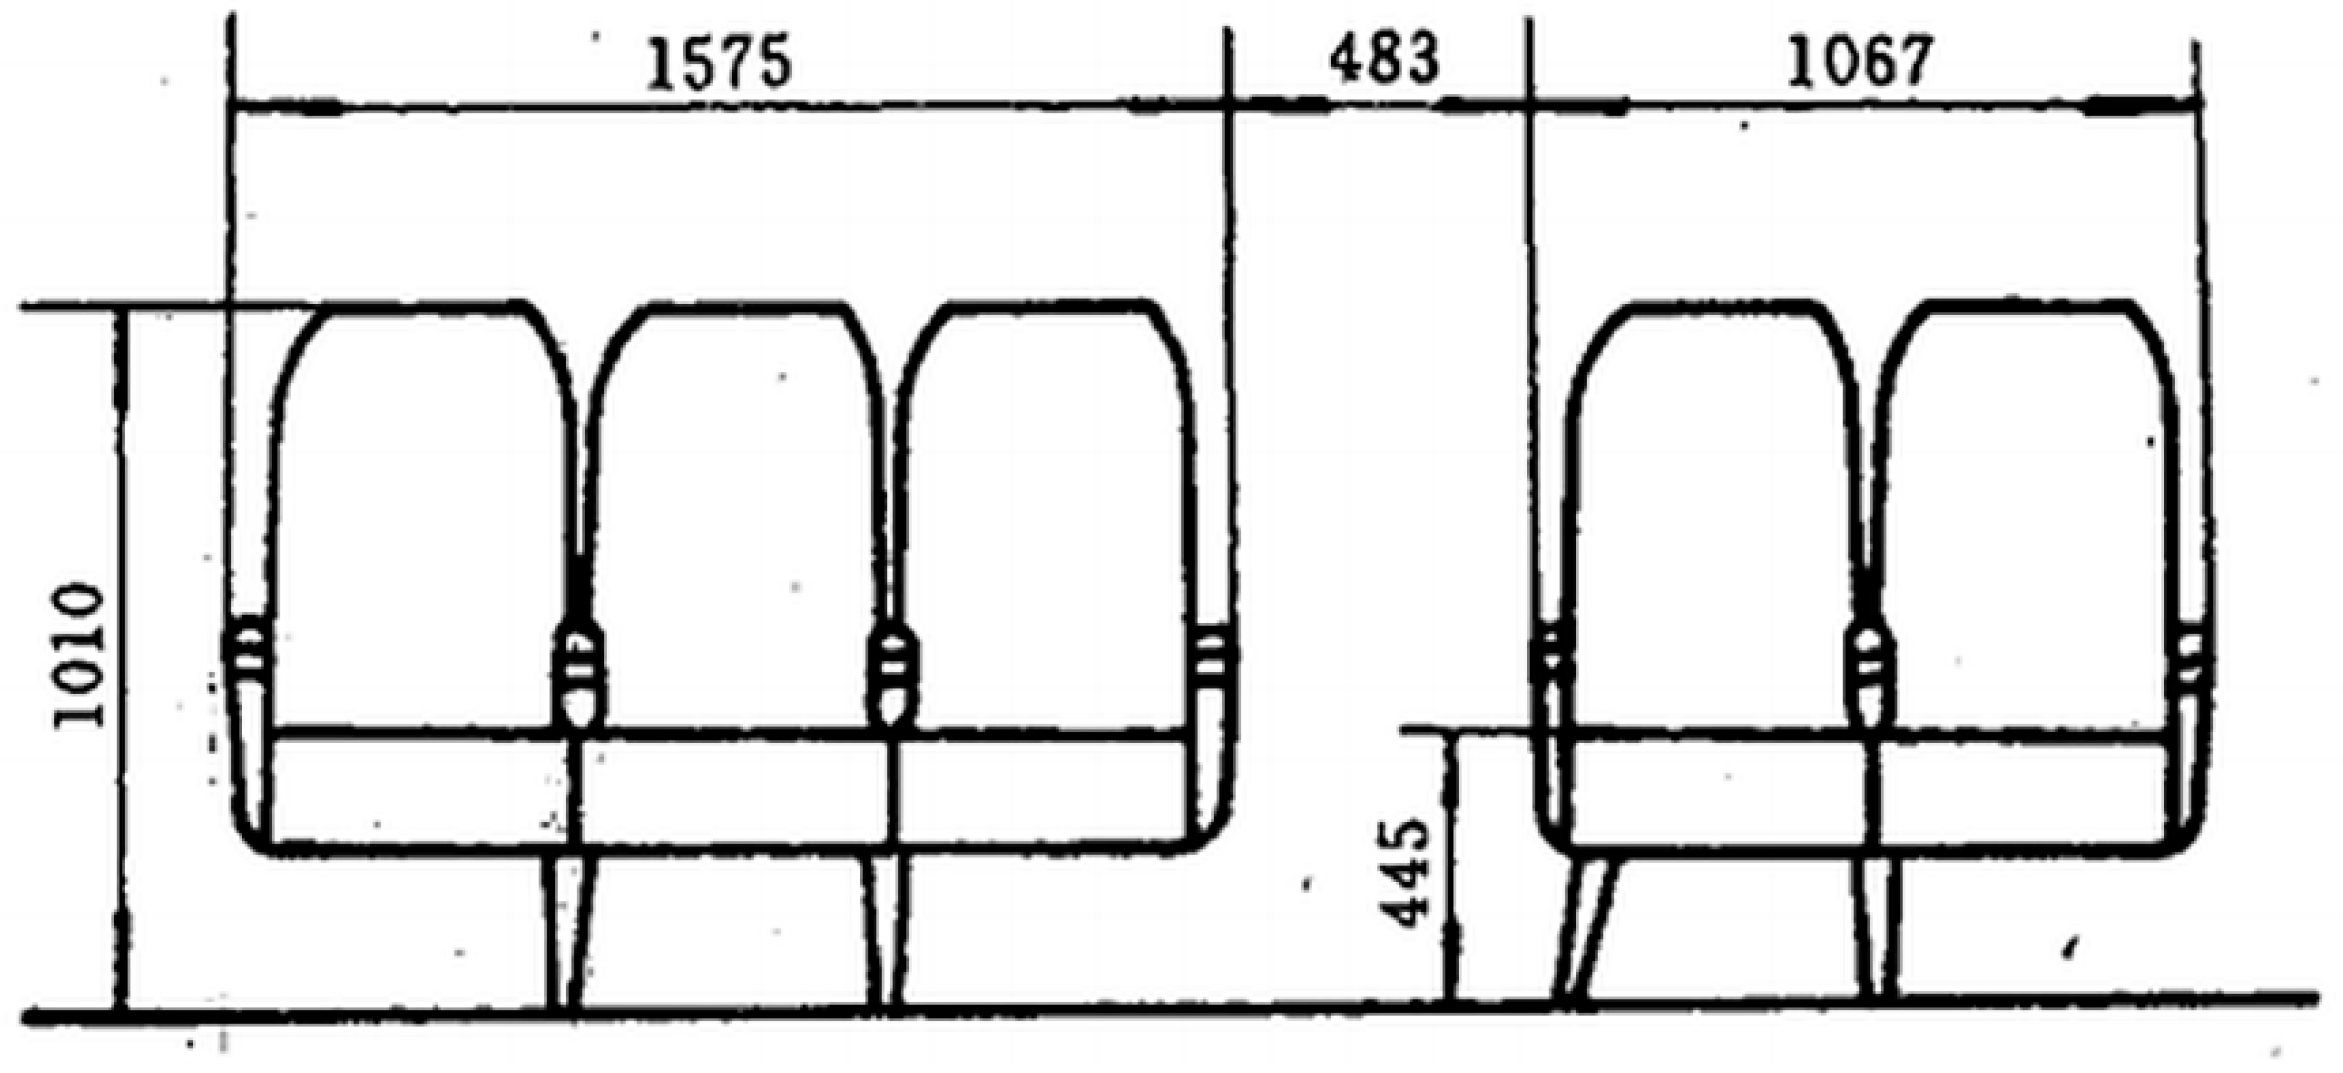
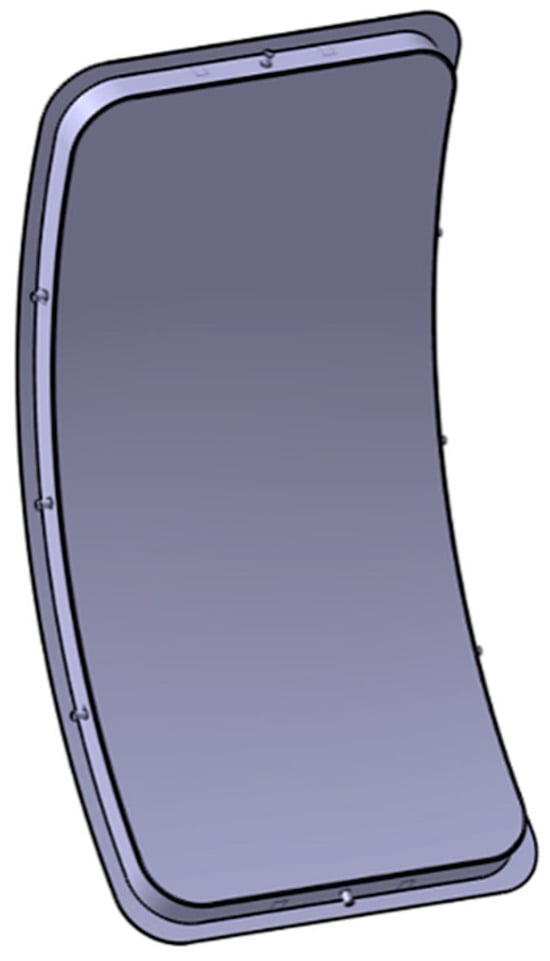
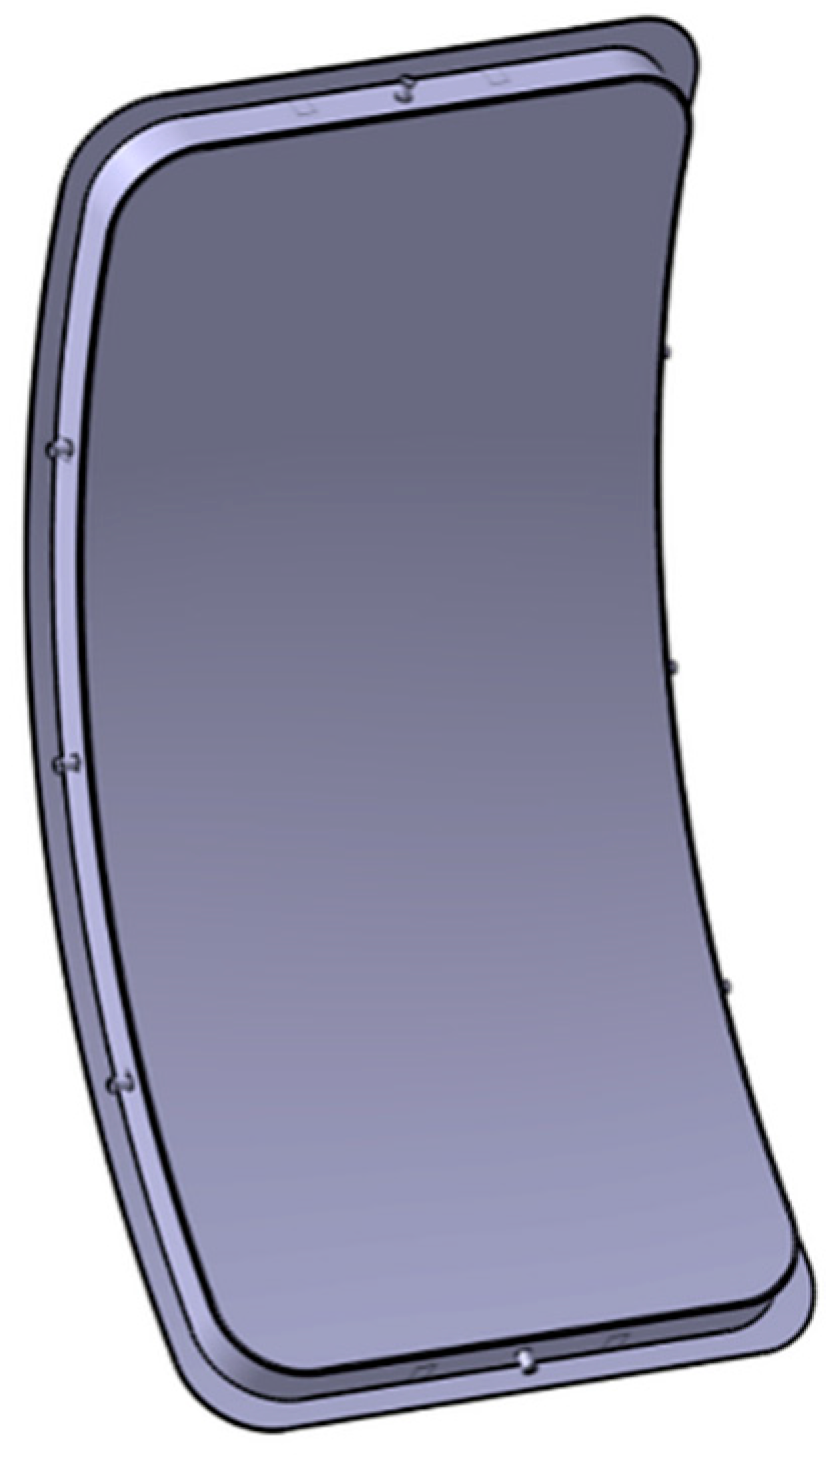
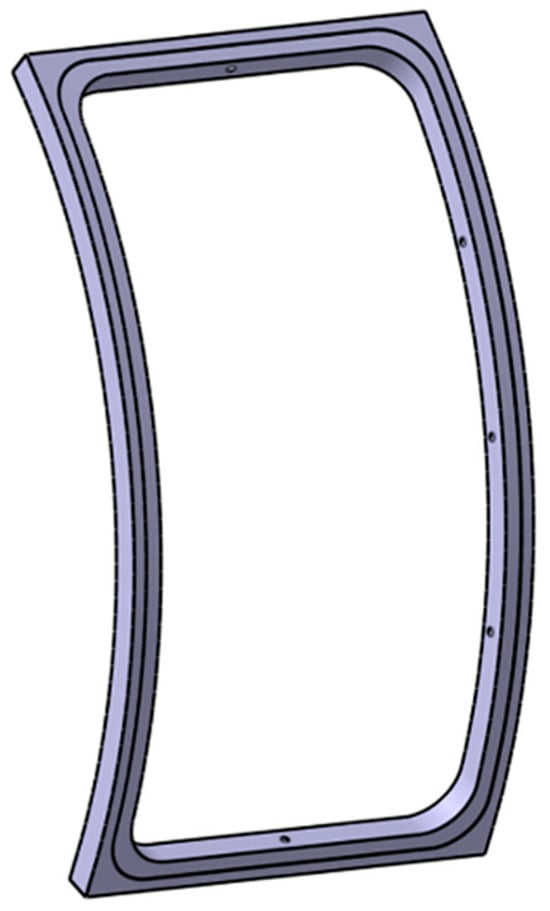
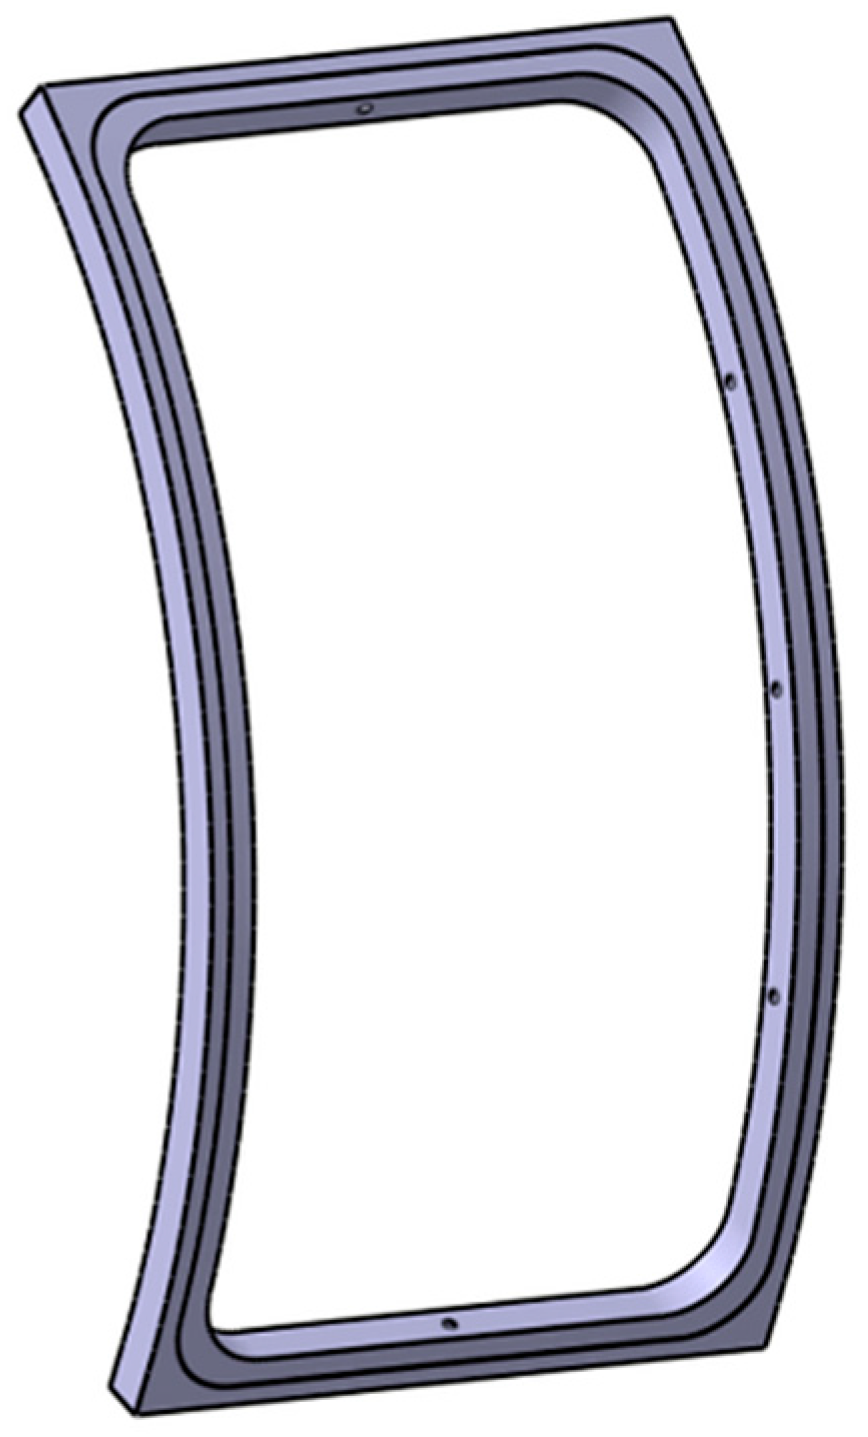
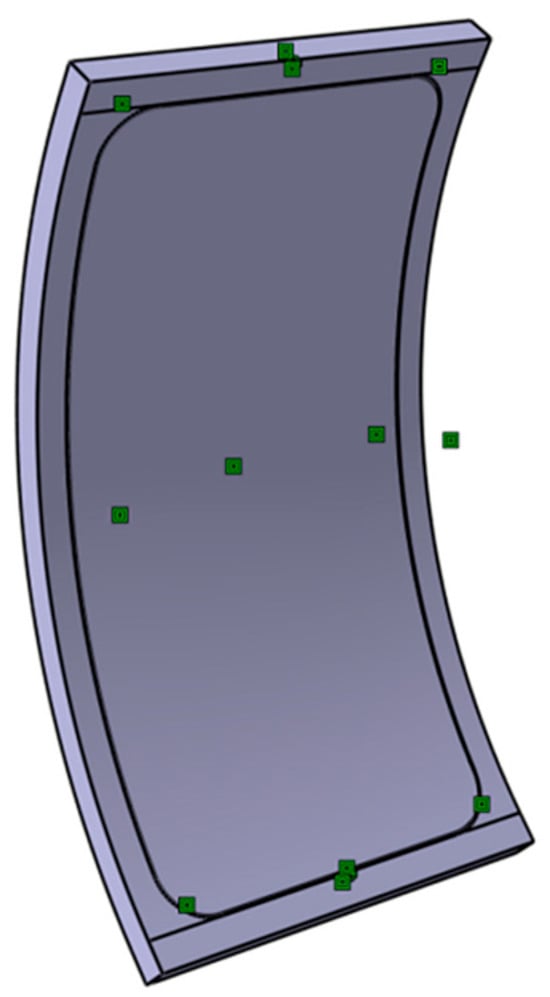
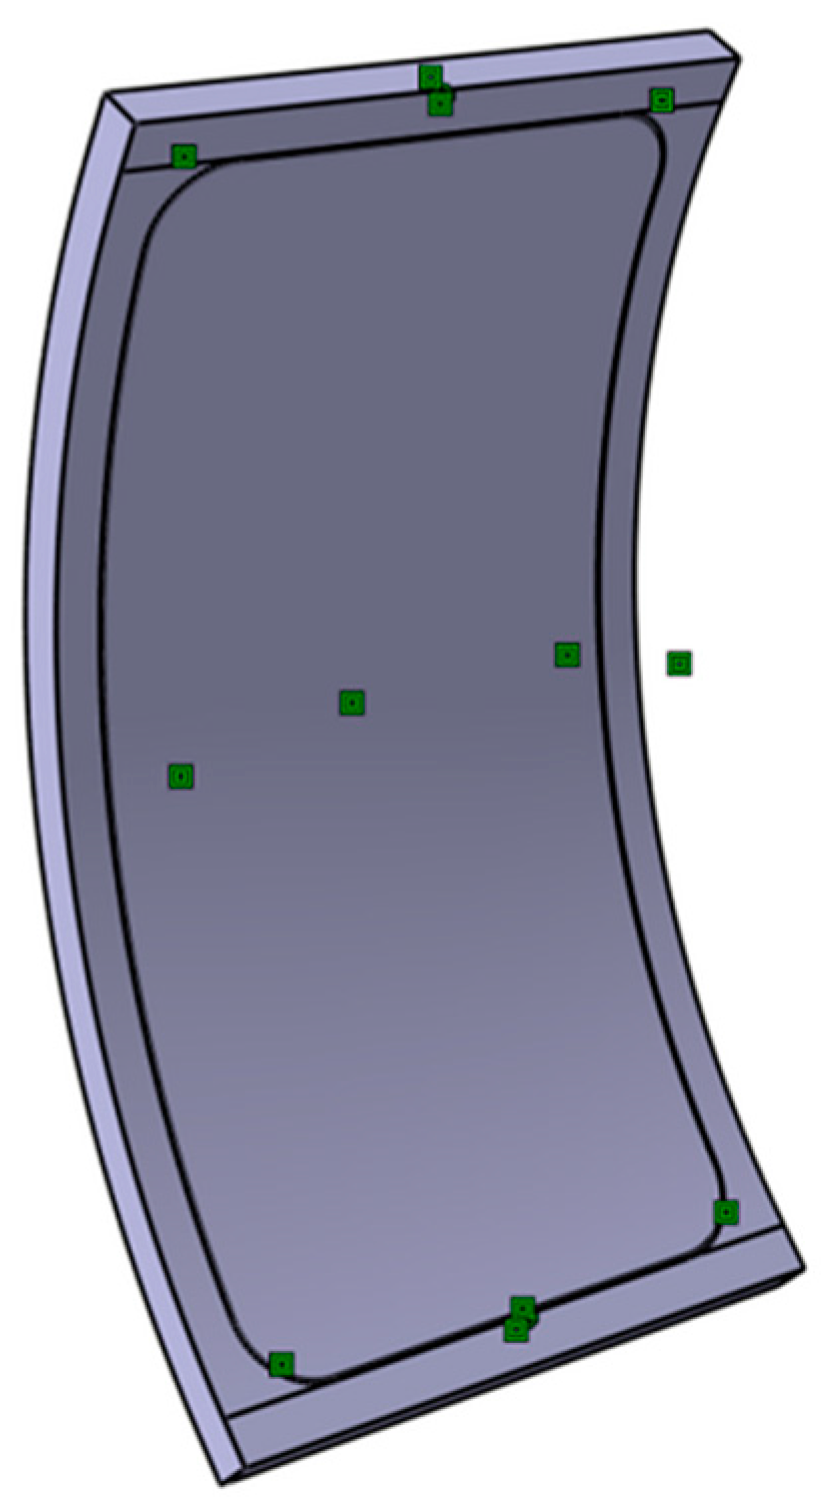
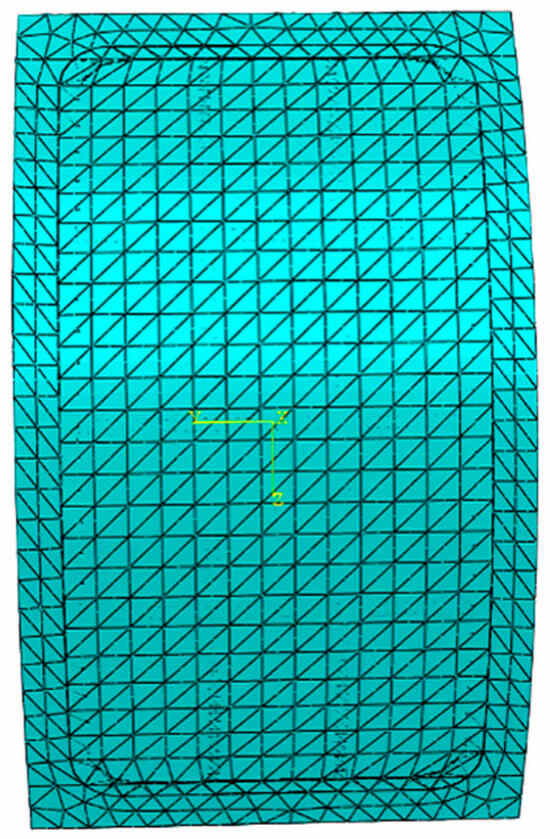
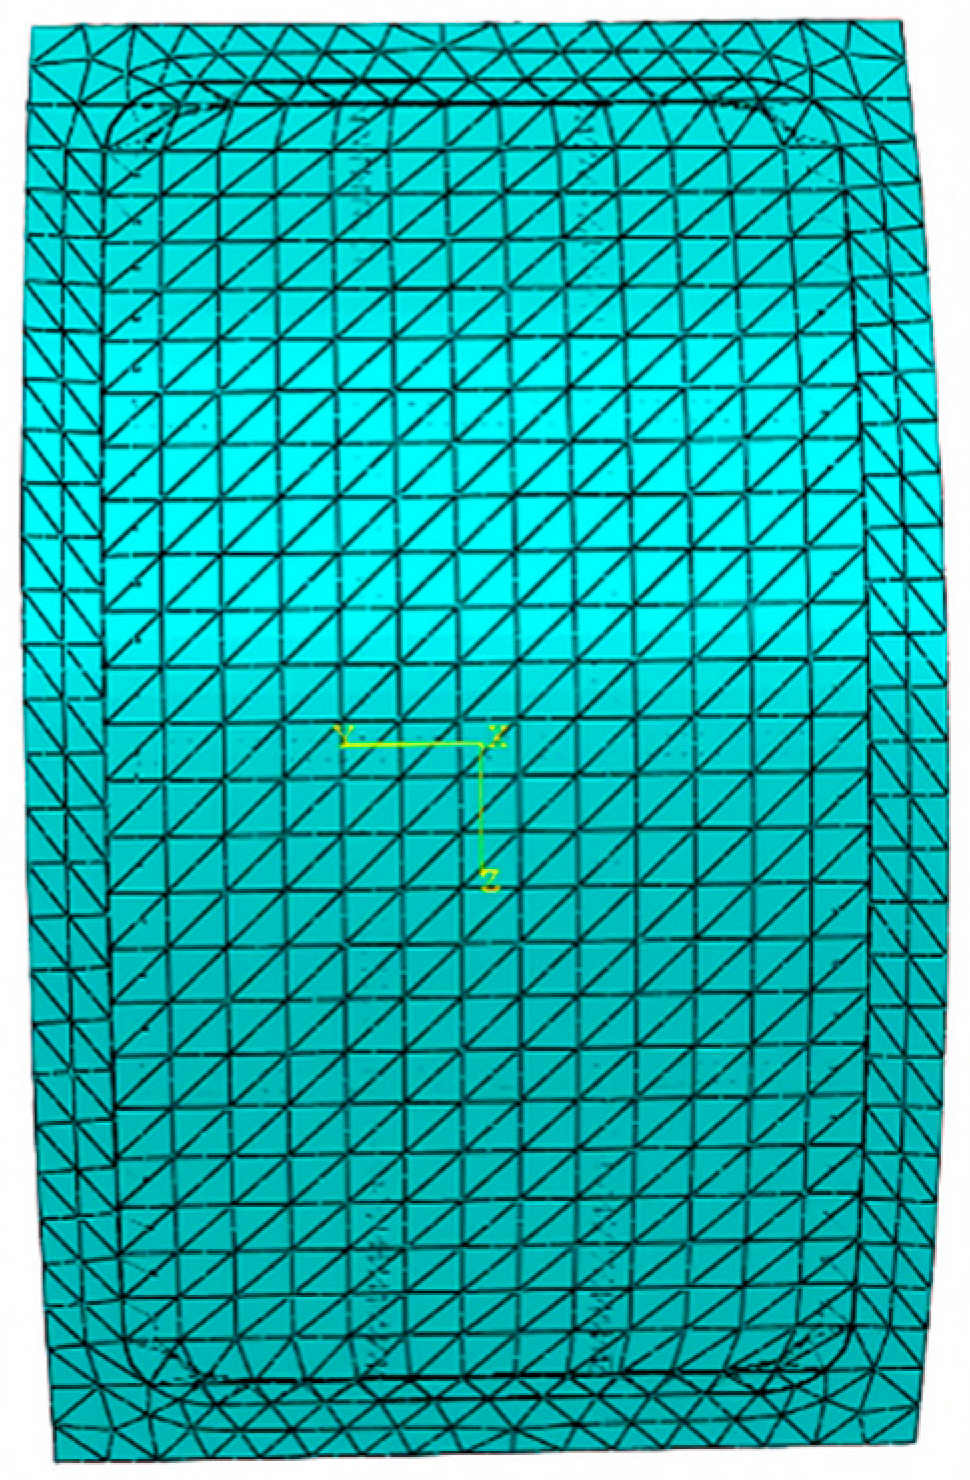
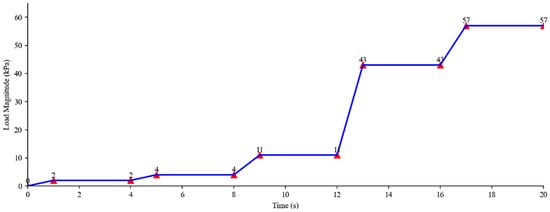
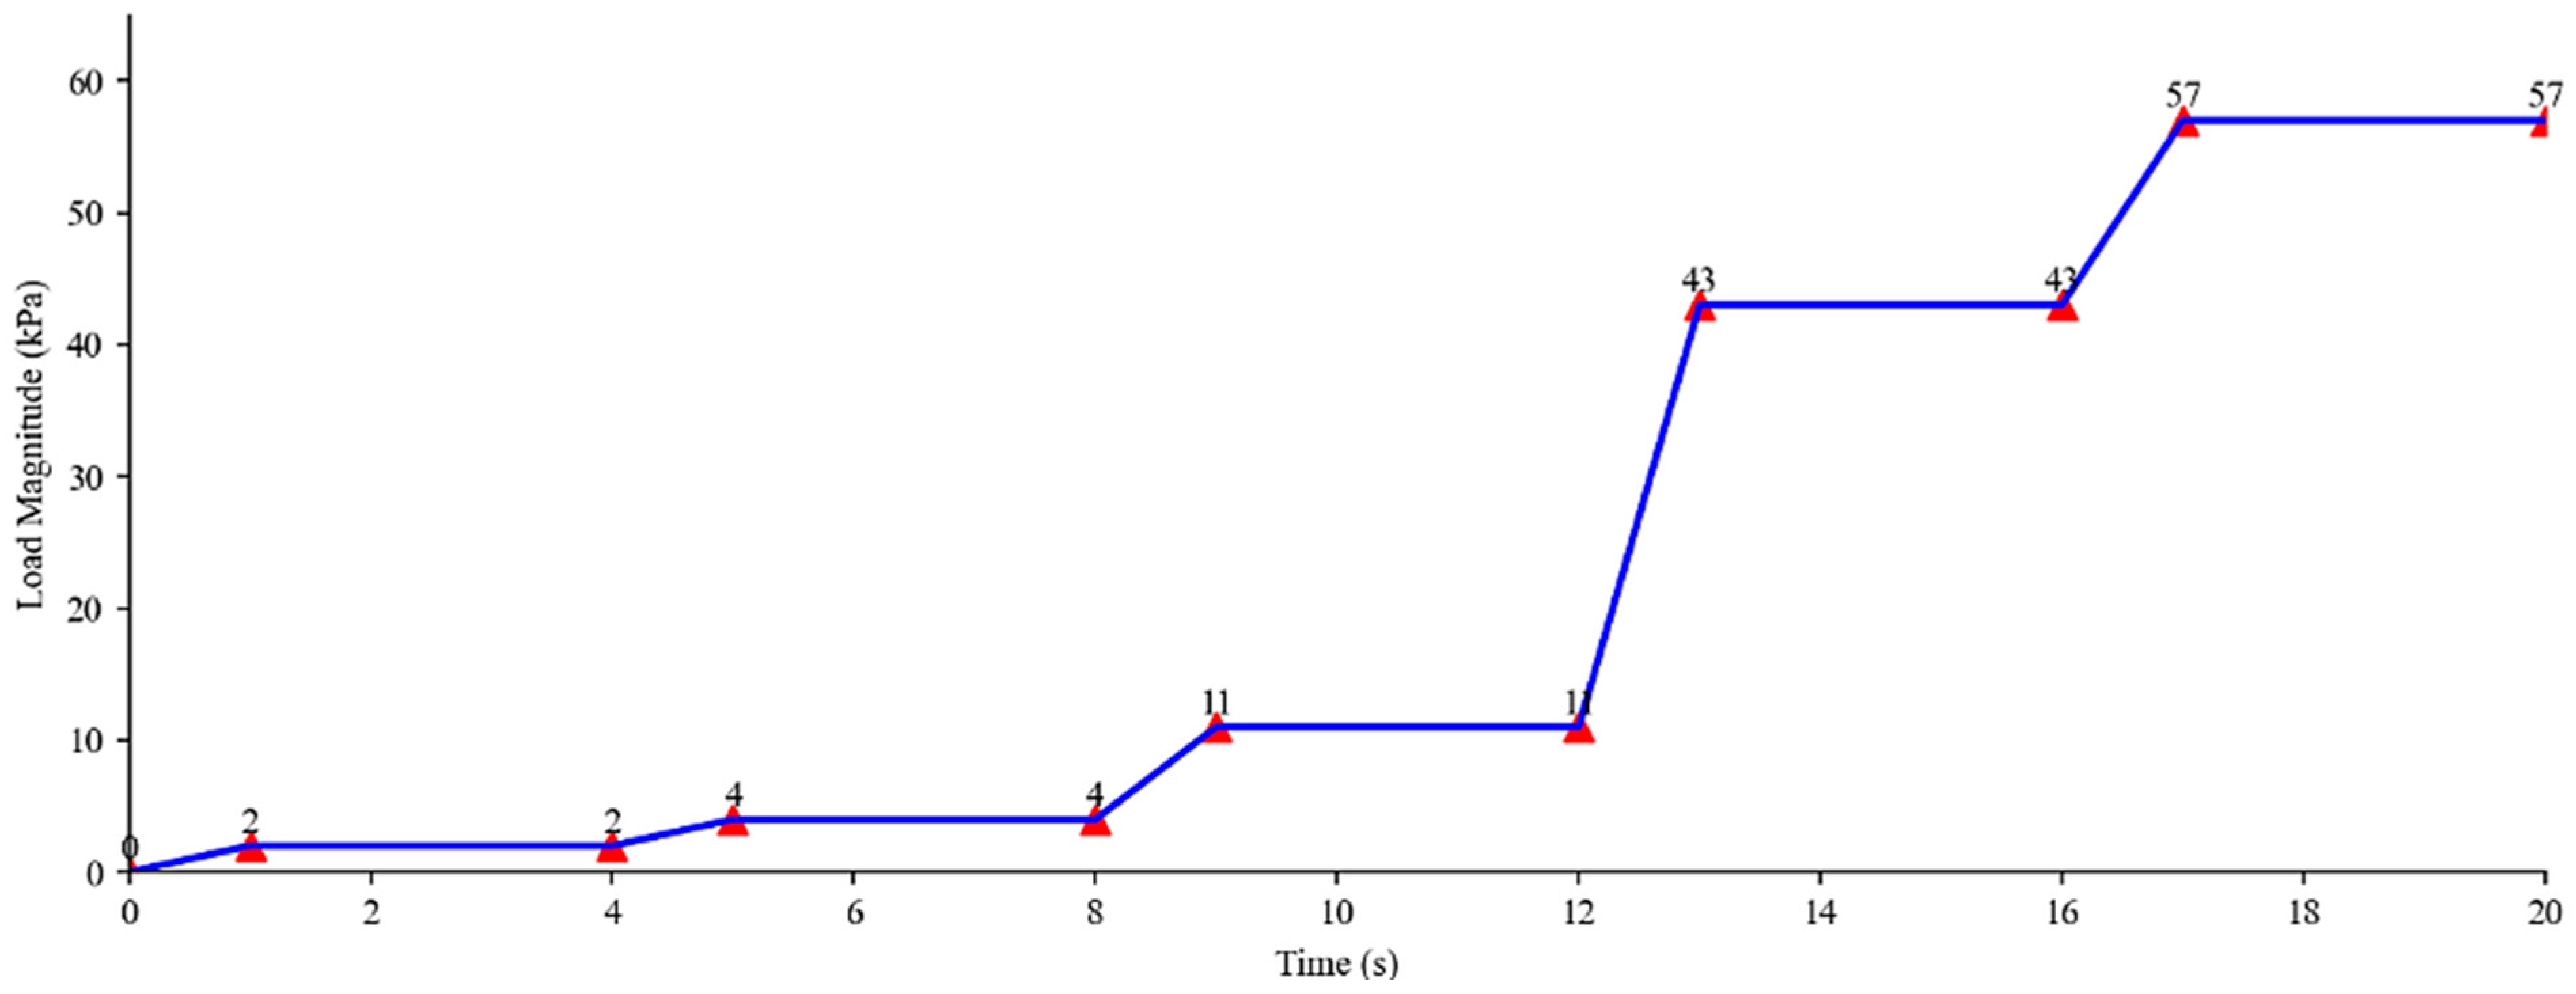
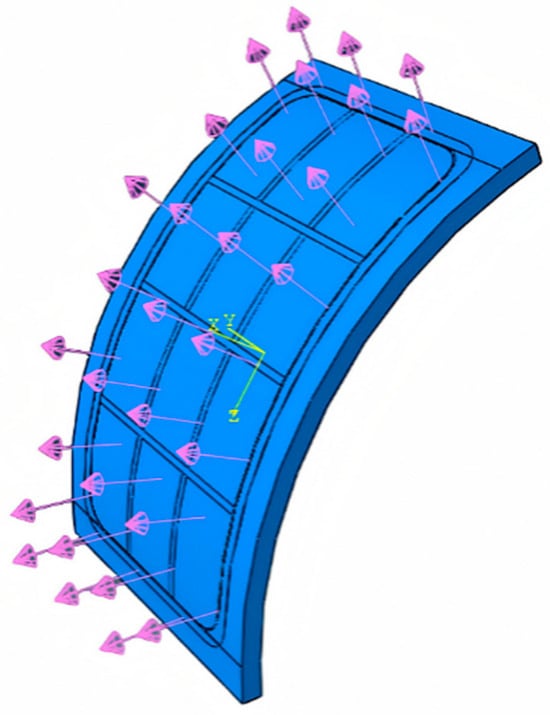
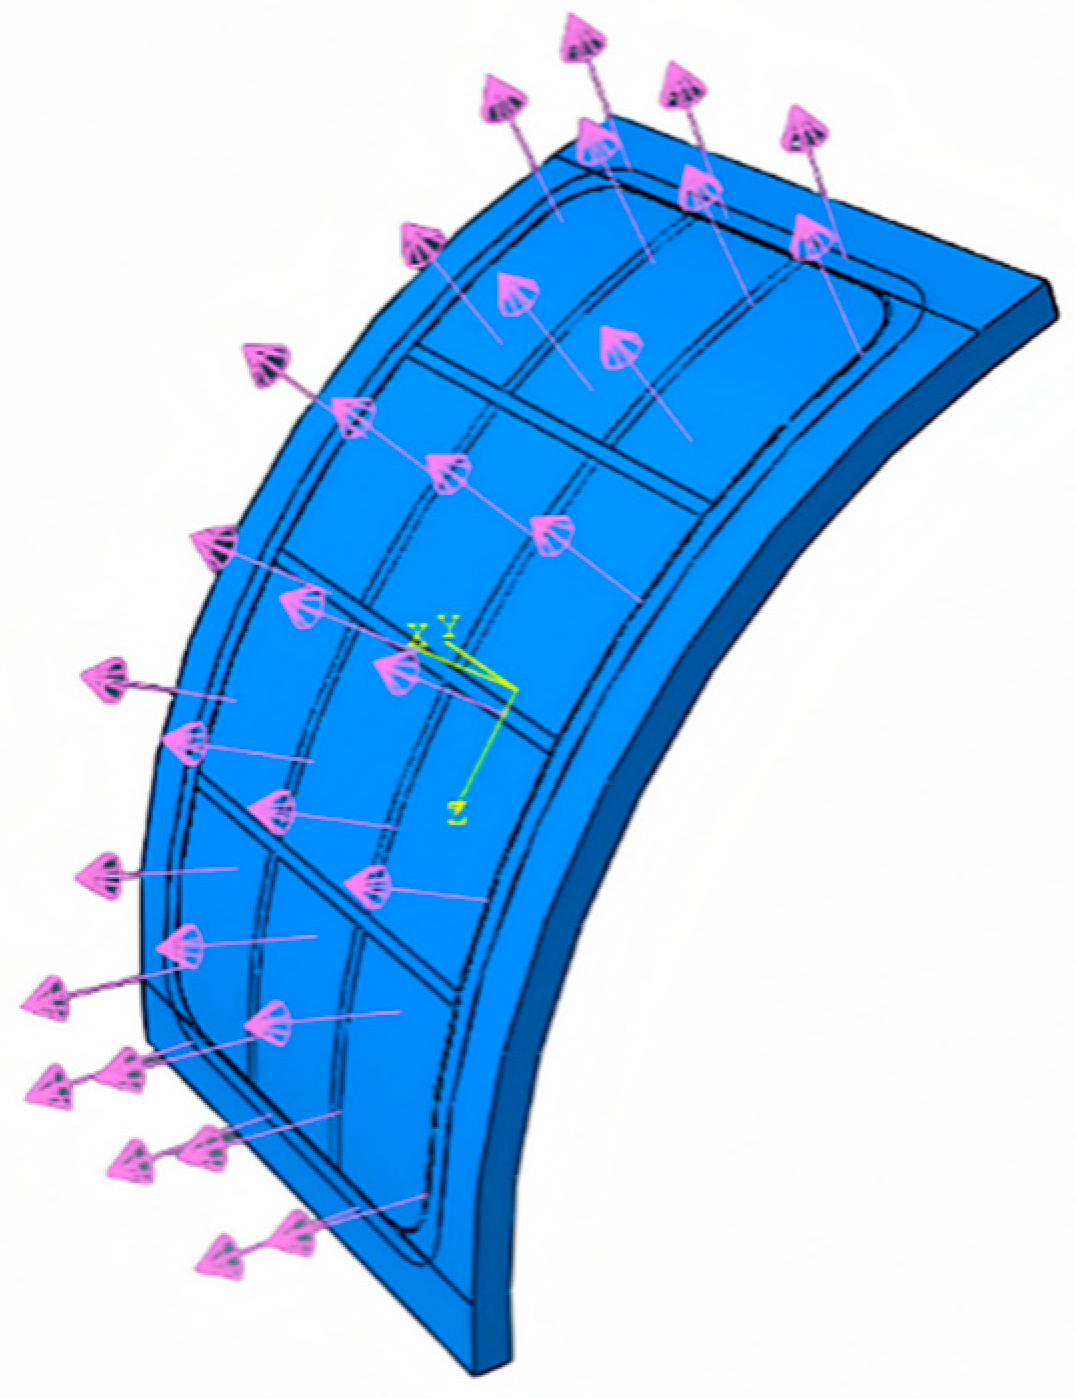
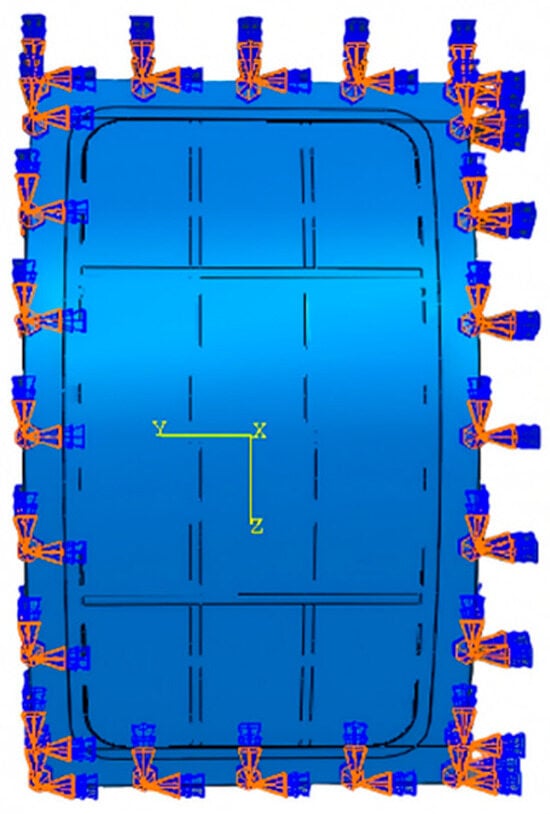
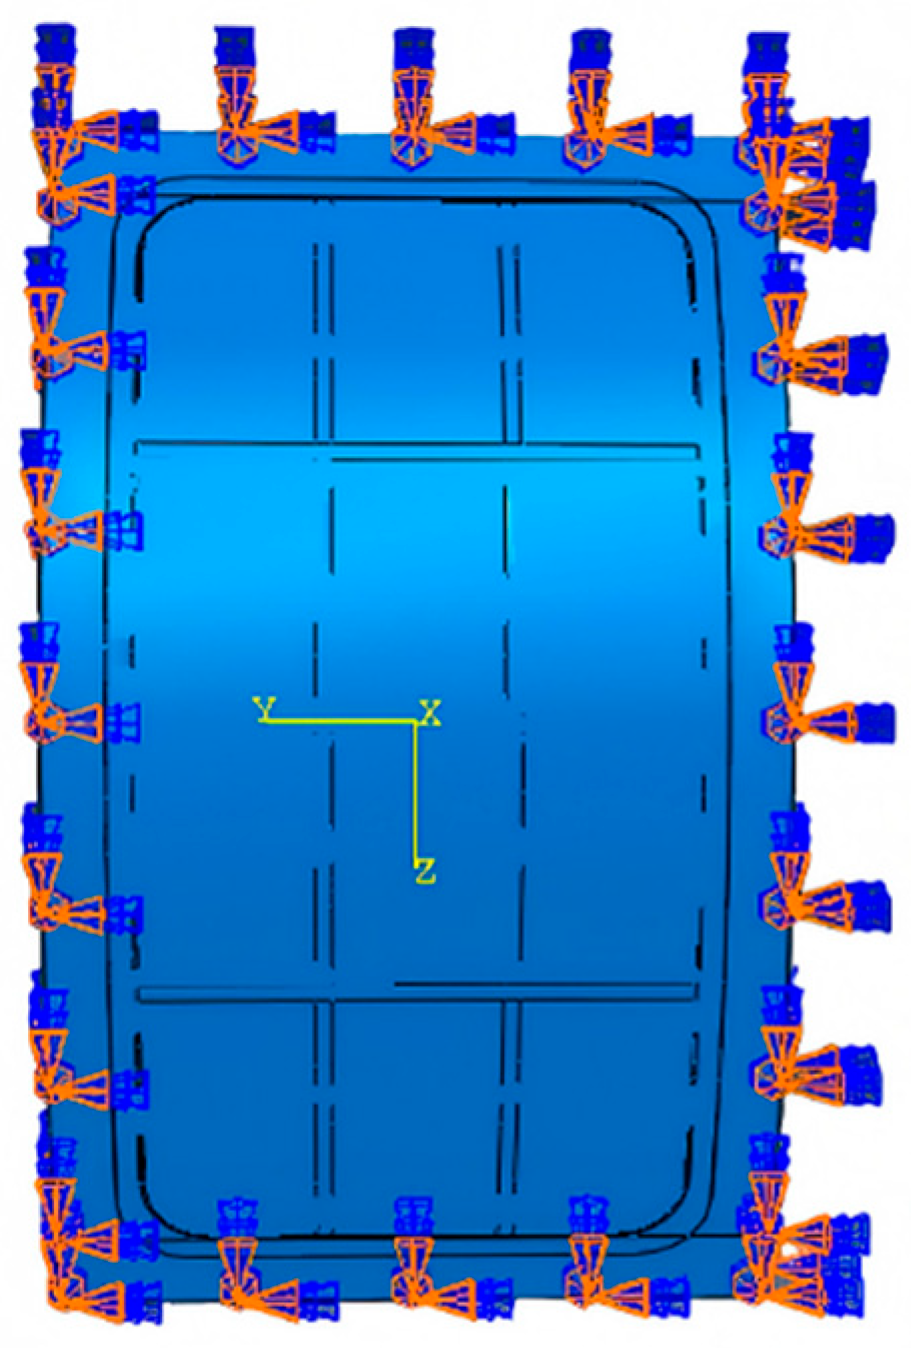
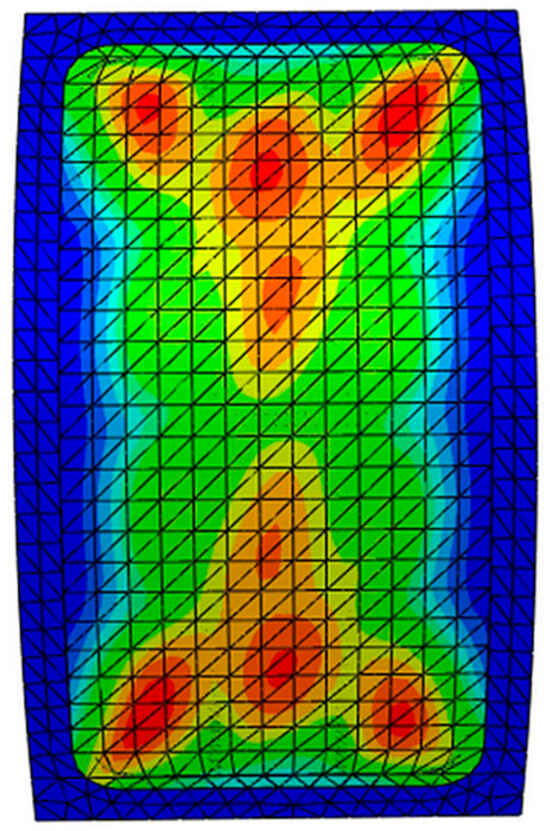
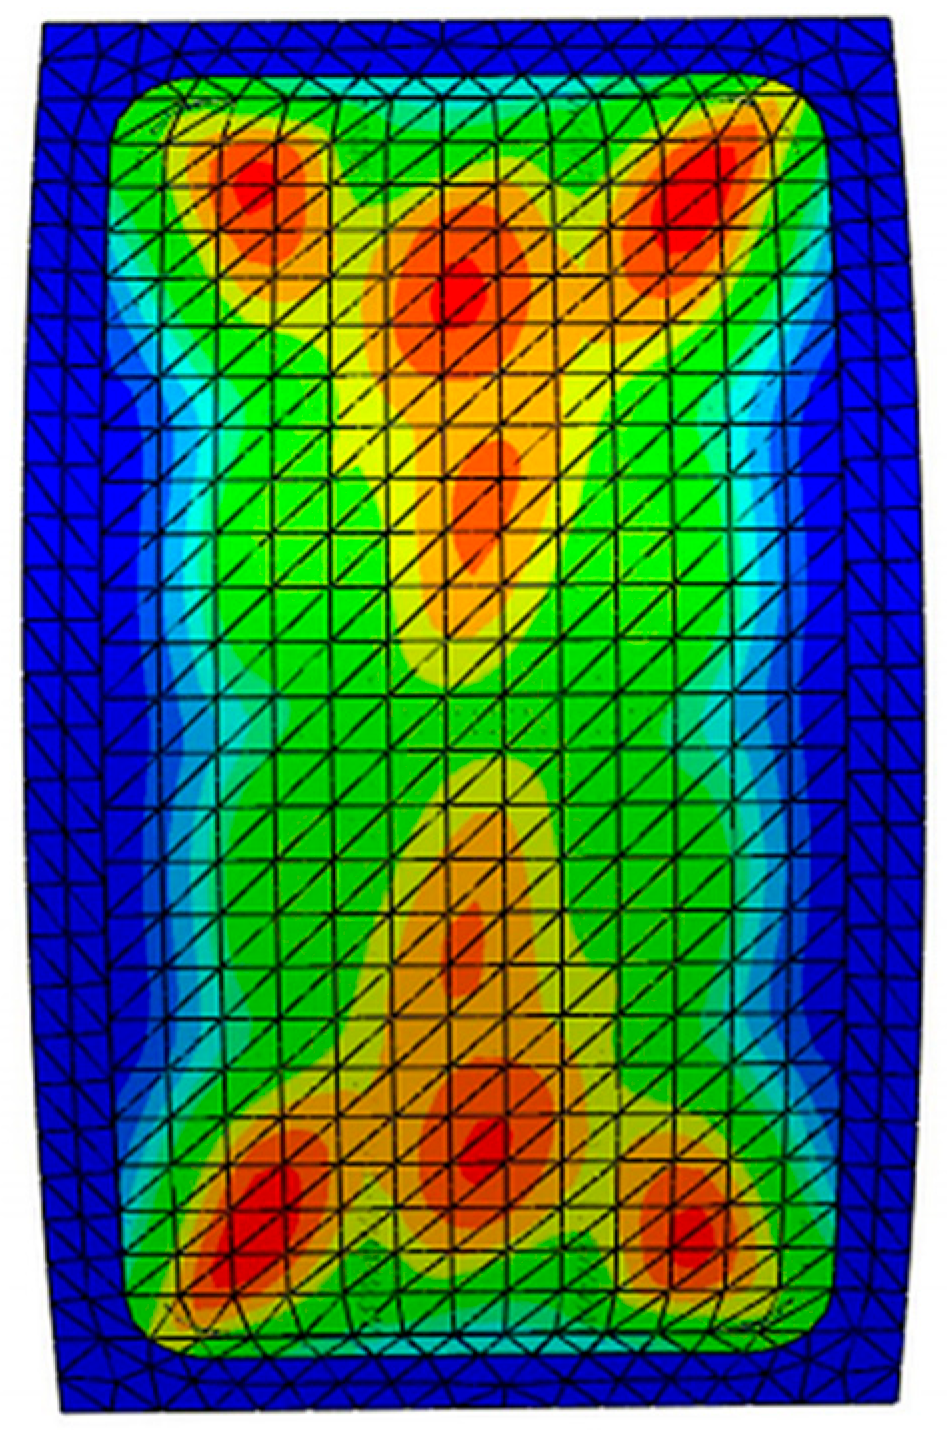
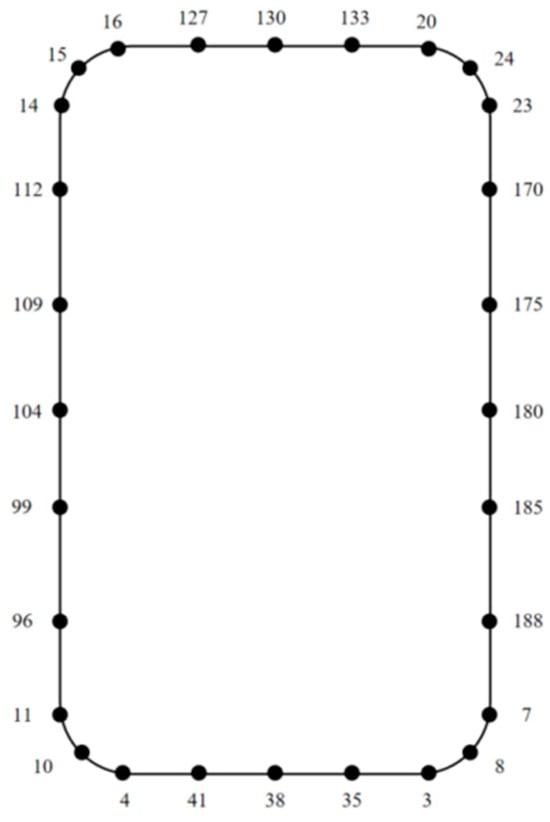
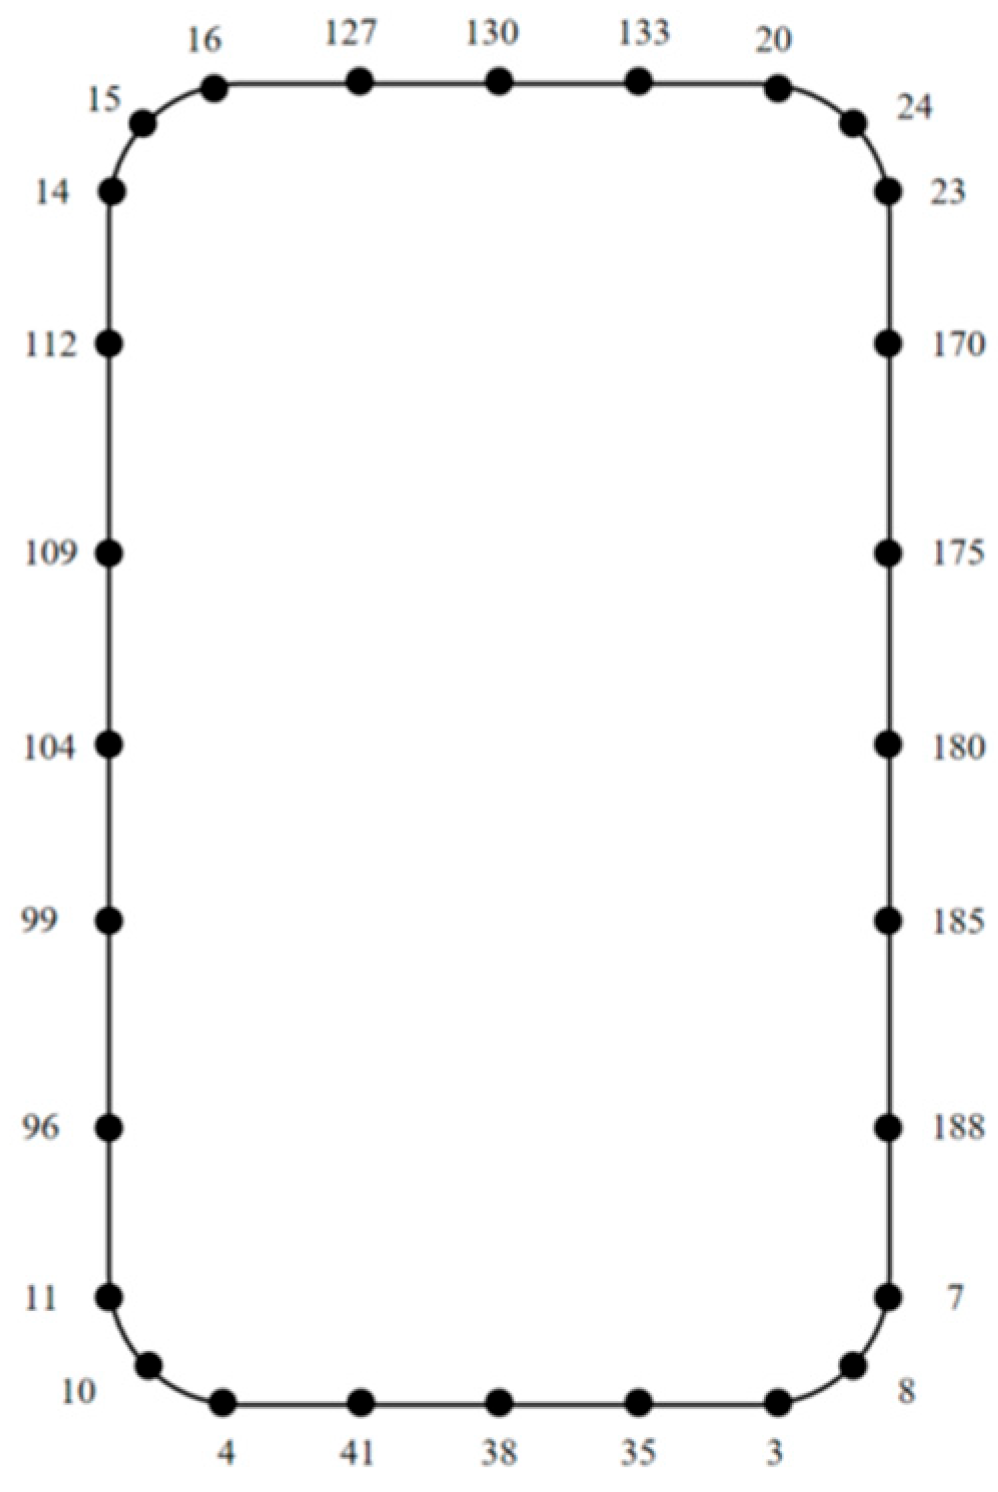
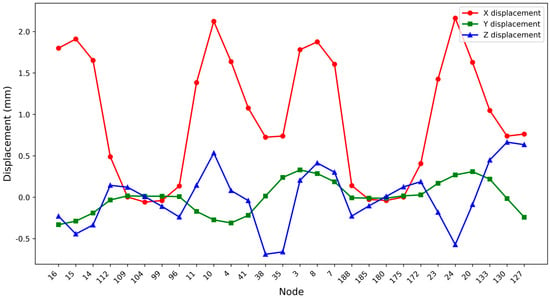
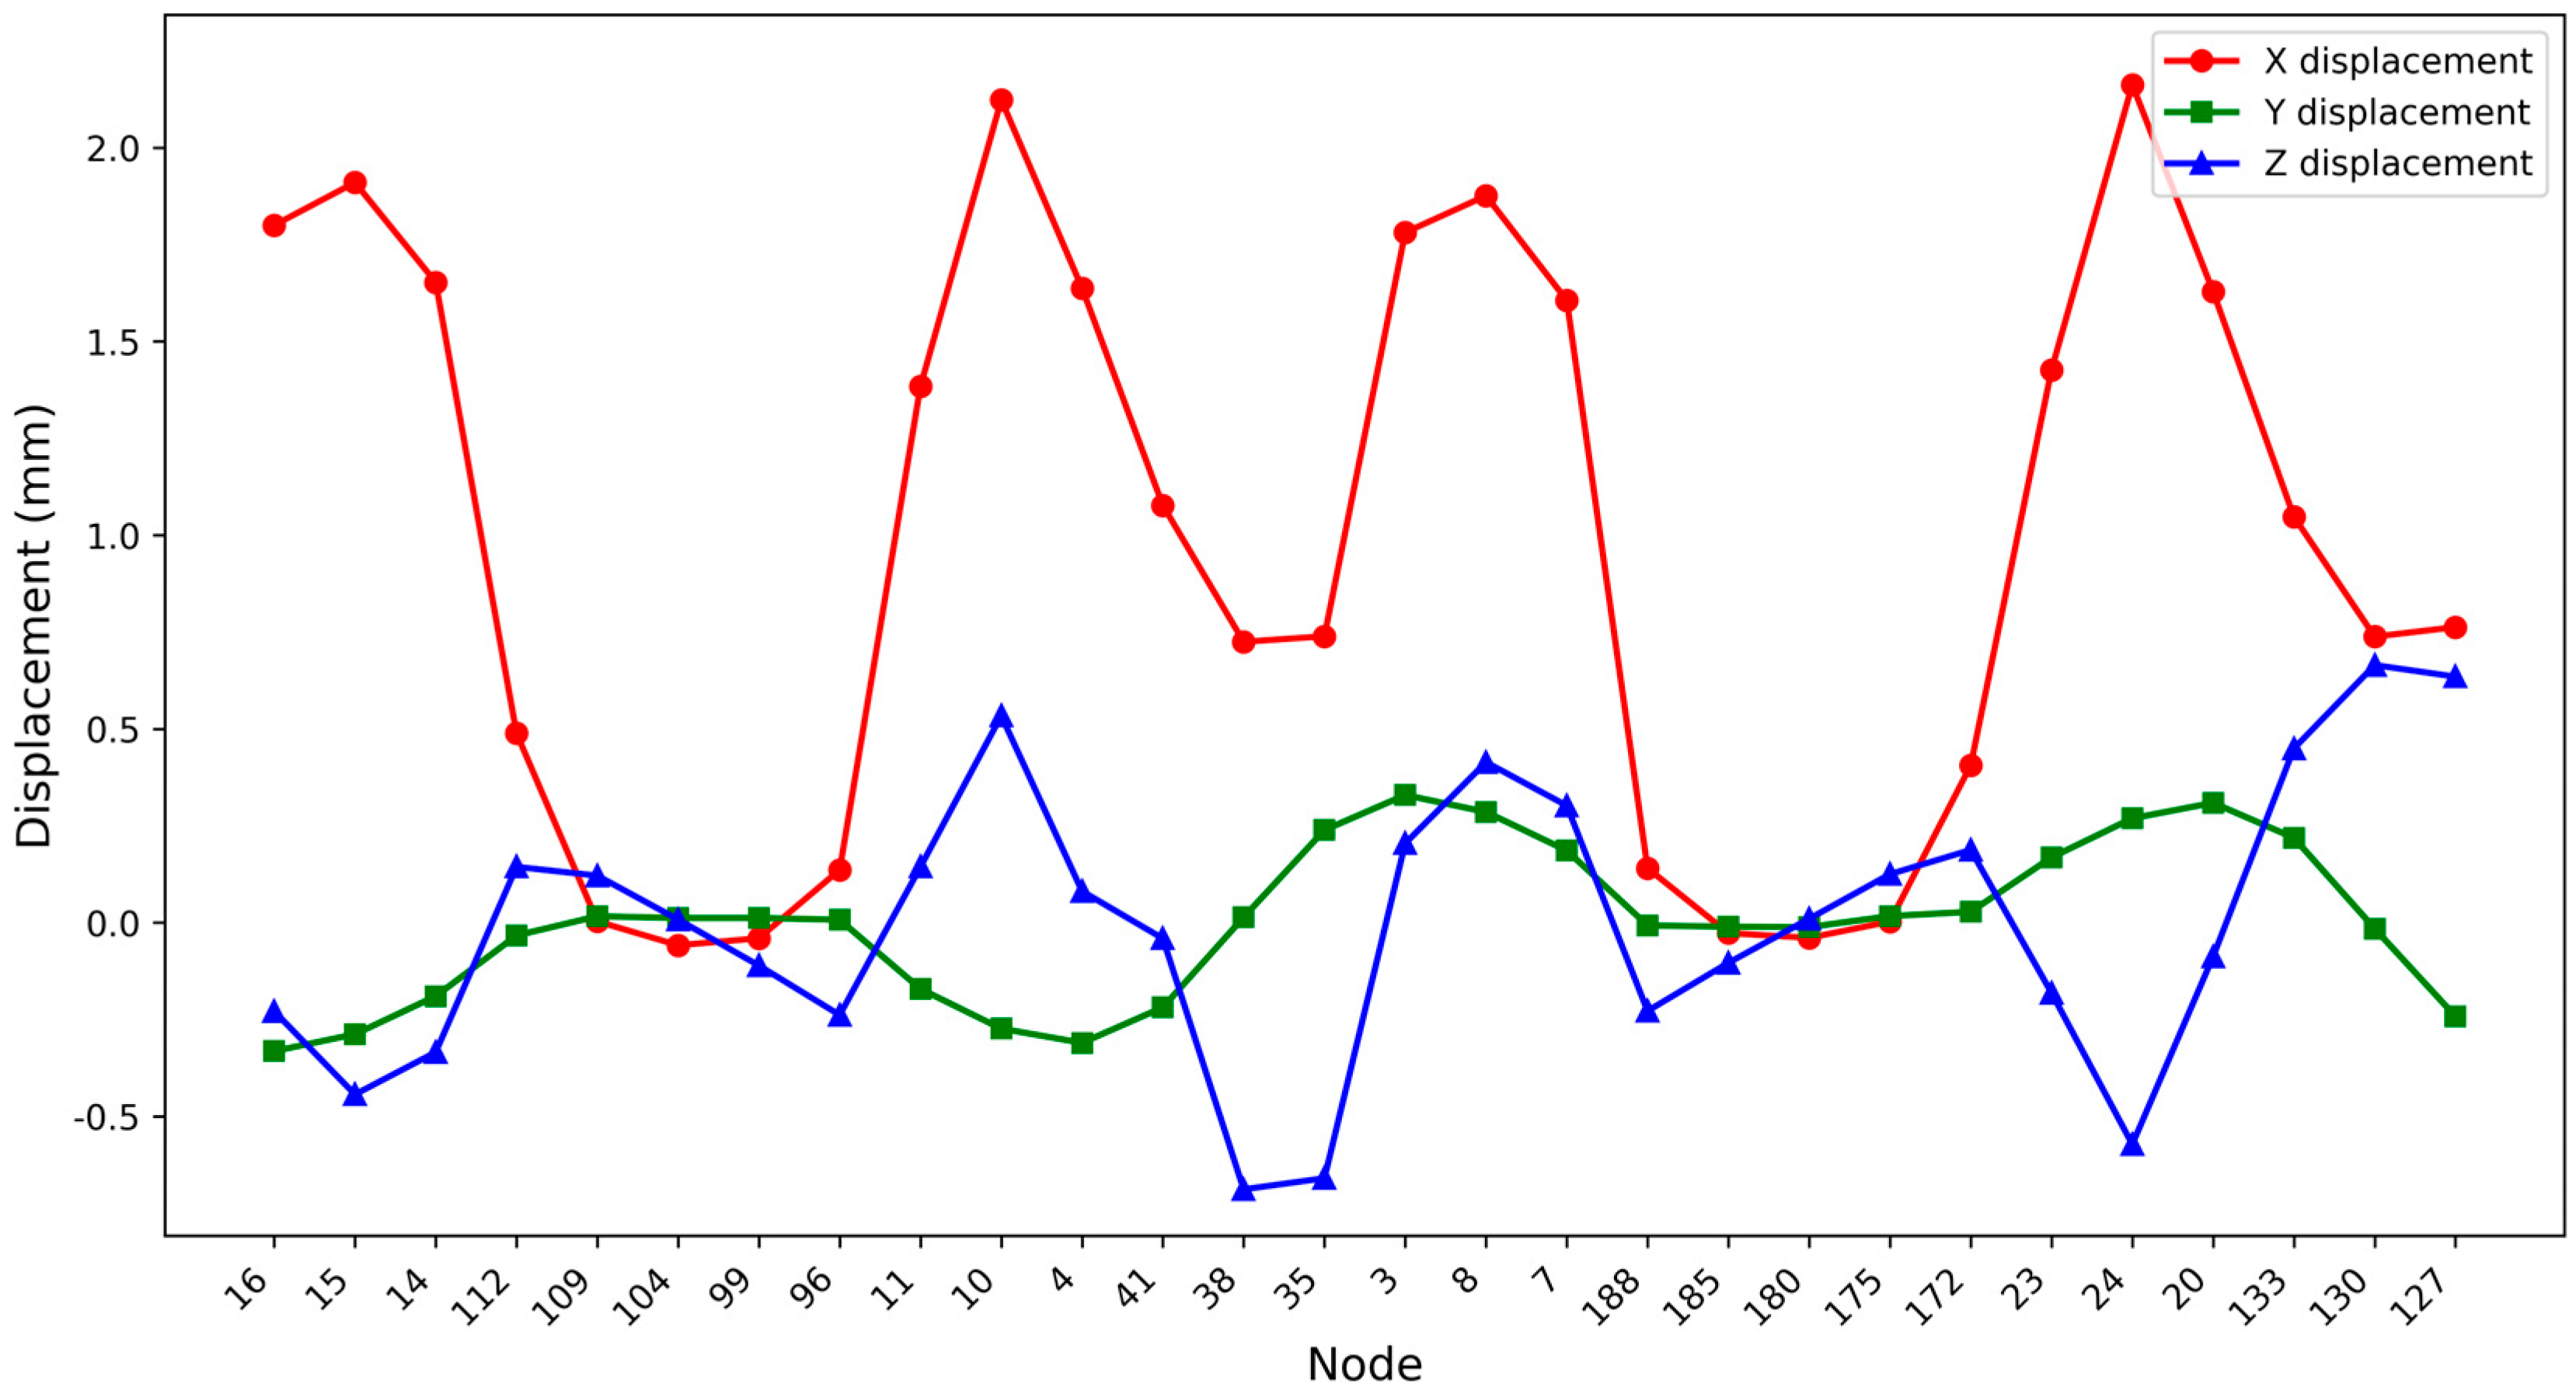
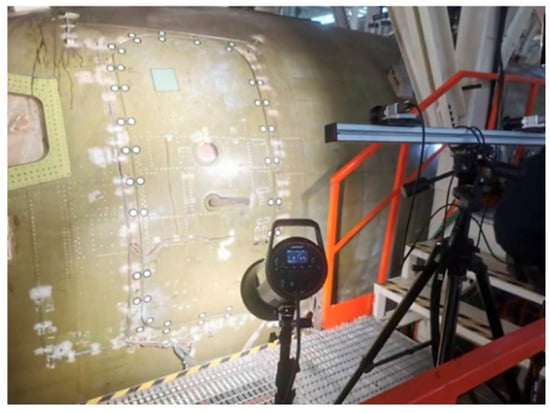
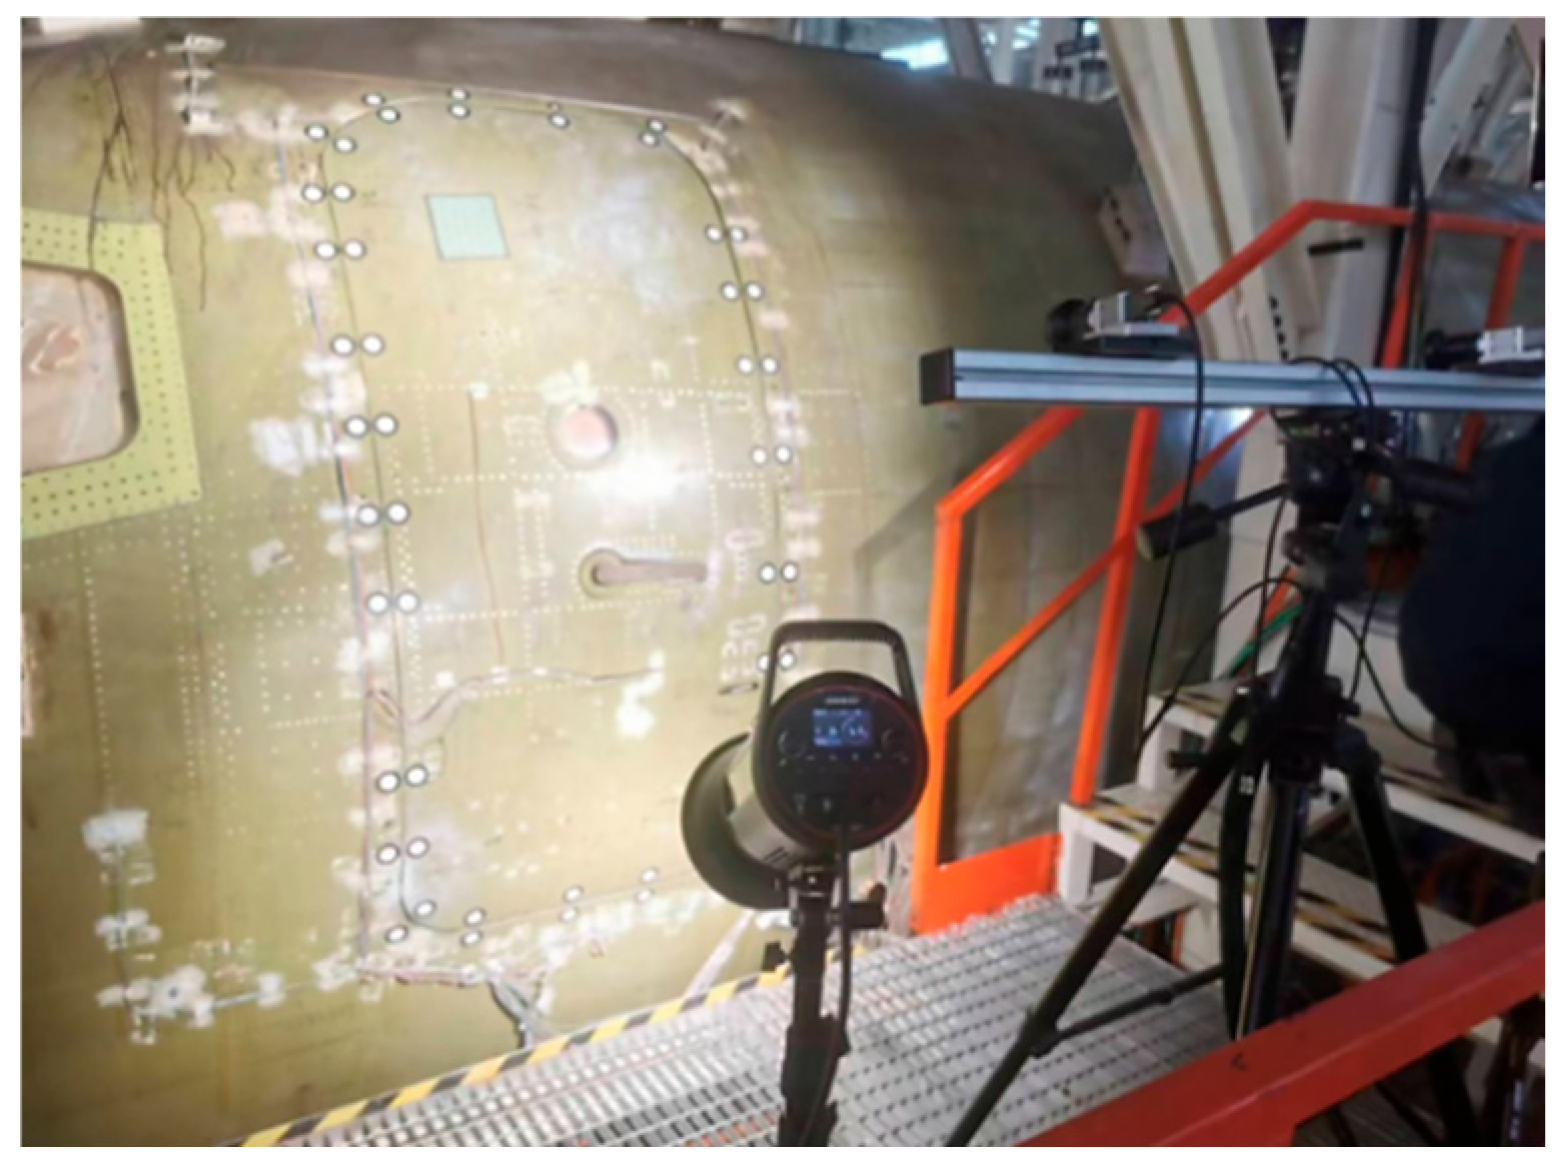
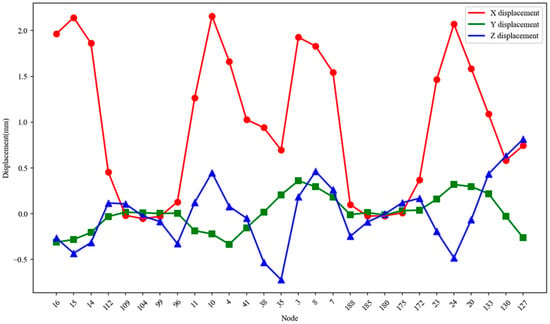
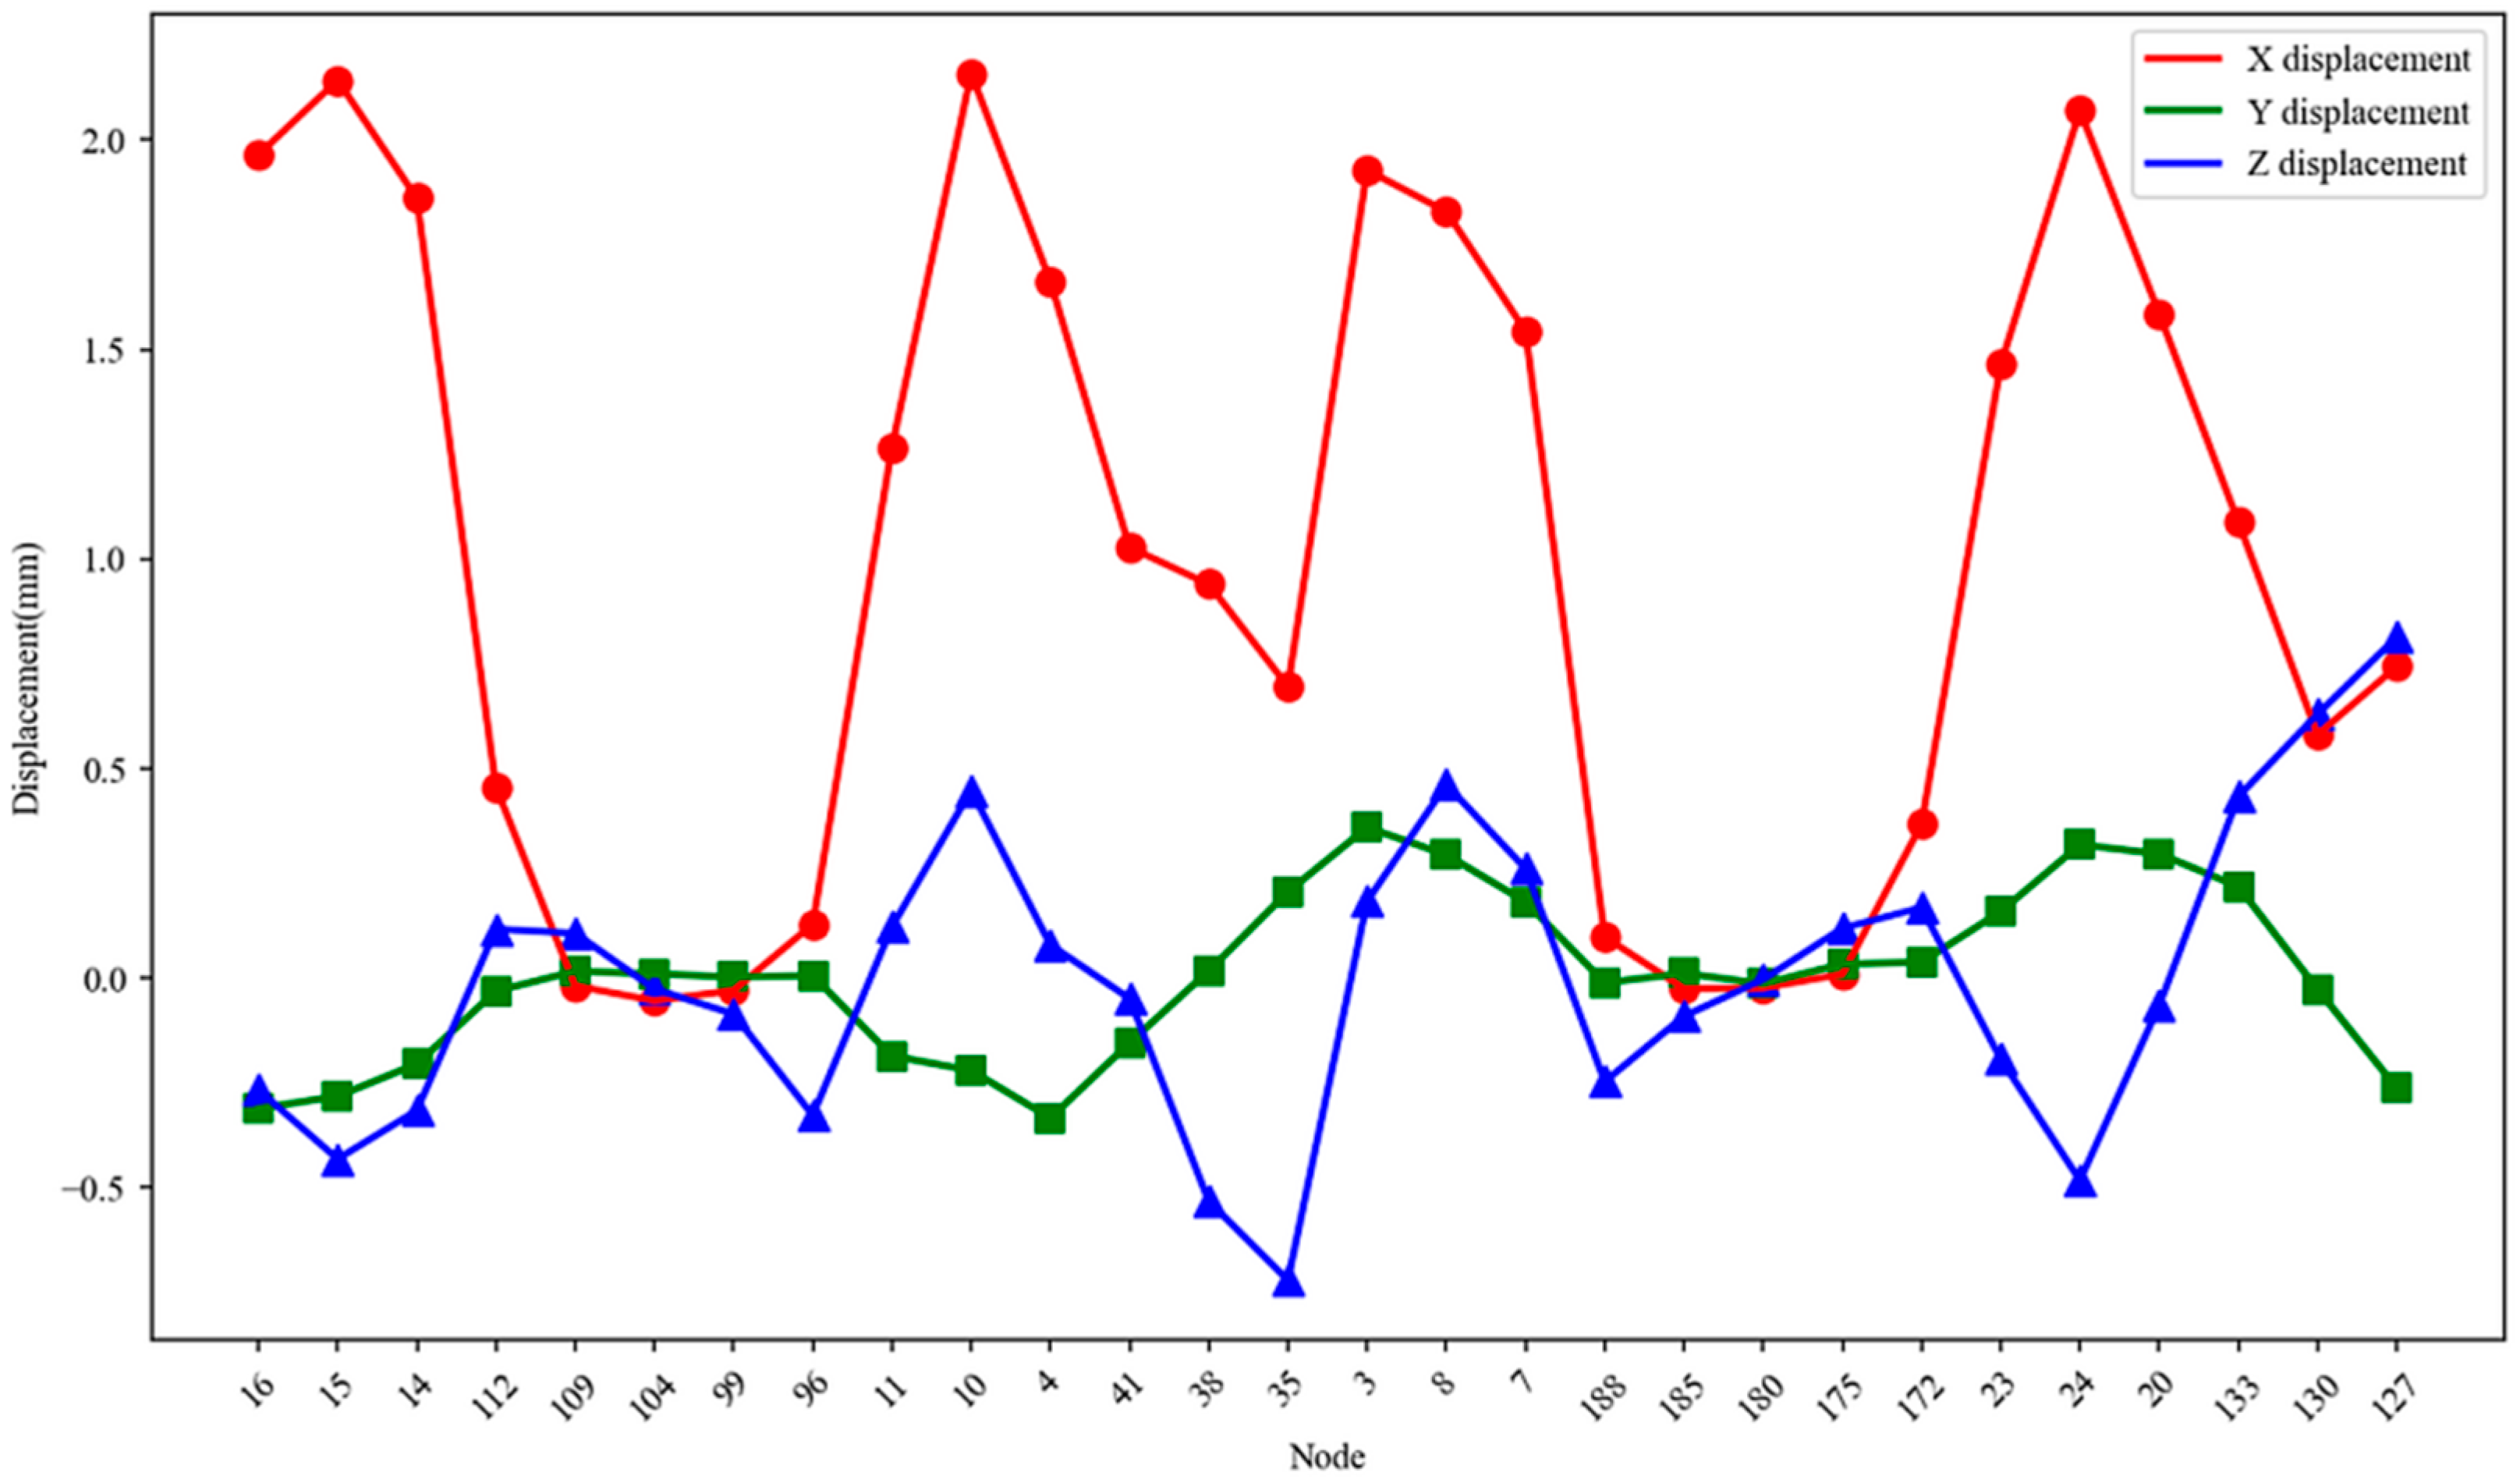
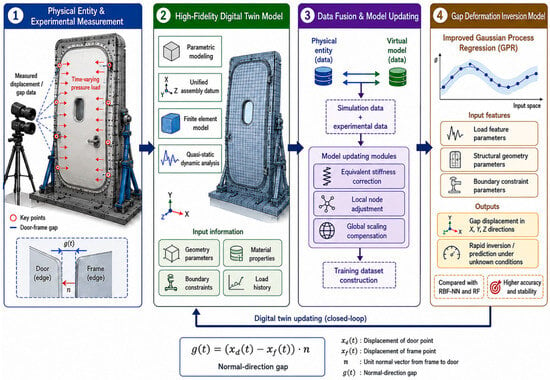
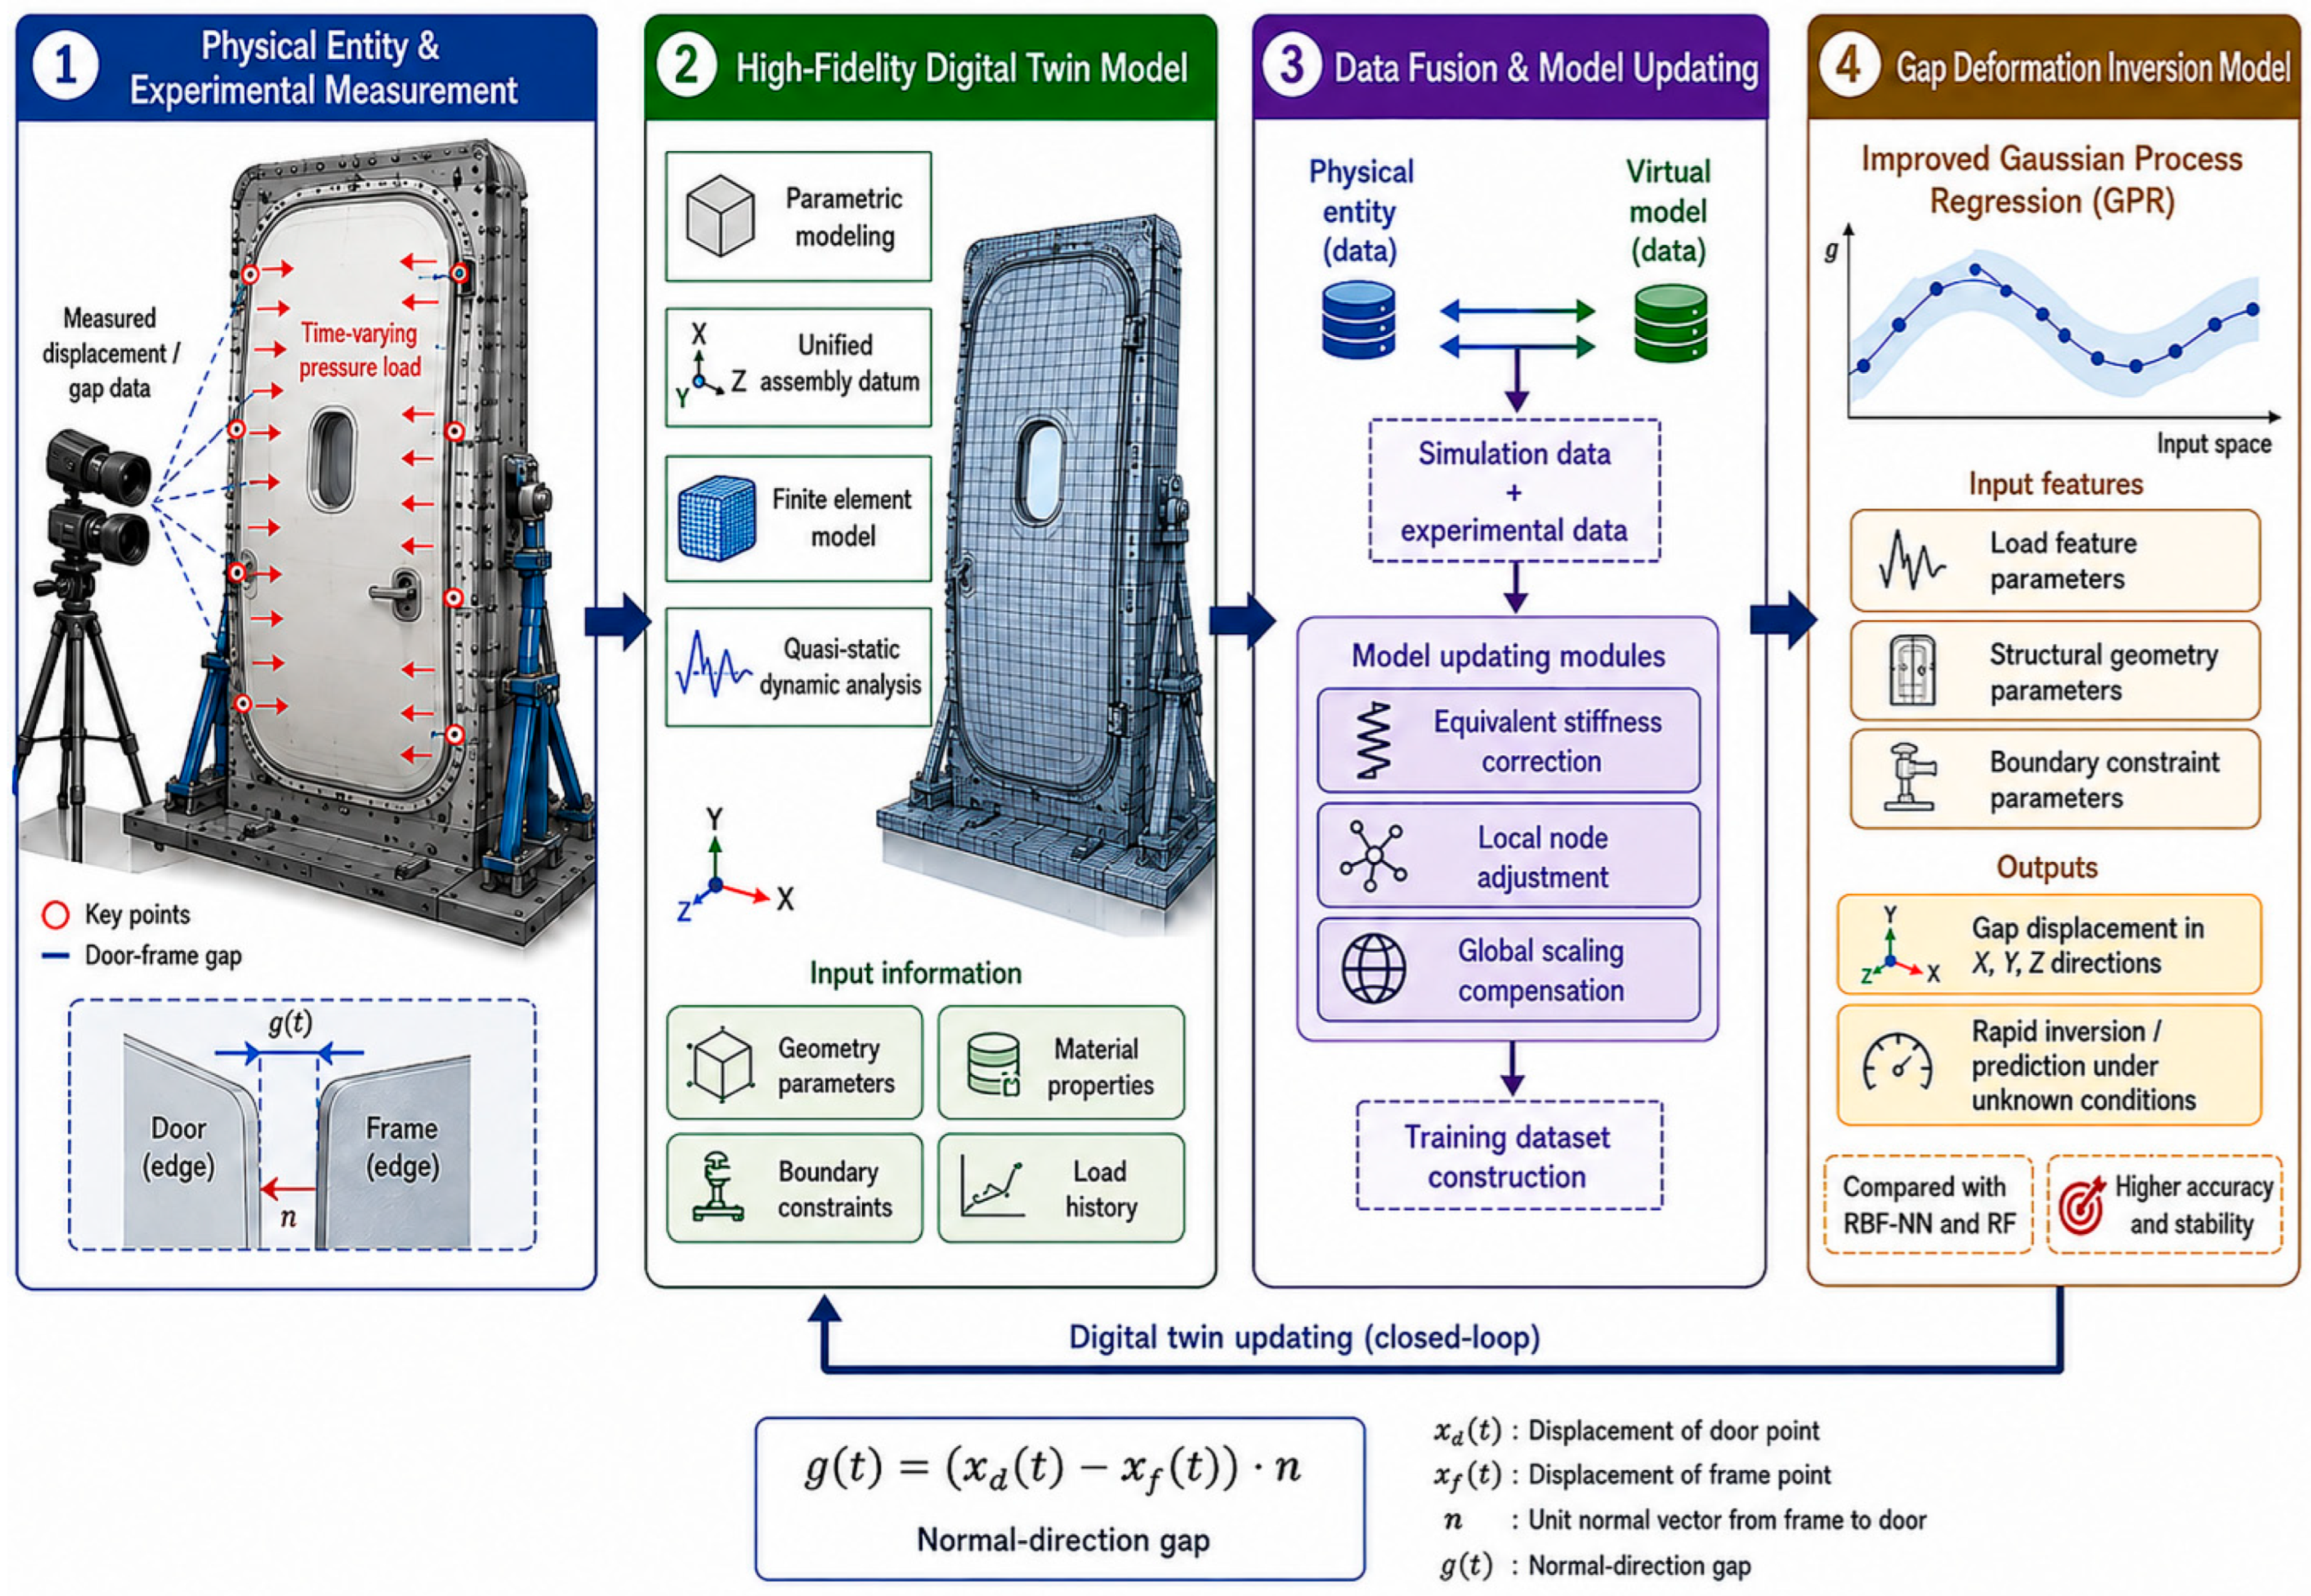

Disclaimer/Publisher’s Note: The statements, opinions and data contained in all publications are solely those of the individual author(s) and contributor(s) and not of MDPI and/or the editor(s). MDPI and/or the editor(s) disclaim responsibility for any injury to people or property resulting from any ideas, methods, instructions or products referred to in the content. |
© 2026 by the authors. Licensee MDPI, Basel, Switzerland. This article is an open access article distributed under the terms and conditions of the Creative Commons Attribution (CC BY) license.