


Abstract
Developing effective adaptation and mitigation strategies depends on climate predictions capable of representing future conditions across multiple temporal scales. Decadal climate predictions bridge seasonal forecasting and long-term climate projections, providing near-term climate information for decision-making and adaptation planning at multi-year timescales. This study assesses the predictive skill of CMIP6 decadal precipitation forecasts from the Decadal Climate Prediction Project for three strategic catchments in state of Ceará, in the Brazilian semi-arid region. Forecast skill was assessed using deterministic and probabilistic metrics for three averaging horizons corresponding to years 1, 1–5, and 1–10 after initialization. Systematic biases were assessed and corrected. The results indicate that predictive skill varies across forecast systems, averaging horizons, and catchments. While skill was generally lower for the 1–5-year averaging horizon, several forecast systems showed positive skill relative to climatology for the 1-year and the 1–10-year averaging horizons, especially for below-normal and above-normal precipitation categories. Although bias correction reduced effectively systematic errors, it did not consistently improve forecast skill. These findings suggest potentially useful predictive skill at decadal timescales and highlight the potential of decadal climate information to provide complementary information for near-term water resources planning and drought preparedness in the Brazilian semi-arid region.
1. Introduction
The high variability of precipitation in semi-arid regions poses substantial challenges for water resource management, particularly in developing countries, where climate-related risks often translate into greater socioeconomic vulnerability [1]. Ongoing changes in the climate system, reflected in shifts in precipitation and temperature patterns, are associated with increases in the frequency and intensity of extreme events, further increasing water scarcity [2,3,4,5]. In this context, climate information derived from numerical climate models has become an important tool for supporting decision-making in climate-sensitive sectors. Such information can help anticipate adverse conditions, strengthen response capacity, and guide mitigation and adaptation strategies, particularly in regions characterized by high climatic variability [6,7,8].
Over the past decades, the ability to predict climate variables across different timescales has been widely investigated using both statistical and process-based approaches [9,10,11,12,13,14,15]. Seasonal forecasts, with lead times ranging from a few months to up to one year, have proven useful for capturing the interannual variability of precipitation in different regions, while long-term projections based on emission scenarios provide information for time horizons spanning several decades to centuries [2,3,15,16,17]. Although these approaches play distinct and complementary roles, representing climate variability at intermediate timescales remains a challenge, particularly given the need to support planning over short- and medium-term horizons.
To address this challenge, decadal forecasting has emerged as a framework for investigating climate predictability at intermediate timescales. It incorporates information about the initial state of the climate system and occupies the space between seasonal climate predictions and long-term climate projections, thereby helping to bridge these two forecasting horizons [18,19,20]. In the context of the Coupled Model Intercomparison Project Phase 6 (CMIP6), the Decadal Climate Prediction Project (DCPP) has broadened the framework for evaluating climate predictability on decadal timescales [18,19,20,21]. Consequently, the number of studies examining the predictive skill of these systems has increased steadily over the past decade.
Several studies have examined different aspects of Coupled Model Intercomparison Project Phase 6 decadal predictions, including comparisons between initialized and non-initialized simulations, as well as evaluations of the models’ ability to reproduce key features of the climate system [18,21,22,23,24,25,26]. In general, these hindcasts perform better at reproducing multi-year average variability, particularly for thermodynamic variables such as temperature, while the predictability of precipitation remains more limited and less consistent across models, depending heavily on the region analyzed and the forecast horizon [21,27,28].
Recent regional assessments illustrate this heterogeneity: in the Sahel, CMIP6 models show moderate ability to represent decadal precipitation variability, with improvements over CMIP5, although the magnitude of variability and the robustness of the ability remain sensitive to the period analyzed and the metric adopted [29]. Similarly, analyses of winter precipitation in Northeast Asia indicate statistically significant ability only over certain decadal timescales, along with strong spatial variability and differences among members of the multimodel ensemble [26]. Other studies have also investigated decadal skill for temperature extremes in regions such as India and the Middle East, showing that the performance of DCPP systems varies across regions and seasons [30,31]. These results indicate that, while there is evidence of decadal predictability in certain regions of the globe, its expression remains uneven and is strongly influenced by regional climate characteristics and the design of the forecasting systems.
In tropical semi-arid regions, such as the Brazilian semi-arid region (SAB), numerous studies have demonstrated a strong relationship between sea surface temperature (SST) anomalies and seasonal precipitation variability. However, systematic analyses of the predictive ability of dynamic climate models for the region from a multi-year and decadal perspective are still scarce [32,33,34,35,36,37].
The state of Ceará, where most municipalities are part of the SAB, exhibits high interannual variability in precipitation, making water resource management a critical factor for regional socioeconomic development [38,39,40]. The state is also located in one of the areas of South America with the highest seasonal climate predictability, due to ocean–atmosphere interactions that modulate precipitation variability [16,41,42,43]. While this may suggest potential for predictability on multi-year and decadal scales, it remains largely unexplored whether decadal forecasting systems can capture this variability at the regional scale and within hydrologically relevant subregions.
Given the importance of evaluating forecasts to determine the usability and practical relevance of climate predictions, this study assesses the performance of decadal precipitation forecasts (DPFs) from CMIP6 forecasting systems in three strategic basins in the Brazilian state of Ceará. Both probabilistic and deterministic metrics are employed to assess forecasts at three averaging horizons corresponding to years 1, 1–5, and 1–10 after initialization, representing interannual, multi-year, and decadal variability timescales, respectively.
This study investigates differences in the performance of models in reproducing precipitation variability across various timescales. It also examines the presence of systematic biases in decadal forecasts and their impact on predictive ability, as well as evaluating how the performance of models varies among the selected catchments. By addressing these issues, the study aims to improve the understanding of the decadal precipitation predictability in semi-arid regions and to assess whether these predictions are sufficiently reliable to support catchment-scale climate analyses relevant to water-resource-dependent sectors.
2. Materials and Methods
2.1. Study Area
This study focuses on the three largest reservoirs in the state of Ceará, northeastern Brazil: Banabuiú, Castanhão, and Orós, which play a critical role in regional water supply. These reservoirs, with maximum storage capacities of 1.6, 6.7, and 1.9 billion cubic meters, respectively, are in the south-central part of the state and together drain approximately 40% of Ceará’s territory. They belong to the Jaguaribe River basin, the main hydrographic system in the state [44,45]. Figure 1 shows the geographical location of the reservoirs and their catchments, while Table 1 summarizes their main physical characteristics and the statistical properties of observed precipitation at different temporal scales. The observed precipitation time series at the annual, 5-year moving average, and 10-year moving average scales for each catchment are presented in Supplementary Figure S1.
Figure 1.
Geographical location of the Banabuiú, Orós, and Castanhão catchment in the state of Ceará, Northeast Brazil. The outlines indicate the boundaries of the river catchments associated with the reservoirs analyzed in this study.
Table 1.
Main characteristics of the Banabuiú, Orós, and Castanhão catchments and summary statistics of mean precipitation for each basin at different timescales.
Located in the semi-arid region of northeastern Brazil, these basins exhibit high spatial and temporal variability in precipitation and are frequently affected by drought events [3,33,40,46,47]. The regional precipitation patterns are marked by distinct seasonal variations, primarily driven by the position of the Intertropical Convergence Zone (ITCZ), with higher rainfall occurring mainly during the first half of the year, particularly from February to May [38,48]. In addition to this pronounced seasonal cycle, precipitation also exhibits substantial interannual variability, largely modulated by large-scale ocean–atmosphere interactions. For instance, the El Niño–Southern Oscillation (ENSO) influences rainfall variability, with its positive/negative phase (El Niño/La Niña) generally associated with negative/positive precipitation anomalies in the region. Furthermore, a positive interhemispheric sea surface temperature (SST) gradient in the Tropical Atlantic (warmer North relative to the South: +Dipole) displaces the ITCZ northward, which is unfavorable for rainfall in northern Northeast Brazil, while a negative gradient (warmer South relative to the North: -Dipole) favors precipitation in the region by shifting the ITCZ southward [32,34,49,50,51].
On longer timescales, the multi-year and decadal climate regimes of these basins are also influenced by lower frequency climate variability modes. The Atlantic Multidecadal Oscillation (AMO) is associated with variations in the average position of the ITCZ, while the Pacific Decadal Oscillation (PDO) modulates the behavior of the ENSO, influencing its frequency, duration, and intensity [36,37,52,53,54].
2.2. Decadal Climate Predictions
The decadal forecasts (DF) used in this study were obtained from seven climate models participating in the Decadal Climate Prediction Project (DCPP), a component of the Coupled Model Intercomparison Project Phase 6 (CMIP6) [18,55]. DCPP systems are coupled ocean–atmosphere global climate models that produce retrospective forecasts (hindcasts) with lead times of up to 10 years, initialized annually with observed climate system conditions since 1960. The models differ in ensemble size, spatial resolution, and initialization month, reflecting the specific configurations adopted by each modeling center. The main characteristics of the systems used in this study, including the development center, horizontal resolution, and number of ensemble members, are summarized in Table 2.
Table 2.
CMIP6 decadal prediction models and their specifications (simulations available at the time of this study). The spatial resolution is shown for the atmospheric grid in degrees of latitude and longitude.
Forecast Processing
This study was motivated primarily by the need to extend the forecasting horizon available to the water resources sector in Ceará, enabling better long-term planning. Water allocation decisions are made at the beginning of July each year, while seasonal forecasts for the coming rainy season only show significant skill from January onward. Thus, decadal precipitation forecasts (DFs) can provide valuable complementary information for strategic decision-making by extending climate information to multi-year and decadal timescales.
The analyses were conducted for the period 1961–2023, corresponding to the common time span between the available decadal forecasts and the observational dataset. Decadal predictions encompass annual, multi-year, and decadal timescales [18]. Therefore, the predictive skill of the DF was evaluated for the annual mean precipitation at three forecast temporal horizons: the annual mean of forecast year 1, the mean precipitation averaged over forecast years 1–5, and the mean precipitation averaged over forecast years 1–10 after initialization.
As the decadal prediction systems are initialized in different months of the calendar year, the initial months after initialization were discarded to ensure that the analysis was restricted to complete calendar years (January–December), as illustrated in Figure 2. Consequently, forecast months 1–12 correspond to the first complete calendar year after initialization. This procedure was applied consistently to all initializations, resulting in a homogeneous time series composed of ten complete forecast years, totaling 120 forecast months per experiment.
Figure 2.
Schematic representation of the temporal framework adopted for the decadal prediction analysis.
Both the forecasts and observations were averaged over the corresponding forecast intervals and indexed by the first year after initialization. For a given initialization year, the annual horizon corresponds to the mean precipitation in forecast year 1, whereas the multi-year and decadal horizons correspond to the mean precipitation averaged over forecast years 1–5 and 1–10, respectively. For example, for the 1960 initialization, the annual horizon (1961) refers to the precipitation in the 1961 calendar year, whereas the multi-year and decadal horizons (1961) correspond to the average precipitation over 1961–1965 and 1961–1970, respectively.
As the analysis is based on moving averages, only complete periods were considered in comparison between forecasts and observations. For the annual horizon (forecast year 1), initializations from 1960 to 2018 were used, resulting in 59 evaluated years for the period 1961–2019. For the multi-year horizon (forecast years 1–5), the same initialization period (1960–2018) was adopted, also yielding 59 evaluated values. For the decadal horizon (forecast years 1–10), only initializations from 1960 to 2013 were considered to ensure that the averaging period did not extend beyond 2023, resulting in 54 evaluated values for the period 1961–2014. For clarity, Table 3 summarizes the forecast horizons and averaging periods adopted in the evaluation.
Table 3.
Definition of the forecast horizons and corresponding evaluation periods used in this study.
To reduce the systematic drift of the models, bias correction was applied using the Empirical Quantile Mapping (EQM) method on the monthly precipitation series [63]. The procedure was performed separately for each model, ensemble member, and lead month, considering all 120 forecast months associated with each initialization [18,64]. EQM adjusts the simulated cumulative distribution function to match the corresponding observed distribution, allowing corrections in the mean, variance, and distributional shape. The bias correction was implemented using a leave-one-out cross-validation scheme, in which the year being evaluated was excluded from the dataset used to estimate the mapping functions.
Although there are various bias-correction techniques and more sophisticated post-processing approaches [65,66,67,68,69], previous studies have shown that Empirical Quantile Mapping has potential for improving decadal forecast skill [30,70,71]. Additionally, EQM remains widely used in climate prediction studies due to its simplicity, computational efficiency, and ability to correct biases in precipitation forecasts [30,63,70,72].
2.3. Precipitation Data
The observed precipitation data used as reference for the evaluation of the model predictions were obtained from conventional rain gauge stations of the monitoring network operated by the Fundação Cearense de Meteorologia e Recursos Hídricos (FUNCEME). This network consists of approximately 550 conventional Ville de Paris–type rain gauges distributed across the state of Ceará. The historical dataset considered in this study covers the period from 1961 to 2023. The dataset can be accessed from http://www.funceme.br/?page_id=2694 (accessed on 17 January 2025).
2.4. Forecast Verification
The predictive performance of the models was evaluated at the catchment scale. To ensure spatial consistency, both the observed precipitation data and the model outputs were aggregated over each basin using the Thiessen polygon method [73]. This procedure allows point-based rain gauge observations and gridded model data to be represented as basin-average precipitation.
Using a combination of deterministic metrics and probabilistic skill scores provides a more robust and comprehensive assessment of model performance. In this study, the models skill were evaluated for each catchment using deterministic metrics, including the Anomaly Correlation Coefficient (ACC), Root Mean Square Error (RMSE), and bias, as well as probabilistic skill scores, including the Continuous Ranked Probability Skill Score (CRPSS) and the Brier Skill Score (BSS), considering forecasts before and after bias correction.
The Anomaly Correlation Coefficient (ACC) was used to evaluate the linear relationship between forecast and observed precipitation anomalies [74]. Forecast anomalies were computed relative to the climatology specific to each model and forecast horizon (forecast year 1, forecast years 1–5, and forecast years 1–10), using the 1981–2010 period as the reference. The ACC ranges from −1 to +1, with values closer to +1 indicating stronger agreement between forecast and observed variability, while values approaching –1 indicate strong anticorrelation (opposite variability patterns).
The statistical significance of the ACC was assessed using a two-tailed Student’s t-test at the 95% confidence level. This significance test was applied using the available sample size for each forecast horizon. Because the multi-year averaging horizons (forecast years 1–5 and 1–10) are characterized by increased temporal autocorrelation, the reported significance levels should be interpreted with appropriate caution, as the effective number of independent samples may be lower than the nominal sample size.
The probabilistic predictive skill of the models was evaluated using the Continuous Ranked Probability Score (CRPS), a widely used metric in meteorological and hydrological forecasting [75]. The CRPS measures the discrepancy between the cumulative distribution function (CDF) of the ensemble forecasts and the observed value [76]. It provides an overall measure of probabilistic forecast accuracy and can be interpreted as a generalization of the mean absolute error for probabilistic forecasts [77]. The CRPS is calculated as:
where is the cumulative distribution function (CDF) of the decadal forecasts, and is the empirical CDF of the observation, defined as a step function:
Here, represents the forecasted precipitation values, and is the observed precipitation. The CRPS corresponds to the squared area between the forecast and observed cumulative distribution functions, simultaneously penalizing errors in reliability, sharpness, and bias. Lower CRPS values indicate better probabilistic forecast performance.
Similarly, this score can also be computed for the climatology, in which case it is referred to as . If the DPFs were perfect, meaning that all ensemble members exactly matched the observations, the CRPS would be equal to zero. Conversely, higher CRPS values indicate lower forecast skill.
Based on the CRPS, the Continuous Ranked Probability Skill Score (CRPSS) can be derived. The CRPSS expresses forecast skill relative to a reference forecast, typically climatology (). In this study, the climatological forecast was used as the reference, considering monthly precipitation records from 1981 to 2010, which resulted in a 30-member ensemble for each basin, forecast system, and forecast horizon. The CRPSS is defined as one minus the ratio between the forecast CRPS () and the reference CRPS ():
The CPRSS ranges from −∞ to 1. Values between 0 and 1 indicate that the forecast system outperforms the reference forecast, whereas negative values indicate poorer performance relative to the reference. One advantage of this metric is that it considers the full range of precipitation variability, does not rely on predefined classes or thresholds, and is straightforward to interpret.
Another probabilistic evaluation metric used in this study was the Brier Skill Score (BSS), which is derived from the Brier Score (BS). The BS is a scalar metric designed to assess the accuracy of probabilistic forecasts for predefined binary events. It can be decomposed into three components: reliability, resolution, and uncertainty [74].
Reliability measures the agreement between the forecast probabilities and the observed relative frequencies of the event. Resolution evaluates the forecast’s ability to discriminate between situations with observed frequencies that differ from the climatological average. Finally, uncertainty represents the intrinsic variability of observations and is lowest when the event occurs either very rarely or very frequently. The Brier Score is defined as follows:
where is the number of forecast-event pairs, is the forecast probability, and is the observed outcome of the event (0 or 1). The BS ranges from 0 to 1.
Based on the BS, the Brier Skill Score (BSS) can be calculated, relating the forecast BS () and the BS of a reference forecast (), which in this study corresponds to the climatology:
The BSS ranges from −∞ ≤ BSS ≤ 1. Positive values indicate that the forecast performs better than the reference forecast, whereas values equal to or below zero indicate no predictive skill relative to the reference. In this study, the BSS was computed considering three forecast categories (lower, middle, and upper terciles). The climatological forecast was adopted as the reference, defined as an equiprobable distribution that assigns equal probabilities to each tercile category.
Unlike the CRPSS, which evaluates the probability distribution, the BSS focuses on predictive skill for specific categories. This characteristic is particularly relevant for decision-makers who rely on multicategorical probabilistic forecasts in applications based on the likelihood of occurrence of events of interest.
Forecast bias was quantified using the Mean Error (ME) and the Root Mean Square Error (RMSE), which were used to evaluate the performance of the bias correction methods applied to the climate models. The Mean Error (ME) was used to identify the systematic bias of the forecasts, indicating whether the models tend, on average, to overestimate or underestimate the observed values. ME is defined as:
where represents the value predicted by the model, the observed value, and n is the total number of samples.
The Root Mean Square Error (RMSE) was used to quantify the average magnitude of the errors between forecasts and observations. Unlike ME, RMSE assigns greater weight to larger errors because it squares the differences, making it particularly useful for identifying more pronounced deviations in forecasts. RMSE is defined as:
Thus, while ME provides information about the presence and direction of systematic bias, RMSE allows the evaluation of the average magnitude of errors, being more sensitive to large discrepancies between predicted and observed values, thereby enabling the assessment of the effectiveness of the bias correction applied to the models.
3. Results
3.1. Does Bias Correction Reduce Systematic Errors and Improve Predictive Ability?
The bias in average precipitation was calculated as the difference between simulated and observed values to quantify systematic errors. This analysis was performed for the Banabuiú, Castanhão, and Orós catchments at the annual, multi-year, and decadal horizons.
In general, the forecast models tend to overestimate average precipitation in the analyzed catchments. Figure 3 presents the forecast bias for each catchment for forecast year 1 (Figure 3a) and for the averages over forecast years 1–5 (Figure 3b) and 1–10 (Figure 3c). In nearly all evaluated cases, the models display a positive bias, indicating an overestimation of observed precipitation. The only exception is the FGOALS-f3-L model in the Castanhão basin, where a slightly negative bias indicates an underestimation of precipitation, although this value is not statistically significant.
Figure 3.
Percentage bias in mean precipitation (%), calculated as , for the Banabuiú, Castanhão, and Orós catchments: (a) forecast year 1 (annual average), (b) forecast years 1–5 (5-year average), and (c) forecast years 1–10 (10-year average).
Among the models examined, CMCC-CM2-SR5 stands out for consistently exhibiting the largest bias values across basins and forecast horizons, with magnitudes that, in some cases, exceed twice the average precipitation. In contrast, FGOALS-f3-L shows the smallest biases among the evaluated models. Spatially, the largest biases are observed in the Orós basin, while the Castanhão basin shows the smallest biases.
All skill metrics presented hereafter were computed for both the raw and bias-corrected forecasts. Systematic biases in the raw outputs were first removed using the Empirical Quantile Mapping (EQM) method. This correction reduced the mean biases to less than 2 mm/month across all lead times and basins, corresponding to bias reductions of 96–99%.
Figure 4 shows the Root Mean Square Error (RMSE) for both the raw and bias-corrected forecasts. A consistent reduction in RMSE is observed after bias correction across all models and forecast lead times. To illustrate the magnitude of these improvements, Table 4 shows the percentage reduction in RMSE relative to the raw forecasts. Overall, the reductions generally exceed 60%, with several cases reaching 80–90%, indicating that the bias correction effectively reduced systematic errors in the forecast precipitation.
Figure 4.
RMSE (mm mês−1) for the raw and bias-corrected forecasts in all models and catchments: (a) FY 1 (annual average), (b) FY 1–5 (5-year average), and (c) FY 1–10 (10-year average). Bars without hatching indicate raw forecasts (before bias correction), while hatched bars indicate bias-corrected forecasts (after bias correction).
Table 4.
RMSE values before (raw, BBC) and after bias correction (ABC), along with the percentage improvement (Imp, %), for each decadal prediction model, and catchments (Banabuiú, Castanhão, and Orós) for forecast year 1 and forecast years 1–5 and 1–10.
The CMCC-CM2-SR5 model exhibited the highest RMSE values among the evaluated models and showed the largest RMSE reductions after bias correction, reaching up to 95%. In contrast, the FGOALS-f3-L model displayed more modest reductions across the catchments, with a maximum decrease of 26% in the Castanhão catchment and a slight increase in RMSE (up to 1.2%) in some cases. These results indicate that the impact of bias correction on RMSE varied among forecast systems and, in a few cases, resulted in a slight increase in error.
Additionally, RMSE reductions were generally larger for longer forecast horizons, indicating a greater reduction in systematic errors after bias correction.
Figure 5 illustrates the changes in forecast performance associated with the application of bias correction, expressed in terms of ΔACC and CRPSS for different models, basins, and forecast horizons. Overall, the impact of bias correction on these skill metrics is relatively limited, suggesting that reductions in total error do not necessarily translate into improvements in predictive skill.
Figure 5.
Impact of bias correction (EQM) on the forecast skill of the different decadal prediction models across the Banabuiú, Castanhão, and Orós catchments. (a) Difference in the Anomaly Correlation Coefficient (ΔACC) between bias-corrected and raw forecasts for FY 1, FY 1–5, and FY 1–10. (b) Difference in CRPSS (ΔCRPSS) between bias-corrected and raw forecasts. Positive values indicate an increase in forecast skill. Colors represent the magnitude of the changes. Asterisks (*) denote statistically significant improvements at the 5% significance level (α = 0.05), based on the one-tailed Steiger test for ACC and the paired t-test for CRPSS.
Among the models, no significant gains were observed at the forecast year 1, indicating that bias correction had a limited impact on predictive skill at this shorter timescale. In contrast, CanESM5 stands out by showing consistent and statistically significant improvements across all catchments, with increases reaching approximately ΔACC ≈ 0.5 and ΔCRPSS ≈ 0.34. Similarly, the MIROC6 model also demonstrates significant improvements, although these are limited to the forecast years 1–10, while HadGEM3-GC31-MM showed more moderate improvements. The relatively large improvements observed for CanESM5 differ from the overall behavior of the remaining models and suggest that the response to bias correction is model-dependent. The mechanisms underlying this behavior were not investigated in the present study.
In contrast, the remaining models, including CMCC-CM2-SR5, FGOALS-f3-L, and MPI-ESM1-2-LR, show little or no significant improvement after bias correction. These results indicate that, for these models, bias correction had a limited impact on predictive skill and, in some cases, was associated with slight reductions in forecast skill.
Overall, the results indicate that bias correction consistently reduced systematic forecast errors, leading to improved agreement between forecast and observed precipitation magnitude. In contrast, its impact on predictive skill metrics was more heterogeneous and strongly model-dependent, suggesting that reducing systematic errors does not necessarily translate into improved forecast skill. Furthermore, the magnitude of these changes varied across forecast horizons, indicating that the response to bias correction depends on both the forecast system and the averaging horizon considered.
3.2. Forecast Performance over Different Lead Times
This section presents the evaluation of decadal precipitation forecast performance in the studied catchments using three complementary skill metrics: the Anomaly Correlation Coefficient (ACC), the Continuous Ranked Probability Skill Score (CRPSS), and the Brier Skill Score (BSS). These metrics assess deterministic forecast skill, probabilistic forecast performance, and the ability to predict categorical precipitation events, respectively. The complete performance assessment of the raw (uncorrected) forecasts for FY1, FY1–5, and FY1–10 is provided in Supplementary Figures S2–S4.
For forecast year 1 (Figure 6), the correlation values (Figure 6a) indicate that most models exhibit positive and statistically significant correlations across all catchments. However, performance varies among catchments, suggesting that regional factors influence model skill.
Figure 6.
Performance of the decadal prediction models for forecast year 1 across the analyzed catchments. (a) Anomaly Correlation Coefficient (ACC), (b) Continuous Ranked Probability Skill Score (CRPSS), and (c) Brier Skill Score (BSS) for the below-normal, near-normal, and above-normal precipitation categories. Asterisks (*) indicate statistically significant results at the 5% significance level.
The CMCC-CM2-SR5, FGOALS-f3-L, HadGEM3-GC31-MM, and MIROC6 models stand out with consistently positive correlations, demonstrating a good ability to reproduce anomaly variability. In contrast, the EC-Earth3 and MPI-ESM1-2-LR models show unsatisfactory performance, with negative correlations reaching values below −0.19. These negative correlations indicate an inverse relationship between simulated and observed anomalies, rather than merely a lack of predictive skill.
Figure 6b presents the CRPSS values for the individual models across the analyzed catchments for forecast year 1. The CRPSS varies among models, with HadGEM3-GC31-MM and CMCC-CM2-SR5 presenting the highest values (approximately 0.13 to 0.18). The CanESM5 and FGOALS-f3-L models show intermediate performance (0.04 to 0.15), while MIROC6 presents the lowest positive values (approximately 0.03–0.05). In contrast, the EC-Earth3 and MPI-ESM1-2-LR models yield negative CRPSS values, indicating performance worse than that of climatology. These results are consistent with the ACC patterns (see Figure 6a).
Figure 6c presents the Brier Skill Score (BSS) for the three precipitation categories: below-normal, near-normal and above-normal conditions (first, second and third terciles, respectively). Overall, the highest positive BSS values occur in the above-normal category. The near-normal category shows values close to zero or negative, indicating limited or no predictive skill. The CMCC-CM2-SR5 and FGOALS-f3-L models stand out by presenting positive BSS values for both above-normal and below-normal categories across all catchments.
The results reveal an asymmetry in forecast skill across precipitation categories, with better performance for above-normal conditions and limited skill for near-normal conditions.
For forecast years 1–5 (Figure 7), the correlation values are generally lower than those for forecast year 1, indicating a reduction in predictive skill. This decline is also evident in the CRPSS values (Figure 7b), which are predominantly negative. Only the HadGEM3-GC31-MM and CanESM5 models show positive CRPSS values across all catchments, although with reduced magnitude. This pattern is consistent with the ACC results (Figure 7a).
Figure 7.
Performance of the decadal prediction models for forecast years 1–5 across the analyzed catchments. (a) Anomaly Correlation Coefficient (ACC), (b) Continuous Ranked Probability Skill Score (CRPSS), and (c) Brier Skill Score (BSS) for the below-normal, near-normal, and above-normal precipitation categories. Asterisks (*) indicate statistically significant results at the 5% significance level.
The BSS values (Figure 7c) again indicate greater skill for the above-normal category, while performance remains limited for the near-normal and below-normal categories, following the same pattern observed for forecast year 1 but with an overall reduction in skill.
Compared with forecast years 1–5, an increase in correlation values is observed for forecast years 1–10 (Figure 8), indicating a recovery in predictive ability over longer timescales. In some cases, correlations reach approximately 0.72. This improvement is also reflected in the CRPSS values (Figure 8b), which increase considerably to reach approximately 0.35 with a higher frequency of positive values. However, the EC-Earth3 and MPI-ESM1-2-LR models continue to exhibit negative correlations (down to approximately −0.90) and negative CRPSS values.
Figure 8.
Performance of the decadal prediction models for forecast years 1–10 across the analyzed catchments. (a) Anomaly Correlation Coefficient (ACC), (b) Continuous Ranked Probability Skill Score (CRPSS), and (c) Brier Skill Score (BSS) for the below-normal, near-normal, and above-normal precipitation categories.
The Brier Skill Score values (Figure 8c) show improved skill for both above-normal and below-normal categories compared to shorter averaging horizons, whereas the near-normal category remains near-zero or negative. Overall, most models exhibit positive BSS values for anomalous conditions (below- and above-normal) for forecast years 1–10, highlighting greater ability to predict extreme precipitation events.
4. Discussion
4.1. The Skill of Decadal Precipitation Forecasts over Reservoir Catchments in the Brazilian Semi-Arid Region
This study provides a general assessment of the predictive capabilities of CMIP6 decadal precipitation forecasts at the catchment scale in the Brazilian semi-arid region. The findings indicate useful predictive skill across the analyzed catchments, although limitations inherent to this temporal scale remain. Among these, discrepancies in model performance and the presence of systematic biases are particularly notable. The main findings and conclusions of this research are summarized in Figure 9.
Figure 9.
Summary of the key findings regarding the predictive skill of CMIP6 decadal models in representing precipitation in the Banabuiú, Castanhão, and Orós catchments.
In general, the decadal predictions from the models outperformed the climatological reference forecast, as indicated by the positive CRPSS and BSS scores, particularly for the lower and upper terciles of the climatological precipitation distribution. These results are particularly relevant given the inherent challenges of climate prediction at the catchment scale, where the relatively coarse spatial resolution of DCPP prediction systems limits their ability to represent local physiographic features, precipitation gradients, and mesoscale processes that influence rainfall variability. Previous DCPP assessments have generally highlighted the limited predictability of precipitation at regional scales. The direct skill of decadal prediction models at this scale has often been reported as insufficient for operational applications, frequently requiring hybrid approaches [78,79].
However, no major differences in model performance were observed among the analyzed catchments, likely due to their geographic proximity and similar climatic conditions. Slightly lower skill in the Banabuiú catchment may be associated with the combined influence of the ITCZ, SACZ, and local orographic effects, which increase precipitation variability and hinder the representation of large-scale climate signals [32,34,36,37,38,39,48,51,80,81].
Despite the predictive skill identified in the decadal forecasts, model performance varies substantially across prediction horizons, as shown in Figure 8. Overall, the models exhibit greater skill in predicting precipitation at forecast year 1 and forecast years 1–10. In contrast, a marked decrease in performance is evident at the intermediate averaging horizon (forecast years 1–5), as indicated by lower skill metrics and reduced consistency among models.
Predictability at shorter timescales is often associated with the influence of the initial conditions, particularly the persistence of oceanic anomalies, whose longer memory favors predictive skill during the first forecast years. Initialization has been identified as a primary source of skill in decadal predictions, especially at shorter lead times [18,20,21].
The higher skill observed at the decadal averaging horizon (forecast years 1–10) may be associated with the influence of boundary conditions and the models’ ability to simulate low-frequency variability patterns. Higher correlation values have been reported for longer averaging periods (1–10 years mean) than for intermediate averaging periods (1–5 years mean), which has been attributed to the improved representation of persistent climate modes, such as the Atlantic Multidecadal Variability, as well as to the increasing influence of long-term trends associated with global warming [25]. Similar findings have also been reported in other studies, reinforcing the dominant role of these low-frequency components in decadal predictability [56,58]. However, part of the apparent increase in skill may also reflect the reduced variability associated with longer averaging periods and corresponding changes in the climatological reference used for skill evaluation. Therefore, the relative contribution of physical predictability and statistical effects associated with temporal averaging cannot be distinguished within the scope of the present study. Likewise, the predictive skill of CMIP6 decadal prediction systems may be lower during the initial forecast years and increase over longer averaging periods, although this behavior depends on the forecast system, region, and averaging period [82].
In contrast, the decline in predictive skill at the intermediate averaging horizon (forecast years 1–5) can be interpreted as the result of a transitional phase between the dominant influence of the ocean’s initial state and the strengthening of the signal associated with external forcings [19,21]. During this period, oceanic memory tends to weaken, while long-term trends are not yet strong enough to compensate for internal variability [55,83,84]. However, as discussed above, part of the differences in skill among averaging horizons may also reflect changes in the statistical characteristics of the averaged series and in the corresponding climatological reference used for skill evaluation. Consequently, the relative contributions of these physical and statistical factors cannot be isolated within the scope of the present study.
With respect to individual model performance, the integrated analysis of deterministic and probabilistic metrics indicates that five of the seven evaluated models demonstrated predictive skill in the catchments of the three reservoirs, with HadGEM3-GC31-MM, CanESM5, and FGOALS-f3-L standing out for their consistent performance across catchments and forecast horizons. Among all models, CanESM5 emerged as the best-performing overall, while CMCC-CM2-SR5 and MIROC6 also exhibited positive predictive skill, although with greater spatial variability among the analyzed basins. In contrast, EC-Earth3 and MPI-ESM1-2-LR showed limited or absent skill in most evaluations, reinforcing the importance of individually assessing prediction systems prior to their application.
Nevertheless, the differences in model performance identified in this study are insufficient to determine the best-formulated models for the region. The prediction systems differ in the number of ensemble members, which may influence CRPS-based skill metrics and consequently contribute to differences in forecast skill among models. Therefore, comparisons of CRPSS across prediction systems should be interpreted with caution, as part of the differences may reflect ensemble size rather than forecast quality alone. In addition, this study did not assess the ability of the models to represent major climate variability modes or key meteorological processes. Finally, the analysis is also limited by sample size, considering that the evaluation period comprises only 54 forecasts for the forecast years 1–10 averaging horizon and 59 forecasts for forecast year 1. Moreover, the statistical significance assessment was based on the nominal sample size and did not explicitly account for the temporal autocorrelation inherent to the multi-year averaged series. Consequently, the reported significance levels, particularly for the multi-year averaging horizons, should be interpreted with appropriate caution.
The observed variation in model performance highlights the importance of multimodel ensemble approaches based on better-performing systems, which may help reduce uncertainties and improve forecast accuracy, as demonstrated in previous studies [27,28,85,86,87]. Models with lower predictive skill, such as MPI-ESM1-2-LR and EC-Earth3, may introduce unrealistic patterns and additional noise that compromise overall ensemble performance, whereas selective ensembles composed of higher-performing models tend to produce more robust and skillful forecasts, often outperforming both individual GCMs and the simple average of large multimodel ensembles [82,88,89].
Furthermore, the dependence on the forecast averaging horizon found in this study suggests that forecast-horizon-specific model selection or weighting strategies may improve predictive skill. In this context, skill-based weighting approaches appear particularly promising. Although beyond the scope of this study, these strategies represent promising directions for developing more robust and reliable decadal forecasts.
Beyond the assessment of predictive skill, the analyses also revealed the presence of systematic biases in the decadal precipitation forecasts, characterized by a general tendency to overestimate precipitation across the analyzed catchments (Figure 3). Similar precipitation overestimation has also been reported for non-initialized CMIP6 simulations over Northeast Brazil [88,90,91].
However, in this study, the effects of bias correction on predictive skill were not uniform across the analyzed models. Although consistent improvements following bias correction have been reported for different prediction systems and forecast periods [30,70,92], other studies have found more limited impacts, with only modest or no significant improvements in predictive skill [65,93]. Consistent with these findings, bias correction in the present study did not produce generalized improvements in predictive skill across the evaluated models. Instead, the most pronounced improvements were observed for CanESM5, whereas the remaining models showed only limited or negligible changes. The stronger response observed for CanESM5 therefore represents an exception among the analyzed forecast systems. Although the present study was not designed to investigate the mechanisms responsible for this behavior, model-specific differences in forecast error characteristics, including the evolution of model drift or interactions with the leave-one-out cross-validation procedure adopted during bias correction, may have contributed to this response. Overall, the results indicate that bias correction primarily reduced systematic forecast errors, whereas improvements in predictive skill were generally limited and varied substantially among forecast systems. This contrast reinforces that there is no single bias-correction technique that is superior in all cases, making it necessary to evaluate its application specifically for each prediction system, climate variable, and study region, as previously noted in earlier studies [72,93,94].
Overall, the predictive skill identified in some of the analyzed forecast systems suggests that decadal climate predictions may provide complementary climate information for long-term hydroclimatic studies, particularly in regions strongly affected by climate variability and water scarcity. Building upon these findings, the next section explores future research opportunities for investigating the integration of decadal precipitation forecasts into hydrological modeling and water resources management studies.
4.2. Prospects of Multi-Temporal Forecasting in the Water Resources Sector
In semi-arid regions such as Northeast Brazil, reliable precipitation forecasts are particularly important for water resources planning and drought preparedness. While seasonal forecasts are already used operationally to construct scenarios for water allocation in Ceará, decadal predictions can provide valuable complementary information for medium- and long-term planning. This becomes particularly relevant under prolonged drought conditions, such as the severe 2012–2018 drought event that affected Northeast Brazil [1,33,35,46,47,95].
The main objective of this study was to evaluate the predictive skill of decadal precipitation forecasts, without directly addressing how this information can be translated into practical value for the water resources sector or incorporated as a climate service to support medium- and long-term planning and decision-making [17,44,96,97]. This distinction is important because high-performing forecasts do not necessarily translate into operational improvements, since their practical value depends on how this information is incorporated into planning and decision-making processes [8,98,99,100,101,102].
Presently, seasonal forecasts implemented at FUNCEME have already been utilized to support decision-making in the water resources sector in Ceará. These forecasts assist in water allocation, reservoir operation, and emergency planning, thereby demonstrating the practical value of climate information for integrated water resources management.
However, the usefulness of climate information depends on the forecast period. At shorter timescales, its value may be limited by the strong influence of initial conditions, particularly reservoir storage, which can exert greater control on short-term water availability than the climate forecast itself. An evaluation of the use of climate and hydrological information for water allocation in Ceará showed that reservoir initial conditions can mask the effective contribution of climate information to decision-making [8].
In this context, longer forecast horizons, such as muti-years to decadal predictions, may help reduce this dependence on initial conditions and expand the use of climate information in medium-term and long-term planning. Decadal predictability could provide additional information for strategic water resources management in basins, complementing seasonal forecasts, and help bridge the gap between interannual variability and long-term planning. Recent studies have also emphasized the potential of integrating climate forecasts, hydrological models, and water management systems to improve drought preparedness and operational planning [93,103,104].
5. Conclusions
This study evaluated the predictive skill of decadal precipitation forecasts from CMIP6 prediction models across three strategic catchments in Ceará state, associated with the Orós, Banabuiú, and Castanhão reservoirs. Forecast performance was assessed using deterministic and probabilistic metrics for the annual horizon (forecast year 1) and for the multi-year averaging horizons corresponding to forecast years 1–5 and 1–10, representing interannual, multiannual, and decadal climate variability.
Among the models analyzed, CanESM5, HadGEM3-GC31-MM, FGOALS-f3-L, CMCC-CM2-SR5, and MIROC6 demonstrated skill higher than the climatological reference forecast across the three analyzed catchments. In contrast, EC-Earth3 and MPI-ESM1-2-LR exhibited limited or no skill, with negative anomaly correlations as well as negative CRPSS and BSS values. Spatially, differences among the catchments were relatively small, although the Castanhão catchment generally showed slightly higher skill scores than the Orós and Banabuiú catchments.
In terms of averaging horizons, model performance was generally stronger for the annual horizon (forecast year 1) and the decadal averaging horizon (forecast years 1–10), whereas reduced skill was observed for the intermediate averaging horizon (forecast years 1–5), suggesting greater difficulty in capturing climate variability at multiannual timescales. Additionally, most models displayed a systematic tendency to overestimate precipitation across the studied catchments. Bias correction reduced these systematic errors and improved the representation of precipitation magnitude, although improvements in predictive skill metrics were generally modest.
Overall, the results indicate that selected CMIP6 decadal prediction systems can provide potentially useful precipitation information at the catchment scale in Brazil’s semi-arid region. Given the strong dependence of regional water resources and agricultural systems on climate variability, these forecasts may provide complementary climate information for near-term planning and climate risk assessment in regions strongly influenced by climate variability. By extending climate information beyond historical observations, these forecasts may support more informed decision-making in climate-sensitive sectors.
Nevertheless, some limitations should be acknowledged. The analysis focused exclusively on precipitation and on three strategic catchments in Ceará, which may limit the broader applicability of the findings to other climatic variables or regions. Furthermore, the relatively low predictive skill for the intermediate averaging horizon (forecast years 1–5) underscores the need for further investigation into the mechanisms governing multiannual climate variability and forecast uncertainty.
This study advances the understanding of CMIP6 decadal forecast performance in the Brazilian semi-arid region by providing a comprehensive catchment-scale assessment. Its findings provide a foundation for future research investigating the integration of decadal climate predictions into hydrological modeling, water resources management, and climate adaptation strategies.
Supplementary Materials
The following supporting information can be downloaded at: https://www.mdpi.com/article/10.3390/cli14070144/s1, Figure S1: Time series of precipitation for the Banabuiú, Castanhão, and Orós catchments at the annual, 5–year moving average, and 10–year moving average timescales; Figure S2: Performance of the decadal prediction models for forecast year 1 before bias correction across the different catchments; Figure S3: Performance of the decadal prediction models for forecast years 1–5 before bias correction across the different catchments; Figure S4: Performance of the decadal prediction models for forecast years 1–10 before bias correction across the different catchments.
Author Contributions
Conceptualization, methodology and validation, G.P.F., F.d.C.V.J., I.A.e.S. and E.S.P.R.M.; software, G.P.F.; formal analysis, investigation, writing—original draft preparation, G.P.F. and E.S.P.R.M.; resources, data curation, G.P.F.; writing—review, editing and supervision, F.d.C.V.J., I.A.e.S. and E.S.P.R.M. All authors have read and agreed to the published version of the manuscript.
Funding
This study was conducted as part of a collaboration between the PhD Program at the Federal University of Ceará (UFC) and the Ceará Foundation for Meteorology and Water Resources (FUNCEME). This study was supported by CAPES–COFECUB (Grant No. 88887.711963/2022-00), FUNCAP-FIT (Grant No. 4920881/2018), and financed in part by the Coordenação de Aperfeiçoamento de Pessoal de Nível Superior—Brasil (CAPES)—Finance Code 001.
Data Availability Statement
The study did not report any data.
Acknowledgments
The authors acknowledge the logistical support provided by FUNCEME (Research Institute for Meteorology and Water Resources, State of Ceará) and PhD Program at the Federal University of Ceará (UFC).
Conflicts of Interest
The authors declare no conflicts of interest.
References
- Hastenrath, S. Exploring the Climate Problems of Brazil’s Nordeste: A Review. Clim. Change 2012, 112, 243–251. [Google Scholar] [CrossRef] [Scilit]
- Marengo, J.A. Vulnerabilidade, Impactos e Adaptação à Mudança Do Clima No Semi-Árido Do Brasil. Parcer. Estratégicas 2008, 27, 149–176. [Google Scholar]
- Marengo, J.A.; Cunha, A.P.M.A.; Nobre, C.A.; Ribeiro Neto, G.G.; Magalhaes, A.R.; Torres, R.R.; Sampaio, G.; Alexandre, F.; Alves, L.M.; Cuartas, L.A.; et al. Assessing Drought in the Drylands of Northeast Brazil under Regional Warming Exceeding 4 °C. Nat. Hazards 2020, 103, 2589–2611. [Google Scholar] [CrossRef] [Scilit]
- Mohammed, R.; Scholz, M. Climate Variability Impact on the Spatiotemporal Characteristics of Drought and Aridityin Arid and Semi-Arid Regions. Water Resour. Manag. 2019, 33, 5015–5033. [Google Scholar] [CrossRef] [Scilit]
- Patel, R.; Patel, A. Evaluating the Impact of Climate Change on Drought Risk in Semi-Arid Region Using GIS Technique. Results Eng. 2024, 21, 101957. [Google Scholar] [CrossRef] [Scilit]
- Bruno Soares, M.; Daly, M.; Dessai, S. Assessing the Value of Seasonal Climate Forecasts for Decision-making. WIREs Clim. Change 2018, 9, e523. [Google Scholar] [CrossRef] [Scilit]
- Robertson, A.W.; Baethgen, W.; Block, P.; Lall, U.; Sankarasubramanian, A.; de Assis de Souza Filho, F.; Verbist, K.M.J. Climate Risk Management for Water in Semi–Arid Regions. Earth Perspect. 2014, 1, 12. [Google Scholar] [CrossRef] [Scilit]
- Pereira, J.M.R.; do Carmo Raimundo, C.; Reis, D.S.; das Chagas Vasconcelos, F.; Martins, E.S.P.R. Use of Climate Information in Water Allocation: A Case of Study in a Semiarid Region. Water 2023, 15, 2460. [Google Scholar] [CrossRef] [Scilit]
- Becker, E.J.; Kirtman, B.P.; L’Heureux, M.; Muñoz, Á.G.; Pegion, K. A Decade of the North American Multimodel Ensemble (NMME): Research, Application, and Future Directions. Bull. Am. Meteorol. Soc. 2022, 103, E973–E995. [Google Scholar] [CrossRef] [Scilit]
- Ferreira, G.W.S.; Reboita, M.S.; Drumond, A. Evaluation of ECMWF-SEAS5 Seasonal Temperature and Precipitation Predictions over South America. Climate 2022, 10, 128. [Google Scholar] [CrossRef] [Scilit]
- da Rocha Júnior, R.L.; Cavalcante Pinto, D.D.; Dos Santos Silva, F.D.; Gomes, H.B.; Barros Gomes, H.; Costa, R.L.; Santos Pereira, M.P.; Peña, M.; dos Santos Coelho, C.A.; Herdies, D.L. An Empirical Seasonal Rainfall Forecasting Model for the Northeast Region of Brazil. Water 2021, 13, 1613. [Google Scholar] [CrossRef] [Scilit]
- dos Santos Guimarães, B.; dos Santos Coelho, C.A.; Woolnough, S.J.; Kubota, P.Y.; Bastarz, C.F.; Figueroa, S.N.; Bonatti, J.P.; de Souza, D.C. An Inter-Comparison Performance Assessment of a Brazilian Global Sub-Seasonal Prediction Model against Four Sub-Seasonal to Seasonal (S2S) Prediction Project Models. Clim. Dyn. 2021, 56, 2359–2375. [Google Scholar] [CrossRef] [Scilit]
- Kent, C.; Scaife, A.A.; Dunstone, N.J.; Smith, D.; Hardiman, S.C.; Dunstan, T.; Watt-Meyer, O. Skilful Global Seasonal Predictions from a Machine Learning Weather Model Trained on Reanalysis Data. npj Clim. Atmos. Sci. 2025, 8, 314. [Google Scholar] [CrossRef] [Scilit]
- Najafi, M.S.; Alizadeh, O. The Skill of RegCM-4 in Forecasting Iran’s Precipitation: A Basin-Scale Intra-Seasonal to Seasonal Analysis. Theor. Appl. Climatol. 2025, 156, 505. [Google Scholar] [CrossRef] [Scilit]
- White, C.J.; Domeisen, D.I.V.; Acharya, N.; Adefisan, E.A.; Anderson, M.L.; Aura, S.; Balogun, A.A.; Bertram, D.; Bluhm, S.; Brayshaw, D.J.; et al. Advances in the Application and Utility of Subseasonal-to-Seasonal Predictions. Bull. Am. Meteorol. Soc. 2022, 103, E1448–E1472. [Google Scholar] [CrossRef] [Scilit]
- Sapucci, C.R.; Mayta, V.C.; Silva Dias, P.L. Predictability of Precipitation and Intraseasonal Variability: Insights From ECMWF Model Skill Over Brazil. Int. J. Climatol. 2025, 45, e8820. [Google Scholar] [CrossRef] [Scilit]
- Escada, P.; Coelho, C.A.S.; Taddei, R.; Dessai, S.; Cavalcanti, I.F.A.; Donato, R.; Kayano, M.; Martins, E.S.P.R.; Miguel, J.C.H.; Monteiro, M.; et al. Climate Services in Brazil: Past, Present and Future Perspectives. Clim. Serv. 2021, 24, 100276. [Google Scholar] [CrossRef] [Scilit]
- Boer, G.J.; Smith, D.M.; Cassou, C.; Doblas-Reyes, F.; Danabasoglu, G.; Kirtman, B.; Kushnir, Y.; Kimoto, M.; Meehl, G.A.; Msadek, R.; et al. The Decadal Climate Prediction Project (DCPP) Contribution to CMIP6. Geosci. Model Dev. 2016, 9, 3751–3777. [Google Scholar] [CrossRef] [Scilit]
- Meehl, G.A.; Goddard, L.; Boer, G.; Burgman, R.; Branstator, G.; Cassou, C.; Corti, S.; Danabasoglu, G.; Doblas-Reyes, F.; Hawkins, E.; et al. Decadal Climate Prediction an Update from the Trenches. Bull. Am. Meteorol. Soc. 2014, 95, 243–267. [Google Scholar] [CrossRef] [Scilit]
- Meehl, G.A.; Goddard, L.; Murphy, J.; Stouffer, R.J.; Boer, G.; Danabasoglu, G.; Dixon, K.; Giorgetta, M.A.; Greene, A.M.; Hawkins, E.; et al. Decadal Prediction. Bull. Am. Meteorol. Soc. 2009, 90, 1467–1486. [Google Scholar] [CrossRef] [Scilit]
- Smith, D.M.; Eade, R.; Scaife, A.A.; Caron, L.P.; Danabasoglu, G.; DelSole, T.M.; Delworth, T.; Doblas-Reyes, F.J.; Dunstone, N.J.; Hermanson, L.; et al. Robust Skill of Decadal Climate Predictions. npj Clim. Atmos. Sci. 2019, 2, 13. [Google Scholar] [CrossRef] [Scilit]
- Boer, G.J.; Sospedra-Alfonso, R. Assessing the Skill of the Pacific Decadal Oscillation (PDO) in a Decadal Prediction Experiment. Clim. Dyn. 2019, 53, 5763–5775. [Google Scholar] [CrossRef] [Scilit]
- Borchert, L.F.; Menary, M.B.; Swingedouw, D.; Sgubin, G.; Hermanson, L.; Mignot, J. Improved Decadal Predictions of North Atlantic Subpolar Gyre SST in CMIP6. Geophys. Res. Lett. 2021, 48, e2020GL091307. [Google Scholar] [CrossRef] [Scilit]
- Choi, J.; Son, S.W. Seasonal-to-Decadal Prediction of El Niño–Southern Oscillation and Pacific Decadal Oscillation. npj Clim. Atmos. Sci. 2022, 5, 29. [Google Scholar] [CrossRef] [Scilit]
- Nicolì, D.; Gualdi, S.; Athanasiadis, P.J. Decadal Predictions Outperform Climate Projections in Forecasting Mediterranean Wintertime Precipitation. Environ. Res. Lett. 2025, 20, 034034. [Google Scholar] [CrossRef] [Scilit]
- Xin, X.; Wu, T.; Zheng, M.; Fang, Y.; Lu, Y.; Zhang, J. Decadal Prediction of Northeast Asian Winter Precipitation with CMIP6 Models. Clim. Dyn. 2024, 62, 3245–3259. [Google Scholar] [CrossRef] [Scilit]
- Delgado-Torres, C.; Donat, M.G.; Gonzalez-Reviriego, N.; Caron, L.-P.; Athanasiadis, P.J.; Bretonnière, P.-A.; Dunstone, N.J.; Ho, A.-C.; Nicoli, D.; Pankatz, K.; et al. Multi-Model Forecast Quality Assessment of CMIP6 Decadal Predictions. J. Clim. 2022, 35, 4363–4382. [Google Scholar] [CrossRef] [Scilit]
- van Oldenborgh, G.J.; Doblas-Reyes, F.J.; Wouters, B.; Hazeleger, W. Decadal Prediction Skill in a Multi-Model Ensemble. Clim. Dyn. 2012, 38, 1263–1280. [Google Scholar] [CrossRef] [Scilit]
- He, Y.; Wang, B.; Liu, J.; Wang, Y.; Li, L.; Liu, L.; Xu, S.; Huang, W.; Lu, H. Assessment of the Decadal Prediction Skill of Sahel Rainfall in CMIP5 and CMIP6. J. Clim. 2024, 37, 2471–2490. [Google Scholar] [CrossRef] [Scilit]
- Konda, G.; Chowdary, J.S.; Gnanaseelan, C.; Parekh, A. Near-Term Prediction of Surface Temperature Extremes over India in the CMIP6-DCPP Models. Clim. Dyn. 2024, 62, 10717–10731. [Google Scholar] [CrossRef] [Scilit]
- Asadi-RahimBeygi, N.; Mofidi, A.; Zarrin, A.; Dadashi-Roudbari, A. Near-Term Climate Extremes in Iran Based on Compound Hazards Analysis. Sci. Rep. 2025, 15, 43843. [Google Scholar] [CrossRef] [Scilit] [PubMed]
- Andreoli, R.V.; de Oliveira, S.S.; Kayano, M.T.; Viegas, J.; de Souza, R.A.F.; Candido, L.A. The Influence of Different El Niño Types on the South American Rainfall. Int. J. Climatol. 2017, 37, 1374–1390. [Google Scholar] [CrossRef] [Scilit]
- Cunha, A.P.M.A.; Zeri, M.; Leal, K.D.; Costa, L.; Cuartas, L.A.; Marengo, J.A.; Tomasella, J.; Vieira, R.M.; Barbosa, A.A.; Cunningham, C.; et al. Extreme Drought Events over Brazil from 2011 to 2019. Atmosphere 2019, 10, 642. [Google Scholar] [CrossRef] [Scilit]
- da Costa, J.A.C.; Andreoli, R.V.; Kayano, M.T.; de Souza, I.P.; de Souza, R.A.F.; Cerón, W.L. The South American Precipitation Trends under (or Not) El Niño-Southern Oscillation Influences and Relationship with Large-Scale Circulation. Int. J. Climatol. 2024, 44, 3154–3168. [Google Scholar] [CrossRef] [Scilit]
- de Medeiros, F.J.; de Oliveira, C.P.; Torres, R.R. Climatic Aspects and Vertical Structure Circulation Associated with the Severe Drought in Northeast Brazil (2012–2016). Clim. Dyn. 2020, 55, 2327–2341. [Google Scholar] [CrossRef] [Scilit]
- Kayano, M.T.; Andreoli, R.V.; de Souza, R.A.F. Pacific and Atlantic Multidecadal Variability Relations to the El Niño Events and Their Effects on the South American Rainfall. Int. J. Climatol. 2020, 40, 2183–2200. [Google Scholar] [CrossRef] [Scilit]
- Maksic, J.; Shimizu, M.H.; Kayano, M.T.; Chiessi, C.M.; Prange, M.; Sampaio, G. Influence of the Atlantic Multidecadal Oscillation on South American Atmosphere Dynamics and Precipitation. Atmosphere 2022, 13, 1778. [Google Scholar] [CrossRef] [Scilit]
- Oliveira, P.T.; Santos e Silva, C.M.; Lima, K.C. Climatology and Trend Analysis of Extreme Precipitation in Subregions of Northeast Brazil. Theor. Appl. Climatol. 2017, 130, 77–90. [Google Scholar] [CrossRef] [Scilit]
- Shimizu, M.H.; Anochi, J.A.; Kayano, M.T. Precipitation Patterns over Northern Brazil Basins: Climatology, Trends, and Associated Mechanisms. Theor. Appl. Climatol. 2022, 147, 767–783. [Google Scholar] [CrossRef] [Scilit]
- Mutti, P.R.; de Abreu, L.P.; Andrade, L.d.M.B.; Spyrides, M.H.C.; Lima, K.C.; de Oliveira, C.P.; Dubreuil, V.; Bezerra, B.G. A Detailed Framework for the Characterization of Rainfall Climatology in Semiarid Watersheds. Theor. Appl. Climatol. 2020, 139, 109–125. [Google Scholar] [CrossRef] [Scilit]
- Doblas-Reyes, F.J.; García-Serrano, J.; Lienert, F.; Biescas, A.P.; Rodrigues, L.R.L. Seasonal Climate Predictability and Forecasting: Status and Prospects. WIREs Clim. Change 2013, 4, 245–268. [Google Scholar] [CrossRef] [Scilit]
- Moura, A.D.; Hastenrath, S. Climate Prediction for Brazil’s Nordeste: Performance of Empirical and Numerical Modeling Methods. J. Clim. 2004, 17, 2667–2672. [Google Scholar] [CrossRef] [Scilit]
- Pinheiro, E.; Ouarda, T.B.M.J. Short-Lead Seasonal Precipitation Forecast in Northeastern Brazil Using an Ensemble of Artificial Neural Networks. Sci. Rep. 2023, 13, 20429. [Google Scholar] [CrossRef] [Scilit] [PubMed]
- Medeiros, C.N.; Gomes, D.D.M.; Albuquerque, E.L.S.; da Cruz, M.L.B. (Eds.) Os Recursos Hídricos Do Ceará: Integração, Gestão E Potencialidades; Instituto de Pesquisa e Estratégia Econômica do Ceará (IPECE): Fortaleza, Brazil, 2011.
- Agência Nacional de Águas (Brasil). Reservatórios Do Semiárido Brasileiro: Hidrologia, Balanço e Operação: Anexo C; Agência Nacional de Águas: Brasilia, Brazil, 2017.
- de Souza Santos, J.A.; Wanderley, H.S.; Carlos de Amorim, R.F.; Delgado, R.C.; Fernades, R.C. The Longest Multiannual Drought in Northeastern Brazil. J. S. Am. Earth Sci. 2024, 143, 104976. [Google Scholar] [CrossRef] [Scilit]
- Marengo, J.A.; Torres, R.R.; Alves, L.M. Drought in Northeast Brazil—Past, Present, and Future. Theor. Appl. Climatol. 2017, 129, 1189–1200. [Google Scholar] [CrossRef] [Scilit]
- Utida, G.; Cruz, F.W.; Etourneau, J.; Bouloubassi, I.; Schefuß, E.; Vuille, M.; Novello, V.F.; Prado, L.F.; Sifeddine, A.; Klein, V.; et al. Tropical South Atlantic Influence on Northeastern Brazil Precipitation and ITCZ Displacement during the Past 2300 Years. Sci. Rep. 2019, 9, 1698. [Google Scholar] [CrossRef] [Scilit] [PubMed]
- Cai, W.; McPhaden, M.J.; Grimm, A.M.; Rodrigues, R.R.; Taschetto, A.S.; Garreaud, R.D.; Dewitte, B.; Poveda, G.; Ham, Y.G.; Santoso, A.; et al. Climate Impacts of the El Niño–Southern Oscillation on South America. Nat. Rev. Earth Environ. 2020, 1, 215–231. [Google Scholar] [CrossRef] [Scilit]
- de Medeiros, F.J.; de Oliveira, C.P. Dynamical Aspects of the Recent Strong El Niño Events and Its Climate Impacts in Northeast Brazil. Pure Appl. Geophys. 2021, 178, 2315–2332. [Google Scholar] [CrossRef] [Scilit]
- Mamani Jimenez, L.C.; Andreoli, R.V.; Kayano, M.T.; de Souza, R.A.F.; Ceron, W.L. Multiyear versus Single-Year El Niño Events: Contrasting Their Impacts on South American Seasonal Precipitation. Int. J. Climatol. 2023, 43, 6368–6382. [Google Scholar] [CrossRef] [Scilit]
- Champagne, O.; Arain, M.A.; Wang, S.; Leduc, M.; Russell, H.A.J. Interdecadal Variability of Streamflow in the Hudson Bay Lowlands Watersheds Driven by Atmospheric Circulation. J. Hydrol. Reg. Stud. 2021, 36, 100868. [Google Scholar] [CrossRef] [Scilit]
- Mantua, N.J.; Hare, S.R.; Zhang, Y.; Wallace, J.M.; Francis, R.C. A Pacific Interdecadal Climate Oscillation with Impacts on Salmon Production. Bull. Am. Meteorol. Soc. 1997, 78, 1069–1079. [Google Scholar] [CrossRef] [Scilit]
- Souza, I.P.; Andreoli, R.V.; Kayano, M.T.; Cerón, W.L.; Souza, R.A.F.; Roy, I. Interdecadal Pacific Oscillation Modulation of ENSO Teleconnections in Its Decaying Stages: Relations with Indian Ocean Basin-Wide Mode and South American Precipitation. Int. J. Climatol. 2023, 43, 3264–3283. [Google Scholar] [CrossRef] [Scilit]
- Eyring, V.; Bony, S.; Meehl, G.A.; Senior, C.A.; Stevens, B.; Stouffer, R.J.; Taylor, K.E. Overview of the Coupled Model Intercomparison Project Phase 6 (CMIP6) Experimental Design and Organization. Geosci. Model Dev. 2016, 9, 1937–1958. [Google Scholar] [CrossRef] [Scilit]
- Nicolì, D.; Bellucci, A.; Ruggieri, P.; Athanasiadis, P.J.; Materia, S.; Peano, D.; Fedele, G.; Hénin, R.; Gualdi, S. The Euro-Mediterranean Center on Climate Change (CMCC) Decadal Prediction System. Geosci. Model Dev. 2023, 16, 179–197. [Google Scholar] [CrossRef] [Scilit]
- Swart, N.C.; Cole, J.N.S.; Kharin, V.V.; Lazare, M.; Scinocca, J.F.; Gillett, N.P.; Anstey, J.; Arora, V.; Christian, J.R.; Hanna, S.; et al. The Canadian Earth System Model Version 5 (CanESM5.0.3). Geosci. Model Dev. 2019, 12, 4823–4873. [Google Scholar] [CrossRef] [Scilit]
- Bilbao, R.; Wild, S.; Ortega, P.; Acosta-Navarro, J.; Arsouze, T.; Bretonnière, P.A.; Caron, L.P.; Castrillo, M.; Cruz-García, R.; Cvijanovic, I.; et al. Assessment of a Full-Field Initialized Decadal Climate Prediction System with the CMIP6 Version of EC-Earth. Earth Syst. Dyn. 2021, 12, 173–196. [Google Scholar] [CrossRef] [Scilit]
- Hu, S.; Wu, B.; Wang, Y.; Zhou, T.; Yu, Y.; He, B.; Lin, P.; Bao, Q.; Liu, H.; Chen, K.; et al. CAS FGOALS-F3-L Model Datasets for CMIP6 DCPP Experiment. Adv. Atmos. Sci. 2023, 40, 1911–1922. [Google Scholar] [CrossRef] [Scilit]
- Sellar, A.A.; Walton, J.; Jones, C.G.; Wood, R.; Abraham, N.L.; Andrejczuk, M.; Andrews, M.B.; Andrews, T.; Archibald, A.T.; de Mora, L.; et al. Implementation of U.K. Earth System Models for CMIP6. J. Adv. Model. Earth Syst. 2020, 12. [Google Scholar] [CrossRef] [Scilit]
- Kataoka, T.; Tatebe, H.; Koyama, H.; Mochizuki, T.; Ogochi, K.; Naoe, H.; Imada, Y.; Shiogama, H.; Kimoto, M.; Watanabe, M. Seasonal to Decadal Predictions with MIROC6: Description and Basic Evaluation. J. Adv. Model. Earth Syst. 2020, 12. [Google Scholar] [CrossRef] [Scilit]
- Mauritsen, T.; Bader, J.; Becker, T.; Behrens, J.; Bittner, M.; Brokopf, R.; Brovkin, V.; Claussen, M.; Crueger, T.; Esch, M.; et al. Developments in the MPI-M Earth System Model Version 1.2 (MPI-ESM1.2) and Its Response to Increasing CO2. J. Adv. Model. Earth Syst. 2019, 11, 998–1038. [Google Scholar] [CrossRef] [Scilit] [PubMed]
- Zhao, T.; Bennett, J.C.; Wang, Q.J.; Schepen, A.; Wood, A.W.; Robertson, D.E.; Ramos, M.H. How Suitable Is Quantile Mapping for Postprocessing GCM Precipitation Forecasts? J. Clim. 2017, 30, 3185–3196. [Google Scholar] [CrossRef] [Scilit]
- International CLIVAR Project Office. Data and Bias Correction for Decadal Climate Predictions; CLIVAR Publication Series No. 150; International CLIVAR Project Office: Southampton, UK, 2011. [Google Scholar]
- Rosa-Cánovas, J.J.; García-Valdecasas Ojeda, M.; Romero-Jiménez, E.; Yeste, P.; Gámiz-Fortis, S.R.; Castro-Díez, Y.; Esteban-Parra, M.J. Drift Correction and Sub-Ensemble Predictive Skill Evaluation of the Decadal Prediction Large Ensemble With Application to Regional Studies. J. Geophys. Res. Atmos. 2023, 128, e2023JD039709. [Google Scholar] [CrossRef] [Scilit]
- Eade, R.; Smith, D.; Scaife, A.; Wallace, E.; Dunstone, N.; Hermanson, L.; Robinson, N. Do Seasonal-to-Decadal Climate Predictions Underestimate the Predictability of the Real World? Geophys. Res. Lett. 2014, 41, 5620–5628. [Google Scholar] [CrossRef] [Scilit] [PubMed]
- Pasternack, A.; Bhend, J.; Liniger, M.A.; Rust, H.W.; Müller, W.A.; Ulbrich, U. Parametric Decadal Climate Forecast Recalibration (DeFoReSt 1.0). Geosci. Model Dev. 2018, 11, 351–368. [Google Scholar] [CrossRef] [Scilit]
- Pasternack, A.; Grieger, J.; Rust, H.W.; Ulbrich, U. Recalibrating Decadal Climate Predictions—What Is an Adequate Model for the Drift? Geosci. Model Dev. 2021, 14, 4335–4355. [Google Scholar] [CrossRef] [Scilit]
- Lanzante, J.R.; Adams-Smith, D.; Dixon, K.W.; Nath, M.; Whitlock, C.E. Evaluation of Some Distributional Downscaling Methods as Applied to Daily Maximum Temperature with Emphasis on Extremes. Int. J. Climatol. 2020, 40, 1571–1585. [Google Scholar] [CrossRef] [Scilit]
- Konda, G.; Chowdary, J.S.; Gnanaseelan, C.; Parekh, A. Improvement in the Skill of CMIP6 Decadal Hindcasts for Extreme Rainfall Events over the Indian Summer Monsoon Region. Sci. Rep. 2023, 13, 21737. [Google Scholar] [CrossRef] [Scilit] [PubMed]
- Shoja, F.; Hamidianpour, M.; Barahooie, D. Forecasting Climate Change Effects on Drought Using the Decadal Climate Prediction Project in Arid and Semi-Arid Regions of Southeastern Iran. Nat. Hazards 2025, 121, 15553–15580. [Google Scholar] [CrossRef] [Scilit]
- Golian, S.; Murphy, C. Evaluating Bias-Correction Methods for Seasonal Dynamical Precipitation Forecasts. J. Hydrometeorogy 2022, 23, 1350–1363. [Google Scholar] [CrossRef] [Scilit]
- Thiessen, A.H. Precipitation Averages for Large Areas. Mon. Weather Rev. 1911, 39, 1082–1089. [Google Scholar] [CrossRef] [Scilit]
- Wilks, D.S. Forecast Verification. Int. Geophys. 2011, 100, 301–394. [Google Scholar] [CrossRef] [Scilit]
- Leutbecher, M.; Haiden, T. Understanding Changes of the Continuous Ranked Probability Score Using a Homogeneous Gaussian Approximation. Q. J. R. Meteorol. Soc. 2021, 147, 425–442. [Google Scholar] [CrossRef] [Scilit]
- Matheson, J.E.; Winkler, R.L. Scoring Rules for Continuous Probability Distributions. Manag. Sci. 1976, 22, 1087–1096. [Google Scholar] [CrossRef] [Scilit]
- Hersbach, H. Decomposition of the Continuous Ranked Probability Score for Ensemble Prediction Systems. Weather Forecast. 2000, 15, 559–570. [Google Scholar] [CrossRef] [Scilit]
- Tsartsali, E.E.; Athanasiadis, P.J.; Materia, S.; Bellucci, A.; Nicolì, D.; Gualdi, S. Predicting Precipitation on the Decadal Timescale: A Prototype Climate Service for the Hydropower Sector. Clim. Serv. 2023, 32, 100422. [Google Scholar] [CrossRef] [Scilit]
- Moulds, S.; Slater, L.J.; Dunstone, N.J.; Smith, D.M. Skillful Decadal Flood Prediction. Geophys. Res. Lett. 2023, 50, e2022GL100650. [Google Scholar] [CrossRef] [Scilit]
- Kayano, M.T.; Cerón, W.L.; Andreoli, R.V.; Souza, R.A.F.; Avila-Diaz, A.; Zuluaga, C.F.; Carvalho, L.M.V. Does the El Niño-Southern Oscillation Affect the Combined Impact of the Atlantic Multidecadal Oscillation and Pacific Decadal Oscillation on the Precipitation and Surface Air Temperature Variability over South America? Atmosphere 2022, 13, 231. [Google Scholar] [CrossRef] [Scilit]
- Monteiro, J.B. The Influence of Teleconnections and Meteorological Systems Producers of Precipitation in the Semi-Arid Northeast. Rev. Bras. Geogr. Fis. 2022, 15, 312–332. [Google Scholar] [CrossRef] [Scilit]
- Monerie, P.A.; Robson, J.I.; Ndiaye, C.D.; Song, C.; Turner, A.G. CMIP6 Skill at Predicting Interannual to Multi-Decadal Summer Monsoon Precipitation Variability. Environ. Res. Lett. 2023, 18, 094002. [Google Scholar] [CrossRef] [Scilit]
- Liu, Y.; Donat, M.G.; Taschetto, A.S.; Doblas-Reyes, F.J.; Alexander, L.V.; England, M.H. A Framework to Determine the Limits of Achievable Skill for Interannual to Decadal Climate Predictions. J. Geophys. Res. Atmos. 2019, 124, 2882–2896. [Google Scholar] [CrossRef] [Scilit]
- Sospedra-Alfonso, R.; Boer, G.J. Assessing the Impact of Initialization on Decadal Prediction Skill. Geophys. Res. Lett. 2020, 47, e2019GL086361. [Google Scholar] [CrossRef] [Scilit]
- Befort, D.J.; O’Reilly, C.H.; Weisheimer, A. Constraining Projections Using Decadal Predictions. Geophys. Res. Lett. 2020, 47, e2020GL087900. [Google Scholar] [CrossRef] [Scilit]
- Delgado-Torres, C.; Donat, M.G.; Soret, A.; González-Reviriego, N.; Bretonnière, P.A.; Ho, A.C.; Pérez-Zanón, N.; Samsó Cabré, M.; Doblas-Reyes, F.J. Multi-Annual Predictions of the Frequency and Intensity of Daily Temperature and Precipitation Extremes. Environ. Res. Lett. 2023, 18, 034031. [Google Scholar] [CrossRef] [Scilit]
- Kim, H.M.; Webster, P.J.; Curry, J.A. Evaluation of Short-Term Climate Change Prediction in Multi-Model CMIP5 Decadal Hindcasts. Geophys. Res. Lett. 2012, 39, L10701. [Google Scholar] [CrossRef] [Scilit]
- Firpo, M.Â.F.; dos Santos Guimarães, B.; Dantas, L.G.; da Silva, M.G.B.; Alves, L.M.; Chadwick, R.; Llopart, M.P.; de Oliveira, G.S. Assessment of CMIP6 Models’ Performance in Simulating Present-Day Climate in Brazil. Front. Clim. 2022, 4, 948499. [Google Scholar] [CrossRef] [Scilit]
- Ahmed, K.; Sachindra, D.A.; Shahid, S.; Iqbal, Z.; Nawaz, N.; Khan, N. Multi-Model Ensemble Predictions of Precipitation and Temperature Using Machine Learning Algorithms. Atmos. Res. 2020, 236, 104806. [Google Scholar] [CrossRef] [Scilit]
- Reboita, M.S.; Willian de Souza Ferreira, G.; Gabriel Martins Ribeiro, J.; Ali, S. Assessment of Precipitation and Near-Surface Temperature Simulation by CMIP6 Models in South America. Environ. Res. Clim. 2024, 3, 025011. [Google Scholar] [CrossRef] [Scilit]
- de Souza Campos Correa, W.; Soares, W.R.; Aylas, G.Y.R.; Reis Junior, N.C.; Marengo, J.A.; Chou, S.C.; Nobre, C. Avaliação Das Simulações de Temperatura e Precipitação de Um Subconjunto de Modelos Do CMIP6 Para o Brasil. Derbyana 2022, 43, e774. [Google Scholar] [CrossRef] [Scilit]
- Todaro, V.; D’Oria, M.; Tanda, M.G. Skill of CMIP6 Decadal Climate Predictions at the Subregional Scale. Stoch. Environ. Res. Risk Assess. 2026, 40, 91. [Google Scholar] [CrossRef] [Scilit]
- Hossain, M.M.; Garg, N.; Anwar, A.H.M.F.; Prakash, M.; Bari, M. Drift in CMIP5 Decadal Precipitation at Catchment Level. Stoch. Environ. Res. Risk Assess. 2022, 36, 2597–2616. [Google Scholar] [CrossRef] [Scilit]
- Holthuijzen, M.F.; Beckage, B.; Clemins, P.J.; Higdon, D.; Winter, J.M. Constructing High-Resolution, Bias-Corrected Climate Products: A Comparison of Methods. J. Appl. Meteorol. Climatol. 2021, 60, 455–475. [Google Scholar] [CrossRef] [Scilit]
- De Medeiros, F.J.; De Oliveira, C.P.; Gomes, R.D.S.; Da Silva, M.L.; Cabral Júnior, J.B. Hydrometeorological Conditions in the Semiarid and East Coast Regions of Northeast Brazil in the 2012–2017 Period. An. Acad. Bras. Cienc. 2021, 93, e20200198. [Google Scholar] [CrossRef] [Scilit] [PubMed]
- Rottler, E.; Schüttig, M.; Bronstert, A.; Sousa Estácio, A.B.; Vieira Rocha, R.; de Carvalho, V.N.; Barbosa Guimarães, C.C.; Martins, E.S.P.R.; Lorenz, C.; Vormoor, K. Regional-Scale Seasonal Forecast of Surface Water Availability in a Semi-Arid Environment: The Case of Ceará State in Northeast of Brazil. J. Hydrol. Reg. Stud. 2024, 56, 102058. [Google Scholar] [CrossRef] [Scilit]
- Nunes, L.; Medeiros, P. Análise Histórica Da Severidade de Secas No Ceará: Efeitos Da Aquisição de Capital Hidráulico Sobre a Sociedade. Rev. Gestão Água Am. Lat. 2020, 17, e18. [Google Scholar] [CrossRef] [Scilit]
- Lee, Y.; Peñuela, A.; Pianosi, F.; Rico-Ramirez, M.A. Exploring the Value of Seasonal Flow Forecasts for Drought Management in South Korea. Hydrol. Earth Syst. Sci. 2025, 29, 1429–1447. [Google Scholar] [CrossRef] [Scilit]
- Olsen, J.R.; Mehta, V.M.; Hill, H. Incorporating Decadal Climate Variability Information in the Operation and Design of Water Infrastructure. Water Policy 2021, 23, 232–249. [Google Scholar] [CrossRef] [Scilit]
- Boucher, M.A.; Tremblay, D.; Delorme, L.; Perreault, L.; Anctil, F. Hydro-Economic Assessment of Hydrological Forecasting Systems. J. Hydrol. 2012, 416–417, 133–144. [Google Scholar] [CrossRef] [Scilit]
- Towler, E.; Yates, D. Incorporating Multiyear Temperature Predictions for Water Resources Planning. J. Appl. Meteorol. Climatol. 2021, 60, 171–183. [Google Scholar] [CrossRef] [Scilit]
- Chiew, F.H.S.; Zhou, S.L.; McMahon, T.A. Use of Seasonal Streamflow Forecasts in Water Resources Management. J. Hydrol. 2003, 270, 135–144. [Google Scholar] [CrossRef] [Scilit]
- Lee, Y.; Pianosi, F.; Peñuela, A.; Rico-Ramirez, M.A. Skill of Seasonal Flow Forecasts at Catchment Scale: An Assessment across South Korea. Hydrol. Earth Syst. Sci. 2024, 28, 3261–3279. [Google Scholar] [CrossRef] [Scilit]
- Budamala, V.; Roy, T.; Bhowmik, R. Das A Robust Skill Verification of Hindcast Decadal Experiments on Streamflow Regimes Using CMIP6 Data. J. Hydrol. 2025, 650, 132525. [Google Scholar] [CrossRef] [Scilit]
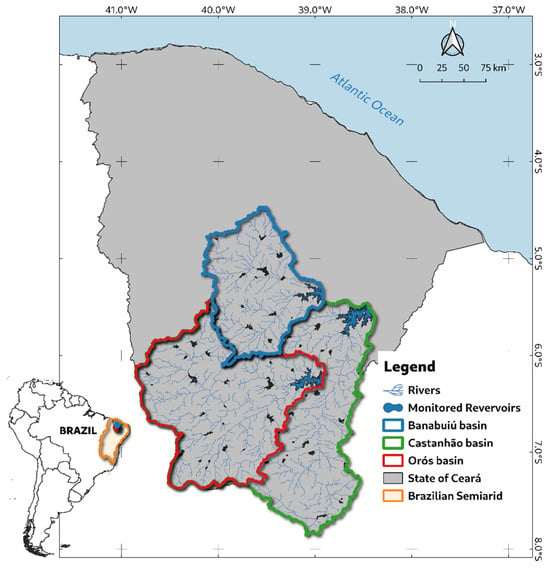
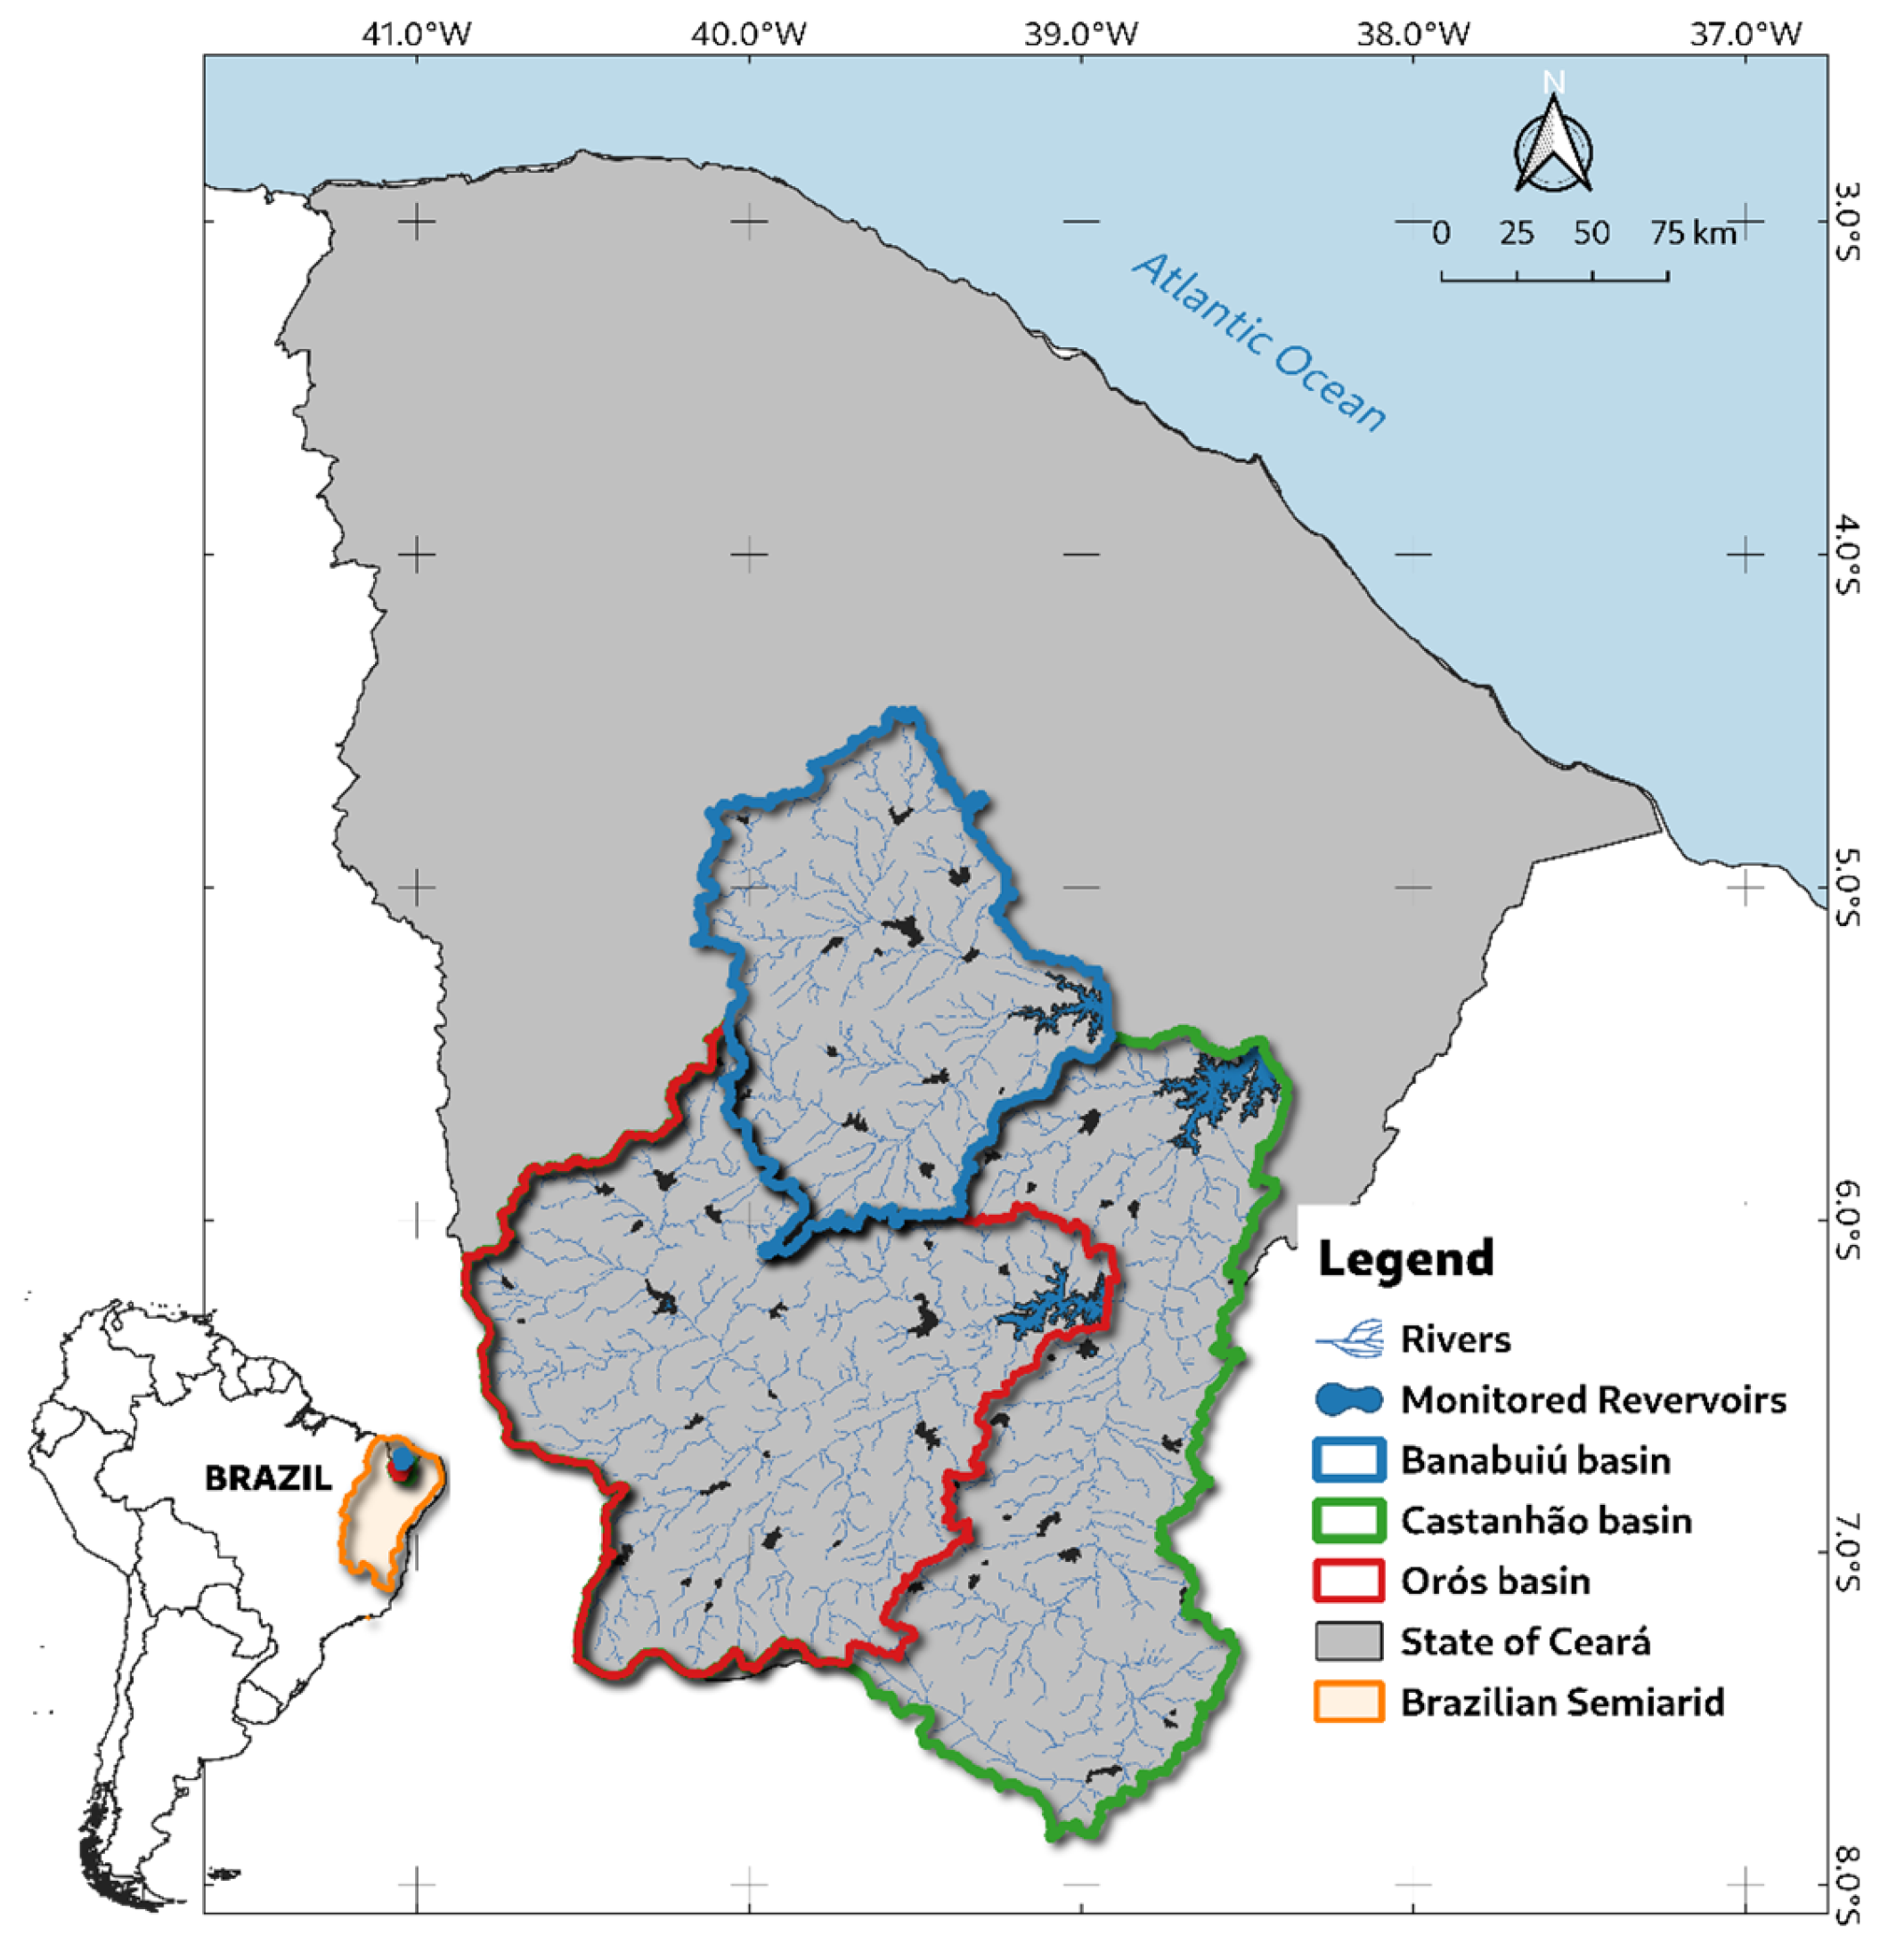
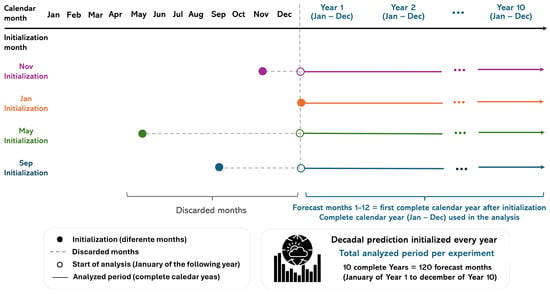
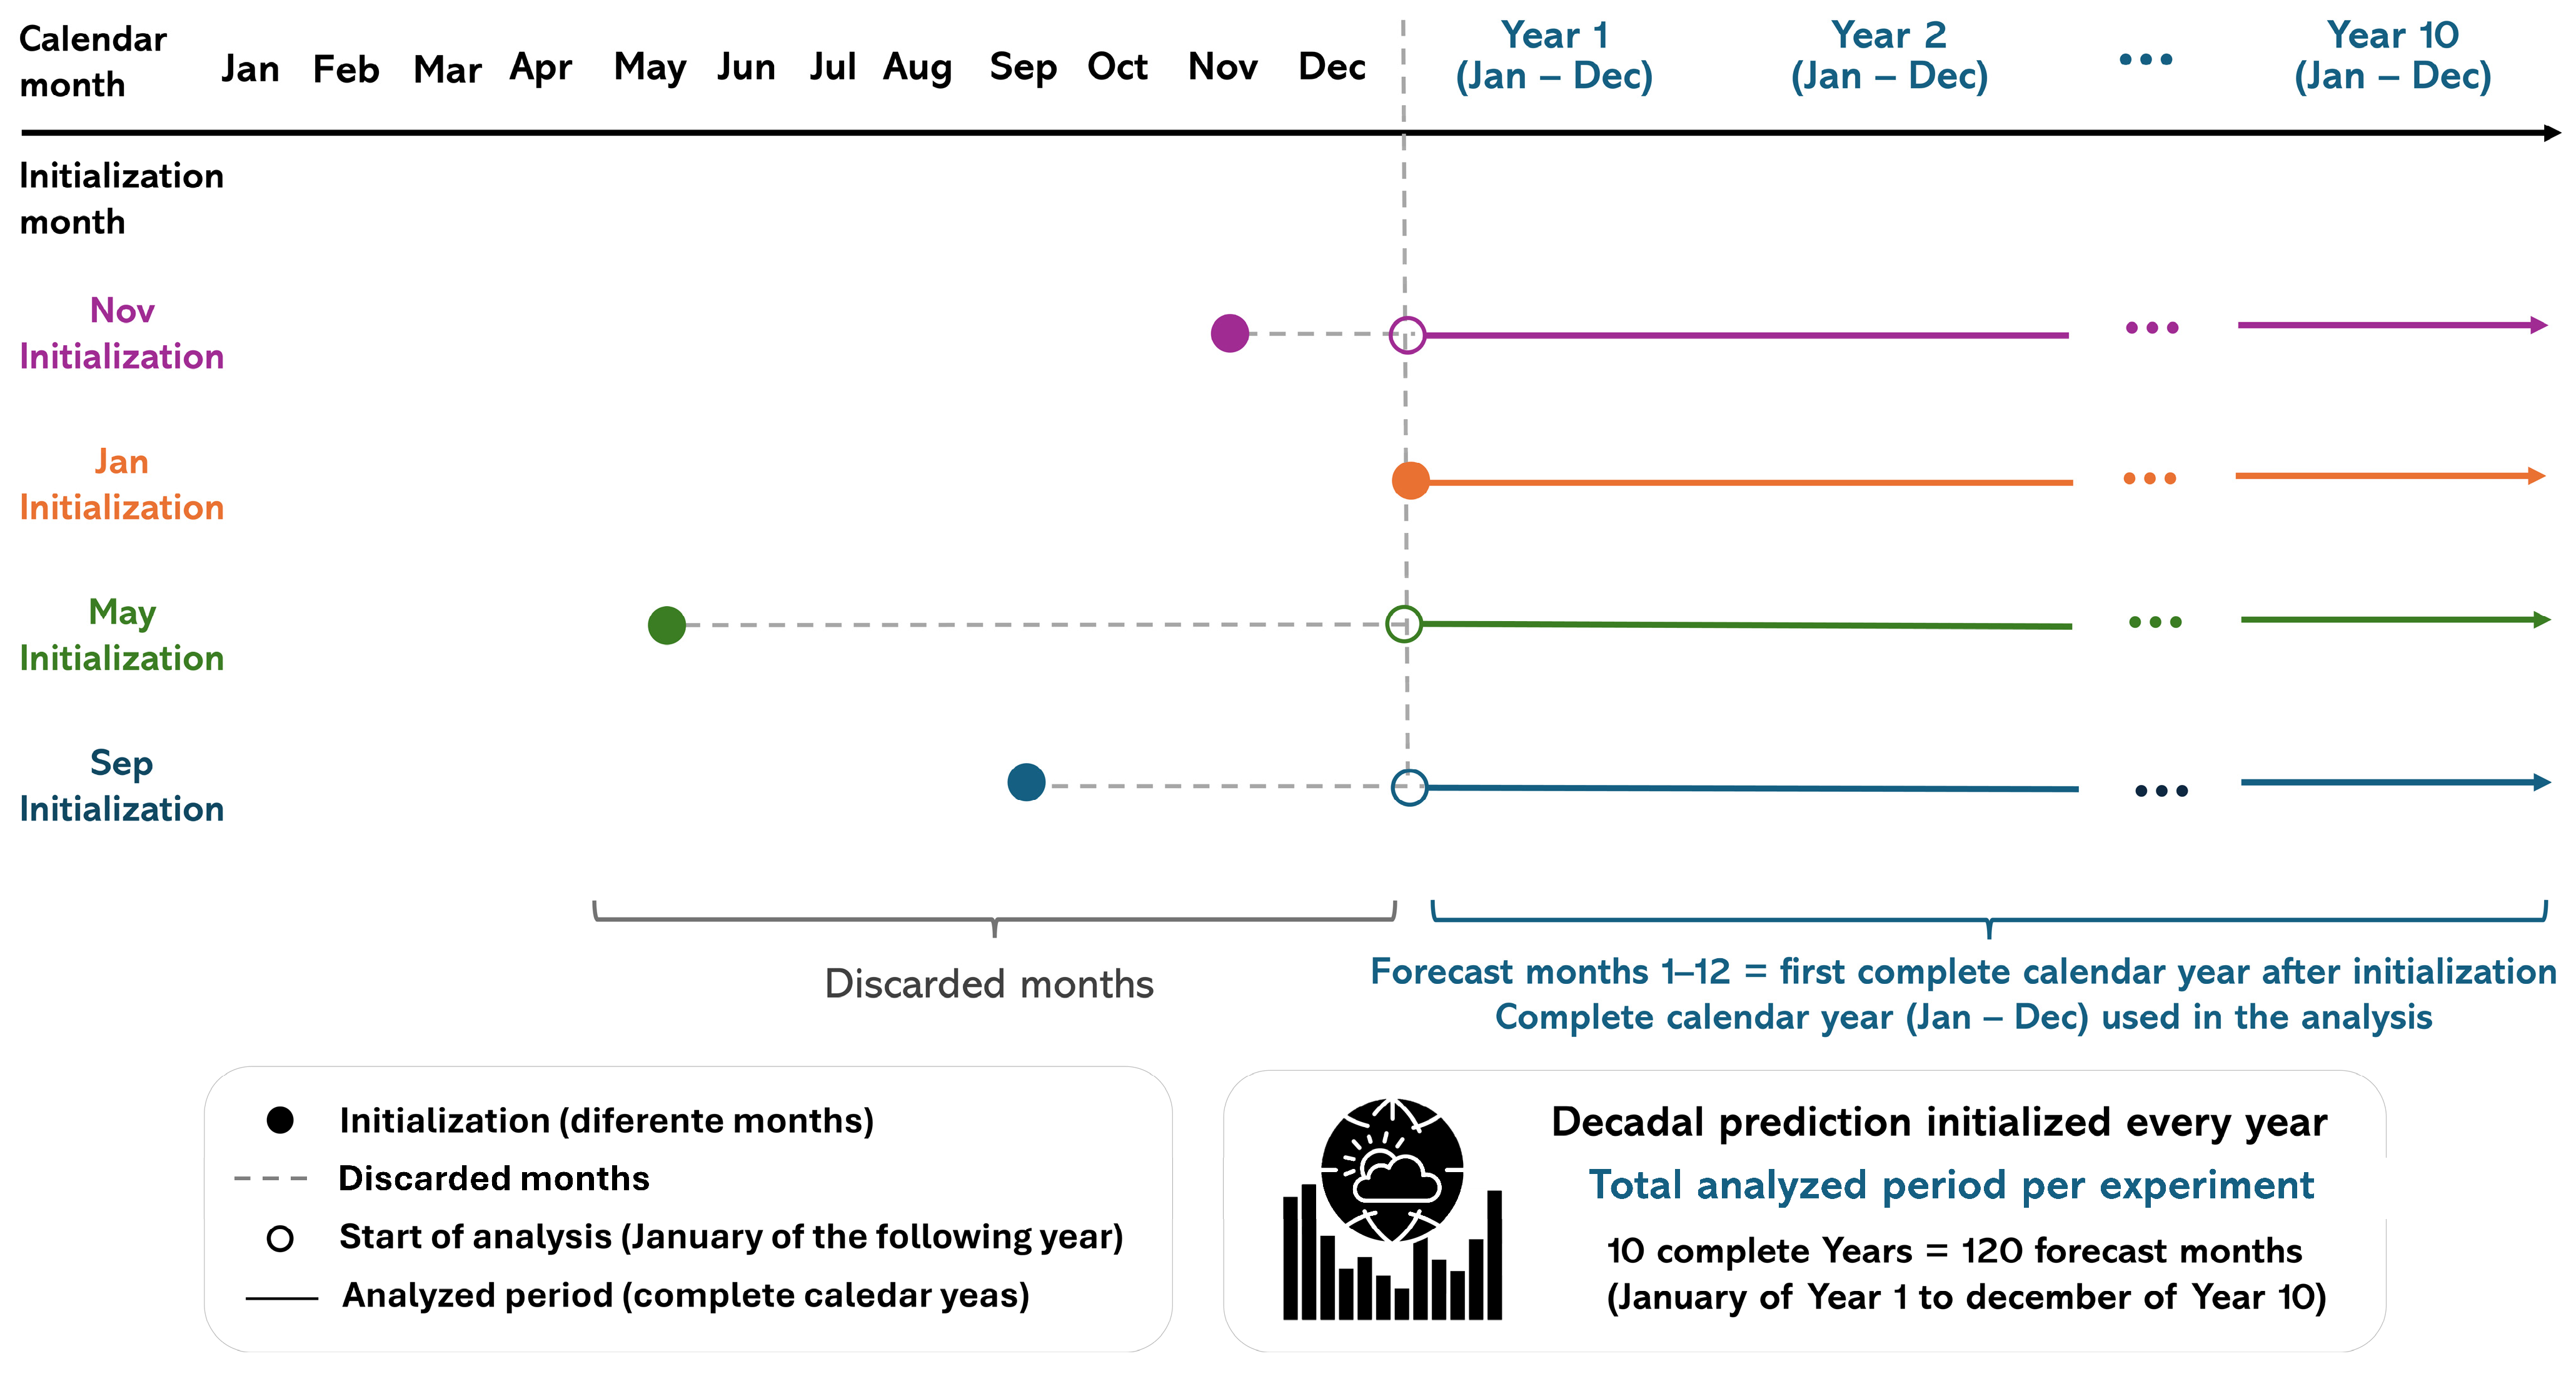
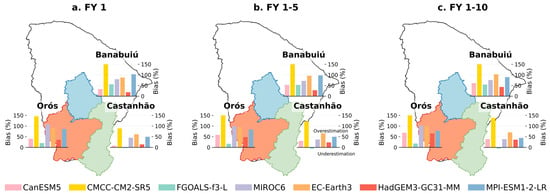
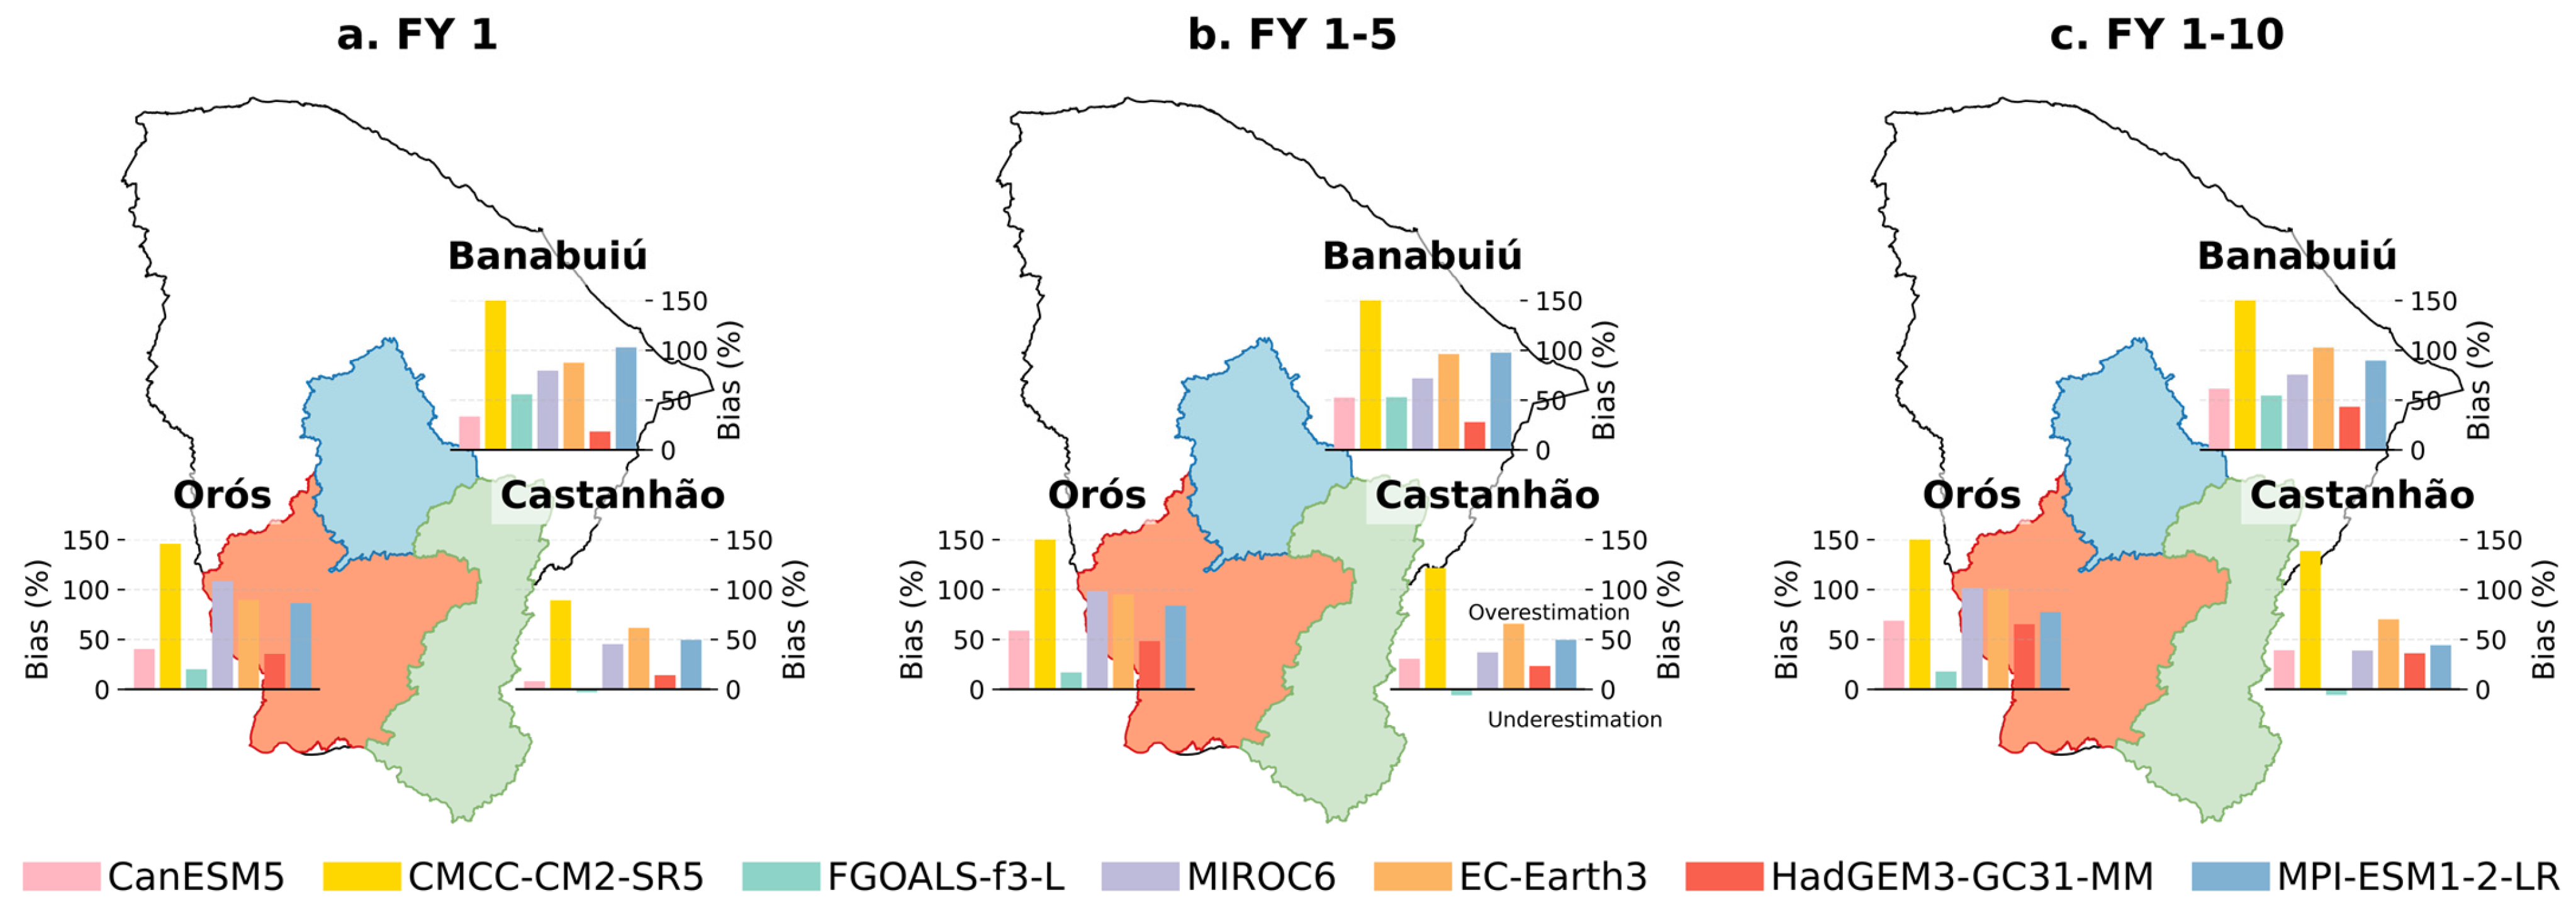
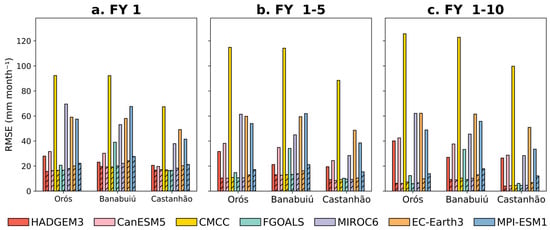
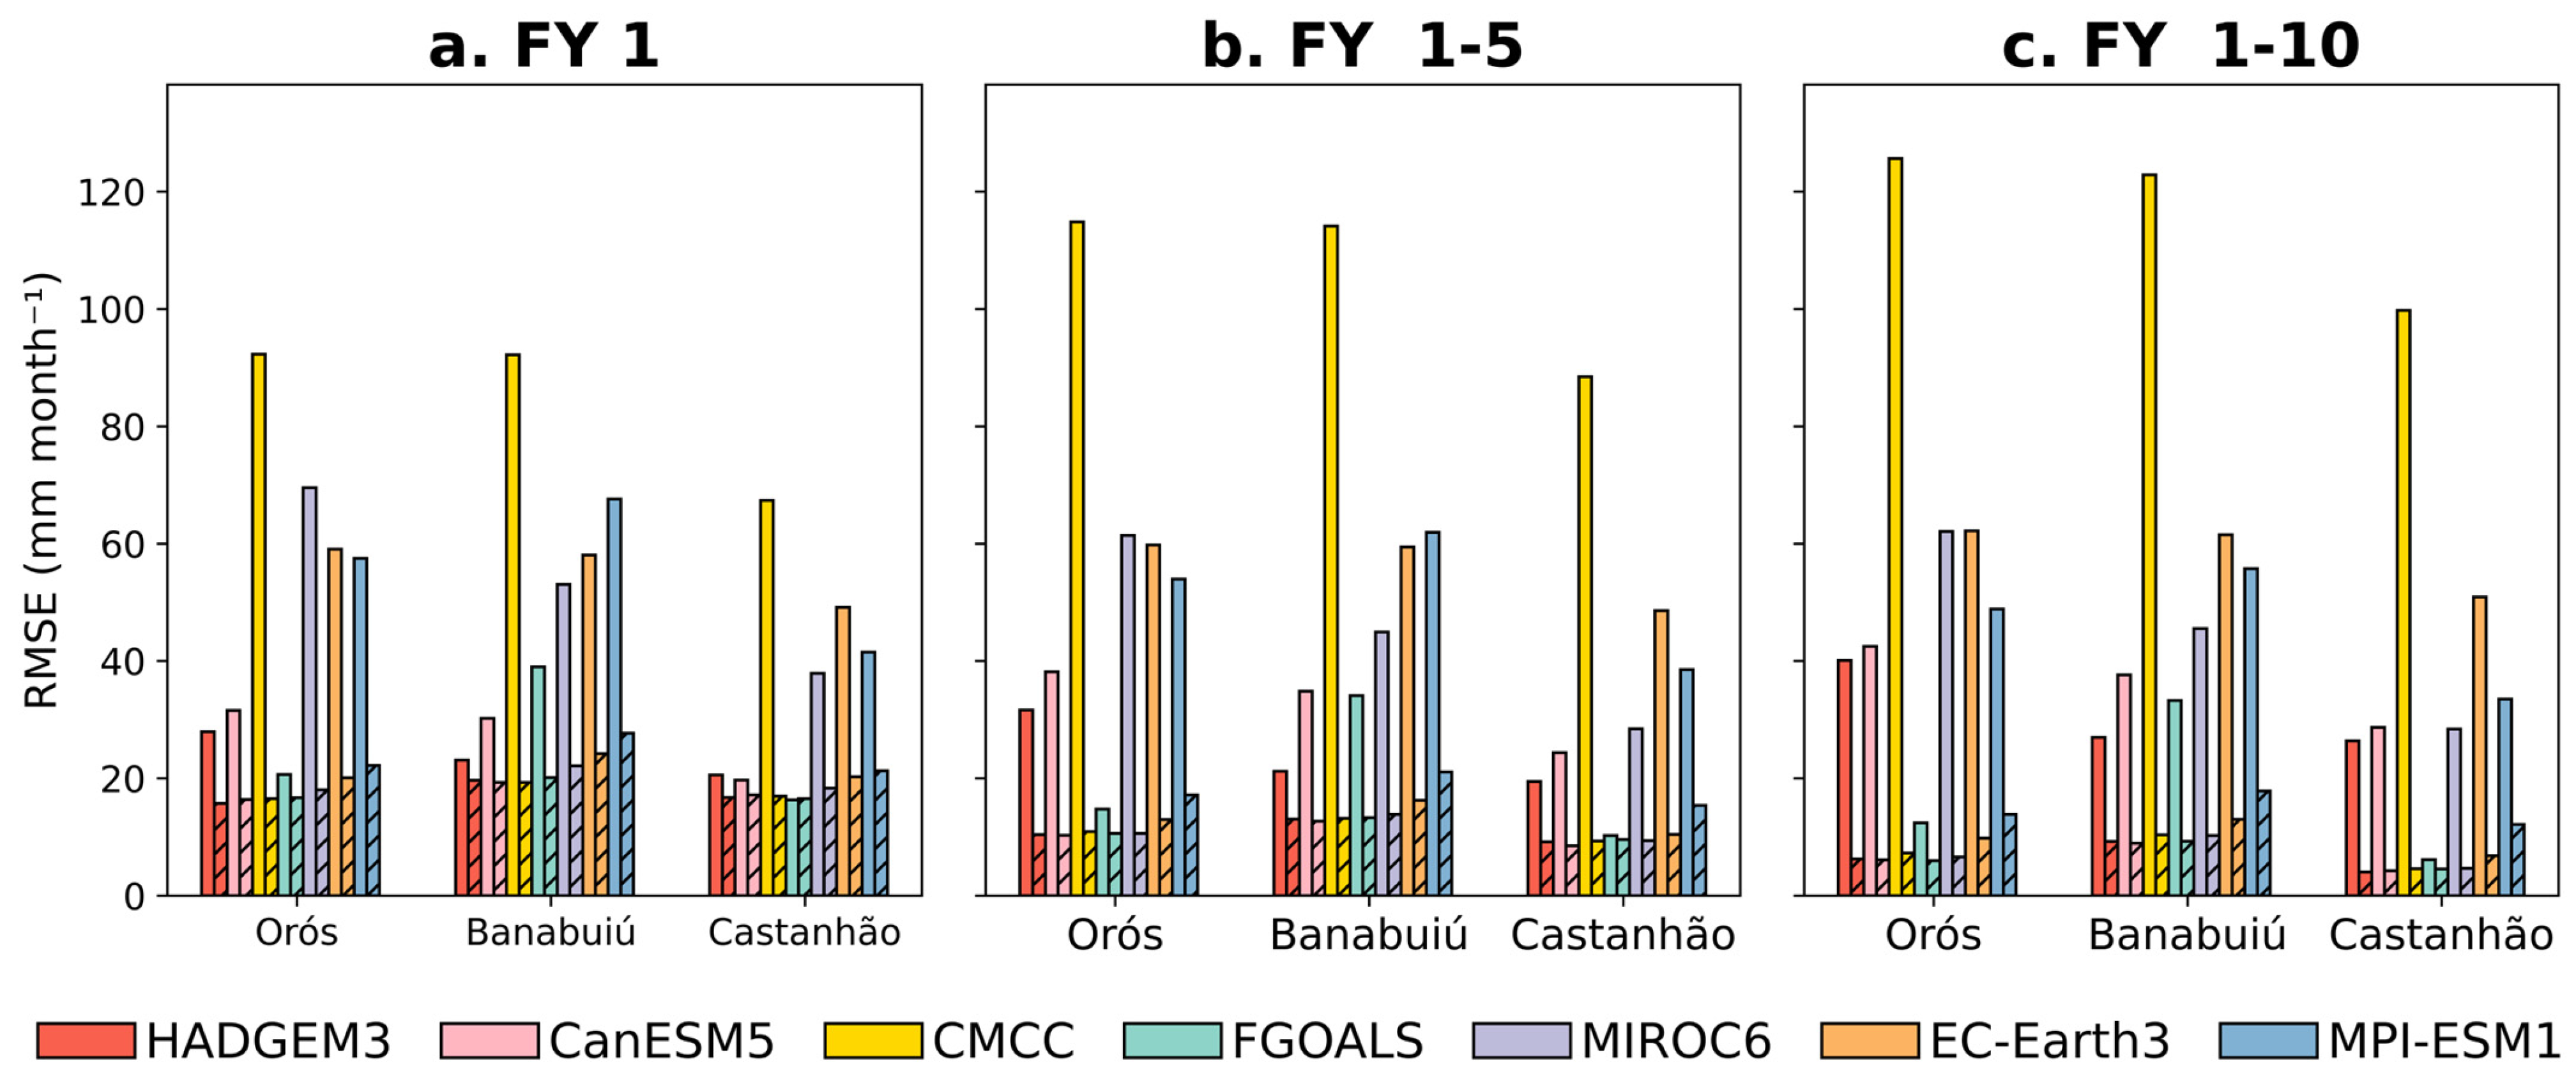
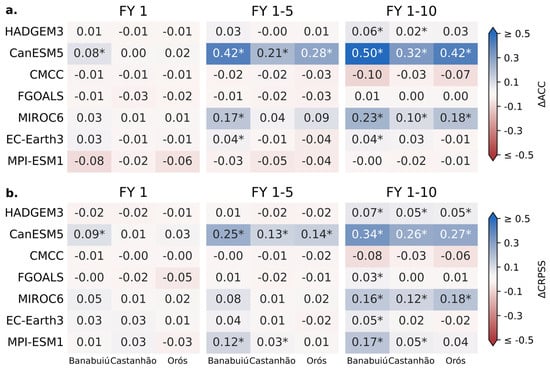
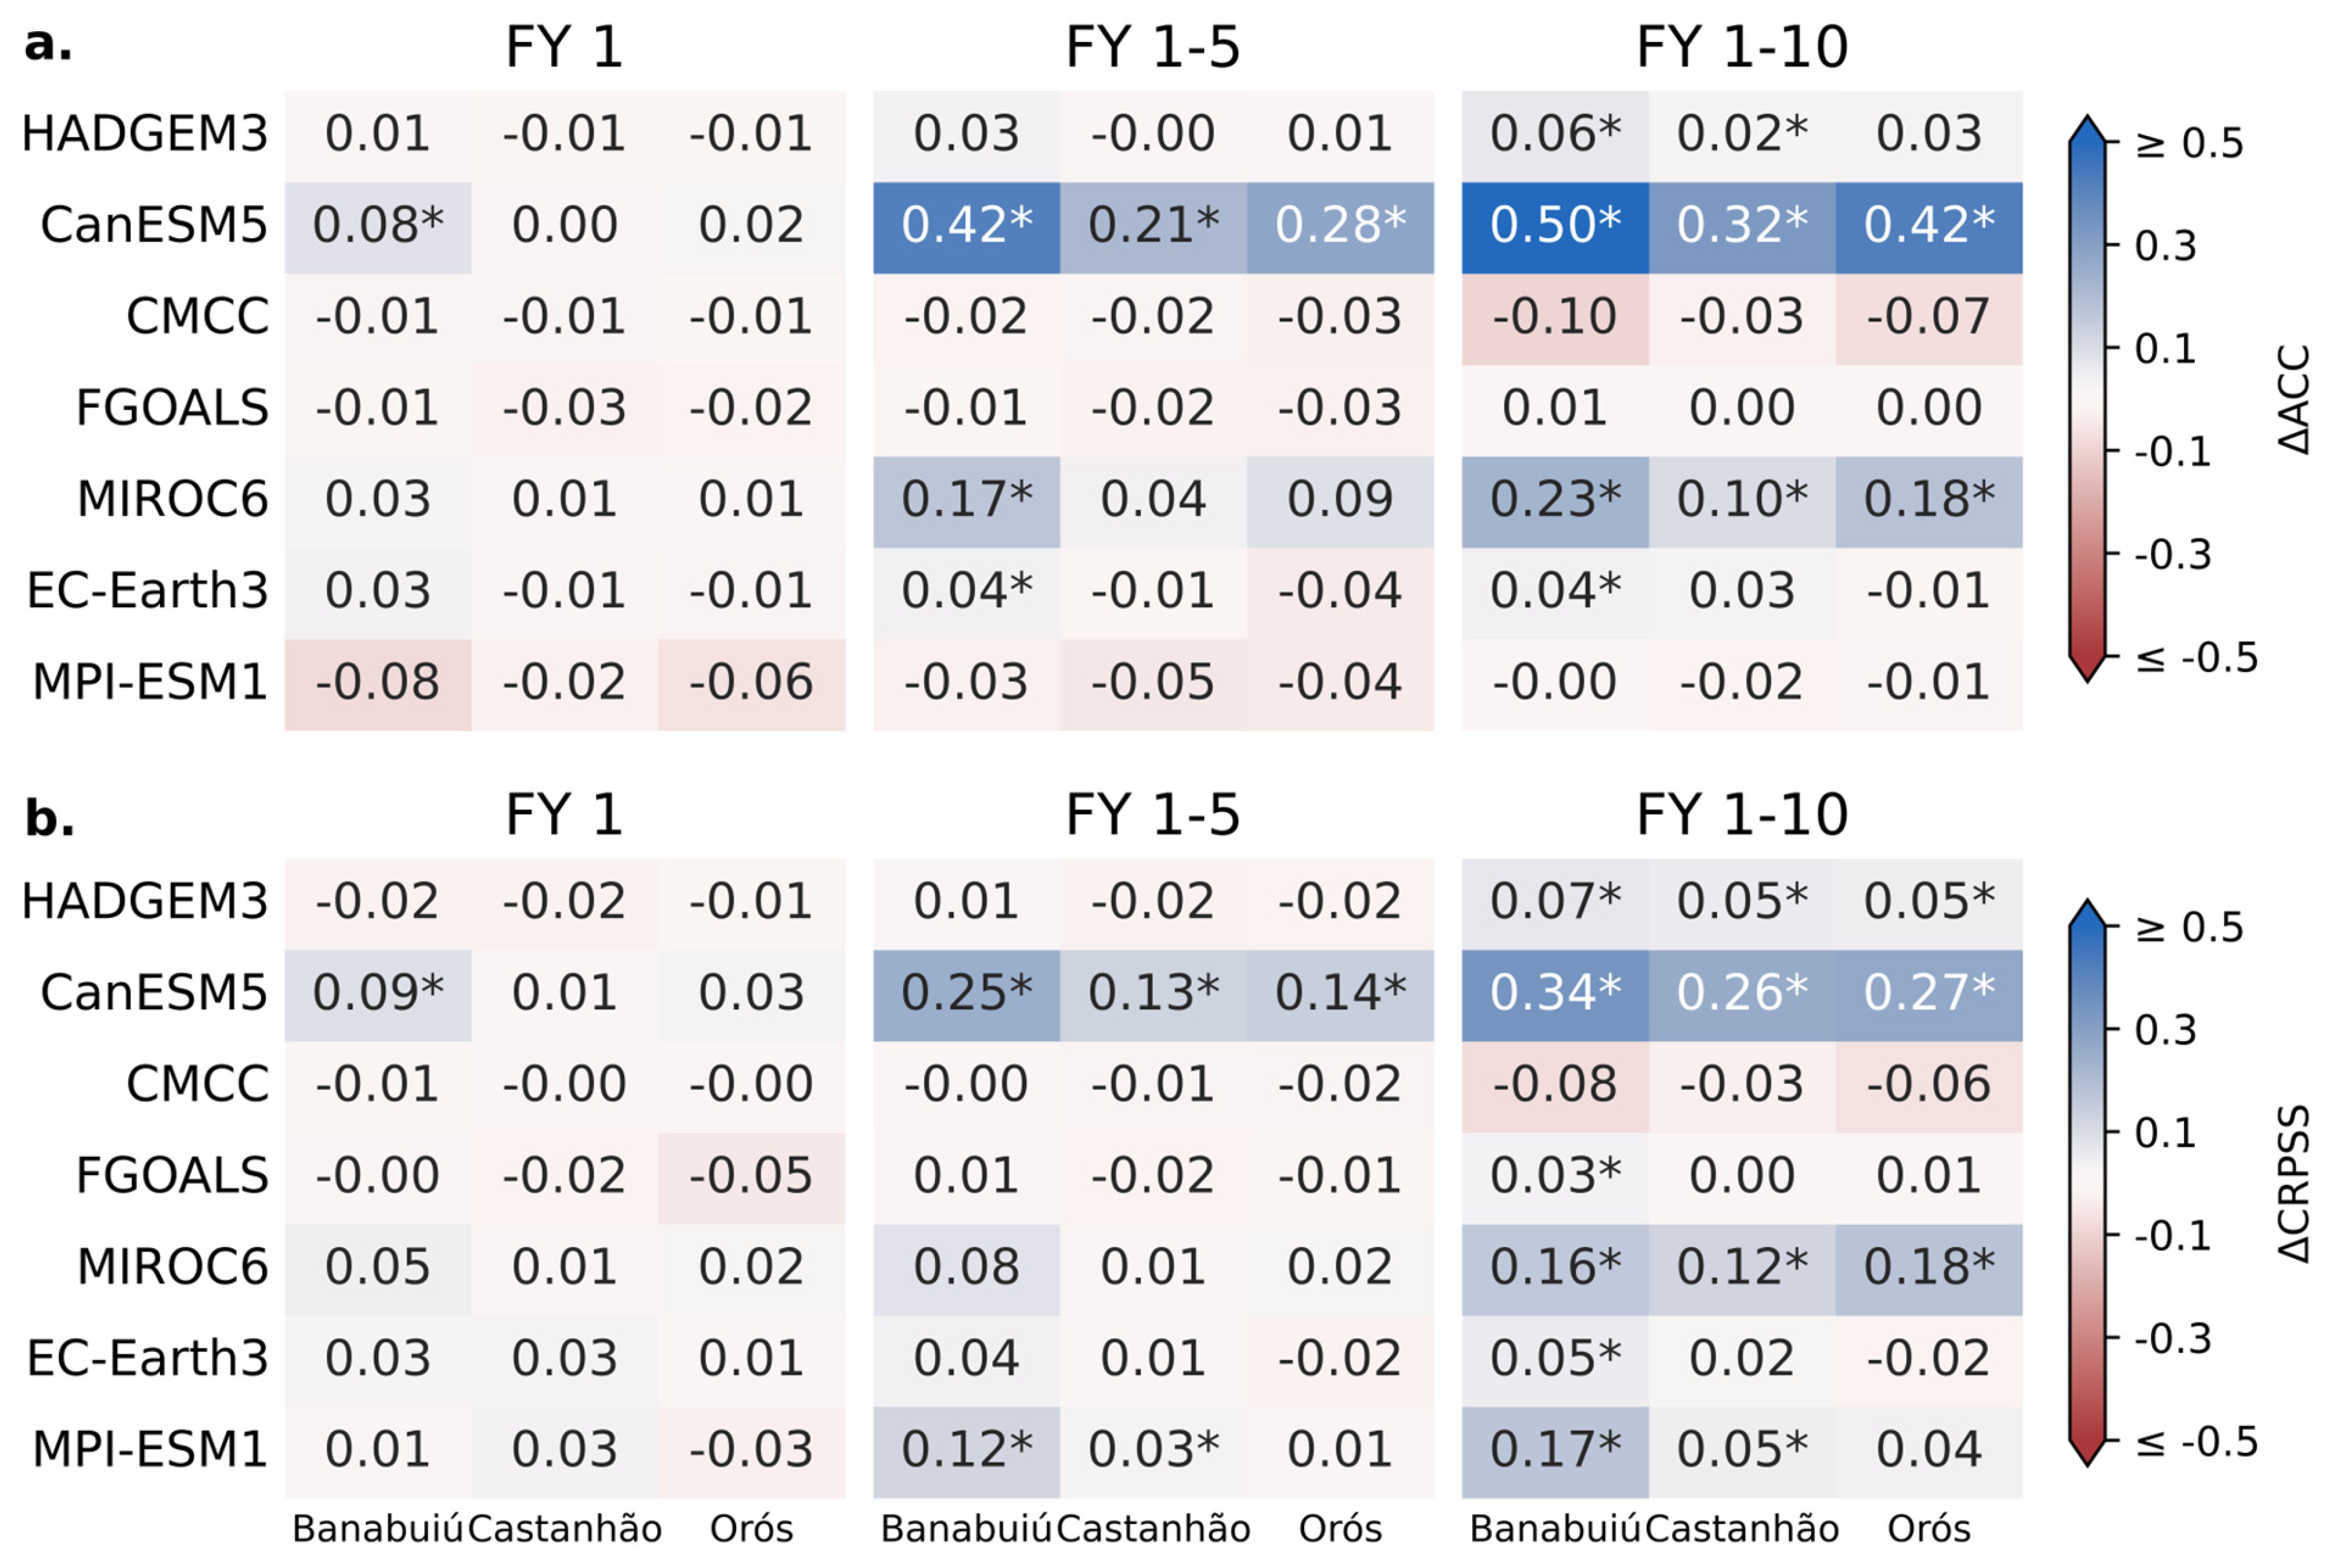
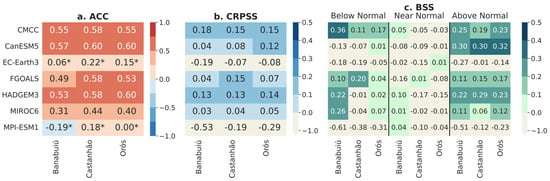
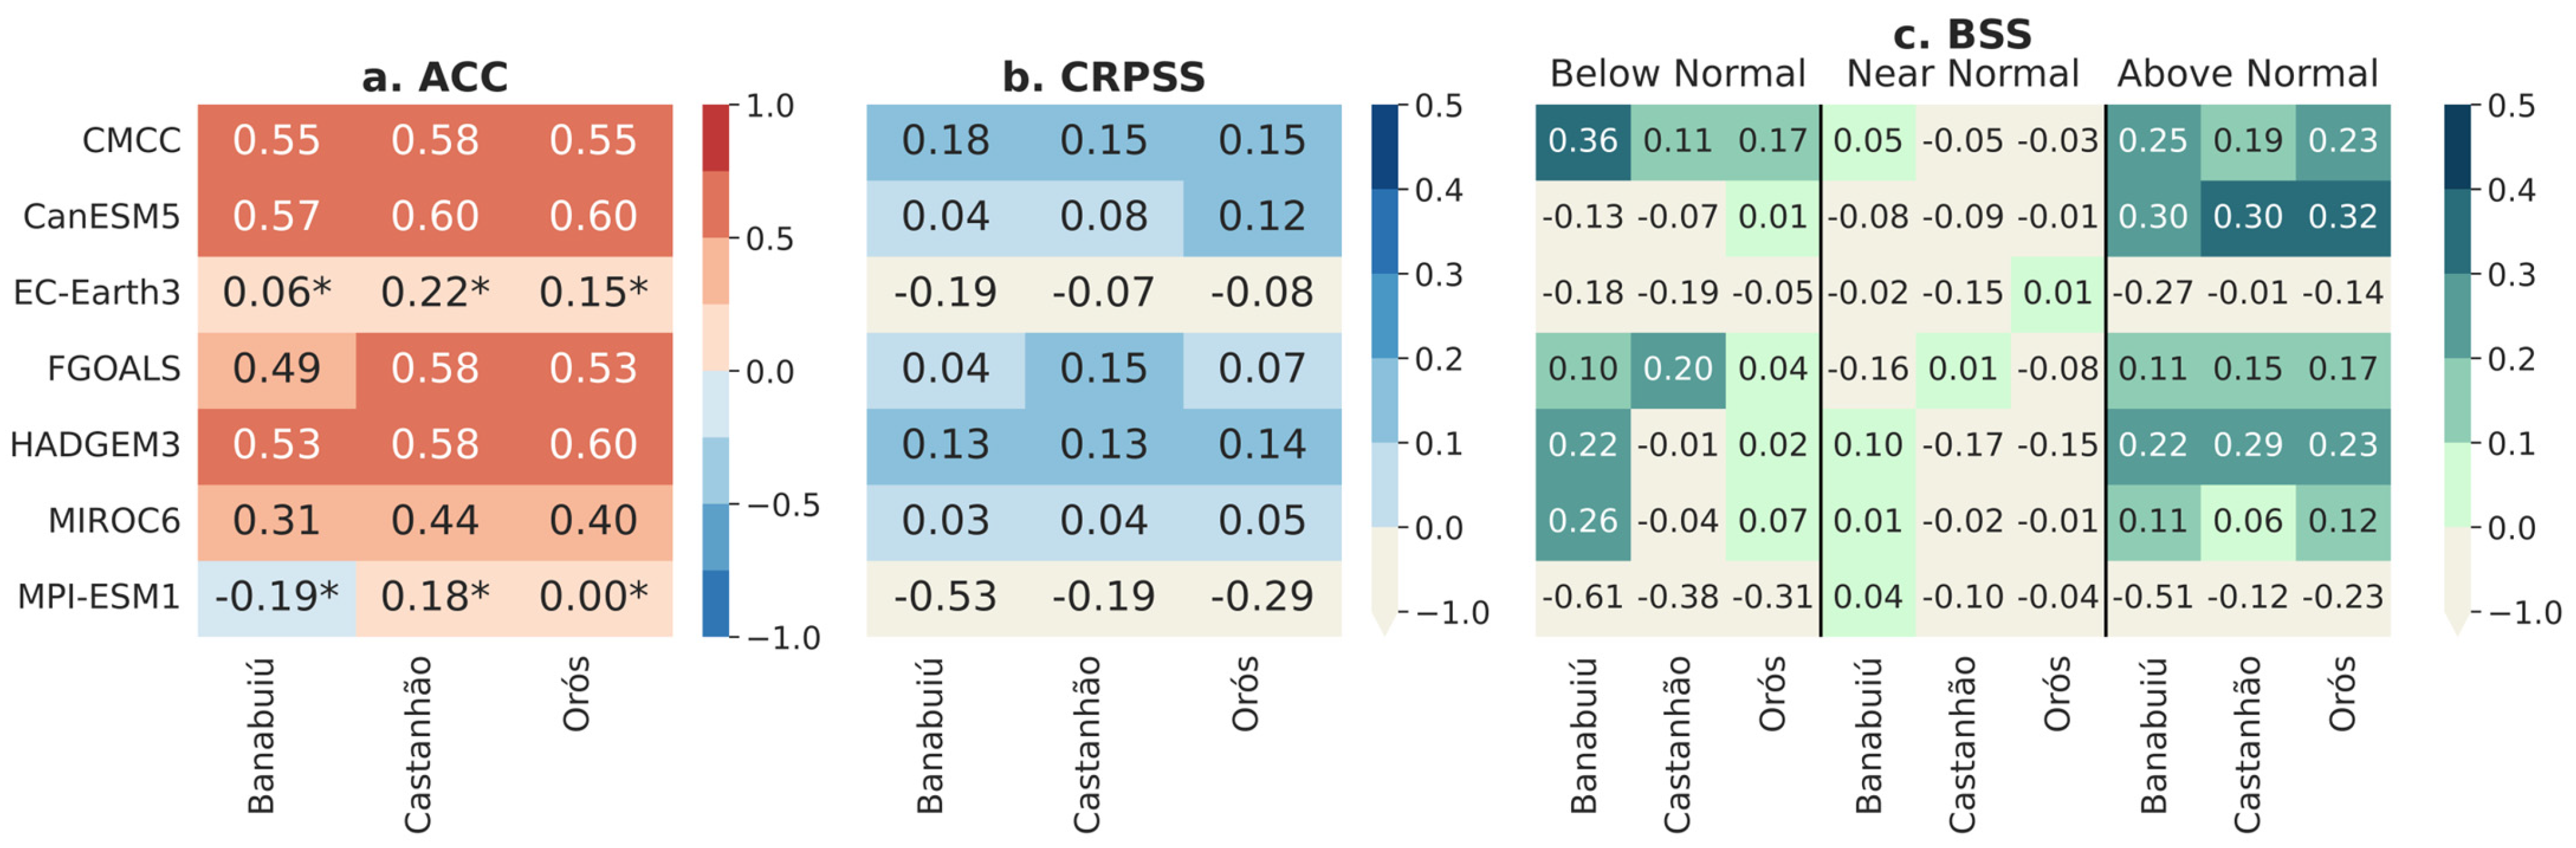
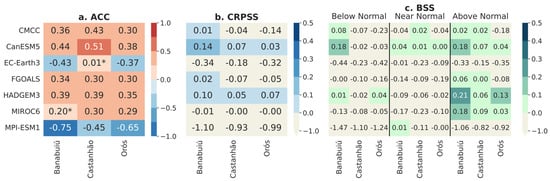
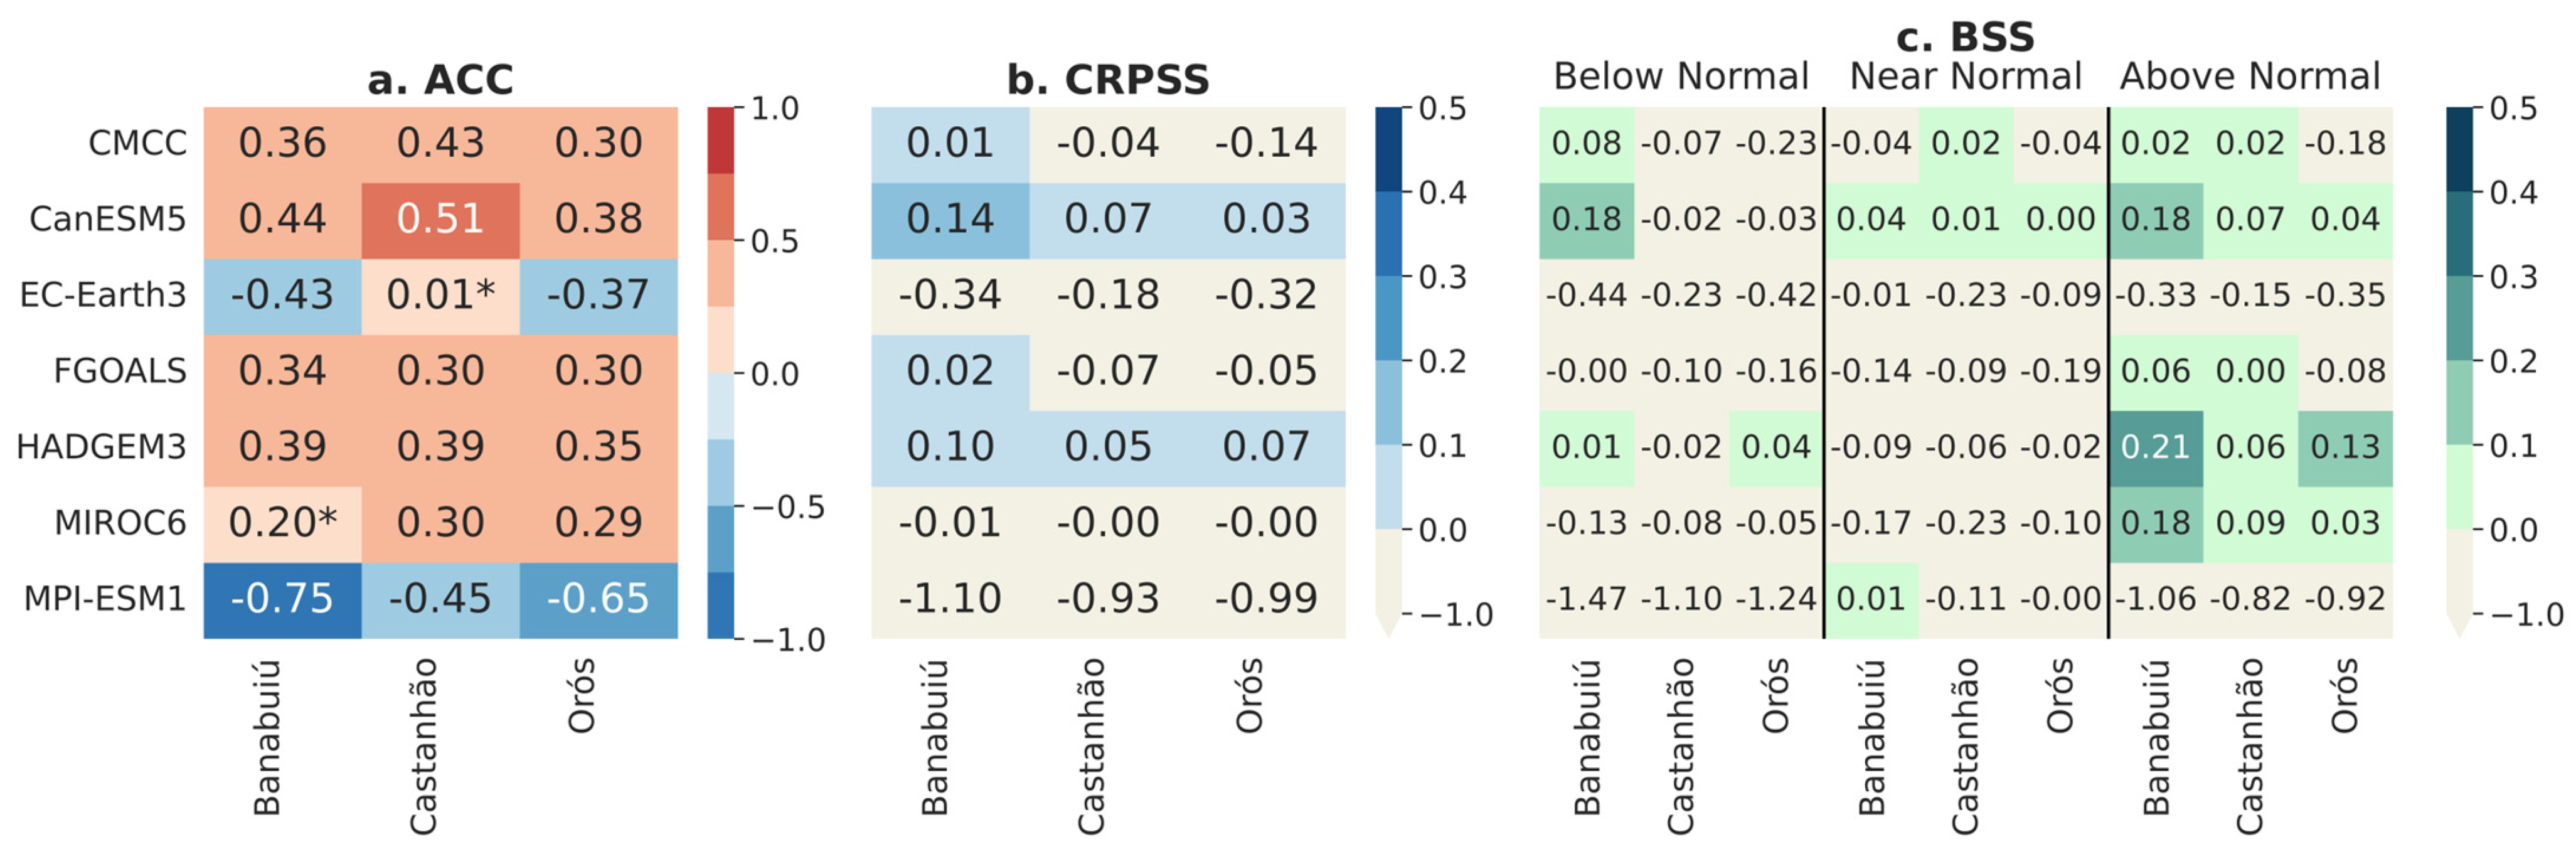
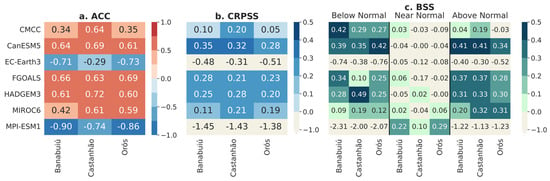
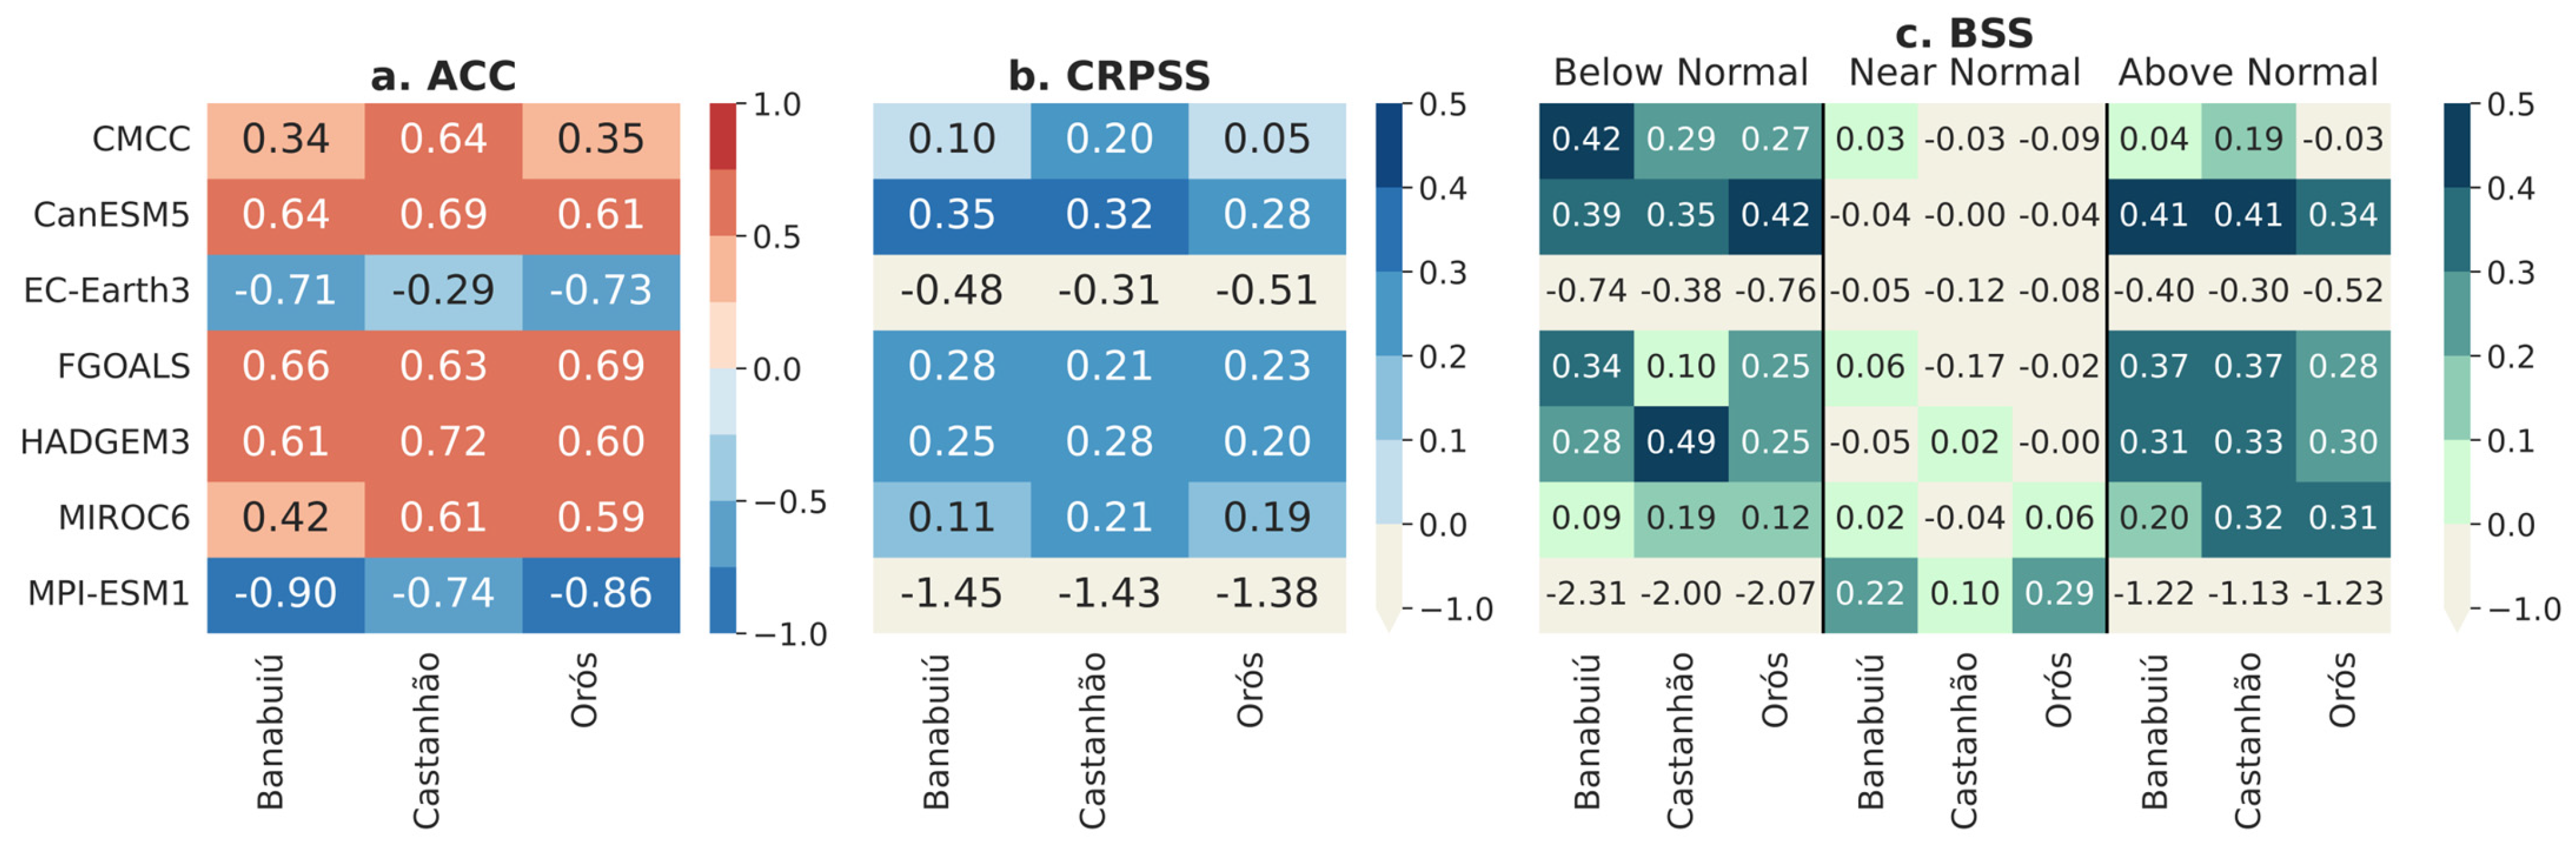
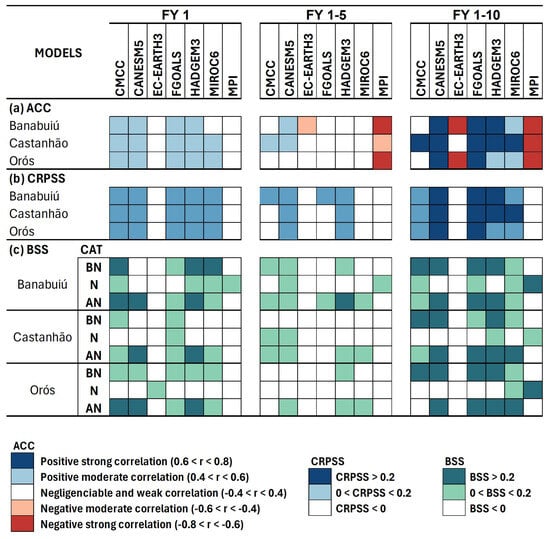
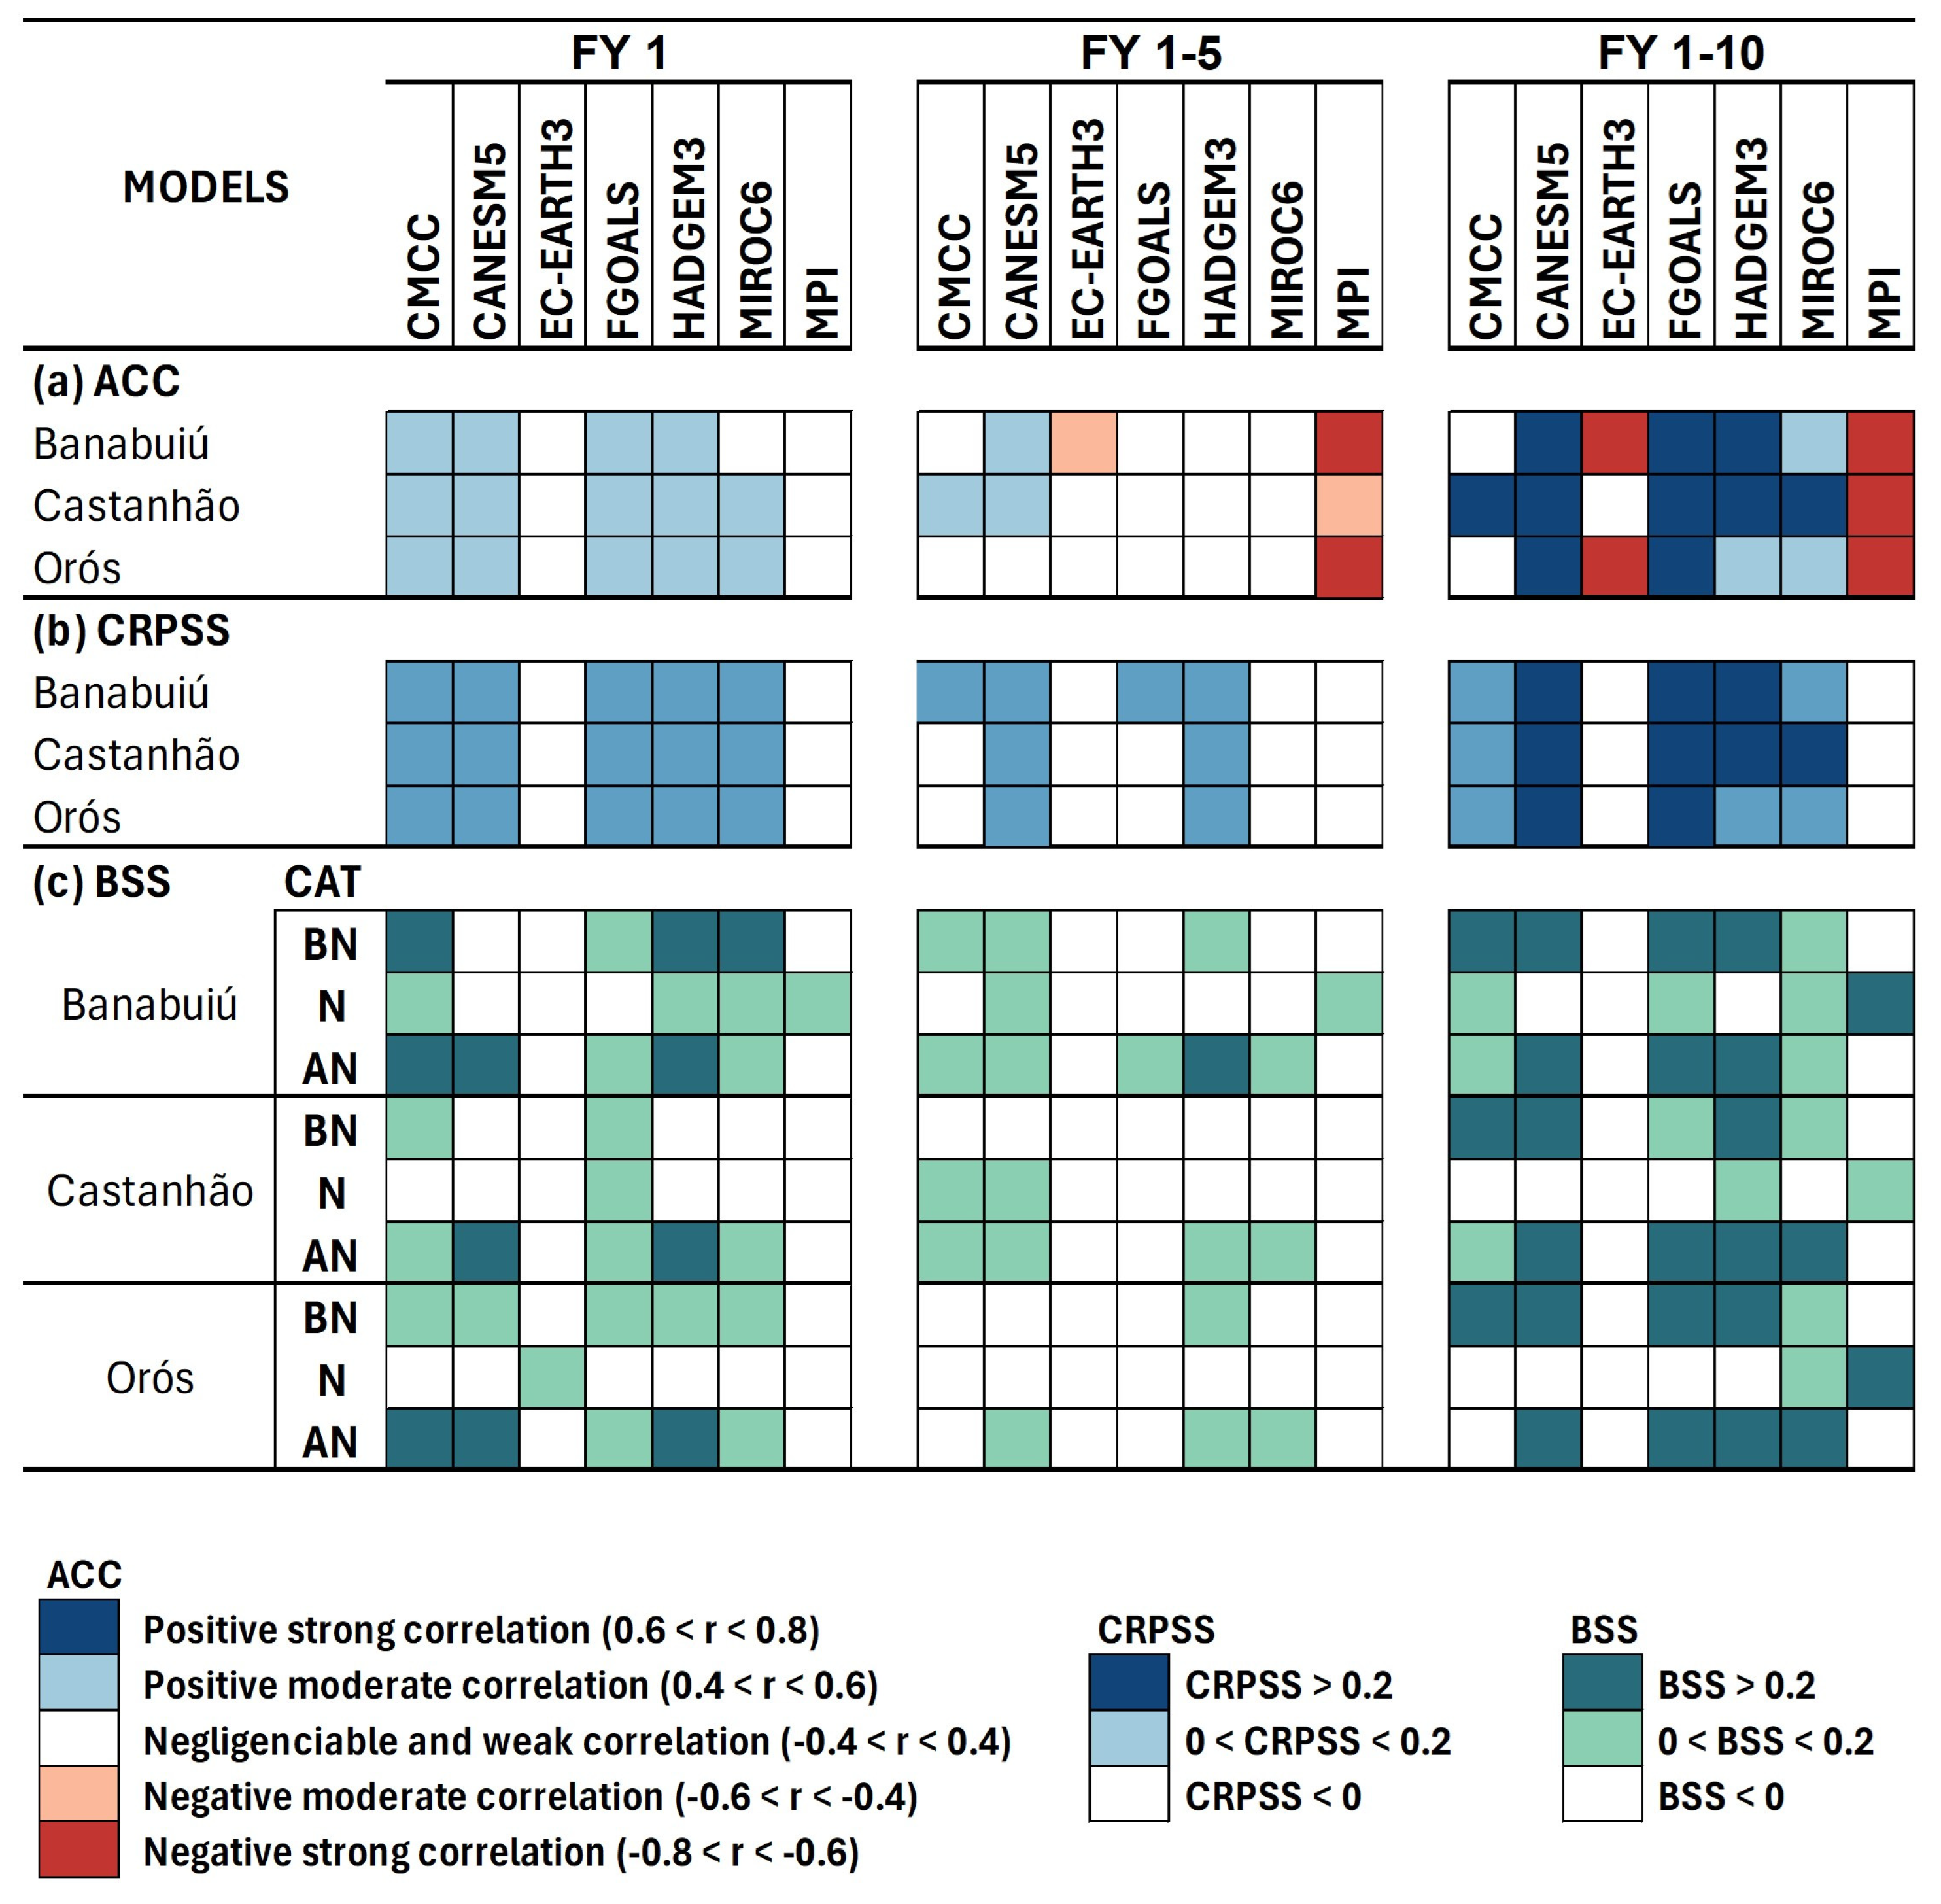

Disclaimer/Publisher’s Note: The statements, opinions and data contained in all publications are solely those of the individual author(s) and contributor(s) and not of MDPI and/or the editor(s). MDPI and/or the editor(s) disclaim responsibility for any injury to people or property resulting from any ideas, methods, instructions or products referred to in the content. |
© 2026 by the authors. Licensee MDPI, Basel, Switzerland. This article is an open access article distributed under the terms and conditions of the Creative Commons Attribution (CC BY) license.