


Abstract
This study evaluates the 20-year operational performance (2006–2025) of a preseason prediction system for Atlantic hurricane activity developed at North Carolina State University (NCSU) and compares it with forecasts from Colorado State University (CSU), Tropical Storm Risk (TSR), and NOAA. Unlike previous studies based primarily on hindcast experiments, this analysis uses real-time forecasts generated under evolving model configurations, providing a realistic assessment of operational forecast skill. Results show that NCSU April forecasts exhibit lower mean absolute error than other April-issued forecasts and achieve performance comparable to later-issued forecasts from NOAA and CSU, indicating that improved model formulation can partially offset the advantage of later initialization. To identify the sources of forecast improvement, regression and ensemble analyses are conducted. Forecast adjustments between early- and late-season forecasts are primarily explained by changes in tropical North Atlantic sea surface temperature (SST), while ENSO contributes secondarily as forecast uncertainty decreases beyond the spring predictability barrier. These results establish a clear hierarchy of predictors, with Atlantic SST providing the dominant source of preseason predictability. Multi-model ensemble experiments further show that simple averaging does not outperform the best individual models; instead, selective combinations yield the highest skill, with optimal configurations differing between named storm and hurricane predictions, demonstrating that forecast improvement depends on combining complementary information rather than increasing ensemble size. Forecast performance is also shown to be predictand-dependent, with named storm counts more sensitive to late-spring environmental evolution and hurricane counts more strongly constrained by basin-scale thermodynamic conditions. Despite these advances, all models exhibit reduced skill during extreme seasons, reflecting the intrinsic limits of seasonal predictability. Overall, these results demonstrate that preseason hurricane forecast skill is governed by the interaction of forecast timing, model capability, and a hierarchical structure of environmental predictors, providing a unified framework for interpreting differences among forecasting systems and guiding future model development.
1. Introduction
Seasonal prediction of Atlantic hurricane activity is of substantial societal and scientific importance, supporting disaster preparedness, insurance risk management, and resource allocation. Since the pioneering work of Gray [1], several institutions, including Colorado State University (CSU), Tropical Storm Risk (TSR), and the National Oceanic and Atmospheric Administration (NOAA), have developed operational forecasting systems that are widely used by government agencies, industry, and the public. Additional seasonal hurricane outlooks are produced by other universities and private groups, including the University of Arizona and forecast compilations maintained by community platforms. The present intercomparison focuses on NCSU, CSU, TSR, and NOAA because these systems provide relatively long, publicly accessible, and consistently archived operational forecasts over the 2006–2025 verification period, with comparable basin-wide seasonal quantities and issuance dates.
Beyond meteorological applications, seasonal hurricane forecasts influence a range of economic and planning decisions. Improved forecasts can reduce uncertainty in insurance risk assessment and inform mitigation strategies [2], while perceived hurricane risk has been shown to affect tourism and regional planning decisions [3]. These applications underscore the need for reliable preseason forecasts and a clear understanding of their sources of skill.
Previous studies have consistently shown that forecast skill increases as the hurricane season approaches [4,5]. Later-issued forecasts benefit from improved representation of evolving environmental conditions, particularly during late spring when key climate drivers become more predictable. However, this well-established relationship between lead time and forecast skill leaves an important question unresolved: to what extent do differences in forecast performance arise from the availability of updated environmental information versus differences in model formulation?
This distinction is critical for advancing seasonal prediction. If forecast improvements are primarily driven by later initialization, then skill is fundamentally constrained by the availability of environmental information. Alternatively, if comparable skill can be achieved at earlier lead times, this would indicate that improved modeling approaches can extract predictive information more effectively from preseason conditions.
Seasonal hurricane prediction relies on large-scale climate predictors, including sea surface temperature (SST) variability, El Niño–Southern Oscillation (ENSO), and atmospheric circulation patterns [6,7,8]. These factors influence hurricane activity through their effects on vertical wind shear, thermodynamic instability, and large-scale circulation. However, their predictive value differs at preseason lead times. ENSO is a well-established driver of Atlantic hurricane variability, but its contribution to preseason forecasts depends on the ability to predict its future state, which is limited by the spring predictability barrier. In contrast, Atlantic SST anomalies are directly observed and typically provide a more stable source of early-season information. The relevance of ENSO to April forecasts is further complicated by the spring predictability barrier, a well-documented reduction in ENSO forecast skill for predictions initialized during boreal spring [9,10,11].
A substantial body of work has established statistically significant associations between SST variability and Atlantic hurricane activity, providing a strong physical basis for seasonal prediction [12]. However, the strength and structure of these associations may evolve over time, reflecting changes in the climate system. This nonstationarity motivates the development of modeling approaches that can adapt to evolving relationships and capture nonlinear interactions among predictors.
Recent advances in machine learning (ML) provide new opportunities to improve seasonal prediction by representing complex and nonlinear dependencies. At the same time, purely data-driven approaches can suffer from limited interpretability and sensitivity to small sample sizes typical of seasonal datasets. Hybrid approaches that combine statistical methods with ML techniques offer a promising balance, allowing physically interpretable predictors to be incorporated within flexible modeling frameworks. Ensemble approaches further enhance performance by integrating multiple models and predictor configurations, including both ENSO-dependent and ENSO-independent representations [13].
In addition to individual forecast systems, there is growing interest in whether forecast skill can be improved through multi-model combinations. In principle, combining forecasts from different systems can reduce error variance and improve reliability. However, the effectiveness of such approaches depends on the independence and quality of individual forecasts, as well as the extent to which they capture complementary information. In the context of preseason hurricane prediction, it remains unclear whether improvements arise primarily from model diversity, differences in forecast timing, or their interaction.
This study evaluates the operational performance of the preseason hurricane prediction system developed at North Carolina State University (NCSU). The forecasts analyzed were issued in real time from 2006 to 2025 and therefore reflect the evolution of an operational system rather than a fixed hindcast configuration. Over this period, the NCSU system progressed from an early LASSO-based statistical framework [14] to an integrated ensemble incorporating multiple machine learning components [15,16]. Although extended-lead approaches using convolutional neural networks have been explored [17], the present study focuses on April-issued preseason forecasts.
Rather than attempting a detailed methodological comparison across forecasting systems, which is limited by incomplete information on external models, this study focuses on evaluating forecast performance in an operational context. Forecast skill is assessed using observed hurricane activity and compared with contemporaneous forecasts from CSU, TSR, and NOAA. In addition, multi-model ensemble experiments are conducted to examine whether forecast combinations improve predictive performance and to assess the relative roles of model capability, forecast timing, and environmental information.
Several physical relationships examined here, including the influence of tropical Atlantic sea surface temperature and ENSO on Atlantic hurricane activity, are well established in the literature. The contribution of this study is therefore not the first identification of these predictors. Rather, the novelty lies in evaluating a 20-year record of real-time NCSU operational forecasts, comparing those forecasts with other operational systems issued at different lead times, and diagnosing how model formulation, forecast timing, predictor reliability, and predictand dependence interact in an operational setting.
The primary objectives of this study are to (1) describe the NCSU integrated modeling system, (2) quantify its predictive skill relative to climatology, (3) evaluate its performance relative to operational forecasts, (4) assess the relative contributions of forecast timing and model capability, (5) examine the extent to which forecast combinations improve predictive performance, and (6) investigate how these relationships depend on the predictand.
2. Data and Methodology
2.1. Data Sources
Observed tropical cyclone counts are derived from the HURDAT2 dataset [18] and restricted to the official Atlantic hurricane season (1 June–30 November). Storms occurring outside this period are excluded to ensure consistency with operational forecast definitions.
Forecast data for NCSU [19], Colorado State University (CSU) [20], Tropical Storm Risk (TSR) [21,22], and the National Oceanic and Atmospheric Administration (NOAA) [23] are compiled from publicly available sources, including official forecast reports, institutional websites, and archived summaries (Appendix A). Forecast values are cross-validated across multiple sources to ensure accuracy and consistency.
To maintain comparability in forecast lead time, April forecasts are used for NCSU, CSU, and TSR, while NOAA forecasts correspond to May outlooks. In addition, CSU June forecasts are included where available to assess the impact of later-season initialization.
Environmental predictors include indices of tropical North Atlantic sea surface temperature (TNA) obtained from the NOAA Physical Sciences Laboratory (PSL) and ENSO indices derived from Niño3.4/ONI datasets as well as other environmental parameters (Table 1). Seasonal ENSO forecasts corresponding to peak hurricane season conditions (August–October) are also included to represent anticipated large-scale climate variability.
Table 1.
Summary of input predictors and forecast outputs for pre-season hurricane prediction systems considered in this study.
The table emphasizes the distinction between internal predictors and public forecast outputs. Predictor attribution in this study is performed primarily within the NCSU framework and through diagnostic regression analyses using observed and forecast environmental indices. The cross-institutional multi-model experiments combine publicly available forecast outputs rather than the environmental predictors of each external system.
This distinction is important because preseason seasonal hurricane prediction differs fundamentally from storm-resolving numerical prediction. Track and intensity models solve time-dependent atmospheric equations and produce storm position and intensity as functions of forecast lead time. In contrast, the systems evaluated here estimate aggregate basin-wide seasonal quantities such as named storm counts, hurricane counts, major hurricane counts, and accumulated cyclone energy. The present analysis therefore does not evaluate storm-by-storm tracks or intensities.
2.2. NCSU Integrated Preseason Hurricane Prediction System
The NCSU preseason hurricane prediction system employs an integrated modeling framework that combines statistical methods and machine learning (ML) models within an ensemble structure (Figure 1). The system is designed to represent both linear relationships and nonlinear interactions between large-scale climate variability and seasonal tropical cyclone activity.
Figure 1.
Illustration of the North Carolina State University integrated preseason hurricane prediction system. The arrows indicate operational procedures of the prediction system.
A key feature of the framework is the explicit distinction between predictors that are directly observed at the time of forecast issuance and those that depend on forecasts of future conditions. This distinction is important because predictor reliability varies substantially at preseason lead times and influences how different model components contribute to the final forecast.
2.2.1. Predictor Construction and Representation
The predictive framework is based on a set of large-scale climate variables that capture environmental conditions known to influence Atlantic hurricane activity. These include:
- (1)
- Sea surface temperature (SST) anomalies in the tropical Atlantic, particularly in the Main Development Region (MDR)
- (2)
- ENSO-related indices (e.g., Niño3.4, ONI)
- (3)
- Atmospheric circulation variables, including wind and pressure fields
- (4)
- Surface flux variables such as latent heat flux
These predictors are selected based on their physical relationships with hurricane activity. SST anomalies influence thermodynamic instability and moisture availability, while ENSO modulates vertical wind shear and large-scale circulation patterns.
ENSO is represented in two forms within the system:
- (1)
- Observed preseason ENSO conditions (e.g., March Niño3.4 or ONI)
- (2)
- Forecasted ENSO conditions during the peak hurricane season (August–October)
This distinction reflects differences in predictive relevance. Preseason ENSO conditions provide limited direct information about peak-season variability, while forecasted ENSO conditions are more directly related to hurricane activity but are subject to uncertainty associated with the spring predictability barrier.
To maintain interpretability and reduce dimensionality, predictors are expressed as basin-scale indices or low-dimensional representations of large-scale variability. This approach preserves physically meaningful information while limiting overfitting in a small-sample setting typical of seasonal prediction problems.
2.2.2. Ensemble Modeling Framework
The core predictive component consists of an ensemble of statistical and machine learning models applied to the predictor set. The ensemble includes:
- (1)
- LASSO regression, which provides a regularized linear baseline and performs variable selection to reduce dimensionality and mitigate multicollinearity among predictors
- (2)
- k-nearest neighbors (KNN), which provides a non-parametric, analog-based approach by identifying historical seasons with similar environmental conditions
- (3)
- Artificial neural networks (ANN), which represent nonlinear interactions among predictors through flexible functional mappings
- (4)
- Gradient boosting (XGBoost), which captures complex and threshold-dependent relationships using an ensemble of decision trees.
Each model generates independent predictions of seasonal named storm (NS) and hurricane (H) counts. The use of diverse modeling approaches allows the system to capture complementary aspects of the climate–hurricane relationship. Linear models provide stability and interpretability, while nonlinear models capture interactions and regime-dependent behavior that are not well represented by linear frameworks.
Predictions from individual models are combined using performance-based ensemble weighting. Model weights are determined using a sliding-window training framework, in which recent historical performance is used to assign greater weight to more skillful models. This adaptive weighting approach allows the ensemble to respond to evolving climate conditions and changes in predictor relevance over time.
By combining models with different sensitivities to predictor types, the ensemble balances contributions from relatively stable observed variables (e.g., Atlantic SST) and more uncertain forecast-based variables (e.g., ENSO). This design reduces sensitivity to individual model errors and improves overall forecast stability.
In this framework, each machine-learning method maps a vector of preseason climate predictors to a basin-wide seasonal predictand. LASSO provides a regularized linear mapping and performs variable selection. The k-nearest-neighbor model acts as an analog method by identifying prior seasons with similar predictor states and estimating the outcome from those analog seasons. The artificial neural network provides a nonlinear predictor-response mapping, while gradient boosting represents nonlinear and threshold-dependent relationships through an ensemble of decision trees. All components are trained within the same sliding-window framework, so that each forecast year is predicted using only information from prior years; this design approximates operational real-time use and reduces look-ahead bias.
2.2.3. Classification Component and Forecast Consistency
In addition to regression-based predictions, the system incorporates a Random Forest (RF) classification framework to characterize seasonal hurricane activity regimes. Seasons are classified into four categories—below normal, near normal, above normal, and highly active—based on accumulated cyclone energy (ACE) thresholds.
The classification model is trained using the same predictor set and sliding-window framework as the regression models. Feature selection is applied to reduce redundancy, and relatively shallow trees are used to balance interpretability and generalization.
Operationally, the classification component serves as a consistency check on regression outputs. When discrepancies arise between predicted storm counts and classified activity regimes, the ensemble configuration can be adjusted to favor model components that produce physically consistent forecasts. This is particularly useful when predictors exhibit differing levels of uncertainty, as it helps ensure that forecast output remains consistent with large-scale environmental conditions.
2.2.4. Model Training and Adaptation
Model training is conducted using a sliding-window cross-validation approach with a 30-year training period. For each forecast year, model parameters are estimated using only data from preceding years, ensuring a realistic out-of-sample evaluation and preventing the use of future information.
This framework allows the system to adapt to potential nonstationarity in climate–hurricane relationships by updating model parameters and ensemble weights over time. It also enables the system to adjust to changes in predictor reliability, favoring configurations that better capture stable sources of variability.
Over the 2006–2025 period, the NCSU system evolved from an initial LASSO-based statistical framework to the current integrated ensemble incorporating multiple machine learning components and a classification module. This evolution reflects ongoing development of the operational forecasting system and improvements in representing nonlinear relationships and interactions among predictors.
As a result, the forecasts evaluated in this study represent the performance of an evolving system rather than a single fixed model configuration. This distinction is important when interpreting verification results, as forecast performance reflects the combined effects of model formulation, adaptation, and changing climate conditions.
2.3. Verification and Evaluation Metrics
The performance of the preseason hurricane prediction system is evaluated using a set of complementary statistical metrics that quantify forecast accuracy, systematic error, and variability. These metrics are applied consistently across all forecasting systems to enable direct comparison among models issued at different lead times.
2.3.1. Forecast Accuracy, Bias, and Error Variability
Forecast accuracy is quantified using the mean absolute error (MAE), defined as
where and denote the forecast and observed values for year , and is the total number of forecast years. MAE provides a robust measure of typical forecast error and is less sensitive to extreme outliers than squared-error metrics. This property is particularly important in seasonal hurricane prediction, where occasional extreme seasons can disproportionately influence error statistics.
Systematic forecast error is evaluated using the mean bias, defined as
Bias indicates whether a model tends to systematically overpredict or underpredict seasonal activity. Positive values correspond to overestimation, while negative values indicate underestimation. Assessing bias provides insight into structural tendencies in model behavior that are not captured by accuracy metrics alone.
In addition to mean error measures, the variability of forecast errors is quantified using the standard deviation of absolute errors:
where denotes the mean absolute error across all years. This metric provides information on the consistency of forecast performance. Lower variability indicates more stable performance across years, while higher variability suggests sensitivity to specific climate conditions or model instability.
Together, MAE, bias, and error variability provide a comprehensive characterization of forecast performance, capturing accuracy, systematic tendencies, and year-to-year stability.
2.3.2. Skill Score Relative to Climatology
To assess predictive value beyond a simple baseline, forecast skill is evaluated relative to climatology using an MAE-based skill score:
A positive skill score indicates that the model improves upon the climatological baseline, while a value of zero corresponds to no improvement. Negative values indicate performance that is worse than climatology. This formulation provides a normalized and scale-independent measure of forecast performance, facilitating comparison across models with different error magnitudes.
An MAE-based skill metric is adopted rather than mean square error-based measures (e.g., mean squared skill score) because MAE is less sensitive to extreme values, which can disproportionately influence squared-error metrics in small samples. This choice is particularly appropriate for seasonal hurricane prediction, where rare but extreme seasons can strongly affect evaluation statistics.
Because climatological baselines depend on the averaging period, skill scores are evaluated using multiple reference periods, as described in Section 2.4. This approach allows assessment of the sensitivity of skill estimates to baseline selection and provides a more robust interpretation of forecast performance.
2.4. Climatology and Benchmark Forecasts
2.4.1. Climatological Baseline
Climatological baselines are used in this study solely for evaluation of operational forecast skill and are not part of the model training procedure. Unlike the sliding-window approach used in model development (Section 2.2.4), the climatological references applied here are fixed over the verification period (2006–2025).
To assess forecast skill relative to different representations of background climate conditions, three climatological baselines are considered:
- (1)
- 2006–2025 (20-year baseline):Defined as the mean observed hurricane activity over the verification period. This baseline represents contemporary climate conditions and provides the most stringent reference for evaluating forecast skill.
- (2)
- 1996–2025 (30-year baseline):Consistent with the World Meteorological Organization (WMO) standard for climate normals, this baseline captures recent multidecadal variability and provides a widely used reference for modern climate conditions.
- (3)
- 1951–2000 (50-year baseline):A longer-term historical baseline commonly used in previous seasonal forecast studies. This period includes relatively lower levels of hurricane activity compared to recent decades and is therefore useful for comparison with earlier literature.
These climatologies are applied uniformly across all forecast systems and years in the verification dataset. As a result, differences in skill scores reflect differences in forecast performance rather than variations in baseline construction.
Because Atlantic hurricane activity exhibits substantial multidecadal variability, the choice of climatological reference influences the magnitude of estimated skill. Shorter, more recent baselines provide a more demanding benchmark, while longer-term baselines may yield higher apparent skill due to lower historical activity levels. Evaluating skill across multiple baselines therefore provides a more complete and robust assessment of forecast performance.
2.4.2. Benchmark Forecasts
Preseason forecasts from CSU, TSR, and NOAA are used as operational benchmarks. These systems differ not only in model formulation but also in issuance time, with April forecasts from NCSU, CSU, and TSR, May forecasts from NOAA, and June updates from CSU.
These differences provide a natural framework for examining the relative contributions of forecast timing, model capability, and the availability of environmental information. Later-issued forecasts incorporate additional observations of evolving climate conditions, particularly during late spring, while earlier forecasts rely more heavily on preseason information.
Although the internal methodologies of these systems are not fully documented in a consistent and reproducible manner, their forecast outputs—seasonal named storm (NS) and hurricane (H) counts—are directly comparable. These quantities represent standardized metrics used by operational forecast centers and are the primary variables of interest for end users.
An important consideration is that all forecasting systems evaluated in this study represent evolving operational frameworks rather than fixed models. Over the 2006–2025 period, each group has refined its predictor sets, modeling approaches, and forecast procedures. Consequently, the comparison presented here reflects the combined effects of model formulation, forecast timing, and ongoing system development.
2.5. Statistical Testing and Temporal Analysis
2.5.1. Significance Testing
Statistical significance of differences in forecast accuracy is assessed using paired t-tests applied to the differences in absolute errors. For each pair of models, the null hypothesis assumes that the mean difference in absolute error is zero, indicating no difference in predictive performance.
The paired structure of the test accounts for shared year-to-year variability and provides a more robust comparison than tests based on aggregated statistics alone. This approach is particularly appropriate for evaluating differences among forecasts issued at different lead times, where interannual variability can otherwise obscure systematic performance differences.
Although more general forecast comparison methods, such as the Diebold–Mariano test, could be applied, the paired t-test offers a transparent and interpretable framework that is well suited to the relatively small sample size and the focus on mean absolute error differences in this study.
Given the limited number of forecast years (2006–2025), statistical power is inherently constrained. Accordingly, statistical significance is interpreted in conjunction with the magnitude and consistency of performance differences, rather than as a sole criterion for model comparison.
2.5.2. Temporal Stability Analysis
To assess the stability of forecast performance over time, evaluation metrics are computed separately for two sub-periods:
- (1)
- 2006–2015
- (2)
- 2016–2025
This partition allows examination of whether model performance changes under evolving climate conditions and provides insight into potential nonstationarity in predictor–hurricane relationships.
Differences between these subperiods may reflect changes in large-scale climate variability, shifts in the relative importance of predictors, or differences in model adaptability. Because the forecasts analyzed in this study are generated by evolving operational systems rather than fixed model configurations, temporal comparisons reflect both changes in the climate system and ongoing model development.
2.5.3. Uncertainty Quantification
Uncertainty in evaluation metrics is quantified using bootstrap resampling. In this approach, forecast years are resampled with replacement to generate empirical distributions of metrics such as mean absolute error and skill score.
Confidence intervals derived from these distributions provide an estimate of the robustness of performance differences and help distinguish systematic effects from sampling variability. This resampling-based approach is particularly useful in small-sample settings, where parametric assumptions may be difficult to justify.
2.6. Evolution of the NCSU Forecast System
The forecasts evaluated in this study consist of real-time operational predictions issued by the NCSU team from 2006 to 2025. As a result, the dataset represents an operational forecast record, rather than a retrospective hindcast generated using a single fixed model configuration.
Over this period, the NCSU system underwent substantial development, evolving from an early LASSO-based statistical framework to a more comprehensive integrated ensemble incorporating machine learning components, performance-based weighting, and classification-based consistency checks (Table 2). These developments improved the system’s ability to represent nonlinear relationships and to balance predictors with differing levels of reliability.
Table 2.
Evolution of the North Carolina State University preseason hurricane prediction system.
Because the forecasts were generated using an evolving system, the verification results presented here reflect the combined effects of model formulation, forecast timing, and ongoing system development. Similar evolution is likely present in other operational forecasting systems over the same period.
Accordingly, differences in forecast performance and temporal changes in skill should be interpreted as reflecting both methodological advances and variations in environmental predictability, rather than the behavior of a single static model.
2.7. Multi-Model Ensemble Experiments
To further assess the roles of model formulation, forecast timing, and information content, a series of multi-model ensemble experiments are conducted using publicly available preseason forecasts.
2.7.1. Ensemble Construction
Equal-weight averaging is used here as a transparent baseline for the cross-institutional experiments. This choice avoids estimating additional ensemble parameters from the short 20-year operational record and is consistent with prior work showing that equal weighting can be competitive with more complex weighting schemes when samples are limited [24]. The equal-weight multi-model ensembles should therefore be interpreted as diagnostic experiments rather than optimized operational forecasts.
where represents an individual forecast and is the number of contributing forecasts.
The following ensemble configurations are examined:
- Full preseason ensemble (four-model equal-weight ensemble):NCSU April + CSU April + TSR April + NOAA May
- Selective ensembles:
- (1)
- NCSU April + NOAA May
- (2)
- NCSU April + CSU June
- (3)
- NCSU April + NOAA May + CSU June
- (4)
- CSU June + NOAA May
These configurations are designed to combine forecasts across both model architectures and initialization times. The selective configurations include both pairwise combinations and one three-member combination. No performance-based weights are estimated for these external forecast combinations. This differs from the internal NCSU ensemble, in which component models are combined using performance-based weighting within the sliding-window training framework.
2.7.2. Evaluation Methodology
All ensemble forecasts are evaluated using the same metrics as individual forecasts, including mean absolute error (MAE), bias, and skill relative to climatology. Performance is assessed separately for named storm (NS) and hurricane (H) counts.
Comparisons are conducted to evaluate:
- (1)
- whether ensemble averaging reduces forecast error relative to individual models
- (2)
- whether selective combinations provide additional improvement
- (3)
- whether performance differs between NS and H predictions
2.7.3. Interpretation Framework
The ensemble experiments are interpreted in terms of three factors:
- (1)
- Model capability: the ability of a forecasting system to extract predictive information from preseason conditions
- (2)
- Forecast timing: the availability of updated environmental information at later initialization times
- (3)
- Information complementarity: the extent to which different forecasts capture distinct aspects of the climate signal
This framework provides a basis for interpreting differences in ensemble performance without assuming that all forecasts contribute equally or independently.
3. Results
Forecast performance is evaluated in terms of both absolute accuracy and skill relative to climatology. While accuracy reflects the closeness of forecasts to observed values, skill measures improvement beyond a baseline and therefore provides a more meaningful indicator of predictive value. In the following sections, both perspectives are considered when comparing forecast systems.
3.1. Overview of Forecast Performance
The performance of the NCSU preseason hurricane prediction system is evaluated over the 2006–2025 period using observed Atlantic hurricane activity and compared with operational forecasts from CSU, TSR, and NOAA. Results are presented for both named storm (NS) and hurricane (H) counts.
Figure 2 shows the time series of preseason forecasts and observed hurricane activity. The NCSU forecasts capture much of the interannual variability in both NS and H counts, indicating that the system responds to large-scale climate fluctuations that influence seasonal activity. However, the amplitude of variability is generally underestimated, particularly during highly active seasons.
Figure 2.
Preseason forecasts versus observed Atlantic named storm and hurricane counts (2006–2025). (a) Named storm counts; (b) hurricane counts.
This behavior is consistent across all forecasting systems. A notable example is the 2020 hurricane season, during which all models substantially underestimated the observed number of named storms. Such cases highlight the difficulty of predicting rare, high-activity seasons using preseason information alone. A more detailed analysis of model performance during extreme seasons is presented in Section 3.7.
Compared with NCSU, CSU and TSR forecasts exhibit larger deviations from observations in several years, particularly for NS counts. NOAA forecasts show relatively consistent performance for hurricane counts, although differences among models are less pronounced for this metric.
Overall, the results indicate that preseason forecasts capture broad interannual variability but exhibit reduced accuracy during extreme seasons, reflecting inherent limits of seasonal predictability.
3.2. Error Characteristics and Model Bias
Figure 3 summarizes the mean absolute error (MAE) of each forecasting system for both named storm (NS) and hurricane (H) counts over the 2006–2025 period. Among April-issued forecasts, the NCSU system exhibits the lowest MAE for NS, with an average error of approximately 3.3 storms, compared to about 4.2 for CSU and 3.8 for TSR. This indicates improved accuracy relative to other early-season forecasts.
Figure 3.
Mean absolute error by forecasting group. (a) Named storm counts; (b) hurricane counts.
For hurricane counts, the NCSU system achieves an MAE of approximately 2.0, comparable to NOAA forecasts and lower than CSU and TSR. However, the smaller absolute errors for H should be interpreted in the context of reduced variability in hurricane counts relative to named storms. Because hurricane counts are lower and less variable, MAE values are inherently smaller, even in the absence of substantially higher predictive skill. This interpretation is supported by the skill analysis presented in Section 3.3.
Bias and error variability are summarized in Table 3. All forecasting systems exhibit a tendency toward underprediction of seasonal activity, particularly during active years. The magnitude of bias is generally modest relative to interannual variability. Among the models considered, only the NCSU bias for NS is statistically significant (p ≈ 0.03), although its practical impact remains limited given the overall spread of forecast errors.
Table 3.
Bias and error variability analysis for named storm and hurricane forecasts.
Differences among forecasting systems are more clearly reflected in the variability of forecast errors. The NCSU system exhibits lower standard deviation of absolute errors compared to CSU, TSR, and NOAA, indicating more consistent performance across years. This reduced variability is consistent with features of the modeling framework, including regularization in the LASSO component and the stabilizing effect of ensemble averaging across multiple models.
To further examine systematic behavior, forecast bias is stratified by activity regime (Figure 4). All systems exhibit larger negative biases during highly active seasons, reflecting a common tendency to underestimate extreme outcomes. Differences among models are more apparent in near-normal and below-normal years, where CSU and TSR forecasts show compensating overprediction, while the NCSU system maintains a relatively consistent slight underprediction across regimes.
Figure 4.
Mean forecast bias, defined as forecast minus observed named storm counts, stratified by activity regime for the period 2006–2025. Active seasons are defined as at least 17 named storms, near-normal seasons as 14–16 named storms, and below-normal seasons as 13 or fewer named storms.
Overall, these results indicate that differences in forecast performance are driven primarily by variability in forecast errors rather than systematic bias. The NCSU system achieves improved accuracy for NS forecasts and more consistent performance across years, while differences among models for hurricane counts remain comparatively small.
3.3. Forecast Skill Relative to Climatology
To assess predictive value beyond a simple baseline, forecast skill is evaluated relative to the climatological references defined in Section 2.4.1. Results for both named storm (NS) and hurricane (H) counts are shown in Figure 5.
Figure 5.
Skill scores for preseason forecasts of (a) named storm counts and (b) hurricane counts over the 2006–2025 period, evaluated relative to three climatological baselines: 2006–2025 (blue), 1996–2025 (orange), and 1951–2000 (green).
For named storm forecasts (Figure 5a), skill varies substantially depending on the choice of climatological baseline. When evaluated relative to the 20-year climatology (2006–2025), skill is close to zero for all forecasting systems, indicating limited improvement over a baseline representative of the current active era. Skill increases modestly when evaluated relative to the 30-year climatology (1996–2025) and increases further relative to the 50-year climatology (1951–2000).
Although the NCSU system exhibits positive skill across all baselines, the magnitude of skill remains small relative to the 20-year reference and increases primarily when evaluated against longer-term climatologies. A similar pattern is observed for other forecasting systems, including NOAA, CSU, and TSR. These results indicate that apparent skill for NS forecasts is sensitive to the choice of climatological baseline and may be overstated when evaluated relative to earlier periods with lower average activity.
In contrast, hurricane count forecasts (Figure 5b) exhibit consistently low skill across all models and climatological baselines. Both NCSU and NOAA show modest positive skill, but the magnitude remains small relative to the 20- and 30-year climatologies and increases only slightly when evaluated against the 50-year baseline. CSU and TSR forecasts show little or no skill across most baselines.
The limited variation in hurricane forecast skill across different climatological references suggests that the low skill reflects intrinsic limits of predictability rather than an artifact of baseline selection. In other words, unlike NS forecasts, the predictability of hurricane counts appears to be fundamentally constrained.
Overall, these results highlight two key features of preseason hurricane prediction. First, the estimated skill of named storm forecasts depends strongly on the climatological reference and should be interpreted with caution when comparing across studies. Second, hurricane forecasts exhibit consistently low skill across all baselines, indicating limited predictability at preseason lead times. Within this context, the NCSU system performs comparably to or better than other operational systems, while the overall magnitude of skill remains modest.
3.4. Intercomparison with Operational Forecasts and Multi-Model Ensembles
Although the detailed methodologies of CSU, TSR, and NOAA forecasting systems are not uniformly documented, their publicly issued forecasts provide a consistent basis for evaluating relative performance. Figure 6 compares forecasted and observed named storm (NS) counts across systems.
Figure 6.
Forecast-versus-observed scatterplots for named storm counts, including linear regression fits and mean absolute error (MAE) for individual and selective ensemble forecasts. Blue dots represent individual forecast years. The dashed blue line shows the 1:1 reference line, where forecast values equal observed values. The solid orange line shows the least-squares linear regression fit between forecast and observed named storm counts for each panel.
When compared at similar lead times, the NCSU April forecasts exhibit lower mean absolute error than CSU and TSR April forecasts. Differences in MAE are modest but consistent across the 2006–2025 period, with paired comparisons indicating marginal statistical significance (p ≈ 0.08). These results suggest a tendency toward improved performance, although the limited sample size constrains formal statistical significance.
To further assess whether forecast performance can be improved through combination, a series of multi-model ensemble experiments are conducted. Results are summarized in Figure 7 for both NS and hurricane (H) counts.
Figure 7.
Performance of individual forecasts and multi-model ensemble combinations for (a) named storm predictions and (b) hurricane predictions over the 2006–2025 period. Forecast accuracy is measured using mean absolute error, with lower values indicating better performance. Individual forecasts include April outlooks from North Carolina State University (NCSU), Colorado State University (CSU), and Tropical Storm Risk (TSR), May outlooks from the National Oceanic and Atmospheric Administration (NOAA), and June updates from CSU. The full four-model ensemble is defined as the equal-weight average of the NCSU April, CSU April, TSR April, and NOAA May forecasts. Selective ensemble combinations are also shown.
A simple equal-weight ensemble constructed from all available preseason forecasts (NCSU April, CSU April, TSR April, and NOAA May) reduces error relative to weaker individual forecasts but does not outperform the best-performing systems. This indicates that indiscriminate averaging can dilute predictive information when lower-skill forecasts are included.
In contrast, selective ensemble combinations yield improved performance. For NS forecasts (Figure 7a), the lowest MAE is achieved by combining NCSU April and CSU June forecasts, while for H forecasts (Figure 7b), the best performance is obtained by combining NCSU April and NOAA May forecasts. These results demonstrate that forecast improvement depends on the combination of complementary information rather than the number of contributing models.
Additional comparisons show that combining CSU June and NOAA May forecasts improves performance relative to individual forecasts but does not exceed combinations that include the NCSU April forecast. This suggests that later initialization alone does not fully account for differences in forecast performance. Instead, the NCSU system appears to extract predictive information at earlier lead times that remains complementary to information incorporated in later forecasts.
Overall, these results indicate that forecast skill is enhanced when combining forecasts that contribute distinct information, and that the relative importance of forecast timing and model formulation depends on the predictand.
3.5. Temporal Evolution of Forecast Skill
To assess how forecast performance evolved over time, the NCSU forecast errors are evaluated relative to the corresponding climatological errors and shown annually in Figure 8. The annual metric is defined as (|F − O| − |C − O|), where (F) is the NCSU forecast, (O) is the observed seasonal count, and (C) is the 2006–2025 climatological mean. Negative values indicate that the forecast outperformed climatology in that year, while positive values indicate performance that is worse than climatology. This benchmark-relative formulation is used because annual absolute error alone can be influenced by differences in the intrinsic variability of the verification period and therefore does not necessarily reflect changes in model behavior.
Figure 8.
Annual climatology-relative absolute error for the NCSU April forecasts of named storms and hurricanes over 2006–2025. Values are defined as , where is the NCSU forecast, is the observed seasonal count, and is the 2006–2025 climatological mean. Negative values indicate that the NCSU forecast outperformed climatology in that year, while positive values indicate performance that is worse than climatology. Vertical dotted lines denote major phases in the evolution of the NCSU forecast system.
The temporal evolution differs between predictands. For named storm forecasts, the climatology-relative errors fluctuate around zero throughout the record, with periods of both improvement and degradation but no clear monotonic trend. This indicates that named storm prediction skill remained comparatively stable across the major phases of NCSU model development. For hurricane forecasts, the earlier part of the record shows larger year-to-year variability, whereas the most recent phase exhibits a more frequent tendency toward negative values, indicating that the NCSU forecasts more consistently outperformed climatology. This pattern suggests that the later integrated ensemble and classification framework may have contributed to improved hurricane prediction.
These results should be interpreted descriptively rather than as a formal attribution of skill changes to specific methodological updates. Each model-development phase contains only a small number of years, and forecast errors are affected by both model formulation and the intrinsic predictability of individual hurricane seasons. A larger hindcast archive or a controlled reforecast experiment using frozen model configurations would be required to isolate the impact of individual model changes. Overall, Figure 8 indicates that the NCSU system maintained relatively stable performance for named storm prediction while showing recent improvement in hurricane prediction under evolving climate conditions and model formulation.
3.6. Role of Forecast Timing, Environmental Predictors, and Predictand Dependence
To better understand the factors underlying differences in forecast performance, we examine the roles of forecast timing, environmental predictors, and predictand dependence. Although the detailed formulations of CSU, TSR, and NOAA forecasting systems are not fully documented, published studies indicate that these systems commonly rely on large-scale predictors such as Atlantic sea surface temperature (SST), ENSO-related conditions, and atmospheric circulation fields. These variables reflect well-established physical mechanisms linking ocean–atmosphere variability to hurricane activity.
A key distinction among forecasting systems is forecast timing. NCSU, CSU, and TSR forecasts are issued in April, whereas NOAA May forecasts and CSU June forecasts incorporate additional environmental information available during late spring. Comparisons between CSU April and CSU June forecasts show measurable improvement with later initialization, confirming that forecast timing contributes to improved accuracy. Similarly, NOAA May forecasts benefit from updated environmental conditions relative to April forecasts.
However, cross-system comparisons indicate that timing alone does not fully explain differences in forecast performance. Differences between NCSU April, NOAA May, and CSU June forecasts are small relative to interannual variability and are not statistically significant. This indicates that comparable levels of forecast skill can be achieved at earlier lead times, suggesting that model formulation plays an important role in extracting predictive information from preseason conditions.
To quantify the environmental drivers of forecast adjustments, both single-variable and multivariate regression analyses are applied. These relationships are interpreted as diagnostic rather than causal, as forecast adjustments may reflect internal model responses to evolving environmental conditions.
As shown in Figure 9, changes in tropical North Atlantic SST between March and May (ΔTNA) explain a substantially larger fraction of variance in forecast adjustments than changes in ENSO conditions (ΔENSO). For NOAA forecast updates, the relationship between ΔTNA and forecast differences is statistically significant (R2 ≈ 0.23, p < 0.05), while ΔENSO does not exhibit statistical significance in any configuration. Similar but weaker relationships are observed for CSU updates.
Figure 9.
Single-variable regression relationships between forecast adjustments and changes in environmental predictors. Blue dots represent individual forecast years, and the solid blue line shows the least-squares linear regression fit for each predictor–forecast-adjustment relationship. ΔTNA denotes the change in observed tropical North Atlantic sea surface temperature between March and May. ΔENSO denotes the difference between the May and March forecasts of August–October ENSO conditions.
Multivariate regression results (Table 4) further support this pattern. When both predictors are included, ΔTNA remains statistically significant, whereas ΔENSO does not. The estimated regression model is:
where ΔE represents the change in forecast error between earlier and later forecasts. The coefficient associated with ΔTNA is significant at the 0.05 level, while the coefficient for ΔENSO is not. These results indicate that late-spring changes in Atlantic SST provide the primary contribution to forecast improvements, while ENSO-related changes contribute secondarily and primarily through interactions with other predictors.
Table 4.
Multivariate regression results.
This hierarchy is consistent with the differing characteristics of the predictors. Atlantic SST variability is directly observed and evolves during late spring, providing a stable and immediately available source of information. In contrast, ENSO contributes to seasonal variability through its influence on vertical wind shear and large-scale circulation, but its predictive value at preseason lead times depends on the accuracy of forecasts of its future state. As ENSO forecast skill improves from March to May, its contribution to seasonal prediction becomes more effective, but it remains secondary to Atlantic SST variability in this preseason framework.
The ensemble results presented in Section 3.4 provide additional insight into the interaction between forecast timing and model capability. The optimal ensemble configurations differ between predictands. For named storm (NS) counts, the best-performing ensemble combines NCSU April and CSU June forecasts, indicating that NS prediction benefits from late-spring updates to environmental conditions. In contrast, for hurricane (H) counts, the best performance is obtained by combining NCSU April and NOAA May forecasts, suggesting that H prediction is more strongly constrained by large-scale conditions that are already reasonably represented by May.
This asymmetry reflects differences in the underlying predictability of storm genesis and intensification. Named storm counts are more sensitive to evolving environmental conditions and short-term variability, while hurricane counts are more strongly influenced by basin-scale thermodynamic constraints. As a result, forecast timing plays a larger role in NS prediction, whereas model formulation plays a relatively larger role in H prediction.
Overall, these results demonstrate that forecast performance is governed by the combined influence of model capability, forecast timing, and environmental predictability. A clear hierarchy emerges in predictor contributions: Atlantic SST variability provides the dominant source of preseason predictability, while ENSO contributes additional information as forecast uncertainty decreases later in the season. The ability of the NCSU system to achieve comparable skill at earlier lead times indicates that improved model design can partially compensate for limitations associated with preseason environmental information.
3.7. Performance in Extreme Seasons
All forecasting systems examined in this study exhibit reduced skill during extreme or anomalous seasons, highlighting fundamental limits of preseason hurricane predictability. The most prominent example is the 2020 Atlantic hurricane season, which recorded 28 named storms during the June–November period, far exceeding climatological expectations.
All models substantially underestimated the magnitude of this event, reflecting the difficulty of predicting rare, high-activity seasons using preseason information alone. Similar behavior is evident in other anomalous years, such as 2012, indicating that this limitation is not confined to a single case.
These results illustrate inherent constraints on seasonal predictability arising from internal climate variability, nonlinear interactions among predictors, and incomplete representation of relevant physical processes. Extreme seasons are often associated with compound environmental conditions—such as concurrent Atlantic SST anomalies, ENSO phase transitions, and changes in atmospheric circulation—that are not fully captured by preseason predictors.
A closer examination of the 2020 season (Table 5) provides additional insight into model behavior under extreme conditions. While all models underestimate observed activity, differences emerge among modeling approaches. Linear models, such as LASSO, tend to exhibit larger errors, reflecting their tendency to regress toward climatological means under strong forcing. In contrast, nonlinear models, particularly XGBoost, produce higher forecasts and smaller absolute errors, partially capturing the elevated activity level.
Table 5.
Forecasted and observed named storm counts for the 2020 Atlantic hurricane season. Midpoint values are used for comparison.
The extreme activity in 2020 was associated with multiple reinforcing factors, including anomalously warm SSTs in the Atlantic Main Development Region, the development of La Niña conditions during the peak season, reduced vertical wind shear, and enhanced atmospheric instability. The concurrence of these factors created conditions that exceeded the range of most historical analogs available for model training.
Despite improvements from hybrid modeling approaches, all systems show limited ability to reproduce extreme outcomes. Ensemble combinations reduce forecast error under typical conditions (Section 3.4) but provide only limited improvement in years such as 2020, indicating that model and ensemble design cannot fully overcome the intrinsic unpredictability of such events.
Overall, these findings underscore that forecast skill is fundamentally constrained during extreme seasons. While model development and ensemble strategies improve performance under average conditions, rare and high-impact events remain difficult to predict at preseason lead times, emphasizing the importance of incorporating uncertainty into seasonal forecasts.
4. Discussion
4.1. Sources of Predictive Skill and Role of Machine Learning
The results of this study indicate that preseason hurricane forecast skill arises from a combination of physically meaningful predictors, flexible modeling approaches, and ensemble integration. The NCSU system achieves consistent skill for named storm (NS) forecasts and modest skill for hurricane (H) forecasts relative to climatology, reflecting both the strengths and inherent limits of seasonal prediction.
A key contributor to forecast performance is the use of large-scale climate predictors that capture environmental conditions relevant to tropical cyclone activity. Variables such as sea surface temperature (SST) anomalies, ENSO-related indices, and atmospheric circulation fields provide a physically grounded representation of the climate system. When appropriately incorporated, these predictors enable the model to extract information related to vertical wind shear, thermodynamic instability, and large-scale circulation patterns. At the same time, the limited skill for hurricane counts highlights that the presence of physically meaningful predictors does not guarantee strong predictive performance, particularly when outcomes depend on nonlinear interactions and processes not fully represented at preseason lead times.
The ability to represent nonlinear relationships is a distinguishing feature of the modeling framework. Traditional statistical approaches are primarily limited to linear or weakly nonlinear relationships, which may not adequately capture the complexity of climate–hurricane interactions. In contrast, machine learning components—particularly gradient boosting and neural networks—allow the model to represent threshold-dependent and interaction effects among predictors. These capabilities are especially relevant in situations where multiple environmental factors act in combination to influence seasonal activity.
The ensemble structure further enhances predictive performance by integrating models with complementary strengths. Rather than relying on a single representation of the predictor–response relationship, the ensemble combines linear and nonlinear approaches, reducing sensitivity to individual model assumptions and errors. This integration improves stability across years and contributes to more consistent forecast performance, as reflected in reduced error variability.
The ensemble results presented in Section 3.4 provide additional insight into the role of model architecture. The finding that selective combinations outperform simple averaging indicates that forecast improvement depends on the integration of complementary information rather than the number of models included. In this context, the NCSU system can be viewed as an internally optimized ensemble that captures a substantial portion of the available predictive information at preseason lead times.
An additional strength of the framework is its ability to incorporate predictors with differing levels of reliability. By including both ENSO-dependent and ENSO-independent model configurations, the system retains predictive skill even when forecast-based predictors are uncertain. This flexibility allows the model to adapt to varying levels of predictor uncertainty and helps explain its relatively stable performance across different climate conditions.
Overall, these results suggest that predictive skill in preseason hurricane forecasts is not solely determined by the availability of environmental information, but also by the ability of the modeling framework to represent complex relationships and integrate complementary sources of information. Machine learning methods play a key role in this process by enabling the extraction of nonlinear signals that are not captured by traditional statistical approaches.
4.2. Comparison with Operational Forecast Systems
The comparison with CSU, TSR, and NOAA forecasts provides important context for interpreting the performance of the NCSU system. As shown in Section 3, NCSU April forecasts generally outperform CSU and TSR forecasts issued at the same lead time, indicating an advantage associated with model formulation rather than forecast timing alone.
To further isolate the role of forecast timing, CSU June forecasts and NOAA May forecasts provide useful benchmarks. Both incorporate additional environmental information relative to April forecasts and therefore represent the expected improvement associated with later initialization. Consistent with this expectation, CSU forecasts show improved performance from April to June, confirming that forecast timing contributes to increased accuracy.
However, when differences in issuance time are taken into account, forecast performance across systems converges. CSU June and NOAA May forecasts do not show statistically significant improvements relative to NCSU April forecasts, and differences among these systems remain small compared to interannual variability. This indicates that a substantial portion of the apparent advantage of later-issued forecasts reflects access to updated environmental information, but also that comparable skill can be achieved at earlier lead times.
These results suggest that model capability plays an important role in extracting predictive information from preseason conditions. The ability of the NCSU system to achieve performance comparable to later-issued forecasts implies that improved model design can partially compensate for the limitations associated with earlier initialization.
The ensemble experiments provide additional support for this interpretation. As shown in Section 3.4, combining NCSU April forecasts with later-issued forecasts yields improved performance, while combinations of later-issued forecasts alone do not outperform those that include the NCSU forecasts. This indicates that NCSU forecasts contribute information that remains complementary to that contained in forecasts initialized at later times.
Overall, the comparison across operational systems highlights the interplay between forecast timing and model formulation. Later initialization provides access to improved environmental information but does not fully determine forecast performance. Instead, skill depends on both the availability of information and the ability of the modeling framework to effectively utilize that information.
4.3. Temporal Stability, Nonstationarity, and Limits of Predictability
The temporal analysis presented in Section 3.5 indicates that forecast performance varies across systems over the 2006–2025 period, with the NCSU system maintaining relatively stable performance while some traditional statistical systems exhibit degradation in the more recent decade. These differences highlight the importance of model adaptability under evolving climate conditions.
Atlantic hurricane activity is influenced by multidecadal variability and long-term changes in the climate system, including trends in sea surface temperature and large-scale atmospheric circulation. Such changes can alter the relationships between predictors and hurricane activity, introducing nonstationarity into seasonal prediction. Models that rely on fixed statistical relationships may therefore experience reduced performance as the climate system evolves.
The relatively stable performance of the NCSU system is consistent with its adaptive framework, which incorporates machine learning components and performance-based ensemble weighting. These features allow the system to adjust to changing predictor relationships and maintain skill under varying climate conditions. In contrast, systems that rely more heavily on fixed or linear relationships may be less able to accommodate such changes.
At the same time, the results from extreme seasons (Section 3.7) highlight fundamental limits of preseason predictability. Even under favorable modeling frameworks, forecast skill is reduced during anomalous years characterized by strong nonlinear interactions among environmental factors. These events often involve combinations of conditions—such as elevated Atlantic SSTs, ENSO phase transitions, and changes in atmospheric circulation—that are difficult to anticipate using preseason information alone.
This distinction between model adaptability and intrinsic predictability limits is important. Improvements in model design can enhance performance under typical conditions and mitigate some effects of nonstationarity, but they cannot fully overcome the inherent uncertainty associated with rare and extreme events.
These findings underscore the need to interpret seasonal hurricane forecasts probabilistically rather than deterministically. While point forecasts provide a useful summary, the underlying uncertainty—particularly during extreme seasons—should be explicitly considered in both scientific analysis and practical applications.
Overall, the results suggest that preseason forecast skill reflects a balance between evolving climate relationships and intrinsic limits of predictability. Adaptive modeling approaches can improve robustness under changing conditions, but fundamental constraints remain, particularly for extreme events and at longer lead times.
4.4. Role of Forecast Timing and Predictand Dependence
The results of this study show that forecast timing plays a significant role in determining seasonal hurricane forecast skill. Later-issued forecasts benefit from improved representation of environmental conditions, particularly tropical Atlantic SST variability, which emerges as the dominant predictor at preseason lead times. As demonstrated in Section 3.6, changes in tropical North Atlantic SST from March to May (ΔTNA) explain a substantial portion of the variance in forecast differences between early- and late-initialized systems, highlighting late-spring SST evolution as a primary source of predictability.
However, forecast timing alone does not fully account for differences in forecast performance. Despite the absence of late-spring updates, the NCSU system achieves skill comparable to forecasts issued one to two months later by other groups. This indicates that model capability can partially offset limitations associated with preseason information, emphasizing the importance of modeling frameworks that efficiently extract predictive signals from early-season environmental conditions.
Regression analyses further establish a clear hierarchy in predictor contributions. ΔTNA consistently emerges as the dominant driver, while ENSO-related changes (ΔENSO) provide a secondary contribution. This result is consistent across both single-variable and multivariate analyses, in which ΔTNA exhibits stronger and more statistically significant relationships with forecast differences, whereas ENSO contributes additional but more limited explanatory power.
This hierarchy reflects fundamental differences in predictor characteristics. Atlantic SST variability is directly observed and evolves during late spring, providing a reliable and immediately available source of information. In contrast, ENSO remains a physically important large-scale driver of Atlantic hurricane variability, but its predictive value at preseason lead times is constrained by uncertainty associated with the spring predictability barrier. As ENSO forecast skill improves from March to May, its contribution becomes more apparent in later-issued forecasts, consistent with its secondary role.
The greater reliability of tropical North Atlantic sea surface temperature at an April lead time is also physically interpretable. April forecasts do not explicitly predict future Atlantic sea surface temperature evolution in the same manner as a coupled dynamical model. Instead, the model uses observed preseason Atlantic thermodynamic anomalies and related large-scale predictors that contain persistent information about the state of the basin. Late-spring Atlantic sea surface temperature evolution is influenced by trade-wind strength, wind-driven evaporation, latent heat flux, and wind-evaporation-sea surface temperature feedbacks. Remote ENSO forcing can also modulate Atlantic vertical wind shear and large-scale circulation, including through Walker-cell-related responses. Thus, the predictor hierarchy found here is consistent with a physical interpretation in which directly observed and persistent Atlantic thermodynamic conditions provide the most reliable preseason signal, while ENSO contributes conditionally as its future state becomes better constrained.
An additional result is that the relative importance of forecast timing and model capability depends on the predictand. Named storm (NS) forecasts exhibit greater sensitivity to late-spring environmental updates, consistent with their stronger dependence on evolving large-scale conditions. In contrast, hurricane (H) forecasts are more strongly constrained by basin-scale thermodynamic conditions that are already reasonably represented by May, resulting in smaller incremental gains from later initialization. This predictand-dependent behavior suggests that optimal forecasting strategies may differ by target variable and supports the use of complementary forecasts across systems and lead times.
Overall, these results highlight the interplay between forecast timing, model capability, and predictor reliability. Late-spring evolution of tropical Atlantic SST provides the dominant source of predictability, while ENSO contributes conditionally as forecast uncertainty decreases. At the same time, advances in modeling can partially compensate for earlier initialization, enabling skillful forecasts at extended lead times.
4.5. Implications, Limitations, and Future Directions
The results of this study have several implications for the development of seasonal hurricane prediction systems. The performance of the NCSU system demonstrates the value of hybrid statistical–machine learning approaches, particularly in their ability to capture nonlinear relationships and adapt to evolving climate conditions. In addition, the ensemble experiments show that forecast improvements depend on combining complementary sources of information rather than simply increasing the number of models, underscoring the importance of both model capability and forecast timing in ensemble design.
At the same time, several limitations should be noted. The relatively short analysis period (2006–2025) limits statistical robustness, particularly for rare extreme events. Differences in forecast timing and methodology constrain direct comparison across operational systems, and the focus on deterministic forecasts does not fully capture forecast uncertainty. In addition, the use of simple equal-weight ensembles does not fully explore the potential of optimized weighting strategies, which may further improve performance.
A related limitation is that the forecasts evaluated here are basin-wide seasonal count forecasts rather than storm-resolving simulations. The models do not produce individual tropical cyclone tracks or intensities, and comparable track-level output is not available from the external operational systems used in the intercomparison. Therefore, track “spaghetti” maps or intensity-map comparisons would require a separate track-density or storm-by-storm prediction framework. Extending the present seasonal-count evaluation to regional track density and intensity metrics is an important direction for future work.
More fundamentally, the results highlight intrinsic limits of seasonal hurricane predictability. As shown in Section 3.7, extreme seasons are often associated with compound and evolving climate conditions that are not fully represented by preseason predictors. Even selective ensemble combinations that improve average performance provide limited gains during such events, indicating that deterministic preseason forecasts remain inherently constrained.
Future work should address these limitations by incorporating probabilistic prediction frameworks, integrating dynamical model outputs, and developing adaptive ensemble strategies that explicitly account for forecast timing and predictand dependence. Extending the analysis to regional scales, such as the Gulf of Mexico and Caribbean Sea, may also provide additional insight into spatial variability in forecast skill.
In addition, a convolutional neural network (CNN)-based extended-lead prediction framework has been developed as part of the broader NCSU system [17], but is not included in the present evaluation. Future research will assess the combined performance of the CNN framework and the core ensemble system, with the goal of improving forecast skill at longer lead times and enhancing the overall performance of the integrated prediction system.
4.6. Relation to Deep Learning and AI-Powered Seasonal Prediction
Recent progress in data-driven weather prediction, including models such as FourCastNet and GraphCast, demonstrates that deep neural networks can learn complex mappings from gridded atmospheric and oceanic states to future weather fields [25,26]. These systems differ from the present preseason hurricane prediction problem because they are designed primarily for time-evolving weather forecasts, whereas the present study focuses on aggregate basin-wide seasonal predictands.
In principle, an end-to-end deep-learning system could be developed to map large-scale environmental predictors directly to seasonal hurricane predictands such as named storm counts, hurricane counts, major hurricane counts, and accumulated cyclone energy. This possibility is consistent with the universal approximation theorem, which states that sufficiently flexible neural networks can approximate nonlinear mappings under appropriate conditions [27,28]. In practice, however, the success of such a system would depend on much more than approximation capacity. Seasonal hurricane records are short, extreme seasons are rare, and predictor-response relationships are nonstationary. These features increase the risk of overfitting and make independent real-time verification essential.
The multi-model forecast outputs analyzed here could also be used as inputs to a post-processing model, such as a one-hidden-layer multilayer perceptron, that maps the set of operational forecast values to the observed seasonal outcome. Such a neural-network ensemble is conceptually feasible, but the 20-year real-time record used in this study is too short to train and independently validate even a small network without strong regularization or additional hindcast data. For this reason, the present manuscript uses equal-weight and selective output-level ensembles as transparent baselines, while identifying neural-network post-processing, transfer learning from climate-model hindcasts, and physically constrained deep-learning architectures as promising future directions.
5. Conclusions and Implications
This study evaluates the 20-year operational performance (2006–2025) of the NCSU preseason hurricane prediction system using real-time forecasts generated under evolving model configurations and climate conditions. Unlike traditional hindcast-based studies, this analysis provides a realistic assessment of operational forecast skill.
Based on the results, several key conclusions emerge:
- (1)
- The NCSU system demonstrates consistent predictive skill and outperforms other April-issued forecasts: NCSU forecasts exhibit lower mean absolute error than CSU and TSR for named storm (NS) prediction and achieve performance comparable to NOAA for hurricane (H) counts, despite earlier issuance.
- (2)
- Forecast improvements associated with later initialization are primarily driven by late-spring evolution of tropical Atlantic SST, with ENSO providing a secondary contribution: Regression analyses show that changes in tropical North Atlantic SST from March to May are the dominant driver of forecast adjustments. ENSO contributes primarily when updated seasonal forecasts better represent peak-season conditions, reflecting reduced uncertainty beyond the spring predictability barrier.
- (3)
- Forecast skill is enhanced by selective ensemble combinations rather than simple averaging: A full equal-weight ensemble does not outperform the best individual models. In contrast, selective combinations yield improved performance, with NCSU April + CSU June producing the most accurate NS forecasts and NCSU April + NOAA May yielding the best H forecasts. This highlights the importance of combining complementary information rather than increasing ensemble size.
- (4)
- Predictor contributions are hierarchical and depend on both timing and predictand: Atlantic SST provides a consistent and directly observed source of predictive information across lead times and dominates both single-variable and multivariate relationships. ENSO, while physically important, contributes conditionally through improved peak-season forecasts and plays a secondary role in preseason prediction. NS forecasts are more sensitive to evolving environmental conditions, whereas H forecasts are more strongly constrained by basin-scale thermodynamic factors.
- (5)
- Preseason predictability is dominated by observed rather than forecast-based environmental signals: Directly observed preseason variables, particularly Atlantic SST, provide more reliable predictive information than forecast-based predictors such as ENSO at early lead times. Forecast-based predictors become more valuable only as their uncertainty decreases closer to the hurricane season.
- (6)
- Seasonal hurricane prediction is subject to intrinsic limits, particularly during extreme seasons: Forecast skill across all systems, including ensemble combinations, is reduced during anomalous years such as 2020, reflecting the influence of internal variability and compound climate drivers that are not fully captured by preseason predictors.
From an applied perspective, improved preseason forecasts can support decision-making in insurance, emergency management, and tourism planning by providing more reliable early-season guidance. At the same time, persistent challenges associated with extreme events highlight the need for probabilistic forecasting frameworks, improved representation of rare climate conditions, and integration of real-time environmental information.
Overall, these results demonstrate that preseason seasonal hurricane forecast skill is governed by the interaction of model capability, forecast timing, and predictand-dependent environmental predictability. This framework provides a coherent basis for interpreting differences among forecasting systems and offers guidance for the continued development of preseason seasonal hurricane prediction methodologies.
Funding
This study was partially supported by a charitable gift to North Carolina State University donated by Lenovo Inc.
Data Availability Statement
All data generated by this study are included in Appendix A.
Acknowledgments
The computations described in this study were carried out on a Lenovo ThinkStation P7 server donated to North Carolina State University. ChatGPT was used during the preparation of this article to assist with organization, draft editing, revision, language refinement, data analysis and visualization. The author independently reviewed the results, corrected AI-generated errors, verified numerical and graphical claims against source materials and approved all final text. The author remains fully responsible for the content, interpretation and conclusions.
Conflicts of Interest
The author declares no conflicts of interest.
Appendix A. Forecast Data Tables
Table A1.
Preseason forecasts of named storm and hurricane count by North Carolina State University, Colorado State University, Tropical Storm Risk, and the National Oceanic and Atmospheric Administration, together with observed HURDAT2 named storm and hurricane counts.
Table A2.
Absolute errors for North Carolina State University, Colorado State University, Tropical Storm Risk, and the National Oceanic and Atmospheric Administration forecasts.
Table A3.
March and May tropical North Atlantic sea surface temperature observations and August–October ENSO forecasts and validations.
References
- Gray, W.M. Atlantic seasonal hurricane frequency. Part I: El Niño and 30 mb quasi-biennial oscillation influences. Mon. Weather Rev. 1984, 112, 1649–1668. [Google Scholar] [CrossRef] [Scilit]
- Emanuel, K.; Fondriest, F.; Kossin, J. Potential economic value of seasonal hurricane forecasts. Weather Clim. Soc. 2012, 4, 110–117. [Google Scholar] [CrossRef] [Scilit]
- Forster, J.; Schuhmann, P.; Lake, I.; Watkinson, A.; Gill, J. The influence of hurricane risk on tourist destination choice in the Caribbean. Clim. Change 2012, 114, 745–768. [Google Scholar] [CrossRef] [Scilit]
- Blake, E.S.; Pasch, R.J.; Bell, G.D. Verification of 12 years of NOAA seasonal hurricane forecasts. In Proceedings of the 29th Conference on Hurricanes and Tropical Meteorology; American Meteorological Society: Boston, MA, USA, 2010. [Google Scholar]
- Klotzbach, P.J.; Saunders, M.A.; Bell, G.D.; Blake, E.S. North Atlantic seasonal hurricane prediction: Underlying science and an evaluation of statistical models. In Prediction of Climate Extremes; AGU: Washington, DC, USA, 2017; pp. 315–328. [Google Scholar]
- Hemri, S.; Bhend, J.; Liniger, M.A.; Manzanas, R.; Siegert, S.; Stephenson, D.B.; Gutiérrez, J.M.; Brookshaw, A.; Doblas-Reyes, F.J. How to create an operational multi-model of seasonal forecasts? Clim. Dyn. 2020, 55, 1141–1157. [Google Scholar] [CrossRef] [Scilit]
- Xie, L.; Yan, T.; Pietrafesa, L.J.; Morrison, J.M.; Karl, T. Climatology and interannual variability of North Atlantic hurricane tracks. J. Clim. 2005, 18, 5370–5381. [Google Scholar] [CrossRef] [Scilit]
- Camargo, S.J.; Sobel, A.H.; Barnston, A.G.; Emanuel, K. Tropical cyclone genesis potential index in climate models. J. Clim. 2007, 20, 4819–4834. [Google Scholar]
- Klotzbach, P.J.; Gray, W.M. Twenty-five years of Atlantic basin seasonal hurricane forecasts (1984–2008). Geophys. Res. Lett. 2009, 36, L09711. [Google Scholar] [CrossRef] [Scilit]
- Webster, P.J.; Yang, S. Monsoon and ENSO: Selectively interactive systems. Q. J. R. Meteorol. Soc. 1992, 118, 877–926. [Google Scholar] [CrossRef]
- Latif, M.; Anderson, D.; Barnett, T.; Cane, M.; Kleeman, R.; Leetmaa, A.; O’Brien, J.; Rosati, A.; Schneider, E. A review of the predictability and prediction of ENSO. J. Geophys. Res. Ocean. 1998, 103, 14375–14393. [Google Scholar] [CrossRef] [Scilit]
- Duan, W.; Wei, C. The “spring predictability barrier” for ENSO predictions and its possible mechanism: Results from a fully coupled model. Int. J. Clim. 2013, 33, 1280–1292. [Google Scholar] [CrossRef] [Scilit]
- Xie, K.; Liu, B. An ENSO-forecast independent statistical model for the prediction of annual Atlantic tropical cyclone frequency in April. Adv. Meteorol. 2014, 2024, 248148. [Google Scholar] [CrossRef] [Scilit]
- Keith, E.; Xie, L. Predicting Atlantic tropical cyclone seasonal activity in April. Weather Forecast. 2009, 24, 436–455. [Google Scholar] [CrossRef] [Scilit]
- Sun, X.; Xie, L.; Shah, S.U.; Shen, X. A machine learning based ensemble forecasting optimization algorithm for preseason prediction of Atlantic hurricane activity. Atmosphere 2021, 12, 522. [Google Scholar] [CrossRef] [Scilit]
- Chen, X.; Xie, L. Comparing statistical and machine-learning models for seasonal prediction of Atlantic hurricane activity. Atmosphere 2026, 17, 129. [Google Scholar] [CrossRef] [Scilit]
- Asthana, T.; Krim, H.; Sun, X.; Roheda, S.; Xie, L. Atlantic hurricane activity prediction: A machine learning approach. Atmosphere 2021, 12, 455. [Google Scholar] [CrossRef] [Scilit]
- Landsea, C.W.; Franklin, J.L. Atlantic hurricane database uncertainty and presentation of a new database format. Mon. Weather Rev. 2013, 141, 3576–3592. [Google Scholar] [CrossRef] [Scilit]
- North Carolina State University Hurricane Prediction Press Releases and Archived Reports. Available online: https://news.ncsu.edu/tag/hurricane-prediction/ (accessed on 13 June 2026).
- Colorado State University Tropical Meteorology Project. Seasonal Atlantic Hurricane Forecasts. Available online: https://tropical.colostate.edu (accessed on 13 June 2026).
- Saunders, M.A.; Lea, A.S. Seasonal prediction of hurricane activity reaching the coast of the United States. Nature 2008, 434, 1005–1008. [Google Scholar]
- Tropical Storm Risk (TSR). Supplementary Information: TSR Forecast Methodology. Available online: https://tropicalstormrisk.com/docs/Supplementary.pdf (accessed on 13 June 2026).
- NOAA Climate Prediction Center, 2026: Atlantic Hurricane Season Outlooks. Available online: https://www.cpc.ncep.noaa.gov/products/outlooks/hurricane2026/May/hurricane.shtml (accessed on 13 June 2026).
- DelSole, T.; Yang, X.; Tippett, M.K. Is unequal weighting significantly better than equal weighting for multi-model forecasting? Q. J. R. Meteorol. Soc. 2013, 139, 176–183. [Google Scholar] [CrossRef] [Scilit]
- Pathak, J.; Subramanian, S.; Harrington, P.; Raja, S.; Chattopadhyay, A.; Mardani, M.; Kurth, T.; Hall, D.; Li, Z.; Azizzadenesheli, K.; et al. FourCastNet: A global data-driven high-resolution weather model using adaptive Fourier neural operators. arXiv 2022, arXiv:2202.11214. [Google Scholar]
- Lam, R.; Sanchez-Gonzalez, A.; Willson, M.; Wirnsberger, P.; Fortunato, M.; Alet, F.; Ravuri, S.; Ewalds, T.; Eaton-Rosen, Z.; Hu, W.; et al. Learning skillful medium-range global weather forecasting. Science 2023, 382, 1416–1421. [Google Scholar] [CrossRef] [Scilit] [PubMed]
- Cybenko, G. Approximation by superpositions of a sigmoidal function. Math. Control Signals Syst. 1989, 2, 303–314. [Google Scholar] [CrossRef] [Scilit]
- Hornik, K.; Stinchcombe, M.; White, H. Multilayer feedforward networks are universal approximators. Neural Netw. 1989, 2, 359–366. [Google Scholar] [CrossRef] [Scilit]
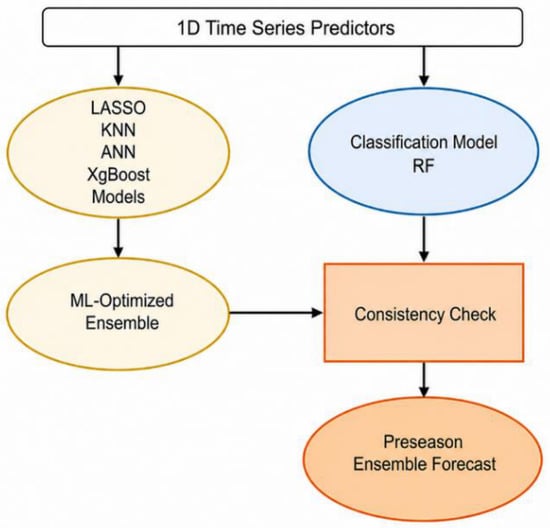
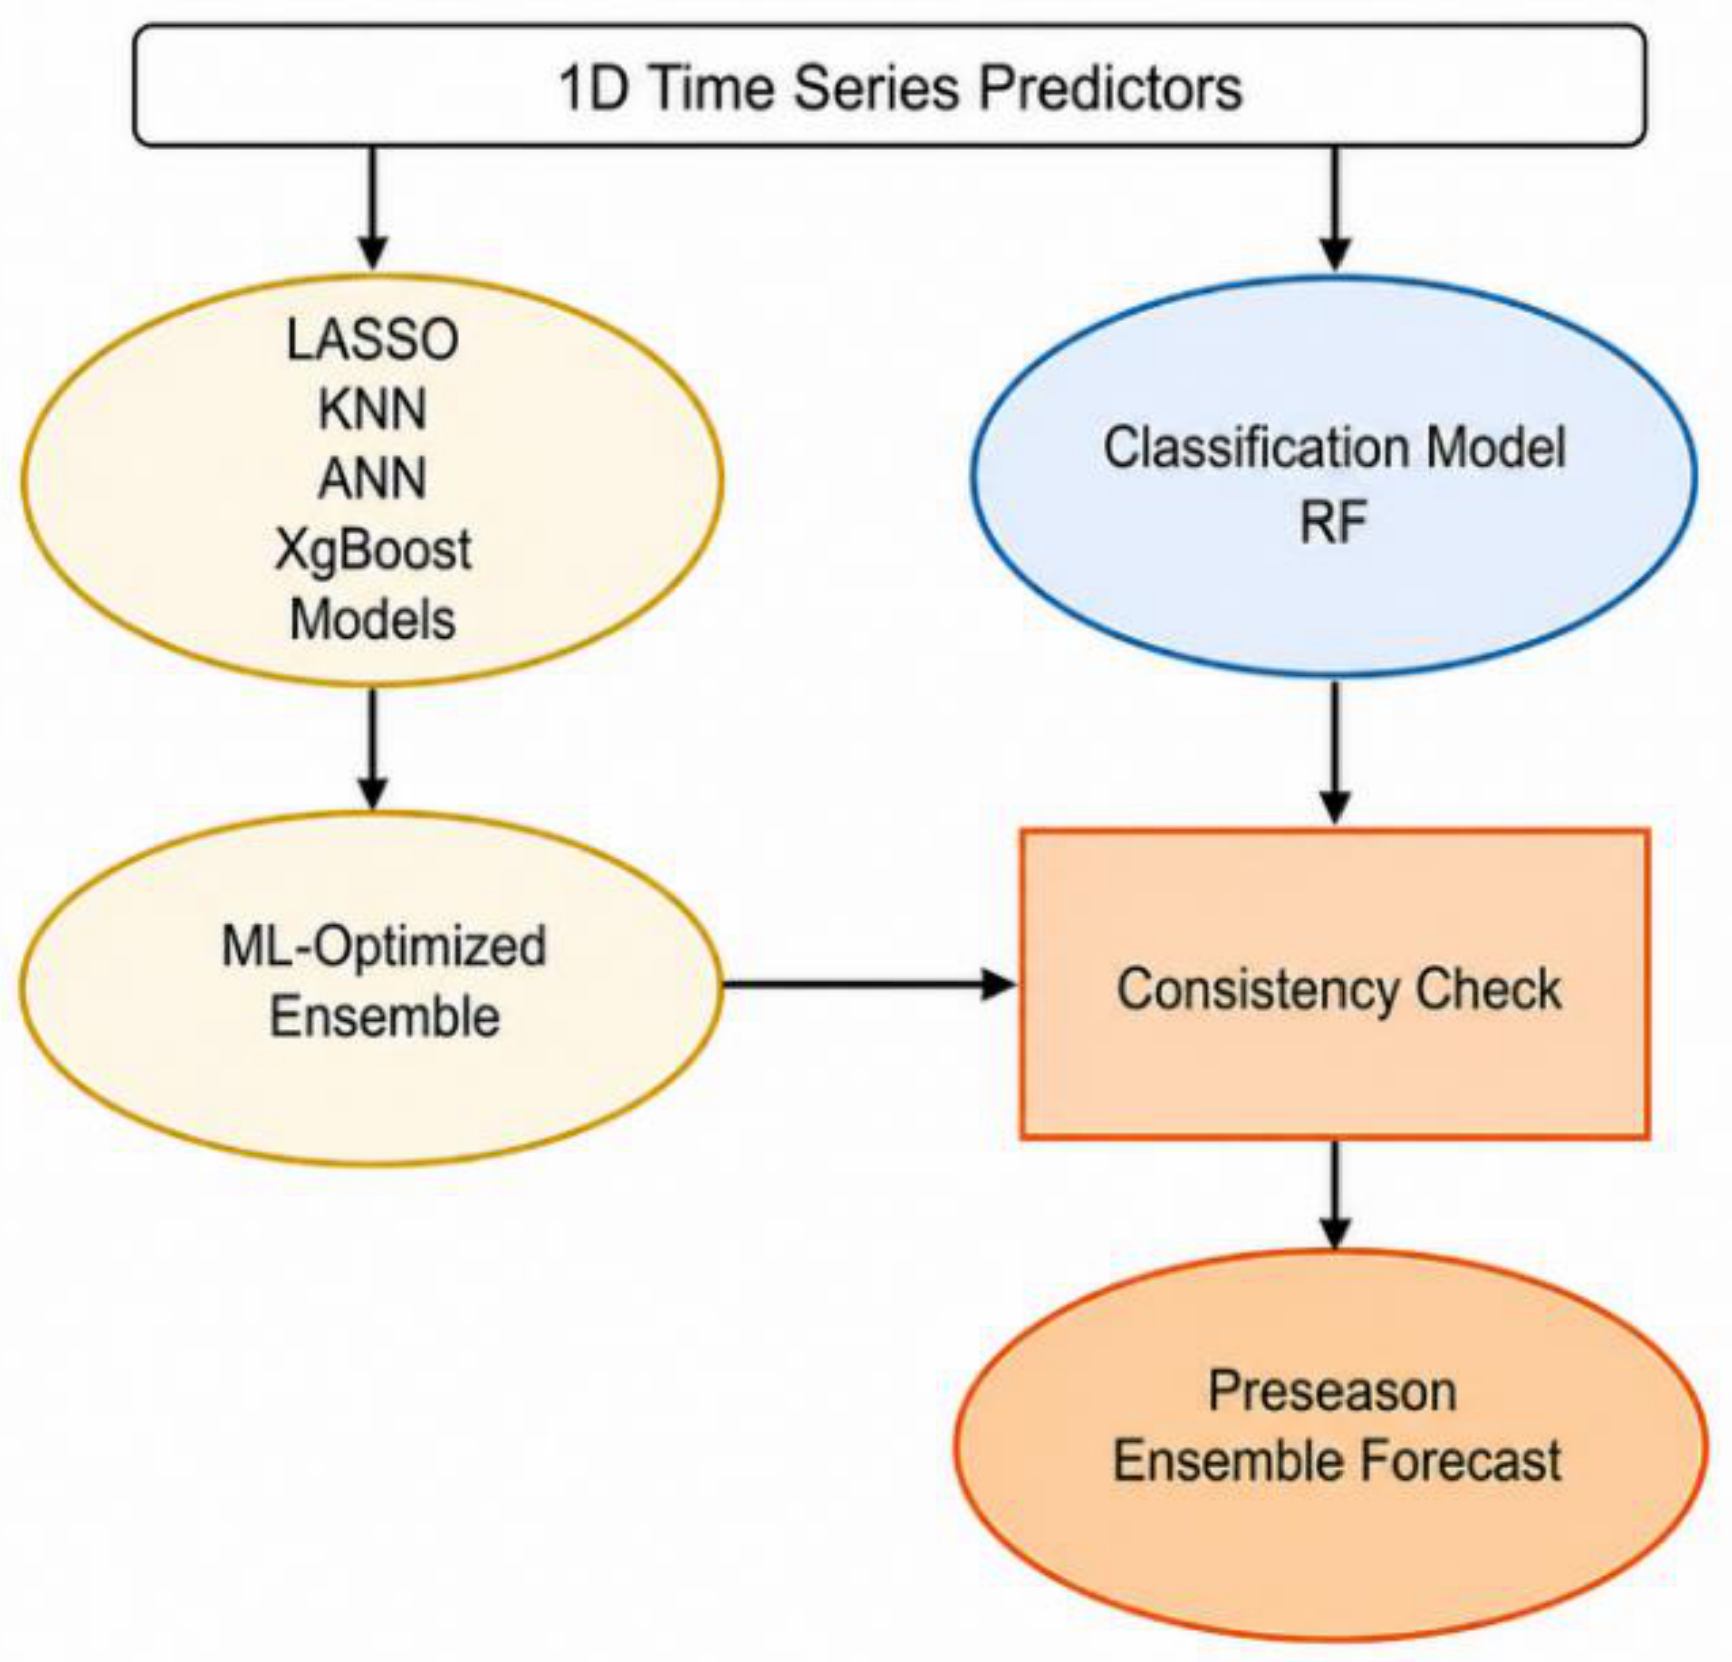
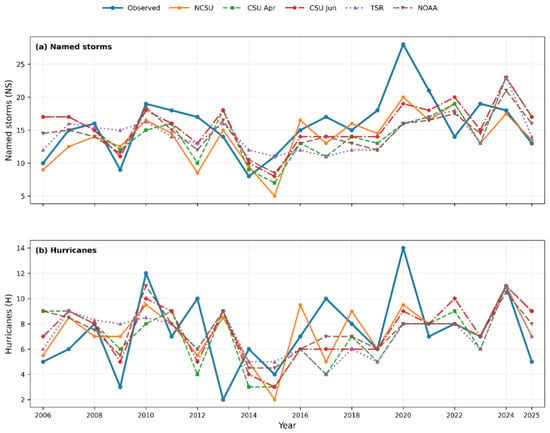
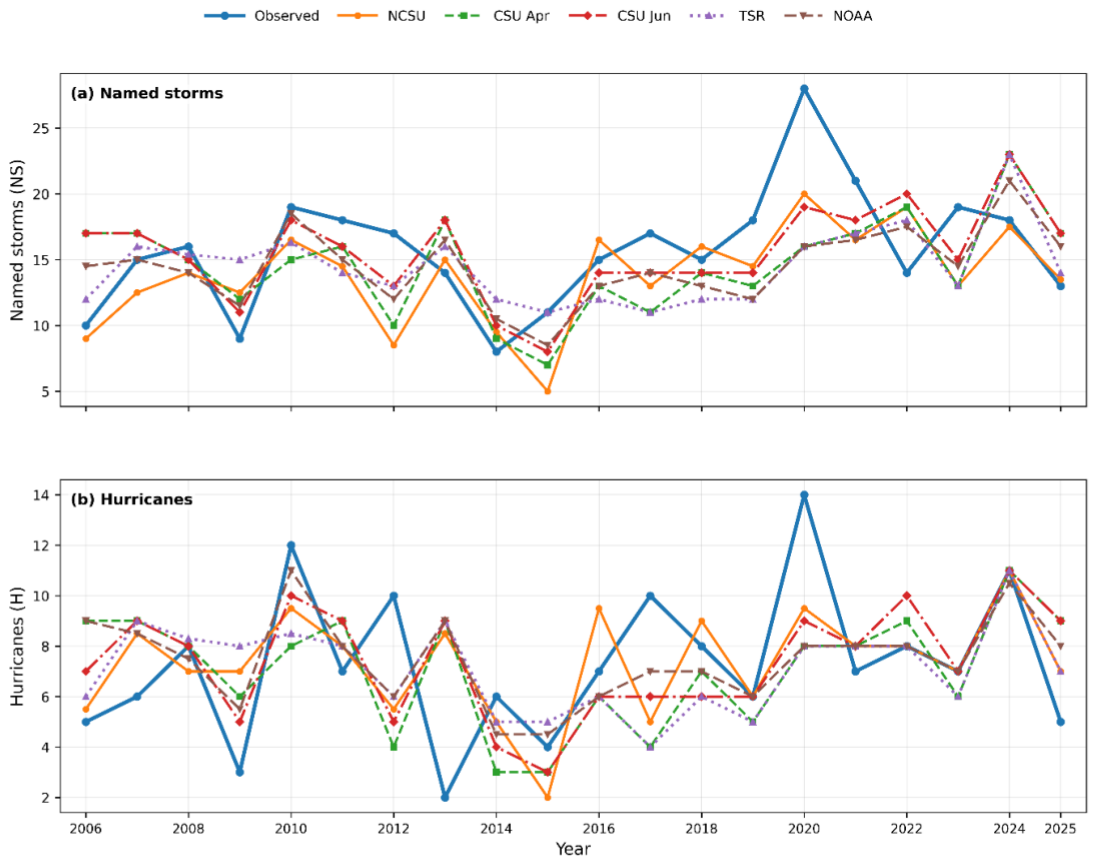
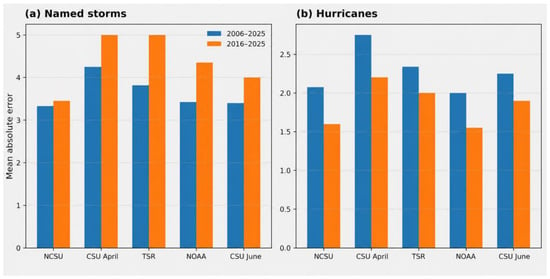
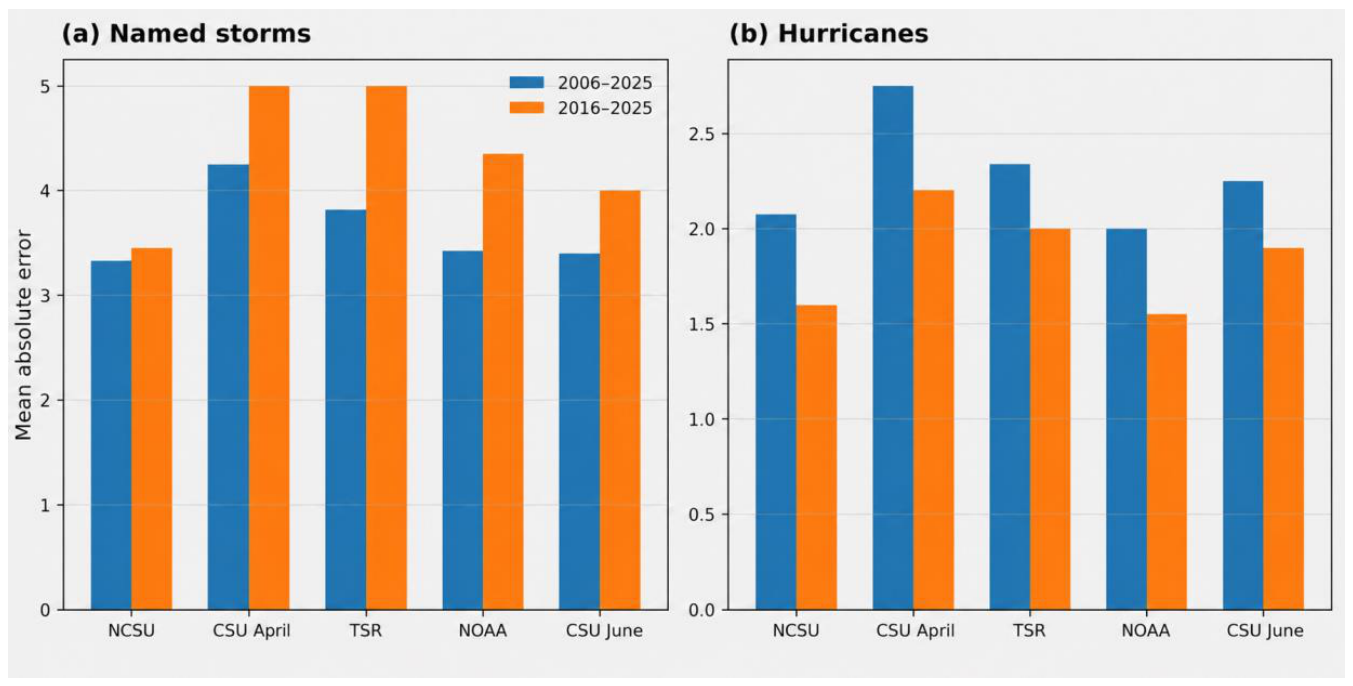
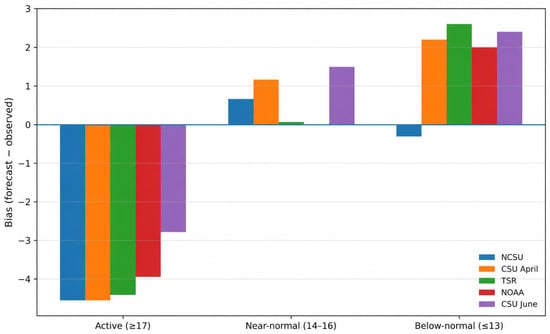
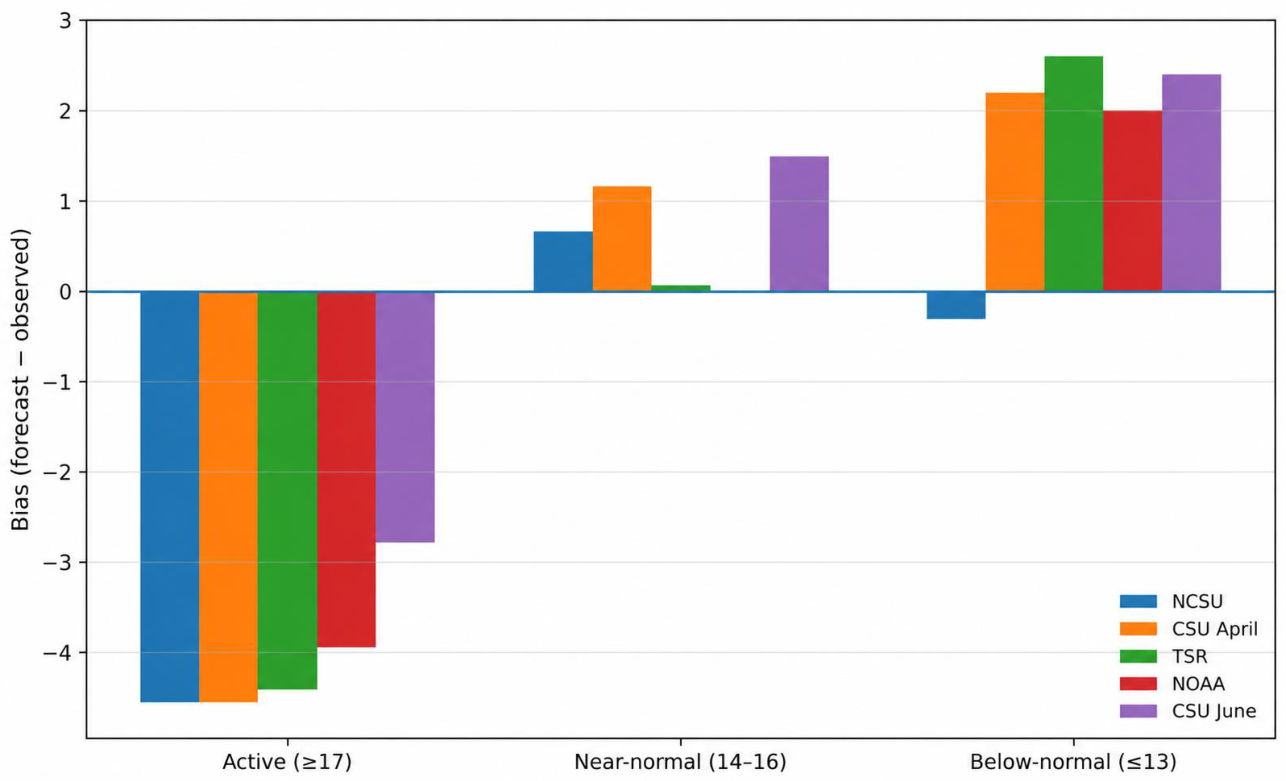
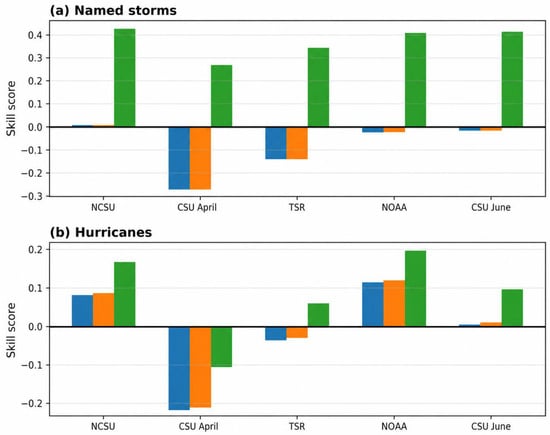
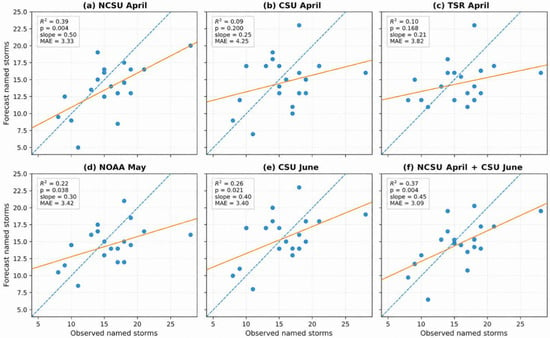
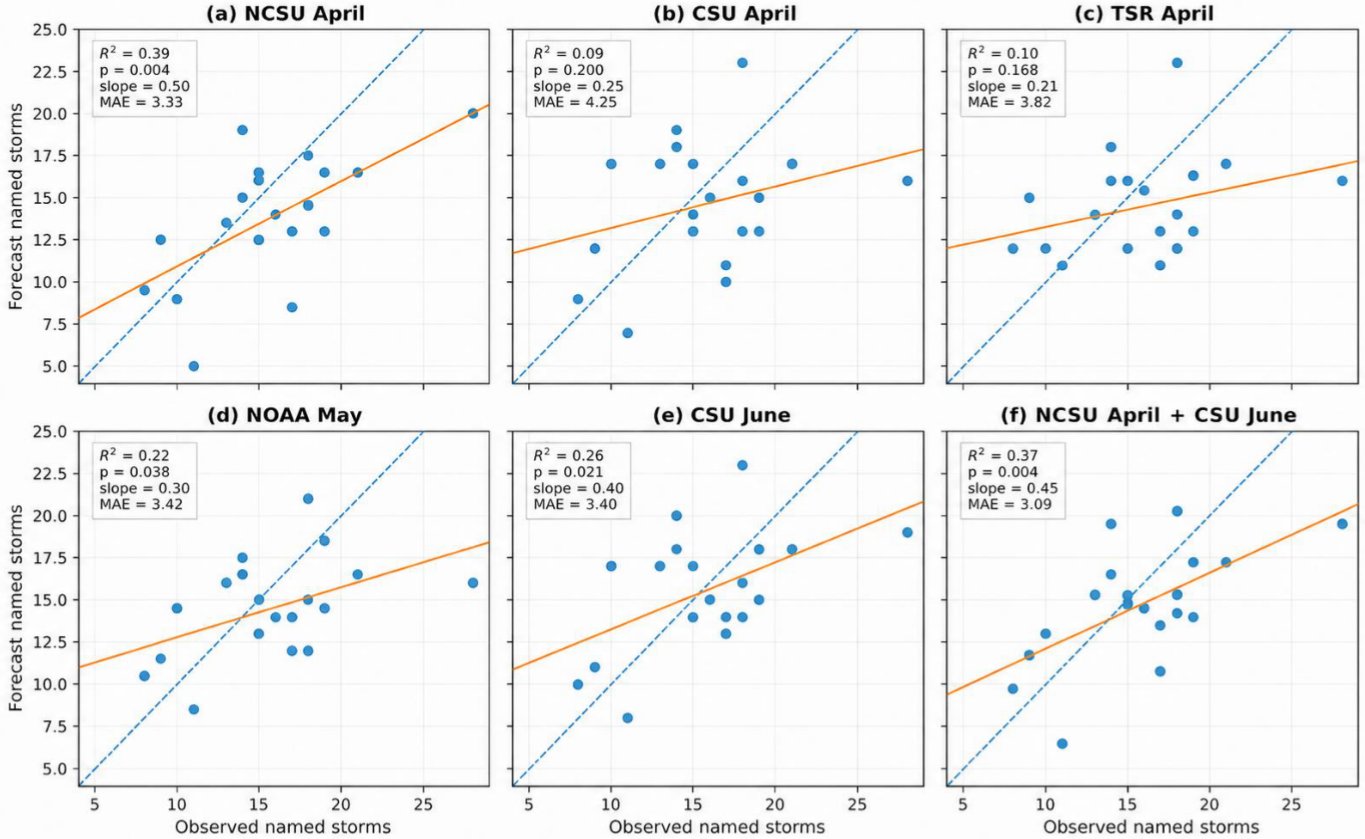
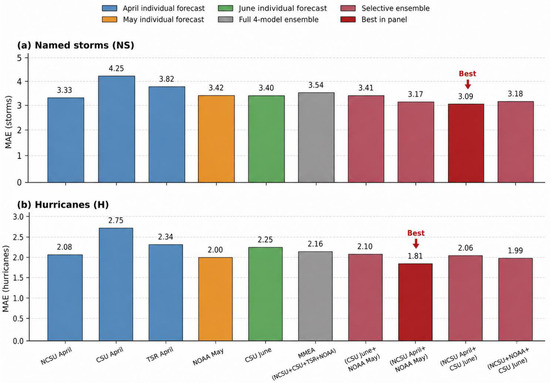
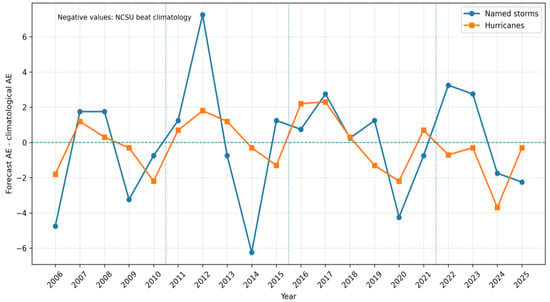
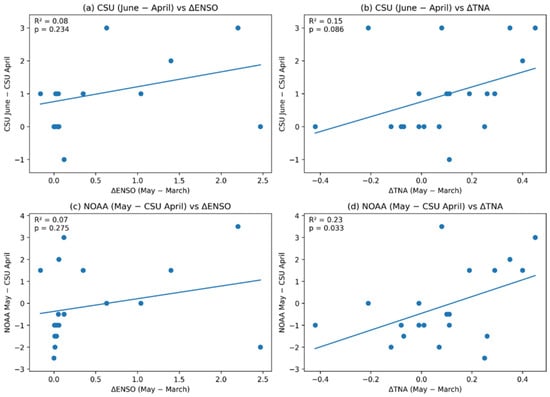
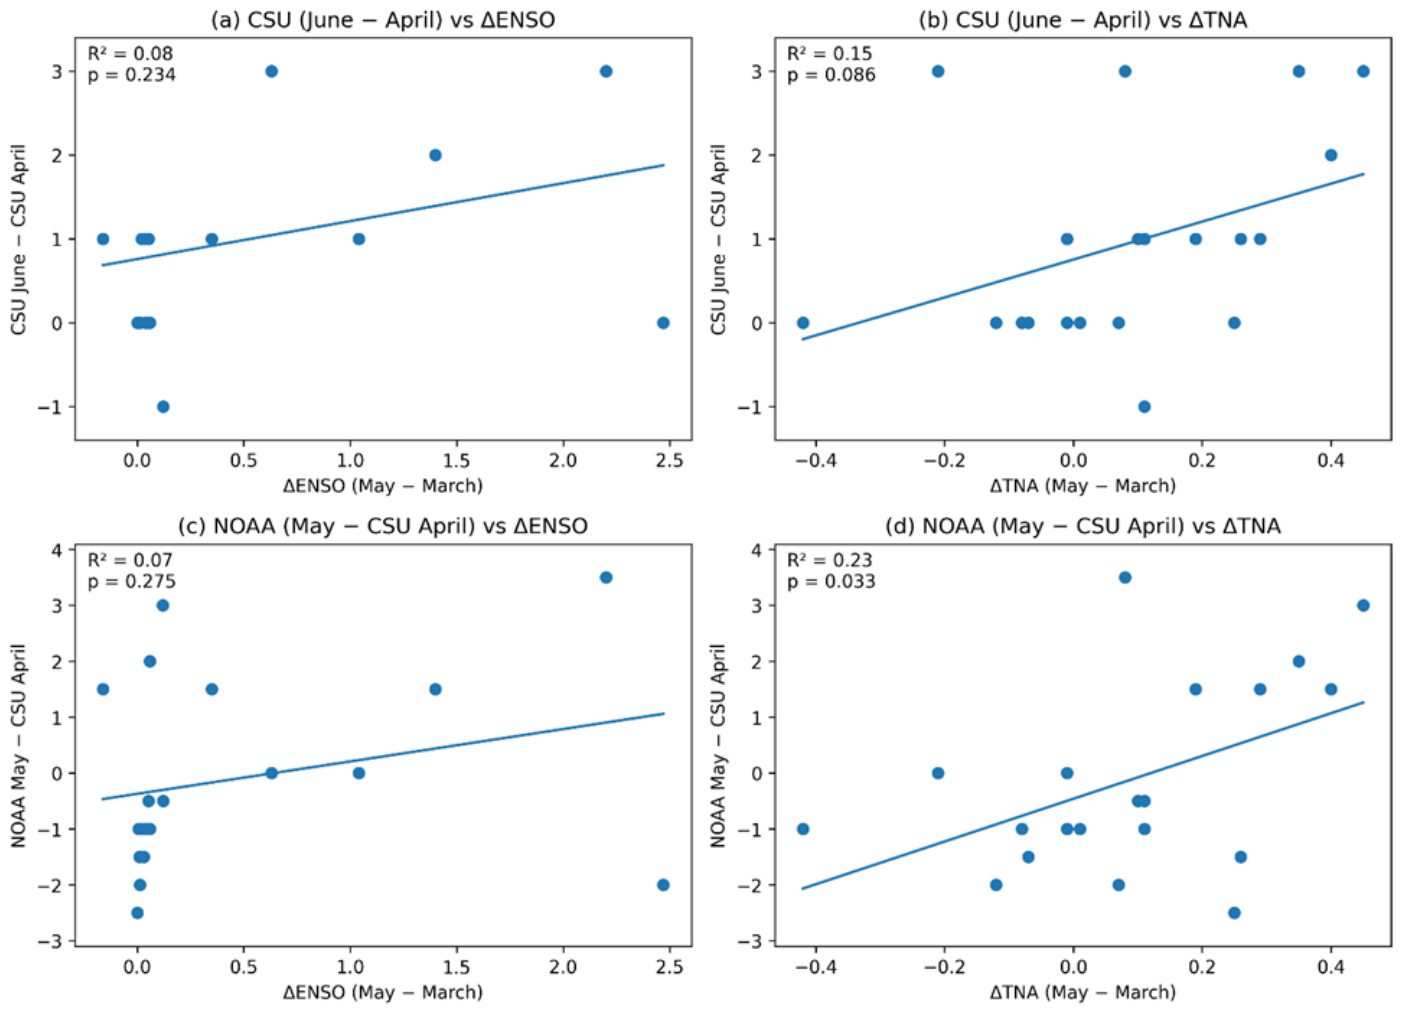

Disclaimer/Publisher’s Note: The statements, opinions and data contained in all publications are solely those of the individual author(s) and contributor(s) and not of MDPI and/or the editor(s). MDPI and/or the editor(s) disclaim responsibility for any injury to people or property resulting from any ideas, methods, instructions or products referred to in the content. |
© 2026 by the author. Licensee MDPI, Basel, Switzerland. This article is an open access article distributed under the terms and conditions of the Creative Commons Attribution (CC BY) license.