


Highlights
What are the main findings?
- Spatially explicit metrics improve models’ capability to detect daily SWE changes.
- Snow water equivalent deviates from a 35-year baseline between 2009 and 2018.
What are the implications of the main findings?
- Snow decline in January and February could threaten the Great Lakes ecosystems.
- Snow-dominant months are shifting, compressing the winter season length.
Abstract
Snow water equivalent (SWE), the amount of water that will be liberated when a given snowpack melts, is considered an essential climate variable. Snowmelt drives annual run-off in snow-dominant basins. However, detecting daily SWE changes in lake-effect snowfall regions such as the Great Lakes Basin (GLB) is challenging with classical methods. We developed a Siamese U-Net (Si-UNet) model to detect and characterize daily changes and trends in SWE. Our Si-UNet detected daily changes in SWE over the GLB with an F1-score of 98.73%. To characterize the basin-wide extent of anomalies in SWE distribution, we compared SWE trends to a 35-year median (35YB) baseline and identified decadal trends in SWE. We found that the period from 1989 to 2008 was the temporal window with minimal anomalies, compared to the 35YB of ~0.5108. Positive deviations from the 35YB were prevalent over these 20 years, indicating less significant daily changes. A significant shift to daily SWE similarity below the 35YB occurred after 2009, especially in January and February. Daily changes in SWE were high in April, beginning in the second week. The strongest positive trend, likely associated with lake-effect snowfall, was observed in April 2000 (R2 = 0.47).
1. Introduction
The Great Lakes Basin (GLB) is one of the most populated watersheds in North America, with an estimated population of approximately 40 million people. About 63% and 37% of the population live in the U.S. and Canada, respectively [1]. Snow is crucial for sustaining the ecosystems’ and human communities’ overall well-being in the GLB [2]. Snow covers a pronounced proportion of the Canadian landmass during winter [3], and produces water that recharges groundwater resources and freshwater ecosystems and contributes to irrigation [4,5].
Snowfall modulates lake ice levels by forming thicker snowpacks [6,7]. Lakes without seasonal ice cover experience high air temperatures [8]. Snow cover also influences soil temperature, soil freezing and thawing processes, and permafrost formation, with a profound impact on carbon and hydrological cycles, especially in the cold regions [9,10]. The timing, duration, accumulation, and melting processes of seasonal snow cover dictate its impacts on the Earth’s thermal regime [9]. The rate and timing of snowmelt affect runoff, which in turn influences plant-available water storage [11]. Rapid fluctuations in snow depth during the winter influence soil temperature and moisture, leading to varying patterns of soil respiration [12]. Increased snowmelt may result in soil attaining field capacity rapidly, stimulating below-root zone percolation and streamflow, whereas slower snowmelt may decrease streamflow [13,14]. For example, using hydrological model simulations and a new snowmelt tracking algorithm, it was shown that although 37% of precipitation falls as snow, 53% of the total runoff in the western United States emanates from snowmelt [15].
The winter climate over North America, driven by both climate-induced events and natural atmospheric cycles (e.g., Pacific Decadal Oscillation and El Niño Southern Oscillation), is changing in unpredictable ways [16]. Diverse variables, including temperature, precipitation, and snow–albedo feedback, influence snow cover [17,18,19,20,21]. However, climate-induced variables portend the most detrimental effects, causing a shift in storm tracks with predictable consequences on the snow regime [22]. Climate warming is projected to exacerbate changes in snow parameters, snow onset and retreat periods, with unpredictable impacts on the Great Lakes water levels and the viability of its ecosystems [23]. The Great Lakes region experiences local precipitation bands, elevated convection, and lake effect snow bands, which enhance snowfall events [24]. Despite the prevalence of lake-effect snowfall, under high greenhouse gas emission scenarios, snow water equivalent (SWE) is projected to decline in the snowbelt regions to the lee of Lakes Erie and Ontario [25].
Rapid snowmelt, driven by factors such as rain-on-snow, reduces the formation of snowpacks and increases the risk of flooding [26]. Thus, detecting changes in snow parameters is an important piece of information for managing water resources as well as planning and adapting to climate change impacts, yet the relationship between seasonal snow and climate variables is uncertain and non-linear, complicating SWE trend analysis [27]. Additionally, detecting and attributing changes in snow over the GLB is not a straightforward task due to the spatially heterogeneous nature of snow ablation processes [28]. Kunkel et al. [29] further emphasized that non-climatic factors complicate the identification of significant change and trends in snow variables. Therefore, methods that are invariant to stochastic internal variability and seasonal patterns of snow spatial structure are crucial for obtaining accurate estimates of changes in snow parameters.
Under climate change, large-scale losses of snow are projected, raising considerable concerns over future freshwater resources, especially in snow-dominated watersheds, where snowmelt has profound effects on streamflow dynamics [19,30,31]. Therefore, it is imperative to unravel how snow processes have transformed over recent decades and to do so at very high temporal resolutions to inform water resource planning and management and adaptation to natural hazards such as snowmelt-induced floods. The overarching objectives of this study are to (a) demonstrate Siamese UNet’s capability to detect basin-scale changes in snow parameters, (b) estimate daily changes in SWE at the watershed scale, and (c) characterize decadal trends and anomalies in SWE distribution over the GLB.
Snowfall Dynamics in the Great Lakes Basin
Synoptic-scale analysis provides evidence that the Great Lakes exert a strong influence on the patterns of snow accumulation and ablation (i.e., lake-induced snowfall) [32,33,34]. Although lake-effect snowfall is known to drive an increase in the snowfall/snow water equivalence ratio in the GLB, time series analysis of snowfall within lake-effect areas shows that this pattern likely began in the 1930s and ended in the early 1970s [35]. Lake-effect snowfall is found to increase snowfall in most regions of the Great Lakes. For instance, lake-effect snowfall near the Great Lakes was elevated from 1951 to 1980 [36]. In a related study, Burnette et al. [37] identified persistent upward snowfall trends in the lake-effect snowbelt areas of the Great Lakes region until the end of the century. Ellis and Johnson [35] also identified a 40-year upward trend in snowfall from 1930 to 1970, followed by less significant trends after this period.
Contrary to these trends, meteorological variables and weather types are becoming more favorable for snow ablation in the GLB; these include elevated air temperatures, southerly wind flows, less cloud cover, and increased liquid precipitation rates during the winter months [38]. Consequently, several studies have reported declining snowfall events in the GLB. For example, seasonal basin-wide snow depth was found to have declined by approximately 25% from 1960 to 2009, especially in the northern part of Lake Superior [39]. In a related study, analysis of snowfall and total precipitation trends over the Great Lakes from 1980 to 2015 revealed a significant decrease in snowfall at a rate of 40 cm/36 years, along the Ontario snowbelts of Lake Superior and Lake Huron–Georgian Bay [40].
Kunkel et al. [41] presented a 107-year analysis of snow trends over the conterminous United States and found that from 1950 to 2006, snow trends in the central and northwest U.S. regions experienced significant declines in high–extreme snowfall years, while four regions (i.e., Northeast, Southeast, South, and Northwest) showed significant increases in the frequency of low–extreme snowfalls [41]. Snowfall and total precipitation trends were derived for the GLB from 1980 to 2015, revealing a significant decrease in snowfall, at a rate equivalent to 40 cm/36 years, and a considerable reduction in total precipitation of 20 mm/36 years, especially in Lake Superior and Lake Huron–Georgian Bay along the Ontario snowbelts [40]. Furthermore, extreme daily snowfalls have been found to shift northward, with large daily changes occurring along the US–Canada border [42]. These findings are corroborated by snow projections in Central and Eastern North America, affirming a decline in extreme snowstorms southward, while the northern regions experience increased snow water equivalent and frequency of snowstorms [43]. In addition, declines in mean annual SWE, high frequency of low-snowfall years, and less frequent high-snowfall years were projected for the western United States [44]. Furthermore, in western North America, annual snow water storage was reported to have decreased from 1950 to 2013 as a consequence of early snowmelt, rainfall in spring months, and decreases in winter precipitation [45].
Despite these consistent findings, Kunkel et al. [29] point out temporal inconsistency and inhomogeneity in the data employed to conduct most of these analyses and call for the use of more homogeneous datasets. For instance, using a set of consistent station data, an upward trend in snowfall was identified in Lake Superior and Michigan basins, largely attributable to warmer surface water and less ice cover [33]. This suggests that gridded snow data hold the potential for a more enhanced and spatial-temporally continuous representation for studying snow. For example, the Snow Data Assimilation System SWE was employed to model snow processes for climate-related water resource studies in the Great Lakes watersheds [46] and stream flow in eastern Canadian basins [47]. Additionally, most studies relied on implementing simple linear regression and change-point analysis after standardizing the raw snow data and comparing long-term mean values with those of adjacent stations [35,38,41]. Baijnath-Rodino [39], on the other hand, conducted regression with a non-parametric Mann–Kendall test to mitigate outlier effects. While these methods have been used to successfully detect long-term changes and trends (e.g., monthly and yearly) in snow properties, detecting daily changes presents challenges related to spatial resolution and uncertainties in SWE retrieval methods. Malik et al. [48] highlight these fundamental drawbacks and propose adopting deep learning and computer vision metrics for change detection.
2. Materials and Methods
2.1. Study Area and Data
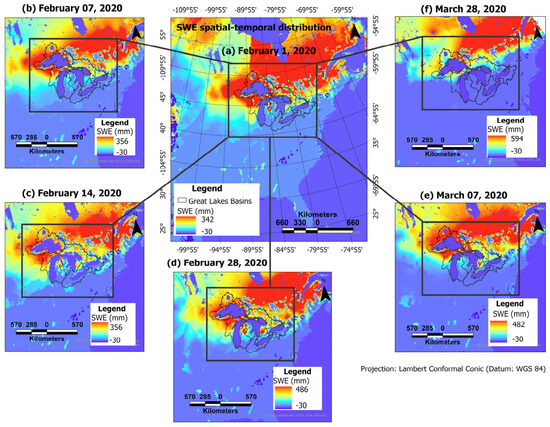
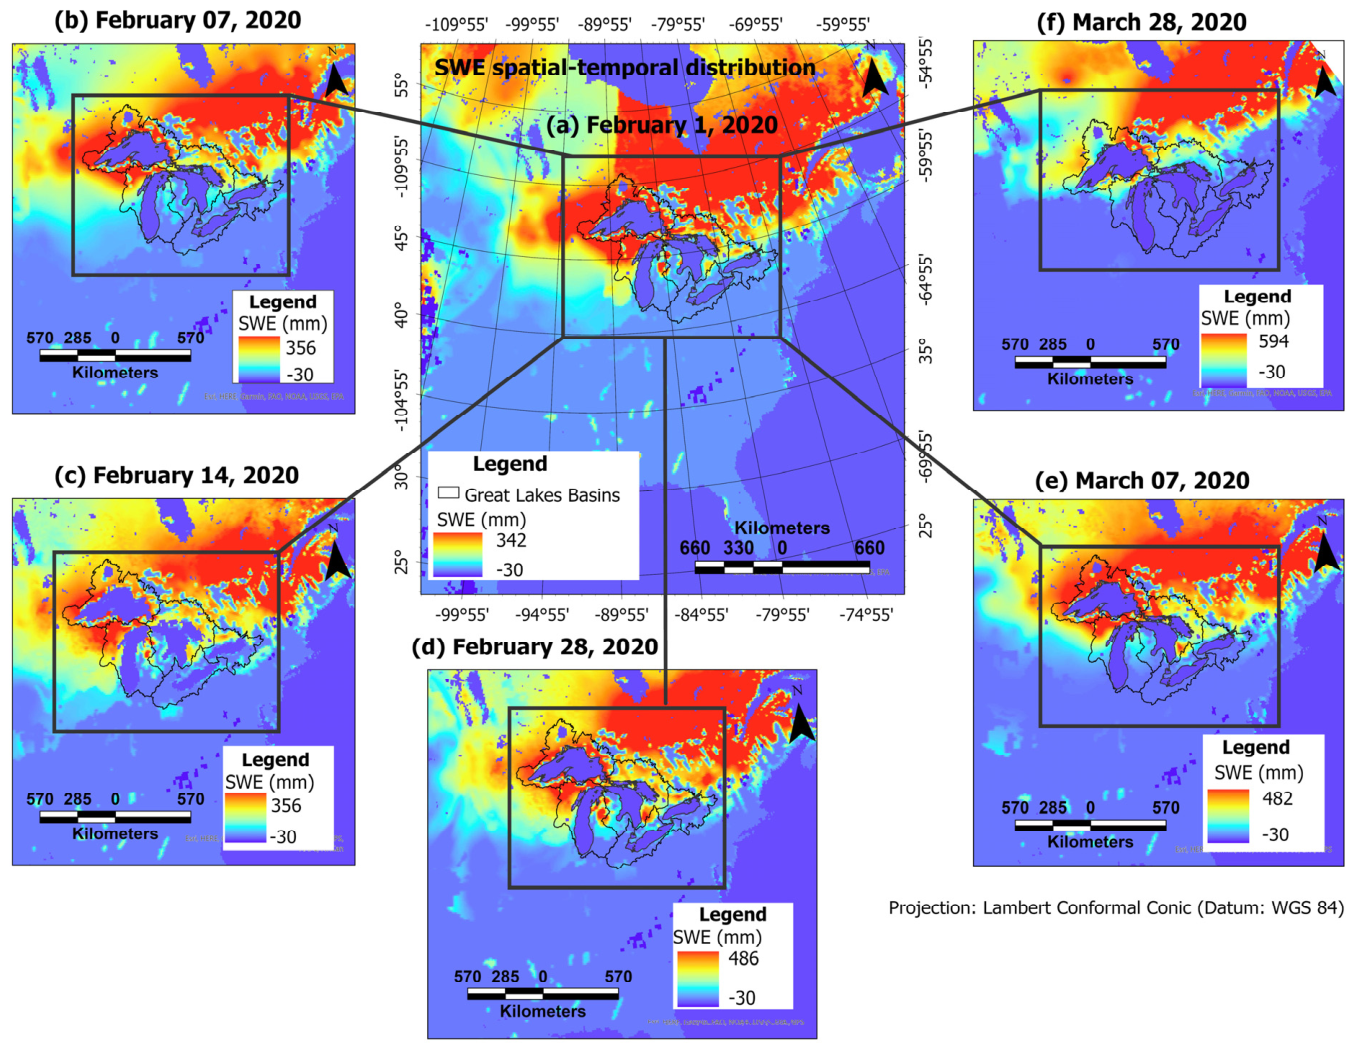
Our study area covers the five Great Lakes and their watersheds. Using the ArcPy Package in ArcGIS Pro version 3.6, the GlobSnow SWE data was clipped to a spatial extent encompassing 72 × 72 pixels. The GlobSnow’s SWE has a spatial resolution of 25 km × 25 km, covering an area of 1800 km × 1800 km, given the spatial extent of 72 × 72 pixels. This area encapsulates the GLB and its surrounding ecosystems. We reprojected the data, adopting an Equal Area Projection (e.g., Lambert Equal Area Projection) to maintain the original grid area. Figure 1 depicts the SWE distribution in early, mid, and late February and March over the GLB in 2020. The northwestern part of the GLB, corresponding to the Lake Superior basin, can be seen to have relatively elevated levels of SWE in February. A northward shift in SWE can be observed between February and March. This gradual transition is indicative of the end of the winter season in the GLB. Negative values denote land, mountains, and water bodies, as these are masked from GlobSnow SWE data products.
Figure 1.
The GLB SWE spatial variability in February and March 2020. Lake Superior watershed shows elevated levels of SWE throughout February, peaking on 28 February and declining substantially on 28 March as snow cover retreats northward. The irregular dark lines demarcate the Great Lakes’ sub-basins. Land, ocean/water, and mountains are coded with negative values because they are masked from the GlobSnow’s SWE data.
2.2. Training Sample Processing and Labeling
We labeled the training data following the methods illustrated in Malik and Colin [48]. Thus, SWE samples at one-day intervals were labeled as positive (No Change), whereas SWE observations that were two or more days apart were labeled as Change instances. We deployed a spatially explicit metric—the Structural Similarity (SSIM) index—to inspect and exclude ambiguous training examples using 0.98 and 0.90 as thresholds for positive pairs (No Change instances of SWE) and negative pairs (Change instances of SWE), respectively, as shown in [48]. For model development, we used data from 1979 to 2001. The training and validation data splits were 75% (training set) and 25% (validation set). Independent validation consists of data from 2002 to 2018. We separated the data into seasons or months and evaluated the model’s performance across seasons.
2.3. Siamese U-Net Architecture and Training
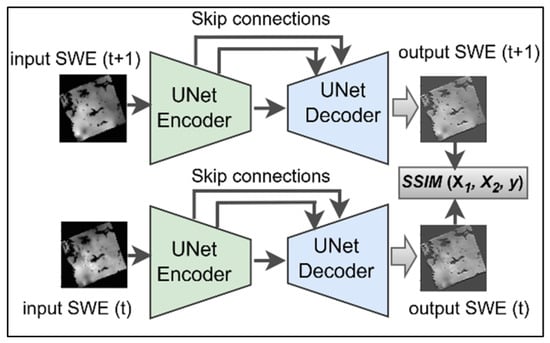
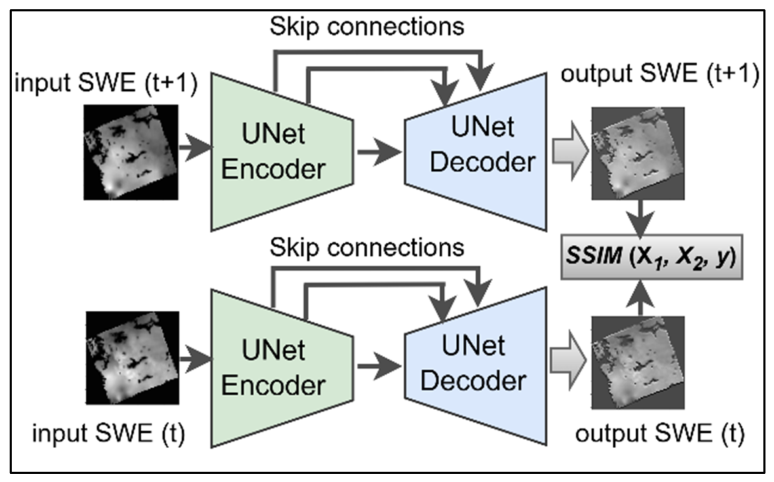
Our model architecture, with the SSIM index combination, is simplified and depicted in Figure 2. The model receives 72 × 72 pixels of SWE data and outputs the same spatial extent at the Decoder branch. Using the SSIM index, the resulting outputs from the two sister decoders are compared, focusing more on changes in the spatial structure of SWE. The computed similarity value is passed to a loss function for error estimation and optimization during model training. An exhaustive description of this learning paradigm is outlined in [48,49]. The model is trained using the Keras–Tensorflow framework with NVIDIA GPU of 40 GB. Fifty epochs were used with Early Stopping applied; the patience parameter of 10 was set to stop training if the model’s performance failed to improve after 10 consecutive epochs. Drop-out, batch-normalization, and ReLU activation function were applied.
Figure 2.
Siamese UNet model. The decoders in both branches receive daily SWE as inputs; the corresponding outputs and are compared by computing their similarity using the SSIM index, which exploits changes in the spatial structure of SWE.
2.4. The SSIM Index and Loss Function Combination
The expression for the SSIM index, proposed by Wang et al. [50], is given below.
represent the average value of a set of pixels in a moving window (e.g., 3 × 3) of images to be compared—x and y, respectively; , respectively denote the variances of x and y, while is the covariance term; and are constants to stabilize the metric [48]. The covariance component encodes structural similarities in SWE.
The SSIM index expression is simplified as follows:
The learning paradigms for Binary-Cross Entropy (BCE) and the contrastive loss function are designed to attribute high scores to data pairs that are closer by distance, while reducing the scores of distant data pairs. Consequently, the learning paradigm is similar for both loss functions;, however, for the contrastive loss, a margin parameter m must be selected, sometimes heuristically. The SSIM index value from the Decoder branches is passed through a sigmoidal neuron, yielding a logit, which then goes through the loss function. The BCE is formulated as shown below:
where N, Y, and p denote sample size, image labels, and probability of SWE image pairs being positive (No Change) or negative (Change), respectively. The probability term is estimated as , using a sigmoid activation function.
The contrastive loss function is expressed as follows:
where represents contrastive loss and margin parameter, respectively; denote a pair of SWE images, and is the image labels. For positive pairs (No Change SWE), (i.e., ), and for negative pairs (Change SWE), (i.e., ). The index for each of the output SWE images from the network’s sister decoders is denoted by i and j (i.e., the ith and jth regenerated SWE). The SSIM’s upper bound is 1; thus, a margin parameter aligns with the SSIM. Intuitively, adopting a margin parameter of 1 makes the BCE learning paradigm algorithmically related to the contrastive loss.
Thus, when , and given that the model’s prediction is correct, the loss reduces for both BCE and the contrastive loss function. Conversely, the model’s losses will increase if the prediction turns out to be false.
2.5. Model Accuracy Metrics
To assess the model’s accuracy on the prediction of No Change versus Change instance of SWE, we adopted the metrics true positive rate (TPR), true negative rate (TNR), false positive rate (FPR), false negative rate (FNR), Precision (PR), F1 score, and overall accuracy (OA) to assess the models’ prediction of SWE similarity and change.
TPR measures the proportion of SWE samples that are correctly predicted as No Change instances; TNR, on the other hand, estimates the fraction of SWE samples that are accurately detected to be Change instances. Thus, FPR = 1 − TNR and FNR = 1 − TPR. Equations (1)–(5) represent the accuracy metrics. Area Under the Curve of the Receiver Operating Characteristics (AUC-ROC) was also derived to examine TPR and FPR over a range of thresholds.
2.6. Deriving the Daily Snow Water Equivalent Similarity Vector
To estimate daily SWE change events, the pre-trained Si-UNet, after rigorous accuracy assessments, can be employed to make predictions over a series of SWE observations, generating a time-series vector consisting of similarity values between consecutive days. High similarity values are indicative of less pronounced changes; contrarily, low similarity values characterize profound changes in SWE. We formulate the solution as illustrated in [49,50]. The SWEsim vector, which represents daily SWE similarity, is derived using Equation (10) to accumulate the daily SWE similarity values.
where t and m represent day and month, respectively. Accordingly, denotes SWE sampled on the ith day. The model term in the equation denotes the Si-UNet.
Using the SWEsim vector, we derived long-term median SWEsim from 1981 to 2016 to compare deviations in SWE over 35 years (Equations (7) and (8)). We refer to this median as a 35-year baseline (35YB). Deviations from 35YB will be indicative of anomalous SWE trends at basin scales.
3. Results
3.1. Model Accuracy Assessment Report
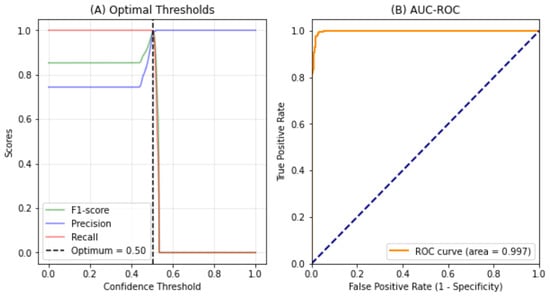
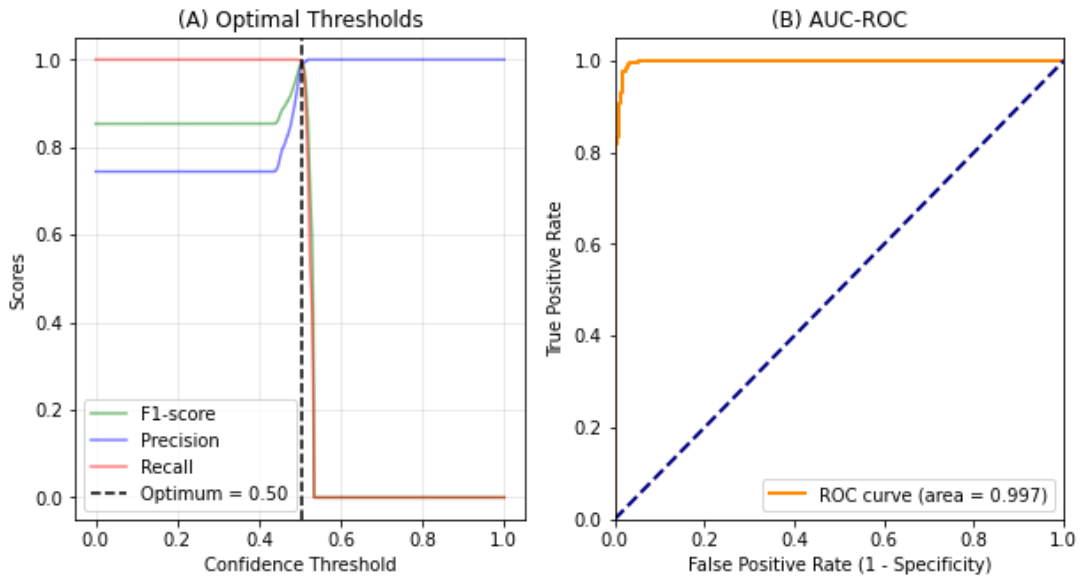
Figure 3A presents F1-score, Precision, and Recall, showing the thresholds at which they approach optimum. The y-axis denotes the scores for each of these accuracy metrics, whereas the x-axis represents a range of possible confidence thresholds for the model’s predictions of SWE similarity. Increasing the threshold value is expected to improve the model’s accuracy until a certain tipping point, beyond which the accuracy begins to degrade; this critical point is the optimum value for maximizing the model’s prediction accuracy. It can be observed that the F1-score, Precision, and Recall appeared to be constant as the threshold parameter varied, until 0.45, where it began to rise steeply. All the accuracy metrics reached their optimal values at a threshold of 0.5. The F1-score and Recall dropped to 0 when the threshold exceeded 0.5. Contrarily, the false positive predictions reduced to near zero, resulting in Precision scores rising to 1.0 after a 0.5 threshold. The AUC-ROC is depicted in Figure 3B. The AUC-ROC compares TPR and TNR using a set of threshold values from 0 to 1. It can be noticed that the AUC-ROC started at 0.8, increased gradually to 1.0, and remained at that level across the range of possible thresholds, resulting in an area (i.e., AUC) of 0.997 or 99.7%.
Figure 3.
Model’s confidence threshold and AUC-ROC. Optimal score for F1-score, precision, and Recall (A), and (B) AUC-ROC for TPR and FPR. The model’s accuracy is optimal at a threshold of 0.5, while the AUC-ROC shows near-perfect model performance (AUC = 0.997), where the dashed diagonal line represents random guessing (baseline).
We compared the accuracy of our proposed Si-UNet to the CNN baseline, using the SSIM index and Euclidean Distance (ECD) metric. Further, we investigated the performance of the models given a choice of loss functions—binary cross-entropy loss (BCE) and contrastive loss (CL). Table 1 presents a summary of the models’ accuracy. It can be observed that our model, with the CL and SSIM index, although having a narrow threshold value (i.e., 50%), tends to outcompete the other models, yielding an F1-score of 98.73%. The most challenging instances were the change-pairs (i.e., negative labels), resulting in a TNR of 92.82%. Surprisingly, the base CNN with ECD can be observed to excel at detecting instances of SWE change (TNR) with 99.44% accuracy; the model’s performance at detecting the No Change (TPR) instances tended to be the worst (92.84%), however.
Table 1.
Model accuracy reports.
3.2. Empirical Evaluation of Snowfall and Ablation in the Great Lakes Basin
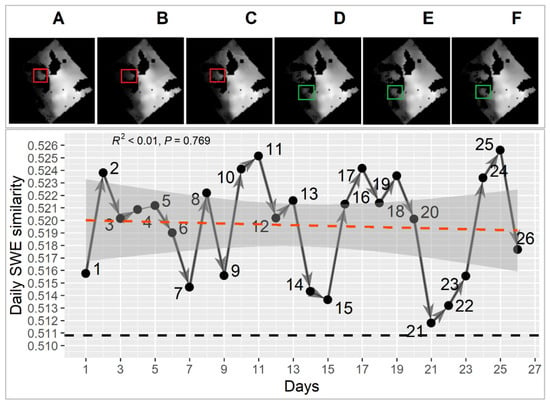
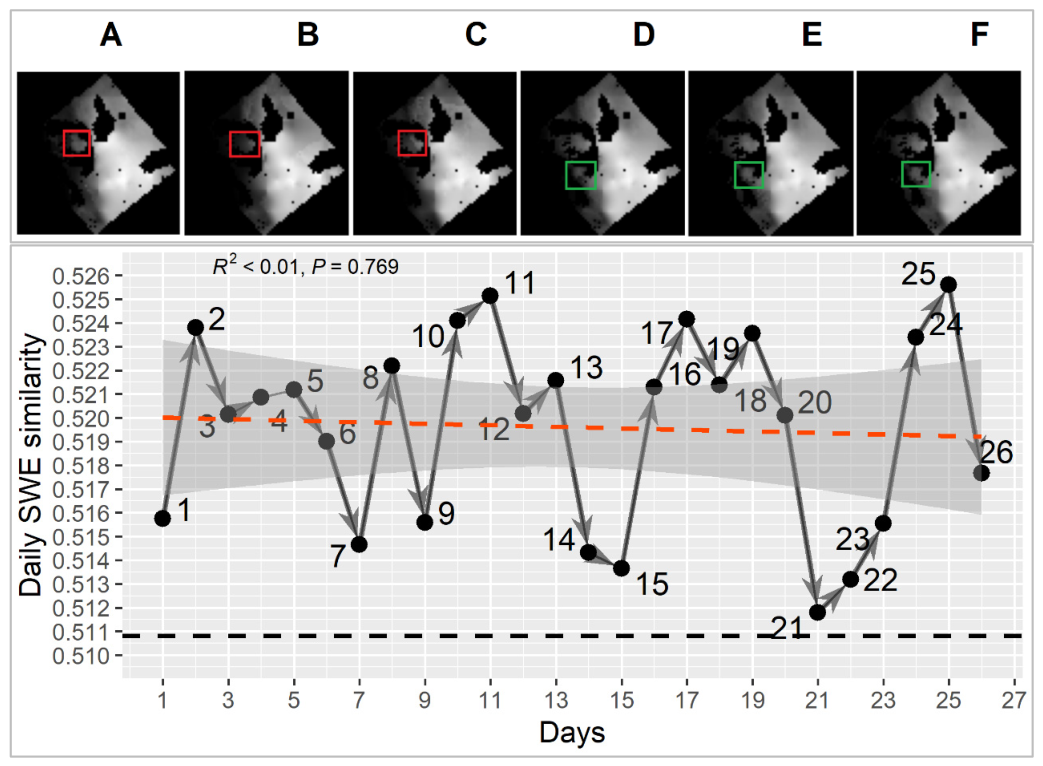
Our model identified three types of sequential snow-related events that create daily variation in SWE trends in the GLB. The first is an alternating increase in snowfall (i.e., snow accumulation) and decreases in snow on the ground (i.e., snow ablation). We termed this sequence a snowfall-ablation (SA) event. This yielded upward- and downward-pointing peaks that characterize sharp transitions between snowfall and ablation events. For example, on the graph in Figure 4, points 2, 11, and 25, corresponding to SWEsim values 0.523, 0.525, 0.526, represent days with pronounced snowfall, whereas points 7, 9, and 12, aligning with SWEsim 0.515, 0.516, 0.520, were days that experienced snow ablation. Upward peaks are associated with high SWE similarity, while downward peaks signify low SWE similarity. The second sequence type is snowfall-snowfall (SS), and the third ablation-ablation (AA). The SS is characterized by two or more consecutive days of snowfall, resulting in pronounced snow accumulation that increases snow depth and, predictably, the amount of SWE (Figure 4D–F). Conversely, AA events are 2 or more consecutive days of snow ablation, resulting in a substantial SWE reduction (Figure 4A–C). Both SS and AA events induce ridges or crests and troughs in daily SWE trends. However, crests are largely generated by SS events in snowfall-dominant months (e.g., January, February, and March), whereas AA events frequently induce troughs. Figure 4 depicts the three types of events, with arrows showing the monotonic pattern and direction of change. The most perceptible pattern (shown in the red rectangles) is SA events in the eastern wing of the Lake Michigan sub-basin. Also noticeable is the SS event in the northwestern part of Lake Ontario sub-basin (shown in the green rectangles). The dashed lines represent simple linear regression (orange) and the 35YB (black). The computed 35YB is ~0.5108, aligning closely with the No Change SWE instance (i.e., No Change SWE days for the Si-UNet model prediction). Thus, it can be observed that all the SWEsim values for February 1990 were above the reference 35YB, leading to a statistically insignificant SWE trend.
Figure 4.
Daily SWE trends over the GLB in February 1990: (A–F) depict observed SWE on days 19, 21, 22, 23, 21, 22, 23, 24, and 25, respectively, as shown on the graph. Superimposed on the trend line are the linear regression line (orange) and 35YB (dark line). Arrows denote the direction of AA, SS, and SA events. The red and green colored rectangles denote AA and SS events, respectively.
3.3. Great Lakes Basin Daily SWE Trends
We conducted Mann–Kendall (MK) tests and linear regression to ascertain daily SWE trends, magnitude, and direction. While linear regression provides the R2 for interpreting trends statistically, its parametric nature and potential sensitivity to outliers warrant using the Mann–Kendall test in tandem. Table 2 presents a sample of the tests carried out in each decade. We derive N, S, tau, and p-values from the MK test, while R2 is estimated from linear regression conditioned on the daily SWEsim vector. It can be observed that both tau and R2 agree on the significance and non-significance of SWE trends. For example, the MK correlation coefficient (i.e., tau) appeared to be negative in March 1998, April 2006, March 2018, and April 2018.
Table 2.
Mann–Kendall test and linear regression statistics.
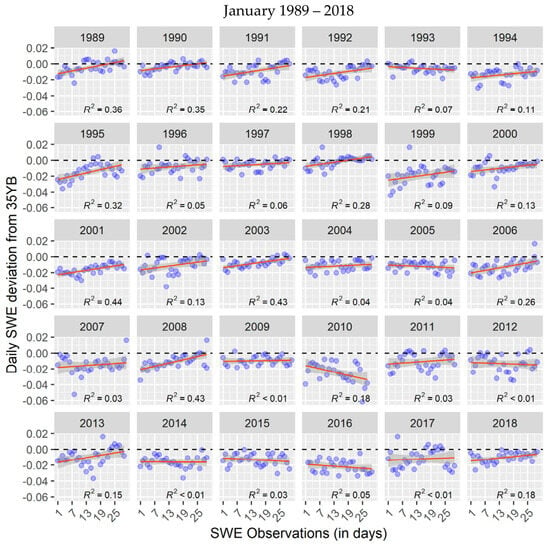
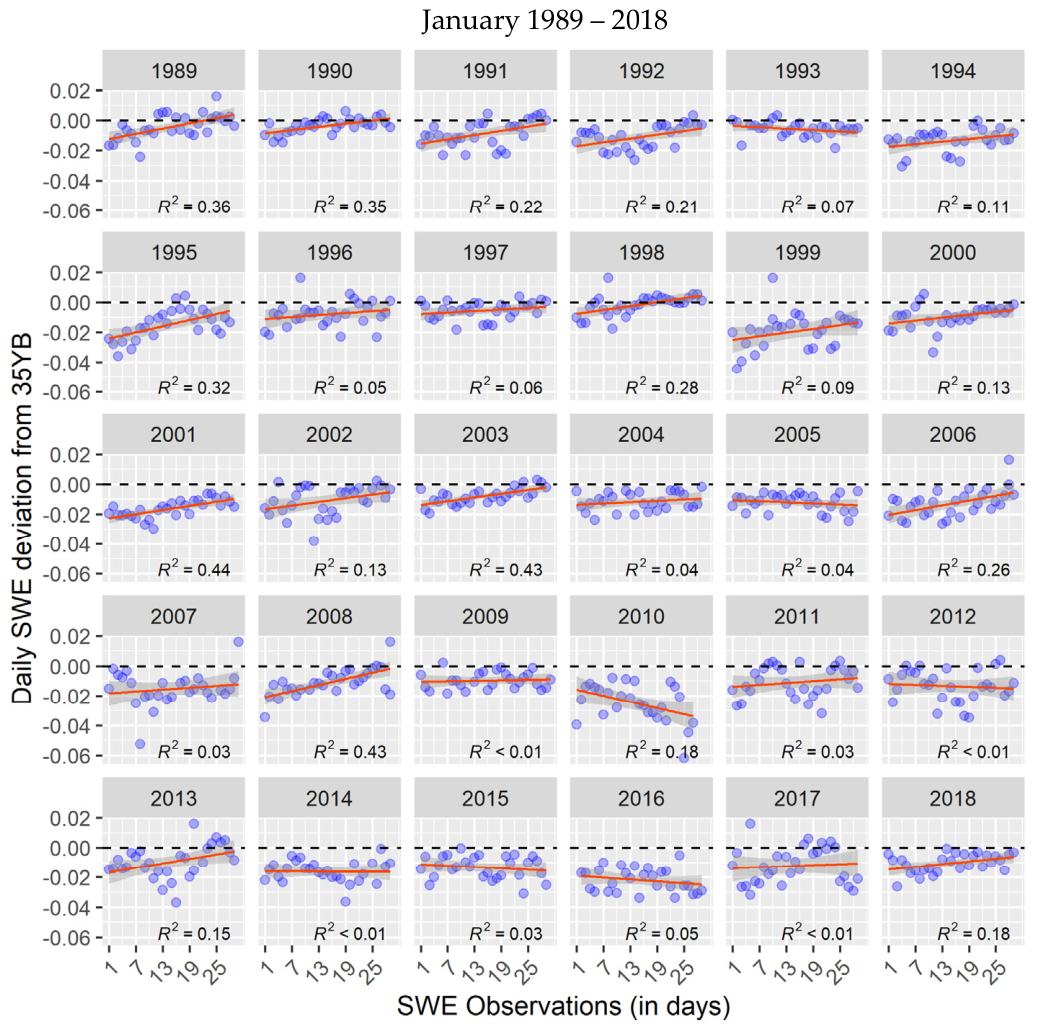
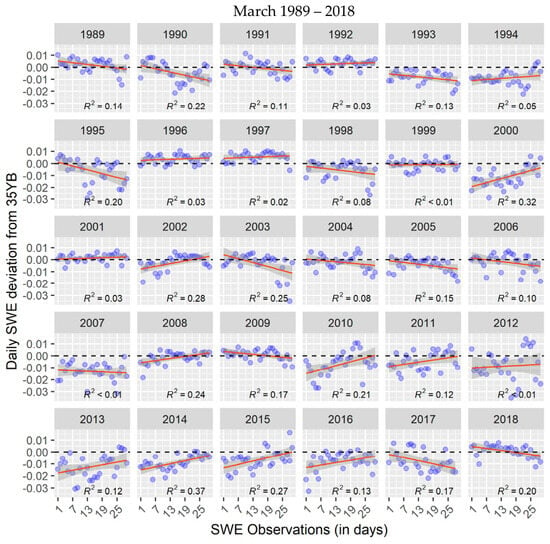
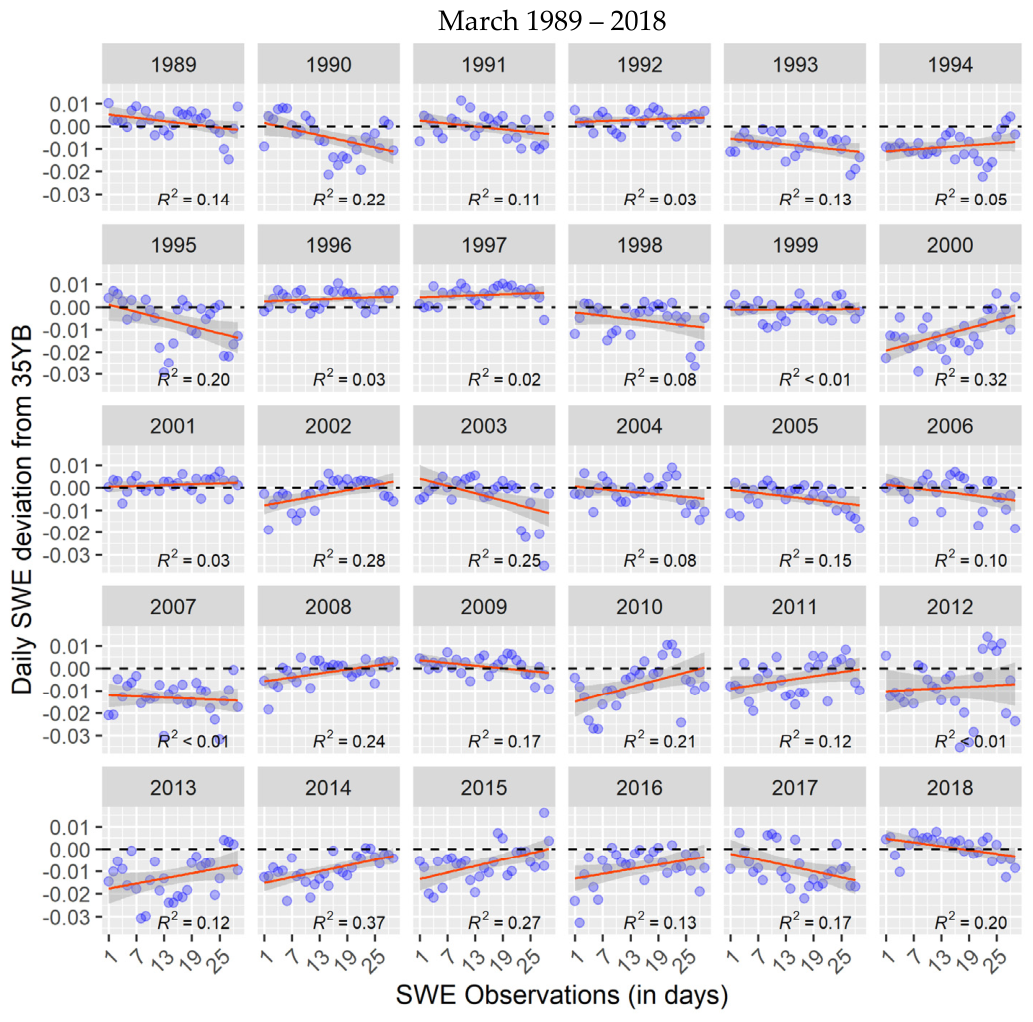
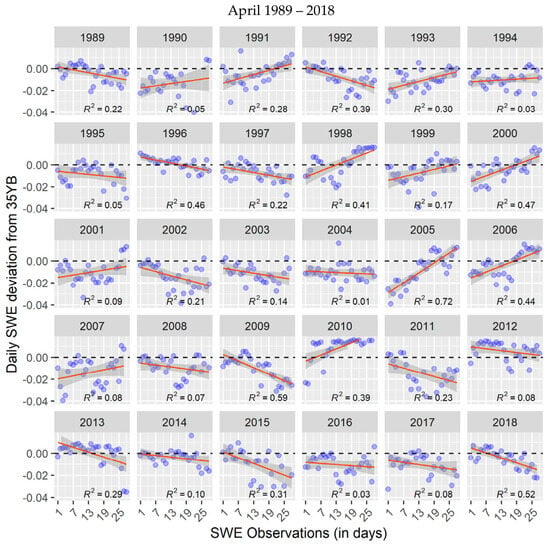
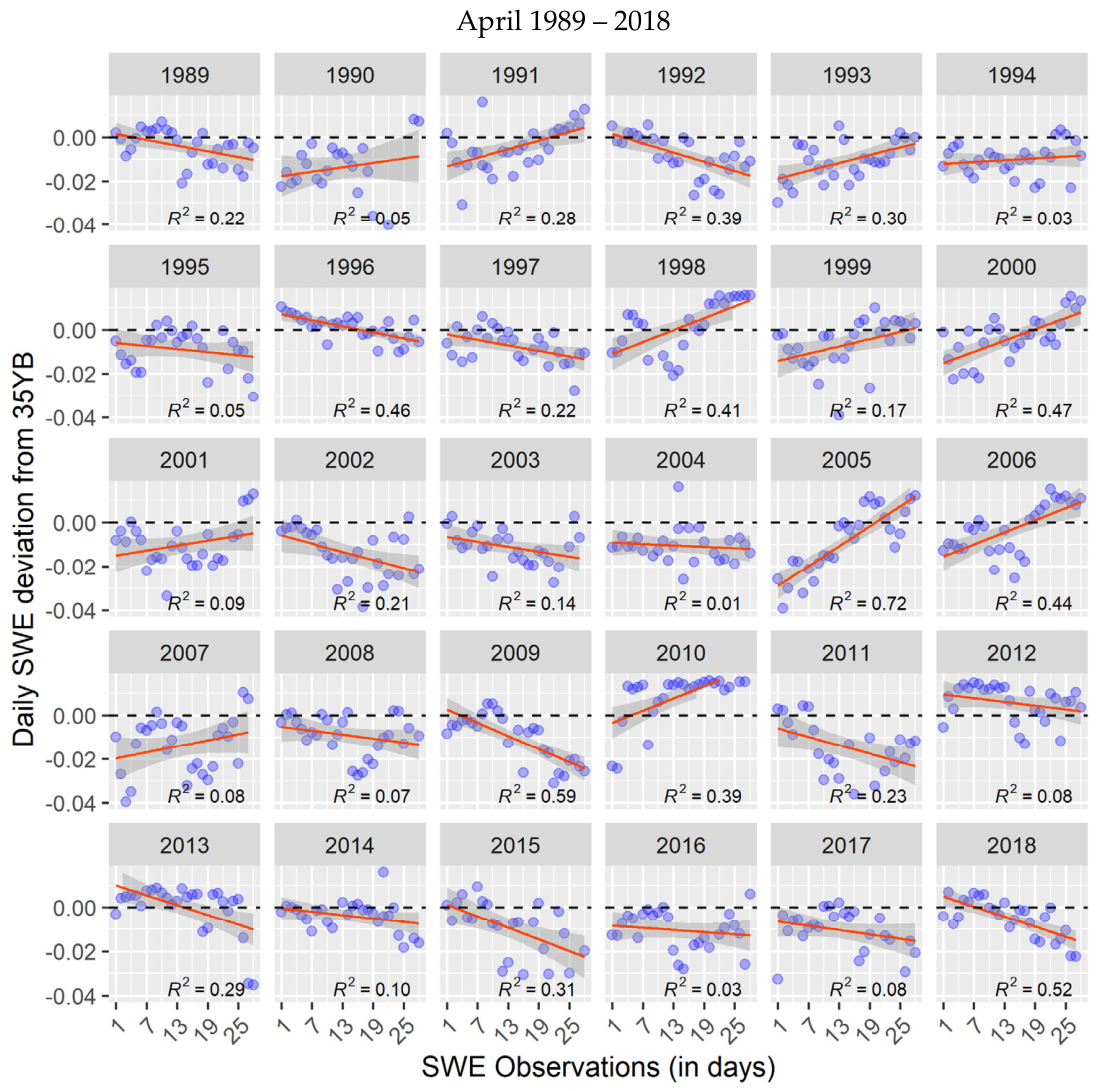
Using the vector, we present 30-year daily SWE similarity trends from 1989 to 2018 (Figure 5, Figure 6, Figure 7 and Figure 8). The y-axis and x-axis represent SWE deviations from 35YB and days, respectively. The blue dots denote daily variability in SWE, the dark lines mark zero deviation from 35YB, and the red lines are linear regression conditioned on the vector. Positive (i.e., positive SWE anomaly) and negative (i.e., negative SWE anomaly) deviations are values above and below the 35YB, respectively. Zero values, on the other hand, signify no deviation from the 35YB. Positive and negative deviations are largely associated with high and low SWE scenarios, respectively. Both deviation types are a function of snowfall and SWE reduction induced by ablation events.
Figure 5.
Daily changes in SWE from January 1989 to 2018. The blue dots represent daily SWE similarity, while the red lines are derived from linear regression using the SWEdiv vector. The dashed lines denote negative and positive SWE deviations from the 35YB.
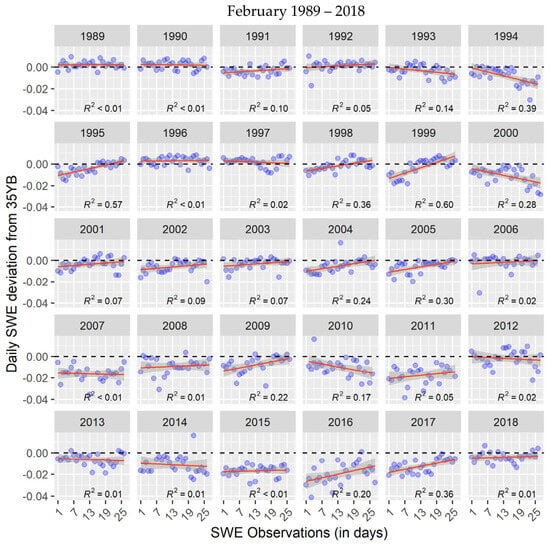
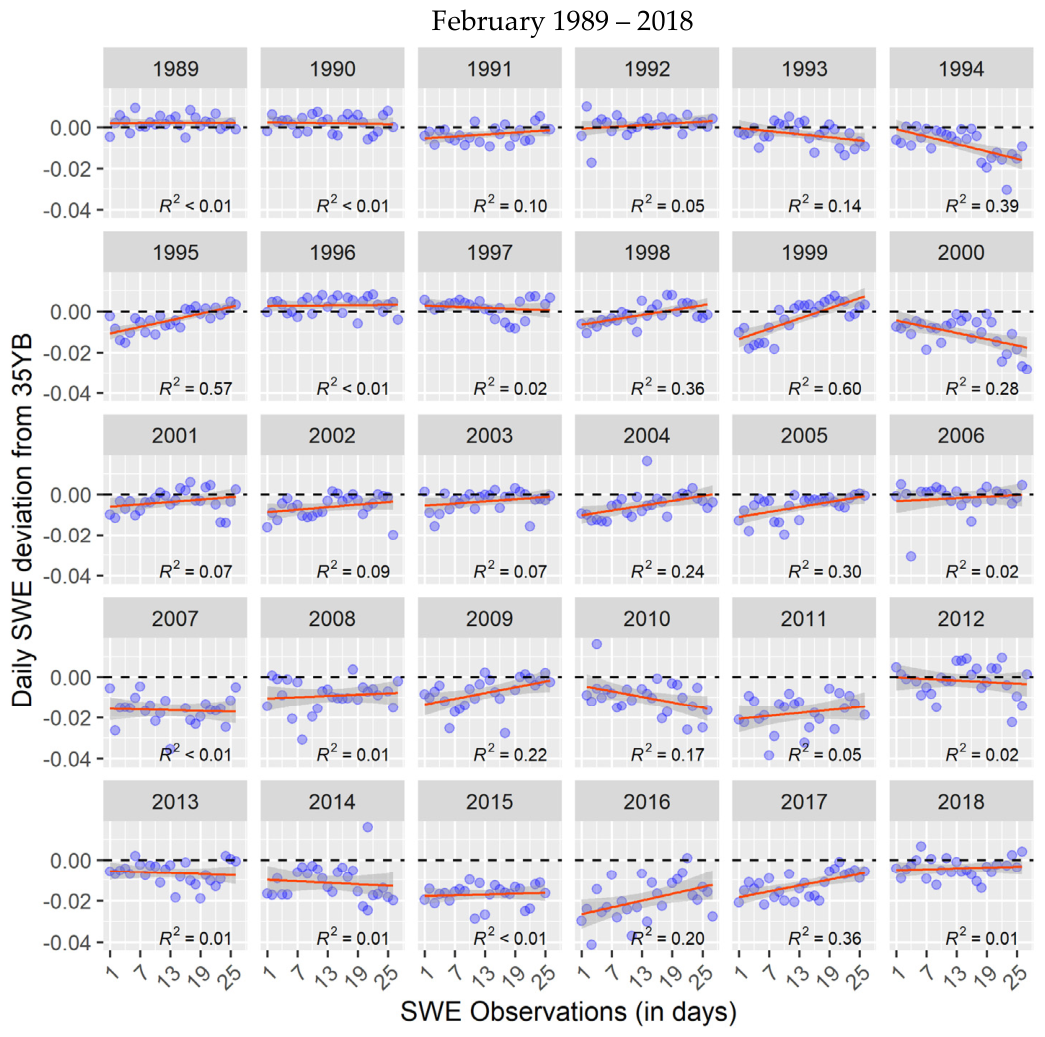
Figure 6.
Daily changes in SWE from February 1989 to 2018. The blue dots denote daily variability in SWE, and the red lines are linear regression derived from the SWEdiv vector. The dashed lines denote negative and positive SWE deviations from the 35YB.
Figure 7.
Daily changes in SWE from March 1989 to 2018. The blue dots denote daily variability in SWE, and the red lines are linear regression derived using the SWEdiv vector. The dashed lines denote negative and positive SWE deviations from the 35YB.
Figure 8.
Daily changes in SWE in April from 1989 to 2018. The blue dots denote daily variability in SWE, and the red lines are linear regression derived using the SWEdiv vector. The dashed lines denote negative and positive SWE deviations from the 35YB.3.4. SWE Anomaly Frequency in the Great Lakes Basin.
Daily SWE trends in January are depicted in Figure 5. January 1989 to 1992 portrayed competing positive trends (R2 = 0.21–0.36). While 1994 and 1995 exhibited positive trends, SWE similarity was anomalously low (i.e., below the 354YB). SWE showed positive trends from 1996 to 1998; however, only the 1998 trend was statistically significant. The latter decade (1999–2008) experienced a consistent positive SWE trend, with daily increases in 2001, 2003, 2006, and 2008, whereas the SWE trends in 2005, 2005, and 2007 tended to be less significant. While the daily SWE trends were stable throughout this decade, the SWE similarity values were largely below the 35YB. The last decade in our study (i.e., 2009 to 2018), on the other hand, presented a unique pattern in the daily SWE variability. A mixture of positive and negative trends prevailed, yet they were weakly to less statistically significant. Also, the daily similarity values were highly dispersed, suggesting the potential occurrence of SA events whose magnitudes were almost equivalent but opposite.
Figure 6 shows daily changes in SWE from February 1989 to 2018. In the first segment of the three decades (i.e., 1989–1998), this temporal window saw a substantial prevalence of non-significant and weakly significant trends, except for 1995 and 1998, where the trends appeared to be significantly positive (R2 = 0.57 and 0.36, respectively). These two positive trends may have resulted from elevated snowfall, with SS events occurring sequentially after 12th February and persisting until the end of the month. It is important to note that a significant decreasing trend was observed in 1994, driven largely by a reduced SWE similarity after February 18th. The years 1999 and 2000 exhibited contrasting daily trends; while SWE increase was almost exponential in 1999 (R2 = 0.6), a reversal pattern occurred in 2000, where the daily decline was significant (R2 = 0.28). From 2001 to 2006, SWE trends were stable and less significant, except for 2004 and 2005, where increasing patterns were detected. It is essential to emphasize that nearly all the daily SWE similarity values were below the 35YB in 2000, 2007, and 2008. In the succeeding decade (i.e., 2009–2018), non-significant trends dominated. Although in February 2009, 2016, and 2017, SWE exhibited increasing trends (R2 = 0.22, 0.20, and 0.36, respectively), the rest of the years showed no statistically significant trend. It is also important to reiterate that aside from 2012, the daily SWE similarity was generally below the 35YB from 2009 to 2018.
Our model’s predictions of daily changes in the GLB’s SWE are depicted in Figure 7. Although the daily SWE showed declining trends from 1989 to 1991 and 1995, they were not strongly statistically significant (R2 = 0.1–0.2). There was no significant daily trend in 1992, 1994, and 1998. Thus, March SWE appeared to have experienced a more stable SWE trend. Except for 1993 and 1994, where SWE similarity was below the 35YB, the rest of the years had most of their values equal to or above the 35YB. A related trend characterized the following decade (1999–2008). Daily SWE trends were stable, with a few significant positive trends occurring in the years 2000, 2002, and 2008 (R2 = 0.32, 0.28, and 0.24, respectively). Although a significant negative trend appeared in 2003, a low SWE similarity at the end of the month might have resulted in outliers driving the trend downward. It can also be observed that 2000 and 2007 incurred anomalously low SWE similarity, causing most of the days to fall below the 35YB. March was characterized by frequent positive trends between 2009 and 2018, with a highly significant SWE increase occurring in 2014 and 2015 (R2 = 0.37 and 0.27, respectively). However, most of the years experienced SWE similarity below the 35YB, suggesting a consistent decline in March SWE.
Figure 8 presents SWE trends from April 1989 to 2018. Within the first decade (i.e., 1989–1998), strong statistically significant increases in SWE similarity were detected in 1991, 1993, and 1998 (R2 = 0.28, 0.3, and 0.41). Contrarily, 1989, 1992, 1996, and 1997 all exhibited a significant decline in SWE similarity (R2 range: 0.22–0.46). Non-significant trends were observed in 1990, 1994, and 1995. The decade after 1998 saw increased SWE similarity. More specifically, there was an upward trend in SWE similarity in 1999, 2000, 2005, 2006, and 2010 (R2 = 0.47, 0.72, 0.44, and 0.39, respectively). The 2000 trend was driven largely by snow accumulation (i.e., SS events) occurring after April 5th, whereas the 2005 trend can be attributed to AA events starting on April 5th and progressing gradually until the end of April. The number of years with significant declines also reduced markedly by 50% between 1999 and 2008 compared to the preceding decade (i.e., 1989–1998). However, 2002 and 2003 incurred significant declines in SWE. The latter decade (2009–2018) was also largely characterized by a significant reduction in daily SWE similarity, except for 2010 (R2 = 0.39). Surprisingly, 2012 and 2017 exhibited no statistically significant trends. The positive trends between 1998 and 2008 tended to be very strong (average R2 = 0.3); conversely, negative trends emerged in the latter decade (after 2008), exhibiting strong R-squared values. It is also worth noting that, except for 2010, 2012, and 2013, most of the SWE similarity values in the rest of the years were below the 35YB. Thus, a predominant negative trend characterized the SWE pattern from April 2008 to 2018, with the strongest being in 2018 (R2 = 0.52).
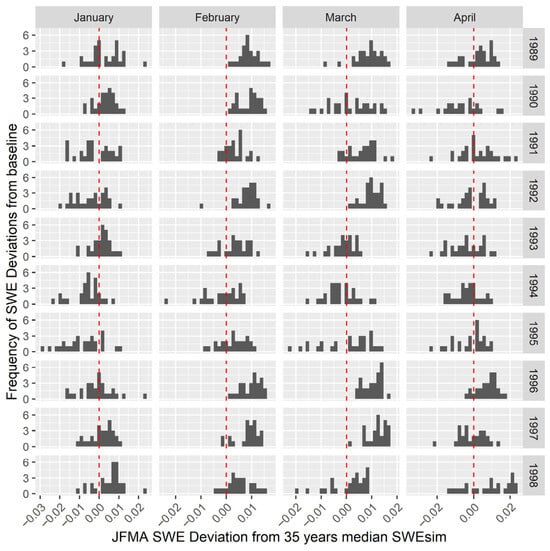
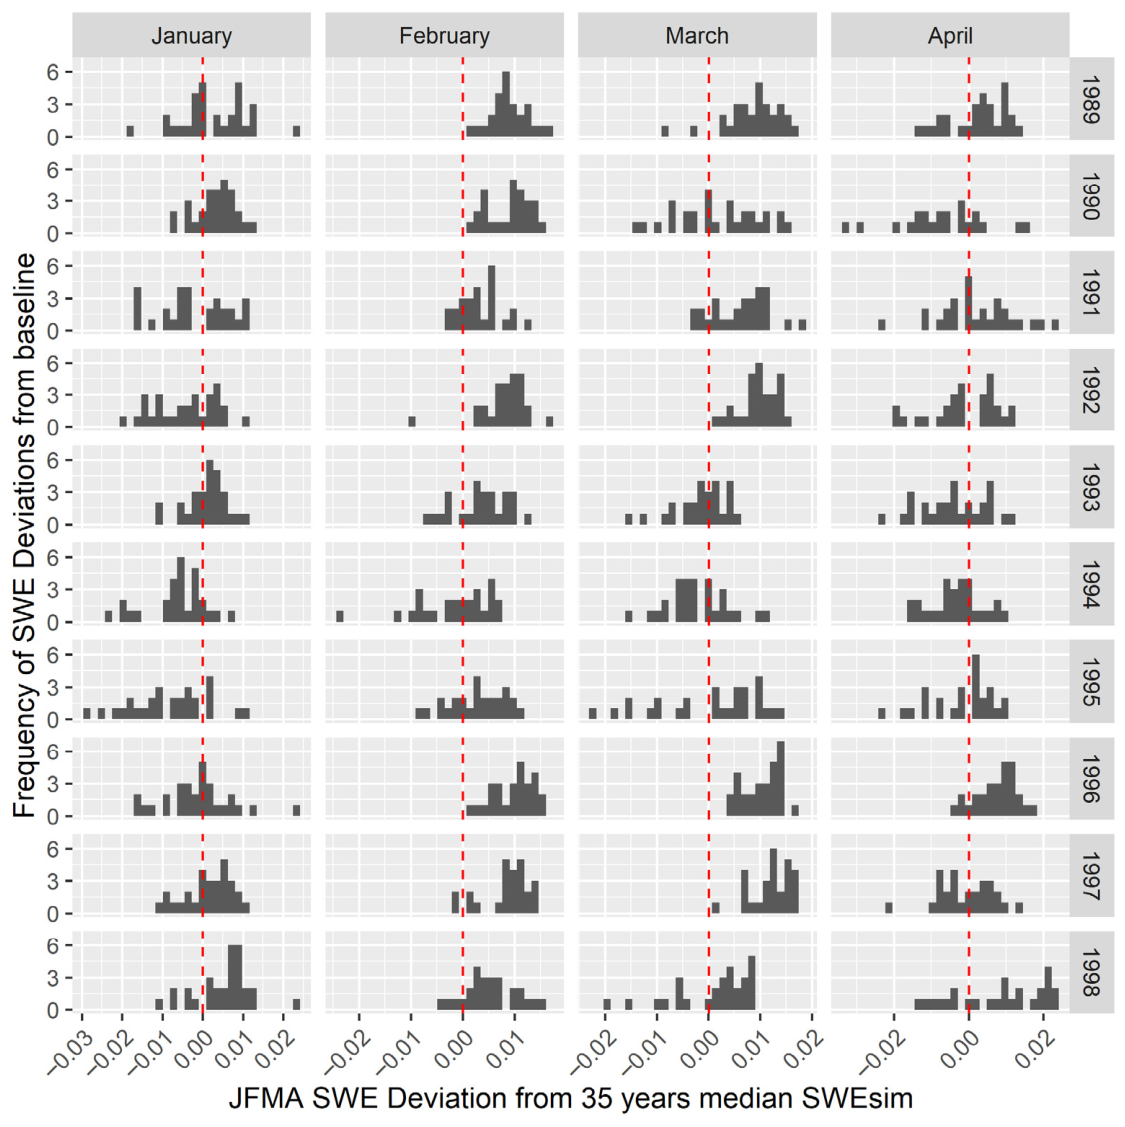
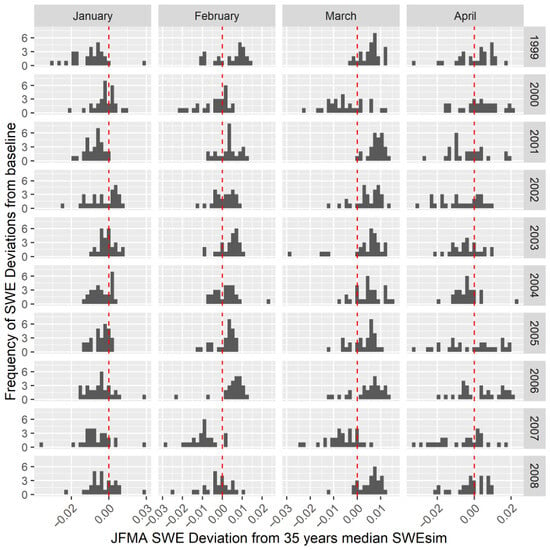
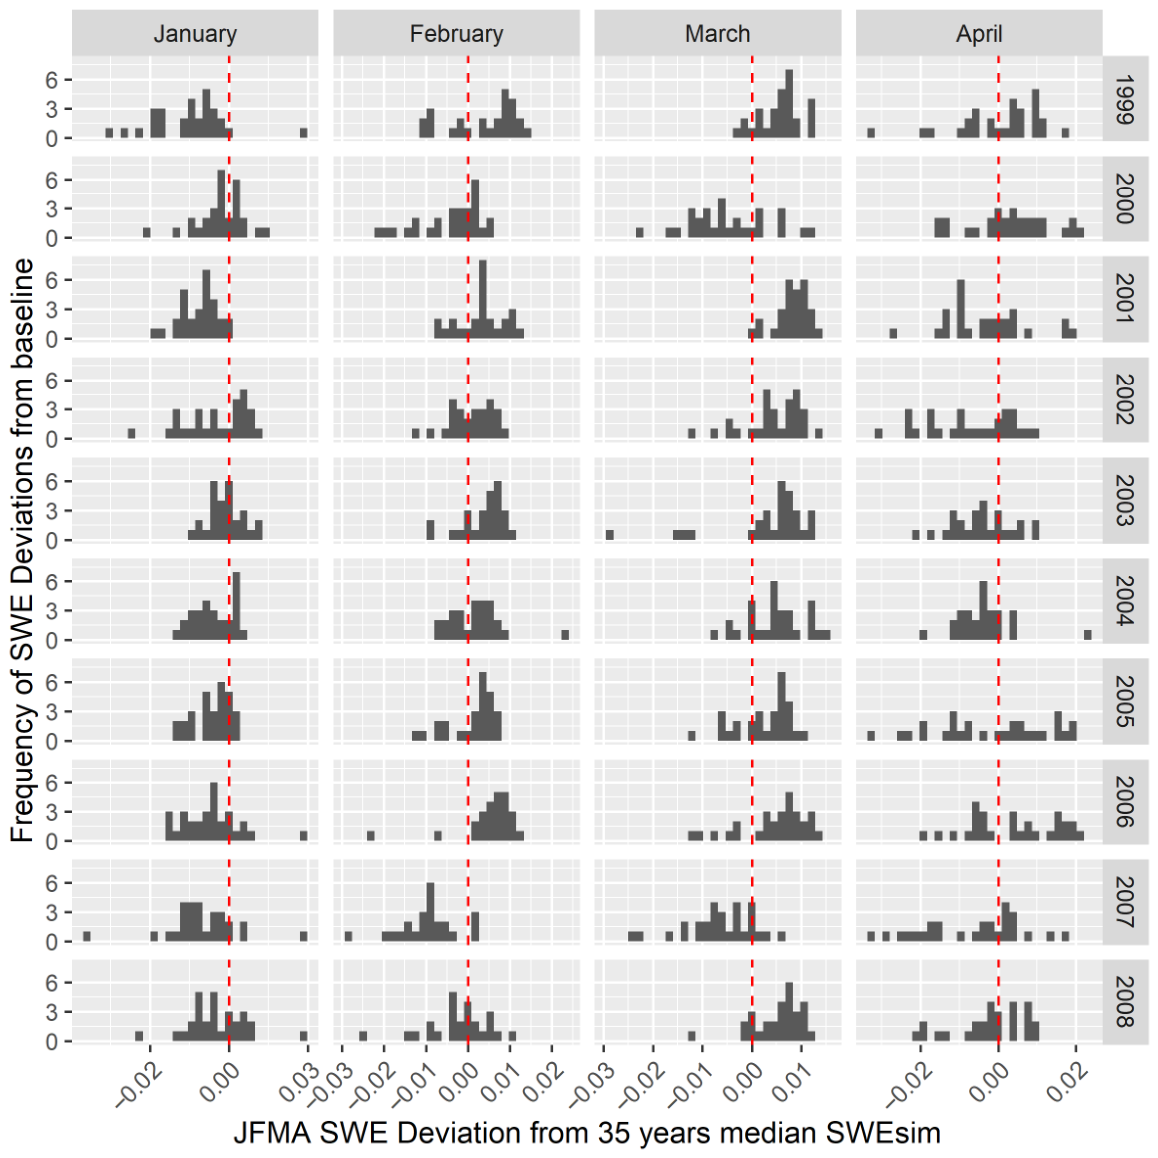
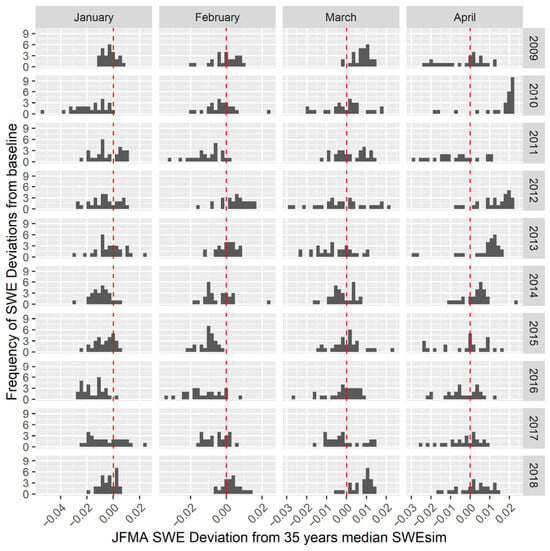
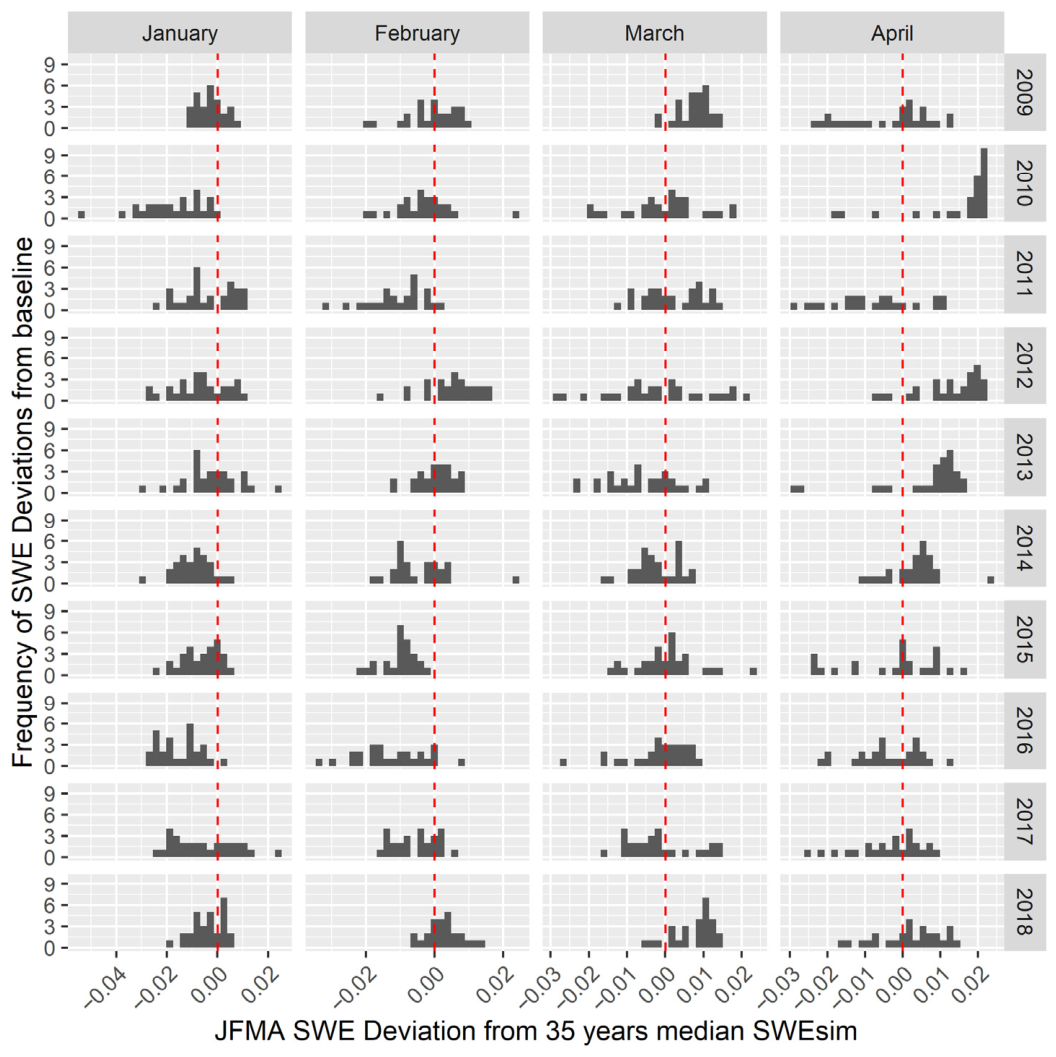
The frequency of SWE deviation (in days) from the 35YB throughout January, February, March, and April (JFMA) is depicted in Figure 9, Figure 10 and Figure 11. The y-axis denotes the frequency of days having values above or below the median, whereas the x-axis represents deviation from the 35YB. The red dotted vertical line demarcates deviations below and above the median (i.e., values below and above zero).
Figure 9.
SWE deviations in JFMA 1989 to 1998 compared to the 35YB SWEsim. The red dotted vertical lines mark deviations below and above the 35YB.
Figure 10.
SWE deviations in JFMA from 1999 to 2008 compared to the 35YB SWEsim. The red dotted vertical lines mark deviations below and above the 35YB.
Figure 11.
SWE deviations in JFMA 2009 to 2018 compared to the 35YB SWEsim. The red dotted vertical lines mark deviations below and above the 35YB.
Figure 9 depicts SWE deviations from the 35YB SWEsim between 1989 and 1998, through JFMA. The histogram bins are more clustered and continuous for most of the months and years. Aside from January 1994 and 1995, when SWE was largely below the baseline, the rest of the years had either high SWEsim values or a balanced frequency above and below the baseline. Contrary to this trend, from February 1989 to 1998, SWE exhibited consistently higher and clustered SWEsim values. The deviations were between −0.005 and +0.01, with frequencies starting at ~2 days. SWE anomaly patterns in March also align with February, as positive deviations (i.e., SWEsim values above the 35YB) were prevalent. The deviations for February, March, and April exhibited balanced frequency from 1993 to 1995. Similarly, April was characterized by symmetrical frequency of values below and above the baseline. The only notable exceptions were 1990 and 1996. These years incurred two contrasting SWE deviations: pronounced daily changes in SWE, resulting in high frequencies of deviations below the 35YB (April 1990), and fewer daily changes, yielding high frequencies of deviations above the 35YB (April 1996).
From 1999 to 2008 (Figure 10), it can be observed that January exhibited the lowest SWE similarity values (i.e., values below 0.5108), while there was a balance between daily occurrences of low and high values in April. Contrarily, the frequency of daily occurrences of high SWEsim values appeared to be elevated in February and March. A notable exception was in 2007, wherein JFMA exhibited values below the 35YB, with deviations ranging from −0.01 to −0.03.
Figure 11 presents SWE deviations between 2009 and 2018 compared to the 35YB. It can be deduced that January and February tended to have anomalously low SWEsim values, ranging from −0.01 to −0.05. Except for 2009 and 2018, where higher SWEsim values were recorded in March, the remaining years elicit a balanced frequency of daily variability in SWE. Similarly, April 2010, 2012, 2013, and 2014 were characterized by balanced frequencies of daily changes in SWE relative to the 35YB.
4. Discussion
In this study, we developed a U-Net model inspired by the Siamese model architecture for detecting anomalies in classification tasks [51]. Our model detected daily changes in SWE with 98.73% accuracy (F1-score), outcompeting the baseline CNN and U-Net models without spatially explicit metrics (i.e., the SSIM index). The AUC-ROC of 0.997 further accentuates the model’s robustness in detecting changes in SWE. Guided by the SSIM index, the model evaluates SWE similarity based on structural differences between pairs of consecutive SWE samples. This reduces the models’ tendency to capture spurious structural differences that are not related to the underlying spatial processes driving snow accumulation and ablation [52,53].
We assessed the strength of the monotonic patterns of daily changes in SWE using MK test and linear regression conditioned on the SWEsim vector (Table 2). While both tests successfully captured the trend and magnitude of daily SWE changes, linear regression was found to slightly underestimate the strength of the changes in SWE, especially where SWE was declining. Thus, the intensity of successive daily SWE reductions, probably driven by snow ablation processes, was not effectively detected through linear regression. For example, the trend in March 2018 received a tau of −0.41 for the MK test and R2 of 0.2 for linear regression. We also computed a 35-year median baseline SWE similarity (i.e., 35YB) of ~0.5108 and identified three types of alternating monotonic upward and downward changes in snow-related events using a sample SWE times series in February, which is a snow-dominant month in the GLB: (1) snowfall-snowfall (SS), (2) ablation-ablation (AA), and (3) snowfall-ablation (SA). These events characterize monotonic transitions between snowfall and ablation processes (Figure 4). The points 2, 11, and 25 in Figure 4 correspond to SWEsim values of 0.523, 0.525, and 0.526. These were days with pronounced snowfall. Conversely, in Figure 4, points 7, 9, and 12 were days experiencing high ablation events. Thus, the SWEsim values tended to be relatively low: 0.515, 0.516, 0.520, respectively. The most perceptible pattern is SA events in the eastern wing of the Lake Michigan watershed. Also noticeable is the SS event in the northwestern part of Lake Ontario (Figure 4). While the northern and southern parts of the GLB, respectively, experience peak ablation events in April and February, most of the regions in the basin experience peak ablation in March [54]. This pattern may have an impact on March SWE anomalies by increasing the frequency of days incurring SWEsim below the baseline. Ablation events have been found to decrease within the northeastern and northwestern Lake Superior basins, while occurring frequently in the eastern Lake Huron and Georgian Bay basins [54]. This pattern is obvious in Figure 4, where SWE persists around the Lake Superior sub-basin throughout February.
Alternating positive and negative deviations are signs of snowfall-ablation, which creates sharp peaks in the time series (i.e., trend line). The trend line becomes virtually flat (e.g., R2 < 0.001), with less pronounced crest and trough regions when the magnitude and frequency of alternating snowfall and ablation events are equivalent (e.g., Figure 5, February 1989). Figure 5, Figure 6, Figure 7 and Figure 8 present 35-year daily SWE trends over the GLB in JFMA. Linear regression conditioned on the days of SS, AA, and AS revealed complex patterns in the daily changes. Significant positive daily SWE trends followed elevated frequency of daily SWEsim values (e.g., SWEsim values equivalent to or above 35YB). Conversely, negative trends were largely driven by a higher frequency of anomalously low daily SWEsim values. The trends were frequently above the 35YB for most of the days in the early two decades (i.e., from 1989 to 2008). In April 1989, 1992, 1996, and 1997, SWE trends significantly declined (R2 ranged from 0.22 to 0.46), suggesting that April fundamentally marks the end of the winter season. The remaining years were characterized by substantial positive SWE trends for January and February. Despite the occurrence of these positive trends, SWE similarity was found to be lower than the 35YB from January 1999 to 2018 (Figure 5) and from February 2009 to 2018 (Figure 6). This suggests a profound long-term decline in SWE as well as shifts in the winter season, as pointed out in earlier studies. In the western United States, a decline in SWE has been observed, with an average reduction of 15–30% (25–50 km3) of April 1st SWE since the mid-century [55]. Although increased snowfall days have been reported in the core winter months, December to February, due to lake-effect snowfall within the lake belt regions relative to inland areas [56], this may have less impact on increases in SWE. Monthly snow trends in snowfall-to-precipitation ratio were also analyzed for northern New England, showing a significant decline in this ratio for March and December [57]. In March, declining trends occurred when the SWE similarity decreased in mid-March (e.g., 13–17 March). This pattern is indicative of a shortening winter season length, characterized by limited snowfall in November and March [56]. While SWE declined significantly in February 1994 (R2 = 0.39), it increased significantly in 1995 (R2 = 0.57). This interannual variability may be linked to large-scale climate processes [16,58,59]. Annual snow variability is also attributable to the changing nature of rain–snow transition, driven largely by near-0 °C temperatures that vary across climatological zones and regions, impacting snowstorm line locations [60,61].
Figure 9, Figure 10 and Figure 11 show daily SWE anomalies relative to the 35YB. A significant shift to SWE similarity values below the 35YB occurred after 2009, with January and February being the months with high frequency of days when SWE fell below the baseline (−0.01 to −0.04). The late arrival of snow in parts of southern Canada likely drives large SWE dissimilarity, resulting in SWEsim anomalies below the 35YB. Suriano and Leathers [62]’s study partly corroborates the decreasing pattern of daily SWE over the GLB in February 2009. The researchers concluded that the ablation event on 10 February 2009 culminated in extensive snow cover reduction across the entire basin and a basin-scale average ablation of 5.34 cm. The ablation event was attributed to advective surface air flow and dewpoint temperatures above 0 degrees, coupled with elevated wind speeds in eastern Lake Erie and west–north of Lakes Superior and Michigan. This probably drove a −0.007 shift in SWE below the 35YB between 9 and 10th February 2009. Likewise, a decrease in snowfall east of Lake Michigan has been identified and linked to reductions in both lake-effect and system snowfall, with system snowfall being dominant in the western region of the lake. The ablation events were primarily driven by snowfall sensitivity to regional temperature and rain-on-snow events [63]. Despite the reported reduction in snowfall, SWE remained above the 35YB for most of the days in February, suggesting that February is potentially a high-SWE month in the GLB. This is substantiated by the findings that high SWE years often experience greater snowfall, less accumulated melting degree, and SWE above normal snowfall in February [64].
Kluver and Leathers [65] identified snowfall regions in the Conterminous United States, pointing out two dominant snowstorm track regions in the GLB. The northern part of the Upper-Midwest was found to experience increasing trends in snowfall frequencies, whereas some areas (mainly around Lake Michigan) showed no significant frequency of snowfall events. These findings reveal the complex nature of daily SWE trends in the GLB. However, Musselman et al. [66] emphasize the need to examine snowmelt and SWE trends in tandem. They compared long-term changes in snowmelt and SWE in western North America and found that winter snowmelt trends increased by about three times the decline in SWE trend, suggesting that snow water resources may be declining more rapidly than portrayed in SWE analysis alone. Snowmelt trends are highly sensitive to ambient temperatures, while SWE trends are modulated by precipitation variability, both of which are linked to climate change signals [31,67,68,69]. Thus, the prediction, planning, and management of future water resources and infrastructure may become more complicated due to changes in SWE and snowmelt in the changing climate [70].
The limitations of our study can be distilled into the modeling framework (i.e., Siamese U-Net, SSIM index, and threshold parameters for determining change in SWE), SWE datasets, and the spatial scale of the analysis. Although we compared the U-Net to the baseline CNN, exploring the capabilities of other deep learning models to characterize changes in SWE could provide valuable insights into how model sensitivity to daily changes in SWE translates into the decadal trends. For example, as pointed out in previous studies, the Siamese Attention model may be more sensitive to daily SWE variations [50]. Additionally, the threshold parameter adopted is model-dependent and could affect the magnitude of SWE trends if different models are used to derive the SWEsim vector. In the context of spatial scale, the heterogeneous nature of snow cover and the relatively large geographic extent of the GLB imply that spatial processes such as snow accumulation and ablation likely exist at sub-basins [71]; therefore, examining SWE variability for each of the Great Lakes’ sub-basins could help disentangle the complexities of SWE trends and variability over time. Furthermore, climatological factors can complicate the identification of significant changes and trends in snow variables [29]. Therefore, synoptic-scale analysis of changes in snow and the underlying SWE could provide more insight into localized-scale influences of climatic drivers and lake-effect snowfall on daily SWE trends. Finally, analyzing SWE trends across different gridded data products could help mitigate false trends that may be introduced by uncertainty in SWE measurements.
5. Conclusions
We developed a convolutional Siamese U-Net to detect and characterize changes and trends in SWE over the GLB. Our model effectively detected daily changes in SWE with 98.73% accuracy and an AUC-ROC of 0.997, outperforming the baseline CNN model. The model detected decadal trends in daily SWE, providing a fine-temporal-resolution glimpse into changes in snow parameters across the Great Lakes region. Using the Siamese model and February SWE, we identified three types of daily snow-related events unfolding in the GLB: (1) snowfall-snowfall (SS), (2) ablation-ablation (AA), and (3) snowfall-ablation (SA). These events create monotonic upward and downward patterns in daily SWE variability and can be effectively detected through the MK test. Except for a few years (1994, 1996, and 1997), daily changes in SWE largely followed positive trends from 1989 to 2008, especially in January and February. Most of the trends in March were non-significant, suggesting a possible contraction of the winter season to a few snow-dominant months (i.e., December, January, and February). We found minimal deviations from a 35YB SWE similarity between 1989 and 2008. While SWE similarity was frequently high and above the 35YB in the first two decades (i.e., 1989–2008), it declined significantly in the latter decade, especially in January and February. Consequently, SWE tended to be consistently lower than the 35YB between 2009 and 2018. By examining previous studies on snow trends in the GLB (e.g., Brunet et al. [37], Baijnath-Rodino [40], Suriano and Leathers [54], Clark et al. [63], and Suriano [70]), we linked these trends to characteristic patterns of snowfall and snow ablation processes, primarily driven by natural climate variability, global climate warming, and lake-effect snowfall, the latter two being the most likely drivers of daily SWE trends in the GLB.
Author Contributions
Conceptualization, K.M.; methodology, K.M. and I.I.; software, I.I., Y.R. and K.S.; validation, K.M. and I.I.; formal analysis, K.M.; investigation, K.M. and I.I.; data curation, I.I., Y.R., K.S., K.K. and H.A.D.; writing—original draft preparation, K.M.; writing—review and editing, K.M., I.I., Y.R., K.S., K.K. and H.A.D.; visualization, K.K. and H.A.D.; supervision, K.M.; project administration, K.M.; funding acquisition, K.M. All authors have read and agreed to the published version of the manuscript.
Funding
This research was funded by the University of Windsor, grant number 823356.
Data Availability Statement
The data used to conduct this research was from GlobSnow SWE version 3.0, which is available at: https://www.globsnow.info/swe/archive_v3.0/ (accessed on 1 December 2025).
Acknowledgments
The authors acknowledge the use of licensed software (ArcGIS Pro version 3.6) and computing systems supplied by the University of Windsor.
Conflicts of Interest
The authors declare no conflicts of interest.
References
- Fergen, J.T.; Bergstrom, R.D.; Twiss, M.R.; Johnson, L.; Steinman, A.D.; Gagnon, V. Updated census in the Laurentian Great Lakes Watershed: A framework for determining the relationship between the population and this aquatic resource. J. Great Lakes Res. 2022, 48, 1337–1344. [Google Scholar] [CrossRef] [Scilit]
- Contosta, A.R.; Casson, N.J.; Garlick, S.; Nelson, S.J.; Ayres, M.P.; Burakowski, E.A.; Campbell, J.; Creed, I.; Eimers, C.; Evans, C.; et al. Northern forest winters have lost cold, snowy conditions that are important for ecosystems and human communities. Ecol. Appl. 2019, 29, e01974. [Google Scholar] [CrossRef] [Scilit] [PubMed]
- Environment and Climate Change Canada. Canadian Environmental Sustainability Indicators: Snow Cover. Available online: www.canada.ca/en/environment-climate-change/services/environmental-indicators/snow-cover.html (accessed on 1 January 2026).
- Callaghan, T.V.; Johansson, M.; Brown, R.D.; Groisman, P.Y.; Labba, N.; Radionov, V.; Bradley, R.S.; Blangy, S.; Bulygina, O.N.; Christensen, T.R.; et al. Multiple effects of changes in arctic snow cover. Ambio 2011, 40, 32–45. [Google Scholar] [CrossRef] [Scilit]
- Hall, D.k.; Loomis, B.D.; DiGirolamo, N.E.; Forman, B.A. Snowfall Replenishes Groundwater Loss in the Great Basin of the Western United States, but Cannot Compensate for Increasing Aridification. Geophys. Res. Lett. 2024, 51, e2023GL107913. [Google Scholar] [CrossRef] [Scilit]
- Wright, D.M.; Posselt, D.J.; Steiner, A.L. Sensitivity of lake-effect snowfall to lake ice cover and temperature in the great lakes region. Mon. Weather. Rev. 2013, 141, 670–689. [Google Scholar] [CrossRef] [Scilit]
- Wang, C.; Graham, R.M.; Wang, K.; Gerland, S.; Granskog, M.A. Comparison of ERA5 and ERA-Interim near-surface air temperature, snowfall and precipitation over Arctic sea ice: Effects on sea ice thermodynamics and evolution. Cryosphere 2019, 13, 1661–1679. [Google Scholar] [CrossRef] [Scilit]
- Layden, A.; Merchant, C.; Maccallum, S. Global climatology of surface water temperatures of large lakes by remote sensing. Int. J. Climatol. 2015, 35, 4464–4479. [Google Scholar] [CrossRef] [Scilit]
- Zhang, T. Influence of the seasonal snow cover on the ground thermal regime: An overview. Rev. Geophys. 2005, 43, RG4002. [Google Scholar] [CrossRef] [Scilit]
- Maurer, G.E.; Bowling, D.R. Seasonal snowpack characteristics influence soil temperature and water content at multiple scales in interior western U.S. mountain ecosystems. Water Resour. Res. 2014, 50, 5216–5234. [Google Scholar] [CrossRef] [Scilit]
- Barnhart, T.B.; Tague, C.L.; Molotch, N.P. The Counteracting Effects of Snowmelt Rate and Timing on Runoff. Water Resour. Res. 2020, 56, e2019WR026634. [Google Scholar] [CrossRef] [Scilit]
- Contosta, A.R.; Burakowski, E.A.; Varner, R.K.; Frey, S.D. Winter soil respiration in a humid temperate forest: The roles of moisture, temperature, and snowpack. J. Geophys. Res. Biogeosci. 2016, 121, 3072–3088. [Google Scholar] [CrossRef] [Scilit]
- Barnhart, T.B.; Molotch, N.P.; Livneh, B.; Harpold, A.A.; Knowles, J.F.; Schneider, D. Snowmelt rate dictates streamflow. Geophys. Res. Lett. 2016, 43, 8006–8016. [Google Scholar] [CrossRef] [Scilit]
- Harpold, A.A.; Molotch, N.P. Sensitivity of soil water availability to changing snowmelt timing in the western U.S. Geophys. Res. Lett. 2015, 42, 8011–8020. [Google Scholar] [CrossRef] [Scilit]
- Li, D.; Wrzesien, M.L.; Durand, M.; Adam, J.; Lettenmaier, D.P. How much runoff originates as snow in the western United States, and how will that change in the future? Geophys. Res. Lett. 2017, 44, 6163–6172. [Google Scholar] [CrossRef] [Scilit]
- Jia, X.; Ge, J. Modulation of the PDO to the relationship between moderate ENSO events and the winter climate over North America. Int. J. Climatol. 2017, 37, 4275–4287. [Google Scholar] [CrossRef] [Scilit]
- Mankin, J.S.; Diffenbaugh, N.S. Influence of temperature and precipitation variability on near-term snow trends. Clim. Dyn. 2015, 45, 1099–1116. [Google Scholar] [CrossRef] [Scilit]
- Räisänen, J. Warmer climate: Less or more snow? Clim. Dyn. 2008, 30, 307–319. [Google Scholar] [CrossRef] [Scilit]
- Thackeray, C.W.; Derksen, C.; Fletcher, C.G.; Hall, A. Snow and Climate: Feedbacks, Drivers, and Indices of Change. Curr. Clim. Chang. Rep. 2019, 5, 322–333. [Google Scholar] [CrossRef] [Scilit]
- Déry, S.J.; Brown, R.D. Recent Northern Hemisphere snow cover extent trends and implications for the snow-albedo feedback. Geophys. Res. Lett. 2007, 34, L22504. [Google Scholar] [CrossRef] [Scilit]
- Luce, C.H.; Lopez-Burgos, V.; Holden, Z. Sensitivity of snowpack storage to precipitation and temperature using spatial and temporal analog models. Water Resour. Res. 2014, 50, 9447–9462. [Google Scholar] [CrossRef] [Scilit]
- Chemke, R.; Yuval, J. Climate change shifts the North Pacific storm track polewards. Nature 2026, 649, 626–630. [Google Scholar] [CrossRef] [Scilit]
- Mortsch, L.D.; Quinn, F.H. Climate change scenarios for Great Lakes Basin ecosystem studies. Limnol. Oceanogr. 1996, 41, 903–911. [Google Scholar] [CrossRef] [Scilit]
- Hanesiak, J.; Stewart, R.; Painchaud-Niemi, D.; Milrad, S.; Liu, G.; Vieira, M.; Theriault, J.; Cholette, M.; Ziolkowski, K. The Severe Multi-Day October 2019 Snow Storm Over Southern Manitoba, Canada. Atmos.-Ocean. 2022, 60, 65–87. [Google Scholar] [CrossRef] [Scilit]
- Suriano, Z.J.; Leathers, D.J. Twenty-first century snowfall projections within the eastern Great Lakes region: Detecting the presence of a lake-induced snowfall signal in GCMs. Int. J. Climatol. 2016, 36, 2200–2209. [Google Scholar] [CrossRef] [Scilit]
- Myers, D.T.; Ficklin, D.L.; Robeson, S.M. Hydrologic implications of projected changes in rain-on-snow melt for Great Lakes Basin watersheds. Hydrol. Earth Syst. Sci. 2023, 27, 1755–1770. [Google Scholar] [CrossRef] [Scilit]
- Rupp, D.E.; Mote, P.W.; Bindoff, N.L.; Stott, P.A.; Robinson, D.A. Detection and attribution of observed changes in northern hemisphere spring snow cover. J. Clim. 2013, 26, 6904–6914. [Google Scholar] [CrossRef] [Scilit]
- Kushner, P.J.; Mudryk, L.R.; Merryfield, W.; Ambadan, J.T.; Berg, A.; Bichet, A.; Brown, R.; Derksen, C.; Déry, S.J.; Dirkson, A.; et al. Canadian snow and sea ice: Assessment of snow, sea ice, and related climate processes in Canada’s Earth system model and climate-prediction system. Cryosphere 2018, 12, 1137–1156. [Google Scholar] [CrossRef] [Scilit]
- Kunkel, K.E.; Palecki, M.A.; Hubbard, K.G.; Robinson, D.A.; Redmond, K.T.; Easterling, D.R. Trend identification in twentieth-century U.S. snowfall: The challenges. J. Atmos. Ocean. Technol. 2007, 24, 64–73. [Google Scholar] [CrossRef] [Scilit]
- Hammond, J.C.; Kampf, S.K. Subannual Streamflow Responses to Rainfall and Snowmelt Inputs in Snow-Dominated Watersheds of the Western United States. Water Resour. Res. 2020, 56, 2019WR026132. [Google Scholar] [CrossRef] [Scilit]
- Jepsen, S.M.; Molotch, N.P.; Williams, M.W.; Rittger, K.E.; Sickman, J.O. Interannual variability of snowmelt in the Sierra Nevada and Rocky Mountains, United States: Examples from two alpine watersheds. Water Resour. Res. 2012, 48, W02529. [Google Scholar] [CrossRef] [Scilit]
- Ellis, A.W.; Leathers, D.J. A Synoptic Climatological Approach to the Analysis of Lake-Effect Snowfall: Potential Forecasting Applications. Weather Forecast. 1995, 11, 216–229. [Google Scholar] [CrossRef] [Scilit]
- Kunkel, K.E.; Ensor, L.; Palecki, M.; Easterling, D.; Robinson, D.; Hubbard, K.G.; Redmond, K. A new look at lake-effect snowfall trends in the Laurentian Great Lakes using a temporally homogeneous data set. J. Great Lakes Res. 2009, 35, 23–29. [Google Scholar] [CrossRef] [Scilit]
- Notaro, M.; Bennington, V.; Vavrus, S. Dynamically Downscaled Projections of Lake-Effect Snow in the Great Lakes Basin. J. Clim. 2015, 28, 1661–1684. [Google Scholar] [CrossRef] [Scilit]
- Ellis, A.W.; Johnson, J.J. Hydroclimatic Analysis of Snowfall Trends Associated with the North American Great Lakes. J. Hydrometeorol. 2004, 5, 471–486. [Google Scholar] [CrossRef] [Scilit]
- Norton, D.C.; Bolsenga, S.J. Spatiotemporal Trends in Lake Effect and Continental Snowfall in the Laurentian Great Lakes, 1951–1980. J. Clim. 1993, 6, 1943–1955. [Google Scholar] [CrossRef] [Scilit]
- Burnett, A.W.; Kirby, M.E.; Mullins, H.T.; Patterson, W.P. Increasing Great Lake-Effect Snowfall during the Twentieth Century: A Regional Response to Global Warming? J. Clim. 2003, 16, 3535–3542. [Google Scholar] [CrossRef] [Scilit]
- Suriano, Z.J.; Leathers, D.J. The changing nature of ablation-inducing synoptic weather types in the North American Great Lakes basin. Theor. Appl. Climatol. 2020, 143, 931–941. [Google Scholar] [CrossRef] [Scilit]
- Suriano, Z.J.; Robinson, D.A.; Leathers, D.J. Changing snow depth in the Great Lakes basin (USA): Implications and trends. Anthropocene 2019, 26, 100208. [Google Scholar] [CrossRef] [Scilit]
- Baijnath-Rodino, J.A.; Duguay, C.R.; LeDrew, E. Climatological trends of snowfall over the Laurentian Great Lakes Basin. Int. J. Climatol. 2018, 38, 3942–3962. [Google Scholar] [CrossRef] [Scilit]
- Kunkel, K.E.; Palecki, M.A.; Ensor, L.; Easterling, D.; Hubbard, K.G.; Robinson, D.; Redmond, K. Trends in twentieth-century U.S. extreme snowfall seasons. J. Clim. 2009, 22, 6204–6216. [Google Scholar] [CrossRef] [Scilit]
- McCray, C.D.; Schmidt, G.A.; Paquin, D.; Leduc, M.; Bi, Z.; Radiyat, M.; Silverman, C.; Spitz, M.; Brettschneider, B.R. Changing Nature of High-Impact Snowfall Events in Eastern North America. J. Geophys. Res. Atmos. 2023, 128, e2023JD038804. [Google Scholar] [CrossRef] [Scilit]
- Ashley, W.S.; Zeeb, A.; Haberlie, A.M.; Gensini, V.A.; Michaelis, A. The Future of Snowstorms in Central and Eastern North America. Int. J. Climatol. 2023, 45, e8770. [Google Scholar] [CrossRef] [Scilit]
- Lute, A.C.; Abatzoglou, J.T.; Hegewisch, K.C. Projected changes in snowfall extremes and interannual variability of snowfall in the western United States. Water Resour. Res. 2015, 51, 960–972. [Google Scholar] [CrossRef] [Scilit]
- Hale, K.E.; Jennings, K.S.; Musselman, K.N.; Livneh, B.; Molotch, N.P. Recent decreases in snow water storage in western North America. Commun. Earth Environ. 2023, 4, 170. [Google Scholar] [CrossRef] [Scilit]
- Gyawali, R.; Watkins, D.W. Continuous Hydrologic Modeling of Snow-Affected Watersheds in the Great Lakes Basin Using HEC-HMS. J. Hydrol. Eng. 2013, 18, 29–39. [Google Scholar] [CrossRef] [Scilit]
- Zahmatkesh, Z.; Tapsoba, D.; Leach, J.; Coulibaly, P. Evaluation and bias correction of SNODAS snow water equivalent (SWE) for streamflow simulation in eastern Canadian basins. Hydrol. Sci. J. 2019, 64, 1541–1555. [Google Scholar] [CrossRef] [Scilit]
- Malik, K.; Robertson, C. Structural Similarity-Guided Siamese U-Net Model for Detecting Changes in Snow Water Equivalent. Remote Sens. 2025, 17, 1631. [Google Scholar] [CrossRef] [Scilit]
- Malik, K.; Isteyak, I.; Robertson, C. Estimating Snow-Related Daily Change Events in the Canadian Winter Season: A Deep Learning-Based Approach. J. Imaging 2025, 11, 239. [Google Scholar] [CrossRef] [Scilit]
- Wang, Z.; Bovik, A.C.; Sheikh, H.R.; Simoncelli, E.P. Image Quality Assessment: From Error Visibility to Structural Similarity. IEEE Trans. Image Process. 2004, 13, 600–612. [Google Scholar] [CrossRef] [Scilit]
- Bromley, R.S.J.; Guyon, I.; LeCun, Y.; Sickinger, E. Signature Verification using a ‘Siamese’ Time Delay Neural Network. In Advances in Neural Information Processing Systems; Denver, Morgan Kaufmann Publisher: Burlington, MA, USA, 1993; Volume 6, pp. 737–744. [Google Scholar]
- Malik, K.; Robertson, C. Exploring the Use of Computer Vision Metrics for Spatial Pattern Comparison. Geogr. Anal. 2020, 52, 617–641. [Google Scholar] [CrossRef] [Scilit]
- Malik, K.; Robertson, C.; Roberts, S.A.; Remmel, T.K.; Jed, A. Computer vision models for comparing spatial patterns: Understanding spatial scale. Int. J. Geogr. Inf. Sci. 2022, 37, 1–35. [Google Scholar] [CrossRef] [Scilit]
- Suriano, Z.J.; Leathers, D.J. Spatio-temporal variability of Great Lakes basin snow cover ablation events. Hydrol. Process. 2017, 31, 4229–4237. [Google Scholar] [CrossRef] [Scilit]
- Mote, P.W.; Li, S.; Lettenmaier, D.P.; Xiao, M.; Engel, R. Dramatic declines in snowpack in the western US. npj Clim. Atmos. Sci. 2018, 1, 2. [Google Scholar] [CrossRef] [Scilit]
- Suriano, Z.J.; Guercio, H.L. A snowfall climatology of the Ohio River Valley, USA. Theor. Appl. Climatol. 2024, 155, 7691–7701. [Google Scholar] [CrossRef] [Scilit]
- Huntington, T.G.; Hodgkins, G.A.; Keim, B.D.; Dudley, R.W. Changes in the Proportion of Precipitation Occurring as Snow in New England (1949–2000). J. Clim. 2003, 17, 2026–2636. [Google Scholar] [CrossRef] [Scilit]
- Suriano, Z.J.; Uz, J.; Loewy, C. Intra-annual snowfall variability in the central United States. Int. J. Climatol. 2023, 43, 5720–5734. [Google Scholar] [CrossRef] [Scilit]
- Martin, J.P.; Germain, D. Large-scale teleconnection patterns and synoptic climatology of major snow-avalanche winters in the Presidential Range (New Hampshire, USA). Int. J. Climatol. 2017, 37, 109–123. [Google Scholar] [CrossRef] [Scilit]
- Thériault, J.M.; Leroux, N.R.; Tchuente, O.T.; Stewart, R.E. Characteristics of Rain-Snow Transitions Over the Canadian Rockies and their Changes in Warmer Climate Conditions. Atmos.-Ocean. 2023, 61, 352–367. [Google Scholar] [CrossRef] [Scilit]
- Mekis, E.; Stewart, R.E.; Theriault, J.M.; Kochtubajda, B.; Bonsal, B.R.; Liu, Z. Near-0 °C surface temperature and precipitation type patterns across Canada. Hydrol. Earth Syst. Sci. 2020, 24, 1741–1761. [Google Scholar] [CrossRef] [Scilit]
- Suriano, Z.J.; Leathers, D.J. Great Lakes Basin Snow-Cover Ablation and Synoptic-Scale Circulation. J. Appl. Meteorol. Climatol. 2018, 57, 1497–1510. [Google Scholar] [CrossRef] [Scilit]
- Clark, C.A.; Goebbert, K.H.; Ganesh-Babu, B.; Young, A.M.; Heinlein, K.N.; Casas, E.G.; Guchte, A.P.V.; Krull, A.J.; Sefcovic, Z.P.; Connelly, R.J.; et al. Classification of Lake Michigan snow days for estimation of the lake-effect contribution to the downward trend in November snowfall. Int. J. Climatol. 2020, 40, 5656–5670. [Google Scholar] [CrossRef] [Scilit]
- Grundstein, A. A synoptic-scale climate analysis of anomalous snow water equivalent over the Northern Great Plains of the USA. Int. J. Climatol. 2003, 23, 871–886. [Google Scholar] [CrossRef] [Scilit]
- Kluver, D.; Leathers, D. Winter snowfall prediction in the United States using multiple discriminant analysis. Int. J. Climatol. 2015, 35, 2003–2018. [Google Scholar] [CrossRef] [Scilit]
- Musselman, K.N.; Addor, N.; Vano, J.A.; Molotch, N.P. Winter melt trends portend widespread declines in snow water resources. Nat. Clim. Chang. 2021, 11, 418–421. [Google Scholar] [CrossRef] [Scilit] [PubMed]
- Huang, X.; Hall, A.D.; Berg, N. Anthropogenic Warming Impacts on Today’s Sierra Nevada Snowpack and Flood Risk. Geophys. Res. Lett. 2018, 45, 6215–6222. [Google Scholar] [CrossRef] [Scilit]
- Sun, F.; Berg, N.; Hall, A.; Schwartz, M.; Walton, D. Understanding End-of-Century Snowpack Changes Over California’s Sierra Nevada. Geophys. Res. Lett. 2019, 46, 933–943. [Google Scholar] [CrossRef] [Scilit]
- Cho, E.; McCrary, R.R.; Jacobs, J.M. Future Changes in Snowpack, Snowmelt, and Runoff Potential Extremes Over North America. Geophys. Res. Lett. 2021, 48, e2021GL094985. [Google Scholar] [CrossRef] [Scilit]
- Cho, E.; Jacobs, J.M. Extreme Value Snow Water Equivalent and Snowmelt for Infrastructure Design Over the Contiguous United States. Water Resour. Res. 2020, 56, e2020WR028126. [Google Scholar] [CrossRef] [Scilit]
- Suriano, Z.J. On the role of snow cover ablation variability and synoptic-scale atmospheric forcings at the sub-basin scale within the Great Lakes watershed. Theor. Appl. Climatol. 2019, 135, 607–621. [Google Scholar] [CrossRef] [Scilit]

Disclaimer/Publisher’s Note: The statements, opinions and data contained in all publications are solely those of the individual author(s) and contributor(s) and not of MDPI and/or the editor(s). MDPI and/or the editor(s) disclaim responsibility for any injury to people or property resulting from any ideas, methods, instructions or products referred to in the content. |
© 2026 by the authors. Licensee MDPI, Basel, Switzerland. This article is an open access article distributed under the terms and conditions of the Creative Commons Attribution (CC BY) license.