


Abstract
Afghanistan is highly vulnerable to the effects of climate change, which poses significant challenges to food security and environmental systems. To mitigate these challenges and promote sustainable development, it is important to adopt an integrated method that promotes food production and climate resilience for environmental sustainability. This manuscript aims to estimate the decoupling impact of green energy on CO2 emissions and food crop production in Afghanistan, with a focus on promoting Sustainable food production. In this research article, the Nonlinear Auto Regressive Distributed Lag (NARDL) model was used to estimate data from 1996 to 2021 in Afghanistan. The NARDL bounds test confirms a stable long-run equilibrium relationship between climatic factors and food crop production. The long-run results reveal an asymmetric decoupling impact of green energy on CO2 emission and food crop production. Specifically, a 1% positive or negative shock in the interaction between green energy and CO2 emissions produces different outcomes for food crop production. Increasing temperature tends to decrease food production, while precipitation increases food production over the long term. Furthermore, raising CO2 emissions negatively affects long-term food production, while greater use of green energy contributes to food production in the future. These findings underscore the need to adopt climate-resilient technologies, including climate-smart agriculture, to help farmers withstand the adverse effects of climate change. In addition, to ensure long-term stability in food production, Afghanistan should prioritize the development of green technologies. This approach would reduce agriculture’s dependence on fossil fuels and foster the growth of sustainable agricultural industries.
1. Introduction
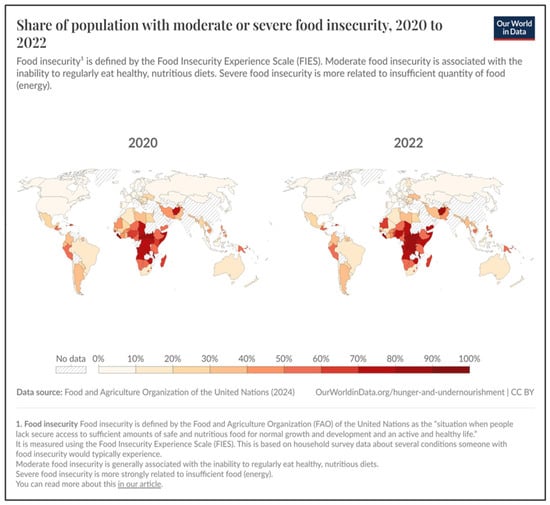
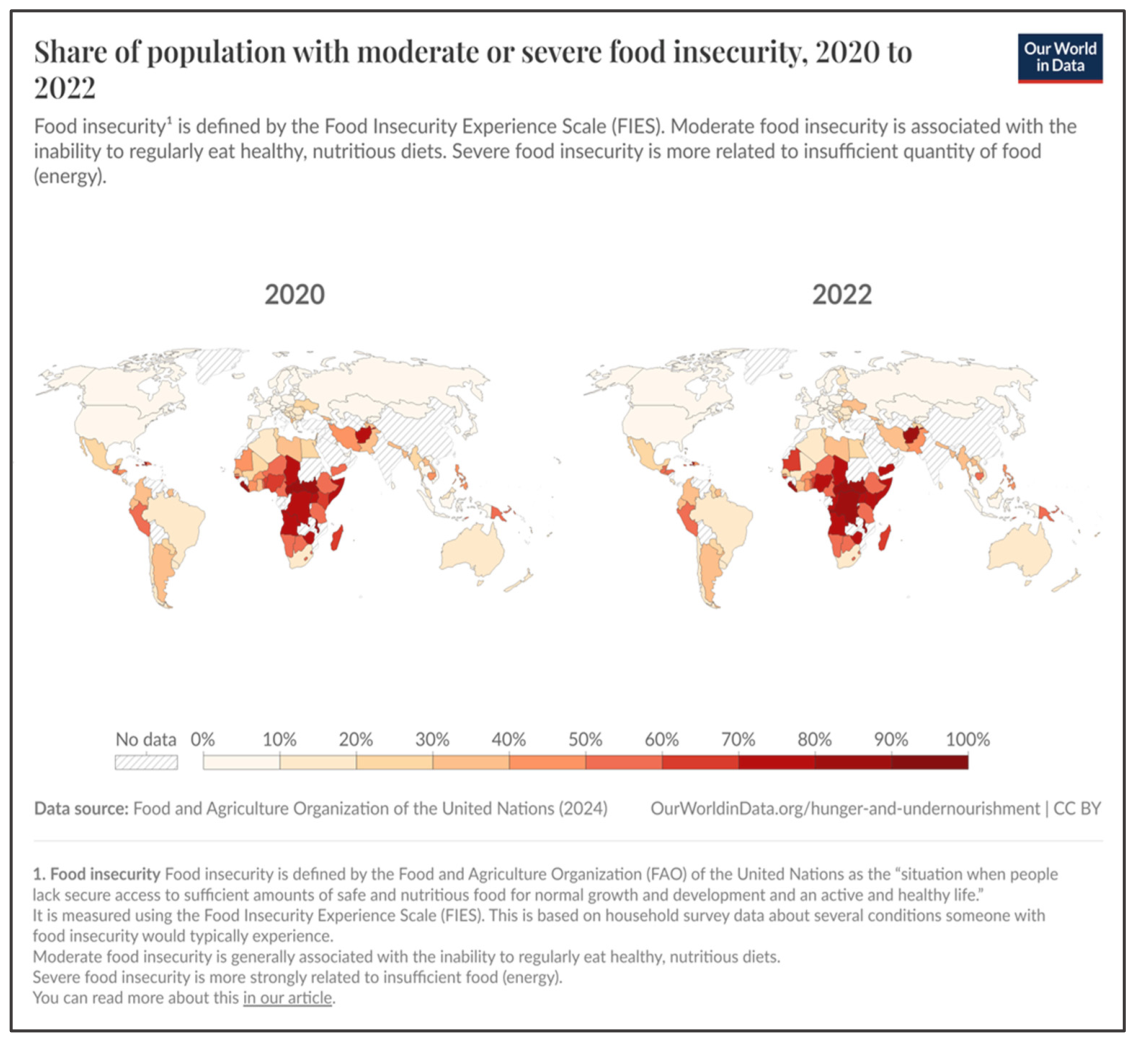
Food security remains one of the most pressing global challenges of this century, as hunger and undernourishment continue to impact millions of people globally [1]. In response, the United Nations (UN) has established SDG 2: Zero Hunger as a key component of the 2030 Agenda, aiming to “end hunger, achieve food security, improve nutrition, and promote sustainable agriculture [2]. Despite efforts that have been made to convert the global food system and improve access to better regimes, hunger remains an important challenge. Even with initiatives to overhaul the global food system and improve access to healthier diets, hunger remains a significant issue. The projection shows that by 2030, approximately 600 million people will experience food insecurity globally [3]. It is important to point out that while food shortages are a global pandemic, they are particularly prevalent in Afghanistan [4]. Approximately 80.9% of Afghanistan’s population experienced moderate to severe food insecurity during the period 2020–2022 (Figure 1). Afghanistan has experienced decades of conflict and political instability [5]. However, due to aid inflows and expenditures associated with foreign aid, the economic condition has improved, and the poverty level has decreased [6]. However, this situation has deteriorated dramatically since the government’s collapse in 2021 (Figure 1) [7]. The economy of Afghanistan deeply belongs to the agricultural sector, which remains dominant despite its low productivity [8]. Agriculture accounts for over a quarter of GDP, more than half of total employment, and two-thirds of rural households rely on farming for their main source of income [9].
Figure 1.
Prevalence of moderate or severe food insecurity in the total population (3-year average). Data source: Food and Agriculture Organization of the United Nations.
Although the decline in agricultural productivity has multiple causes, Climate Change (CC) is often cited as a key determinant [10]. Agricultural systems are highly sensitive to environmental events in Afghanistan, making them vulnerable to significant risk and uncertainty [11]. In developing countries, such as Afghanistan, the significance of agriculture is even more pronounced. It has an arid continental climate, where drought is a constant concern and is significantly affected by CC [4]. Climatic factors influence crop resilience, growth potential, production costs, and productivity through frequent droughts, water shortages, increased evapotranspiration, and heat stress. For example, increasing temperature can lead to elevated heat stress, necessitate changes in planting times, affect growing season duration, and boost growing degree days (GDD). Similarly, changes in precipitation can cause droughts, floods, water stress, and increased crop water demand. These factors collectively establish the main influence of CC on agricultural yield [12]. Consequently, agricultural production costs increase, leading to price fluctuations and higher unit prices for food and other agricultural products. Research has shown that increasing the temperature by 1% can decrease wheat production by 3–10% in India [13]. The study by Raoufi [14] in Afghanistan found that a 1 °C increase in mean temperatures and a 1% increase in rainfall will decrease crop productivity by 3.05% in 2100. However, CC poses a significant threat to Afghanistan’s agricultural supply, which may severely undermine food security if timely and effective actions are not implemented.
Afghanistan is one of the countries most vulnerable to CC worldwide, and environmental degradation remains a persistent concern [15]. According to the Global Climate Risk Index (2019), Afghanistan ranked sixth among the countries most affected by climate-related impacts [16]. Greenhouse gas (GHG) emissions have reached unprecedented levels as a result of the widespread use of fossil fuels and carbon-intensive energy sources [17]. Consequently, Afghanistan has been ranked among the top 20 most polluted countries [18], likely due to the overuse of low-quality fuels, open waste burning, limited environmental regulations, and inefficient heating technologies [19]. Furthermore, intensive resource extraction activities, including coal and mineral exploitation, contribute significantly to environmental pollution. The exploration and extraction of these resources are often associated with substantial environmental degradation, which has further contributed to Afghanistan’s ranking among the 20 most polluted countries.
The literature indicates that various indicators of CC affect farming production [20,21,22]. As a result, price stability, supply chains, and farmers’ livelihoods are constantly affected, creating significant challenges for the agricultural sector. However, in light of the pressing issues posed by CC, environmental harm, and food scarcity, global efforts such as the Intergovernmental Panel on Climate Change (IPCC) and the Sustainable Development Goals (SDGs) have advocated a collective shift towards renewable energy sources [22,23]. The aim of this shift is to effectively manage GHG emissions, specifically CO2 emissions [24,25]. The literature suggests that transitioning to renewable energy sources can contribute to climate stabilisation by reducing CO2 emissions in developing countries such as Afghanistan [22,26]. Green energy refers to renewable energy sources that are environmentally sustainable.
In this context, it is important to establish a connection between nature conservation, energy utilisation, agricultural production, and research and development efforts with the agricultural environment-climate nexus [27]. Previous studies have confirmed that advanced farming practices and climate mitigation technologies can enhance agricultural yields and reduce the negative impacts of climate change [28,29,30,31]. Weather-related risks pose a significant threat to cereal crops like wheat, rice, and maize. Consequently, the success of crop farming largely depends on adapting to environmental stresses and implementing climate-resilient solutions, such as adopting green technologies [29,32]. However, a wide range of empirical studies in the literature have thoroughly examined the association between CC, energy, and food production. Therefore, a significant research gap persists in the existing literature on this topic. Previous studies have primarily emphasised the impact of increasing temperature and CO2 emissions on food crop production [20,21]. To the best of our knowledge, the literature has largely ignored the association between food crop production, CC, and green energy.
We provide three significant contributions to the current body of literature. First, it presents the first attempt to estimate how green energy can offset the future negative effects of CO2 emissions on food crop production. While previous studies [33,34] have analysed the effects of renewable energy on crop production and food security, they have overlooked the role of green energy in reversing the negative impact on CO2 emissions in crop production. Second, this study employs the NARDL model to examine the asymmetric relationship between green energy and food crop production, an approach often overlooked in the literature [22]. The NARDL model reveals hidden patterns and interactions within datasets, enabling deeper insights [35]. By disaggregating data, this method identifies causal pathways that aggregated analyses fail to detect, offering new hypotheses for future research [36]. This nuanced analysis bridges theoretical gaps and provides a clearer understanding of the effect of green energy on the negative impact of CO2 emissions on food crop production in Afghanistan. Third, this study focuses on the unique context and policy implications of Afghanistan. This study is the first to estimate the asymmetric effects of green energy and CC on food crop production in Afghanistan. Therefore, several parameters guided the selection of Afghanistan for this research. Afghanistan is experiencing a severe crisis of hunger and undernourishment; the FAO report shows that 80.9% of the population face moderate or severe food insecurity. This study offers policymakers valuable insights into formulating sustainable strategies that are aligned with the Sustainable Development Goals (SDGs) and promotes improved environmental quality and food security.
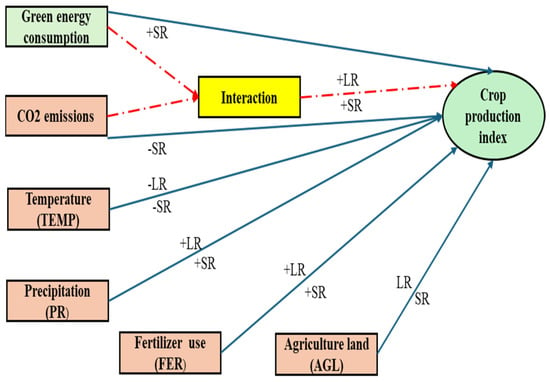
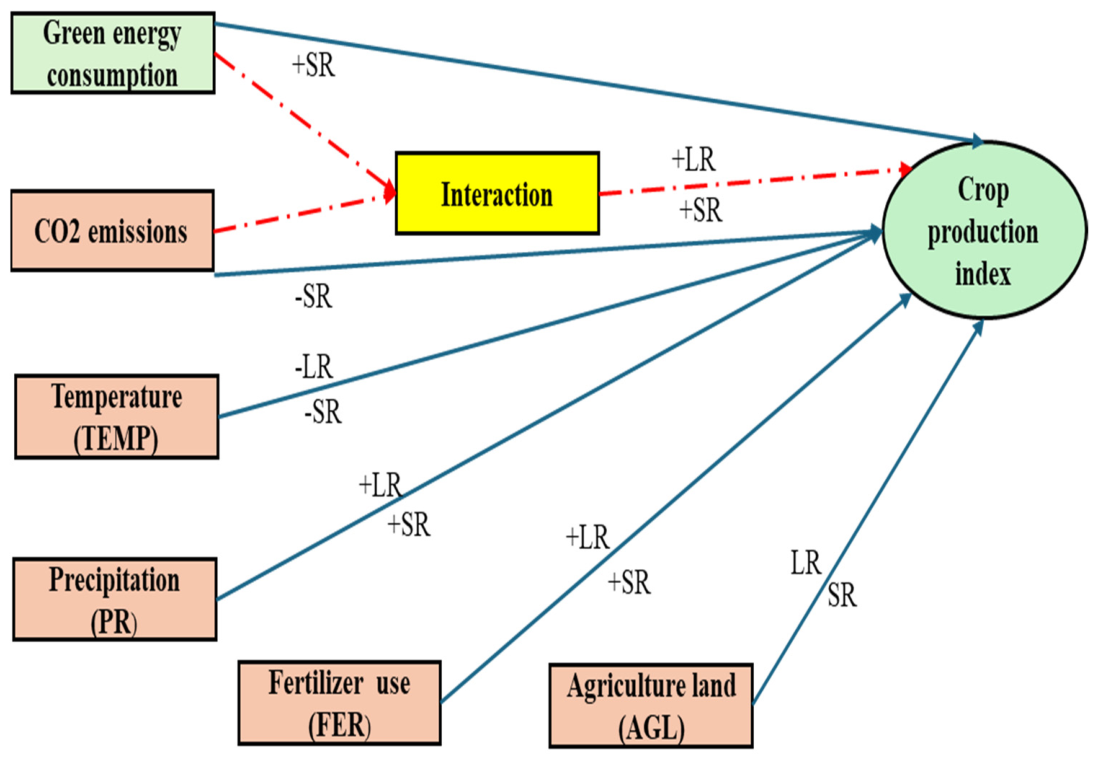
Building on the findings presented by the literature’s studies, we can justify the hypothesis in the following manner: an increase in green energy will promote food production in Afghanistan by decreasing the negative effect of CO2 emissions. Temperature will reduce food production due to the increasing drought in Afghanistan. Rainfall will significantly increase food production via water availability in Afghanistan. However, in simple words, green energy contributes to increased food production, whereas climatic factors such as temperature and CO2 emissions will decrease food production. Figure 2 presents the conceptual model linking CC, Green Energy Consumption (GEC), and food crop production in the long run (LR) and short run (SR).
Figure 2.
Conceptual framework of the study.
2. Materials and Methods
2.1. Source and Description of Data
This manuscript used time series data to estimate the decoupling impact of green energy on food crop production and CO2 emissions in Afghanistan. The time series data on the study variables cover 1996 to 2021 for Afghanistan. Specifically, the study employed several variables, including the food production index (FPI), CO2 emissions, green energy consumption (GEC), agricultural land (AGL), and fertilizer (FER), all obtained from the World Development Indicators (WDI). The study retrieved data on temperature (TEMP) changes on agricultural land (AGL) from FAOSTAT while obtaining precipitation (PR) from the World Bank climate change (WBC) knowledge portal. Table 1 presents information on the variables, detailing their origins and methods of measurement. In this study, the food production index is the dependent variable, and the interaction between CO2 emissions and green energy consumption is the endogenous variable. In Afghanistan, green energy refers to renewable energy sources that are environmentally sustainable, and the most feasible forms of green energy include: solar photovoltaics, small-scale wind turbines, micro-hydro power, biogas digesters, community-based energy systems, private-sector engagement, humanitarian–development partnerships, and integration with agricultural value chains.
Table 1.
Description of the variables.
The empirical analysis in this study is based on quarterly data from 1996Q1 to 2021Q4, depending on data availability in Afghanistan. To address the limitation of the short time span, this study follows the methodology adopted in recent studies [35,37], and applies the quadratic match-sum technique to convert annual data into a quarterly series. This approach helps adjust for cyclical fluctuations and mitigates the effects of data irregularities. As described by Shahbaz et al. [37], the quadratic match-sum method minimizes point-to-point variability, thereby providing more robust estimates and isolating the non-seasonal components of the data. Consequently, the constructed quarterly dataset spans from 1996Q1 to 2021Q4 (Table 1).
As a conventional practice, all variables were transformed to their logarithms to mitigate heteroskedasticity and obtain more reliable, consistent parameter estimates. Logarithmic transformation in time-series analysis helps stabilize variance, reduce skewness—particularly in right-skewed data with outliers—linearize nonlinear relationships, and convert multiplicative changes (such as percentage growth rates) into additive effects, thereby making the data more suitable for econometric analysis [35].
2.2. Theoretical Framework and Model Conceptualization
The Environmental Kuznets Curve (EKC) is used in this study to examine the long-term evolution of environmental conditions. According to this theory, countries initially engage in activities that contribute to CC in the short term, such as rising temperatures, elevated CO2 emissions, and irregular rainfall patterns. Nevertheless, as economic growth is experienced in the medium term, they reach a “turning point” at which they are able to invest in low-emission technologies and enforce stricter environmental regulations to reduce pollution. At this stage, countries begin adopting approaches to counteract the negative effects of CC on the production of food. In line with international agreements, countries are increasingly investing in green technologies, renewable energy, and sustainable farming practices to combat CC and promote sustainable development.
In this context, this research seeks to estimate the complex association between food crop production and CC and examine the role of green energy in food production in Afghanistan. We sought to demonstrate that these relationships align with the EKC framework in the long run. Thus, this study proposes a theoretical framework to estimate the relationship between climatic factors and food crop production. Furthermore, green energy is crucial in mitigating the impact of CC on food production by decreasing CO2 emissions, promoting climate resilience, and supporting sustainable agrifood systems. This underscores the importance of the link between CO2 emissions and the dynamics of food production over time. However, this manuscript introduced the interaction of green energy and CO2 emission as an endogenous variable. The theoretical framework that demonstrates the connection between climatic factors, green energy, and crop production is as follows:
where lnFPI represents the natural logarithm of the food production index, β0 represents the constant term, lnCO2 * lnGEC, lnTEMP, lnPR, lnCO2, lnGEC, lnFER, and lnAGL represent the natural logarithm of the interaction lnCO2 * lnGEC, temperature, precipitation, CO2 emission, green energy consumption, fertilizer usage, and agricultural land, respectively. β1 to β7 represents the parameter to be estimated.
2.3. Analytical Approach
To estimate the asymmetrical relationships between the variables, the study used the nonlinear autoregressive distributed lag (NARDL) model, which was developed by Shin et al. [38]. The NARDL approach is especially valuable for exploring the relationships among variables during unexpected events, such as financial downturns, governmental shifts, disease outbreaks, and other disruptions. It functions as a dynamic error-correction algorithm capable of identifying both short- and long-term irregularities by differentiating the varying impacts of independent factors over time [35].
Furthermore, the NARDL model allows the incorporation of variables with diverse integration orders, including I(0), I(1), or a combination of I(0) and I(1). This characteristic enhances the model’s adaptability, making it ideal for examining intricate connections. This study estimated the long-run asymmetric associations involving lnCO2 * lnGEC, lnTEMP, lnPR, lnCO2, lnGEC, lnFER, lnAGL, and lnFPI in Afghanistan. These relationships are expressed as follows:
In this equation, lnFPIt, lnCO2 * lnGEC, lnTEMP, lnPR, lnCO2, lnGEC, lnFER, and lnCL represent the respective variables over time in Afghanistan. The NARD model evaluates the asymmetric relationship between variables by accounting for both increases and decreases in the independent variables over time. This approach allows the NARDL model to capture the effect of negative and positive changes in explanatory variables on outcomes across time frames. To evaluate the potential asymmetrical association between the selected variables, this study applied the framework used by Bergougui and Aldawsari. [35]. The specific equations are as follows.
In this context, β represents the long-term coefficient of the asymmetric impact of lnCO2 * lnGEC, lnTEMP, lnPR, lnCO2, lnGEC, lnFER, and lnAGL. Positive shocks are represented by lnCO2 * lnGEC+, lnTEMP+, lnPR+, lnCO2+, lnGEC+, and lnFER+, while negative shocks are represented by lnCO2 * lnGEC−, lnTEMP−, lnPR−, lnCO2−, lnGEC−, and lnFER-. The coefficients for these positive and negative shocks represent the aggregate effects of changes in lnCO2 * lnGEC, lnTEMP, lnPR, lnCO2, lnGEC, lnFER, and lnAGL. The short-run dynamics are formed as follows, incorporating the NARDL approach.
In this formula, Δ presents the change in variables over time, while the error correction term (ECT) is added to address changes from the long-run equilibrium. ECT cannot adjust the long-run equilibrium following short-run disturbances. Therefore, the model can augment the use of ECT, the model framework, and the equations presented below.
In the equations above, the symbols (+) and (−) represent the positive and negative variations in the model, respectively. β represents the long-run regressor coefficient, while α is the short-run regressor coefficient. ECT represents the error correction term, with its coefficient θ indicating the rate at which adjustments are made to the LR. All econometric analyses, including the estimation of the Nonlinear Autoregressive Distributed Lag (NARDL) model and related diagnostic tests, were conducted using EViews version 13.
3. Empirical Results and Discussion
3.1. Preliminary Result
Before presenting the main findings, we briefly summarise the trends of the studied variables. Table 2 presents a detailed descriptive summary of the characteristics of the studied variables, including the mean values for lnFPI, lnCO2 * lnGEC, lnTEMP, lnPR, lnCO2, lnGEC, lnFER, and lnAGL, along with their respective standard deviations. These statistics suggest that the average food crop production index is 4.47246, ranging from 4.10351 to 4.740718. The mean values of the interaction variables lnCO2 * lnGEC(−6.36276) ranged from –11.56939 to −2.15439; the values of the climatic factors, LnTEMP (0.02269) ranged between 0.85983 and −2.5371; lnPR (5.8030) ranged between 6.11560 and 5.21241; lnCO2 (−1.89708) ranged between −3.04046 and −0.87191; lnGEC (3.21195) ranged between 4.142983 and 3.84347; lnAG (4.06315) ranged between 4.142983 and 4.07437; and lnFER (1.21597) ranged between −0.9706 and 3.04407.
Table 2.
Descriptive statistics summary.
Moreover, the skewness values show that most study variables are negatively skewed. It showed moderate variability and significant non-normality. Specifically, the variables lnCO2, lnCO2 * lnGEC, and lnTEMP were left-skewed, and lnPR was right-skewed. lnFPI and lnFER exhibited smaller variations, with distributions close to normal. However, the non-normality of lnCO2 * lnGEC, lnTEMP, lnCO2, lnPR, lnGEC, and lnAGL highlights potential nonlinear relationships, justifying the need for advanced models such as NARDL. The variability and skewness across the variables suggest diverse patterns in food crop production and CC, making this dataset suitable for investigating asymmetric effects. Thus, using the NARDL model is important for effectively detecting potential nonlinearity in the data [39].
Furthermore, to identify collinearity among the regressors, we followed standard practice in the literature [40] by “mean-centering the CO2 emissions and green energy variables” before generating the interaction term. This transformation reduces non-essential multicollinearity without affecting the interpretation of the interaction effect. After this adjustment, we reassessed the model using the Variance Inflation Factor (VIF). The results confirm that multicollinearity is not a severe problem in our specification, as all VIF values are well below the critical threshold of 10 (Table A1).
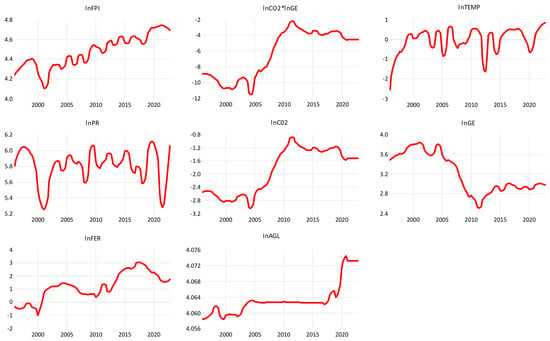
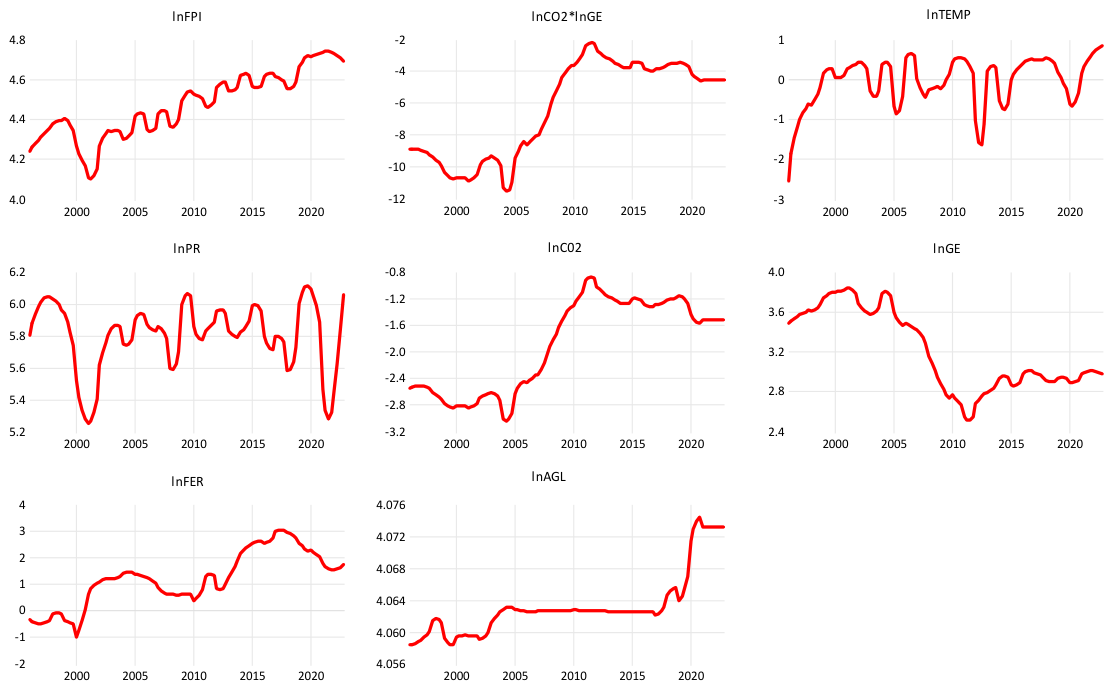
Figure 3 shows the graphical trends for the study variables. Trend analysis revealed distinct patterns across the study variables. lnTEMP, lnPR, and lnCO2 exhibited general rising and downward trends across the years. This suggests that climatic conditions are erratic and exhibit seasonal and annual variations. The lnFPI demonstrates an increasing trend over the period. lnGEC shows an initial decline, stabilising after 2012, while lnFER fluctuates with a peak around 2016. Finally, the lnAGL continues to fluctuate over time. These trends highlight the dynamic interactions between resource management and environmental quality, justifying the study’s focus on asymmetric impacts.
Figure 3.
Trend analysis of the study variables.
3.2. Nonlinear Test
To estimate the potential nonlinearity of lnFPI, lnCO2 * GEC, lnTEMP, lnPR, lnCO2, lnGEC, lnFER, and lnAGL, we used the Brock Dechert Scheinman (BDS) test. The findings are described in Table 3. The analysis hypothesizes that the variables follow a linear distribution when the BDS statistic falls below the critical values across dimensions. In contrast, the alternative hypothesis suggests a nonlinear distribution if the Z-statistic exceeds the critical values across dimensions. Our analysis revealed that the Z-statistic values for all variables were considerably below the critical thresholds at the 1% level of significance. This finding leads to the dismissal of the null hypothesis, offering robust evidence for nonlinear dynamics in the relationships under investigation.
Table 3.
Results of the BDS test for nonlinearities.
3.3. Outcomes of Unit Root Analysis
Time-series data frequently exhibit unit-root properties, which may lead to erroneous estimates and misleading statistical inferences if non-stationarity is not properly addressed [22]. Therefore, we examined the stationarity properties of all variables using the Augmented Dickey–Fuller test (ADF) and Phillips–Perron test (P–P) unit root tests. The results indicate that all variables are integrated at either I(0) or I(1), as reported in Table 4. Specifically, the ADF and P–P test results show that lnFPI, lnCO2 × lnGEC, lnCO2, lnGEC, lnFER, and lnAGL are non-stationary at their level form but become stationary after first differencing. At the first-difference level, I(1), these variables achieve stationarity, as confirmed by statistically significant test statistics (p < 0.05 or p < 0.01) across both testing approaches. In contrast, lnTEMP and lnPR are stationary at level, indicating integration of order I(0). Overall, the mixed order of integration—limited to I(0) and I(1)—confirms that the dataset satisfies the necessary preconditions for applying the Nonlinear Autoregressive Distributed Lag (NARDL) model.
Table 4.
Variables stationarity test.
3.4. Optimum Lag Selection
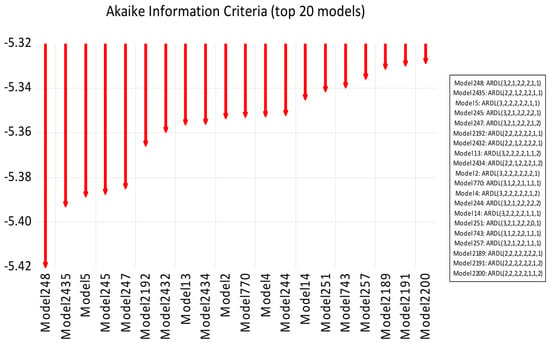
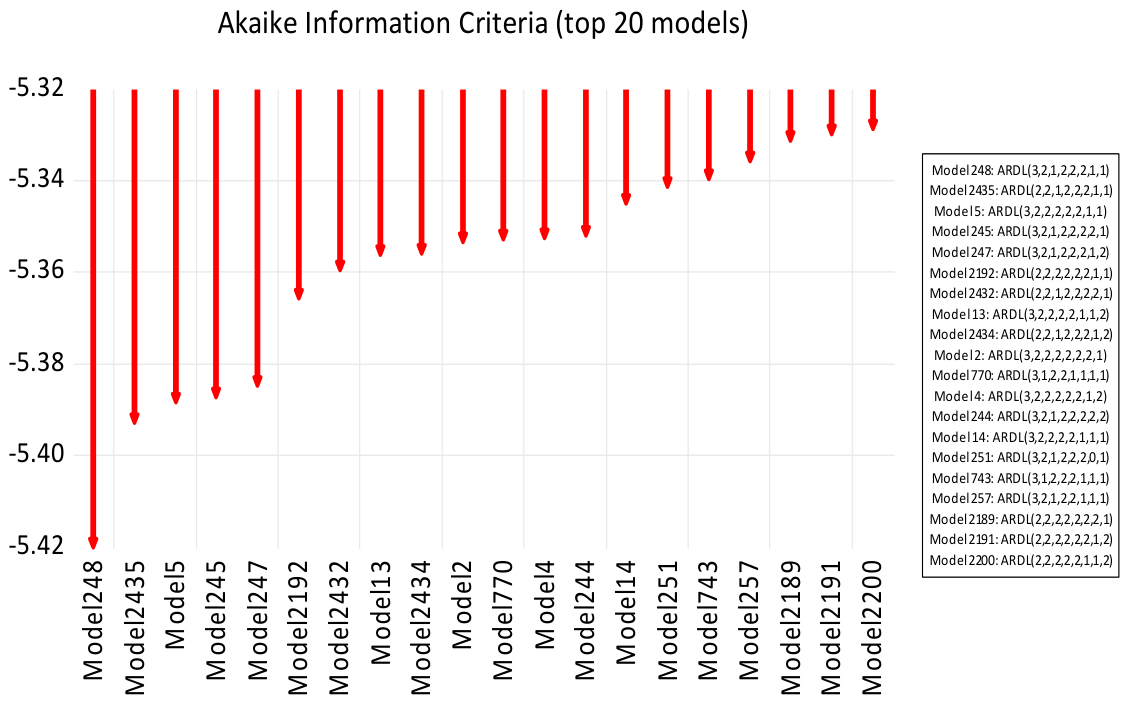
Before estimating the empirical model, we used the Akaike Information Criterion (AIC) to determine the optimal lag length for the NARD model. As shown in Figure 4, the Akaike Information Criterion (AIC) results for model selection indicate the optimal ARDL specifications for ARDL (3,2,1,2,2,2,1,1). This model had the lowest AIC values among the top 20 models, suggesting that it provided the best balance of goodness-of-fit and model complexity. The downward trend in the AIC values highlights the importance of lag selection in capturing the dynamic relationships of the variables. These results confirm the need for appropriately lagged ARDL models to accurately analyze the short- and long-run.
Figure 4.
Model selection criteria.
3.5. NARDL Bounds Test of Cointegration
As part of ongoing analysis on the estimation of the long-term cointegration among the indicators, this study applied the F-test. The cointegration findings are accessible in Table 5. The bound test’s F-statistics were found to be 4.20666, surpassing the critical values at the 99% confidence level. The F- dismissed the null hypothesis, indicating a cointegrating relationship exists between the dependent and independent variables. Thus, a long-run association between LnFPI and its relevant factors have been established.
Table 5.
The result of the cointegration test.
3.6. Asymmetric NARDL Empirical Analysis and Discussion
Once nonlinear cointegration between the variables is established, the next test involves calculating the coefficient estimation for short and long periods. This measurement enables the examination of how both positive and negative variations in lnFPI, lnCO2 * lnGEC, lnTEMP, lnPR, lnCO2, lnGEC, lnFER, and lnAGL affect lnFPI.
3.6.1. Long and Short-Run Results of an Asymmetric Relationship
This empirical research investigates the asymmetric effect of the moderating role of green energy on food production, alongside the effects of climatic factors on the food production nexus. The estimated long- and short-run asymmetric effects of climatic factors on food production, as well as the moderating role of green energy on the climate change–food crop production nexus obtained from the NARDL model, are reported in Table 6. The error correction of the NARDL model was fitted using the maximum lag option, with lag selection based on the AIC. Going to the key result, the results indicate that, in the long run, a positive 1% shock in the interaction between green energy and CO2 emissions leads to a 0.7884% increase in food production, while a negative 1% shock in this interaction results in a 0.1575% increase in food production. These findings suggest that positive shocks exert a stronger influence than negative shocks in enhancing food production over the long term. Accordingly, positive changes in the interaction between green energy and CO2 emissions significantly affect food crop production in Afghanistan. Similarly, the short-run estimates reveal that both positive and negative changes in the interaction between green energy and CO2 emissions are associated with increases in food production; however, positive shocks again exhibit a more pronounced effect.
Table 6.
NARDL Model: The asymmetric impact of CC on food production in Afghanistan.
These results reflect Afghanistan’s current economic trajectory, which heavily depends on the exploitation of natural resources—particularly mineral extraction and fossil fuel consumption—leading to elevated CO2 emissions. Therefore, the emission is likely to cause food insecurity via decreasing food crop production and quality. Consistent with the findings of Subramaniam et al. [41] and Kyire et al. [22] for Ghana, our results demonstrate that green energy mitigates the adverse effects of CO2 emissions on food crop production in the long run. This indicates a decoupling effect of green energy in the CO2–food production nexus. Green energy likely limits excessive CO2 emissions and their detrimental consequences, such as intensified climate variability, altered precipitation patterns, rising temperatures, and more frequent extreme weather events. These phenomena directly threaten food security and agricultural productivity, particularly in semi-arid and drought-prone countries such as Afghanistan. Overall, the findings suggest that expanding green energy adoption can help stabilize the climate, enhance agricultural resilience, and support sustainable and stable food production and distribution in Afghanistan and other developing countries.
Furthermore, the impact of climate change on food crop production exhibits heterogeneous outcomes. The temperature’s effect on food crop production follows the Environmental Kuznets curve ideology. In the long run, a 10% increase in temperature leads to a 0.01263% decline in crop yield, whereas a 5% decrease in temperature results in a 0.03990% increase in crop production. This pattern may be attributed to the fact that higher temperatures tend to intensify drought conditions, thereby negatively affecting crop growth and productivity in Afghanistan. In the short run, however, temperature fluctuations, whether positive or negative, are associated with declines in crop yields. Specifically, positive temperature shocks lead to a 0.05596% reduction in crop production. The impact of temperature on food production in Afghanistan reflects the widely held belief that increasing temperature reduces food production. Rising temperatures can diminish yields, degrade crop quality, and increase plant stress, particularly during critical growth stages such as flowering and grain filling. To explain, Afghanistan is in the early phases of economic growth. Thus, an aggressive quest for food production through unsustainable practices like bush burning, deforestation, excessive use of pesticides and fertilizer, and too many emissions from industries. This will reduce the environment, raise temperatures, and affect food crop production and food security. Our results are consistent with those of Chandio et al. [13], who documented the adverse effects of increased temperatures on crop production in China. Similarly, Singh et al. [42] reported that higher temperatures impact crop yields in India.
The regression findings indicate that both the long-term and short-term precipitation coefficients are positive and statistically significant. Both positive and negative shocks in annual average precipitation have asymmetric effects on crop production in Afghanistan. Specifically, a 5% increase in average precipitation leads to a 0.18420% increase in crop production, whereas a 5% decrease results in a smaller increase of 0.016417% in the long run. These results suggest that positive precipitation shocks have a stronger effect on enhancing crop production than negative shocks. A similar asymmetric pattern is observed in the short period, where both an increase and a decrease in average precipitation are asymmetrically impacted in crop production, but the effect of positive shocks remains more pronounced. Precipitation enhances crop productivity by supplying water for plant growth and germination, facilitating nutrient transport within the soil, preserving soil structure, reducing pest and disease pressures, promoting pollination, and stabilizing crop yields Kyire et al. [22]. Consistent with our result, the study by Gyamerah et al. [43], and Chandio et al. [44] reported that precipitation improves food crop production and emphasized the beneficial role of precipitation in guiding adaptive strategies. Agriculture in Afghanistan depends heavily on winter snowfall and spring rainfall for both irrigated and rainfed farming systems, with average annual precipitation ranging from about 322 to 355 mm [4].
In recent years, Afghanistan has experienced high climate variability, and recurrent droughts have caused significant agricultural losses. Consequently, adopting improved varieties of rice and maize may be beneficial in certain regions; however, their high-water requirements limit their broader applicability. Therefore, the adoption of drought-tolerant wheat and barley varieties—well-suited to Afghanistan’s arid and semi-arid regions is critically important. Vegetables such as potatoes are also highly significant in mountainous areas, as they provide a resilient crop option. More importantly, traditional Afghan wheat varieties, which exhibit strong resistance to local climatic conditions and possess high nutritional value and desirable taste, can further enhance food security despite their relatively low yields. At the same time, the use of small-scale irrigation systems helps mitigate the risks associated with rainfed agriculture [29]. Beyond field crops, reforestation and the restoration of productive tree crops, including fruit and nut trees, can contribute to sustainable agriculture, floodwater management, and urban greening. Together, these strategies promote a diversified and water-efficient agricultural system that supports continued production under erratic precipitation patterns, thereby strengthening crop productivity and national food security.
Our study employs CO2 emissions per capita as an indicator of anthropogenic emission intensity and environmental stress generated by fossil fuel combustion, energy use, and industrial activities in Afghanistan. Importantly, this variable does not capture the direct atmospheric CO2 concentration affecting crop physiology; rather, it reflects broader environmental stress associated with emission-driven climate change and ecological degradation. Furthermore, despite the common belief that higher CO2 levels may promote plant growth through a fertilization effect, improved water use, and potentially increased biomass [22]. Our empirical findings reveal a statistically significant negative relationship between CO2 emissions per capita and food production. Specifically, our results indicate that a 1% increase in CO2 emissions per capita reduces crop production by approximately 0.90%, while a 10% decrease in CO2 emissions reduces crop production by about 0.38%, reflecting a clear asymmetric long-run relationship. These results suggest that increases in emission intensity impose stronger adverse effects on agricultural productivity than the gains achieved through emission reductions. In the short run, both positive and negative shocks to CO2 emissions exert asymmetric effects on food production, with negative shocks showing a relatively stronger mitigating impact. This finding implies that even temporary reductions in emissions could yield meaningful improvements in agricultural performance.
The adverse effects of higher emissions are likely transmitted through indirect climate-related mechanisms, including rising temperatures, increased climate variability, water scarcity, soil degradation, and heightened pest and disease incidence. These environmental stresses reduce crop yields and agricultural stability, particularly in climate-vulnerable economies such as Afghanistan. While controlled experimental studies sometimes highlight potential CO2 fertilization benefits, such effects are unlikely to offset the broader and more persistent damages associated with emission-induced climate change under real-world conditions [4]. From a theoretical perspective, the observed negative association between CO2 emissions per capita and food production does not support the Environmental Kuznets Curve (EKC) hypothesis for Afghanistan. The country’s dependence on fossil fuel–based and resource-intensive energy systems contributes to rising emissions that intensify climate risks and undermine agricultural productivity and food security. Overall, the findings align with existing empirical evidence indicating that higher emission intensity is associated with declining agricultural performance in developing and climate sensitive regions [45].
Regarding green energy consumption (GEC), the regression estimation shows that a 10% increase in green energy consumption increases crop production by 0.466958%, whereas a 10% negative shock increases crop production by 0. 432982% in the long run. Similarly, the short-term findings show that a 5% negative shock in green energy enhances crop production by 0.432981%, whereas a positive shock in green energy increases crop production by 0.20695%, but it is not significant. It justifies that the impact of green energy on crop production is positive in the long term but negative in the short term. Our result is consistent with the study by Kyire et al. [15], which reported the positive role of green energy in food security in Ghana.
This research incorporates control variables like fertilizer and the area dedicated to agriculture, both of which collectively influence crop yield. The regression findings show that 10% negative shocks in lnFR resulted in a 0.07368% reduction in lnFPI over the long run. However, an increase in lnFR does not influence lnFPI. Regarding lnAG, a 10% positive shock in lnAG increases lnFPI by 0.8471%. Conversely, over the short term, a positive change resulted in a significant decrease in crop production by 0.61613%.
3.7. Model Stability and Diagnostic Tests
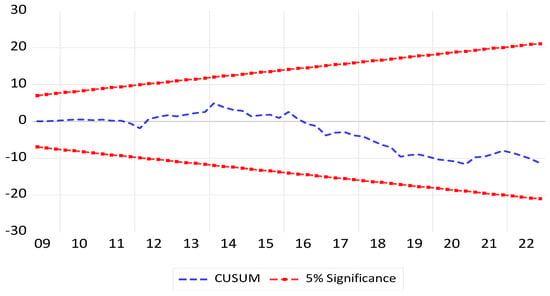
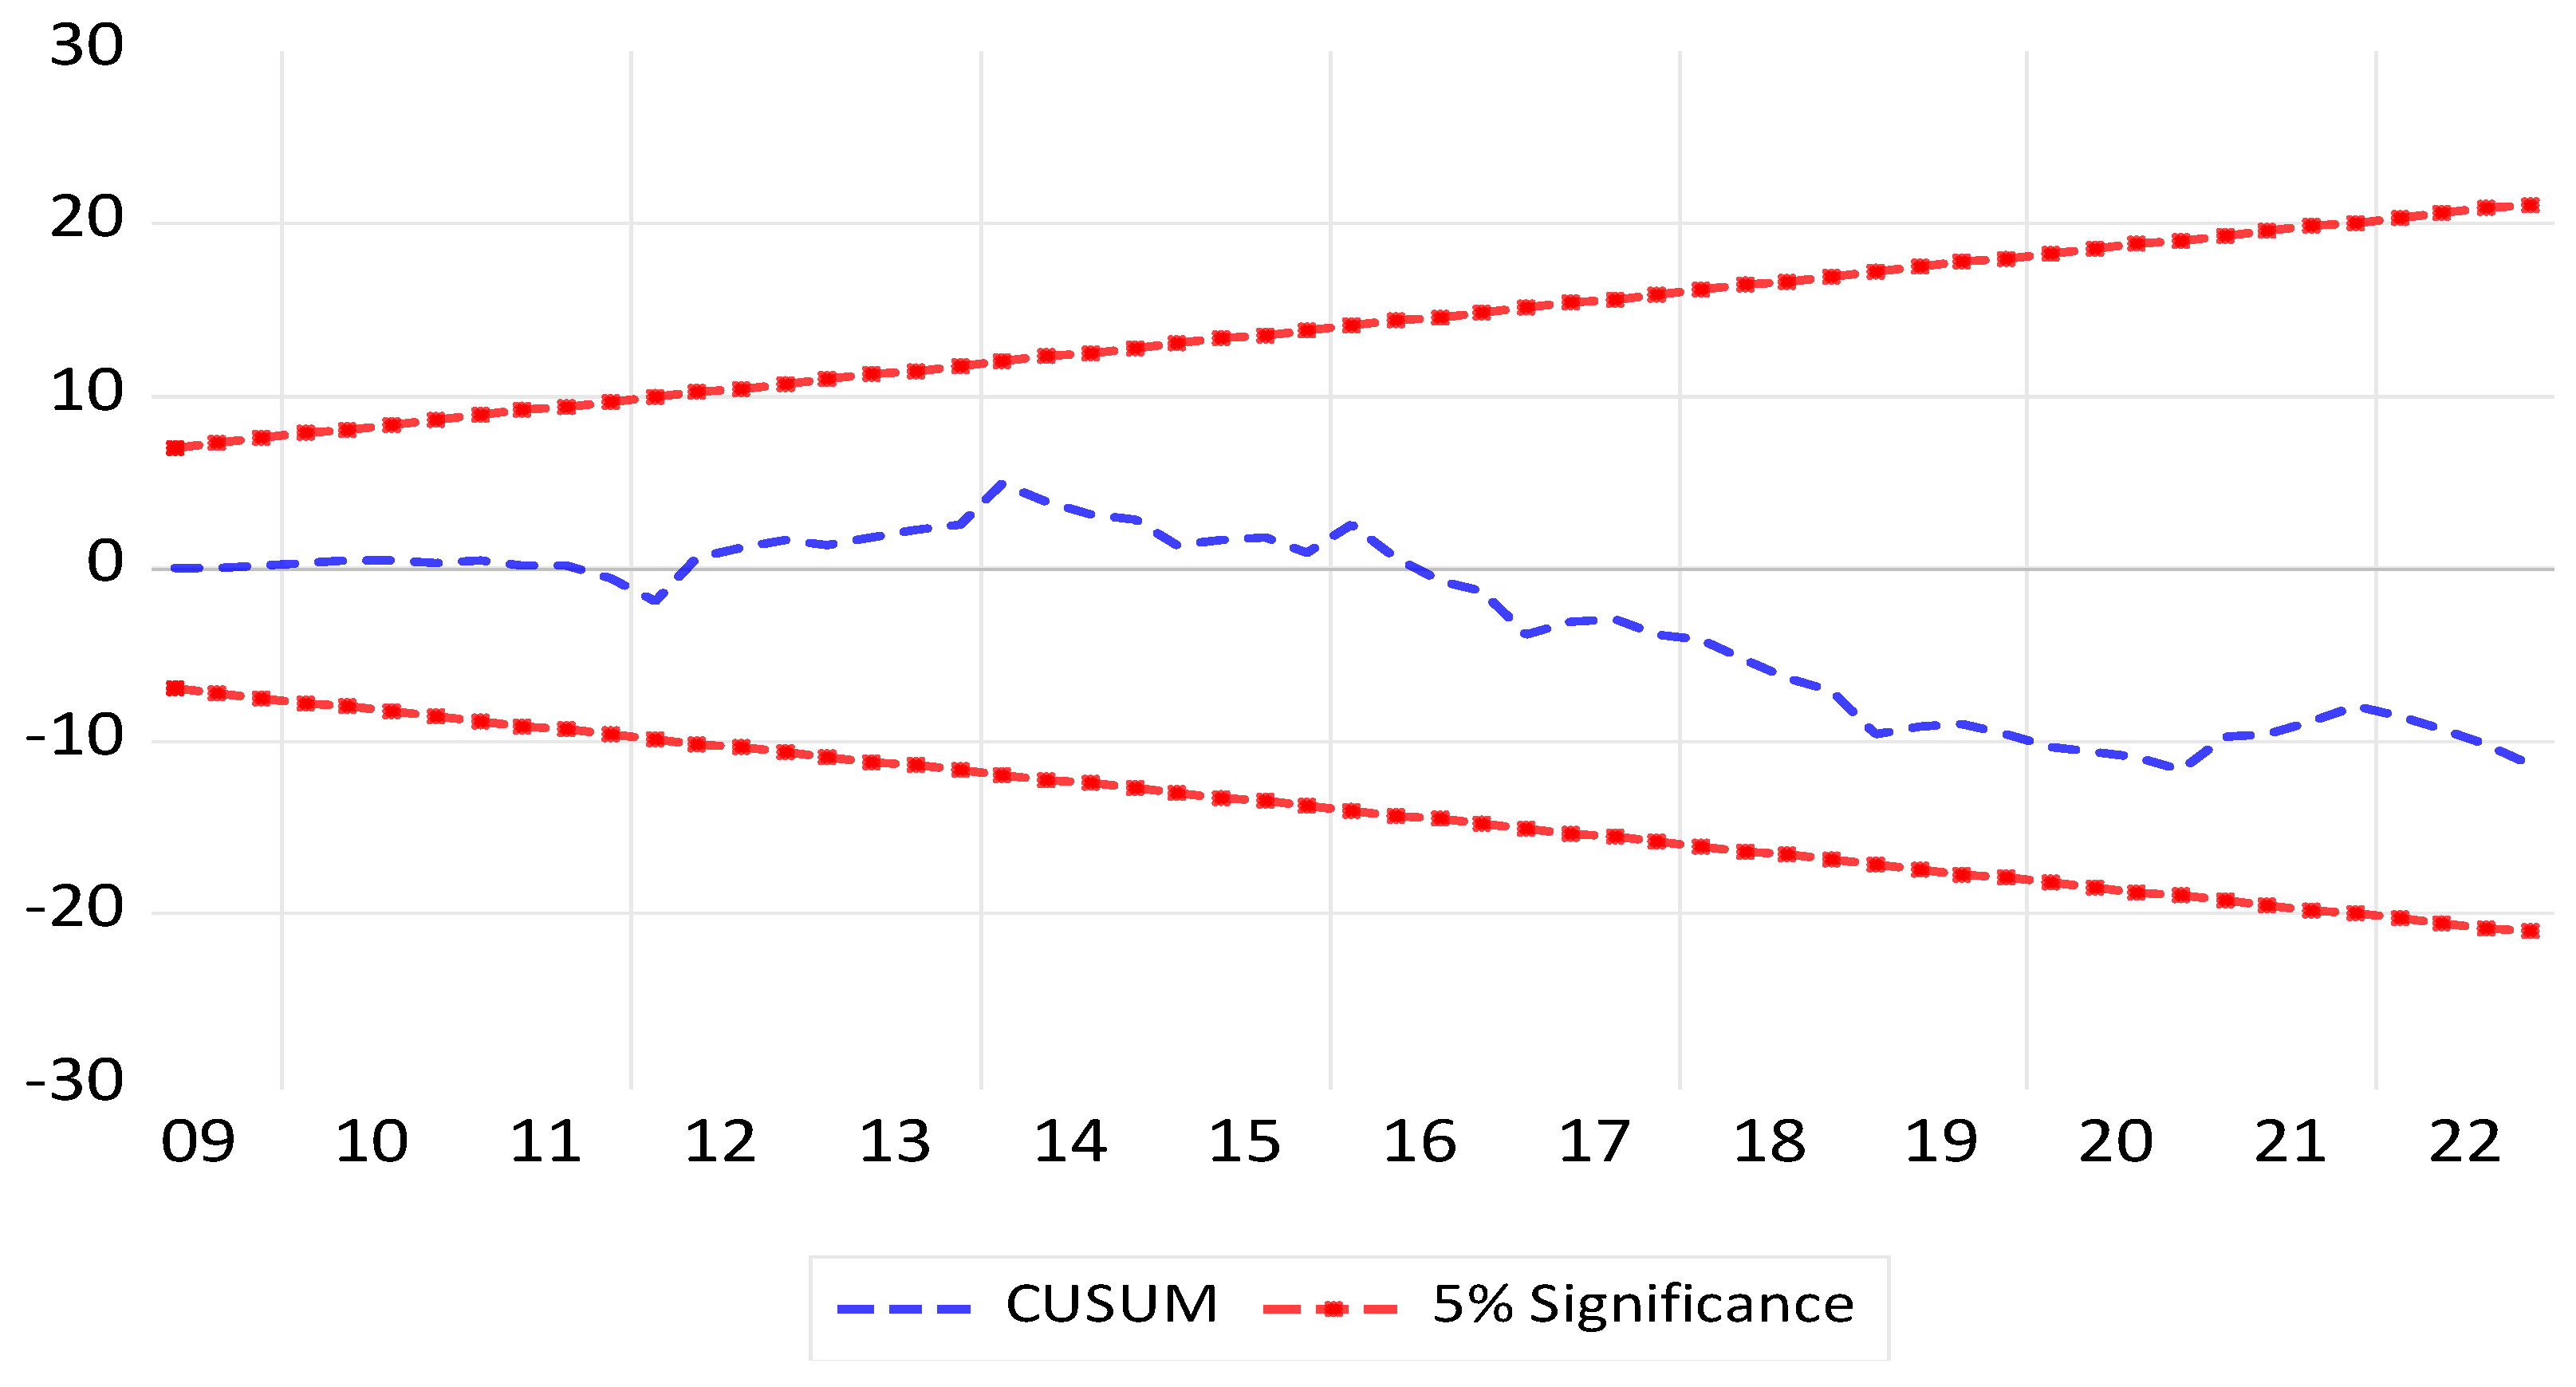
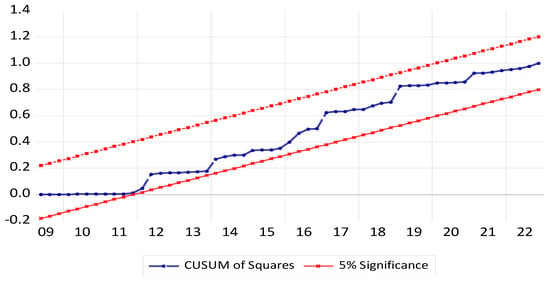
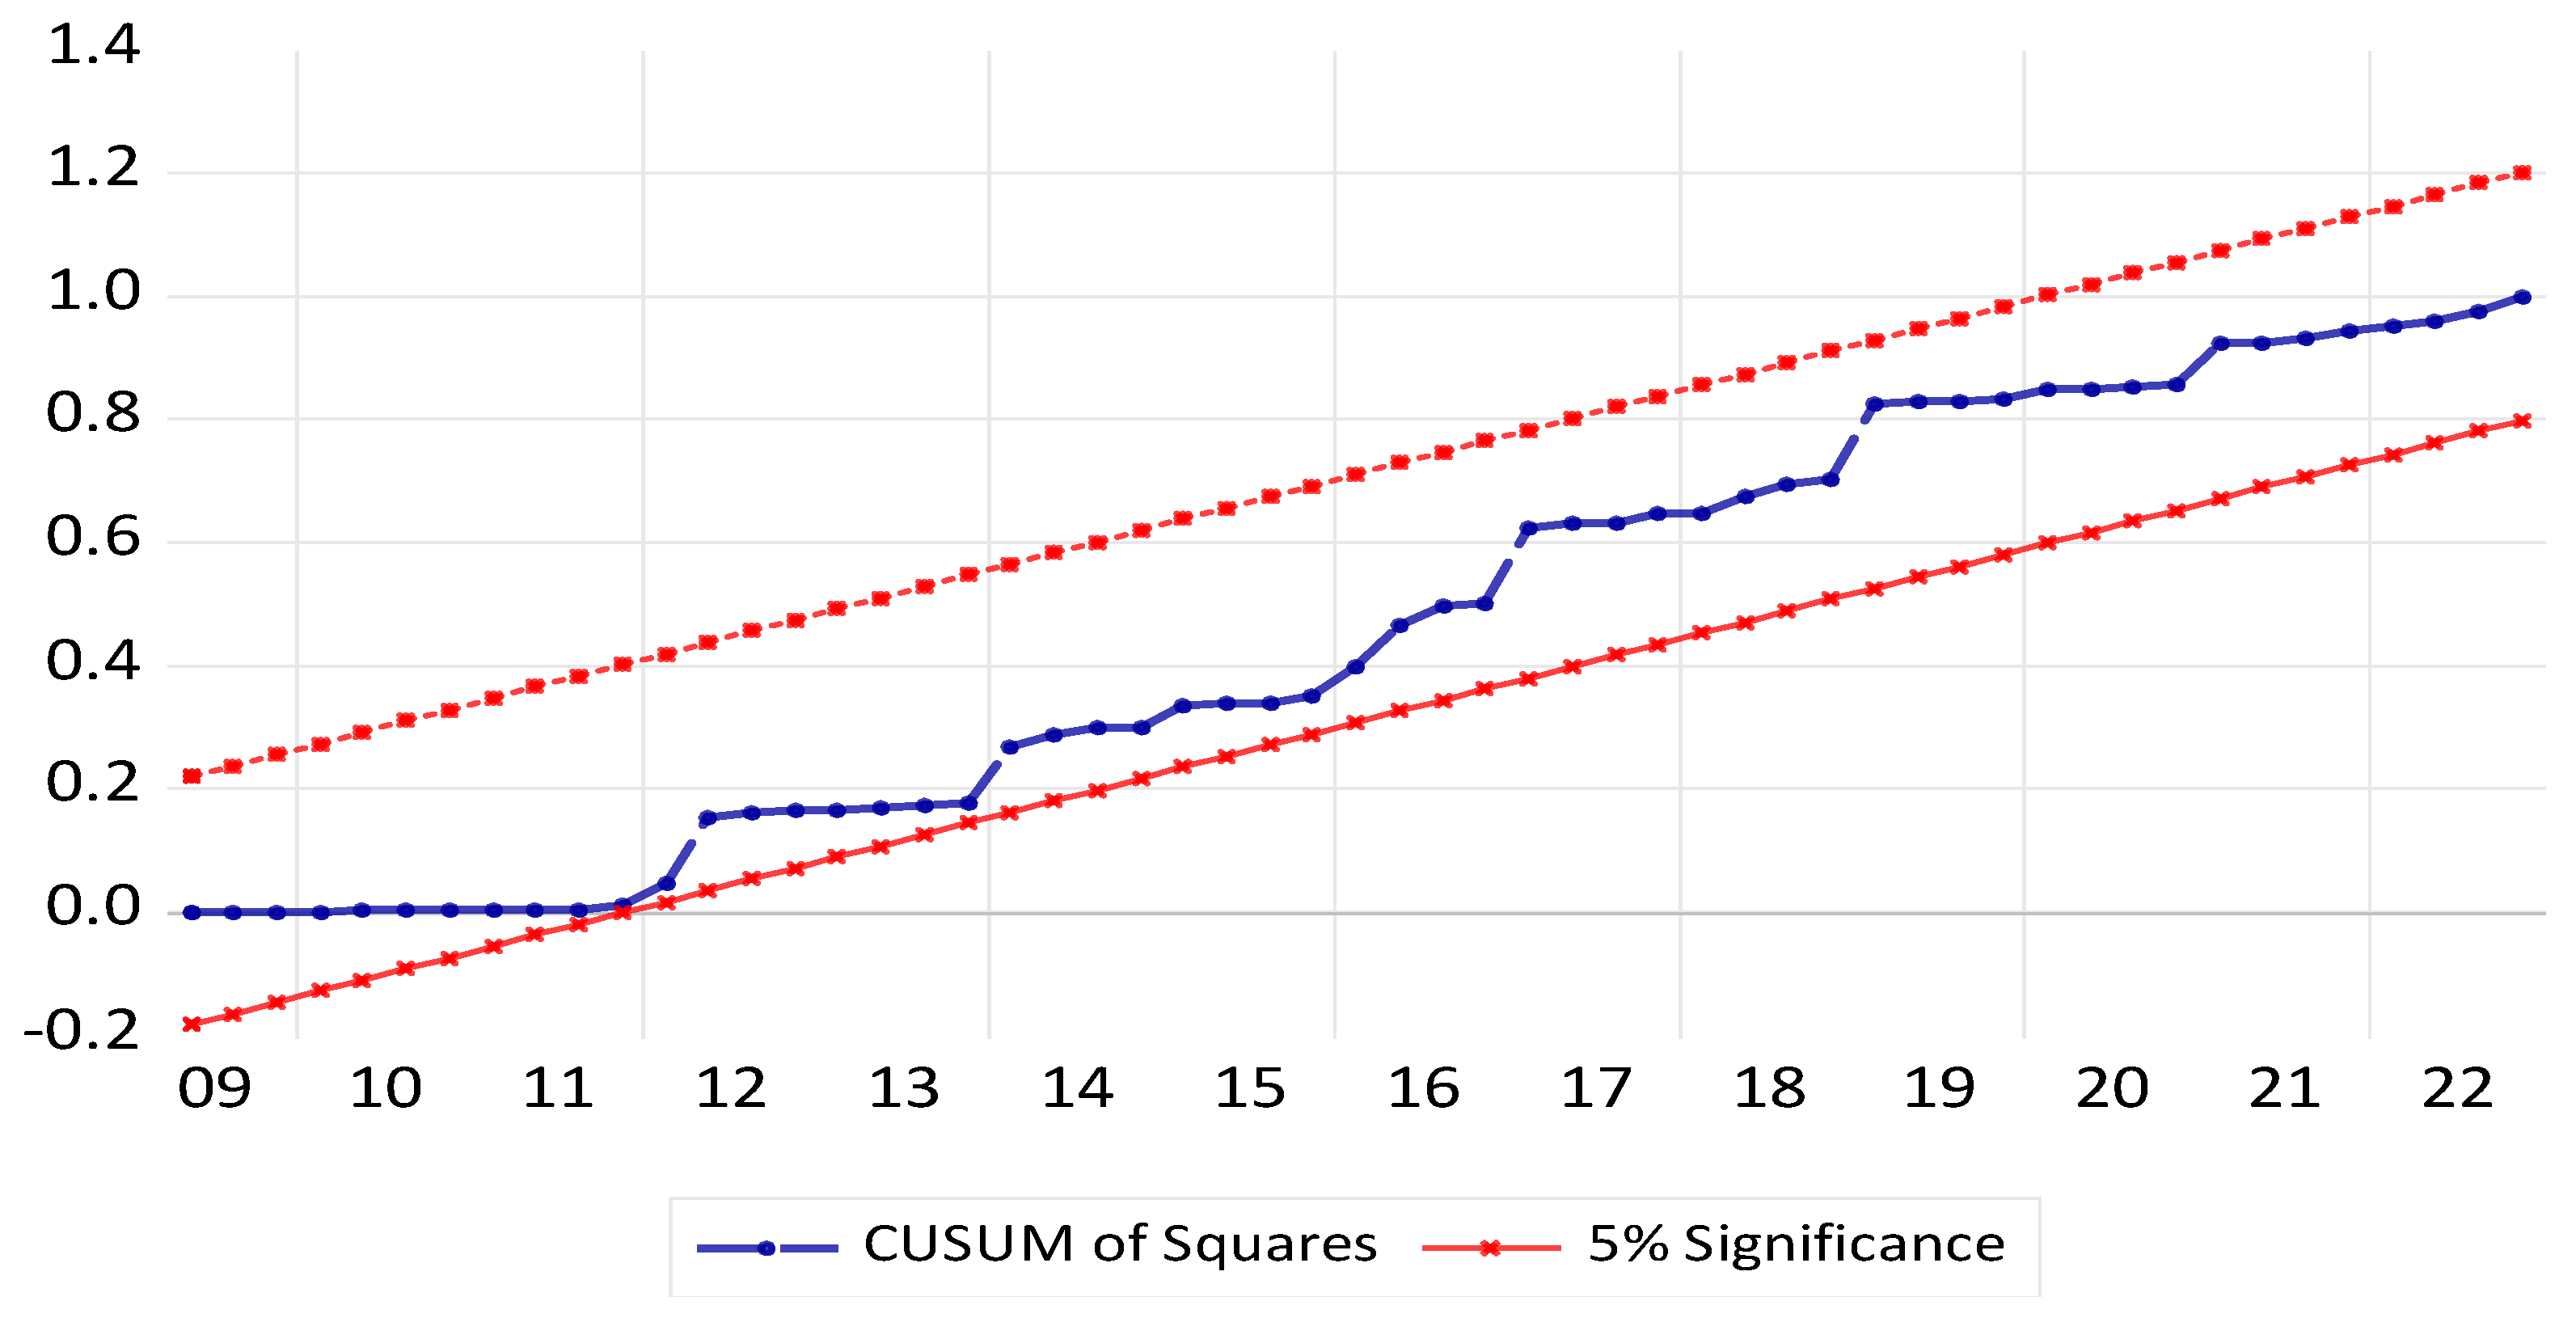
Table 7 presents the model diagnostic tests, which confirm the robustness of the findings. The Wald test showed substantial long-term asymmetry for the model, revealing that changes negatively or positively in the independent variables had differing effects on lnFPI. The Breusch-Godfrey LM test results show no serial relationship in either model. Additionally, the Breusch/Pagan test specified the absence of heteroscedasticity between the variables in the model. The Ramsey RESET test verifies the proper model specification, and the CUSUM and CUSUMSQ tests (Figure 5 and Figure 6) demonstrate the model stability, with plots remaining within 95% confidence intervals.
Table 7.
Model diagnostic test.
Figure 5.
CUSUM test for model stability.
Figure 6.
CUSUM of Squares tests for model stability.
4. Conclusions and Policy Implications
4.1. Conclusions
Agricultural productivity is globally affected by extreme climatic factors. Therefore, green energy is important to increase agrifood production and raise environmental quality. The nonlinear autoregressive distributed lag (NARDL) model was used to examine data from 1996Q1 to 2021Q1. This research utilized data obtained from the Food and Agriculture Organisation (FAO) and the World Development Indicators (WDI). The key explanatory variables comprised interaction (CO2 * GR), temperature, precipitation, CO2 emissions, and green energy. The study also used fertilizer and land under cereal production as the control variables.
On the empirical front, we reached the following conclusion: Almost all the variables included in this study play a significant role in promoting crop production in Afghanistan. Specifically, the long- and short-term empirical results show that both increases and decreases in the interaction lnCO2 * lnGRC have a significant and positive effect on crop production. Similarly, temperature (both increases and decreases) negatively affected crop production, whereas increases and decreases in precipitation positively affected crop production in Afghanistan. In contrast, CO2 emissions (both increases and decreases) had a negative effect on crop production, whereas green energy consumption (both increases and decreases) contributed to higher crop production. Furthermore, although land under cereal production and fertilizer significantly influence food production in the short run, their impact is not significant in the long run.
4.2. Policy Implications and Limitations
The findings have important policy implications for Afghanistan’s efforts to rebuild and sustain food production. First, the study underscores the asymmetric effect of rainfall and temperature on food crop production in Afghanistan. Therefore, investing in research and development is crucial for creating new crop varieties that are resilient to CC and capable of producing higher yields than those currently available. Secondly, the majority of land in Afghanistan dedicated to crop cultivation depends on rain-fed agriculture, which makes it particularly susceptible to changes in rainfall patterns. The lack of sufficient irrigation system has made Afghanistan’s agriculture and economy highly vulnerable to climate risks, in particular to droughts. To mitigate this risk in Afghanistan, investing in irrigation infrastructure, especially in rural areas, is crucial for supporting farmers and promoting sustainable agricultural production. Furthermore, strengthening institutional and local capacities and developing improved water resource management systems are necessary to promote sustainable water use in Afghanistan.
Thirdly, green energy plays a significant and positive role in food production. This suggests that using more green energy sources can improve crop production and reduce food loss or waste. Therefore, the policy can make an effort to encourage the adoption of off-grid renewable energy solutions that offer cost-effective and dependable power to stakeholders. Afghanistan’s policymakers should prioritize decentralized, community-managed renewable energy systems—particularly solar-powered irrigation and agro-processing—as a strategic agricultural investment. By leveraging existing international partnerships and climate finance mechanisms, these interventions can simultaneously enhance food production, reduce emissions, and build climate resilience, even within the country’s challenging political context. Furthermore, farmers can adapt their production systems to evolving climate conditions by implementing more effective farm management practices and adopting CC mitigation strategies to ensure greater resilience and sustainability. Lastly, farmers need to move towards sustainable practices like diversification, afforestation, timely planting, early harvesting, etc., since climatic conditions are becoming erratic. Moreover, strengthening farmer cooperatives, extension services, and traditional water management practices—such as community-managed irrigation systems—can enhance policy effectiveness under Afghanistan’s existing institutional and financial constraints.
Although this study offers significant empirical results in the case of Afghanistan, the investigation is not without limitations that need to be addressed in future studies. This study focused on some climatic variables due to the omitted variables bias. Therefore, other climatic factors also predict food crop production in Afghanistan. Future investigations should consider additional factors, such as soil conditions, when examining the environmental impact on food crop production. Moreover, this study relies on quarterly data due to the limited availability of data in Afghanistan; therefore, future studies are encouraged to use annual data for further investigation.
Author Contributions
Conceptualization, S.A.S. and S.S.; methodology, S.A.S.; software, S.A.S.; validation, S.A.S., Z.H. and S.S.; formal analysis, S.A.S.; investigation, S.A.S.; resources, Z.H. and S.S.; data curation, S.A.S.; writing—original draft preparation, S.A.S.; writing—review and editing, A.Q.N., writing—review and editing, M.H.K. and S.S.; visualization, S.S.; supervision, S.S. and Z.H.; project administration, S.A.S.; funding acquisition, S.S. and Z.H. All authors have read and agreed to the published version of the manuscript.
Funding
This research was supported by National Science Centre, Poland under the OPUS call in the Weave programme, grant no. 2021/43/I/HS4/01090 and Basic Scientific Research Operating Fund of the Chinese Academy of Agricultural Sciences Y2026ZK02.
Data Availability Statement
The data that support the findings of this study are available on World Development Indicators. https://data.worldbank.org/ (accessed on 1 April 2026).
Conflicts of Interest
The authors declare no conflicts of interest.
Abbreviations
The following abbreviations are used in this manuscript:
| NARDL | Autoregressive Distributed Lag |
| UN | United Nations |
| SDGs | Sustainable Development Goals |
| CC | Climate Change |
| GHG | Greenhouse Gas (GHG) |
| IPCC | Intergovernmental Panel on Climate Change |
| WDI | World Development Indicators |
| EKC | Environmental Kuznets Curve |
| ECT | error correction term |
| FPI | Food production index |
| TEMP | Temperature |
| PR | Precipitation |
| GE | Green energy |
| FER | Fertilizer |
| BDS | Brock Dechert Scheinman |
| ADF | Augmented Dickey–Fuller |
Appendix A
Table A1.
Multicollinearity test.
References
- Food and Agriculture Organization. The State of Food Security and Nutrition in the World 2022; FAO: Rome, Italy, 2022. [Google Scholar]
- United Nations, Department of Economic and Social Affairs. Nations United Transforming Our World: The 2030 Agenda for Sustainable Development; United Nations, Department of Economic and Social Affairs: New York, NY, USA, 2015; Volume 1, p. 41. [Google Scholar]
- FAO. The State of Food Security and Nutrition in the World 2023; FAO: Rome, Italy; IFAD: Rome, Italy; UNICEF: New York, NY, USA; WFP: Rome, Italy; WHO: Geneva, Switzerland, 2023. [Google Scholar]
- Samim, S.A.; Hu, Z. Assessment of Food Security Situation in Afghanistan. SVU-Int. J. Agric. Sci. 2020, 2, 356–377. [Google Scholar] [CrossRef] [Scilit]
- Samim, S.A.; Hu, Z.; Stepien, S.; Amini, S.Y.; Rayee, R.; Niu, K.; Mgendi, G. Food Insecurity and Related Factors among Farming Families in Takhar Region, Afghanistan. Sustainability 2021, 13, 10211. [Google Scholar] [CrossRef] [Scilit]
- Ahmadzai, H.; Morrissey, O. Climate Shocks, Household Food Security and Welfare in Afghanistan. Food Policy 2025, 134, 102910. [Google Scholar] [CrossRef] [Scilit]
- Ahmadzai, H.; Morrissey, O. Crop Diversification, Household Welfare and Conflict: Afghanistan 2011–2017. J. Dev. Stud. 2025, 61, 381–399. [Google Scholar] [CrossRef] [Scilit]
- Samim, S.A.; Deng, X.; Amini, S.Y.; Hu, Z.; Cheng, W.; Yu, Z.; Olasehinde, T.S. Does Improving Technical Efficiency Increase Food Production? An Analysis of Wheat Farms in Afghanistan. Singap. Econ. Rev. 2024, 1–25. [Google Scholar] [CrossRef] [Scilit]
- Leao, I.; Ahmed, M.; Kar, A. Jobs from Agriculture in Afghanistan; World Bank Publications: Washington, DC, USA, 2018. [Google Scholar]
- Khalfaoui, R.; Goodell, J.W.; Mefteh-Wali, S.; Chishti, M.Z.; Gozgor, G. Impact of Climate Risk Shocks on Global Food and Agricultural Markets: A Multiscale and Tail Connectedness Analysis. Int. Rev. Financ. Anal. 2024, 93, 103206. [Google Scholar] [CrossRef] [Scilit]
- Wakweya, R.B. Impacts of Climate Change on Crop Production and Food Security in Ethiopia. Discov. Sustain. 2025, 6, 158. [Google Scholar] [CrossRef] [Scilit]
- Rahman, M.M.; Akter, R.; Abdul Bari, J.B.; Hasan, M.A.; Rahman, M.S.; Abu Shoaib, S.; Shatnawi, Z.N.; Alshayeb, A.F.; Shalabi, F.I.; Rahman, A.; et al. Analysis of Climate Change Impacts on the Food System Security of Saudi Arabia. Sustainability 2022, 14, 14482. [Google Scholar] [CrossRef] [Scilit]
- Naikwade, P.V. Impact of Climate Change on Wheat Productivity in India; Mohindra Publishing House: Chandigarh, India, 2022. [Google Scholar]
- Raoufi, H. Assessing Climatic Variation, Vulnerable Factors, and Reduction of Wheat Crop Production in Response to Climate Change in Afghanistan. Theor. Appl. Climatol. 2025, 156, 83. [Google Scholar] [CrossRef] [Scilit]
- Jawid, A.; Khadjavi, M. Adaptation to Climate Change in Afghanistan: Evidence on the Impact of External Interventions. Econ. Anal. Policy 2019, 64, 64–82. [Google Scholar] [CrossRef] [Scilit]
- Eckstein, D.; Künzel, V.; Schäfer, L. Global Climate Risk Index 2021; Germanwatch: Bonn, Germany, 2021. [Google Scholar]
- Dhayal, K.S.; Enyoghasim, M.O.; Anyanwu, K.C.; Onwe, J.C.; Giri, A.K. Impact of Green Energy, Strategic Commodities and Economic Policy Uncertainty towards Environmental Sustainability for Sub-Saharan Africa. Discov. Sustain. 2025, 6, 215. [Google Scholar] [CrossRef] [Scilit]
- Hameed, M.A.; Rahman, M.M.; Khanam, R. The Validity of the Environmental Kuznets Curve in the Presence of Long-Run Civil Wars: A Case of Afghanistan. Heliyon 2024, 10, e25341. [Google Scholar] [CrossRef] [Scilit]
- Masood, W.; Aquil, S.; Ullah, H.; Nadeem, A.; Mehmood, H.; Islam, Z.; Essar, M.Y.; Ahmad, S. Impact of Climate Change on Health in Afghanistan amidst a Humanitarian Crisis. J. Clim. Change Health 2022, 6, 100139. [Google Scholar] [CrossRef] [Scilit]
- Chandio, A.A.; Akram, W.; Min Du, A.; Ahmad, F.; Tang, X. Agricultural Transformation: Exploring the Impact of Digitalization, Technological Innovation and Climate Change on Food Production. Res. Int. Bus. Financ. 2025, 75, 102755. [Google Scholar] [CrossRef] [Scilit]
- Chandio, A.A.; Ozdemir, D.; Tang, X. Modelling the Impacts of Climate Change on Horticultural Crop Production: Evidence From Turkiye. Food Energy Secur. 2025, 14, e70040. [Google Scholar] [CrossRef] [Scilit]
- Kyire, S.K.C.; Dhaka, S.S.; Bannor, R.K.; Asare, J.K. Climate Change and Food Security Nexus in Ghana: The Role of Renewable Energy. Sci. Total Environ. 2025, 963, 178454. [Google Scholar] [CrossRef] [Scilit]
- Nhamo, L.; Mpandeli, S.; Liphadzi, S.; Mabhaudhi, T. Catalyzing Sustainable Development Goals through the Water-Energy-Food Nexus. iScience 2025, 28, 111902. [Google Scholar] [CrossRef] [Scilit] [PubMed]
- Gyamfi, B.A.; Kwakwa, P.A.; Adebayo, T.S. Energy Intensity among European Union Countries: The Role of Renewable Energy, Income and Trade. Int. J. Energy Sect. Manag. 2023, 17, 801–819. [Google Scholar] [CrossRef] [Scilit]
- Kwakwa, P.A. Sectoral Growth and Carbon Dioxide Emission in Africa: Can Renewable Energy Mitigate the Effect? Res. Glob. 2023, 6, 100130. [Google Scholar] [CrossRef] [Scilit]
- Nhamo, L.; Taguta, C.; Mpandeli, S.; Dirwai, T.; Liphadzi, S.; Mabhaudhi, T. Transforming Agricultural Water Management Through the Water–Energy–Food Nexus: Trends, Opportunities, Barriers and Solutions. Irrig. Drain. 2025, 1–12. [Google Scholar] [CrossRef] [Scilit]
- OECD. Agricultural Policy Monitoring and Evaluation 2022: Reforming Agricultural Policies for Climate Change Mitigation; Agricultural Policy Monitoring and Evaluation; OECD: Paris, France, 2022. [Google Scholar]
- Karri, V.; Nalluri, N. Enhancing Resilience to Climate Change through Prospective Strategies for Climate-Resilient Agriculture to Improve Crop Yield and Food Security. Plant Sci. Today 2024, 11, 21–33. [Google Scholar] [CrossRef] [Scilit]
- Samim, S.A.; Deng, X.; Li, Z. Climate-Smart Agricultural Practices- Determinants and Impact on Crop Production. New Insights from Afghanistan. Mitig. Adapt. Strateg. Glob. Change 2024, 29, 91. [Google Scholar] [CrossRef] [Scilit]
- Vatsa, P.; Ma, W.; Zheng, H.; Li, J. Climate-Smart Agricultural Practices for Promoting Sustainable Agrifood Production: Yield Impacts and Implications for Food Security. Food Policy 2023, 121, 102551. [Google Scholar] [CrossRef] [Scilit]
- Igharo, A.E.; Ibe, A.E.; Al-Faryan, M.A.S.; Khalid, A.A.; Okoi, I.E.; Ovat, O.O.; Caulker, S. Pragmatic Investigation of the Effect of Green and Low-Carbon Economies on Food Safety in Africa. Discov. Sustain. 2024, 5, 485. [Google Scholar] [CrossRef] [Scilit]
- Musse, O.S.H.; Echchabi, A.; Mohamud, I.H.; Shariff, M.N. Empirical Assessment of Climate Change Effect on Cereal Crop Production in the East African Community. Discov. Sustain. 2025, 6, 1147. [Google Scholar] [CrossRef] [Scilit]
- Chopra, R.; Magazzino, C.; Shah, M.I.; Sharma, G.D.; Rao, A.; Shahzad, U. The Role of Renewable Energy and Natural Resources for Sustainable Agriculture in ASEAN Countries: Do Carbon Emissions and Deforestation Affect Agriculture Productivity? Resour. Policy 2022, 76, 102578. [Google Scholar] [CrossRef] [Scilit]
- He, J.; Osabohien, R.; Yin, W.; Adeleke, O.K.; Uduma, K.; Agene, D.; Su, F. Green Economic Growth, Renewable Energy and Food Security in Sub-Saharan Africa. Energy Strategy Rev. 2024, 55, 101503. [Google Scholar] [CrossRef] [Scilit]
- Bergougui, B.; Aldawsari, M.I. Asymmetric Impact of Patents on Green Technologies on Algeria’s Ecological Future. J. Environ. Manag. 2024, 355, 120426. [Google Scholar] [CrossRef] [Scilit]
- Uzar, U.; Eyuboglu, K. Testing the Asymmetric Impacts of Income Inequality, Financial Development and Human Development on Ecological Footprint in Türkiye: A NARDL Approach. J. Clean. Prod. 2024, 461, 142652. [Google Scholar] [CrossRef] [Scilit]
- Shahbaz, M.; Raghutla, C.; Song, M.; Zameer, H.; Jiao, Z. Public-Private Partnerships Investment in Energy as New Determinant of CO2 Emissions: The Role of Technological Innovations in China. Energy Econ. 2020, 86, 104664. [Google Scholar] [CrossRef] [Scilit]
- Shin, Y.; Yu, B.; Greenwood-Nimmo, M. Modelling Asymmetric Cointegration and Dynamic Multipliers in a Nonlinear ARDL Framework. In Festschrift in Honor of Peter Schmidt; Sickles, R.C., Horrace, W.C., Eds.; Springer: New York, NY, USA, 2014; pp. 281–314. [Google Scholar]
- Sun, Y.; Razzaq, A.; Sun, H.; Irfan, M. The Asymmetric Influence of Renewable Energy and Green Innovation on Carbon Neutrality in China: Analysis from Non-Linear ARDL Model. Renew. Energy 2022, 193, 334–343. [Google Scholar] [CrossRef] [Scilit]
- Aiken, L.S. Multiple Regression: Testing and Interpreting Interactions; Sage: Newbury Park, CA, USA, 1991. [Google Scholar]
- Subramaniam, Y.; Masron, T.A.; Azman, N.H.N. Biofuels, Environmental Sustainability, and Food Security: A Review of 51 Countries. Energy Res. Soc. Sci. 2020, 68, 101549. [Google Scholar] [CrossRef] [Scilit]
- Singh, A.; Arora, K.; Chandra Babu, S. Examining the Impact of Climate Change on Cereal Production in India: Empirical Evidence from ARDL Modelling Approach. Heliyon 2024, 10, e36403. [Google Scholar] [CrossRef] [Scilit]
- Gyamerah, S.A.; Asare, C.; Mintah, D.; Appiah, B.; Kayode, F.A. Exploring the Optimal Climate Conditions for a Maximum Maize Production in Ghana: Implications for Food Security. Smart Agric. Technol. 2023, 6, 100370. [Google Scholar] [CrossRef] [Scilit]
- Chandio, A.A.; Gokmenoglu, K.K.; Joyo, M.A.; Jiang, Y. Modeling the Climate Change Impacts on Major Fruits Production: Recent Evidence from Pakistan. Sci. Hortic. 2024, 324, 112618. [Google Scholar] [CrossRef] [Scilit]
- Chandio, A.A.; Akram, W.; Bashir, U.; Ahmad, F.; Adeel, S.; Jiang, Y. Sustainable Maize Production and Climatic Change in Nepal: Robust Role of Climatic and Non-Climatic Factors in the Long-Run and Short-Run. Environ. Dev. Sustain. 2023, 25, 1614–1644. [Google Scholar] [CrossRef] [Scilit]

Disclaimer/Publisher’s Note: The statements, opinions and data contained in all publications are solely those of the individual author(s) and contributor(s) and not of MDPI and/or the editor(s). MDPI and/or the editor(s) disclaim responsibility for any injury to people or property resulting from any ideas, methods, instructions or products referred to in the content. |
© 2026 by the authors. Licensee MDPI, Basel, Switzerland. This article is an open access article distributed under the terms and conditions of the Creative Commons Attribution (CC BY) license.