


Abstract
Ocean warming driven by climate change is altering regional circulation patterns and the balance of hydrodynamic forcings in semi-enclosed seas. Understanding how these changes affect ocean circulation and stratification is critical, as they directly influence marine productivity and ecosystem functioning in highly sensitive regions such as the Gulf of California. This study examines the hydrodynamic response of the Gulf of California under three climate change scenarios (SSP1–2.6, SSP2–4.5, SSP5–8.5) projected from 2015 to 2100 using the CNRM-CM6-1-HR global climate model. We evaluate changes in sea surface temperature, surface circulation, and the relative contributions of dominant dynamic forcing mechanisms at annual and interannual scales. Results reveal a basin-wide warming trend accompanied by an increased frequency of extreme heat events. Surface current velocities weaken throughout the Gulf, exhibiting a consistent negative trend, with the strongest decline occurring under SSP5–8.5 in the central basin ( m s−1 year−1). Wind speed also shows a general decreasing tendency, contributing to reduced circulation intensity and enhanced stratification. The analysis of dimensionless numbers indicates moderate but consistent changes in the relative balance among inertial, baroclinic, and wind-driven processes. Although their proportions vary slightly across scenarios, the dominant forcing hierarchy remains largely preserved, suggesting a gradual modulation in forcing intensity rather than a fundamental reorganization of the hydrodynamic regime. These findings highlight spatial contrasts in climate sensitivity within the Gulf of California and underscore the importance of regional-scale assessments for anticipating future changes in circulation dynamics and marine ecosystem responses.
1. Introduction
As the oceans absorb heat, warming propagates into deeper layers, intensifying the vertical temperature gradient and strengthening water column stratification [1,2]. This enhanced stratification reduces the efficiency of physical processes that regulate ocean circulation, including wind stress, tidal mixing, and thermohaline circulation. A more stratified water column limits the vertical exchange of heat, dissolved oxygen, organic matter, and nutrients [3,4,5]. This reduction in nutrient supply to the euphotic zone constrains primary productivity, as nutrients remain trapped below the thermocline [6,7].
These changes occur heterogeneously across the ocean and may produce different responses at the regional scale, depending on the characteristics of each basin. This highlights the importance of evaluating how hydrodynamic forcings respond to climate change at the regional scale under climate change.
The Gulf of California is a semi-enclosed basin characterized by complex bathymetry, strong tidal forcing—particularly in the Midriff Islands region—seasonal wind-driven circulation, and permanent exchange with the Pacific Ocean at its mouth [8,9,10]. Previous studies have documented climate-related impacts in the Gulf of California, including long-term SST trends [11,12,13,14,15], ecological responses to increasing SST [16,17], deoxygenation processes [18,19], and effects on regional fisheries [20]. However, despite these advances, a comprehensive understanding of how hydrodynamic forcings respond to climate change—particularly their variability at annual and interannual timescales and their relative contribution across regions—remains limited.
The objective of this study is to evaluate the annual and interannual variability of SST and to diagnose, through the application of dimensionless numbers, the relative importance of the forces controlling the hydrodynamics of the Gulf of California under three climate change scenarios (Shared Socioeconomic Pathways, SSPs; SSP1–2.6, SSP2–4.5, and SSP5–8.5), using outputs from the CNRM-CM6-1-HR model [21]. The remainder of this manuscript is structured as follows. Section 2 describes the study area, data sources, and methodological approach, including the hydrographic and hydrodynamic analyses, climate model and scenarios. Section 3 presents the results of the climate change scenarios and their impacts on SST and hydrodynamic forcings within the Gulf of California. Section 4 discusses the implications of these findings in the context of regional climate variability, and Section 5 summarizes the main conclusions of the study.
2. Data and Methods
2.1. Study Area
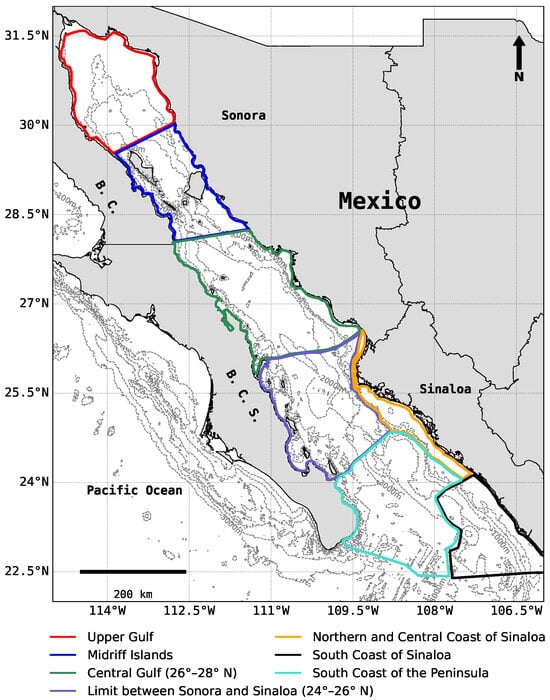
The Gulf of California (Figure 1), located in northwestern Mexico, is a semi-enclosed marginal sea characterized by complex bathymetry, strong air–sea interactions, and pronounced seasonal variability. These features generate sharp gradients in physical and biogeochemical properties, making the Gulf one of the most productive marine ecosystems in the eastern Pacific [17,22]. The combined influence of wind forcing, tidal dynamics, and large-scale climate variability makes the Gulf an ideal natural laboratory for investigating oceanographic processes and their responses to climate variability.
Figure 1.
Regionalization used for the Gulf of California. The Mexican states of Sinaloa, Sonora, Baja California (B.C.), and Baja California Sur (B.C.S.) are shown.
The Gulf exhibits a strong latitudinal gradient in temperature and biological productivity. The northern region, extending from the Midriff Islands to the Colorado River delta, is the coldest part of the basin, with a mean sea surface temperature (SST) of approximately 23.4 °C and predominantly eutrophic conditions, as indicated by chlorophyll-a concentrations of around 1.81 mg m−3 [23]. The central region exhibits intermediate hydrographic conditions, with a mean SST of approximately 24.6 °C and similarly eutrophic waters (1.53 mg m−3 of chlorophyll-a). In contrast, the southern region is the warmest part of the Gulf, with mean SST ranging from 25.9 to 26.8 °C and predominantly oligotrophic conditions, where chlorophyll-a concentrations vary between 0.37 and 0.95 mg m−3 [24].
Surface circulation in the Gulf is dominated by a marked seasonal cycle primarily driven by wind forcing. During winter, strong northwesterly winds originating over the North American continent typically reach speeds of 8–12 m s−1 [25]. These winds promote coastal upwelling along the eastern margin of the Gulf, leading to nutrient enrichment and enhanced biological productivity [8,26,27]. Under winter conditions, upper-layer circulation is predominantly anticyclonic at the basin scale. In contrast, summer circulation is associated with weaker southeasterly winds, with mean speeds of approximately 5 m s−1. These winds favor the inflow of Pacific waters through the mouth of the Gulf and promote a transition toward cyclonic circulation patterns [9,26,28].
Superimposed on the wind-driven seasonal circulation, tidal forcing plays a crucial role, particularly in the northern Gulf and the Midriff Islands region. In these areas, strong tidal currents interact with complex bathymetry, enhancing vertical mixing and generating residual flows that can substantially modify the mean circulation [28,29].
At intraseasonal timescales, tropical cyclones originating in the eastern tropical Pacific during summer significantly influence Gulf dynamics. These events generate coastally trapped waves (Kelvin waves) and topographic waves that propagate into the Gulf at speeds of approximately 150–300 km d−1. The resulting wave activity strongly modulates current variability, produces sea level fluctuations of 10–30 cm, and induces thermocline deepening on the order of 40–60 m [30,31]. At longer timescales, Gulf variability is closely linked to large-scale climate modes, particularly the El Niño–Southern Oscillation (ENSO). ENSO events generate positive SST anomalies and sea level rise in the Gulf, producing complex and spatially heterogeneous ecological responses across marine species and trophic levels [18,32,33,34,35,36]. The impacts of tropical cyclones at seasonal scales and ENSO at interannual scales can be understood through the propagation of coastally trapped waves, which act as efficient mechanisms for transmitting remote Pacific forcing into the Gulf [31,37].
In this study, the Gulf of California was subdivided into seven regions. This regionalization follows the hydrographic classification proposed by López-Martínez et al. (2023) [24], with a modification that separates the Upper Gulf from the Midriff Islands region to account for their distinct hydrodynamic regimes.
2.2. Climate Model
CNRM-CM6-1-HR is a global climate model developed by the French National Centre for Meteorological Research (CNRM) and the European Centre for Advanced Research and Training in Scientific Computing (CERFACS). Its atmospheric component is based on the ARPEGE-Climat v6.3 model, while biospheric processes are simulated using the ISBA-CTRIP model. Limnological dynamics are handled by the FLake model. These components are integrated via SURFEX v8.0, enabling simulation of the land–atmosphere continuum.
For oceanic processes, the model incorporates NEMO (Nucleus for European Modelling of the Ocean) and GELATO for sea ice dynamics, both coupled through the OASIS-MCT module v4.0. The vertical resolution includes 91 levels for the atmosphere, 75 for the ocean, 14 for soil, and 12 for snow. The model also utilizes the configurable input/output XML server ”XIOS”, developed by the Laboratory of Climate and Environmental Sciences at the Pierre-Simon Laplace Institute (IPSL/LSCE), to support high-performance, massively parallel simulations. Further details on the model configuration are available in Voldoire (2019) [21].
The CNRM-CM6-1-HR model has been extensively evaluated within the framework of the Coupled Model Intercomparison Project Phase 6 (CMIP6) [38]. Previous studies have demonstrated that CMIP6-class models are capable of realistically reproducing key aspects of the global climate system, including temperature trends, precipitation patterns, and large-scale circulation variability [39]. In particular, the CNRM-CM6-1 family has shown robust performance across multiple climate variables when compared to observations and reanalysis datasets [21,40]. Furthermore, the CNRM-CM6-1 model incorporates advanced representations of atmospheric processes, including cloud–radiation interactions and large-scale circulation dynamics [41], which contribute to its ability to simulate key features of the climate system. The high-resolution configuration (HR), with an ocean resolution of approximately 0.25°, enhances the representation of oceanic processes and improves the simulation of regional variability [42].
2.3. Climate Scenarios
The climate projections analyzed in this study are based on three Shared Socioeconomic Pathway scenarios (SSP1–2.6, SSP2–4.5, and SSP5–8.5), developed within the CMIP6 framework.framework of the Coupled Model Intercomparison Project Phase 6 (CMIP6) [43,44]. These scenarios combine greenhouse gas emission trajectories with socioeconomic development pathways to explore a range of possible future climate conditions. SSP1–2.6 represents a low-emissions pathway characterized by strong mitigation efforts and low radiative forcing. SSP2–4.5 describes an intermediate pathway with moderate emissions and challenges for mitigation and adaptation. In contrast, SSP5–8.5 corresponds to a high-emissions pathway associated with continued reliance on fossil fuels and high radiative forcing.
2.4. Hydrographic Analysis
2.4.1. Seasonal, Annual, and Interannual Variability
The data for the SSP1–2.6, SSP2–4.5, and SSP5–8.5 scenarios were obtained from https://aims2.llnl.gov/ (accessed on 2 December 2020) for projections generated using the CNRM-CM6-1-HR model. The dataset spans the period from 2015 to 2100 and includes the following variables: potential temperature, absolute salinity, zonal and meridional current velocities, and zonal and meridional wind speeds at 10 m above the surface. The native horizontal resolution of the ocean component is approximately 0.25°, while the atmospheric component operates at a resolution of approximately 0.5°, both with a monthly temporal resolution. Seawater density was computed from potential temperature and absolute salinity using the gsw toolbox implemented in MATLAB R2021a, following the TEOS-10 standard (https://teos-10.org/, accessed on 2 December 2020).
To identify dominant periodic components of SST variability, the power spectral density (PSD) was estimated using Welch’s method, a Fast Fourier Transform (FFT)-based approach that averages modified periodograms of overlapping segments to obtain a more robust spectral estimate. Given the monthly resolution of the data, a sampling frequency of 12 samples per year was specified to express frequencies in cycles per year. This spectral analysis enabled the identification of dominant frequencies in SST variability, as well as the characteristic periods and cycles under different climate change scenarios [45].
Additionally, a Seasonal-Trend Decomposition using LOESS (STL) was performed, following the methodology proposed by Cleveland et al. (1990) [46], where LOESS stands for Locally Estimated Scatterplot Smoothing, a non-parametric local regression method used to estimate smooth trend and seasonal components of a time series. The SST time series, , was decomposed into three main components: trend (), representing long-term changes; seasonal (), capturing regular cyclical patterns; and residual (), encompassing interannual variability and noise. This decomposition allowed for a clearer understanding of the underlying dynamics and variability in SST in the Gulf of California under projected climate scenarios.
The first step is to obtain the seasonally adjusted series () by removing the seasonal component:
Now, the term contains the trend and residual components, that is, the seasonally adjusted series. A LOESS is then applied, based on
where denotes the set of observations within the smoothing window centered at time t, and represents the LOESS weight associated with observation i. The weights are computed using a tricubic weight function:
where is the temporal distance between observation i and the center point t, and d is the half-width of the smoothing window (e.g., 12 months for an annual cycle). Observations closer to t receive higher weights.
Once the weights are defined, the trend at each time point is estimated by fitting a local linear regression within the window :
where and are the intercept and slope of the local linear regression, respectively. This procedure yields the estimated trend value at each time point. Repeating the regression across the entire time series produces a smooth trend curve that captures gradual changes without imposing a predefined global functional form.
To perform the STL decomposition, a seasonal window of 12 months was used to accurately capture the annual SST cycle. This ensures that the seasonal component reflects periodic variability without distorting the long-term trend. The residual component, which contains interannual and decadal oscillations, is particularly relevant for identifying signals associated with ENSO and PDO.
Subsequently, we applied a wavelet analysis to the residual component using the Python 3.12.11 package pycwt, which implements wavelet transforms using the complex Morlet wavelet. This component is crucial, as it contains variability in timescales greater than two years, i.e., interannual variability. Unlike the FFT, wavelet analysis allows for the identification of both the timing and amplitude of dominant frequencies throughout the time series. This makes it a powerful tool for detecting non-stationary signals and temporal shifts in oceanographic processes. Wavelet analysis has been widely used to decompose and examine complex oceanographic phenomena across multiple temporal and spatial scales [47,48,49].
2.4.2. Spatial Trend Analysis Under Climate Change Scenarios
To quantify the spatial patterns of projected SST changes under each climate change scenario, a pixel-by-pixel linear regression was applied to the original monthly SST time series for the period 2015–2100. The slope of the regression represents the projected warming rate (°C year−1) at each grid point. These spatially distributed trends were mapped and interpolated using the nearest-neighbor method to illustrate regional differences in warming intensity across the Gulf of California. The same regression-based approach was applied to the 10-m wind speed time series to derive spatially distributed projected trends in wind intensity (m s−1 year−1) under each climate scenario.
2.4.3. Directional Analysis of Wind and Surface Currents
Monthly mean directions were calculated using circular statistics to properly account for the angular nature of the data [50,51], following the standard methodology described by Wilks (2011) [52]. Uncertainty in the estimated mean directions was quantified using a bootstrap resampling approach [53], and 95% confidence intervals were derived from the bootstrap distributions as described by [54]. Potential directional changes among scenarios were evaluated by examining the overlap of these confidence intervals for each region and month. Non-overlapping intervals were interpreted as indicative of a possible shift in the dominant wind or surface current direction under different climate scenarios.
2.4.4. Extreme SST Events
The analysis of extreme events and the hydrodynamic assessment described below were conducted by dividing the study area into seven regions (Figure 1). López Martínez et al. (2023) [24] proposed a division of the Gulf of California into six bioregions based on a cluster analysis of SST and chlorophyll-a concentrations. These variables are closely linked to mesoscale features such as eddies and filaments, which are visible manifestations of the prevailing hydrodynamic conditions [55]. For this reason, the present study adopted this regionalization framework.
However, a modification was made to the northern portion of the Gulf: the Upper Gulf of California was separated from the Midriff Islands region. This adjustment was based on the recognition that inertial forces play a particularly significant role in the Midriff Islands area, warranting its distinction as a separate hydrodynamic zone.
From the trend component of the SST time series, the 10th percentile (P10) and 90th percentile (P90) were calculated for each region and climate change scenario. Extreme cold events were defined as SST values below P10, while extreme heat events were defined as values exceeding P90. The frequency of these events was then computed for each decade to assess their temporal evolution and regional variability. This percentile-based approach is widely used in climate studies to detect trends in extreme events, as it avoids assumptions of normality in the data distribution [56,57], making it particularly suitable for analyzing non-linear and non-stationary climate signals.
2.5. Hydrodynamic Analysis
2.5.1. Dimensionless Numbers
To characterize the hydrodynamics of the Gulf of California under the SSP scenarios, three dimensionless numbers were calculated for each region: the Froude number [58], the Wedderburn number [59], and the stress number [60]. These parameters collectively allow for the identification of the dominant forcing mechanisms acting on the water body under study.
Equation (6) describes the momentum balance along the along-gulf (y) direction, assuming steady-state and irrotational flow. The use of dimensionless numbers provides a robust framework for comparing hydrodynamic regimes across regions and scenarios, independent of scale, and is particularly useful for assessing the relative influence of wind stress, buoyancy, and nonlinear advective forcing.
In Equation (6), the terms represent the inertial stress, while the term corresponds to the baroclinic pressure gradient. The term represents the sea surface elevation gradient, and accounts for frictional stresses due to vertical turbulent mixing. Here, x, y, and z denote the longitudinal, transverse, and vertical coordinate axes, respectively. The variables u and v are the fluid velocities in the x and y directions, g is the gravitational acceleration, is the water density, is the reference density, is the vertical turbulent viscosity coefficient, and is the sea surface height.
2.5.2. Froude Number
The term in Equation (6) represents the inertial stresses, which can be scaled as , where V is the characteristic velocity and L is the characteristic length scale. The term represents the baroclinic pressure gradient, which can be scaled as or alternatively as , where H is the depth scale, is the density contrast (which may be vertical, longitudinal, or transverse), and is the reduced gravity.
From this scaling, the Froude number () is defined as
The Froude number is a dimensionless parameter used in fluid dynamics to characterize the relative importance of inertial forces compared with gravitational (buoyancy) forces. In a two-layer stratified system, the effective gravitational force is given by the buoyancy term , and the internal Froude number [58] is expressed as
where U is the fluid velocity, is the reduced gravity, and is a representative length scale, which may correspond to the length or depth of the channel, bay, or gulf.
When , inertial forces dominate, indicating a predominantly turbulent flow regime; when , buoyancy forces dominate, and the flow is primarily governed by stratification and gravity; and when , inertial and buoyancy forces are balanced, representing a transitional regime.
2.5.3. Wedderburn and Stress Numbers
The Wedderburn number (W) compares the relative importance of wind stress acting on the water column to the gravitational circulation of a stratified fluid [60]. It is defined as
This number provides insight into whether the flow is primarily driven by internal dynamics (inertia) or by external forcing (wind stress).
Since the Froude number compares inertial forces to buoyancy forces, and the Wedderburn number compares wind stress to the density gradient, ref. [60] proposed a dimensionless number that compares inertial forces to wind stress . The stress number () arises from this relationship and is defined as
When , external forces dominate, indicating a predominantly wind stress flow regime; when , inertial forces dominate; and when , inertial forces and wind stress are balanced.
The dimensionless numbers—Froude, Wedderburn, and stress—are derived from Equation (6) through dimensional analysis, allowing for the characterization of dominant hydrodynamic forcing mechanisms across different regions and climate scenarios. The longitude scale L was defined as the maximum latitudinal width of each subregion, and the depth scale H corresponds to the mean water depth of each subregion, calculated from regional bathymetry. This ensures that the dimensionless values reflect the local physical characteristics of each region and allows for consistent comparisons between subregions and climate scenarios. The east component of the wind stress () was calculated as
where is the wind speed magnitude, is the air density (1.2 kg m−3), and is the dimensionless air–water drag coefficient (0.00114) [61]. The V component is aligned with the main Gulf of California axis and is used as a representative component of the study area.
The reduced gravity () was calculated using the following expression:
where g is the gravitational acceleration, is the vertical density difference, and is a reference density. In this study, a reference density of 1024 kg m−3 was used.
3. Results
3.1. Annual and Interannual Variability in Surface Temperature in the Gulf of California
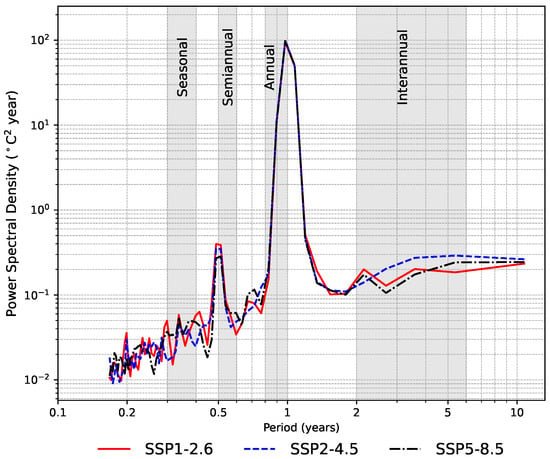
Spectral analysis (Figure 2) reveals that the annual signal is consistent across all SST time series under the different climate change scenarios analyzed. The results indicate a progressive increase in SST across all scenarios, with notable divergences emerging around the 2050s. Under the SSP5–8.5 scenario, a marked increase in the frequency of extreme warm events is observed, accompanied by a sharp decline in the occurrence of cold events. This pattern suggests a shift in the thermal regime of the Gulf of California, with potential implications for ecosystem dynamics, stratification processes, and the frequency of climate-driven disturbances.
Figure 2.
Fast Fourier transform spectrum of SST for the Gulf of California under the SSP1–2.6, SSP2–4.5, and SSP5–8.5 scenarios.
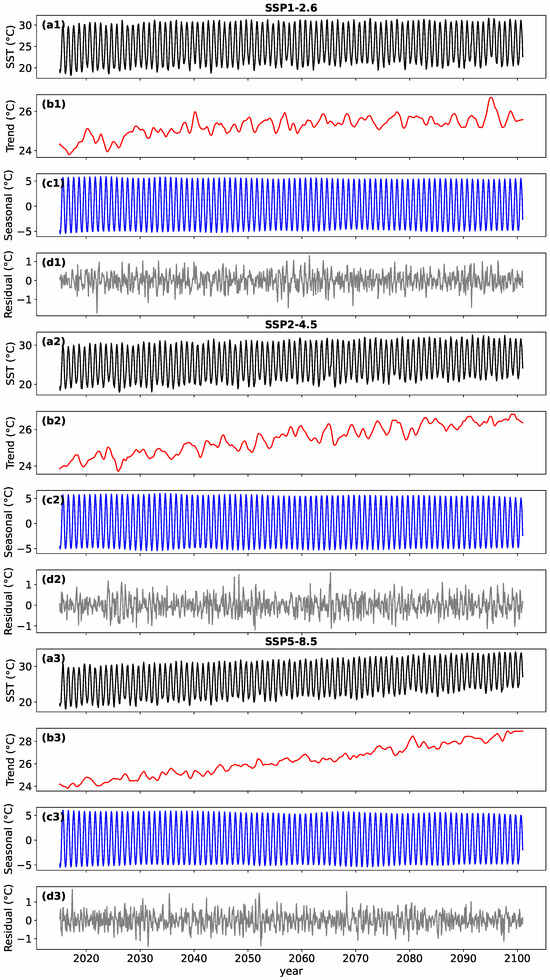
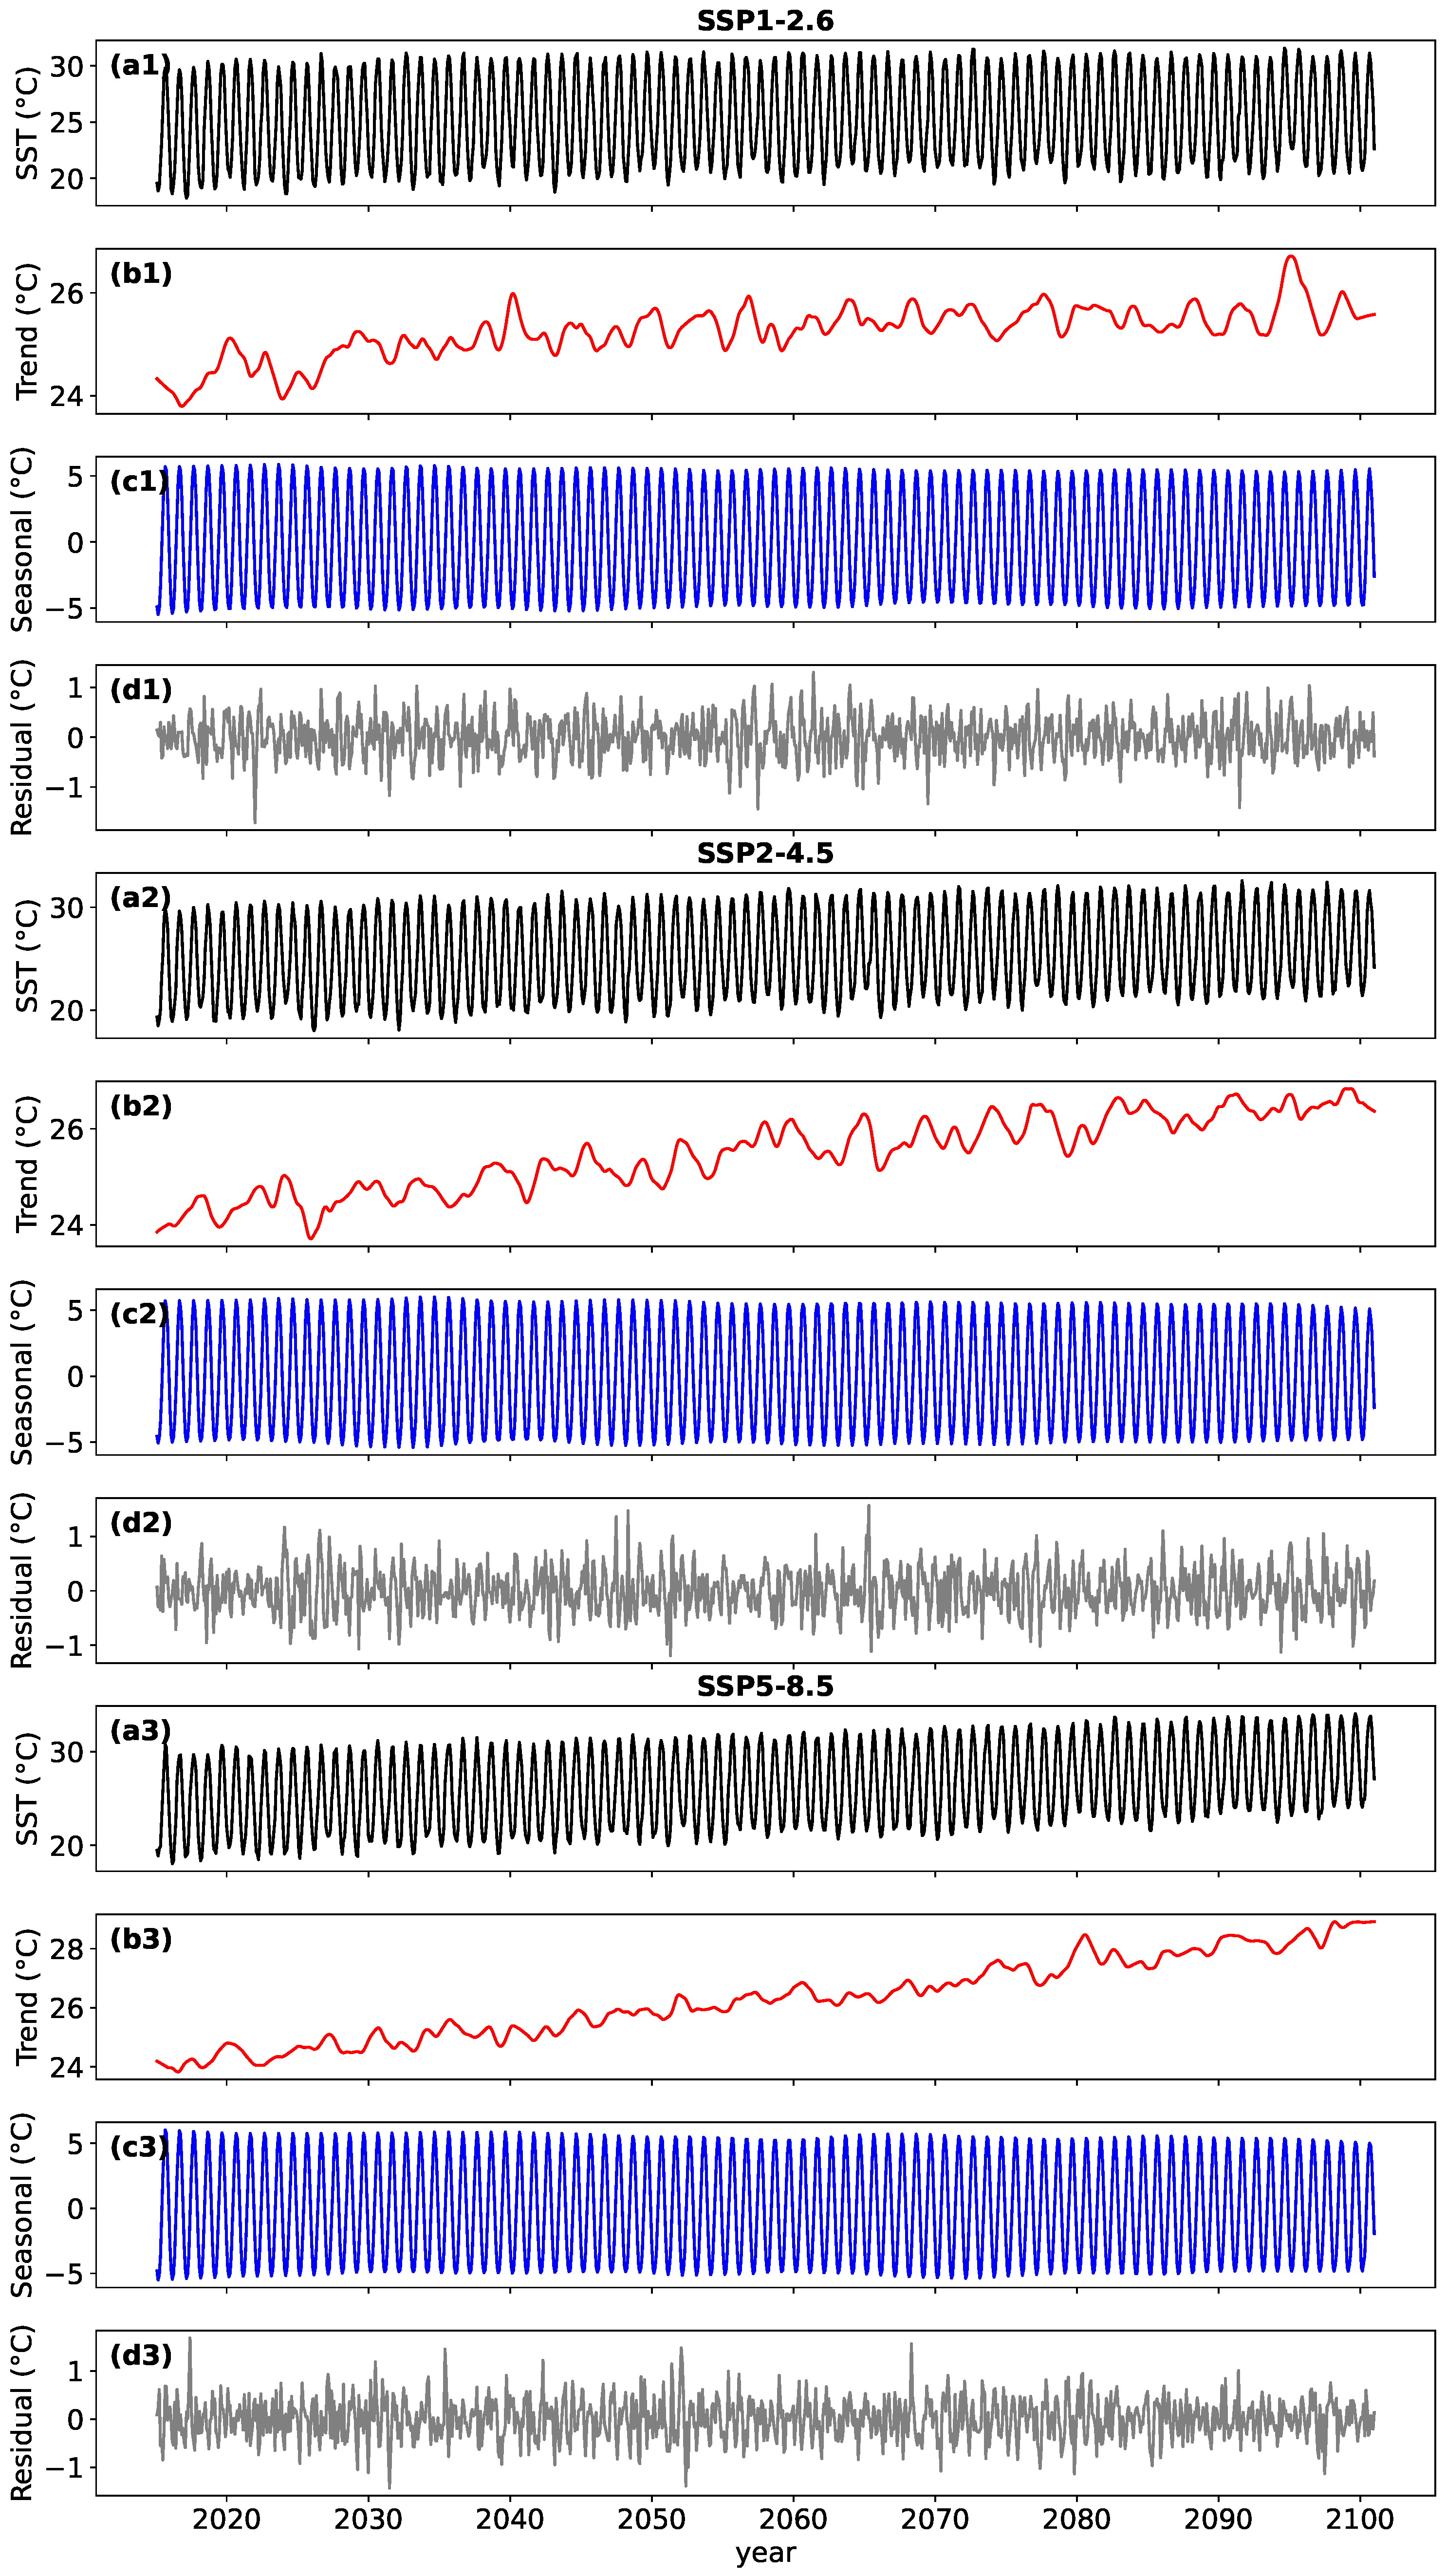
Figure 3 shows the time series for the different scenarios. Figure 3(a1–a3) presents the original series (the result of the modeling of the different scenarios) of the monthly SST for the entire Gulf. This series allows a well-defined observation of annual variability. Differences between scenarios are also observed, with the high-emissions scenario exhibiting a progressive increase in SST over time. Figure 3(b1–b3) is the trend component (long term). It shows long-term SST without the effect of seasonality or interannual variability. This allows us to observe a progressive increase trend in SST under all three scenarios analyzed. Figure 3(c1–c3) is the seasonal component (annual cycle). This represents the seasonal variability in SST, characterized by a repetitive cycle that occurs annually. It allows us to identify a sinusoidal pattern that indicates warming in the summer months and cooling in the winter months. The amplitude of the seasonal cycle remains stable over time regardless of the scenario. Figure 3(d1–d3) shows the interannual and decadal variability component (Residual). It represents variability not explained by trend or seasonality, i.e., lower-frequency and noisy fluctuations. It contains signals of interannual (2–7 years, ENSO) and decadal (>10 years, PDO) variability. The amplitude of this signal is highly variable over time under all three scenarios.
Figure 3.
Seasonal trend decomposition of monthly SST (°C) in the Gulf of California under the SSP1–2.6, SSP2–4.5, and SSP5–8.5 scenarios. Panels (a1–a3) show the original monthly SST time series (°C); panels (b1–b3) represent the long-term trend component (Trend, °C); panels (c1–c3) display the seasonal component (Seasonal, °C); and panels (d1–d3) correspond to the residual component (Residual, °C).
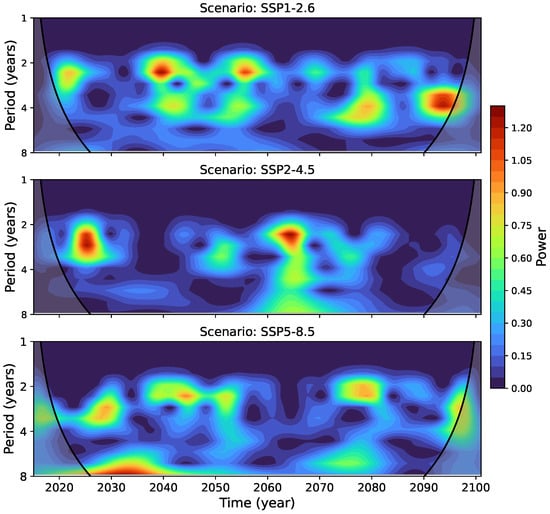
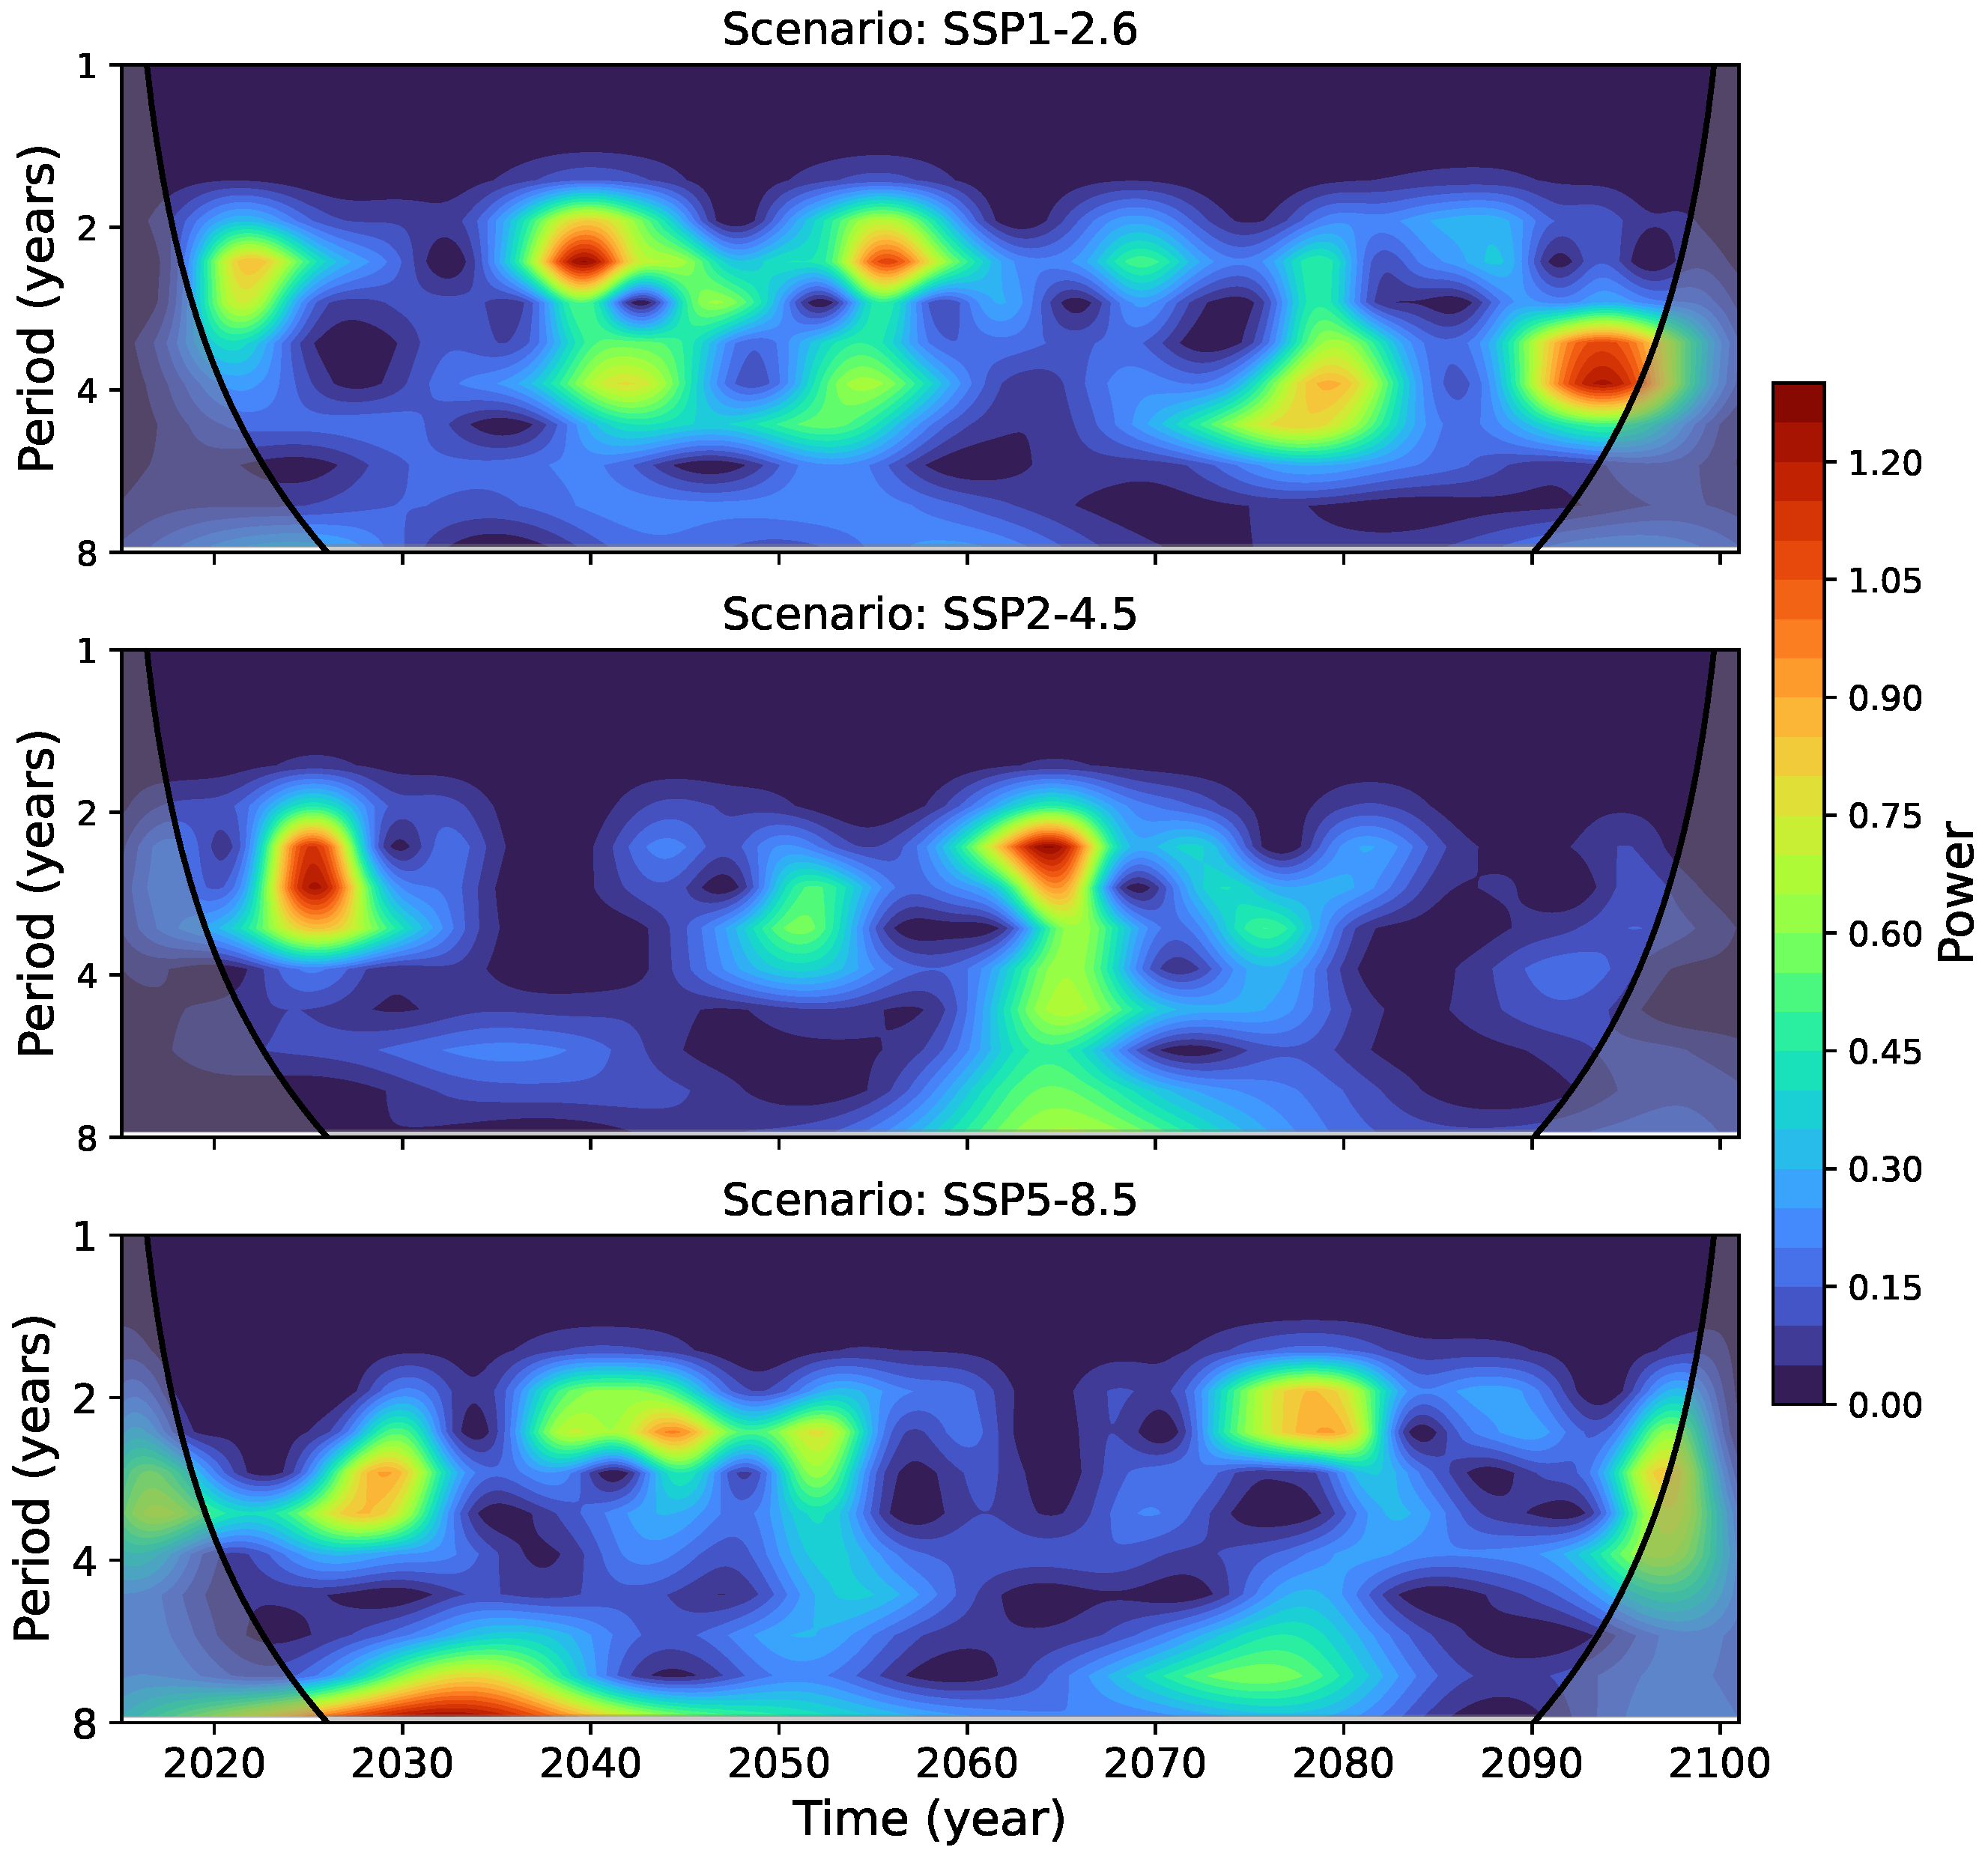
Wavelet analysis for the SSP1–2.6, SSP2–4.5, and SSP5–8.5 scenarios (Figure 4) indicates that the highest spectral power appears within the 2–5-year band. Differences among scenarios are primarily reflected in the temporal distribution of power within this frequency range rather than in changes to the dominant periodicity itself. Under SSP1–2.6, enhanced power appears intermittently, with notable concentrations during the 2020s, 2040s, and late-century decades, along with a slight shift toward longer periods (6–7 years) toward the end of the record. In SSP2–4.5, variability is characterized by a period of reduced power followed by increased power between approximately 2040 and 2090. For SSP5–8.5, elevated power within the 2–4-year band appears more continuous over extended intervals, although the dominant timescale remains within the interannual range.
Figure 4.
Wavelet transform of the residual component of SST in the Gulf of California under the climate change scenarios SSP1–2.6 (upper panel), SSP2–4.5 (middle panel), and SSP5–8.5 (lower panel).
3.2. Trends in Sea Surface Temperature
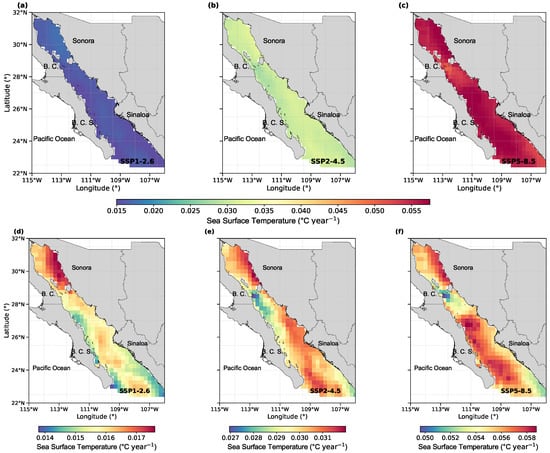
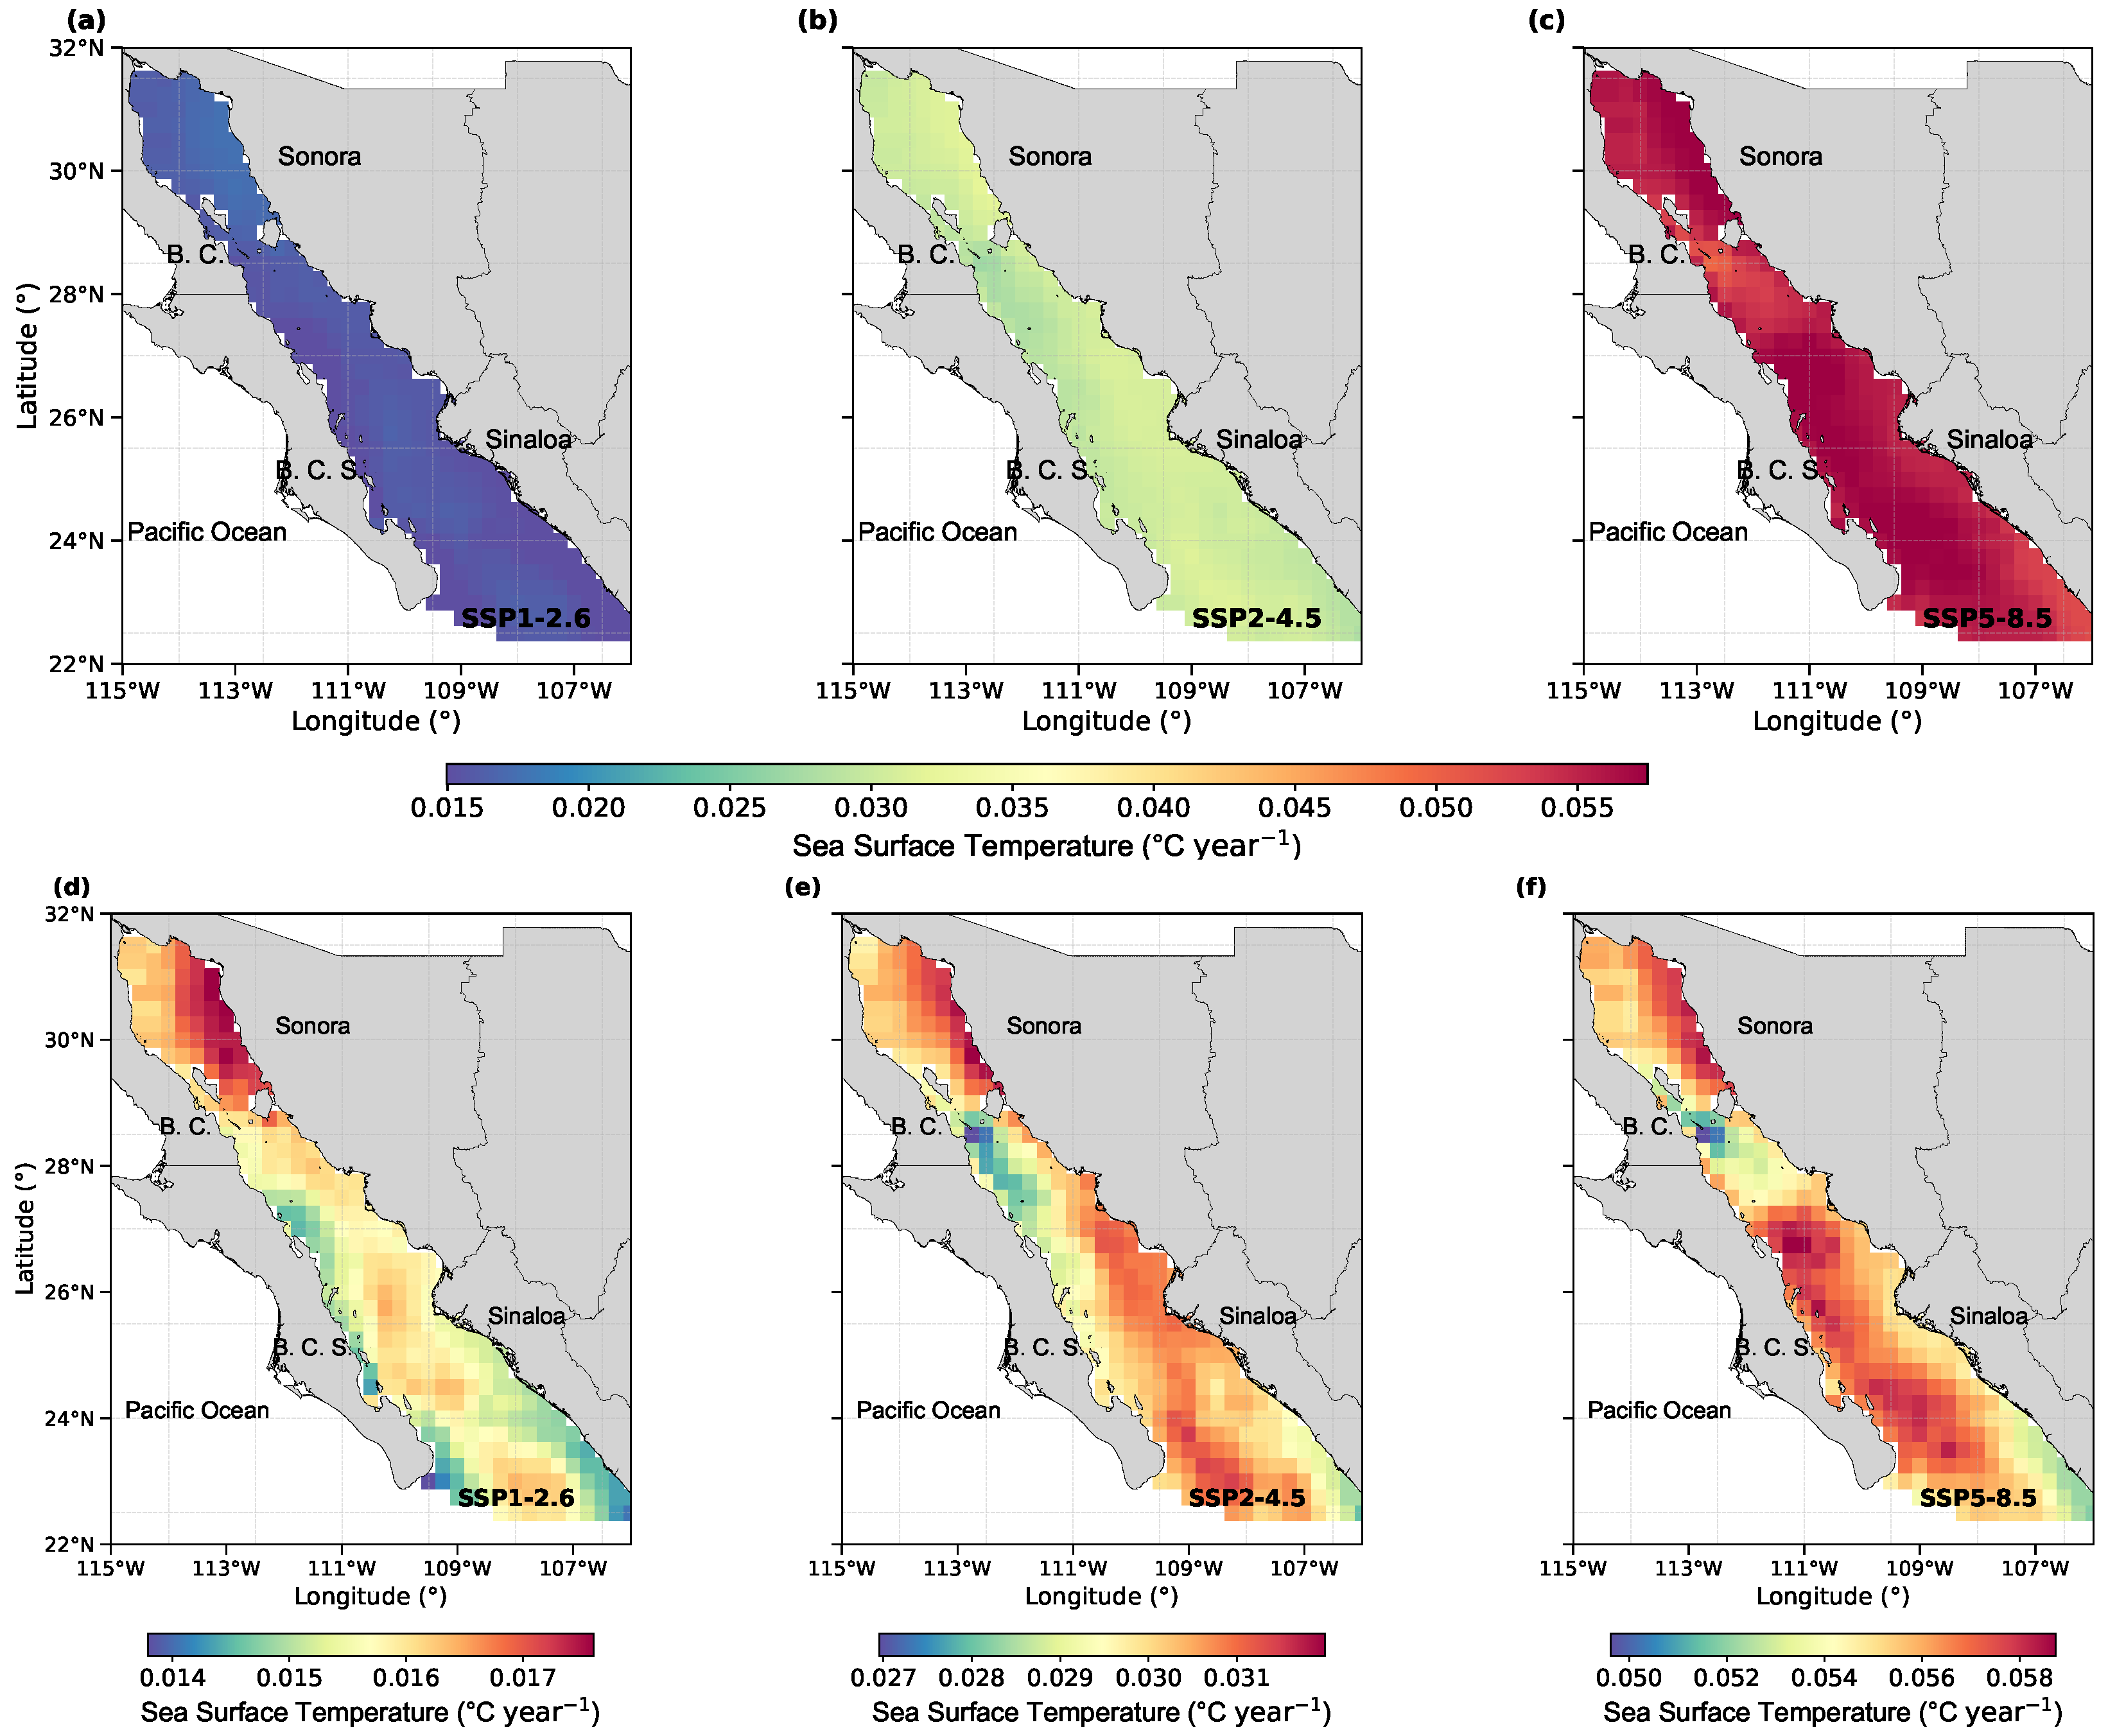
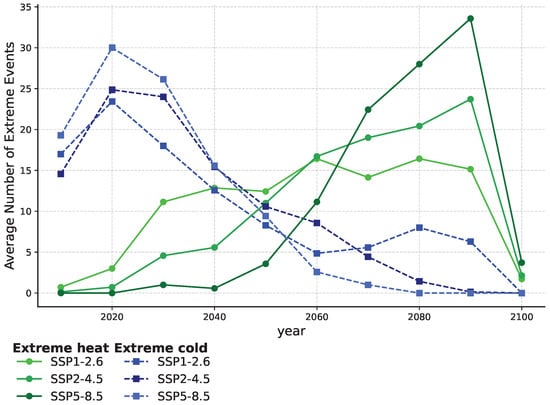
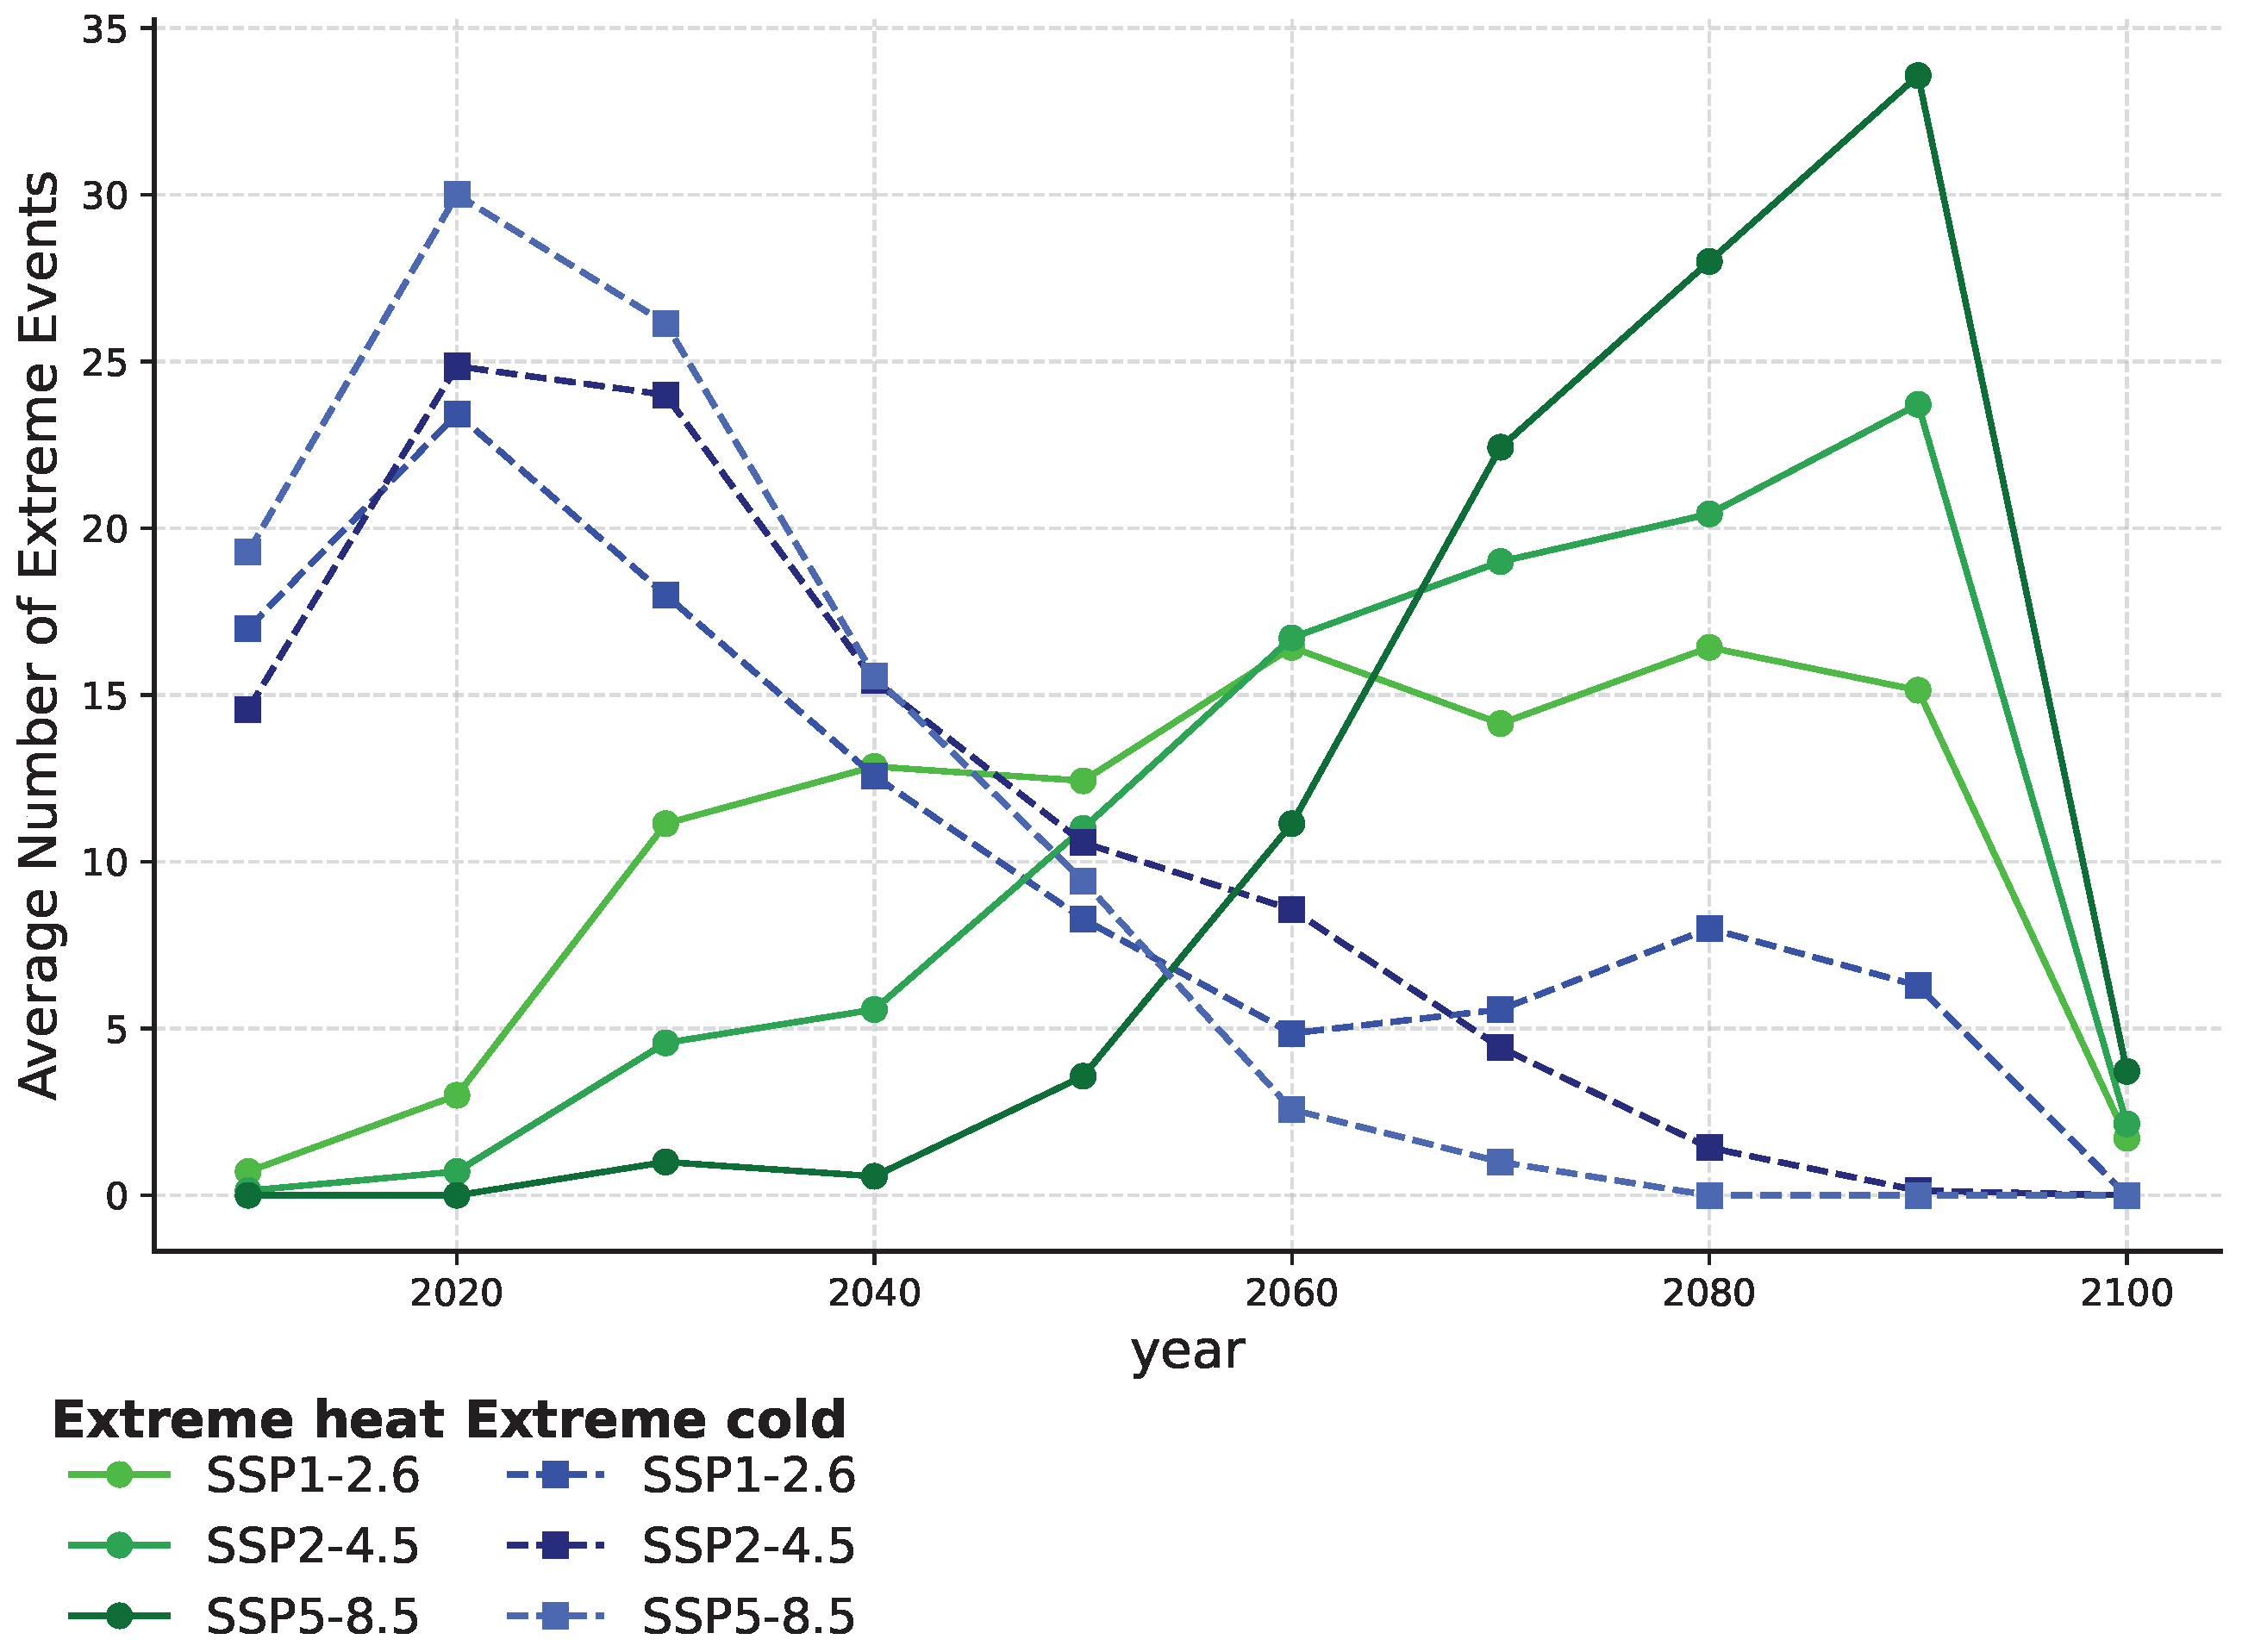
Under the SSP1–2.6 scenario, relatively higher projected rates of change in SST are found in the Upper Gulf (0.0168 °C year−1), while lower values occur along the southern and oceanic coasts of Sinaloa (0.0152 °C year−1). In SSP2–4.5, higher rates of change are identified along the Southern Peninsula Coast and the Gulf entrance (0.0307 °C year−1), whereas comparatively lower values are observed in the Midriff Islands region (0.0283 °C year−1). Under SSP5–8.5, the Central Gulf shows relatively higher projected rates of change (0.0568 °C year−1), while the Midriff Islands again display lower regional magnitudes (0.0504 °C year−1). Spatially, warming is not uniform across the basin. Under SSP1–2.6, higher rates are concentrated along the eastern Upper Gulf (Figure 5d). In SSP2–4.5, elevated rates extend southward along the mainland margin (Figure 5e). Under SSP5–8.5, comparatively higher warming is projected in the central and southern Gulf, while lower values persist in the Midriff Islands region (Figure 5f). The frequency of extreme heat events exhibits an overall increasing trend across all scenarios throughout most of the century (Figure 6), with a more pronounced rise under SSP5–8.5. In contrast, the occurrence of extreme cold events generally decreases over time. The apparent reduction in event counts toward the end of the century should be interpreted with caution, as it may be influenced by endpoint effects or by the temporal aggregation methodology.
Figure 5.
Rate of change of sea surface temperature under the scenarios SSP1–2.6 (a,d), SSP2–4.5 (b,e), and SSP5–8.5 (c,f).
Figure 6.
Temporal evolution of extreme temperature conditions in the Gulf of California under the SSP1–2.6, SSP2–4.5, and SSP5–8.5 climate scenarios. The figure shows the interannual variability in the average number of extreme heat and extreme cold events throughout the 21st century. Green lines represent extreme heat events, whereas blue dashed lines indicate extreme cold events. Symbols correspond to individual years and colors distinguish the different SSP scenarios. Extreme heat events show an overall increase toward the end of the century, particularly under SSP5–8.5, while extreme cold events exhibit a gradual decline across all scenarios.
3.3. Trends in Surface Current Speed and Direction
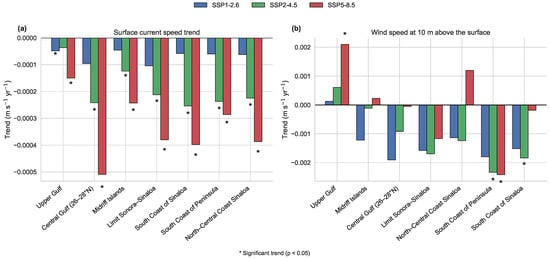
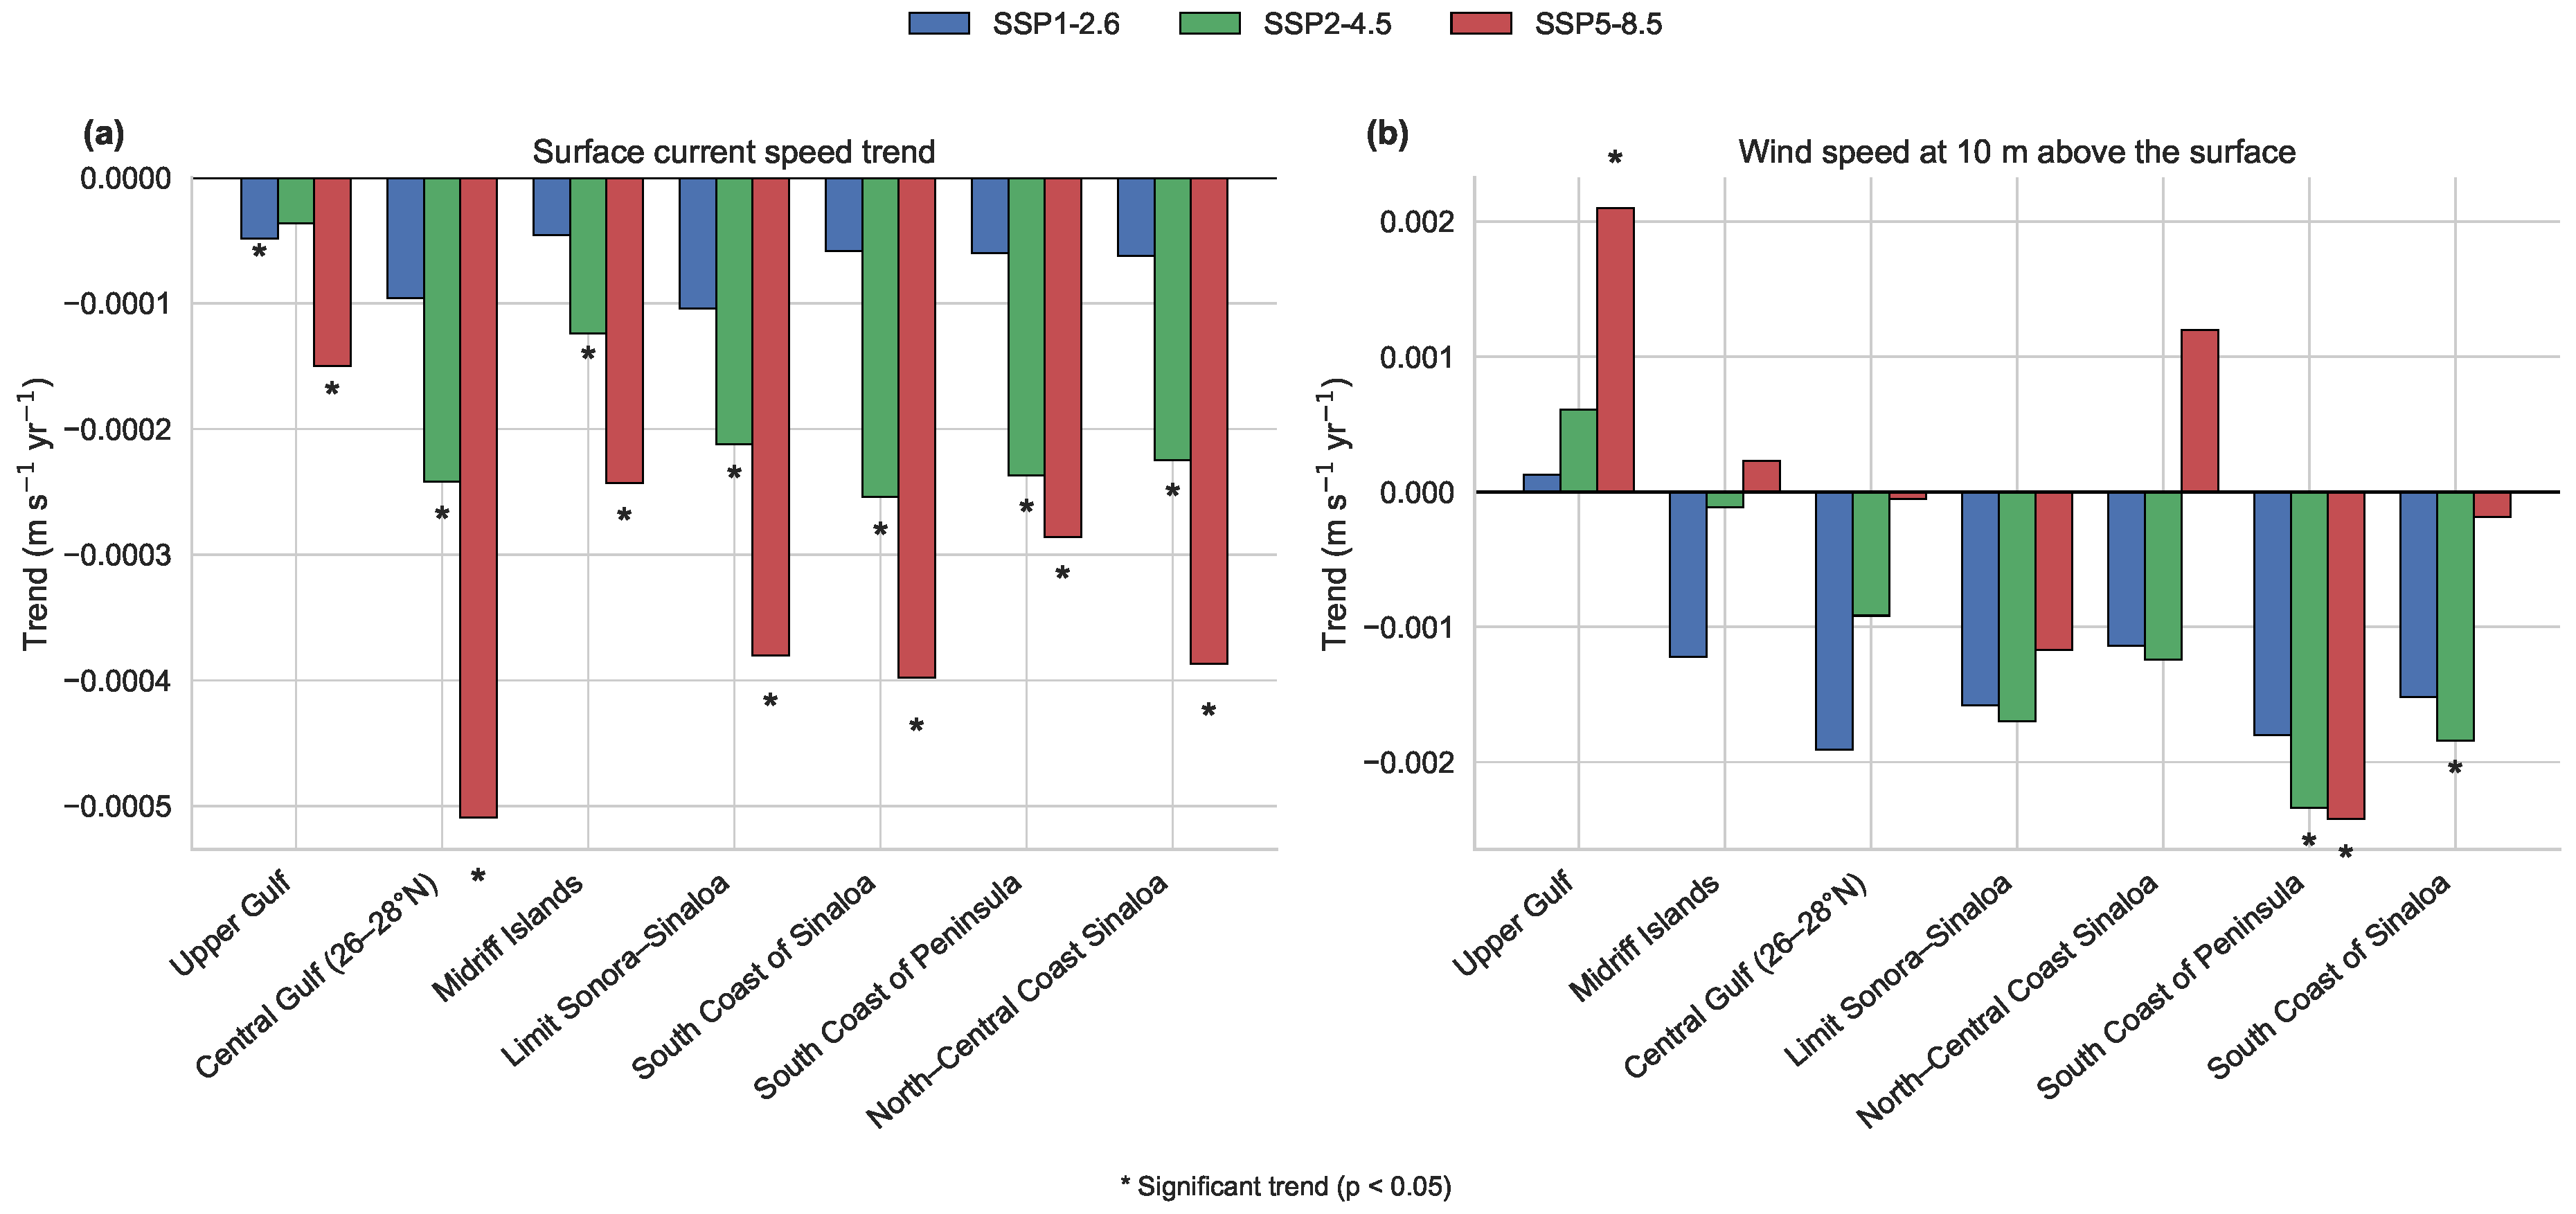
Surface current speeds exhibit negative trends across the analyzed regions of the Gulf, with larger declines under the SSP2–4.5 and SSP5–8.5 scenarios. The greatest reductions occur in the central basin under SSP5–8.5 (Figure 7a), with the highest decrease detected in the Central Gulf (26–28° N; m s−1 year−1), followed by the Midriff Islands ( m s−1 year−1). These regions also exhibit statistically significant trends () under SSP2–4.5 and SSP5–8.5. Additional significant negative trends are identified in the Limit between Sonora and Sinaloa (24–26° N), the South Coast of Sinaloa, the South Coast of the Peninsula, and the Northern and Central Coast of Sinaloa under the higher-emission scenarios. In contrast, trends in the Upper Gulf and under SSP1–2.6 are generally weaker and less frequently statistically significant.
Figure 7.
Linear trends in (a) surface current speed and (b) wind speed at 10 m above the surface across the seven regions of the Gulf of California under the SSP1–2.6, SSP2–4.5, and SSP5–8.5 climate scenarios for the period 2015–2100. Bars represent the slope of the linear regression fitted to the annual mean time series in each region and scenario. Negative values indicate decreasing trends, whereas positive values indicate increasing trends. Asterisks denote statistically significant trends at the 95% confidence level ().
In the analysis of surface current direction, potential directional changes—defined as shifts characterized by non-overlapping confidence intervals—were identified in specific regions and months. In the Upper Gulf, these changes occurred in May and October. In the Central Gulf (26–28° N), they were detected in June. In the Northern and Central Coast of Sinaloa, potential changes were observed in August. In the South Coast of the Peninsula, they occurred in July, October, and December, while in the South Coast of Sinaloa they were identified in November. In the Limit between Sonora and Sinaloa (24–26° N), potential directional changes were detected in July, August, and October.
Although these changes were identified in several regions, they were not spatially coherent across the basin. However, their occurrence was concentrated primarily during summer and autumn months. A summary of the months and regions exhibiting potential directional changes is provided in Table S1 of the Supplementary Materials.
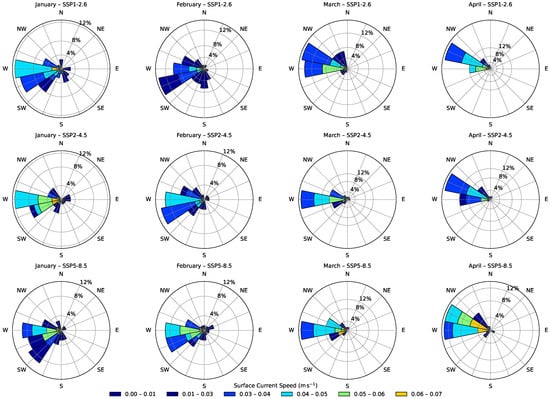
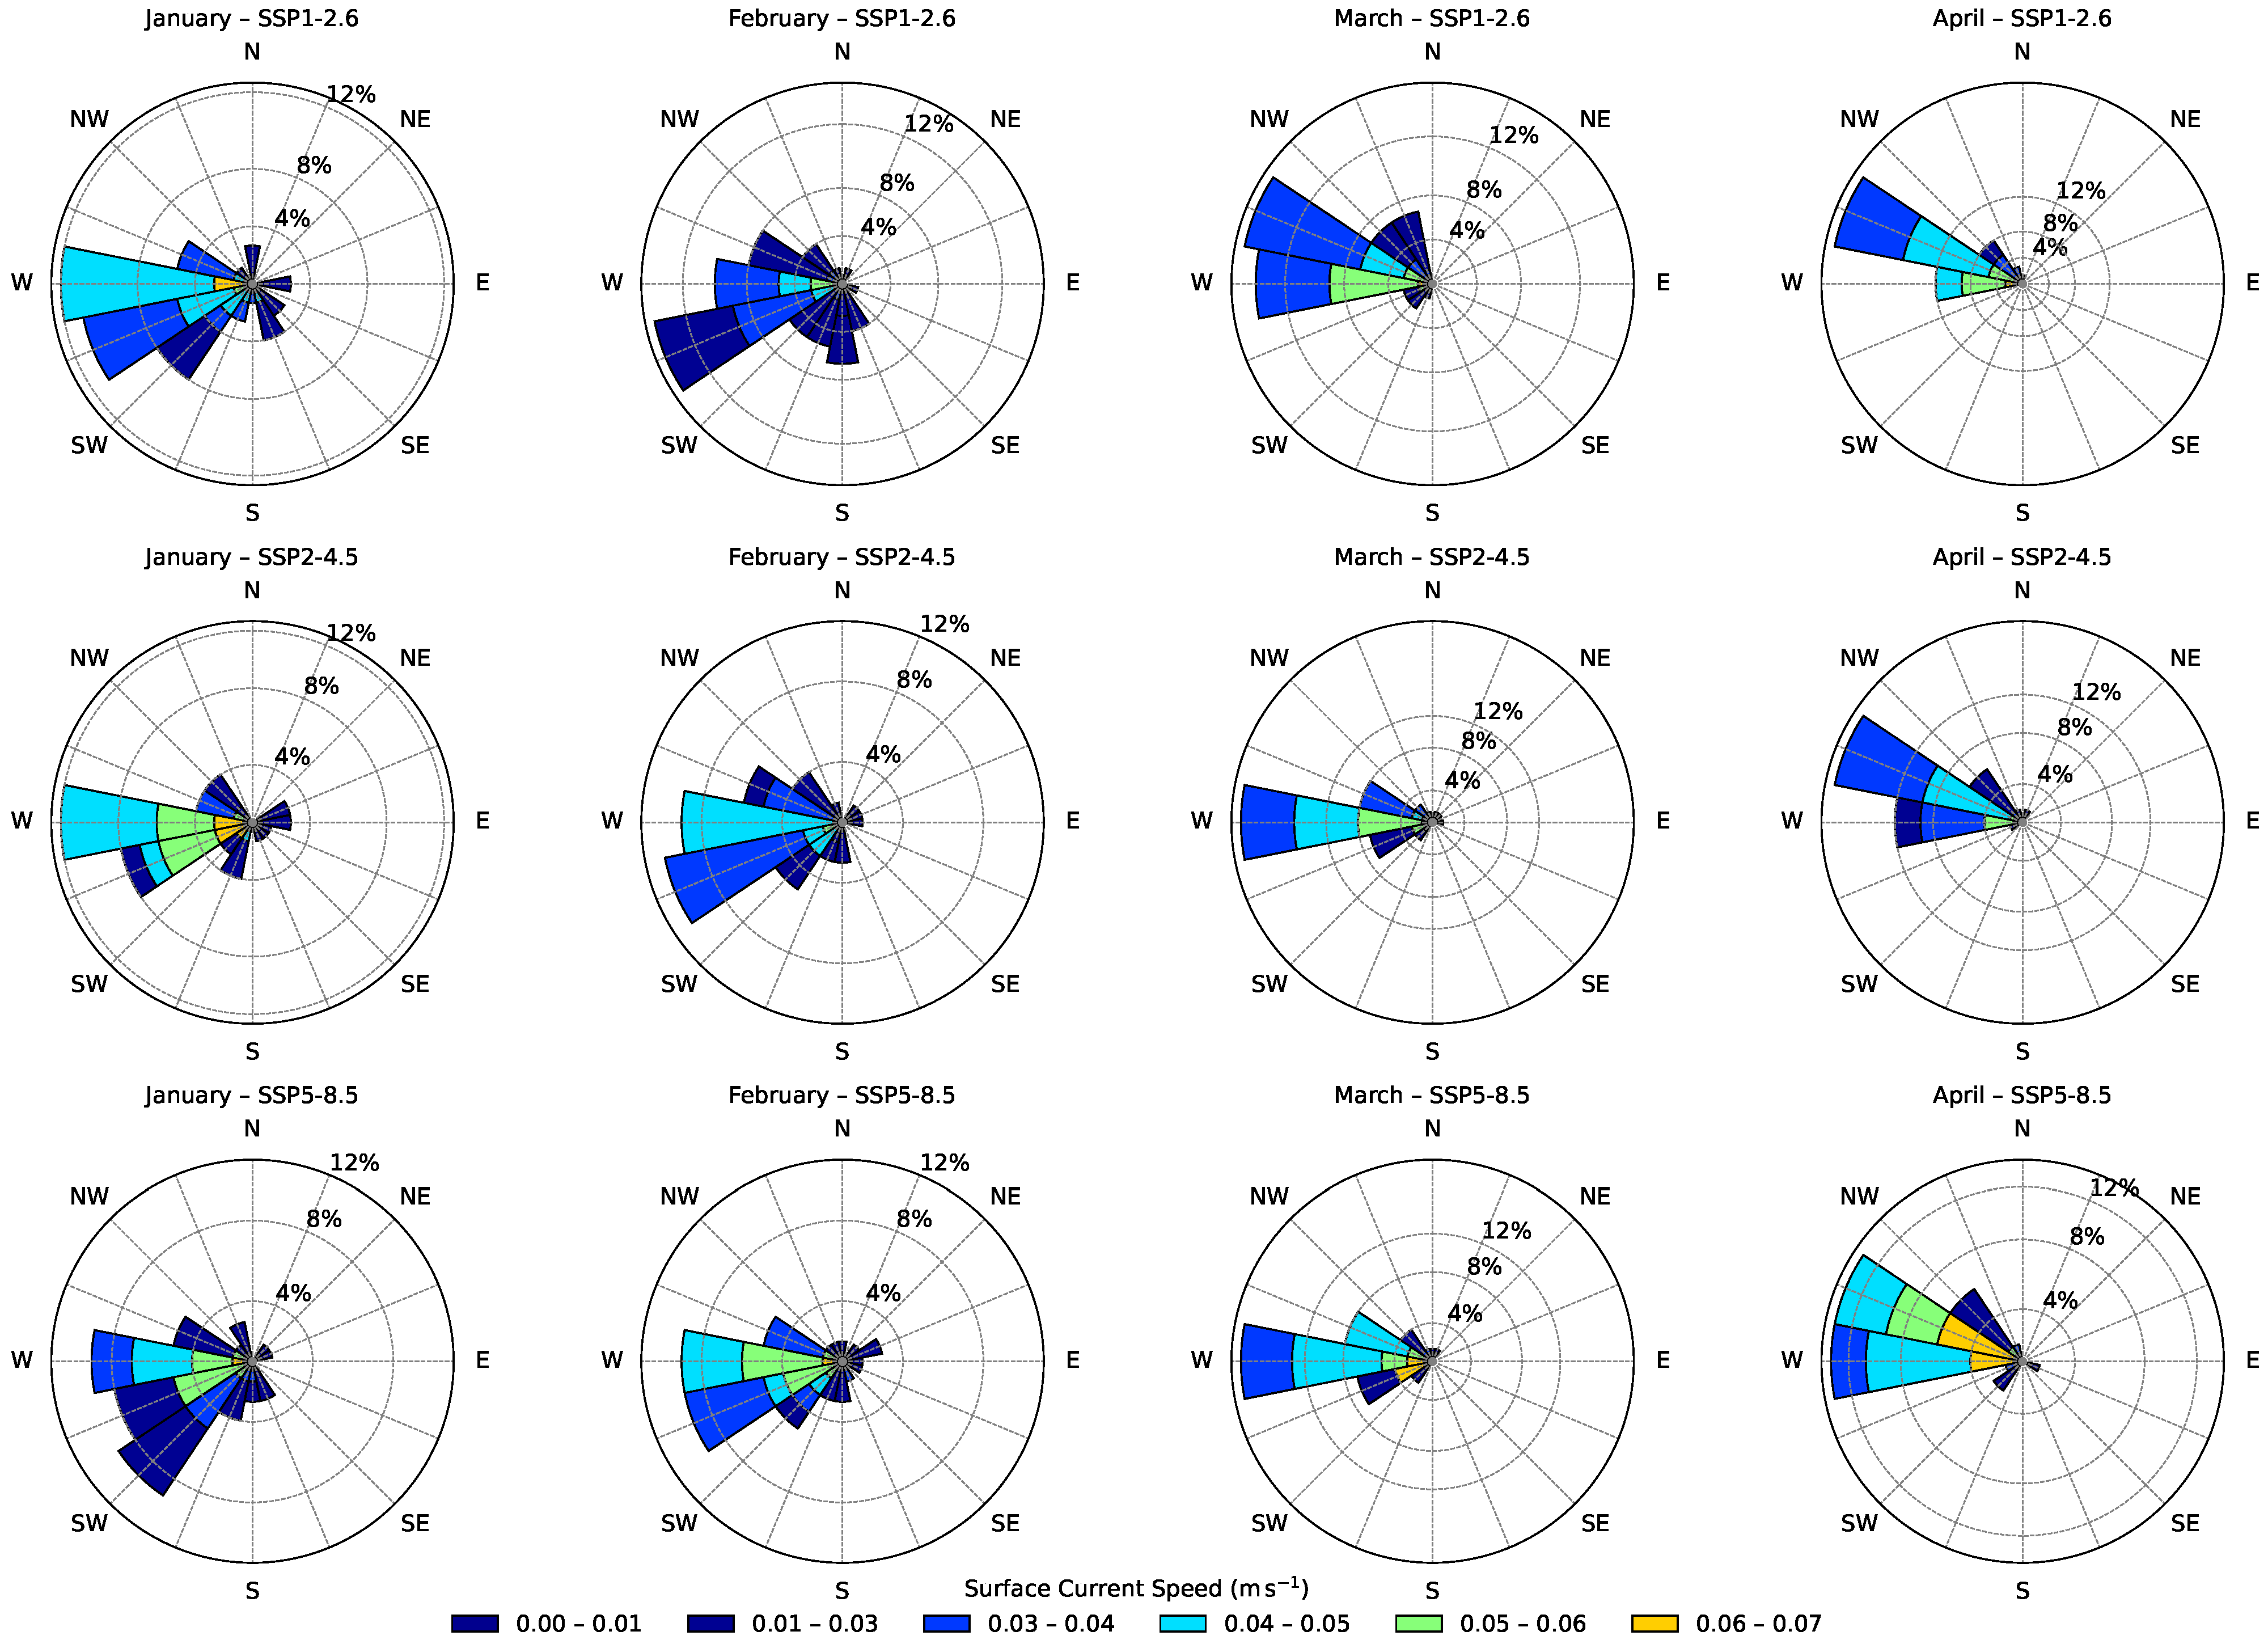
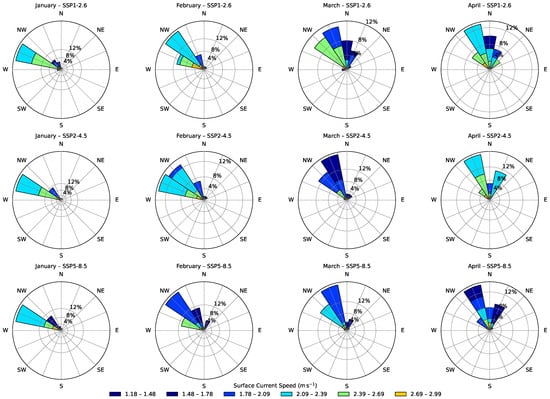
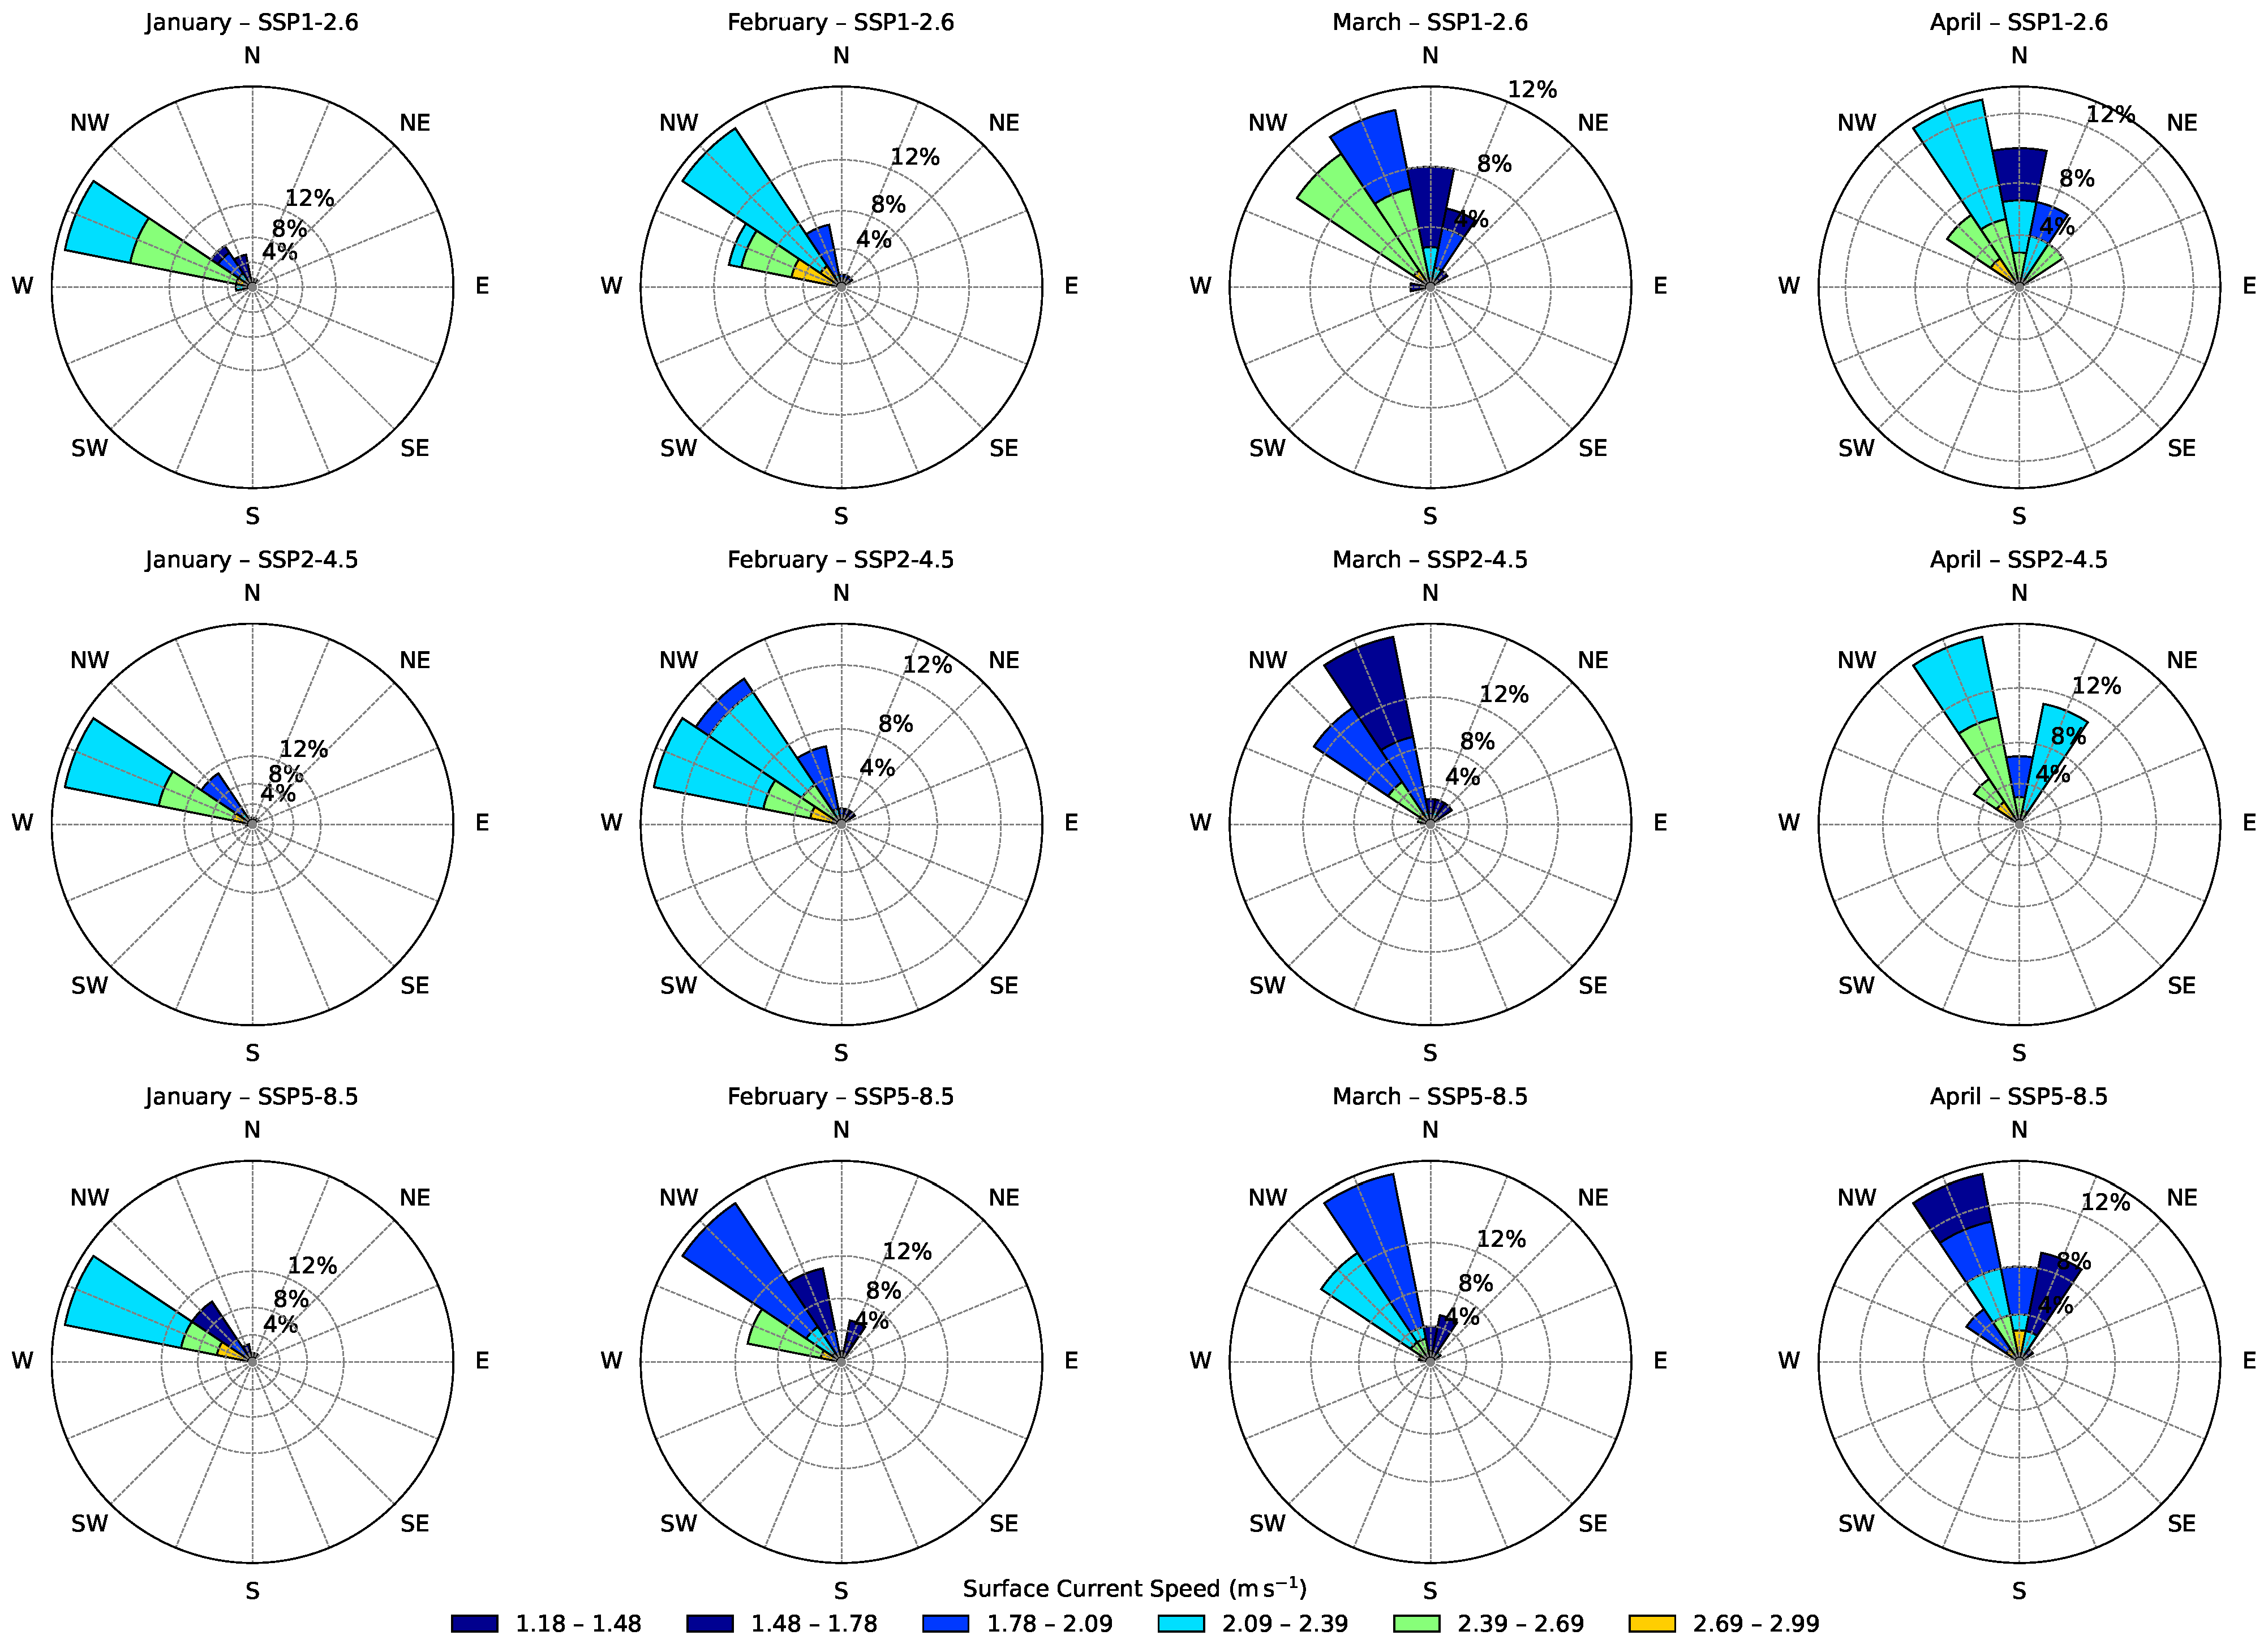
Figure 8 shows the mean monthly surface current direction in the Upper Gulf region for the period 2015–2100 from January to April under the SSP1–2.6, SSP2–4.5, and SSP5–8.5 scenarios. Equivalent analyses were performed for all regions, months, and scenarios. The complete set of corresponding figures is included in the Supplementary Materials (Figures S1–S21).
Figure 8.
Monthly distribution of surface current speed and direction in the Upper Gulf of California for January–April during the period 2015–2100 under the SSP1–2.6, SSP2–4.5, and SSP5–8.5 climate scenarios. Each panel shows a current rose diagram representing the frequency of current directions and their associated speed classes. Radial axes indicate the percentage occurrence of current directions, while colors represent current speed intervals (m s−1). The figure shows the seasonal variability in surface circulation patterns during the winter–spring transition, with currents occurring more frequently from the western and southwestern sectors of the Gulf. Differences among scenarios mainly reflect variations in the frequency and magnitude of current speeds rather than clear changes in the prevailing flow direction. Rows correspond to the different SSP scenarios, whereas columns represent the months from January to April. Current direction follows the oceanographic convention, indicating the direction toward which the current flows.
3.4. Trends in Wind Speed and Direction at 10 m from the Surface
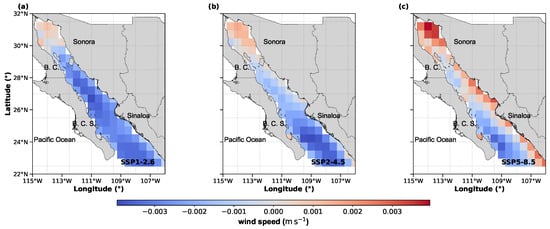
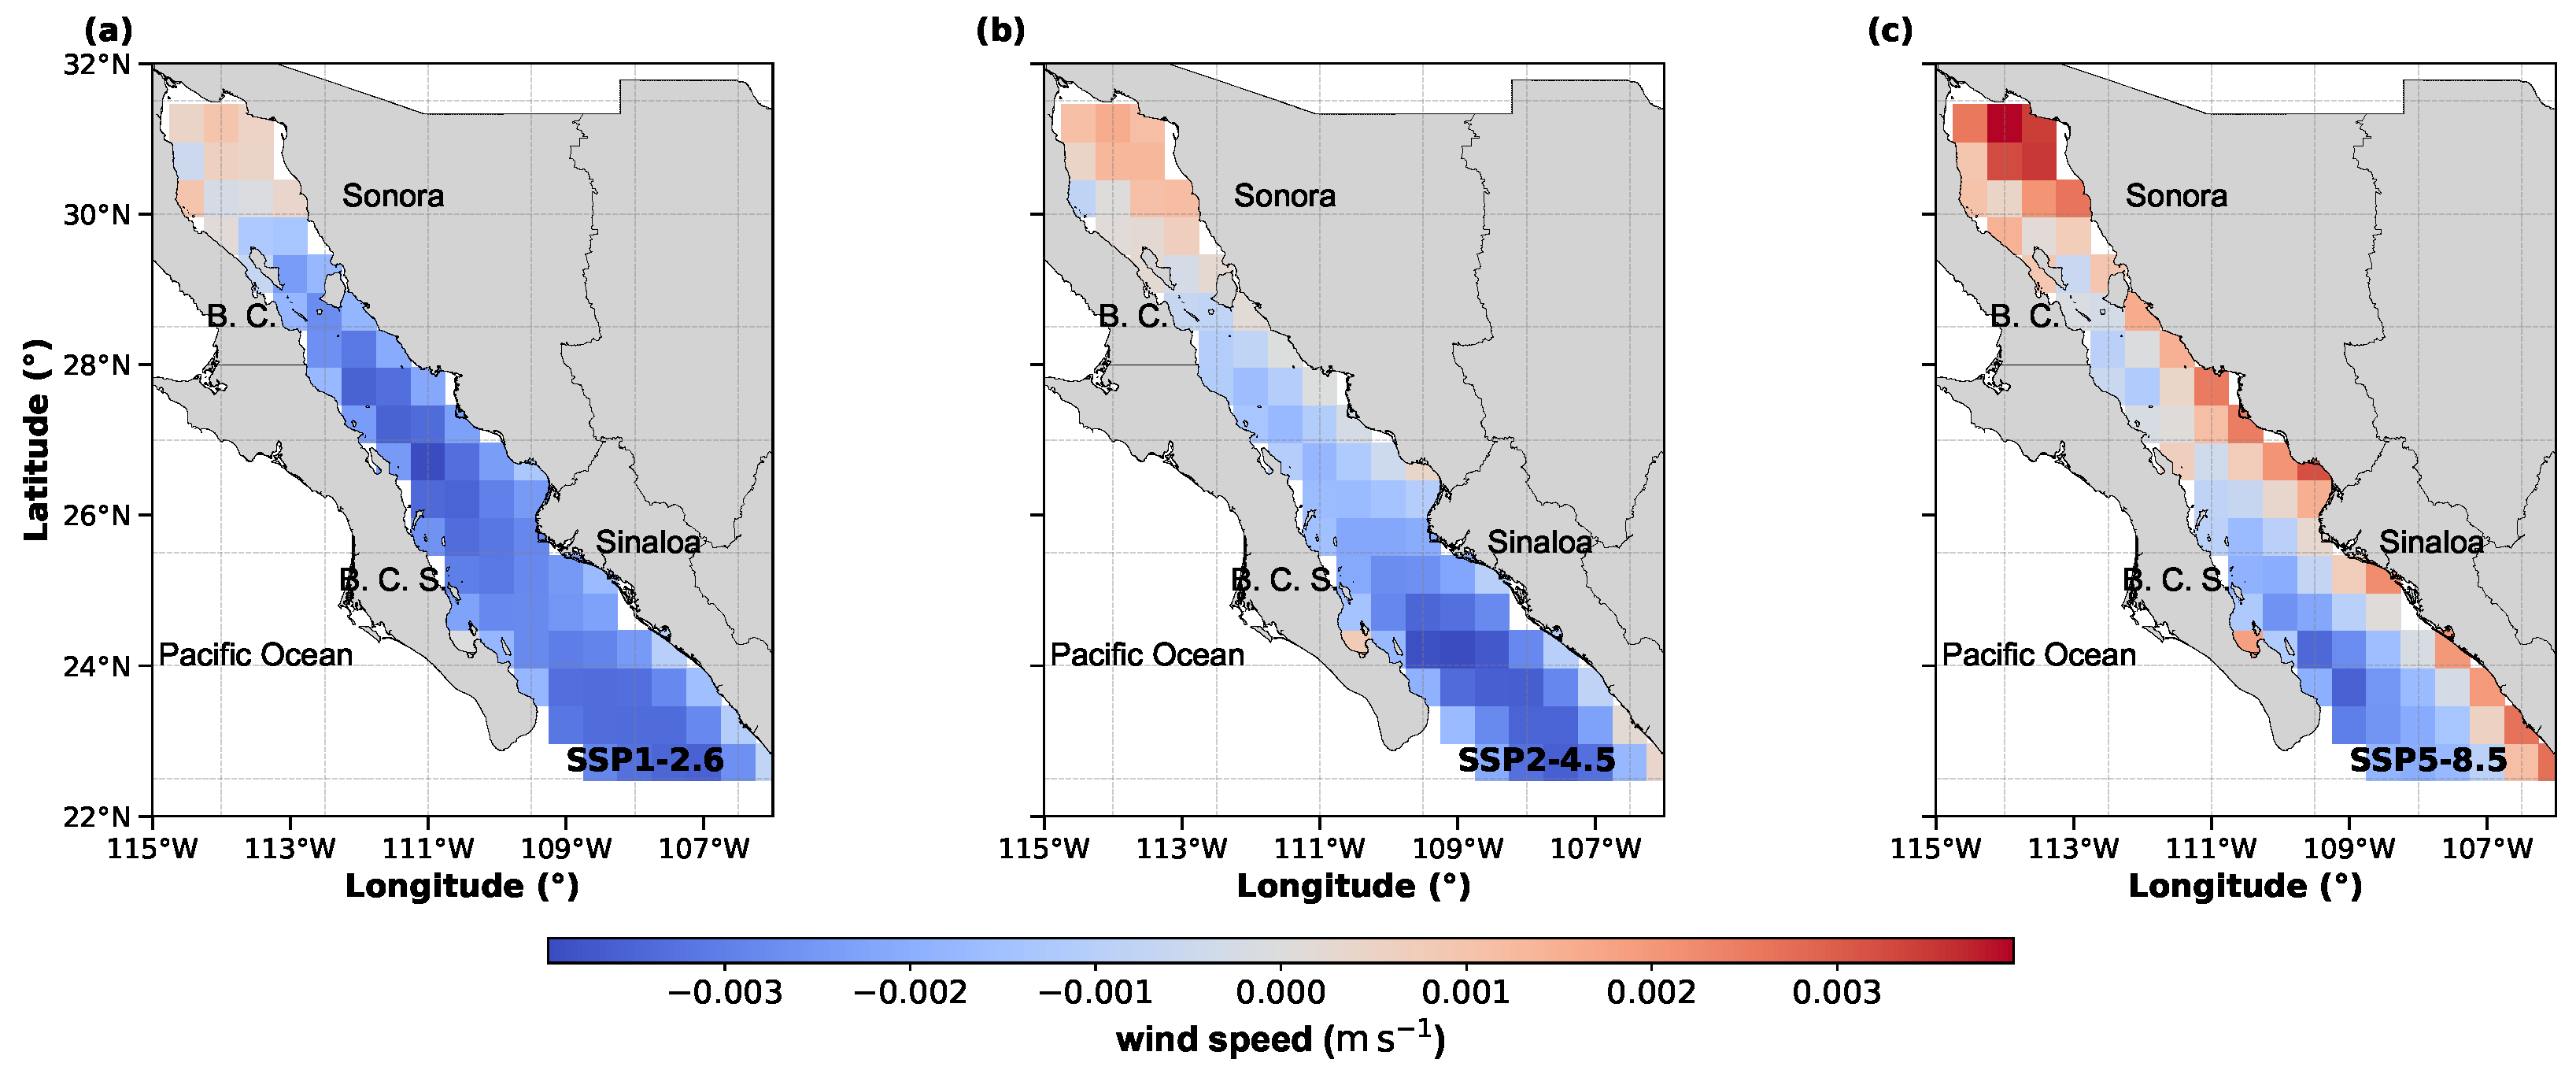
Figure 9 shows the rate of change of wind speed per year (m s−1 year−1) for all regions in each SSP scenario. In the low-to-medium emissions scenarios, the rate of change indicates an increase in the Upper Gulf region and a decrease from the southern Gulf of Insular toward the Gulf’s mouth. In the high emissions scenario (SSP5–8.5), wind speed tends to increase along parts of the eastern Gulf coast, although the spatial pattern is heterogeneous. In the southwestern Gulf, the negative rate of change remains similar to that observed in the other scenarios.
Figure 9.
Rate of change of wind speed under the scenarios SSP1–2.6 (a), SSP2-4.5 (b), and SSP5–8.5 (c).
The monthly wind speeds for various regions within the Gulf of California under three climate change scenarios, SSP1–2.6, SSP2–4.5, and SSP5–8.5, show mostly negative trends with specific positive exceptions deletedin all regions (Figure 7b), indicating a gradual decrease in wind speed, except for the North and Central Coast of Sinaloa under the SSP5–8.5 scenario, where a slight increase is observed, and are positive for the Upper Gulf region under all scenarios. The most pronounced reductions are observed along the South Coast of the Peninsula and at the entrance to the Gulf, especially under the SSP2–4.5 and SSP5–8.5 scenarios. It is worth noting that the trends are statistically significant. These results indicate that climate change has a differential impact on wind dynamics in each region of the Gulf of California. The positive wind trend is statistically significant in the Upper Gulf of California under the SSP5–8.5 scenario. Significant positive trends are also detected along the South Coast of the Peninsula under SSP2–4.5 and SSP5–8.5, and along the South Coast of Sinaloa under SSP2–4.5.
Wind direction patterns (Figure 10) show a generally northerly to northwesterly flow from December to April across all scenarios, consistent with the typical winter wind regime in the Gulf of California. Projected changes in wind direction—defined as shifts characterized by non-overlapping confidence intervals—are not uniformly distributed in space or time. The South Coast of Sinaloa exhibits the highest frequency of potential directional shifts (January, March, June, August, and December). The Northern and Central Coast of Sinaloa and the South Coast of the Peninsula show potential changes primarily in April and August. In the Limit between Sonora and Sinaloa (24–26° N), shifts are detected in April, May, and August. The Upper Gulf, Central Gulf (26–28° N), and Midriff Islands exhibit potential shifts mainly in May, with the Midriff Islands also showing a change in September.
Figure 10.
Monthly distribution of wind speed and direction in the Upper Gulf of California for January–April during the period 2015–2100 under the SSP1–2.6, SSP2–4.5, and SSP5–8.5 climate scenarios. Each panel shows a wind rose diagram representing the frequency of wind directions and their associated wind speed classes. Radial axes indicate the percentage occurrence of winds from each direction, while colors denote wind speed intervals (m s−1). The diagrams illustrate the seasonal variability in the wind regime during the winter–spring transition. Wind direction follows the meteorological convention, indicating the direction from which the wind blows. Rows correspond to the different SSP scenarios, whereas columns represent the months from January to April.
Overall, potential shifts occur intermittently across regions and months, without a consistent basin-wide spatial pattern. Table 1 summarizes the regions and months in which potential directional shifts were identified for both wind and surface currents. For completeness, the full set of region–month combinations derived from the analysis is included in Table S2 of the Supplementary Materials.
Table 1.
Summary of months exhibiting potential directional shifts for wind and surface currents.
3.5. Relative Comparison Between Efforts
Within the Gulf of California, seasonal hydrographic conditions exhibit well-defined summer and winter regimes, each governed by distinct physical forcings. A transitional period also occurs during spring and autumn, characterized by wind reversals, rapid changes in stratification, and adjustments in currents and thermocline depth. However, despite their oceanographic relevance, these transitional months are highly variable and short in duration, which limits their suitability for seasonal aggregation in the context of our dimensionless number analysis. Therefore, the summer period was delineated as July through October, while winter encompassed December through March. Under these seasonal frameworks, the relative contribution of various dynamic forcings was assessed using dimensionless numbers.
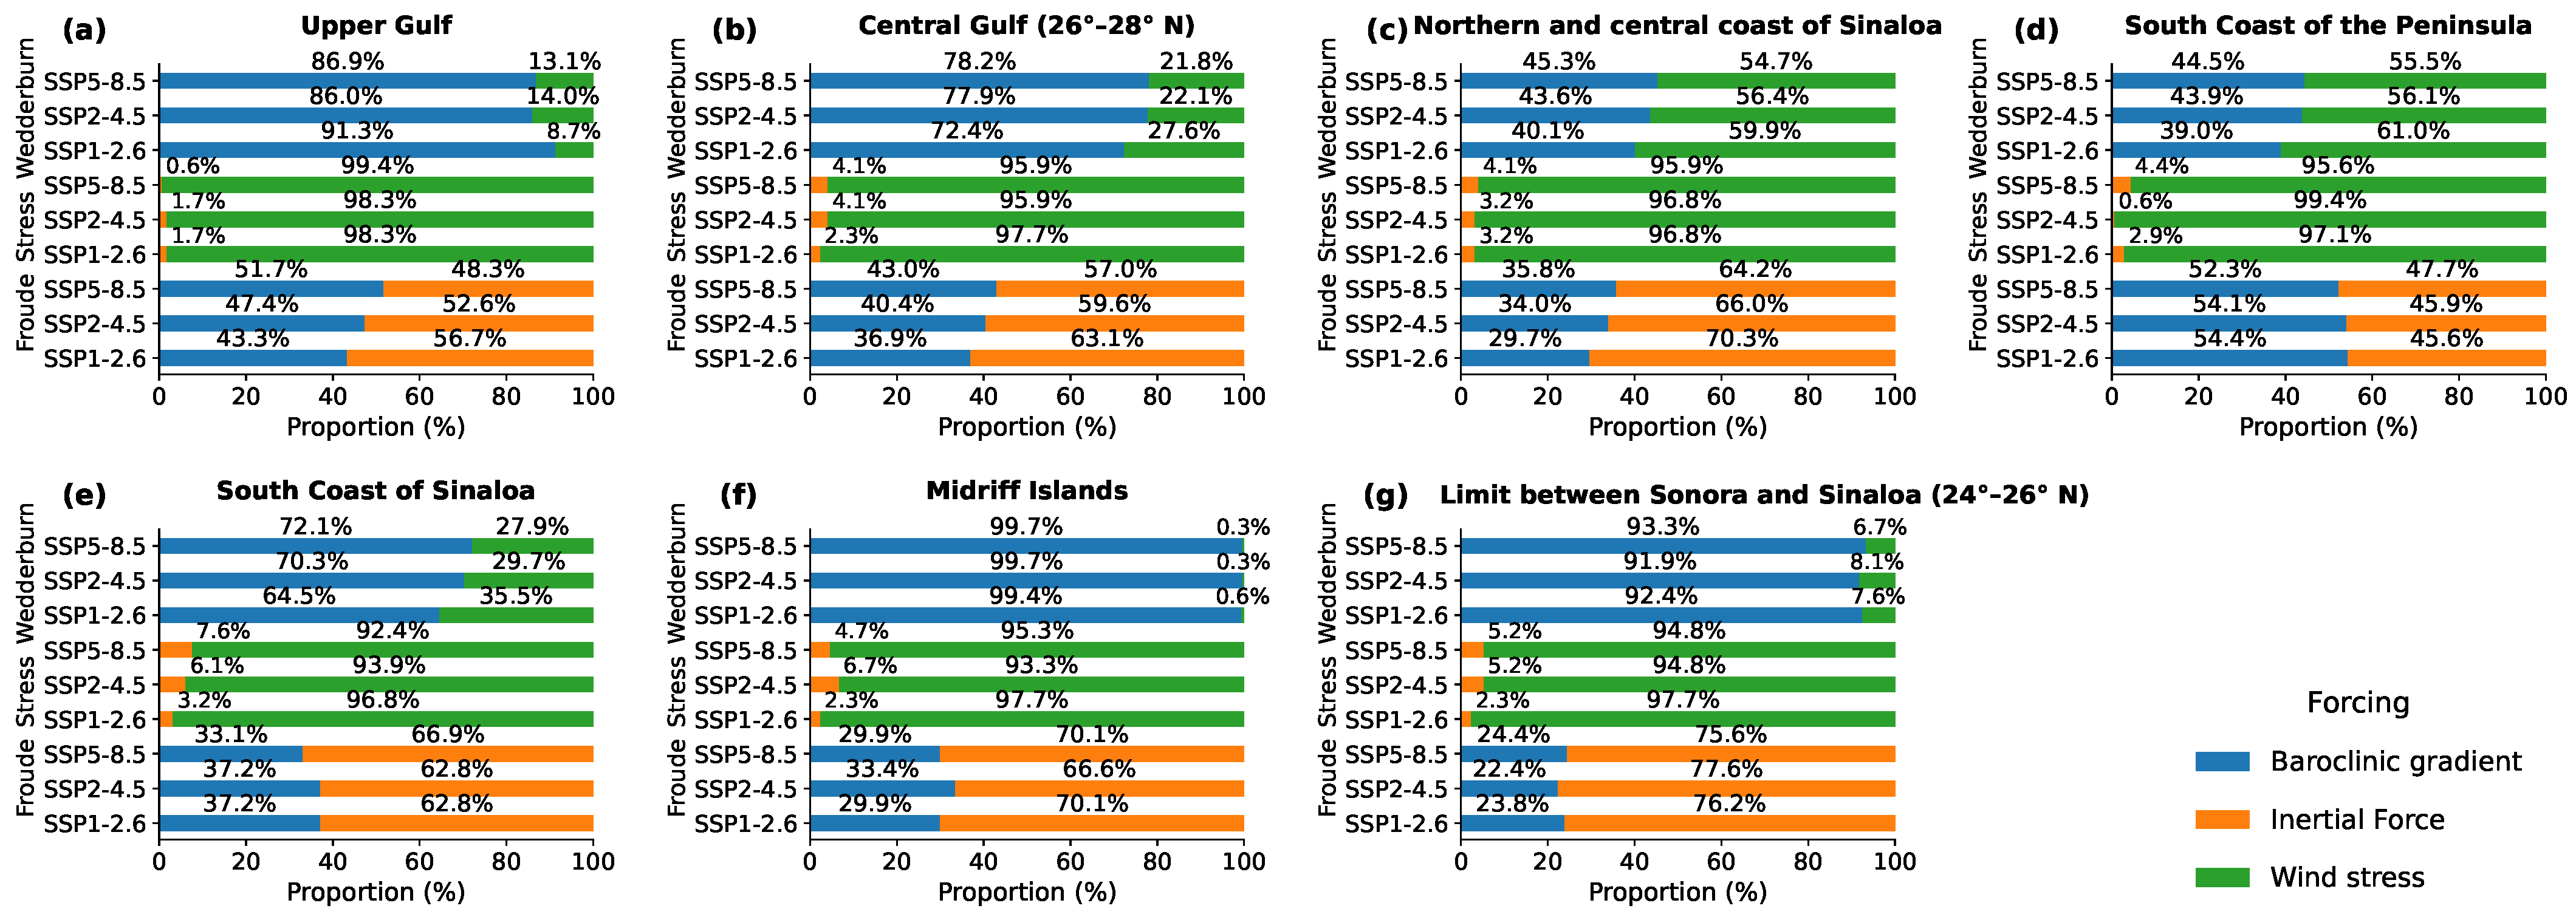
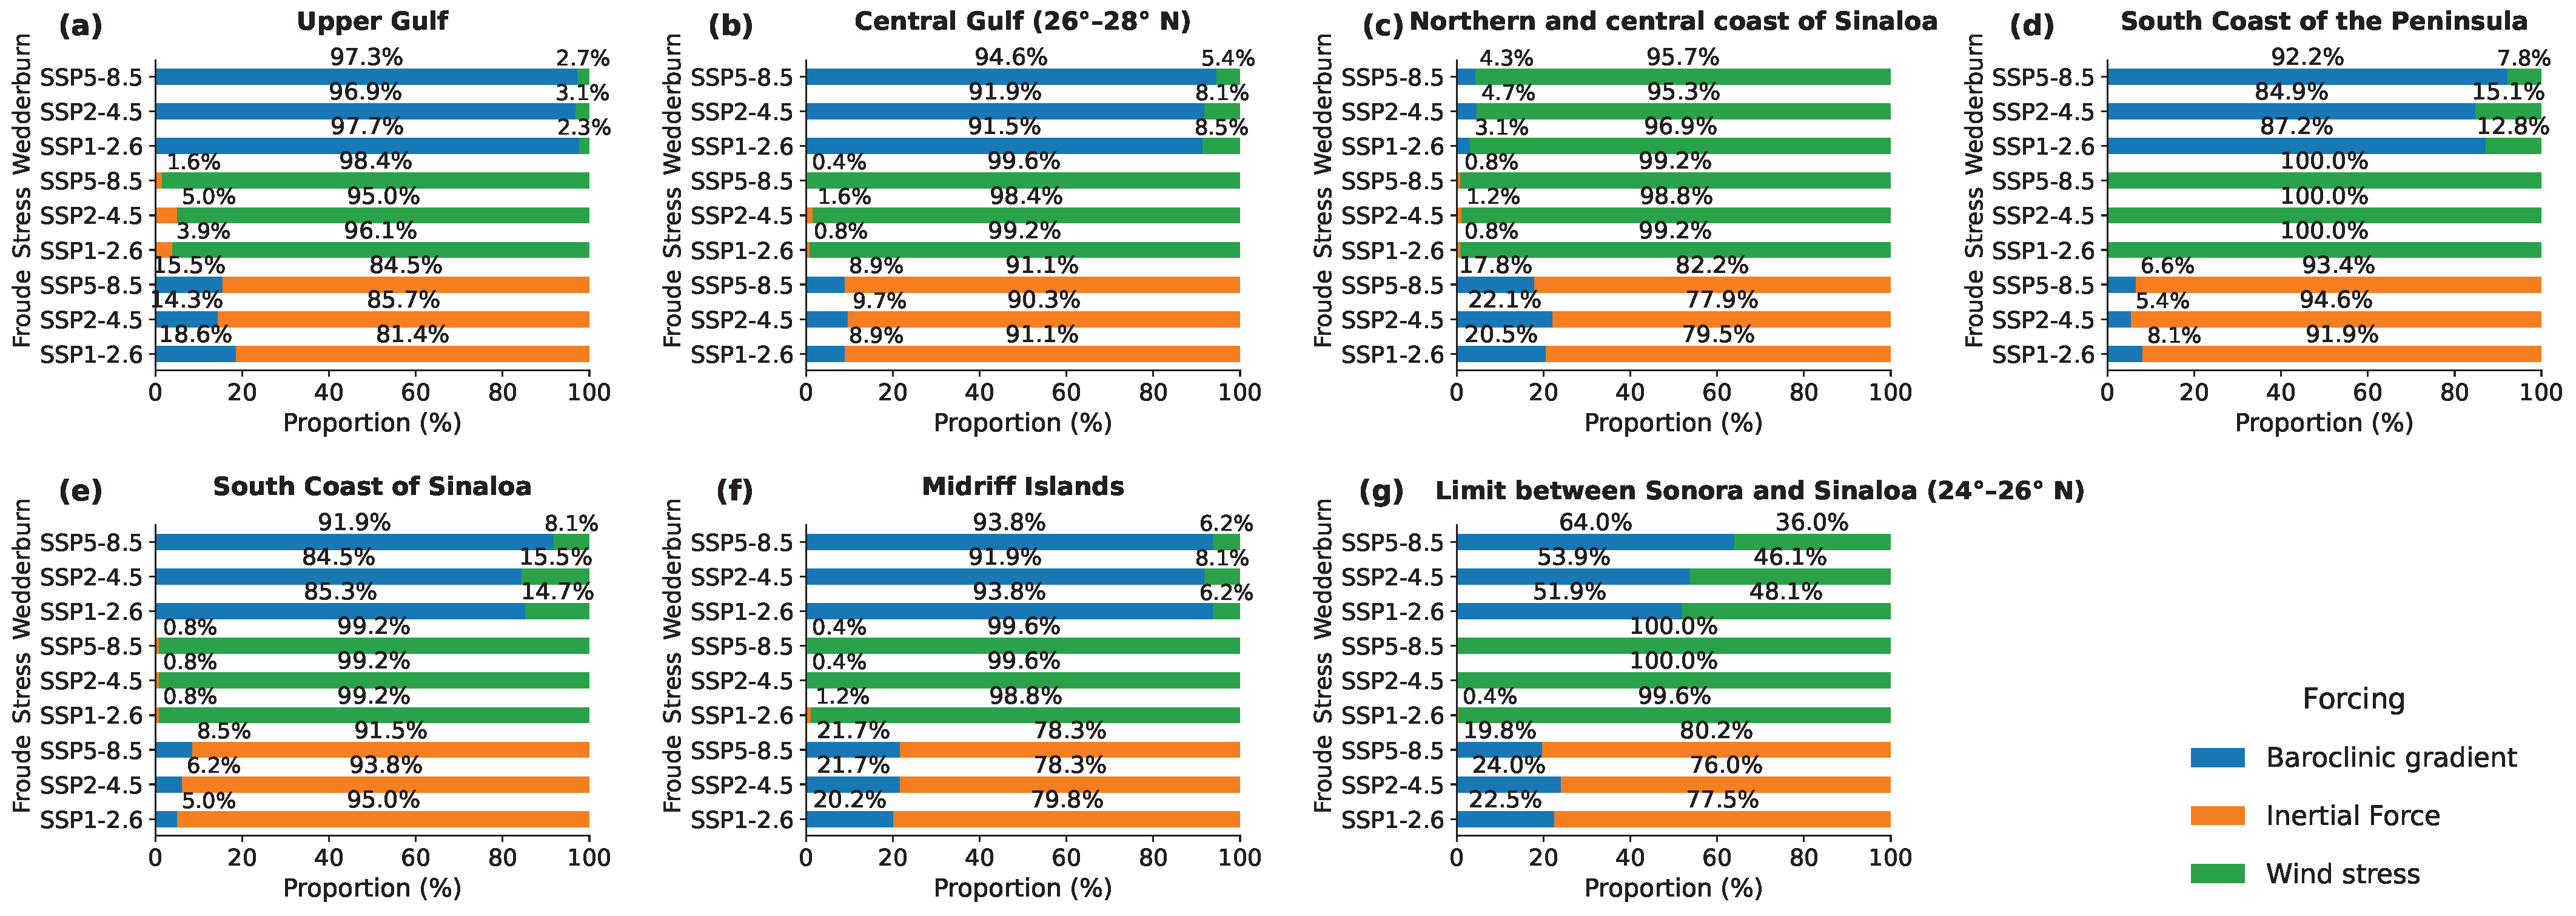
For each region and climate scenario, the relative contribution of specific forcings was quantified by calculating the proportion of monthly observations in which a given force showed a relatively higher magnitude than the others. For instance, in the case of the Froude number (), a total of 344 monthly observations were analyzed. Instances where inertial forces were relatively higher () and where baroclinic pressure gradients were relatively higher () were counted separately. These counts were then normalized to yield percentage values representing the seasonal occurrence of each forcing mechanism. This approach provided a comparative assessment of dynamic regimes across regions and scenarios and allowed the identification of seasonal variability in the physical processes involved (see Figure 11 and Figure 12).
Figure 11.
Proportion of forcing mechanisms during summer by region and climate scenario. Panels show results for (a) Upper Gulf, (b) Central Gulf (26–28° N), (c) Northern and Central Coast of Sinaloa, (d) South Coast of the Peninsula, (e) South Coast of Sinaloa, (f) Midriff Islands, and (g) the limit between Sonora and Sinaloa (24–26° N). In each panel, bars are grouped by scenario (SSP1–2.6, SSP2–4.5, and SSP5–8.5, from bottom to top). Percentages indicate the fraction of summer events in which each forcing mechanism shows the greatest relative contribution. Blue bars indicate conditions associated with the baroclinic pressure gradient, orange bars represent conditions associated with inertial forcing, and green bars indicate conditions associated with wind stress. The relative contribution of each forcing mechanism is estimated from the magnitude of the corresponding non-dimensional numbers: the Froude number (inertial forcing versus baroclinic forcing), the Wedderburn number (baroclinic forcing versus wind stress), and the Stress number (inertial forcing versus wind stress).
Figure 12.
Proportion of forcing mechanisms during winter by region and climate scenario. Panels show results for (a) Upper Gulf, (b) Central Gulf (26–28° N), (c) Northern and Central Coast of Sinaloa, (d) South Coast of the Peninsula, (e) South Coast of Sinaloa, (f) Midriff Islands, and (g) the limit between Sonora and Sinaloa (24–26° N). In each panel, bars are grouped by scenario (SSP1–2.6, SSP2–4.5, and SSP5–8.5, from bottom to top). Percentages indicate the fraction of winter events in which each forcing mechanism shows the greatest relative contribution. Blue bars indicate conditions associated with the baroclinic pressure gradient, orange bars represent conditions associated with inertial forcing, and green bars indicate conditions associated with wind stress. The relative contribution of each forcing mechanism is estimated from the magnitude of the corresponding non-dimensional numbers: the Froude number (inertial forcing versus baroclinic forcing), the Wedderburn number (baroclinic forcing versus wind stress), and the Stress number (inertial forcing versus wind stress).
During summer (Figure 11), the Froude number indicates that inertial forcing dominates (>50%) in most regions, particularly along the Sinaloa coast and the Midriff Islands, where inertial contributions frequently exceed 60–70%. However, in the South Coast of the Peninsula, baroclinic forcing slightly surpasses inertial forcing under some SSP scenarios, revealing a more balanced dynamic regime.
The Wedderburn number suggests that the baroclinic pressure gradient generally shows a larger relative contribution across all regions, exceeding approximately 70–90% of the observations. This pattern is especially noticeable in the Midriff Islands and in the limit between Sonora and Sinaloa, where the contribution associated with baroclinic forcing exceeds 90%.
The stress number suggests that wind stress generally shows a larger contribution than inertial forcing in most regions (>90% in several cases), indicating the influence of atmospheric forcing during summer.
Overall, summer shows regional variability. While wind stress and baroclinic forcing generally show a larger relative contribution according to the stress and Wedderburn numbers, the Froude number indicates spatial differences in the balance between inertial and baroclinic processes, especially along the southern peninsula and central Gulf regions.
During winter (Figure 12), the forcing configuration appears relatively consistent across regions. The Froude number suggests a larger contribution of inertial forcing in all regions and scenarios, commonly exceeding 80–95%, indicating a greater relative contribution of inertial processes compared with summer.
The Wedderburn number indicates that baroclinic forcing generally shows a larger contribution relative to wind stress, often exceeding 90–95% in all regions. In some cases, such as the South Coast of the Peninsula, wind stress represents a comparatively smaller contribution.
Similarly, the stress number indicates that wind stress tends to dominate over inertial forcing throughout the basin during winter, frequently reaching values above 95%.
In contrast to summer, winter shows a relatively consistent spatial pattern in the dynamical regime across the Gulf of California. The similarity among SSP scenarios suggests that projected climate change does not indicate major changes in the relative importance of the forcing mechanisms, but rather small variations in their relative contributions.
4. Discussion
4.1. Annual and Interannual Variability of Sea Surface Temperature
Differences among scenarios are more evident for variables that respond directly to radiative forcing, such as SST, whereas variables governed by inertia and large–scale circulation tend to exhibit more gradual changes. FFT results indicate that SST variance is primarily associated with annual and semiannual frequencies in all scenarios, reflecting a persistent seasonal cycle. The similarity of spectral peaks suggests that the frequency structure of seasonal variability remains relatively stable across emission pathways, although FFT does not provide temporal localization. At frequencies longer than approximately two years, differences in spectral energy distribution among scenarios become apparent. However, because FFT does not resolve temporal evolution, these differences cannot be interpreted as temporal divergence among scenarios. Rather, they suggest that lower–frequency SST variability may respond differently under distinct emission pathways. STL decomposition and linear trend analysis indicate a persistent increase in SST across the Gulf of California under all three emission scenarios, together with spatial variability in the magnitude of warming. While the long–term trend reflects basin–wide warming, the spatial distribution of SST trends highlights regional differences in the rate of change. The seasonal component retains its amplitude and periodicity, indicating that the structure of intra–annual variability remains relatively stable despite the rising mean temperature.
Wavelet analysis further highlights variability at interannual timescales across the analyzed climate scenarios. Under SSP1–2.6, variability within the 2–5–year band appears intermittent and temporally bounded, whereas under SSP2–4.5 and SSP5–8.5 it tends to exhibit greater temporal persistence. These fluctuations fall within the typical ENSO timescale range; however, the present analysis does not include coherence or correlation with established climate indices. Therefore, the results are interpreted as variability occurring within ENSO–like timescales rather than as modifications to specific El Niño events. Previous studies have documented notable inter-model differences in the representation of ENSO-related variability across CMIP simulations [62], highlighting the inherent uncertainty in projections at interannual scales. Although the CNRM–CM6–1–HR model presents known limitations, including a reported cooling bias under tropical cyclone conditions [63], such biases primarily affect short–term air–sea interactions. Because the present study focuses on annual to interannual variability, these event-scale biases are not expected to substantially influence the overall interpretation of the results.
4.2. Extreme Temperature Events and Implications for Regional Climate and Precipitation
Beyond changes in mean SST variability, the analysis also indicates modifications in the occurrence of extreme temperature events. Extreme heat events become more frequent across the Gulf of California throughout the 21st century, while extreme cold events show a declining tendency. Under the SSP5–8.5 scenario, increases in extreme heat events become more noticeable beginning in the 2050s. Although extreme cold events decrease substantially, the apparent near-disappearance toward the end of the century should be interpreted cautiously, as endpoint and binning effects may influence late-century event counts. Nevertheless, these patterns are consistent with global trends reported by Wang et al. (2024) [64], who documented a widespread decline in extreme cold events across tropical and subtropical oceans. Regions with higher projected frequencies of extreme heat events under all scenarios include the southern coast of the Baja California Peninsula, the entrance to the Gulf of California, and the southern and oceanic coasts of Sinaloa. Under SSP5–8.5, up to 38 extreme heat events are projected during the 2090s decade in these areas. Such events may have ecological implications, including increased thermal stress on marine organisms, potential coral bleaching, disruptions to fisheries, and shifts in species distributions [65].
Furthermore, SST anomalies in the GoC have been shown to influence precipitation patterns in northwestern Mexico and the southwestern United States of America (USA). Mo and Higgins (2008) [66] and Kim et al. (2005) [67] found that warm SSTs in the northern GoC enhance monsoonal rainfall, while cold SSTs suppress it. Mo and Juang (2003) [68] noted that this influence is primarily confined to northwestern Mexico. In contrast, Mitchell et al. (2002) [69] reported that intense monsoonal precipitation in the southwestern USA is associated with SSTs exceeding 29 °C in the GoC during the July–September period. The present study identifies a consistent increase in SST and an increase in the number of extreme SST events, which may imply a longer monsoon season or an increase in rainfall events. However, it is important to consider that global warming is also associated with a higher frequency and intensity of tropical cyclones. Higgins et al. [70] showed that approximately 50% of Gulf moisture surge events are linked to tropical cyclones. These events can induce episodic SST cooling through wave-driven mixing and increased cloud cover, which reduces incoming solar radiation and net surface heat flux [66,70]. Nevertheless, such episodic cooling events are insufficient to offset the long-term warming trend projected in the Gulf, particularly under high-emissions scenarios.
4.3. Implications of Projected Changes in Surface Circulation and Wind Speed
In addition to thermal changes, projections suggest a reduction in surface current speeds across several regions of the Gulf. The largest decreases occur in the Central Gulf and the Midriff Islands under the SSP5–8.5 scenario. Although the seasonal inversion pattern in the northern Gulf is preserved, the projected decrease in circulation intensity may influence nutrient transport and the renewal of water masses. The Gulf’s circulation exhibits a well-documented seasonal inversion, characterized by cyclonic flow from June to September and anticyclonic flow from November to April, both with average speeds close to 0.15 m s−1. These seasonal patterns have been reproduced in previous numerical modeling studies [71,72]. Within this context, the results suggest that under higher-emission scenarios, surface current intensity may decline, particularly in the central portion of the basin, without evidence of systematic changes in the prevailing flow direction.
Wind speed also shows a general declining tendency across most regions, although regional anomalies are present. For example, a slight increase in wind speed is projected along the north-central coast of Sinaloa under SSP5–8.5, potentially associated with localized pressure gradients. In contrast, the overall reduction in wind speed across the Gulf may contribute to weaker vertical mixing and enhanced water column stratification. The Gulf exhibits a well-documented seasonal wind regime, with winter northwesterlies and summer southeasterlies modulating Ekman transport and coastal upwelling [8,29]. Against this background, the projected weakening of wind speed in most regions may favor stronger stratification associated with increasing SST. In addition to changes in wind speed, projected variations in wind direction are spatially and seasonally heterogeneous, without a consistent basin-wide shift. These variations suggest localized modifications in wind-driven transport rather than a systematic reorganization of atmospheric forcing across the basin.
4.4. Relative Contribution of Hydrodynamic Forcings
While several studies [11,73,74] have proposed that wind-driven coastal upwelling systems may intensify under climate change due to enhanced thermal gradients and atmospheric circulation, the results of this study suggest a different pattern for the Gulf of California. Arellano and Rivas (2019) [11], for example, reported an intensification of upwelling events in the Gulf linked to climate change. In contrast, the present results do not indicate a basin-wide intensification of wind forcing. Although stronger wind forcing can enhance Ekman transport and surface current acceleration in principle, the projected wind trends in this study do not suggest such a basin-wide increase. Instead, wind speed tends to decrease across most regions, with increases limited to the Upper Gulf under SSP5–8.5 and to isolated coastal areas. Consequently, the projected circulation changes appear to be more closely associated with increasing stratification than with enhanced wind forcing. This interpretation is consistent with observations by Robinson (2016) [15], who documented a decline in upwelling intensity off the western coast of the Baja California Peninsula during the 2014–2015 warming event.
Within the dimensionless framework adopted in this study, these projected changes reflect shifts in the relative balance among inertial forcing, baroclinic contributions, and wind stress. Under higher-emission scenarios, baroclinic effects tend to gain relative importance as stratification intensifies, while the relative contribution of wind forcing weakens in most regions. This adjustment in the balance of forcings may help explain the projected reduction in surface circulation intensity without a systematic reorganization of flow direction.
The combined effects of declining surface currents, reduced wind speed, and increasing frequency of warm events suggest that the Gulf of California may become more susceptible to reduced vertical exchange and diminished nutrient renewal in the upper water column. Such conditions could influence primary productivity and ecosystem resilience. Under higher-emission scenarios (SSP5–8.5), these tendencies appear more noticeable, whereas under SSP1–2.6 the projected changes remain comparatively moderate.
4.5. Limitations and Future Work
It is important to recognize several limitations of this analysis. The use of a single global climate model provides valuable basin-scale information but does not allow explicit quantification of structural uncertainty across the broader CMIP ensemble. In addition, the spatial resolution of approximately 0.25° may not fully resolve coastal and submesoscale processes, including fine-scale upwelling dynamics and nearshore circulation. Local atmospheric variability, freshwater inputs, and other regional forcings were not explicitly isolated and may modulate SST and circulation patterns at smaller spatial scales.
Therefore, while the model provides a robust framework for analyzing large-scale and long-term variability, caution is required when interpreting regional-scale processes. Future studies incorporating multi-model ensembles and higher-resolution regional simulations would help refine projections of coastal circulation and upwelling intensity in the Gulf of California.
5. Conclusions
The analysis of dimensionless numbers suggests changes in the physical processes governing the Gulf of California under increasing greenhouse gas emissions. Across all scenarios (SSP1–2.6, SSP2–4.5, SSP5–8.5), the system is projected to become warmer and less energetic, with reduced surface current speeds and lower wind speed. Under higher radiative forcing, the relative balance among forcing mechanisms may vary, with baroclinic contributions becoming relatively more important than inertial and wind-driven components, particularly under high-emission pathways.
Surface current speeds decline across most regions, with larger reductions occurring in the central basin under SSP5–8.5. Although the seasonal inversion pattern in the northern Gulf is preserved, the projected decrease in circulation intensity may affect the renewal and formation of Gulf of California Water (GCW), which warrants further investigation.
Wind speed also shows a general downward trend, albeit with regional variability. For instance, a slight increase is projected along the north–central coast of Sinaloa under SSP5–8.5, potentially linked to intensified pressure gradients during specific seasons. Nevertheless, the overall decline in wind speed suggests reduced vertical mixing and enhanced stratification of the water column.
The three scenarios analyzed using the CNRM-CM6-1-HR model project a warming of the surface layer in the Gulf of California. The annual SST variability signal remains the primary component across all scenarios, superimposed on a positive long-term trend. Low-frequency variability within the ENSO timescale (2–7 years) appears to modulate interannual SST fluctuations, with amplitudes ranging between 0.5 and 0.9 °C. These oscillations persist throughout the projection period, suggesting that interannual variability may continue to play an important role under the SSP1–2.6, SSP2–4.5, and SSP5–8.5 scenarios.
Supplementary Materials
The following supporting information can be downloaded at: https://www.mdpi.com/article/10.3390/cli14040079/s1.
Author Contributions
M.R.-R.: conceptualization, methodology, software, validation, formal analysis, investigation, data curation, visualization, writing—original draft preparation, and project administration. D.A.S.-d.-L.: methodology, writing—review and editing, and supervision. All authors have read and agreed to the published version of the manuscript.
Funding
This research was funded by an institutional grant from the Institute of Marine Sciences and Limnology, National Autonomous University of Mexico (UNAM) (grants 144 and 145), and the DGAPA-PAPIIT project IG100421 “Análisis de las interacciones entre aguas continentales y marinas en el Golfo de California bajo el enfoque de la fuente al mar como base para su gestión sustentable”. M. Romero-Robles acknowledges financial support from the Marine Sciences and Limnology Graduate Program at the National Autonomous University of Mexico (UNAM) through a PhD scholarship (CVU 745610).
Data Availability Statement
All data used in this study are publicly available and can be freely downloaded from the CMIP6 archive at https://aims2.llnl.gov/search/cmip6 (accessed on 2 December 2020).
Acknowledgments
The authors express their gratitude to the Institute of Marine Sciences and Limnology, UNAM, and to the Marine Sciences and Limnology Graduate Program, UNAM.
Conflicts of Interest
The authors declare no conflicts of interest.
References
- Gregg, M.C.; Sanford, T.B.; Winkel, D.P. Reduced mixing from the breaking of internal waves in equatorial waters. Nature 2003, 422, 513–515. [Google Scholar] [CrossRef] [Scilit] [PubMed]
- Hoegh-Guldberg, O.; Cai, R.; Poloczanska, E.S.; Brewer, P.G.; Sundby, S.; Hilmi, K.; Fabry, V.J.; Jung, S. The Ocean. In Climate Change 2014: Impacts, Adaptation, and Vulnerability. Part B: Regional Aspects. Contribution of Working Group II to the Fifth Assessment Report of the Intergovernmental Panel on Climate Change; Barros, V.R., Field, C.B., Dokken, D.J., Mastrandrea, M.D., Mach, K.J., Bilir, T.E., Chatterjee, M., Ebi, K.L., Estrada, Y.O., Genova, R.C., Eds.; Cambridge University Press: Cambridge, UK; New York, NY, USA, 2014; pp. 1655–1731. [Google Scholar]
- Hoegh-Guldberg, O.; Mumby, P.; Hooten, A.; Steneck, R.; Greenfield, P.; Gomez, E.; Harvell, C.; Sale, P.; Edwards, A.; Caldeira, K.; et al. Coral reefs under rapid climate change and ocean acidification. Science 2007, 318, 1737–1742. [Google Scholar] [CrossRef] [Scilit] [PubMed]
- Li, G.; Cheng, L.; Zhu, J.; Trenberth, K.; Mann, M.; Abraham, J. Increasing ocean stratification over the past half-century. Nat. Clim. Change 2020, 10, 1116–1123. [Google Scholar] [CrossRef] [Scilit]
- Libes, S. Introduction to Marine Biogeochemistry; Academic Press: Cambridge, MA, USA, 2011. [Google Scholar]
- Chavez, F.P.; Messié, M. A comparison of eastern boundary upwelling ecosystems. Prog. Oceanogr. 2009, 83, 80–96. [Google Scholar] [CrossRef] [Scilit]
- Behrenfeld, M.J.; O’Malley, R.T.; Siegel, D.A.; McClain, C.R.; Sarmiento, J.L.; Feldman, G.C.; Milligan, A.J.; Falkowski, P.G.; Letelier, R.M.; Boss, E.S. Climate-driven trends in contemporary ocean productivity. Nature 2006, 444, 752–755. [Google Scholar] [CrossRef] [Scilit]
- Roden, G. Oceanographic and meteorological aspects of the Gulf of California. Pac. Sci. 1958, VII, 21–45. [Google Scholar]
- Marinone, S.G. Tidal residual currents in the Gulf of California: Is the M2 tidal constituent sufficient to induce them? J. Geophys. Res. Ocean. 1997, 102, 8611–8623. [Google Scholar] [CrossRef] [Scilit]
- Portela, E.; Beier, E.; Barton, E.; Castro, R.; Godínez, V.; Palacios-Hernández, E.; Fiedler, P.; Sánchez-Velasco, L.; Trasviña, A. Water masses and circulation in the tropical Pacific off central Mexico and surrounding areas. J. Phys. Oceanogr. 2016, 46, 3069–3081. [Google Scholar] [CrossRef] [Scilit]
- Arellano, B.; Rivas, D. Coastal upwelling will intensify along the Baja California coast under climate change by mid-21st century. J. Mar. Syst. 2019, 199, 103207. [Google Scholar] [CrossRef] [Scilit]
- Lluch-Cota, S.; Parés-Sierra, A.; Magaña-Rueda, V.; Arreguín-Sánchez, F.; Bazzino, G.; Herrera-Cervantes, H.; Lluch-Belda, D. Changing climate in the Gulf of California. Prog. Oceanogr. 2010, 87, 114–126. [Google Scholar] [CrossRef] [Scilit]
- Lluch-Belda, D.; del Monte-Luna, P.; Lluch-Cota, S. 20th century variability in Gulf of California SST. In CalCOFI Reports; California Cooperative Oceanic Fisheries Investigations (CalCOFI): La Jolla, CA, USA, 2009; Volume 50, pp. 147–154. [Google Scholar]
- Petatan-Ramirez, D.; Ojeda-Ruiz, M.; Sánchez-Velasco, L.; Rivas, D.; Reyes-Bonilla, H.; Cruz-Piñón, G.; Morzaria-Luna, H.; Cisneros-Montemayor, A.; Cheung, W.; Salvadeo, C. Potential changes in the distribution of suitable habitat for Pacific sardine. Deep Sea Res. Part II 2019, 169, 104632. [Google Scholar] [CrossRef] [Scilit]
- Robinson, C. Evolution of the 2014–2015 sea surface temperature warming in Baja California. Geophys. Res. Lett. 2016, 43, 7066–7071. [Google Scholar] [CrossRef] [Scilit]
- Ayala-Bocos, A.; Reyes-Bonilla, H.; Calderón-Aguilera, L.; Herrero-Perezrul, M.; González-Espinosa, P. Proyección de cambios en la temperatura superficial del mar del Golfo de California. Rev. Cienc. Mar. Costeras 2016, 8, 29–40. [Google Scholar]
- Lluch-Cota, S.E.; Aragón-Noriega, E.A.; Arreguín-Sánchez, F.; Aurioles-Gamboa, D.; Bautista-Romero, J.J.; Brusca, R.C.; Cervantes-Duarte, R.; Cortés-Altamirano, R.; Del-Monte-Luna, P.; Esquivel-Herrera, A.; et al. The Gulf of California: Review of ecosystem status and sustainability challenges. Prog. Oceanogr. 2007, 73, 1–26. [Google Scholar] [CrossRef] [Scilit]
- Sánchez-Velasco, L.; Godínez, V.M.; Ruvalcaba-Aroche, E.D.; Márquez-Artavia, A.; Beier, E.; Barton, E.D.; Jiménez-Rosenberg, S.P.A. Larval fish habitats and deoxygenation in the northern limit of the oxygen minimum zone off Mexico. J. Geophys. Res. Oceans 2019, 124, 9690–9705. [Google Scholar] [CrossRef] [Scilit]
- Gallo, N.; Beckwith, M.; Wei, C.; Levin, L.; Kuhnz, L.; Barry, J. Dissolved oxygen and temperature best predict deep-sea fish community structure. Mar. Ecol. Prog. Ser. 2020, 637, 159–180. [Google Scholar] [CrossRef] [Scilit]
- Nevárez-Martínez, M.O.; Lluch-Belda, D.; Cisneros-Mata, M.A.; Santos-Molina, J.P.; De los Angeles Martıinez-Zavala, M.; Lluch-Cota, S.E. Distribution and abundance of the Pacific sardine (Sardinops sagax) in the Gulf of California and their relation with the environment. Prog. Oceanogr. 2001, 49, 565–580. [Google Scholar] [CrossRef] [Scilit]
- Voldoire, A.; Saint-Martin, D.; Sénési, S.; Decharme, B.; Alias, A.; Chevallier, M.; Colin, J.; Guérémy, J.F.; Michou, M.; Moine, M.P.; et al. Evaluation of CMIP6 deck experiments with CNRM-CM6-1. J. Adv. Model. Earth Syst. 2019, 11, 2177–2213. [Google Scholar] [CrossRef] [Scilit]
- Lara-Lara, J.R.; Arenas-Fuentes, V.; Bazán-Guzmán, C.; Díaz-Castañeda, V.; Escobar-Briones, E.; García-Abad, M.C.; Gaxiola-Castro, G.; Robles-Jarero, G.; Sosa-Ávalos, R.; Soto-González, L.A.; et al. Los ecosistemas marinos. In Capital Natural de México, Vol. I: Conocimiento Actual de la Biodiversidad; CONABIO: Mexico City, Mexico, 2008; pp. 135–159. [Google Scholar]
- Emilsson, I. Oceanografía Físico-Química del Golfo de California; Technical Report; CICIMAR-IPN: La Paz, Mexico, 1993. [Google Scholar]
- López-Martínez, J.; Farach-Espinoza, E.; Herrera-Cervantes, H.; García-Morales, R. Long-term variability in sea surface temperature and chlorophyll a in the Gulf of California. Remote Sens. 2023, 15, 4088. [Google Scholar] [CrossRef] [Scilit]
- Douglas, M.W.; Maddox, R.A.; Howard, K.; Reyes, S. The Mexican monsoon. J. Clim. 1993, 6, 1665–1677. [Google Scholar] [CrossRef] [Scilit]
- Beier, E. A numerical investigation of the annual variability in the Gulf of California. J. Phys. Oceanogr. 1997, 27, 615–632. [Google Scholar] [CrossRef] [Scilit]
- Beier, E.; Ripa, P. Seasonal gyres in the northern Gulf of California. J. Phys. Oceanogr. 1999, 29, 305–311. [Google Scholar] [CrossRef] [Scilit]
- Salas-de-León, D.A.; Carbajal-Pérez, N.; Monreal-Gómez, M.A.; Barrientos-MacGregor, G. Residual circulation and tidal stress in the Gulf of California. J. Geophys. Res. Oceans 2003, 108, 3317. [Google Scholar] [CrossRef] [Scilit]
- Lavín, M.; Marinone, S. An overview of the physical oceanography of the Gulf of California. In Nonlinear Processes in Geophysical Fluid Dynamics: A Tribute to the Scientific Work of Pedro Ripa; Springer: Dordrecht, The Netherlands, 2003; pp. 173–204. [Google Scholar]
- Merrifield, M.A.; Winant, C.D. Shelf circulation in the Gulf of California: A description of the variability. J. Geophys. Res. 1989, 94, 18133–18160. [Google Scholar] [CrossRef] [Scilit]
- Zamudio, L.; Hurlburt, H.E.; Metzger, E.J.; Smedstad, O.M. On the evolution of coastally trapped waves generated by Hurricane Juliette along the Mexican west coast. Geophys. Res. Lett. 2002, 29, 56-1–56-4. [Google Scholar] [CrossRef] [Scilit]
- Herrera-Cervantes, H.; Lluch-Cota, D.; Lluch-Cota, S. The ENSO signature in sea-surface temperature in the Gulf of California. J. Mar. Res. 2007, 65, 589–605. [Google Scholar] [CrossRef] [Scilit]
- Herrera-Cervantes, H.; Lluch-Cota, S.; Lluch-Cota, D.; Gutiérrez-de Velasco, G.; Lluch-Belda, D. ENSO influence on satellite-derived chlorophyll trends in the Gulf of California. Atmósfera 2010, 23, 253–262. [Google Scholar] [CrossRef] [Scilit]
- Sánchez-Velasco, L.; Shirasago, B.; Cisneros-Mata, M.A.; Ávalos-García, C. Spatial distribution of small pelagic fish larvae in the Gulf of California and its relation to El Niño 1997–1998. J. Plankton Res. 2000, 22, 1611–1618. [Google Scholar] [CrossRef] [Scilit]
- Sánchez-Velasco, L.; Beier, E.; Godínez, V.M.; Barton, E.D.; Santamaría-del-Ángel, E.; Jiménez-Rosenberg, S.P.; Marinone, S.G. Hydrographic and fish larvae distribution during the “Godzilla El Niño 2015–2016” in the northern end of the shallow oxygen minimum zone of the eastern tropical Pacific Ocean. J. Geophys. Res. Ocean. 2017, 122, 2156–2170. [Google Scholar] [CrossRef] [Scilit]
- Coria-Monter, E.; Monreal-Gómez, M.A.; Salas-de-León, D.A.; Durán-Campos, E. Water masses and chlorophyll-a distribution in a semi-enclosed bay in the southern Gulf of California, Mexico, after the “Godzilla El Niño”. Arab. J. Geosci. 2019, 12, 473. [Google Scholar] [CrossRef] [Scilit]
- Lavín, M.; Castro, R.; Beier, E.; Cabrera, C.; Godínez, V.M.; Amador-Buenrostro, A. Surface circulation in the Gulf of California in summer from surface drifters and satellite images (2004–2006). J. Geophys. Res. Oceans 2014, 119, 4278–4290. [Google Scholar] [CrossRef] [Scilit]
- Eyring, V.; Bony, S.; Meehl, G.A.; Senior, C.A.; Stevens, B.; Stouffer, R.J.; Taylor, K.E. Overview of the Coupled Model Intercomparison Project Phase 6 (CMIP6) experimental design and organization. Geosci. Model Dev. 2016, 9, 1937–1958. [Google Scholar] [CrossRef] [Scilit]
- Tokarska, K.B.; Stolpe, M.B.; Sippel, S.; Fischer, E.M.; Smith, C.J.; Lehner, F.; Knutti, R. Past warming trend constrains future warming in CMIP6 models. Sci. Adv. 2020, 6, eaaz9549. [Google Scholar] [CrossRef] [Scilit] [PubMed]
- Saint-Martin, D.; Geoffroy, O.; Voldoire, A.; Cattiaux, J.; Brient, F. Tracking changes in climate sensitivity in CNRM climate models. J. Adv. Model. Earth Syst. 2021, 13, e2020MS002190. [Google Scholar] [CrossRef] [Scilit]
- Roehrig, R.; Beau, I.; Saint-Martin, D.; Alias, A.; Decharme, B.; Guérémy, J.F.; Voldoire, A.; Abdel-Lathif, A.Y.; Bazile, E.; Belamari, S.; et al. The CNRM global atmosphere model ARPEGE-Climat 6.3: Description and evaluation. J. Adv. Model. Earth Syst. 2020, 12, e2020MS002075. [Google Scholar] [CrossRef] [Scilit]
- Roberts, M.J.; Vidale, P.L.; Senior, C.; Hewitt, H.T.; Bates, C.; Berthou, S.; Chang, P.; Christensen, H.M.; Danilov, S.; Demory, M.E.; et al. The benefits of global high-resolution for climate simulation: Process understanding and the enabling of stakeholder decisions at the regional scale. Bull. Am. Meteorol. Soc. 2018, 99, 2341–2359. [Google Scholar] [CrossRef] [Scilit]
- O’Neill, B.C.; Kriegler, E.; Ebi, K.L.; Kemp-Benedict, E.; Riahi, K.; Rothman, D.S.; van Ruijven, B.J.; van Vuuren, D.P.; Birkmann, J.; Kok, K.; et al. The roads ahead: Narratives for shared socioeconomic pathways describing world futures in the 21st century. Glob. Environ. Change 2017, 42, 169–180. [Google Scholar] [CrossRef] [Scilit]
- Intergovernmental Panel on Climate Change (IPCC). Climate Change 2021—The Physical Science Basis: Working Group I Contribution to the Sixth Assessment Report of the Intergovernmental Panel on Climate Change; Cambridge University Press: Cambridge, UK, 2023. [Google Scholar]
- Rojo-Garibaldi, B.; Salas-de León, D.; Sánchez, N.; Monreal-Gómez, M. Hurricanes in the Gulf of Mexico and the Caribbean Sea and their relationship with sunspots. J. Atmos.-Sol.-Terr. Phys. 2016, 148, 48–52. [Google Scholar] [CrossRef] [Scilit]
- Cleveland, R.; Cleveland, W.; McRae, J.; Terpenning, I. STL: A seasonal-trend decomposition. J. Stat. 1990, 6, 3–73. [Google Scholar]
- Thomas, E.; Joseph, I.; Abraham, N. Wavelet analysis of annual rainfall over Kerala and sunspot number. New Astron. 2023, 98, 101944. [Google Scholar] [CrossRef] [Scilit]
- Terán, B.; Recalde Mosquera, S.; Navarro Hernández, J.; Rozo Celemin, A.; Córdova Aguilar, J. Relación de la Corriente de Cromwell e índices ENOS en el Pacífico ecuatorial entre 1993 y 2017. Bol. Cient. CIOH 2020, 39, 51–64. [Google Scholar] [CrossRef] [Scilit]
- Durán-Campos, E.; Salas-de León, D.; Coria-Monter, E.; Monreal-Gómez, M.; Aldeco-Ramírez, J.; Quiroz-Martinez, B. ENSO effects in the southern Gulf of California estimated from satellite data. Cont. Shelf Res. 2023, 266, 105084. [Google Scholar] [CrossRef] [Scilit]
- Mardia, K.V.; Jupp, P.E. Directional Statistics; John Wiley & Sons: Chichester, UK, 2000. [Google Scholar]
- Fisher, N.I. Statistical Analysis of Circular Data; Cambridge University Press: Cambridge, UK, 1993. [Google Scholar]
- Wilks, D.S. Statistical Methods in the Atmospheric Sciences, 3rd ed.; Academic Press: Oxford, UK, 2011. [Google Scholar]
- Efron, B.; Tibshirani, R.J. An Introduction to the Bootstrap; Chapman & Hall/CRC: New York, NY, USA, 1993. [Google Scholar]
- Mudelsee, M. Climate Time Series Analysis: Classical Statistical and Bootstrap Methods; Springer: Dordrecht, The Netherlands, 2010. [Google Scholar]
- Páez-Osuna, F.; Sanchez-Cabeza, J.; Ruiz-Fernández, A.; Alonso-Rodríguez, R.; Piñón-Gimate, A.; Cardoso-Mohedano, J.; Flores-Verdugo, F.; Carballo, J.; Cisneros-Mata, M.; Álvarez-Borrego, S. Environmental status of the Gulf of California: A review of responses to climate change and climate variability. Earth-Sci. Rev. 2016, 162, 253–268. [Google Scholar] [CrossRef] [Scilit]
- Beck, S.; Mahony, M. The IPCC and the new map of science and politics. Wiley Interdiscip. Rev. Clim. Change 2018, 9, e547. [Google Scholar] [CrossRef] [Scilit]
- Alsefri, M.; Sudell, M.; García-Fiñana, M.; Kolamunnage-Dona, R. Bayesian joint modelling of longitudinal and time to event data: A methodological review. BMC Med. Res. Methodol. 2020, 20, 94. [Google Scholar] [CrossRef] [Scilit]
- Kundu, P.; Cohen, I.; Dowling, D. Fluid Mechanics; Elsevier: Amsterdam, The Netherlands, 2016. [Google Scholar]
- Monismith, S. An experimental study of the upwelling response of stratified reservoirs to surface shear stress. J. Fluid Mech. 1986, 171, 407–439. [Google Scholar] [CrossRef] [Scilit]
- Tenorio-Fernandez, L.; Valle-Levinson, A.; Gomez-Valdes, J. Subtidal hydrodynamics in a tropical lagoon: A dimensionless numbers approach. Estuar. Coast. Shelf Sci. 2018, 200, 449–459. [Google Scholar] [CrossRef] [Scilit]
- Stewart, R.H. Introduction to Physical Oceanography; Texas A&M University: College Station, TX, USA, September 2008. [Google Scholar]
- Cheng, L.; Zhang, L.; Wang, Y.; Canadell, J.; Chiew, F.; Beringer, J.; Li, L.; Miralles, D.; Piao, S.; Zhang, Y. Recent increases in terrestrial carbon uptake at little cost to the water cycle. Nat. Commun. 2017, 8, 110. [Google Scholar] [CrossRef] [Scilit]
- Guan, S.; Huang, M.; Cai, W.; Zhang, Z.; Lin, I.-I.; Kim, H.-S.; Zhou, L.; Lin, X.; Xu, Z.; Jin, F.-F.; et al. Weak self-induced cooling of tropical cyclones amid fast sea surface warming. Nat. Geosci. 2026, 19, 153–158. [Google Scholar] [CrossRef] [Scilit]
- Wang, X.; Woolway, R.; Shi, K.; Qin, B.; Zhang, Y. Lake cold spells are declining worldwide. Geophys. Res. Lett. 2024, 51, e2024GL111300. [Google Scholar] [CrossRef] [Scilit]
- Walther, G.; Post, E.; Convey, P.; Menzel, A.; Parmesan, C.; Beebee, T.; Fromentin, J.; Hoegh-Guldberg, O.; Bairlein, F. Ecological responses to recent climate change. Nature 2002, 416, 389–395. [Google Scholar] [CrossRef] [Scilit] [PubMed]
- Mo, K.; Higgins, R. Relationships between sea surface temperatures in the Gulf of California and surge events. J. Clim. 2008, 21, 4312–4325. [Google Scholar] [CrossRef] [Scilit]
- Kim, J.; Farrara, J.; Roads, J. The effects of the Gulf of California SSTs on warm-season rainfall in the southwestern United States and northwestern Mexico: A regional model study. J. Clim. 2005, 18, 4970–4992. [Google Scholar] [CrossRef] [Scilit]
- Mo, K.C.; Juang, H.-M.H. Influence of sea surface temperature anomalies in the Gulf of California on North American monsoon rainfall. J. Geophys. Res. Atmos. 2003, 108, 4112. [Google Scholar] [CrossRef] [Scilit]
- Mitchell, D.; Ivanova, D.; Rabin, R.; Brown, T.; Redmond, K. Gulf of California sea surface temperatures and the North American monsoon: Mechanistic implications from observations. J. Clim. 2002, 15, 2261–2281. [Google Scholar] [CrossRef] [Scilit]
- Higgins, R.; Shi, W. Dominant factors responsible for interannual variability of the summer monsoon in the southwestern United States. J. Clim. 2000, 13, 759–776. [Google Scholar] [CrossRef] [Scilit]
- Lavín, M.; Durazo, R.; Palacios, E.; Argote, M.; Carrillo, L. Lagrangian observations of the circulation in the northern Gulf of California. J. Phys. Oceanogr. 1997, 27, 2298–2305. [Google Scholar] [CrossRef] [Scilit]
- Palacios-Hernández, E.; Beier, E.; Lavín, M.; Ripa, P. The effect of the seasonal variation of stratification on the circulation of the northern Gulf of California. J. Phys. Oceanogr. 2002, 32, 705–728. [Google Scholar] [CrossRef] [Scilit]
- Bakun, A.; Black, B.; Bograd, S.; Garcia-Reyes, M.; Miller, A.; Rykaczewski, R.; Sydeman, W. Anticipated effects of climate change on coastal upwelling ecosystems. Curr. Clim. Change Rep. 2015, 1, 85–93. [Google Scholar] [CrossRef] [Scilit]
- Sydeman, W.; García-Reyes, M.; Schoeman, D.; Rykaczewski, R.; Thompson, S.; Black, B.; Bograd, S. Climate change and wind intensification in coastal upwelling ecosystems. Science 2014, 345, 77–80. [Google Scholar] [CrossRef] [Scilit]

Disclaimer/Publisher’s Note: The statements, opinions and data contained in all publications are solely those of the individual author(s) and contributor(s) and not of MDPI and/or the editor(s). MDPI and/or the editor(s) disclaim responsibility for any injury to people or property resulting from any ideas, methods, instructions or products referred to in the content. |
© 2026 by the authors. Licensee MDPI, Basel, Switzerland. This article is an open access article distributed under the terms and conditions of the Creative Commons Attribution (CC BY) license.