


Abstract
Rapid urbanization and global warming are amplifying heat-related health risks, particularly for vulnerable age groups. This study develops an open-source risk assessment framework that uses big data from remote sensing, land use, and population datasets to evaluate heat-related health risks. The framework integrates indicators of green infrastructure, Land Surface Temperature (LST), and demographic vulnerability to identify areas of increased health risk. Milan (Italy) was used as the case study for the application to test the methodology and validate its capacity to detect spatial correlations between Surface Urban Heat Island (Surface UHI) intensity and concentrations of sensitive population groups (children aged 0–5 and elderly aged 65+). The results highlight distinct spatial inequalities in heat exposure and health vulnerability, confirming the method’s potential to support climate adaptation and public health planning. By relying entirely on open-access data and tools, this approach offers a replicable and scalable model for assessing climate-related health risks and informing evidence-based strategies that can support public administrations to visualize risk, prioritize interventions, and enhance urban resilience.
1. Introduction
Climate change is one of the most critical challenges of the last century affecting ecosystems, economies, and societies. Urban areas, due to their building density and excessive use of impermeable surfaces, are particularly vulnerable to the effects of the Urban Heat Island (UHI) phenomenon, which intensifies temperatures in cities compared to their rural surroundings [1,2]. The rise in urban temperature poses significant risks to public health, particularly for vulnerable age groups such as the elderly and young children, who are less able to adapt to extreme heat conditions [3,4,5,6,7,8]. Recent European assessments show that heat-related mortality has risen in 94% of monitored regions, with average mortality rates increasing by approximately 33% between 2003–12 and 2013–22 [9].
In the global context of a rising older population, heat risks impose a growing concern, especially in densely populated cities with temperate climates where heat waves are increasingly frequent [10]. One out of six world inhabitants will be over 65 years old in 2050, according to United Nations projections [11]. Regarding European Union (EU) inhabitants, the older adult population (65+ years old) is projected to increase from 21.1% (94.3 million) at the beginning of 2022 to 31.5% in 2100 [12]. Therefore, the aim of reducing the heat-related risks should be a priority for public health and climate adaptation of cities [10,11,12].
At the national level, Italy is among the most rapidly ageing countries in Europe, with a high and increasing proportion of residents aged 65 and over [10,11]. This demographic trend is particularly evident in large urban areas such as Milan, where population ageing further amplifies vulnerability to heat-related health impacts, as documented in previous epidemiological and spatial analyses [13,14].
More localized and data-driven approaches to climate adaptation are essential to mitigate these risks [14,15]. The integration of remote sensing, demographic data and Geographic Information Systems (GIS) offers a tool to map and understand spatial patterns of heat exposure and vulnerability [13,16], aligning with recent public-health research that emphasizes the need for spatially explicit assessments to support heat–health adaptation planning [17].
The aim of this research is to assess and identify urban areas with the highest health risks for vulnerable populations during heat waves and associated Surface Urban Heat Island (SUHI) phenomena using open-source data. The study follows a GIS-based methodology that combines Surface Urban Heat Island data, demographic information, and green infrastructure mapping [18,19]. Being able to combine different datasets, GIS allows for a comprehensive analysis of a city’s environmental context, therefore facilitating policymakers to identify high-risk areas, evaluate the effectiveness of Nature-Based Solutions (NBS), and develop a targeted implementation strategy [17,20].
Italy is among the European countries most exposed to extreme summer heat. Recent evidence indicates that Italy recorded the highest number of heat-related deaths in Europe during the summer of 2022, with an estimated 18,010 fatalities [9]. Consistently, the Italian National Climate Change Adaptation Plan identifies Milan as highly vulnerable to heatwaves, with documented increases in heat-related mortality during past extreme events, notably the 2003 heatwave [21]. The city is experiencing intense UHI effects and is among the European cities with the hottest recorded urban areas [22]. Its geographical position in the Po Valley (Pianura Padana), surrounded by the Alps, limits natural air circulation, facilitating heat retention. Using high-resolution satellite imagery and localized population estimates, this paper identifies urban areas where vulnerable populations are currently at risk as well as future projections. Previous spatial analyses in Milan have underscored the influence of urban form, surface materials, and green coverage on local thermal performance [13], emphasizing the need for more targeted strategies to protect at-risk groups.
In addition to observed heat-related impacts, future climate projections indicate a substantial increase in heatwave frequency and intensity in Milan. According to analyses available through the Copernicus Climate Data Store and regional climate assessments for the City of Milan, the number of heatwave days during summer months is projected to increase markedly under future climate scenarios (2031–2060 and 2071–2100), compared to the historical reference period (1976–2005) [23]. These projections are accompanied by a significant rise in heat-attributable mortality among individuals aged 65 and over, with outcomes varying across emission, socio-economic, and adaptation scenarios, including business-as-usual and climate adaptation pathways. This projected intensification of heat-related health risks reinforces the relevance of spatially identifying neighbourhoods where vulnerable populations are currently most exposed.
2. Materials and Methods
This study adopts a data-driven and spatially explicit methodology to assess heat-related risks in urban contexts, integrating environmental exposure, demographic sensitivity, and adaptive capacity. The approach builds upon consolidated scientific evidence that establishes previous links among Urban Heat Islands (UHIs), Nature-Based Solutions (NBSs), and demographic vulnerability in European urban contexts [9,21,22]. The methodological workflow integrates environmental and demographic datasets using open-source tools to ensure transparency, scalability, and replicability. The analysis adopts a descriptive spatial approach aimed at identifying co-occurring patterns of exposure and susceptibility, rather than testing statistical associations.
In this study, the term “risk” is used in a spatial and descriptive sense to indicate the co-occurrence of high heat exposure and demographic susceptibility, rather than in a probabilistic framework. In line with the United Nations Office for Disaster Risk Reduction (UNDRR) definitions, probabilistic climate risk assessment would require an explicit estimation of hazard likelihood and health outcome probabilities, which are beyond the scope of the present analysis. Accordingly, this work focuses on mapping spatial patterns of exposure and susceptibility to identify areas potentially vulnerable to heat-related impacts.
The process consists of four main phases: (1) exposure assessment, based on Surface UHI and Humidex as proxies of thermal stress; (2) population sensitivity, quantifying the density of vulnerable age groups; (3) lack of resilience and adaptive capacity, assessing the distribution of green infrastructure; and (4) overlay analysis, integrating exposure, vulnerability, and adaptation indicators to highlight the areas at greatest health risk in the case of Milan.
2.1. Exposure Assessment: Urban Heat and Thermal Discomfort
Thermal exposure was evaluated through analyzing Surface Urban Heat Island (SUHI) spatial patterns.
UHIs can be broadly divided into atmospheric UHIs calculated from weather station networks and Surface UHIs (SUHIs) evaluated from thermal infrared remote sensing techniques (satellite). Compared with the atmospheric UHI, the Surface UHI has the advantages of easier access, continuous coverage, and direct linkage with surface conditions, which have a direct influence on urban thermal comfort. Therefore, the Surface UHI has been extensively applied for Urban Heat Island studies [24].
For the purposes of this research, Surface UHI data were used for the hottest heatwave of the year. To determine this date, data from the meteorological observatory (OMD) and the Humidex index (HD), a reliable indicator of human thermal perception, were used [25].
The Selection of the Optimal Heatwave Observation Date
Remote sensing through satellite imagery is one of the most effective methods for Surface UHI analysis, as it provides consistent, regularly collected, and city-wide temperature measurements that cannot be obtained from ground stations alone. Landsat 8 and 9 were selected because they offer an optimal balance between spatial resolution (30 m) and temporal frequency (16 days). Unlike meteorological observations, which capture only point-based air temperature, Landsat thermal data allow detailed spatial mapping of surface heating patterns across the entire urban fabric (Land Surface Temperature). Landsat 8 and 9 imagery are widely recognized as valuable tools for mapping and analyzing Urban Heat Islands due to their free availability, global coverage, spatial resolution, and the provision of both thermal and thematic spectral bands [26].
The selection of appropriate Landsat imagery is an important step in creating UHI maps. Landsat imagery was selected from the hottest day for which high-quality, cloud-free satellite data were available during the 2024 summer heatwave period (11 July–14 August), recorded by the Milan Meteorological Observatory (Fondazione OMD). The day with the most representative surface temperature peak was 31 July 2024, acquired by the satellites at 10:03:35.9 UTC (12:03:35.9 local CEST time). This image was selected based on daily temperature profiles by Fondazione OMD and minimal cloud cover (<10%).
The synoptic conditions over Milan on 31 July 2024 were consistent with atmospheric patterns typically associated with heatwaves. Data from the Milan Meteorological Observatory indicate a mean daily air temperature of 30.6 °C and a maximum temperature of 34.7 °C, with a mean atmospheric pressure of 1015 hPa. Wind conditions were very weak, with a daily mean wind speed of 1.8 km/h and an average relative humidity of 56%. The entire Milan area also exhibited atmospheric stability, with convective available potential energy (CAPE) values that were null or very low throughout the heatwave period. These conditions favoured heat accumulation and limited atmospheric mixing, providing an appropriate synoptic background for the analysis of surface thermal exposure.
The images are processed in Google Earth Engine (GEE) through a JavaScript code to convert Landsat digital numeric data into colour-coded maps of Land Surface Temperature (LST), allowing the identification of Surface Urban Heat Islands (SUHIs) [27]. After processing the images, they are inserted as a raster file in the Quantum Geographic Information System (QGIS) 3.34 Prizren version for further analysis and overlap with the demographic data. The resulting maps and the code used for processing the data in GEE for this study were entirely created by the authors. Although it is possible to manually compute Land Surface Temperature (LST) and derive UHI maps directly in QGIS, this process is more efficient in GEE. The JavaScript code within GEE provides instant access to pre-processed Landsat 8 and 9 images, allows filtering by date and cloud cover, and performs large-scale calculations through cloud computing.
Selection of the Representative Heatwave Event Using the Humidex Index
The Humidex index is used as a tool that accounts for both temperature and humidity, providing a more appropriate measure of thermal discomfort. A previous comparative analysis of thermal indices [25] confirmed that Humidex effectively represents human thermal discomfort in humid urban areas like Milan. Unlike indices such as WBGT (Wet-Bulb Globe Temperature) or PET (Physiological Equivalent Temperature), which require additional parameters (solar radiation and wind speed), Humidex depends on air temperature and humidity only, making it a practical indicator for large-scale perceived urban heat assessments.
The Humidex was calculated to verify that the selected satellite acquisition day corresponded to conditions perceived as high heat by the human body. According to Weather Underground data, on July 31st, at the time the satellite image was acquired (between 11:50 a.m. and 12:20 p.m.), the air temperature was 32.2 °C, and the dew point 20 °C, resulting in a Humidex value of 40 °C. Two hours later, the Humidex increased to 43 °C, confirming the great discomfort perceived on that day. For comparison, across the entire heatwave period, the maximum recorded Humidex was 43.4 °C, indicating that the selected date is representative of severe heat stress conditions. Air temperature and humidity data used to compute the Humidex were obtained from a single Weather Underground meteorological station located in Milan city centre (Duomo station), which was used as a reference point to characterize the temporal severity of the heat event.
2.2. Population Sensitivity: Demographic Vulnerability
Population sensitivity was assessed through the identification and construction of the most granular demographic dataset available, with the aim of enabling a localized and detailed heat-risk assessment. From a methodological perspective, the priority was to obtain age-specific population data, particularly for vulnerable groups such as children (0–5 years) and older adults (65+ years).
To identify neighbourhoods characterized by the concurrent presence of high thermal exposure and demographic vulnerability, specific threshold values were applied to the analyzed indicators. Surface Urban Heat Island (SUHI) intensity was defined as neighbourhood-level Land Surface Temperature values exceeding 45.8 °C, corresponding to the upper range of surface temperatures observed on the selected extreme heat day. Demographic vulnerability thresholds were set at >30 elderly residents (65+) per hectare and >7 children aged 0–5 per hectare, reflecting high-density concentrations of sensitive population groups within Milan’s NILs.
The selection of the geographical unit for the analysis
In Italy, demographic information is typically provided through ISTAT census datasets. However, some municipalities offer more granular population data that allow for finer-scale analysis. In this study, the more detailed demographic dataset made available by the Municipality of Milan was selected because it includes both current population counts and projections for 2030 [28]. The analysis is based on Local Identity Units (Nuclei di Identità Locale—NIL), a detailed administrative zoning system used in Milan for demographic data collection and spatial analysis, consisting of 88 units across the city. Population counts were converted to density for each NIL, generating separate databases for children and elderly groups in both the 2020 and projected 2030 scenarios. An innovative aspect of this research is the development of a comprehensive spatial database derived from the administrative reports, which enabled the visualization, comparison, and quantification of demographic data.
2.3. Lack of Resilience and Adaptive Capacity: Green Infrastructure Distribution
Adaptive capacity was evaluated through the presence and quality of urban green infrastructure, used as a proxy for the city’s ability to mitigate heat-related health risks through shading, evapotranspiration, and cooling effects [9,21,22,23]. To capture these functions accurately, the analysis required vector-based land-use datasets capable of representing the spatial configuration and typology of urban green areas. This level of detail allows precise identification of greenery location, how extensive it is, and which types of vegetation contribute most effectively to cooling.
Selection of Green Infrastructure Data
Green infrastructure was assessed using official vector-based land use and vegetation datasets provided by the Municipality (DUSAF 2021 Land Use database). These vector layers offer detailed typological classifications, enabling the calculation of green area percentages per NIL (Local Identity Unit) with high spatial accuracy. From these categories, features with strong cooling potential, such as tree rows, urban parks, and larger vegetated areas [29] were selected to evaluate neighbourhood-level adaptive capacity. Green infrastructure was classified based on the percentage of green area coverage per NIL, using discrete classes (<10%, 10–30%, 30–40%, 40–50%, >50%) to facilitate comparison across neighbourhoods and visual interpretation of spatial patterns.
Approaches based on the Normalized Difference Vegetation Index (NDVI) were also considered in the initial stages of the research, since NDVI is one of the most widely used remote sensing indicators for estimating vegetation presence, density, and vitality. NDVI was evaluated as a potential source of green infrastructure information because it offers continuous raster coverage, is easy to compute from freely available satellite data, and allows rapid comparisons across large urban areas. However, NDVI primarily reflects vegetation health rather than physical structure or spatial configuration. In dense urban contexts with mixed land uses, building shadows, and fragmented greenery, NDVI outputs tend to be inconsistent and difficult to interpret at the neighbourhood scale. These limitations reinforced the decision to rely on vector-based land use datasets, which provide more precise and reliable information for assessing the cooling potential and functional characteristics of urban green infrastructure.
2.4. Health Risk Identification
The final phase comprises the analysis and interpretation of spatial mapping results. This phase is crucial for assessing the city’s climate risk related to heat waves. For this reason, the analysis was conducted both through the graphical overlay of thematic maps (SUHI, the density of vulnerable populations now and in 2030, and their relationship with Urban Green Space density) and through the creation of an additional database to enable numerical cross-checking and quantification of heat–health risk at the NIL level.
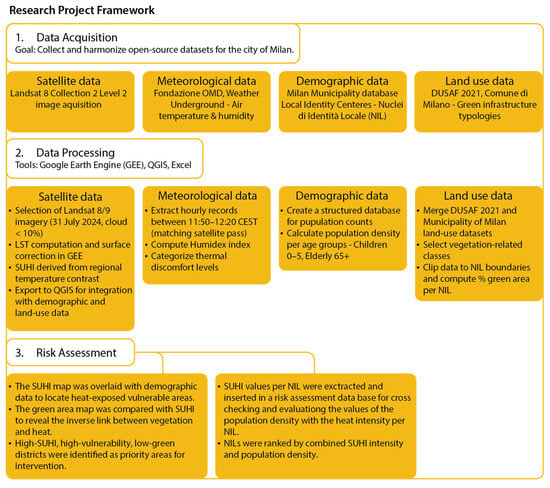
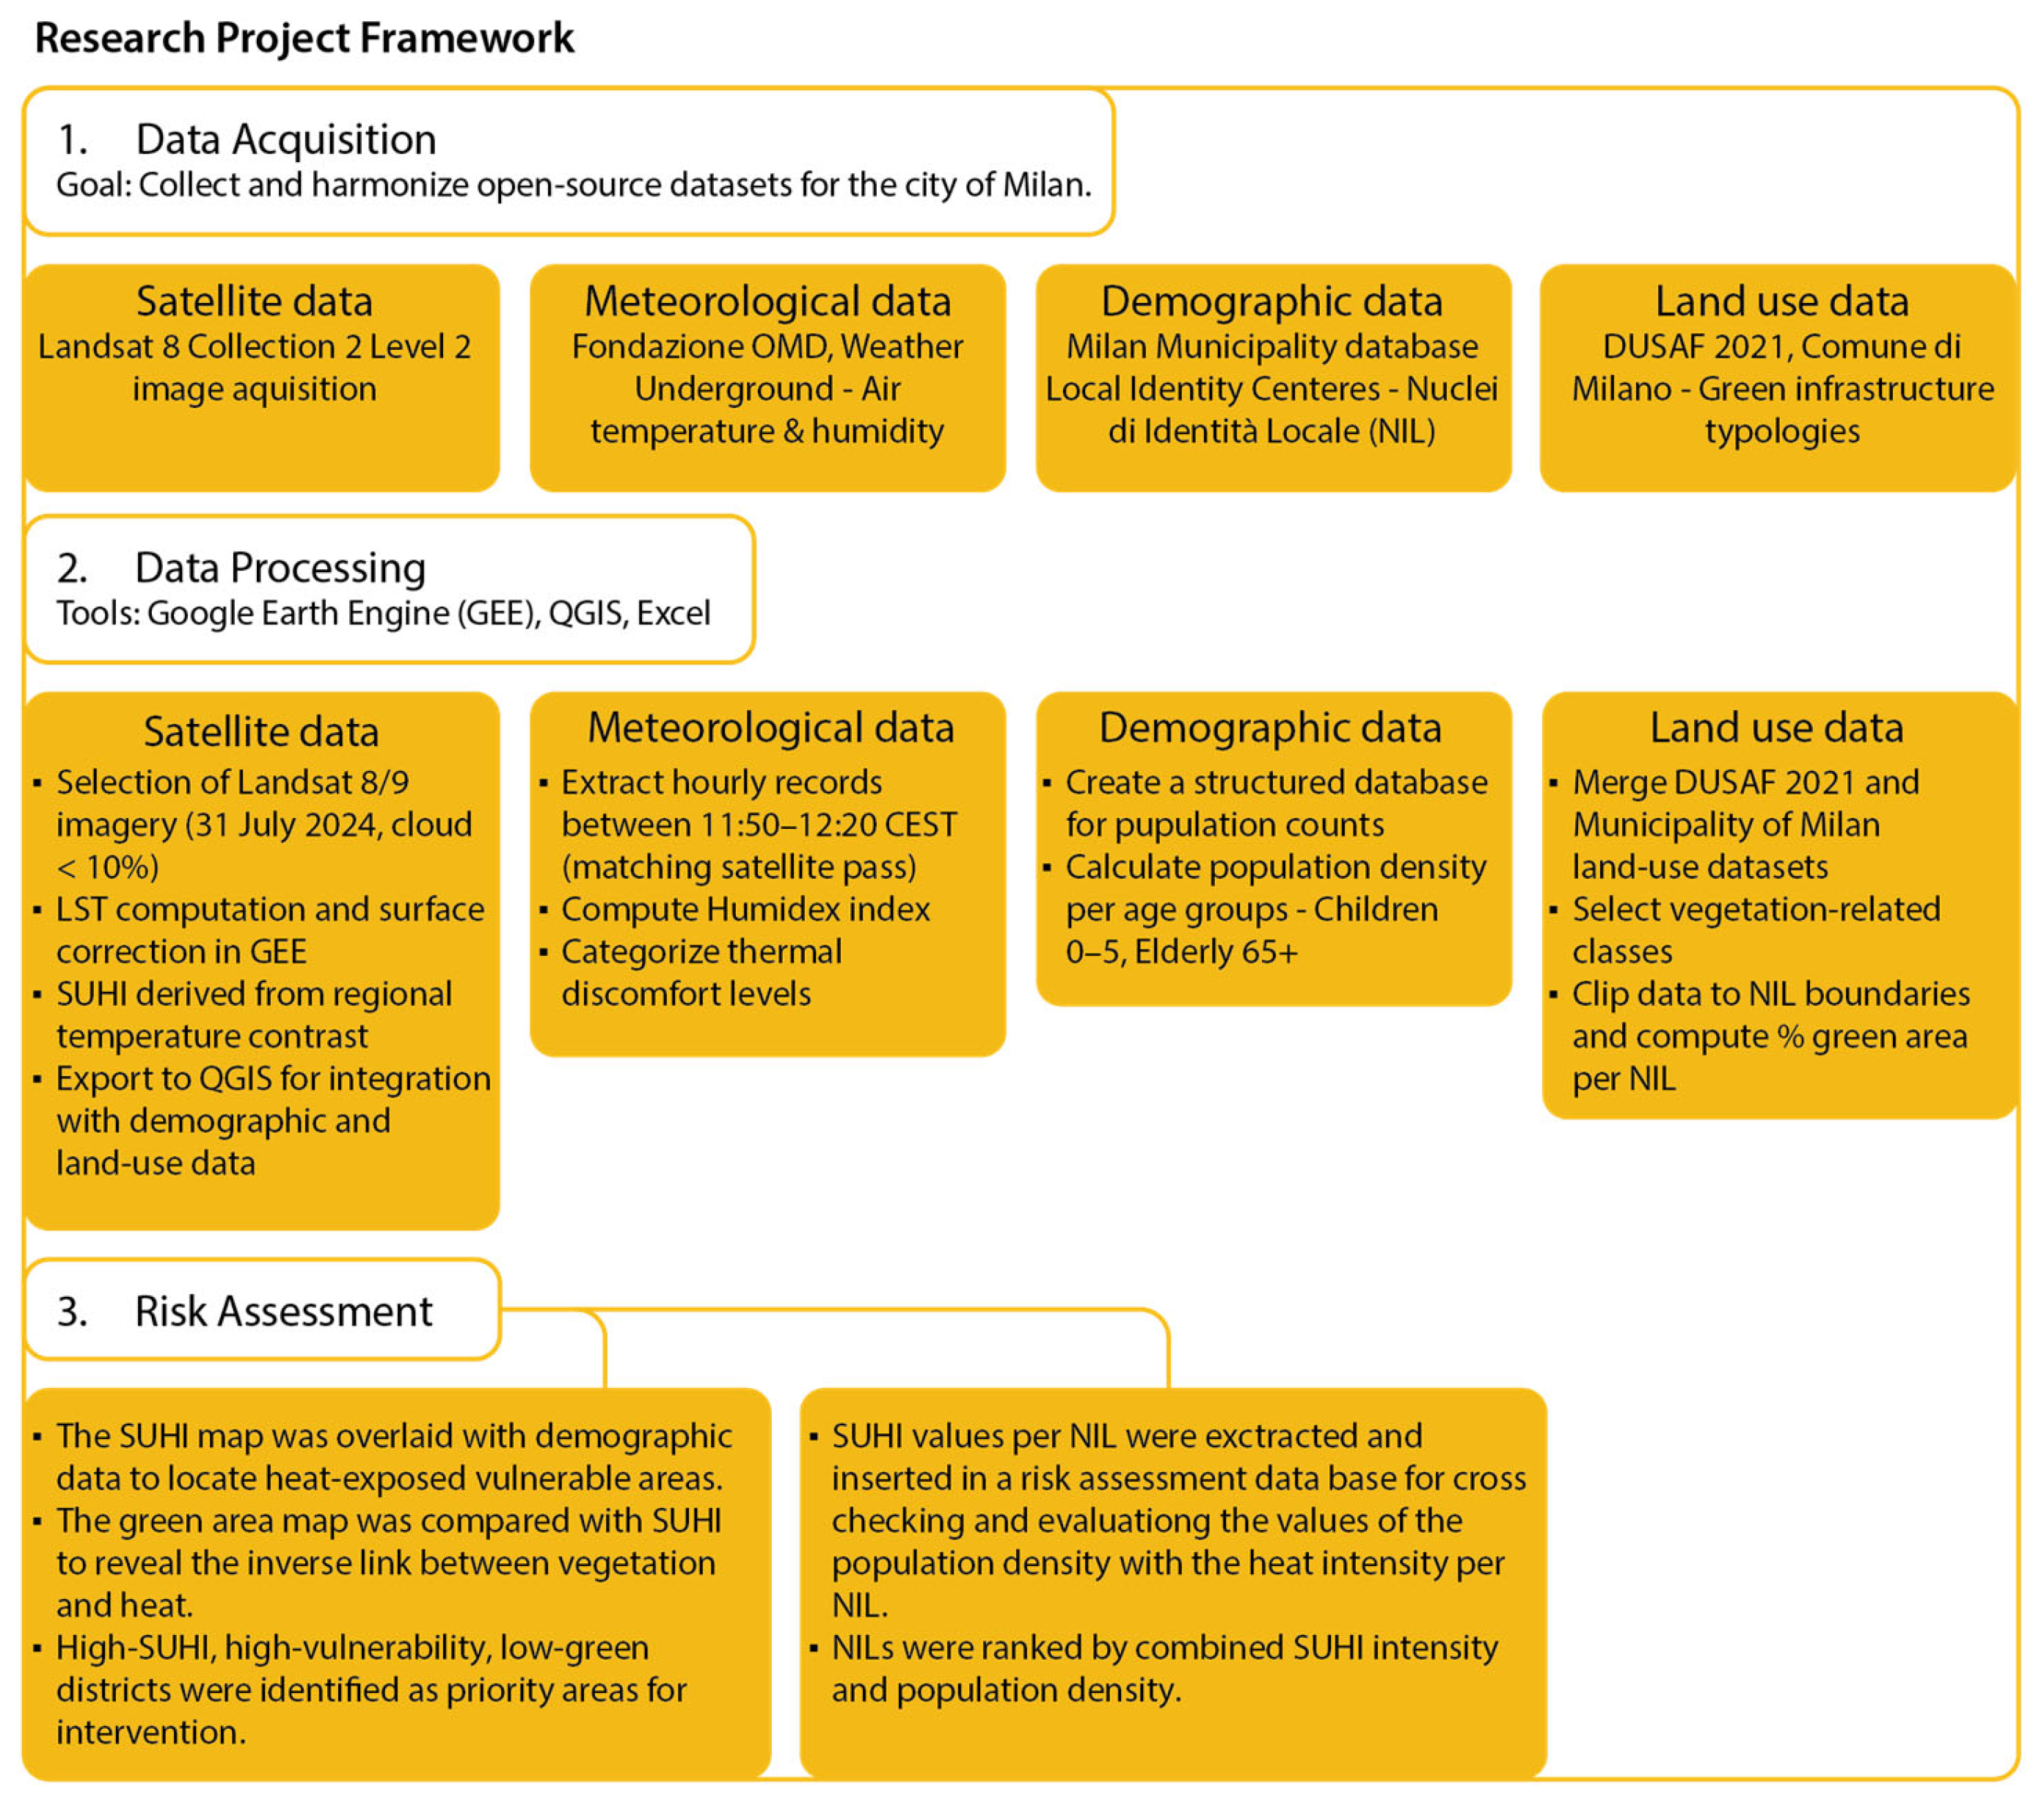
The complete framework of the methodological workflow used in this study is shown in Figure 1.
Figure 1.
Research methodology framework.
3. Results
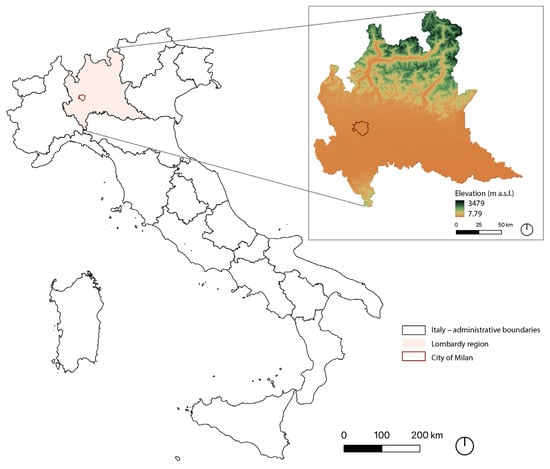
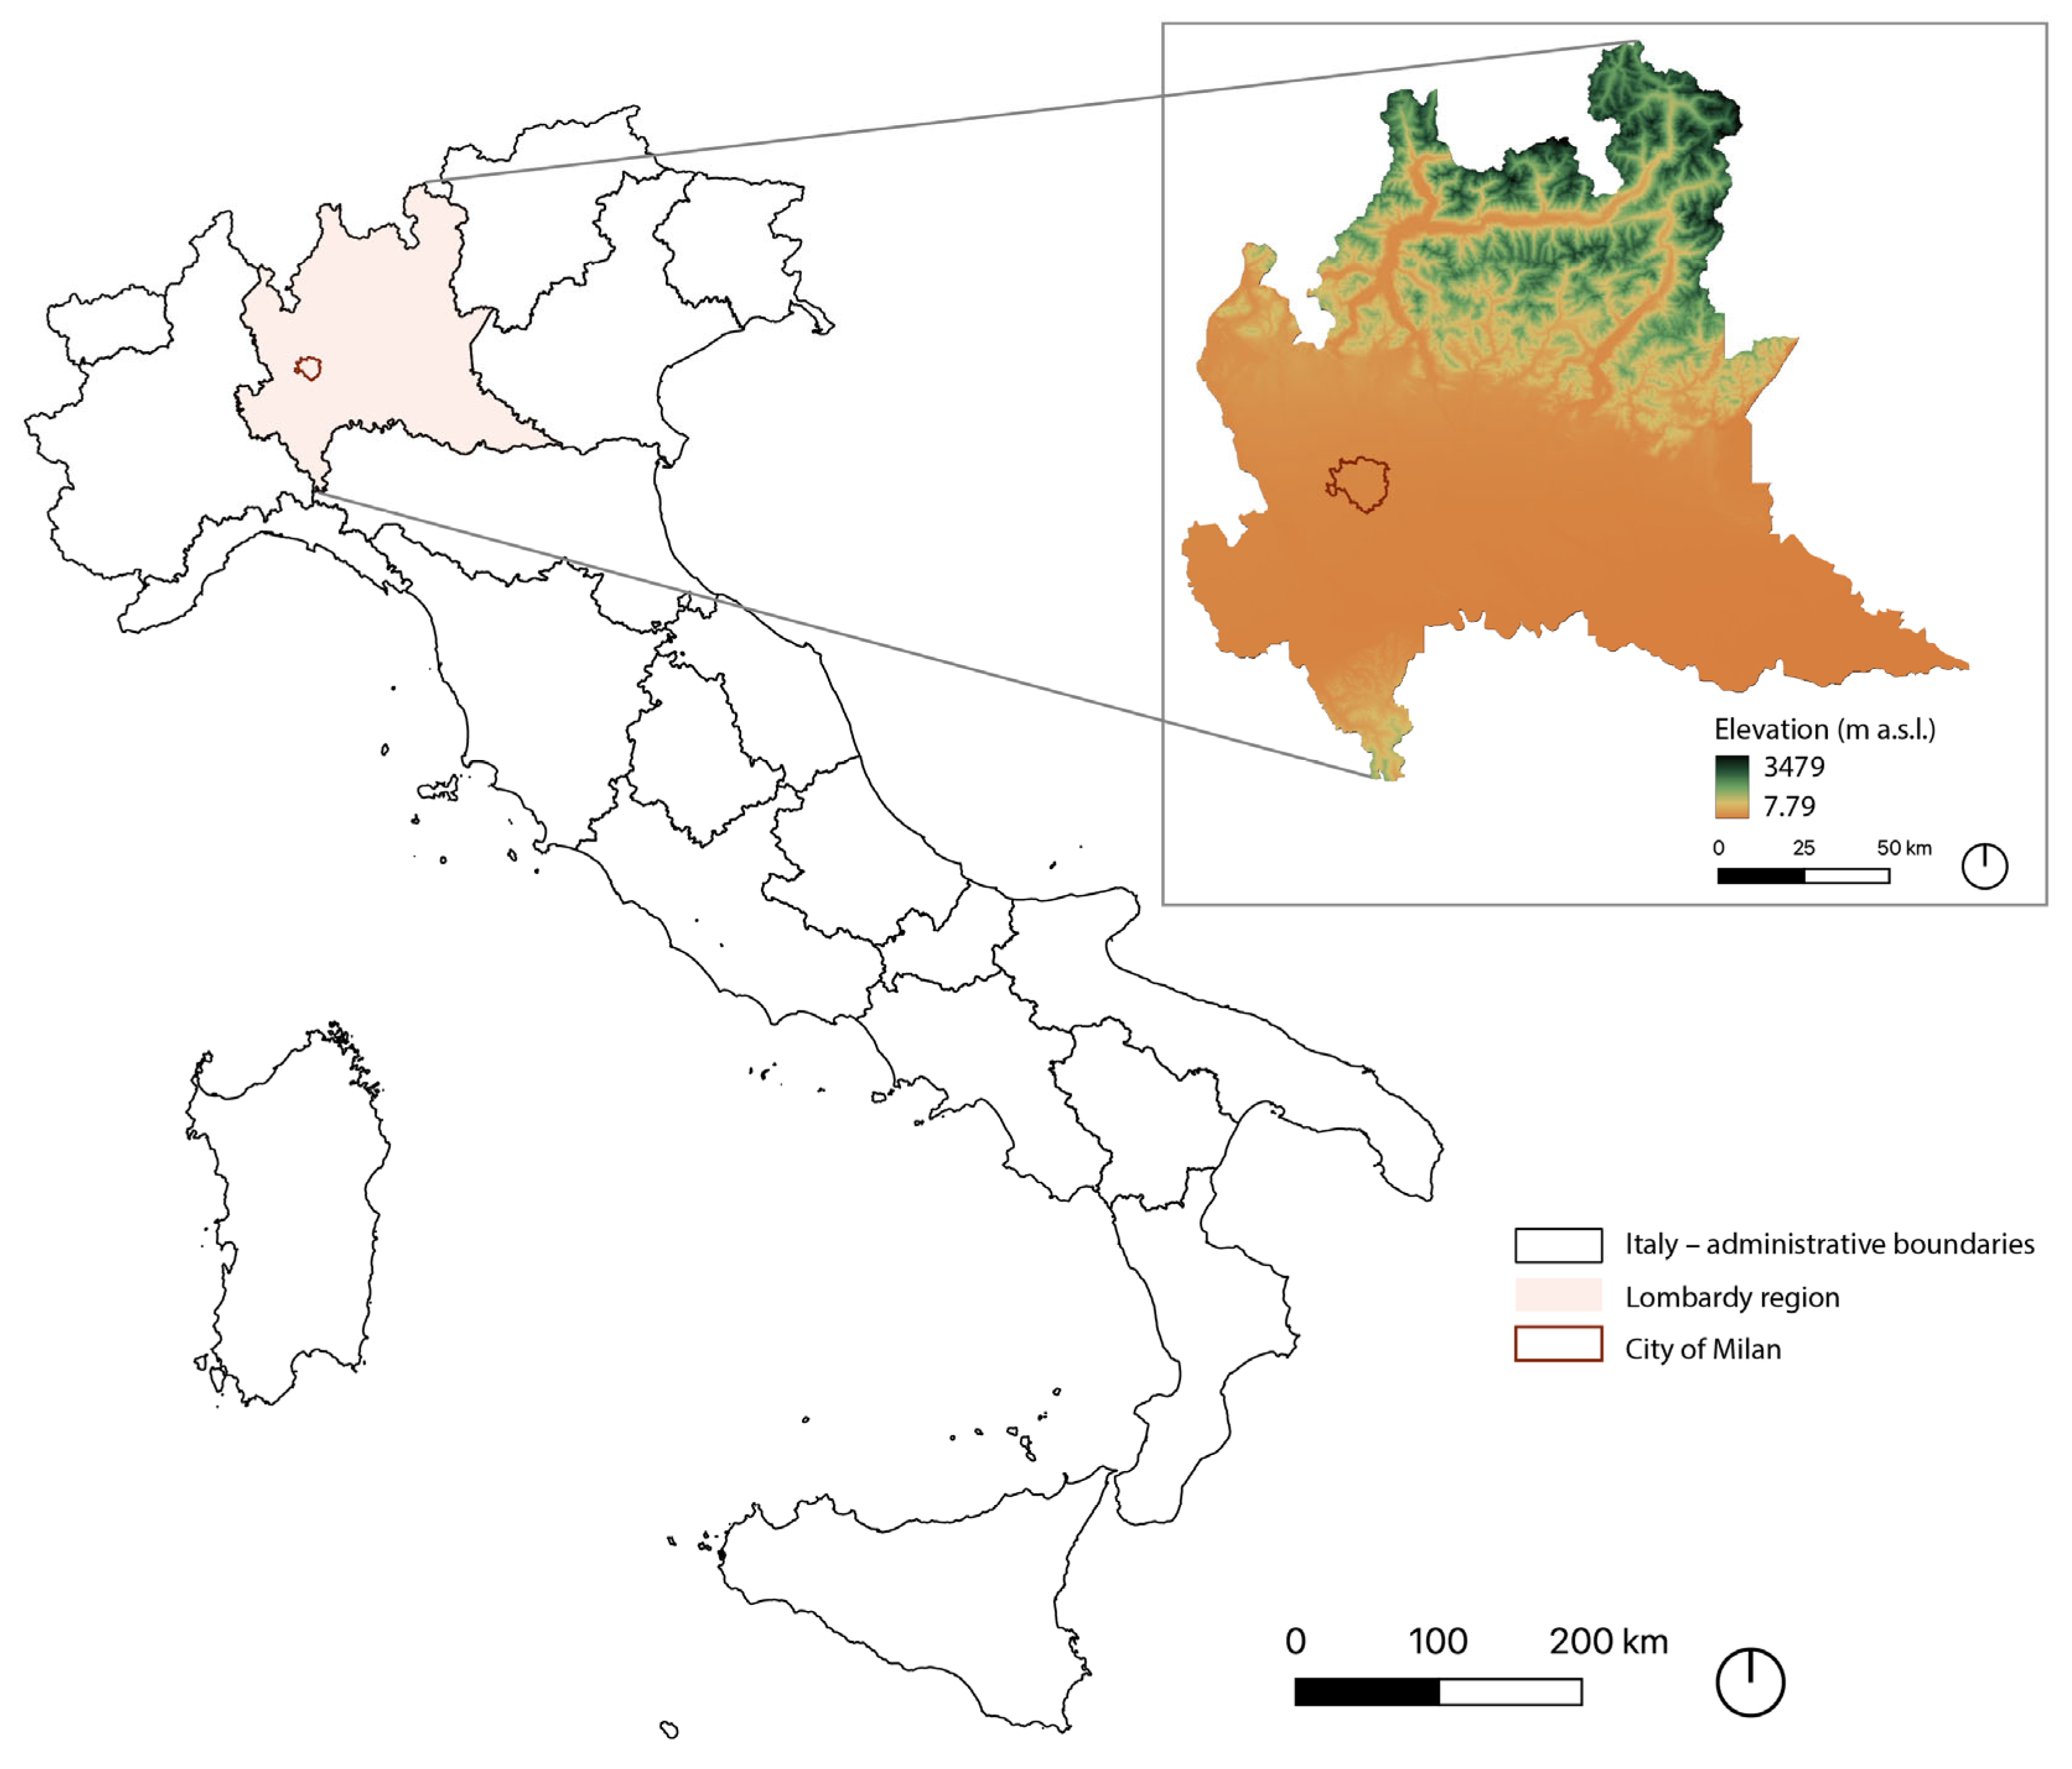
The study area is located in Northern Italy, with the city of Milan situated within the Lombardy region. Milan lies in the central area of the Po Valley, a predominantly low-lying and topographically flat area characterized by limited elevation gradients. The hypsometric representation in Figure 2 highlights the strong contrast between the surrounding Alpine relief in Northern Lombardy and the low elevations of the metropolitan area, where Milan is located at elevations close to sea level. This geomorphological setting provides important contextual background for the interpretation of surface thermal exposure patterns analyzed in the following sections.
Figure 2.
Geographic context of Milan and elevation patterns in the Lombardy region.
To correctly interpret the risk maps, created for Milan as a pilot project, it is important to understand how the values were obtained. For this research, as explained in the methodology, the granular administrative division of Milan into 88 Local Identity Units (NILs) was used to assess both the density of vulnerable populations (children and elderly) and the Surface Urban Heat Island (SUHI) intensity during the 2024 heatwave.
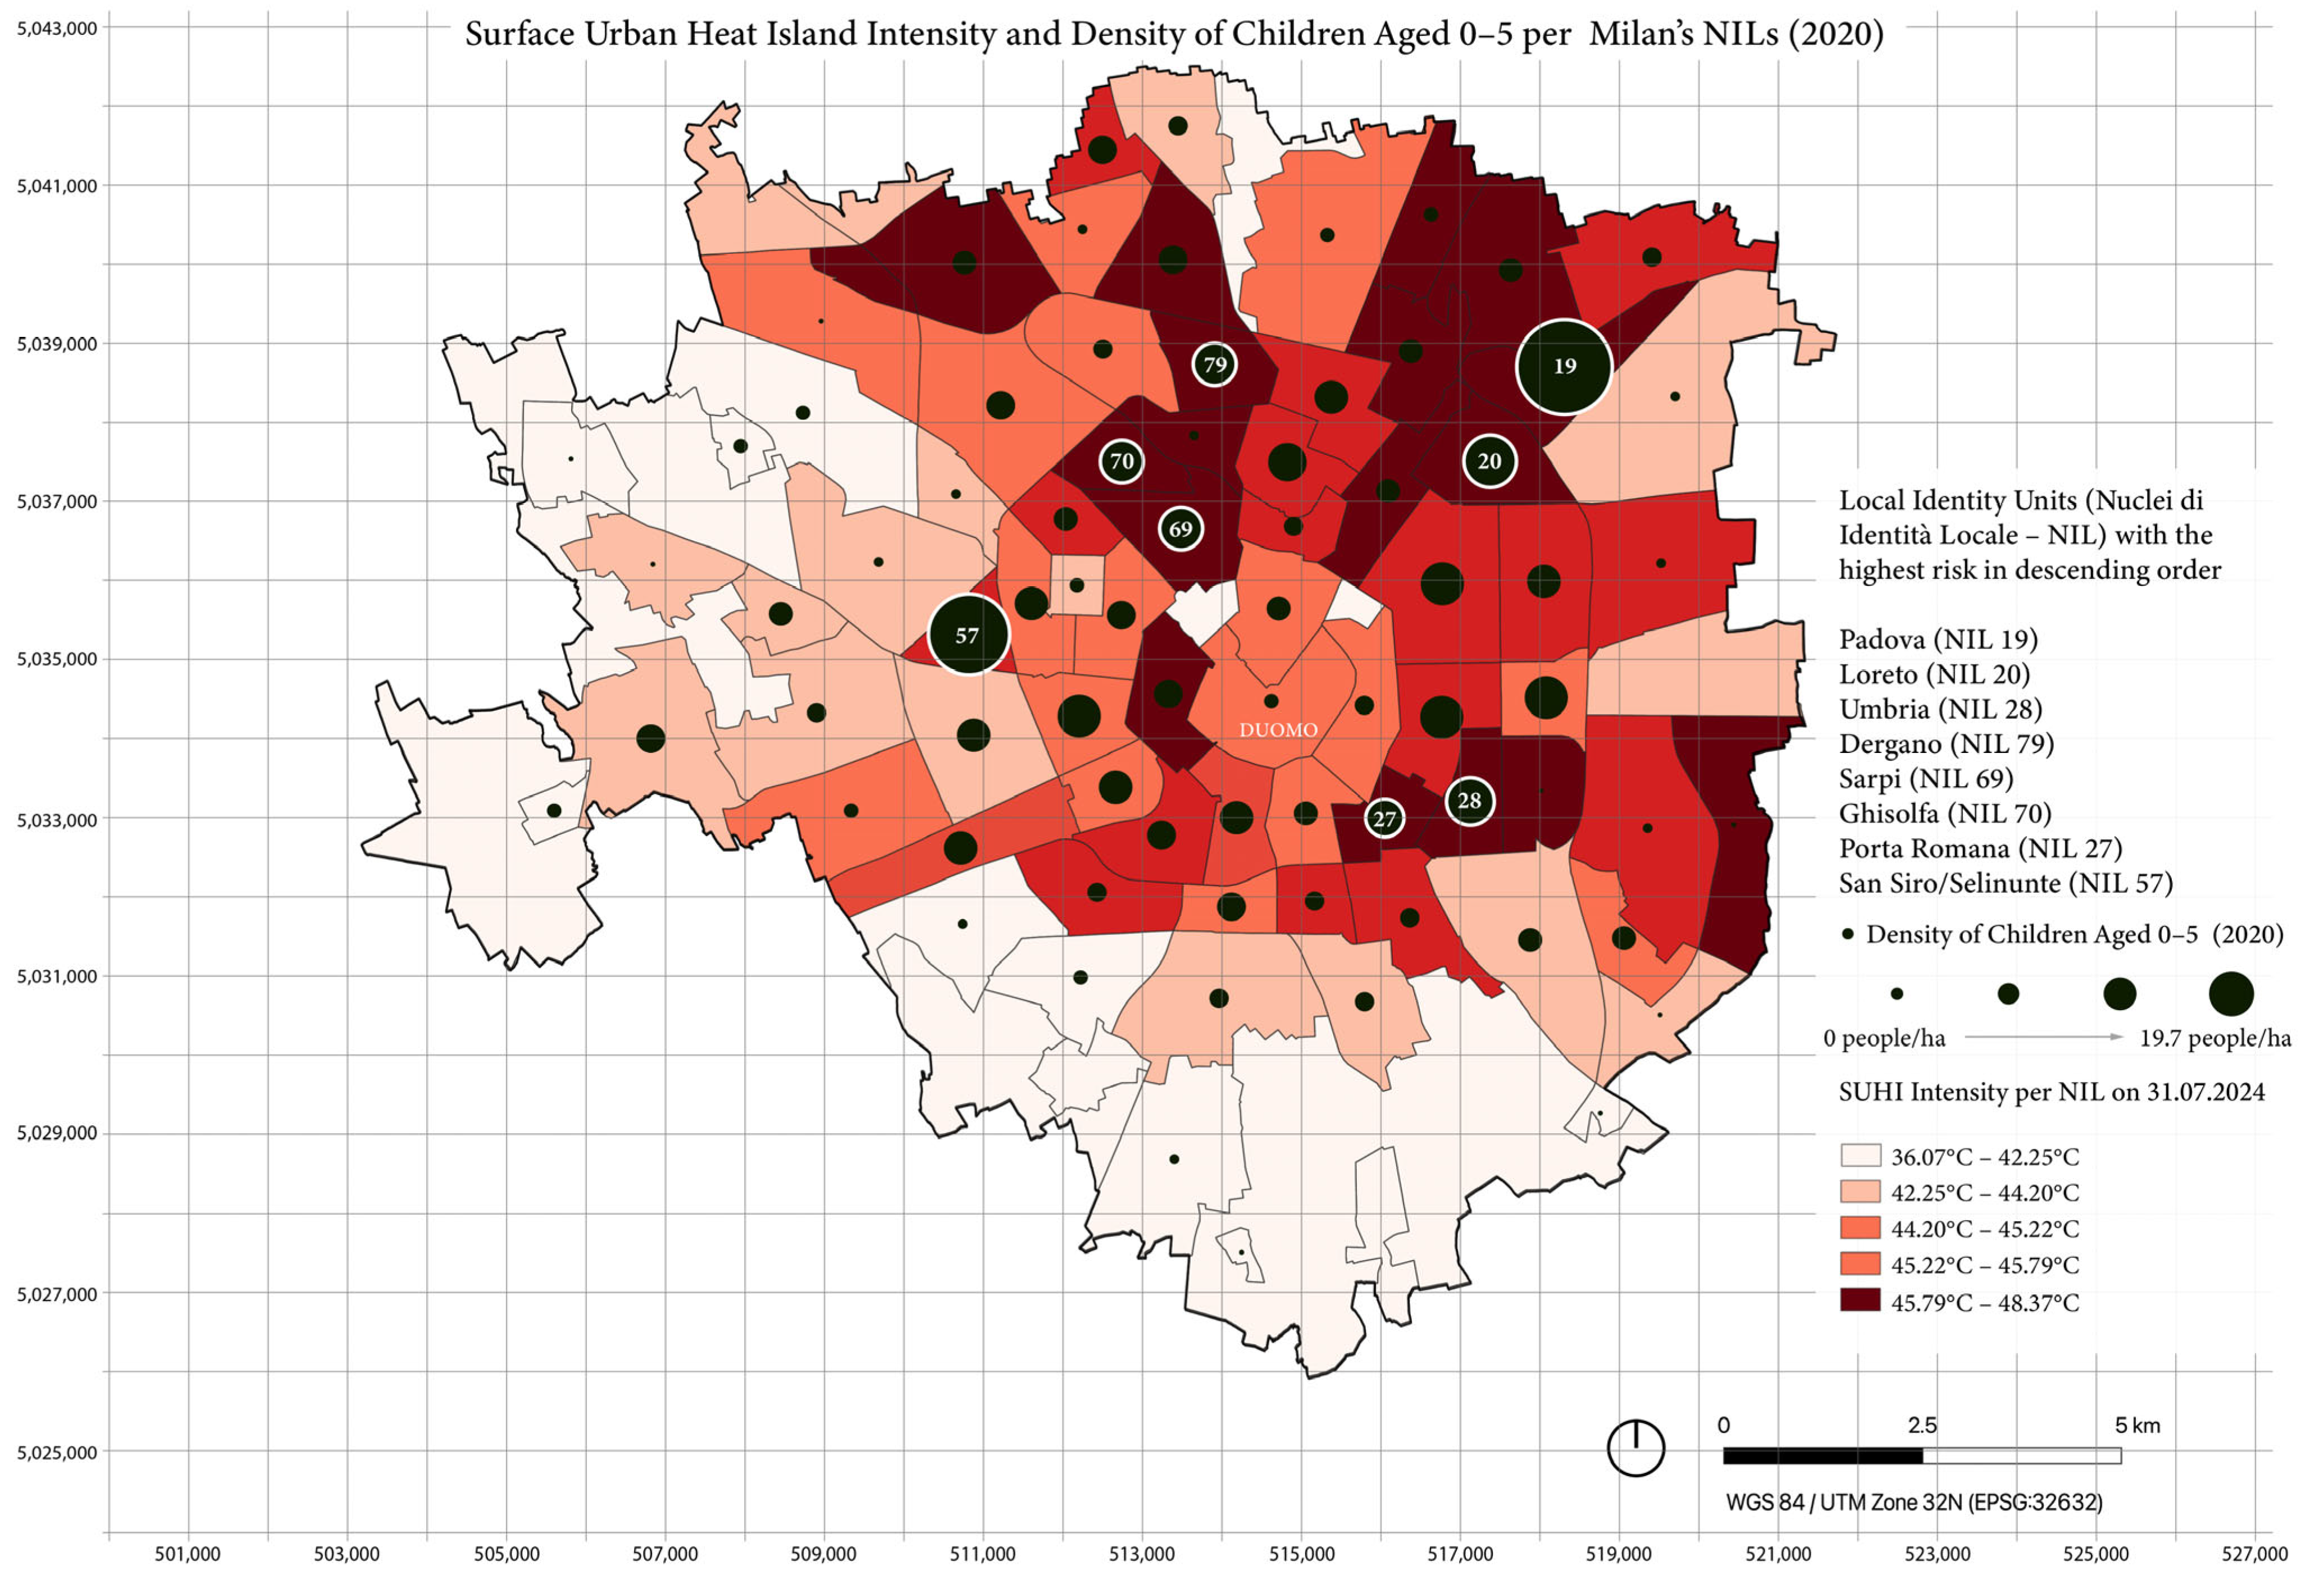
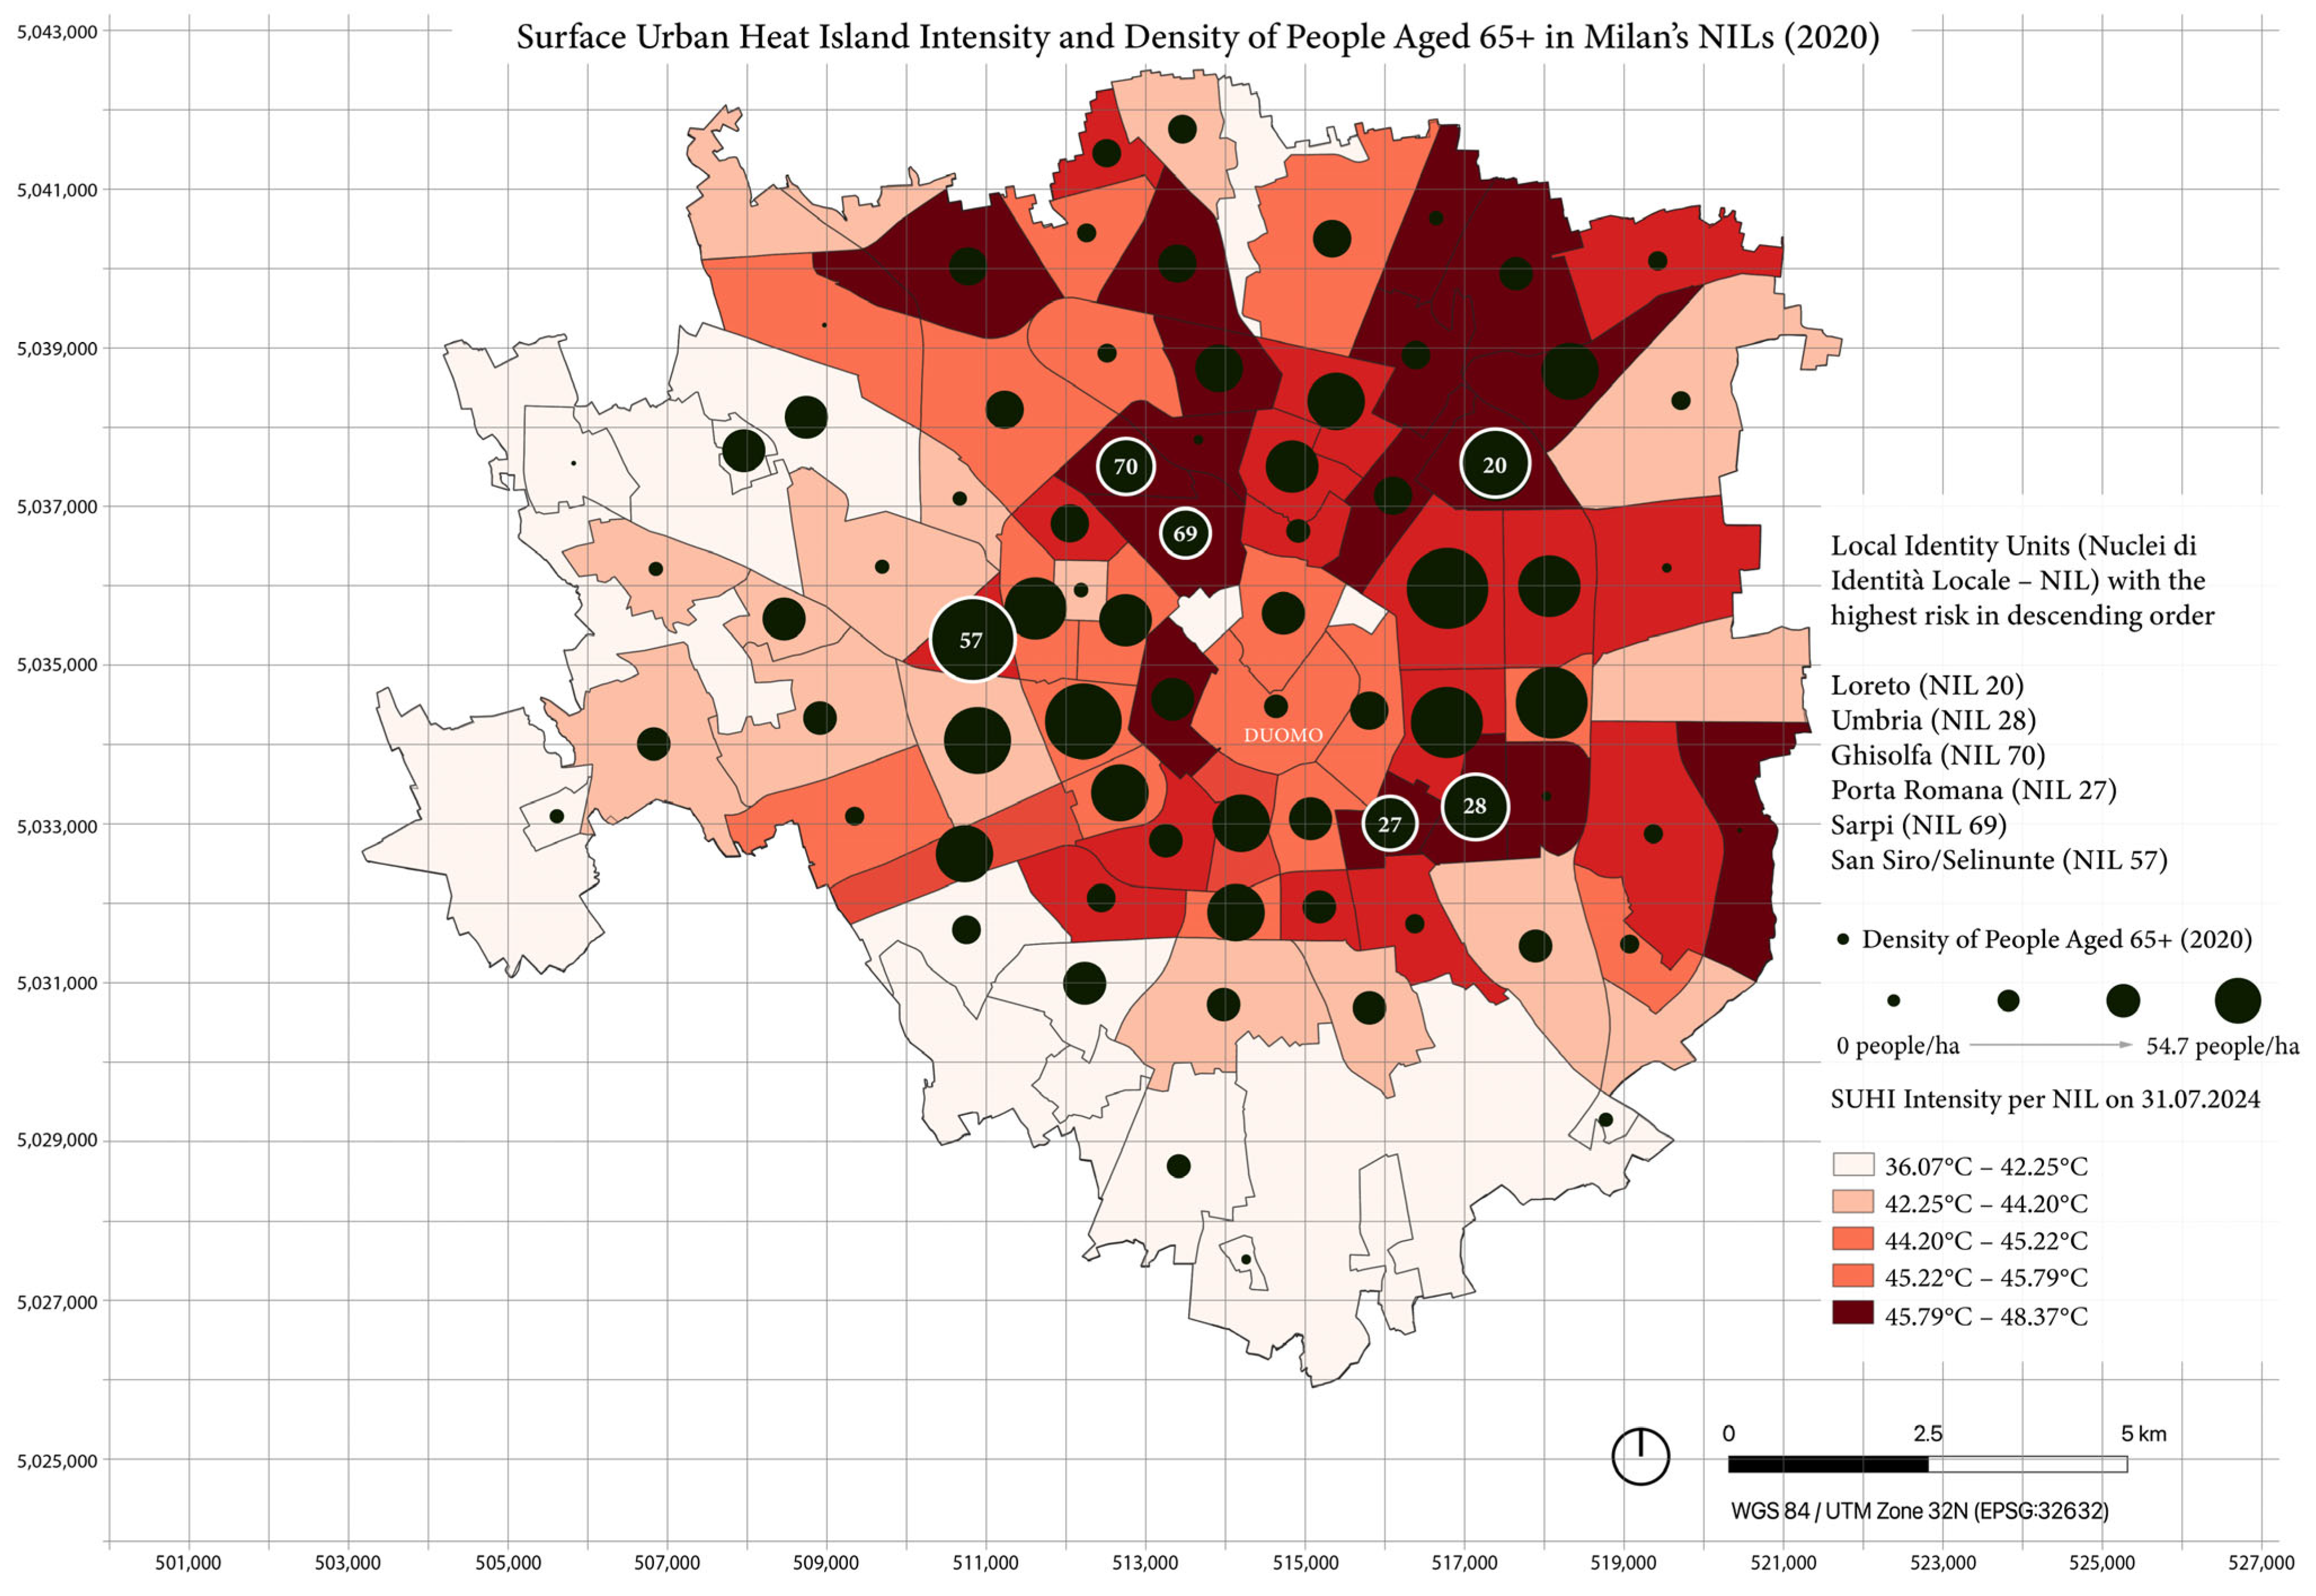
Land Surface Temperature (LST) data were derived from Landsat 8 imagery acquired on 31 July 2024, the hottest day with minimal cloud cover. The thermal maps were processed in Google Earth Engine (GEE), which calculated an average LST of 33.96 °C for Lombardy and 40.8 °C for Milan, revealing a +6.85 °C difference that confirms Milan’s heat island effect. Finally, to compare neighbourhoods, SUHI values were computed for each NIL and rescaled to °C using the LST standard deviation of 5.14 °C obtained in GEE. The city-wide mean LST (40.8 °C) served as the baseline. As shown in Figure 3, Figure 4 and Figure 5, NIL-level LST values range from 36.07 °C to 48.37 °C, meaning the coolest NIL is 4.73 °C and below, and the hottest is 7.57 °C and above the city’s average.
Figure 3.
Surface Urban Heat Island average intensity and density of children aged 0–5 recorded in 2020 per NIL.
Figure 4.
Surface Urban Heat Island average intensity and density of population aged 65+ recorded in 2020 per NIL.
Figure 5.
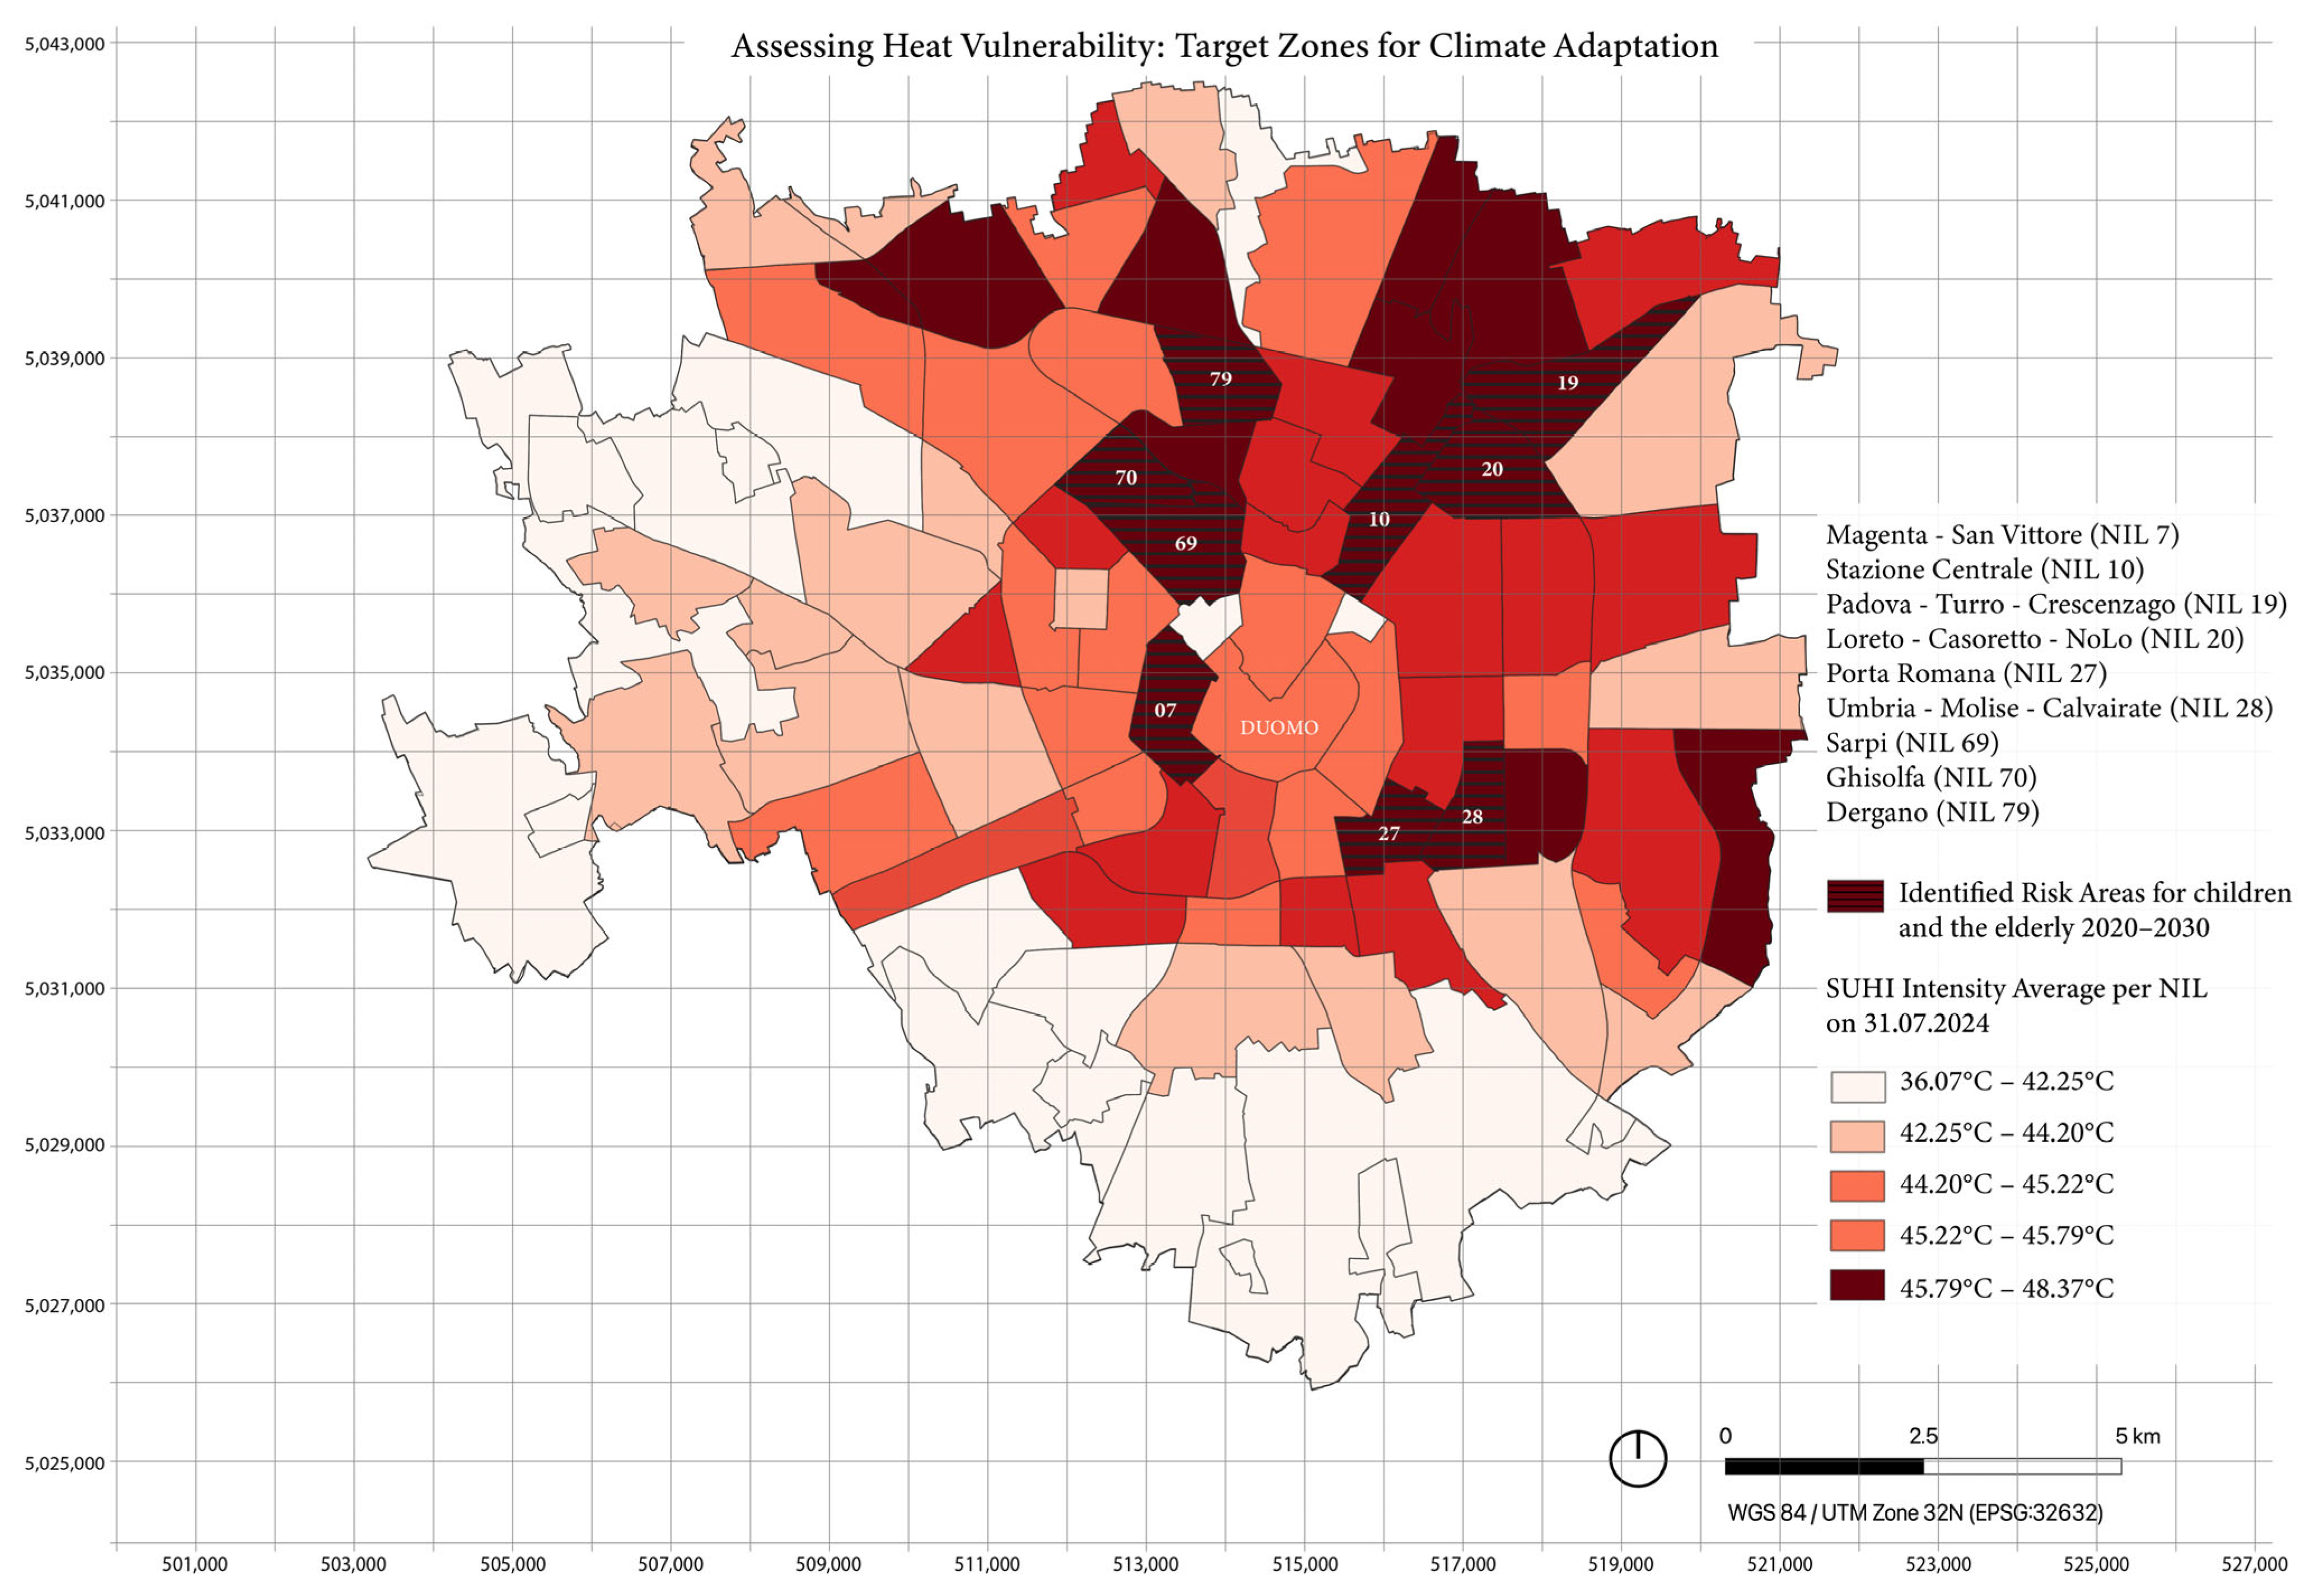
Identified heat risk areas for children and the elderly in 2020 and 2030 by overlapping demographic and SUHI data.
To quantify and compare the exposure of vulnerable groups, the residential density for each group was calculated for every NIL in the city of Milan. Consequently, an Excel database was created compiling the population densities of children (0–5 years) and elderly (65+) within each NIL for the years 2020 and 2030 (projected data). This database enabled a numerical comparison between demographic data and SUHI intensity values, identifying where high population densities coincide with elevated heat levels.
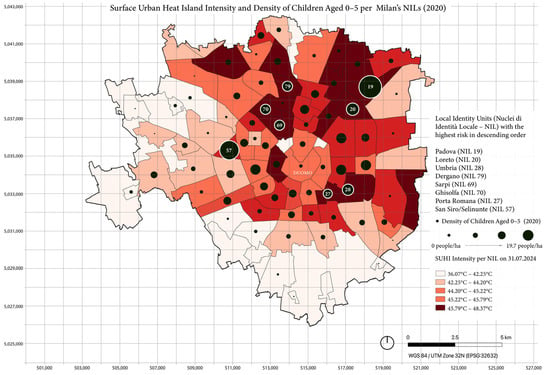
In Figure 3, the SUHI intensity across Milan’s NIL districts data is overlaid with dark circles representing the density of children aged 0–5 years (2020), with graduated symbols indicating higher density. The map highlights Padova as the most critical NIL, where both the SUHI intensity and the density of young children are particularly high (46.5 °C and 19.5 children/ha). In descending order of risk, the other neighbourhoods with the highest levels of SUHI (dark red), where the density of children is greatest are Loreto (NIL 20; 46.3 °C; 10.9 children/ha), Umbria (NIL 28; 45.8 °C; 10 children/ha), Dergano (NIL 79; 47.3 °C; 9 children/ha), Sarpi (NIL 69; 46.3 °C; 8.9 children/ha), Ghisolfa (NIL 70; 45.8 °C; 8.6 children/ha), and Porta Romana (NIL 27; 46 °C; 7.8 children/ha).
In addition to the NILs mentioned, it is important to highlight that San Siro/Selinunte (NIL 57; 45.3 °C; 16.7 children/ha) is also critical; it is the second-largest NIL for child-related density and has a medium–high SUHI risk (red). More broadly, several neighbourhoods with higher proportions of young children are located within areas registering the most intense surface temperatures, underscoring unequal exposure to heat stress among vulnerable populations.
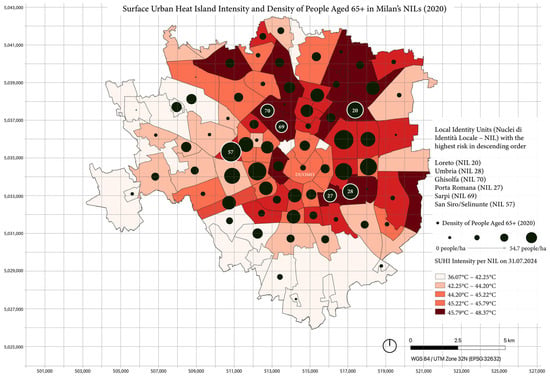
Figure 4 illustrates the spatial distribution of residents aged 65 and over, overlaid with SUHI intensity values for each NIL. The analysis highlights several districts with critical heat–vulnerability conditions, including Loreto (NIL 20; 46.3 °C; 44.8 people/ha), Umbria (NIL 28; 45.8 °C; 43.2 people/ha), Ghisolfa (NIL 70; 45.8 °C; 36 people/ha), Porta Romana (NIL 27; 46 °C; 35 people/ha), and Sarpi (NIL 69; 46.3 °C;34 people/ha). Compared with the map of children aged 0–5, the elderly population is more extensively distributed across Milan, exhibiting higher overall densities. The maximum density of the elderly population reaches approximately 54.7 people per hectare in San Siro/Selinunte (NIL 57; 45.3 °C; 54.8 people/ha), exceeding the children’s peak of 19 people per hectare (Padova, NIL 19). This reflects a broader urban demographic trend in which ageing populations are both increasing in size and becoming more spatially concentrated within cities.
The overlap analysis conducted within the Excel database identified NILs simultaneously exceeding SUHI values of 45.8 °C, elderly population densities above 30 people/ha, and child-related densities above 7 people/ha, as shown in Table 1. This intersection highlights some areas where thermal exposure and demographic vulnerability coincide most critically. The NILs of Loreto (NIL 20), Umbria (NIL 28), Padova (NIL 19), Ghisolfa (NIL 70), Sarpi (NIL 69), and Porta Romana (NIL 27) consistently meet these thresholds in both 2020 and 2030 projections, confirming a persistent connection between climate risk and social vulnerability. Overall, 5941 children and 18,406 elderly residents were at risk in 2020, increasing to 6512 children and 28,761 elderly residents projected for 2030, indicating a significant rise in heat-related health vulnerability among Milan’s population. Besides facing high heat exposure, these areas also house populations that are less resilient to extreme heat, making them crucial locations for targeted interventions.
Table 1.
Overlap between Surface Urban Heat Island intensity (>45.8 °C) and population density thresholds for vulnerable groups in Milan’s NILs.
As can be seen from Table 1, for the 2030 projections, the distribution of risk remains largely consistent with 2020 patterns for children, indicating that heat exposure will continue to affect the same high-density NILs. For the elderly population, however, the number of high-risk areas increases, with Padova (NIL19), Dergano (NIL 79), and Magenta (NIL 7) emerging as new critical zones due to projected demographic growth.
Figure 5 spatially identifies that heat-risk areas for children and the elderly identified from the database overlap the highest density of vulnerable population age groups in 2020 and in 2030 projections and peak SUHI intensity.
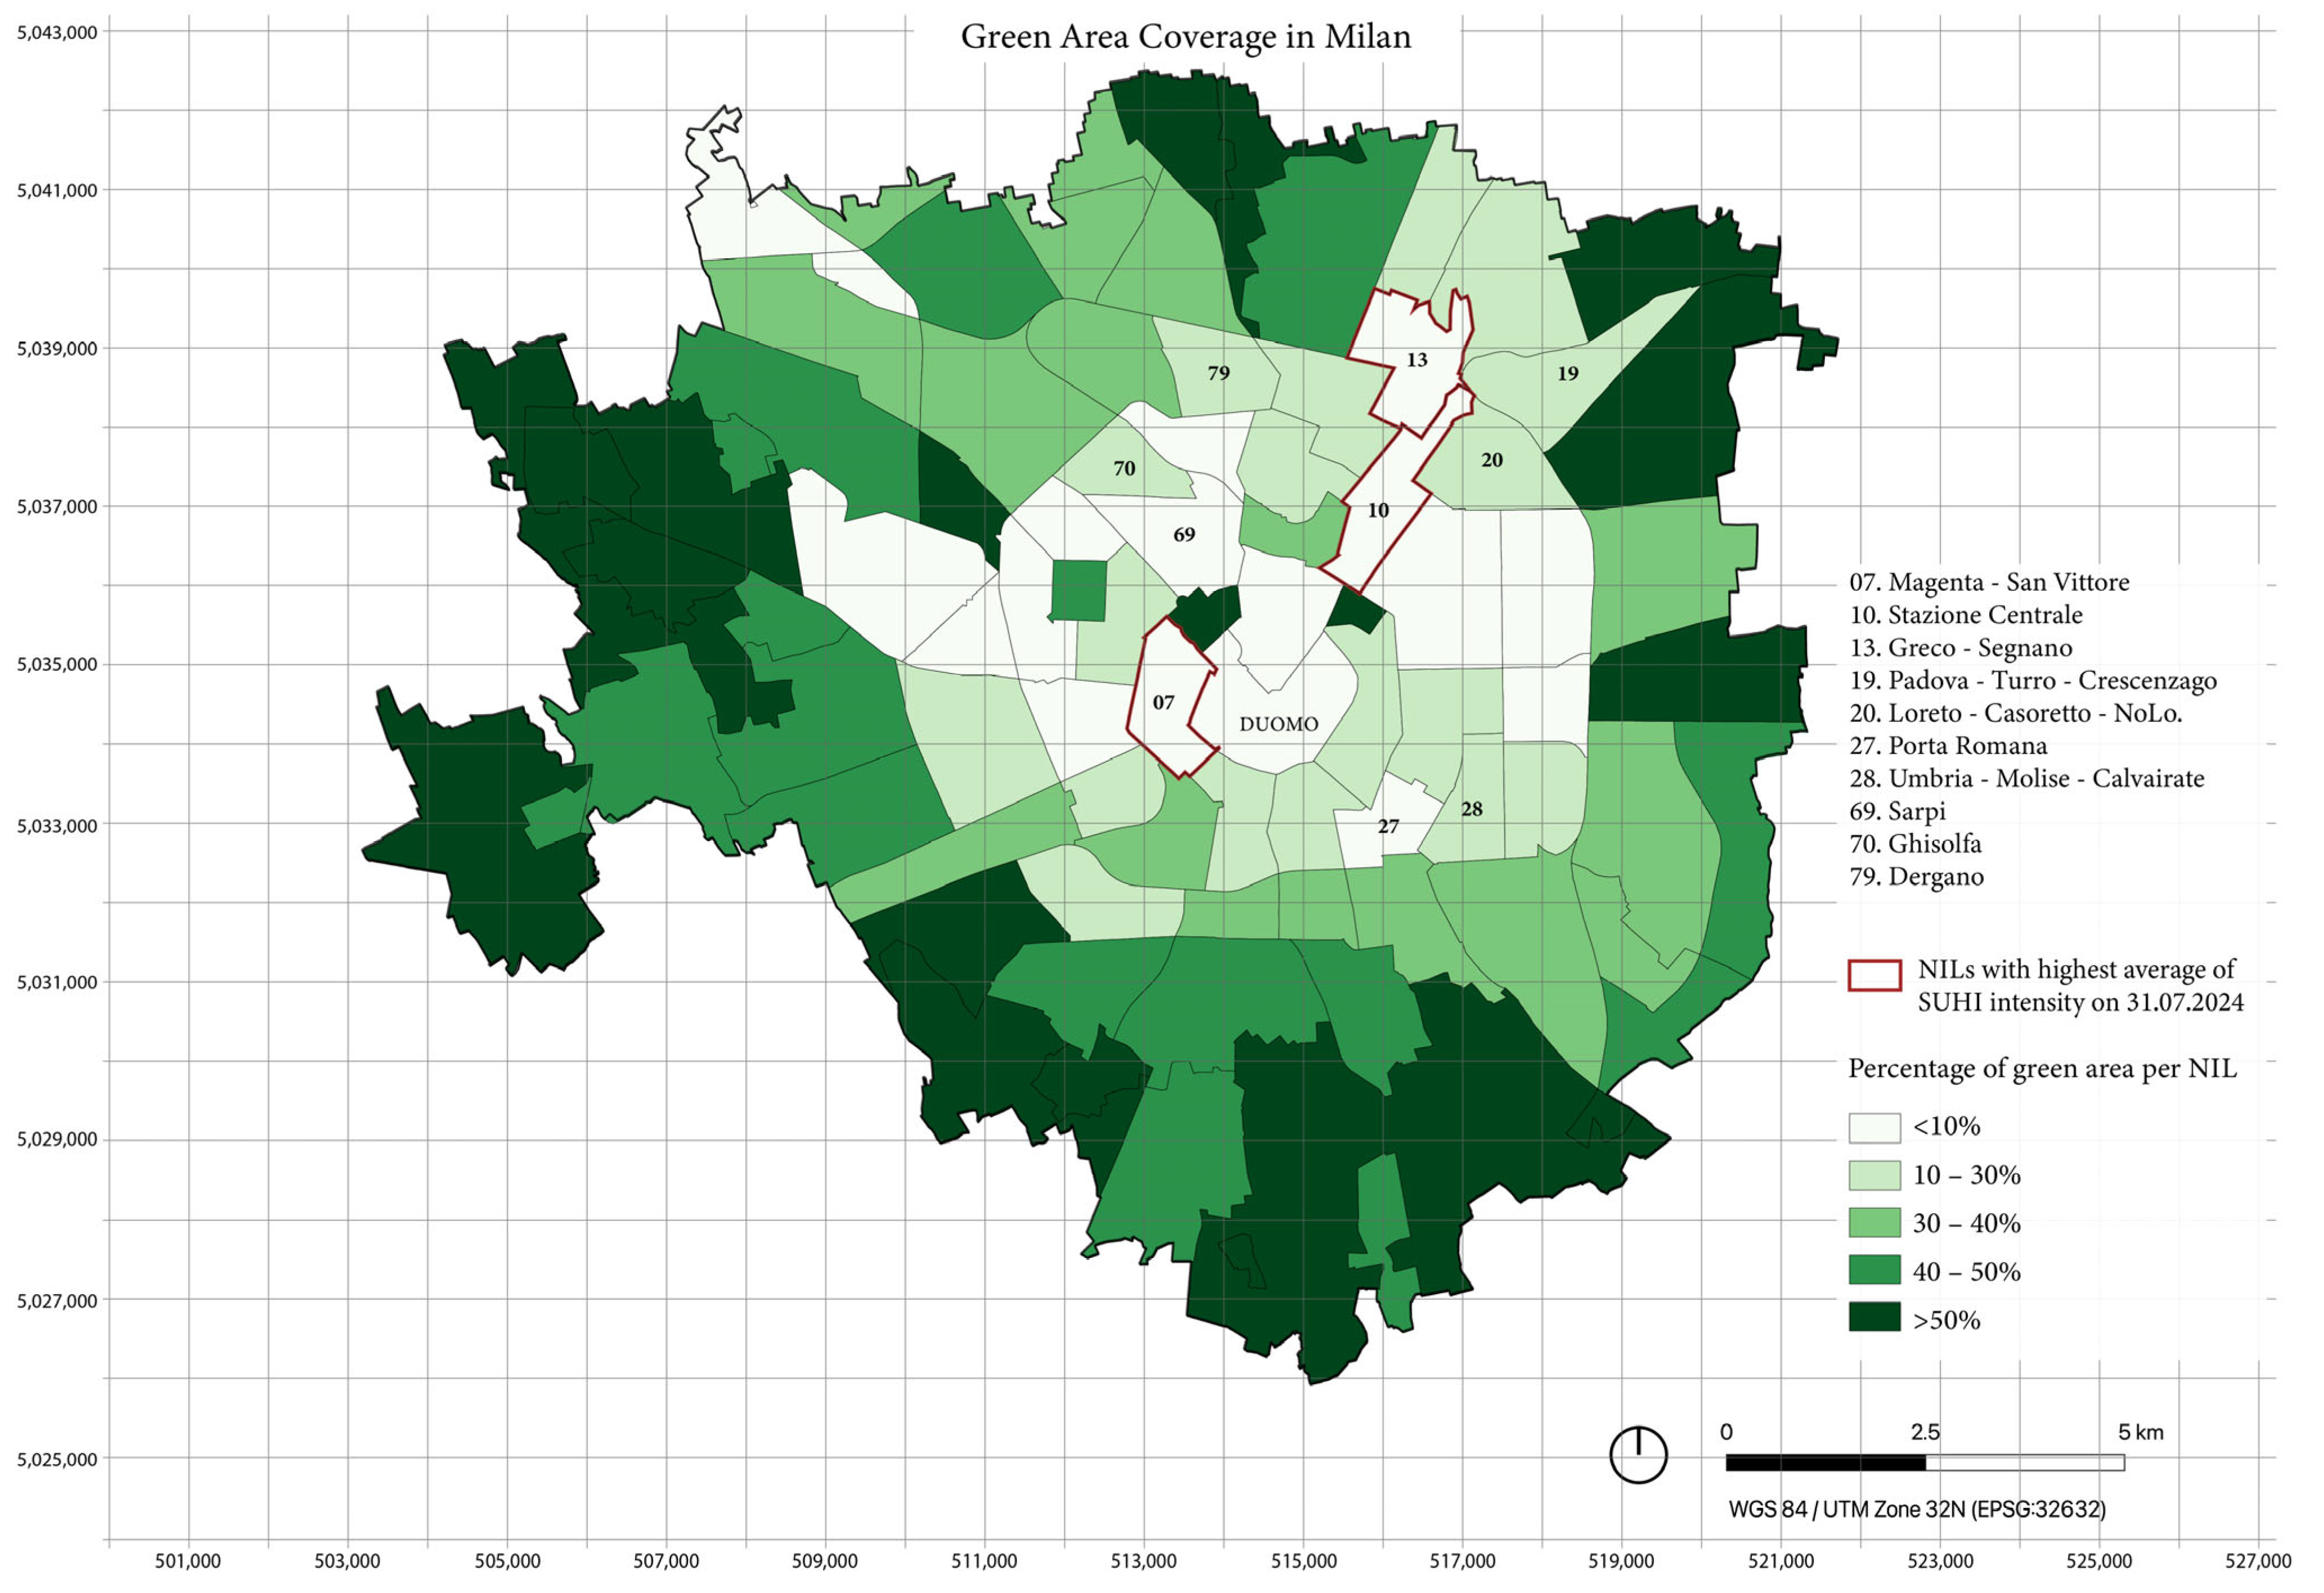
Another crucial aspect to highlight is that the hottest NILs are in the northern and eastern parts of the city, while the NILs in the southern and western sides, closer to Parco Agricolo Sud Milan (South Agricultural Park), are less critical neighbourhoods, highlighting the potential effect of green intervention for heat mitigation. Particularly, the hottest area in Milan is Magenta (NIL 7), followed by Centrale (NIL 10) and Greco (NIL 13), all of which are characterized by a dense urban fabric with limited green pockets and parks.
Finally, Figure 6 illustrates the distribution of green areas per NIL and their correlation with heat vulnerability. An inverse relationship emerges between SUHI intensity and green area density, confirming the crucial role of vegetation in urban cooling. The NILs with the highest concentrations of vulnerable populations consistently coincide with those lacking green infrastructure, indicating that residents in these areas experience greater and unequal exposure to thermal stress.
Figure 6.
Percentage of green areas per NIL.
This condition has direct health and social implications. Having limited access to shaded or cooler public spaces increases the risk of heat-related morbidity and preventable mortality, particularly among the elderly and young children. In addition to their climatic functions, green spaces provide multiple further health benefits, including physical, mental, and social well-being, representing a fundamental proximity service that should be accessible to all residents [8]. These findings underscore the need to prioritize Nature-Based Interventions in the most exposed districts, both to reduce thermal discomfort and promote equitable access to climate-resilient and health-promoting environments.
4. Discussion
The spatial analysis performed offers a comprehensive understanding of Surface Urban Heat Island (SUHI) intensity in Milan and its relationship with demographic vulnerability and distribution of green infrastructure. Map rendering makes urban analyses effective and easily understandable for both policymakers and interested individual users. The geolocation of data and the visualization of analyses at the NIL (neighbourhood) level make it possible to easily identify the districts most at risk during heat waves and those where greening interventions would be most appropriate.
The methodology adopts a population-centred perspective, concentrating on vulnerable age groups, namely children (0–5 years) and the elderly (65+), who are physiologically more sensitive to extreme temperatures. The novelty of this work, therefore, lies in its integration of demographic vulnerability with environmental exposure, creating a database that can be used in a GIS derived from the Municipality of Milan’s administrative reports of current and future demographic projections. This approach enables a replicable, quantitative, and comparative analysis of population risk, transforming static data into a spatially explicit tool for anticipating health impacts and guiding preventive adaptation strategies for the most exposed age groups.
These findings reinforce the existing literature, which found that spatial mismatches between ecosystem services and vulnerable populations can exacerbate heat-related inequalities in urban areas [18,22,23,25]. Additionally, the spatial pattern of green space coverage exhibits a clear inverse association with SUHI intensity, indicating that areas with higher vegetation presence tend to correspond to lower surface temperatures. While this relationship supports the importance of natural elements in urban thermal environments through processes such as shading and evapotranspiration [27,28], these mechanisms are not directly observed in the present dataset and are, therefore, interpreted as contextual explanations rather than causal evidence. The data that emerged are also consistent with other research related to SUHI in Milan, such as that conducted on heat exposure and cardiovascular or respiratory health outcomes [30,31,32].
Analyzing the results relating to the elderly, several NILs with a high density (over 30 people per hectare) consistently emerge in both 2020 and 2030. These include Loreto, Umbria, Ghisolfa, Porta Romana, and Sarpi, which should be priority areas for heat mitigation strategies over the next decade. Additionally, Padova (NIL19), Dergano (NIL 79), and Magenta (NIL 7) are projected to emerge as new high-density areas of elderly inhabitants by 2030, signifying an expansion of ageing populations into different neighbourhoods. The persistence of certain NILs across the 10-year difference suggests that these areas will continue to have substantial ageing residents, emphasizing their long-term vulnerability to extreme heat events.
Older populations are more vulnerable to extreme heat because of reduced thermoregulation, pre-existing health conditions, and social isolation. As emphasized in the introduction [3], exposure to urban heat disproportionately affects elderly residents. In the case of Barcelona, during summer, 54% of older adults use green spaces as the primary means for cooling. Hence, Milan’s NILs with high elderly population densities should be prioritized for SUHI adaptation measures such as expanding urban greening and higher tree canopy coverage in pedestrian zones, increasing shaded public spaces, and cooling centres.
The NILs with the highest density of children, namely those over 19.7 children per hectare, remain relatively stable, with almost all appearing in both 2020 and 2030 projections. Padova (NIL 19), Loreto (NIL 20), Umbria (NIL 28), Dergano (NIL 79), Sarpi (NIL 69), Ghisolfa (NIL 70), and Porta Romana (NIL 27) consistently exhibit high densities of young children, indicating that these areas continue to be high-risk neighbourhoods for heat exposure to children. This persistent high density of child-related heat stress highlights the important need for child-friendly heat adaptation planning in these areas.
Children are more sensitive to heat stress due to dehydration risks and their underdeveloped thermoregulatory systems, and pregnant women risk giving birth to children with lower body weights [12]. The aforementioned NILs should be selected interventions like shaded and vegetated play areas in residential regions, water features and cooling facilities in schools and public parks and incorporating heat adaptation strategies in childcare and health centres. Due to children having lower regulation of body temperature and being dependent on caregivers, implementing heat-adaptive urban planning that focuses on thermal comfort and safety is crucial.
The persistent overlap between NILs with a high density of vulnerable people and the hottest zones identified in SUHI mapping underlines an important connection between climate risk and social vulnerability. Loreto (NIL 20), Umbria (NIL 28), Padova (NIL19), Ghisolfa (NIL 70), Sarpi (NIL69), and Porta Romana (NIL27) consistently emerge as having the most vulnerable age groups (elderly and children) in both 2020 and 2030 projections.
Similar spatial relationships between urban heat exposure and population vulnerability have been documented in other European cities within comparable climatic contexts. Studies using thermal indicators such as Land Surface Temperature and Surface Urban Heat Island intensity have identified consistent associations between dense urban fabric, limited green infrastructure, and elevated surface temperatures in cities such as Rome, Zagreb, and across multiple European metropolitan areas [22,27,33]. In parallel, research adopting biometeorological indices to assess human thermal stress, including Humidex, PET, and related temperature–humidity indicators, has highlighted comparable patterns of heat exposure and health vulnerability in cities such as Barcelona and Amsterdam, as well as in epidemiological studies linking heatwaves to adverse health outcomes [3,12,13]. These findings support the broader relevance of the spatial exposure–susceptibility patterns observed in Milan.
These results underline the success of this research, which was able to identify the NILs at highest risk, and highlight the consequent need for health-oriented climate adaptation policies. The findings reinforce recent evidence that heat-related health risks require a public-health adaptation approach centred on vulnerability assessment, environmental equity, and preventive planning [18,32]. For metropolitan areas such as Milan, municipalities should develop Urban Heat Action Plans aligned with recommendations from the World Health Organization (WHO), European Environment Agency (EEA), and Intergovernmental Panel on Climate Change (IPCC). Such plans should integrate GIS-based risk mapping, early warning systems, and investment in green and blue infrastructure in high-risk neighbourhoods. Embedding public health perspectives into urban climate policy would enable Milan to move from reactive measures to preventive strategies, promoting a more equitable and climate-adaptive urban environment.
5. Conclusions
This study demonstrates that GIS tools are powerful for identifying and addressing heat-related health risks in urban environments. By integrating spatial data on SUHI intensity, demographic vulnerability, and green infrastructure distribution, the analysis revealed unequal exposure to extreme heat, particularly among children and the elderly.
The GIS-based approach proved effective in supporting public health strategies aimed at mitigating the impacts of heat exposure. It enables planners and policymakers to visualize health disparities, locate the most vulnerable neighbourhoods, and prioritize interventions. Through spatial evidence, GIS fosters the development of targeted NBSs, cooling infrastructures, and heat–health adaptation measures that contribute to a more equitable and resilient city.
Moreover, this methodology provides an opportunity for local health authorities, such as ATS Milano, to integrate geospatial data into their monitoring systems, improving the efficiency and responsiveness of health policy models. This framework can support cross-sectoral collaboration between urban planning and public health institutions, aligning local adaptation measures with the broader recommendations of the WHO, EEA, and IPCC for climate–health resilience.
6. Limitations and Further Developments
It is important to acknowledge the limitations of relying on satellite-derived LSTs alone as an indicator of human-perceived thermal stress. LST represents surface temperature, which differs from actual ambient conditions experienced by individuals. Human thermal comfort is influenced by a combination of variables such as air temperature, relative humidity, wind speed, and solar radiation, which LST does not capture on its own. As shown in the recent literature [34], the use of comprehensive thermal indices such as the Universal Thermal Climate Index (UTCI), the Physiologically Equivalent Temperature (PET), and the PALM model system for microscale simulations can have high-resolution outputs for accurate representations of outdoor heat stress by integrating multiple meteorological inputs. Additionally, evaluating the thermal performance of shade and the use of physically based microclimate models such as ENVI-met [35] can improve the small-scale dimension of this analysis.
However, due to data limitations and the spatial scale of this research, such indices were not implementable within the scope of the study. Instead, LST was selected as a practical and replicable metric, widely used in urban climate research, particularly for large-scale analysis. To partially address this, we incorporated the Humidex index, calculated for the same date and time as the available satellite imagery, using ground-level air temperature and dew point data. This provided a supplementary indication of thermal discomfort and confirmed that the selected date represented severe heat stress conditions. We recognize that future research should aim to integrate more refined thermal indices and ground validation to enhance the precision of the study.
Heatwave conditions are also influenced by synoptic-scale atmospheric processes, such as warm-air advection and upper-level subsidence, which can intensify heat stress. However, these processes were not explicitly analyzed in this study, which focuses on spatial patterns of surface thermal exposure.
The analysis was intentionally focused on a single representative day within the 2024 heatwave, rather than a temporal composite, to align thermal conditions with demographic vulnerability using the Humidex index. While this approach is focused on a single-day risk snapshot, we acknowledge that for identifying persistent or seasonal SUHI patterns, it would be beneficial in future studies to incorporate multiple satellite images within the heatwave. Greater availability of comparable GIS data would make it possible to develop methodologies to assess multifactorial risks, which are capable of simultaneously addressing different elements of environmental pressure (e.g., floating SUHI) and various vulnerability factors (age, illness, socio-economic and cultural conditions, etc.). The incorporation of future climate projections alongside demographic change is, therefore, identified as a key direction for subsequent research.
While the Humidex index was useful for selecting a representative extreme heat event, it has limitations in fully capturing urban thermal conditions. In particular, it does not account for meteorological factors such as wind speed and solar radiation, which can influence heat accumulation, Urban Heat Island intensity, and human thermal comfort. These drivers were not incorporated in the current analysis due to data constraints, and their inclusion represents an important direction for future research.
The relationships discussed in this study are based on spatial and visual comparisons between surface temperature patterns, demographic indicators, and green infrastructure distribution. No formal statistical correlation analysis was performed, and the observed associations should, therefore, be interpreted as descriptive rather than inferential. Future research integrating statistical correlation or regression analyses is required to quantitatively assess the strength and significance of these relationships.
Looking forward, there is a need to digitalize urban and demographic datasets in editable formats such as Excel, CSV, or geolocated GIS packages. Additionally, better organization and accessibility of spatial and statistical data by public institutions would significantly enhance the quality and efficiency of such research, enabling more informed and equitable urban planning decisions.
Author Contributions
Conceptualization, M.B. and R.M.S.; Methodology, M.B. and R.M.S.; Software, R.M.S.; Validation, M.B., R.M.S. and S.A.; Formal Analysis, R.M.S.; Investigation, M.B. and R.M.S.; Resources, R.M.S.; Data Curation, R.M.S. and S.A.; Writing—Original Draft Preparation, R.M.S., M.B. and S.A.; Writing—Review and Editing, M.B., R.M.S., S.A. and S.C.; Visualization, R.M.S.; Supervision, M.B., S.A. and S.C.; Project Administration, M.B.; Funding Acquisition, S.C. All authors have read and agreed to the published version of the manuscript.
Funding
This research received no external funding.
Data Availability Statement
The data used in this study are derived from publicly available sources. Landsat 8 and 9 satellite data are available from the United States Geological Survey (USGS). Demographic data were obtained from the Municipality of Milan through publicly accessible administrative reports. Processed datasets and analytical workflows supporting the findings of this study are available from the corresponding author upon reasonable request.
Acknowledgments
During the preparation of this manuscript, the authors did not use generative artificial intelligence tools. The authors reviewed and edited all content and take full responsibility for the integrity and accuracy of the final manuscript.
Conflicts of Interest
The authors declare no conflicts of interest.
Abbreviations
The following abbreviations are used in this manuscript:
| UHI | Urban Heat Island |
| SUHI | Surface Urban Heat Island |
| LST | Land Surface Temperature |
| GEE | Google Earth Engine |
| GISs | Geographic Information Systems |
| NBSs | Nature-Based Solutions |
| OMD | Osservatorio Meteorologico Milano Duomo |
| NIL | Nuclei di Identità Locale |
| WHO | World Health Organization |
| EEA | European Environment Agency |
| IPCC | Intergovernmental Panel on Climate Change |
| UTCI | Universal Thermal Climate Index |
| PET | Physiologically Equivalent Temperature |
| WBGT | Wet-Bulb Globe Temperature |
| NDVI | Normalized Difference Vegetation Index |
| HD | Humidex |
| UNDRR | United Nations Office for Disaster Risk Reduction |
| CAPE | Convective Available Potential Energy |
References
- Grilo, F.; Pinho, P.; Aleixo, C.; Catita, C.; Silva, P.; Lopes, N.; Freitas, C.; Santos-Reis, M.; McPhearson, T.; Branquinho, C. Using Green to Cool the Grey: Modelling the Cooling Effect of Green Spaces with a High Spatial Resolution. Sci. Total Environ. 2020, 724, 138182. [Google Scholar] [CrossRef] [Scilit]
- Kalantari, Z.; Ferreira, C.S.S.; Pan, H.; Pereira, P. Nature-Based Solutions to Global Environmental Challenges. Sci. Total Environ. 2023, 880, 163227. [Google Scholar] [CrossRef] [Scilit] [PubMed]
- Vasconcelos, L.; Langemeyer, J.; Cole, H.V.S.; Baró, F. Nature-Based Climate Shelters? Exploring Urban Green Spaces as Cooling Solutions for Older Adults in a Warming City. Urban For. Urban Green. 2024, 98, 128408. [Google Scholar] [CrossRef] [Scilit]
- Xu, Z.; Sheffield, P.E.; Hu, W.; Su, H.; Yu, W.; Qi, X.; Tong, S. Climate Change and Children’s Health—A Call for Research on What Works to Protect Children. Int. J. Environ. Res. Public Health 2012, 9, 3298–3316. [Google Scholar] [CrossRef] [Scilit] [PubMed]
- Capari, L.; Wilfing, H.; Exner, A.; Höflehner, T.; Haluza, D. Cooling the City? A Scientometric Study on Urban Green and Blue Infrastructure and Climate Change-Induced Public Health Effects. Sustainability 2022, 14, 4929. [Google Scholar] [CrossRef] [Scilit]
- Mosca, F.; Dotti Sani, G.M.; Giachetta, A.; Perini, K. Nature-Based Solutions: Thermal Comfort Improvement and Psychological Wellbeing, a Case Study in Genoa, Italy. Sustainability 2021, 13, 11638. [Google Scholar] [CrossRef] [Scilit]
- Aznarez, C.; Kumar, S.; Marquez-Torres, A.; Pascual, U.; Baró, F. Ecosystem Service Mismatches Evidence Inequalities in Urban Heat Vulnerability. Sci. Total Environ. 2024, 922, 171215. [Google Scholar] [CrossRef] [Scilit]
- Gianfredi, V.; Buffoli, M.; Rebecchi, A.; Croci, R.; Oradini-Alacreu, A.; Stirparo, G.; Marino, A.; Odone, A.; Capolongo, S.; Signorelli, C. Urban Green Spaces and Public Health Outcomes: A Systematic Review of Literature. Eur. J. Public Health 2021, 31, 243–244. [Google Scholar] [CrossRef] [Scilit]
- Ballester, J.; Quijal-Zamorano, M.; Méndez Turrubiates, R.F.; Pegenaute, F.; Herrmann, F.R.; Robine, J.M.; Basagaña, X.; Tonne, C.; Antó, J.M.; Achebak, H. Heat-Related Mortality in Europe during the Summer of 2022. Nat. Med. 2023, 29, 1857–1866. [Google Scholar] [CrossRef] [Scilit]
- United Nations Ageing. Available online: https://www.un.org/en/global-issues/ageing (accessed on 6 May 2025).
- Eurostat Population Projections in the EU. Available online: https://ec.europa.eu/eurostat/statistics-explained/index.php?title=Population_projections_in_the_EU (accessed on 6 May 2025).
- Van Der Hoeven, F.; Wandl, A. Amsterwarm: Mapping the Landuse, Health and Energy-Efficiency Implications of the Amsterdam Urban Heat Island. Build. Serv. Eng. Res. Technol. 2015, 36, 67–88. [Google Scholar] [CrossRef] [Scilit]
- Enrico, G.; Caiani, J.N. Neighborhood Determinants of Vulnerability to Heat for Cardiovascular Health: A Spatial Analysis of Milan, Italy. Popul. Environ. 2024, 46, 25. [Google Scholar] [CrossRef] [Scilit]
- Nawaro, J.; Gianquintieri, L.; Pagliosa, A.; Sechi, G.M.; Caiani, E.G. Heatwave Definition and Impact on Cardiovascular Health: A Systematic Review. Public Health Rev. 2023, 44, 1606266. [Google Scholar] [CrossRef] [Scilit] [PubMed]
- Sánchez-Guevara Sánchez, C.; Núñez Peiró, M.; Neila González, F.J. Urban Heat Island and Vulnerable Population. The Case of Madrid. In Sustainable Development and Renovation in Architecture, Urbanism and Engineering; Mercader-Moyano, P., Ed.; Springer International Publishing: Cham, Switzerland, 2017; pp. 3–13. ISBN 978-3-319-51441-3. [Google Scholar]
- Alied, M.; Huy, N.T. A Reminder to Keep an Eye on Older People during Heatwaves. Lancet Healthy Longev. 2022, 3, e647–e648. [Google Scholar] [CrossRef] [Scilit] [PubMed]
- Gianquintieri, L.; Caiani, E.G. State-of-Art in Studying the Public Health Effects of Heat: A Literature Review. Glob. Chall. 2025, 9, e00381. [Google Scholar] [CrossRef] [Scilit]
- Oppio, A.; Caprioli, C.; Dell’Ovo, M.; Bottero, M. Assessing Ecosystem Services through a Multimethodological Approach Based on Multicriteria Analysis and Cost-Benefits Analysis: A Case Study in Turin (Italy). J. Clean. Prod. 2024, 472, 143472. [Google Scholar] [CrossRef] [Scilit]
- Fradelos, E.; Papathanasiou, I.; Mitsi, D.; Tsaras, K.; Kleisiaris, C.; Kourkouta, L. Health Based Geographic Information Systems (GIS) and Their Applications. Acta Inf. Med. 2014, 22, 402. [Google Scholar] [CrossRef] [Scilit]
- Khashoggi, B.F.; Murad, A. Issues of Healthcare Planning and GIS: A Review. ISPRS Int. J. Geo-Inf. 2020, 9, 352. [Google Scholar] [CrossRef] [Scilit]
- Conti, S.; Meli, P.; Minelli, G.; Solimini, R.; Toccaceli, V.; Vichi, M.; Beltrano, C.; Perini, L. Epidemiologic Study of Mortality during the Summer 2003 Heat Wave in Italy. Environ. Res. 2005, 98, 390–399. [Google Scholar] [CrossRef] [Scilit]
- Lauwaet, D.; Berckmans, J.; Hooyberghs, H.; Wouters, H.; Driesen, G.; Lefebre, F.; De Ridder, K. High Resolution Modelling of the Urban Heat Island of 100 European Cities. Urban Clim. 2024, 54, 101850. [Google Scholar] [CrossRef] [Scilit]
- Mercogliano, P.; Padulano, R.; Ellena, M. Milan and the CLIMATE: Past and Future; CMCC Foundation—Euro-Mediterranean Center on Climate Change: Lecce, Italy; Available online: https://www.cmcc.it/it/report-milano (accessed on 26 January 2026).
- Yang, Q.; Huang, X.; Li, J. Assessing the Relationship between Surface Urban Heat Islands and Landscape Patterns across Climatic Zones in China. Sci. Rep. 2017, 7, 9337. [Google Scholar] [CrossRef] [Scilit]
- d’Ambrosio Alfano, F.R.; Palella, B.I.; Riccio, G. Thermal Environment Assessment Reliability Using Temperature—Humidity Indices. Ind. Health 2011, 49, 95–106. [Google Scholar] [CrossRef] [Scilit]
- Isola, F.; Leone, F.; Pittau, R. Evaluating the Urban Heat Island Phenomenon from a Spatial Planning Viewpoint. A Systematic Review. TeMA J. Land Use Mobil. Environ. 2023, 2023, 75–93. [Google Scholar]
- Bečić, D.; Gašparović, M. Urban Heat Islands and Land-Use Patterns in Zagreb: A Composite Analysis Using Remote Sensing and Spatial Statistics. Land 2025, 14, 1470. [Google Scholar] [CrossRef] [Scilit]
- Comune di Milano. Catalogo Schede NIL Ed Elenchi Dei Servizi—Piano Dei Servizi. Comune di Milano. Available online: https://fareimpresa.comune.milano.it/it/web/guest/aree-tematiche/edilizia/pgt-previgente/piano-dei-servizi/catalogo-schede-nil-elenchi-dei-servizi (accessed on 6 May 2025).
- Vieira, J.; Matos, P.; Mexia, T.; Silva, P.; Lopes, N.; Freitas, C.; Correia, O.; Santos-Reis, M.; Branquinho, C.; Pinho, P. Green Spaces Are Not All the Same for the Provision of Air Purification and Climate Regulation Services: The Case of Urban Parks. Environ. Res. 2018, 160, 306–313. [Google Scholar] [CrossRef] [Scilit] [PubMed]
- Buchin, O.; Hoelscher, M.-T.; Meier, F.; Nehls, T.; Ziegler, F. Evaluation of the Health-Risk Reduction Potential of Countermeasures to Urban Heat Islands. Energy Build. 2016, 114, 27–37. [Google Scholar] [CrossRef] [Scilit]
- Arellano, B.; Roca, J. EFFECTS OF URBAN GREENERY ON HEALTH. A STUDY FROM REMOTE SENSING. Int. Arch. Photogramm. Remote Sens. Spat. Inf. Sci. 2022, XLIII-B3-2022, 17–24. [Google Scholar] [CrossRef] [Scilit]
- Haase, A.; Koprowska, K.; Borgström, S. Green Regeneration for More Justice? An Analysis of the Purpose, Implementation, and Impacts of Greening Policies from a Justice Perspective in Łódź Stare Polesie (Poland) and Leipzig’s Inner East (Germany). Environ. Sci. Policy 2022, 136, 726–737. [Google Scholar] [CrossRef] [Scilit]
- Marando, F.; Salvatori, E.; Sebastiani, A.; Fusaro, L.; Manes, F. Regulating Ecosystem Services and Green Infrastructure: Assessment of Urban Heat Island Effect Mitigation in the Municipality of Rome, Italy. Ecol. Model. 2019, 392, 92–102. [Google Scholar] [CrossRef] [Scilit]
- Anders, J.; Schubert, S.; Maronga, B.; Salim, M. Simplifying Heat Stress Assessment: Evaluating Meteorological Variables as Single Indicators of Outdoor Thermal Comfort in Urban Environments. Build. Environ. 2025, 274, 112658. [Google Scholar] [CrossRef] [Scilit]
- Middel, A.; AlKhaled, S.; Schneider, F.A.; Hagen, B.; Coseo, P. 50 Grades of Shade. Bull. Am. Meteorol. Soc. 2021, 102, E1805–E1820. [Google Scholar] [CrossRef] [Scilit]

Disclaimer/Publisher’s Note: The statements, opinions and data contained in all publications are solely those of the individual author(s) and contributor(s) and not of MDPI and/or the editor(s). MDPI and/or the editor(s) disclaim responsibility for any injury to people or property resulting from any ideas, methods, instructions or products referred to in the content. |
© 2026 by the authors. Licensee MDPI, Basel, Switzerland. This article is an open access article distributed under the terms and conditions of the Creative Commons Attribution (CC BY) license.