Article

Long-Term Variations in Solar Radiation and Its Role in Air Temperature Increase at Dome C (Antarctica)


1
Independent Researcher, Beijing 100029, China
2
National Research Council of Italy, Institute of Polar Sciences (CNR-ISP), Via P. Gobetti 101, 40129 Bologna, Italy
3
Institute of Atmospheric Physics, Chinese Academy of Sciences, Beijing 100029, China
*
Authors to whom correspondence should be addressed.
Retired.
Climate 2026, 14(2), 43; https://doi.org/10.3390/cli14020043
Submission received: 6 December 2025 / Revised: 23 January 2026 / Accepted: 26 January 2026 / Published: 2 February 2026

Abstract

Based on a previously developed empirical model of global solar irradiance (EMGSI) at the Dome C station under all-sky conditions, and on good simulations of global solar radiation and its losses in the atmosphere caused by absorption and scattering components, as well as albedos at the top of the atmosphere (TOA) and the surface (TOAsur) during 2006–2016, similar estimations for the above parameters during 2018–2021 and 2006–2021 were computed by further application of this empirical model, and reliable calculations were also obtained, as in 2006–2016. The long-term variations in the above variables were thoroughly investigated during 2006–2021. For annual averages over 2006–2021, the calculated and observed global solar radiation decreased, and the absorption and scattering losses increased, well associated with increases in absorption and scattering atmospheric substances. Air temperature increased by 0.99 °C, showing regional climate warming. The mechanisms of air temperature increase were fully studied, and the basic mechanism reported previously was further confirmed. Additionally, the mechanisms of air temperature change vary with gases, liquids, and particles (GLPs) and with sites. Therefore, a proposal is recommended that, to reduce climate warming, all forms of direct emissions of GLPs and the secondary formation of new GLPs in the atmosphere produced by these directly emitted GLPs via chemical and photochemical reactions (CPRs) should be controlled. The estimated and satellite-derived albedos during 2006–2021 decreased at the TOAsur. An integrated understanding of solar radiation transfer in the atmosphere and of energy balance at the TOAsur is necessary.

1. Introduction

Global warming during the 20th century is caused by anthropogenic factors. These findings have been presented by the Intergovernmental Panel on Climate Change (IPCC) [1]. Most sites in the Antarctic and Arctic, as well as in the Qomolangma region (the Third Polar), display warming trends [1,2,3,4,5,6]. As one of the most important regions on Earth, climate change and its driving factors in the Antarctic should be extensively investigated. The Antarctic continent shows a warming trend; the air temperature rise was 0.12 °C per decade during 1980–2023, and this warming is contributed by thermodynamic and dynamic processes [7]. As a significant representative site in the Antarctic, Dome C possesses a unique advantage in studying regional climate change. A previous study reports that the annual air temperature has risen by 1.80 °C during 2006–2016 [8], and increases in atmospheric absorption and scattering components are the main reasons. Although some possible mechanisms of climate warming are reported, such as changing oceanographic and atmospheric circulations and air–sea-ice feedback, more extensive studies are still necessary to fully understand the current climate and climate change, as well as the internal relationships and mechanisms in the Sun–atmosphere–land system.
Solar energy plays a significant role in climate and climate change, and interacts with atmospheric components (including gases, liquids, and particles (GLPs)) through chemical and photochemical reactions (CPRs) in the UV and visible (VIS) wavelength bands [9,10,11,12,13,14,15,16,17].
Both radiative transfer models and empirical models, together with ground-measured and satellite-retrieved solar radiation, are beneficial for studying global solar radiation [17,18,19,20,21,22,23,24,25,26,27]. Based on a previously developed empirical model of global solar irradiance (EMGSI) at Dome C and climate warming during 2006–2016 [8], further investigations were conducted using the updated measurements from 2018 to 2021 at Dome C for the objectives in this study: (1) Can EMGSI be used to estimate global solar radiation after 2016? (2) What are the trends of global solar radiation, the absorption and scattering components, and the albedos at the top of the atmosphere (TOA) and the surface (TOAsur) during 2006–2021? (3) Is climate still warming after 2016 and during 2006–2021? What are the mechanisms of climate change over a longer time period (e.g., 2006–2021)?

2. Materials and Methods

2.1. Measurements and Data Collection

Dome C (75°06′ S, 123°21′ E, 3233 m), a site of the Baseline Surface Radiation Network (BSRN), supplies high-quality observational data of solar radiation. Solar radiation and meteorological parameters are measured at Dome C, Antarctica [8,28,29,30,31,32,33], and detailed information is reported in [8]. The data from January 2006 to December 2016 in a previous study [8] and the updated data from October 2018 to December 2021 are used in the present work (the solar radiation data observed during 1 January 2017–30 November 2018 are not available). A detailed introduction to the instruments of global solar irradiance (G) and diffuse horizontal irradiance (S) and their calibrations, air temperature (T), relative humidity (RH), and water vapor pressure (E) is provided in [8,29].
The Dome C region has a nearly homogeneous snow surface [34], low seasonal air temperatures (ranging from −80 °C to −20 °C [35]), and a clean atmosphere [8,36]. The aerosols and aerosol optical depth (AOD) in Antarctica remain at a very low value [37,38,39,40].

2.2. Application and Evaluation of the Empirical Model

An EMGSI model was introduced to calculate the global radiation (Gcal) [8]:
G cal = A 1 e kWm × cos ( Z ) + A 2 e S / G obs + A 0
where G and S are the hourly global and diffuse horizontal solar exposures at the ground (MJ m−2), respectively. K is the mean absorption coefficient of water vapor, W = 0.021E × 60 (E, water vapor pressure at the ground, hPa); m is the optical air mass; and Z is the solar zenith angle. A1, A2, and A0 are coefficients (MJ m−2) [8].
Applying EMGSI, which was established previously by analyzing measurements in 2008–2011 at Dome C, global solar radiation from 1 October 2018 to 31 December 2021 was computed. The Gobs values > 20 W m−2 were selected to ensure reliable data and further estimations. The basic parameters of the empirical model (model coefficients and coefficient of determination (R2)) and results in 2008–2011, including the mean absolute value of relative error (δ) between Gcal and Gobs, the mean absolute deviations (MAD, in exposure unit, MJ m−2, and as a percentage of the mean measured value, %), and the root mean square errors (RMSE, in exposure units and as a percentage of the mean measured value), are shown in Table 1. During 2018–2021, the computed values were lower than the observations by 7.26% on average and were found to have an uncertainty of less than 20% in relation to the uncertainty of popular solar radiation models [41]. The RMSE was 0.15 MJ m−2 and less than the mean RMSE (0.22 MJ m−2) obtained using 7 independent a priori models with better estimations out of the 105 empirical models [23], meaning that the empirical model is still performing well.
Figure 1 shows a scatter plot of hourly Gcal versus Gobs. Comparing the simulations of hourly G between two time periods—from 1 October 2018 to 31 December 2021 and from 1 January 2006 to 30 November 2016—most calculation biases were found to be similar. For example, the estimated values in 2006–2016 were lower than the measured values by 18.40% on average, the NMSE was 0.01 MJ m−2, and the RMSE values were 0.146 MJ m−2 and 10.90%. Generally, the calculated hourly G still agrees well with measurements; therefore, the empirical model can be applied to the time period of 2018–2021 at Dome C.
The hourly losses of G caused by the absorption and scattering components (GLA, GLS) were calculated using the absorption and scattering radiation at the TOA minus those at the surface, respectively, i.e., GLA = A1(1 − e−kWm × cos(Z)) and GLS = A2(1 − e−S/G), and the total loss GL was GLA + GLS.

3. Results

3.1. Global Solar Radiation During the Time Period 2018–2021

To study the basic characteristics of solar radiation and meteorology in 2018–2021 at Dome C, the measured hourly data in the analysis were from 1 October 2018 to 31 December 2021, considering only the months from September to April and excluding the polar night. During 2018–2021, the mean observed hourly G, S, and D (direct horizontal irradiance) (n= 13,443) were 1.23 (342.63 Wm−2), 0.33 (90.64 Wm−2), and 0.91 (251.98 Wm−2) MJ m−2; thus, direct solar radiation dominated global solar radiation and contributed to 73.55%, while diffuse solar radiation contributed to 26.46%. The mean S/G was 0.330, and the mean T, RH, and E were −41.5 °C (ranging from −76.6 to −14.7 °C), 57.79%, and 0.14 hPa, respectively. The mean air pressure was 644.5 hPa.
The hourly Gcal from 1 October 2018 to 31 December 2021 was computed using EMGSI, together with the measured hourly parameters (G, E, and S/G). To express atmospheric components objectively, the absorbing factor (expressed by E) and the scattering factor (S/G, also called the diffuse fraction) are used [17]. The computed and measured monthly G, S, and S/G from 1 October 2018 to 31 December 2021 are shown in Figure 2. Generally, the empirical model also indicates better performance, and most of the monthly estimates are in the range of one standard deviation of the observed G. The global solar exposure shows strong seasonal variations and peaks in December. The diffuse horizontal radiation displays similar variations to G. In general, G and S are negatively affected by the atmospheric scattering components (expressed as S/G). The diffuse fraction S/G also shows clear seasonal variation patterns, with peaks in April and lower levels during October–December. From October 2018 to December 2021, the monthly mean observed values are 295.0 W m−2 (ranging from 52.8 to 436.3 W m−2, the same hereafter) for G, −46.0 °C (−63.2 to −28.5 °C) for T, 53.4% (35.3% to 70.6%) for RH, 0.10 hPa (0.00–0.36 hPa) for E, and 0.360 (0.154 to 0.591) for S/G, respectively.
Over the 4 years, the monthly mean Gobs and Gcal decreased by 0.32% and 0.39% per month, respectively, while the measured S also decreased by 0.35% per month. They were associated with increases in S/G of 0.63% and E of 0.30% per month. The monthly mean T and RH decreased by 0.10% (corresponding to 0.16 °C) and 0.05% per month, respectively (Figure 2 and Figure 3).
On an annual basis (2018–2021), the air temperature decreased by 0.65% (0.8 °C) (Figure 4), which is contrary to the warming in 2006–2016 and the general Antarctic warming [8]. The annual mean of Gobs and Gcal decreased by 4.12% and 4.55% per year, respectively, and S decreased by 0.87% per year (Figure 5). They were associated with annual increases in S/G of 8.39% and decreases in E of 0.58%. The RH value increased by 0.02% per year.
To fully understand the mean environmental conditions at Dome C in 2018–2021, annual averages of observed values were reported: 338.54 and 89.84 W m−2 for G and S, 0.335 for S/G, and −41.81 °C, 57.50%, and 0.14 hPa for T, RH, and E, respectively.

3.2. The Losses of G in the Atmosphere in 2018–2021

For monthly averages, GLA and GL showed strong seasonal variations, with peaks in April and the lowest values in December. GLS also varied evidently with season, with the highest values in April and lower values in October, November, and December. GLA made a significant contribution to the total loss. From October 2018 to December 2021, (1) the monthly GLA increased by 0.09%, associated with an increase in E of 0.30%; (2) the monthly GLS increased by 0.51%, associated with an increase in S/G of 0.63%; and (3) the monthly GL increased by 0.11% (Figure 6).
Figure 7 shows the annual (i.e., September–April) losses of G during 2018–2021. GLA increased by 1.38% per year, corresponding to a decrease in E of 0.58%; GLS increased by 7.03% per year, corresponding to an increase in S/G of 8.39%; and the annual GL increased by 1.62% per year.
During October 2018–December 2021, the monthly mean contributions of absorption and scattering losses (RLA = GLA/[A1e−kWm × cos(Z) + A2e−S/Gobs] = A1(1−e−kWm × cos(Z))/[A1e−kWm × cos(Z) + A2e−S/Gobs], RLS = GLS/[A1e−kWm × cos(Z) + A2e−S/Gobs] = A2(1−e−S/Gobs)/[A1e−kWm × cos(Z) + A2e−S/Gobs)] to the total loss were 95.37% and 4.63%, respectively (Figure 8). This corresponds to the monthly averages of E at 0.14 hPa, S/G at 0.34, and T at −41.81 °C. Generally, RLA was higher in October–December and lower in April or October, indicating that the GLP absorption mainly controls the attenuation of G. RLS changed inversely relative to RLA. For the annual averages, the above corresponding absorption and scattering losses (RLA, RLS) were 95.43% and 4.57%, respectively. The annual averages of E, S/G, and T were 0.14 hPa (0.13–0.15), 0.327 (0.280–0.356), and −41.67 °C (−42.38 to −40.74 °C), respectively. The annual and monthly RLA and RLS during 2018–2021 were at similar levels to those in 2006–2016, indicating that the absorption and scattering components also remained at similar levels [8].
During 2018–2021, the annual mean losses of GLA, GLS, and GL were 3.95 (3.80–4.01), 0.19 (0.17–0.21), and 4.14 (3.97–4.21) MJ m−2, respectively. They were also similar to those in the period 2006–2016 [8].

3.3. G and Its Atmospheric Loss in Three Different Time Periods

To fully investigate the interactions among solar radiation, atmospheric absorption and scattering substances, and regional climate (represented by E, S/G, and T), we calculated monthly G and the absorption and scattering losses, along with E, S/G, and T, in three time scales, i.e., from October to March and from September to April during 2018–2021, and from October 2018 to December 2021.
Change rates in the monthly average G and other parameters are presented in Table 2 for the three situations, i.e., (a) from September to April of the next year, (b) from October to March of the next year during 2018–2021, and (c) from January 2018 to December 2021.
Situation (a): For monthly averages, T decreased, and it was mainly caused by decreases in G at the ground. However, the total loss of G in the atmosphere increased by about 0.03% (or remained stable), and the measured LWU from the ground increased by 0.54% per month. Additionally, the averages of G and LWU in 2018–2021 were 294.51 and 160.48 W m−2, respectively. For annual averages, T also decreased, and it was due to similar reasons as those for monthly T. The observed and calculated decreases in G were much larger than those of the absorption and scattering losses and the total loss. It should be noted that the monthly data in the analysis in September and April were less than 30 days, which may have resulted in large uncertainties.
Situation (b): For monthly averages, T increased; the observed and calculated G, as well as GLA, GLS, and GL, decreased, but the measured LWU from the ground increased by 0.98% per month, which is a key warming factor. For annual averages, T also increased, and it was caused by increases in GLA, GLS, and GL, corresponding well to the increases in absorption and scattering GLPs, together with an increase in LWU. This warming phenomenon is similar to that during 2006–2016 at Dome C to some extent [8].
Situation (c): For monthly averages, T increased, and it was mainly caused by increases in G (observed and calculated). For annual averages, T also increased, and it was due to increases in G and GLS. This local warming phenomenon is clearly displayed and understandable.
Comprising these three situations, it is revealed that the data quality and their representativeness are important; the three full-year datasets can exhibit the multiple interactions and mechanisms between T and solar radiation components thoroughly and clearly. Meanwhile, the monthly data can be helpful to investigate the complicated interactions and processes, especially those with longer time, which may be much more beneficial. It can be seen evidently from our previous analysis (i.e., 2006–2016); additionally, the uncertainties of all the above parameters can be reduced. Comparing situations a and b, the observed G in October–March has better quality, with higher solar altitude and smaller cosine errors in measurements than those in September–April.

3.4. G and Its Atmospheric Loss in Different Time Periods During September–April, October–March, and November–February (2006–2021)

Long-term variations in G and its loss in the atmosphere and the driving factors (i.e., absorption and scattering GLPs), along with T and RH, during January 2006–December 2021 were studied. Figure 9 and Figure 10 show the long-term variations in G, S/G, T, RH, and E, respectively. Figure 11 shows the long-term variations in the losses of G.
Over the 16 years, the monthly mean Gobs and Gcal displayed similar decreasing trends of 0.04% and 0.05% per month, respectively, while the observed S increased by 0.01% per month. They were associated with increases in S/G of 0.10% and E of 0.12% per month. The monthly T and RH increased by 0.01% (corresponding to 0.10 °C) and 0.05% per month, respectively. The absorbing loss decreased by 0.01% per month, and the scattering loss increased by 0.07% per month, while the total loss decreased as little as 0.002% per month.
During 2006–2021, the annual averages of Gobs and Gcal decreased by 0.65% and 0.76% per year, respectively, and S increased by 0.01% per year (Figure 12). They were associated with annual increases in S/G of 0.92% and E of 0.63% per year (Figure 13). The RH also increased by 0.63% per year. The T increased by 0.16% per year (corresponding to 0.99 °C in 2006–2021), maintaining the consistency of warming, i.e., air temperature increased by 0.43% (1.80 °C) per year, as observed during 2006–2016 [8] in accordance with the general Antarctic warming [7]. GLA and GLS increased by 0.29% and 0.79% per year, respectively, and GL also increased by 0.31% per year (Figure 14). The regional climate warming was still exhibited at Dome C during the recent 16 years; its mechanism was the same as that in 2006–2016, i.e., the increases in absorption and scattering substances, along with the increases in GLA, GLS, and GL [8].
To thoroughly study the significant characteristics and long-term variations in solar radiation, atmospheric substances, and meteorological parameters during 2006–2021, the monthly change rates of the above parameters under different time periods (September–April, October–March, and November–February) were calculated and are shown in Table 3, Table 4, Table 5 and Table 6 for monthly and annual averages, respectively. Similarly, the annual change rates of the above variables in three time periods during 2006–2021 are reported in Table 5.
For the three time periods during 2006–2021 on the monthly scale, Gobs, Gcal, GLA, and GL decreased, and GLS increased. The absorption and scattering substances increased. Generally, all the above factors contributed to an air temperature increase. The absorbing and total losses were different from those in their annual variations. Thus, the mechanisms and processes in climate change and its associated factors, solar radiation, and atmospheric substances varied with time scales, even at the Dome C station, an idealized natural laboratory with the driest and cleanest atmosphere on Earth. The largest increase in air temperature (2.03 °C) was also in the same time period of November–February as that in the annual scale.
For the three time periods during 2006–2021 on the annual scale, the observed and calculated G decreased, and the absorbing, scattering, and total losses increased. They correspond well to the increases in absorption and scattering substances (i.e., E and S/G, respectively). Finally, all the above factors resulted in an air temperature increase, with the mechanism being the same as that in 2006–2016 [8]. The air temperature increase was the highest (1.39 °C) during November–February, associated with the largest increase rates of E and S/G, i.e., absorption and scattering GLPs. The Gobs and E were the largest, leading to the highest “longwave radiation heating potential” contributed by the longwave radiation (Gobs × E = 0.253 MJ m−2 hPa). This was another important factor for the regional climate warming, which was also found in the air temperature increase at Dome C in 2006–2016 [8]. In summary, both shortwave and longwave radiation play vital roles in climate change, i.e., the increases in energy GLA and GLS, together with increases in atmospheric absorption and scattering GLPs, thus contributing to climate warming during 2006–2021. In addition, the Arctic as another important polar region has also warmed over the past decade [42].
In addition, the computed and satellite-derived annual mean albedos at the surface decreased by 0.39% and 0.15% per year during 2006–2021, respectively, indicating an increase in the longwave radiation converted from G (Section 3.5 and Section 3.6).
Taking the annual average as an example, GLA and GLS contributed to GL by 95.44% and 4.56% in September–April during 2006–2021, respectively, showing that the absorbing components still play a dominant role in the global solar radiation transfer process.

3.5. Albedos at the TOA and the Surface (TOAsur) During 2006–2021

Reflections from the TOAsur are important influencing factors that are associated with solar radiation transfer, absorption, and scattering features in the atmospheric components, energy balance, and climate change, and should be fully investigated [8,43,44,45,46]. For albedo calculations, we selected the monthly shortwave flux and incoming solar flux at the TOAsur for all skies, clear skies (cloud-free), and clear skies over a 1° × 1° region (https://ceres.larc.nasa.gov/products.php?product=EBAF-Product, accessed on 1 February 2025). The data were obtained from the Clouds and the Earth’s Radiant Energy System (CERES) Energy Balanced and Filled (EBAF) Edition 4.2 [47,48].
A previously established albedo calculation algorithm (Equations (2) and (3)) at the TOAsur for Dome C [8] was further applied.
AlbedoSur = (A0/Transca + A2/Transca + A1 × Tranabs × A2/(A1 + A2))/(A1e−kWm × cos(Z) + A2e−S/Gobs)
AlbedoTOA = (A0 + A2 + A2 × Transca × AlbedoSur + A1 × A2/(A1 + A2) + A1 × Tranabs × AlbedoSur)/(A1 + A2)
where Tranabs and Transca are the mean transmittances of absorption and scattering exposures in the atmosphere, respectively. A more detailed description can be seen in [8].
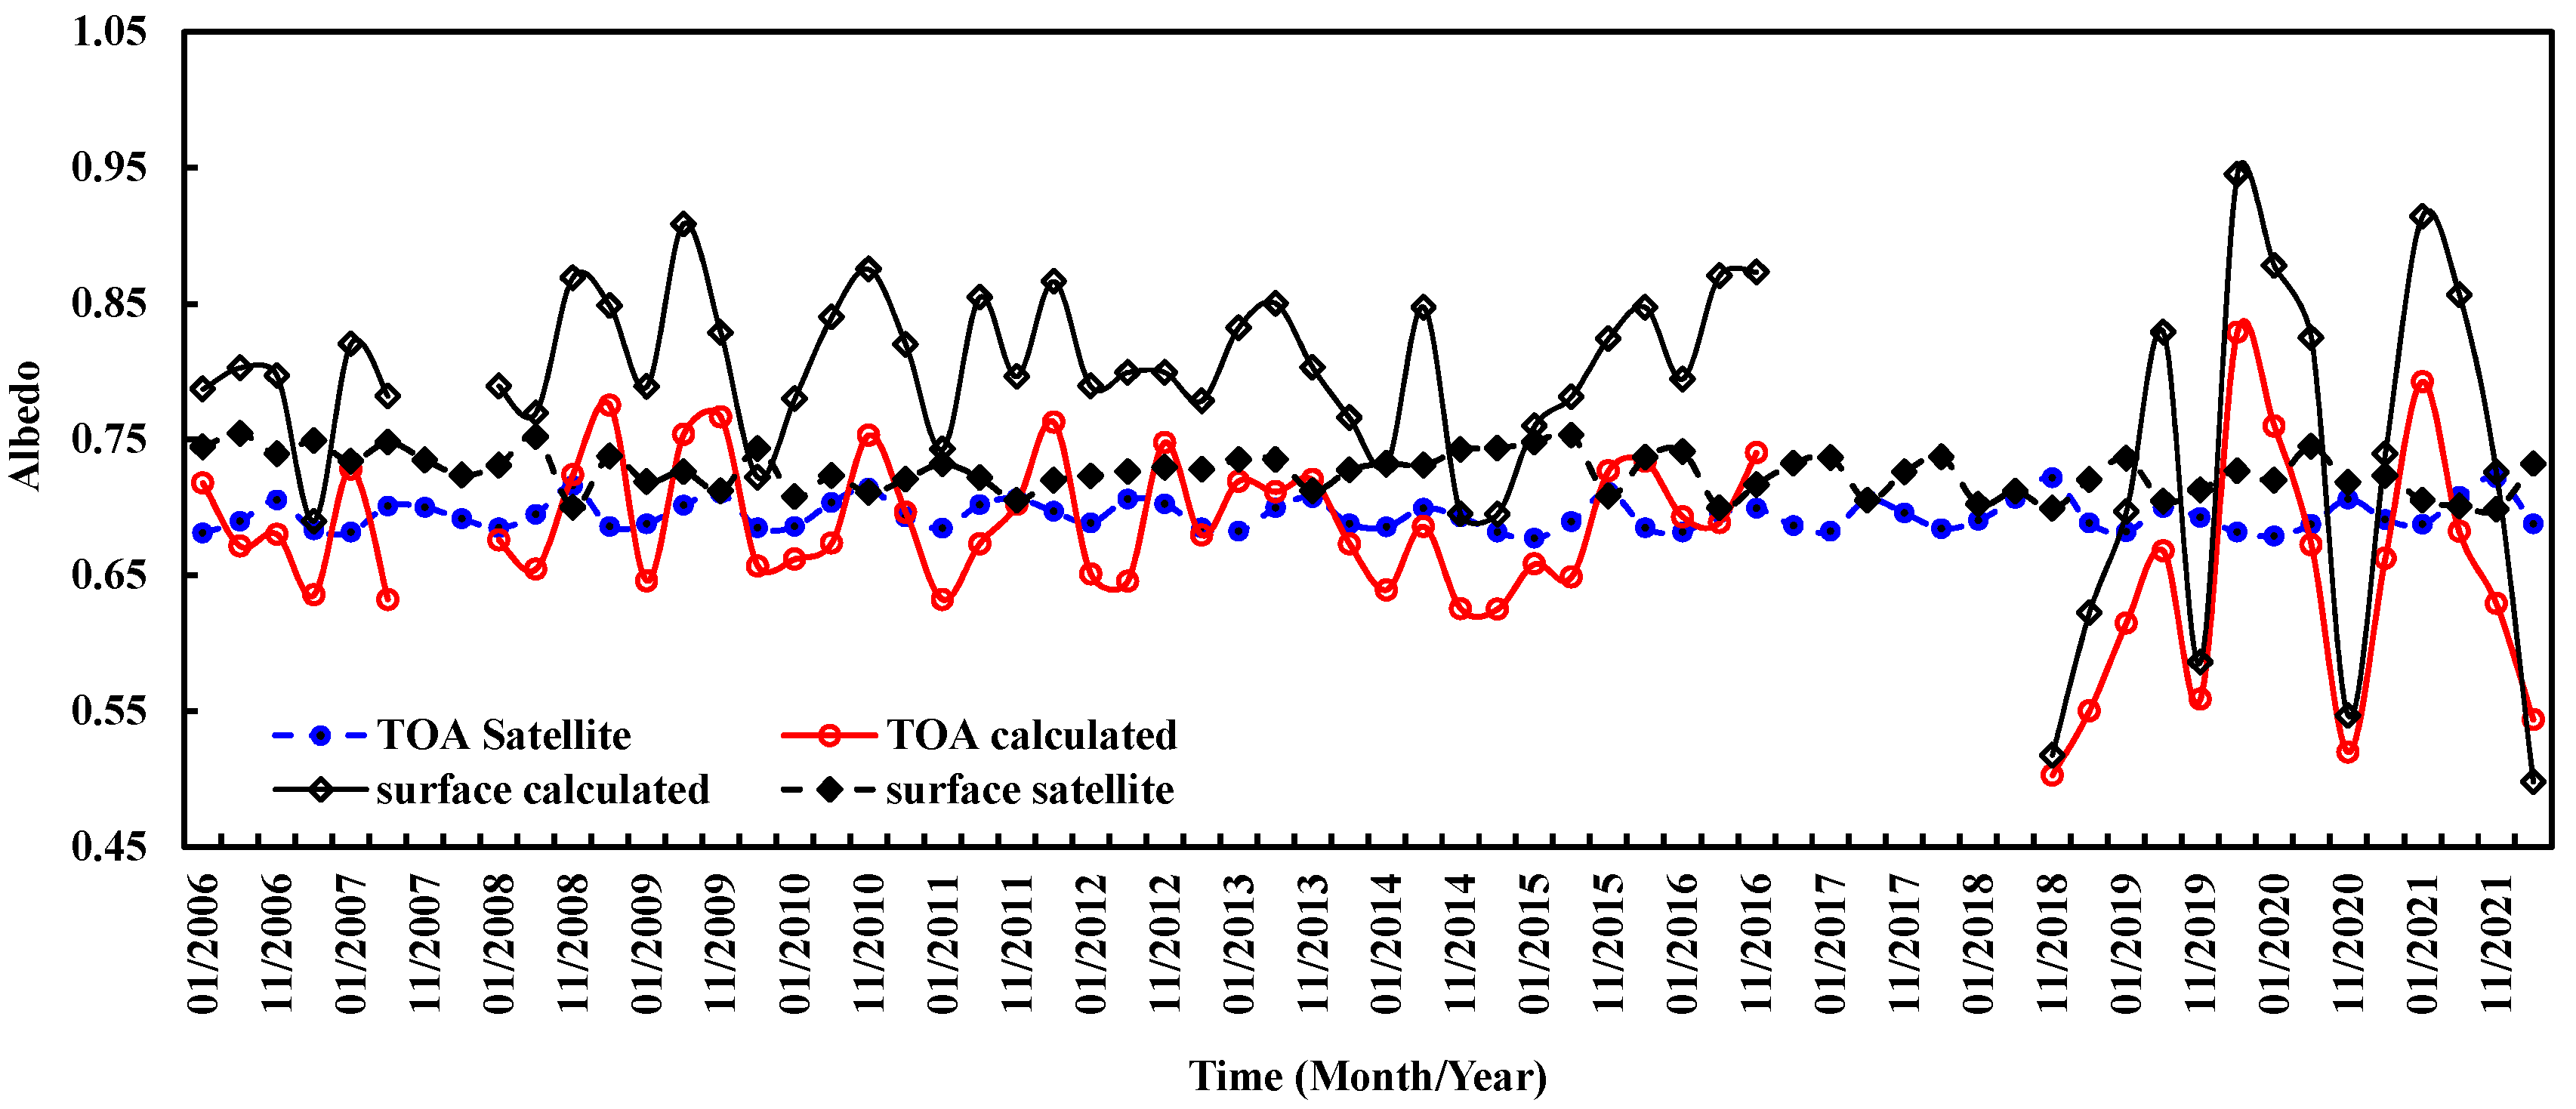
Using Equations (2) and (3) and hourly observations in January, February, November, and December (JFND) with solar altitude h ≥ 10°, the monthly mean albedos at the TOAsur were obtained for all-sky conditions during 2006–2021 (Figure 15). The estimated albedos at the TOAsur showed clear monthly variations and generally agreed with the satellite-derived values, respectively. The monthly mean ratios of calculated to satellite-derived albedos were 0.98 (0.70–1.22) and 1.08 (0.68–1.30) at the TOAsur, respectively. In the period 2006–2021, both calculated and satellite-derived monthly albedos decreased by 0.16% and 0.04%, respectively, at the surface, but decreased by 0.13% and increased by 0.01%, respectively, at the TOA. In general, the estimated monthly mean albedos underestimated TOA albedo by 2.4% and overestimated the surface albedo by 7.4% compared to the satellite-derived values in 2006–2021.
The annual albedos in JFND at the TOAsur were also calculated and are in reasonable agreement with the corresponding values (Figure 16). The annual ratios of estimated to satellite-derived albedos were 0.99 (0.93–1.02) and 1.09 (1.01–1.18) at the TOAsur, respectively. Generally, the estimated annual albedos underestimated TOA albedo by 1.5% and overestimated the surface albedo by 8.2% in 2006–2021. The accuracy of the retrieved albedos using MODIS data is about 85.9% [49]. Both estimated and satellite-derived annual albedos decreased by 0.286% and 0.0001% per year at the TOA, respectively, and by 0.39% and 0.15% per year at the surface, respectively, showing good agreement with the decreasing trends at the TOAsur in 2006–2021. The annual albedos in JFND were 0.684 (0.644–0.707) and 0.793 (0.742–0.846) at the TOAsur for the calculated values, respectively, and 0.694 (0.685–0.701) and 0.728 (0.709–0.747) for the satellite-derived values, respectively. The computed and satellite-derived albedos exhibited similar characteristics, and the albedos at the surface were larger than those at the TOA, revealing that the snow surface has a high reflectivity of 0.793 and 0.728, determined by model simulation and satellite retrieval, respectively.
Comparing the CERES solar radiation data between versions 4.2 and 4.1 for the albedo calculations at the TOA and surface in 2006–2021 [8,50], their relative biases were −0.06% (−0.01% to −0.12%) and −8.07% (−1.81% to −16.7%), respectively. According to detailed comparisons, the CERES data of version 4.1 showed better performance on the basis of the agreement between the model estimation and satellite retrieval for monthly and annual averages and their long-term variations at the TOAsur.
The annual values in JFND in the period 2006–2021 for the atmospheric substances (i.e., S/G) increased by 2.10% per year, the water vapor increased by 1.25%, the measured G decreased by 1.28%, and S decreased by 0.27%, while T increased by 0.16% per year, corresponding to 0.86 °C. The computed global solar exposure also decreased by 1.51% per year, which is in good agreement with the observation.
Additionally, the annual absorption and scattering losses in JFND (2006–2021) increased by 0.82% and 1.72% per year, respectively, and the total loss increased by 0.86% per year.
To better understand the basic features of the atmosphere, the annual averages in JFND (2006–2020) are reported: Gcal = 1.618 MJ m−2, Gobs = 1.659 MJ m−2, S/G = 0.272, E = 0.184 hPa, T = −35.49 °C, and RH = 63.31%. They were generally kept at similar corresponding levels as those during 2006–2016, respectively.
The albedo decrease at the TOA in 2006–2021 was mainly due to (1) increases in the atmospheric absorption and scattering substances, represented by increases in E and S/G, respectively, and (2) increases in direct absorption and indirect use of UV and visible radiation caused by all forms of atmospheric GLPs through biogenic volatile organic compounds (BVOCs) and OH radicals [8,51]. Thus, the chemical components in the atmosphere play significant roles in albedo changes at the TOAsur.
At Dome C, the albedo decrease at the surface in 2006–2021 reflects that the surface became more absorptive and resulted in greater absorption of G at the ground and more longwave radiation emitted to the atmosphere. Additionally, the atmosphere also became more absorptive (e.g., increase in E) and stored more shortwave radiation in the Earth system (e.g., GLA and GLS), based on the albedo decrease at the TOA in 2006–2021. Both factors contributed to regional climate warming.

3.6. Downward and Upward Longwave Radiation Under All Skies During 2006–2021

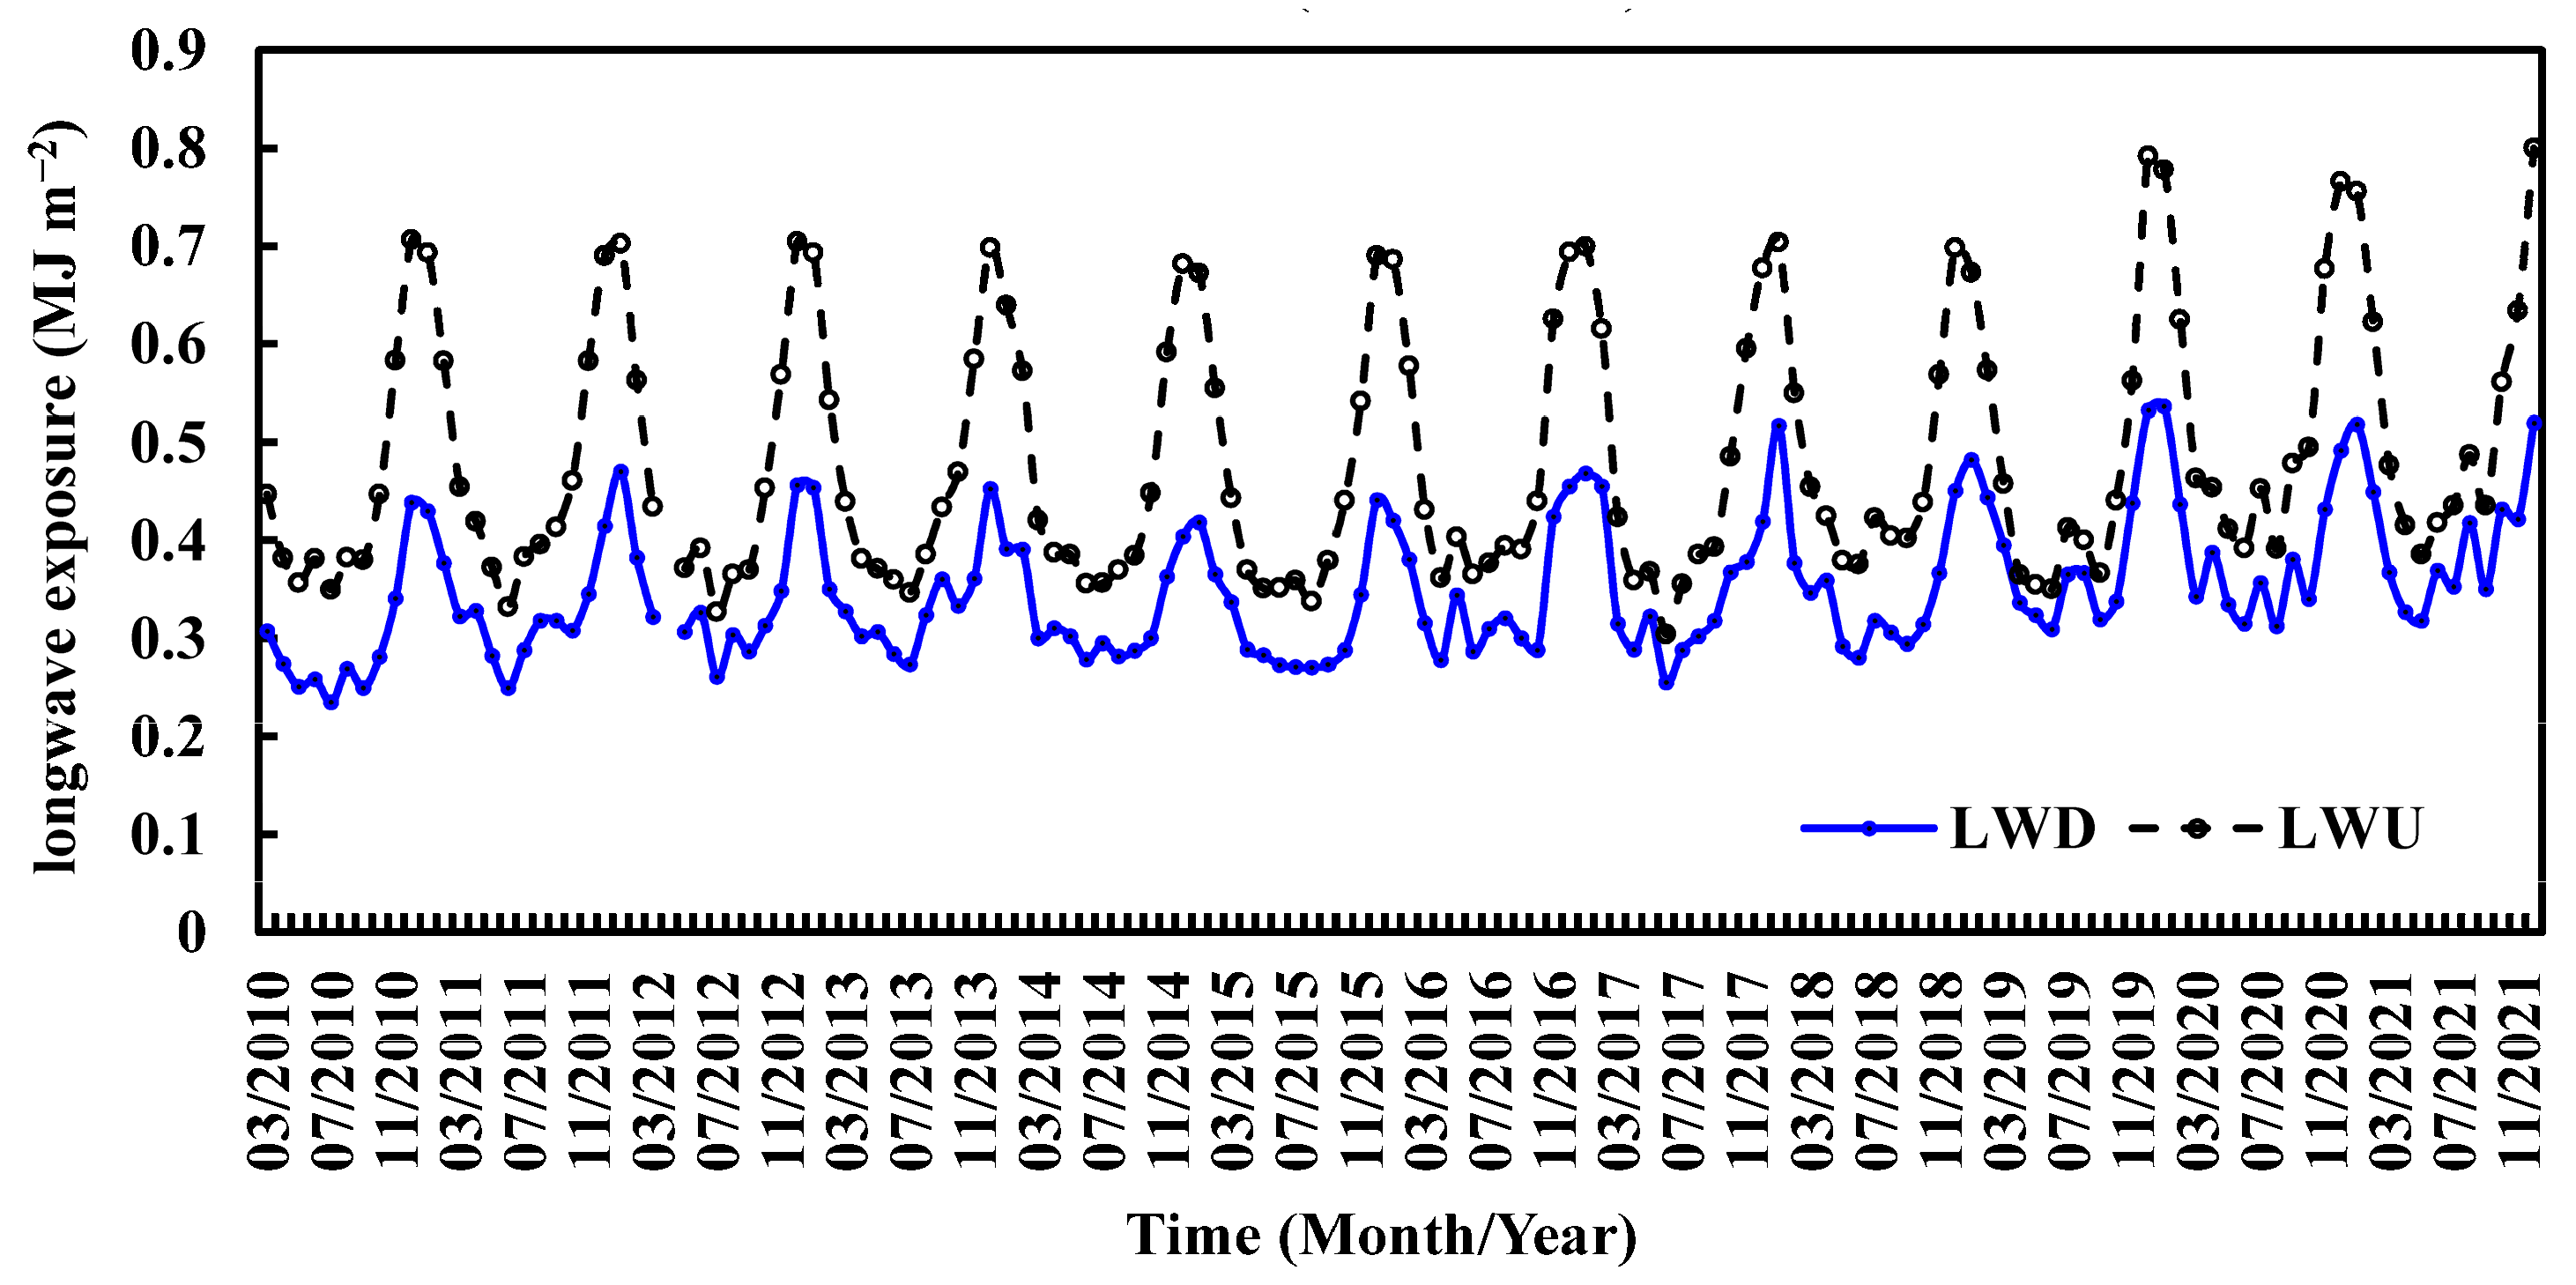
Under all-sky conditions, downward and upward longwave radiation (LWD, LWU) at Dome C from March 2010 to December 2021 were analyzed. Their monthly averages (n = 135) expressed as irradiance and exposure are shown in Figure 17. The LWD and LWU displayed evident monthly variations. They were usually higher in December and January and lower in July and June. The monthly LWU was systematically larger than LWD, and their averages during 2010–2021 were 135.2 and 98.0 W m−2, respectively, with a difference of 37.9%. From March 2010 to December 2021, monthly LWU and LWD increased by 0.11% and 0.21% per month.
For the time period September–April from March 2010 to December 2021, the LWD and LWU values were also investigated. Similar characteristics were observed as described above. Specifically, the monthly mean LWU and LWD during 2010–2021 (n = 66) were 107.1 and 86.2 W m−2, respectively; LWU was higher than LWD by 24.3%. During March 2010–December 2021, the monthly LWU and LWD increased by 0.10% and 0.21% per month.
The annual averages of LWD and LWU from March 2010 to December 2021 are reported in Figure 18. The annual mean LWU and LWD values during 2010–2021 are 0.482 and 0.348 MJ m−2, respectively; LWU is larger than LWD by 38.3%. The annual mean LWU and LWD increased by 1.23% and 2.58% per year, respectively.
As for the time period September–April from March 2010 to December 2021, the corresponding mean LWU and LWD were 0.384 and 0.306 MJ m−2, respectively, and LWU was higher than LWD by 25.4%. Annual mean LWU and LWD increased by 1.18% and 2.46% per year, respectively.
It is clear that the upward longwave radiation has a more significant impact on atmospheric warming through GLP absorptions than the downward longwave radiation.

4. Discussion

4.1. Further Application of the EMGSI

In this study, a previously developed EMGSI was further applied to investigate global solar radiation during 2018–2021 and 2006–2021, respectively. Based on the results and statistical metrics for hourly, daily, monthly, and annual global solar radiation, as well as albedos at the TOAsur, the empirical model showed good performance as that in 2006–2016. Therefore, it indicated that the EMGSI has a good ability to study G and other related issues, e.g., losses of G and albedos at the TOAsur, etc., over longer time periods, although it was built using short-term observational data, i.e., 2008–2011.
The contributions of GLA and GLS to GL during 2018–2021 and 2006–2021 were similar to those during 2006–2016, still revealing that the absorbing GLPs play the most significant roles in the Dome C region and are much more important than the scattering GLPs. For example, the annual ratio of GLA/G to GLS/G in 2006–2016 was about 20 (Section 3.3). It can be speculated that the absorbing GLPs mostly contribute to solar radiative transfer, energy utilization, and climate warming more than scattering GLPs; therefore, more attention should be paid to this point in the future.
According to the comprehensive analyses of solar radiation and its losses, meteorological parameters, and atmospheric substances during different time periods (Section 3.3 and Section 3.4), air temperature increased during 2006–2021, mainly caused by increases in absorption and scattering atmospheric GLPs, together with increases in the absorbing, scattering, and total losses. This mechanism was exhibited for the annual values during 2006–2021. In addition, the albedos at the TOAsur were also found to play vital roles in energy balance and should be considered in air temperature changes, especially the longwave radiation emitted from the ground. Thus, the effective longwave radiation absorbed by GLPs in the atmosphere is a necessary component heating the atmosphere. Based on the long-term changes on monthly and annual time scales during 2006–2021, this longwave radiation is another factor contributing to atmospheric heating, i.e., LWU increased during 2006–2021. Additionally, atmospheric longwave radiation also contributed to local warming, i.e., the corresponding LWD increased as well. In the longwave region, apart from the absorbers of greenhouse gases (GHGs), most volatile organic compounds (VOCs), as well as their CPR products, are also absorbers [52,53,54,55,56]; their total absorption should also be included in the consideration.
The surface albedo drop in 2006–2021 revealed that the surface around Dome C was gradually becoming absorptive, well associated with the increase in LWU over 2010–2021.
In brief, the shortwave and longwave radiation should be considered together in contributing to climate warming. Therefore, longwave radiation measurements are strongly recommended at radiation and weather stations around the world. The GLPs play a significant role in the transfer of shortwave and longwave radiation (UV, VIS, NIR (near-infrared), IR) and their distribution in the atmosphere and at the TOAsur. Thus, increases in absorption and scattering GLPs made significant contributions to regional climate warming through different mechanisms [51,52,53,54,55,56,57,58,59,60,61,62,63,64]. Global climate warming leads to enhanced emissions of biogenic volatile organic compounds (BVOCs) and fine particles that can be transported to the Antarctic [8,64,65]. BVOCs and their oxidation products influence and interact with G (especially in VIS, PAR, and UV). Therefore, there are multiple interactions in climate change–BVOC emissions–G system, which should be fully studied.
It should be noted that LWU is larger than LWD, and both LWU and LWD are lower than G (Section 3.4 and Section 3.6). Data covering time periods of several entire years are more useful and beneficial, as suggested in the analysis.

4.2. Further Confirmation of the Previous Mechanism and Suggestion to Reduce Climate Warming

Based on previous studies during 2018–2021 and 2006–2016, it was further confirmed here that the regional climate warming still existed during 2006–2021. The significant causes were increases in absorption and scattering GLPs, well associated with increases in GLA and GLS, which were the same as those in 2006–2016 [8] (Section 3.3 and Section 3.4). It is a fundamental mechanism for air temperature increase or climate warming in the Dome C region. A similar mechanism was also found for annual averages during 2018–2021 for situation a (Section 3.3 and Section 3.4). The longwave radiation (LWU and LWD) made additional contributions. Therefore, it is strongly recommended to reduce the emissions of GLPs from all sources, including GHGs and non-GHGs, liquids, and particles, as well as new productions from direct emissions of GLPs through CPRs to slow down regional climate warming at Dome C [8]. This basic principle is suitable for other regions of the world.
It should be emphasized that the above mechanism for air temperature changes with the absorption and scattering substances (concentration, composition, etc.), as well as the absorption and scattering losses; for example, the monthly and annual air temperature values increased or decreased during 2018–2021 for situations a, b, and c. They were caused by different changes in the absorption and scattering GLPs and their losses, and in G, especially by the different interactions between GLPs and global solar radiation (GLA, GLS, and G) (Section 3.3 and Section 3.4). Even in the driest and cleanest atmospheric environments on Earth at Dome C, the mechanism of air temperature change varies with time (months, years). Thus, it is natural and understandable that the reasons/mechanisms vary with sites around the globe for climate warming, considering the very complicated systems of the atmosphere, land, and vegetation. More examples are reported at different latitudes, e.g., Sodankylä in the Arctic (67.367 N, 26.630 E, 184 m), Ankara (39°58′21.7” N, 32°51′49.3” E, 890 m) in Türkiye, and Qianyanzhou (26°44′48” N, 115°04′13” E, 110.8 m) in China [5,6,17,52]. A clear non-linear relationship between T and S/G is found for 29 BSRN stations on Earth [53], indicating that T increases with increases in S/G under a relatively clear atmosphere (S/G < 0.5), while decreasing with increases in S/G under high GLP loads (S/G > 0.5). The major challenges to finding the causes of climate change remain, and more studies are, therefore, necessary in the future. The progress and some examples supporting the above mechanism include absorption of solar radiation by GLPs [54,55,56,57].
Additionally, the thermodynamic and dynamic processes contribute to climate warming in the Antarctic in different ways [7]. Speaking fundamentally, the original and driving energy force for the movements of the atmosphere and ocean originates from the Sun. Without its energy, these movements would disappear. Thus, it is a significant foundation to thoroughly study solar radiation, its transmittance through the atmosphere, and its use in the Sun–atmosphere–land–ocean system.

4.3. Particles Deposited at the Surface (SOA, Black Carbon, Etc.)

The surface type and structure are key driving factors influencing surface albedo. Therefore, the atmospheric GLPs deposited on the ground should be taken into consideration for energy balance at the surface. One of the most important GLPs is particles, including organic and inorganic aerosols, especially black carbon (BC), secondary organic aerosol (SOA), PM2.5, PM10, etc. Most of them are produced from biomass burning [58,59,60] and BVOC oxidation via OH radicals [61,62,63,64,65,66,67,68] and can be transported to Antarctica by atmospheric circulation [69]. In view of the surface gradually changing to absorptive during 2006–2021 (Section 3.5), it is suggested to study the absorbing aerosols, including species, physical and chemical properties, concentrations, etc., because they absorb and use UV, VIS, and NIR energy through different mechanisms [17,51,70]. The rapid increase in ice melting of the Antarctic ice sheet [71], particle deposition, and the decrease in surface albedo combined with the increase in LWU and climate warming over the Dome C and Antarctic regions confirmed regional warming since 2006 and revealed that a change in surface type affects climate warming. Therefore, the above processes associated with particle deposition, ice-sheet melting, surface albedo, and air temperature occurred synchronously and should be investigated as a system.
On a global scale, BC and other absorbing aerosols contribute >70% to the total aerosol annually [72]. In several typical sites, e.g., two polar sites and at low- and mid-latitudes, the absorbing GLPs play dominant roles (ranging from 61.96% to 95.51%) in total solar radiation attenuation in the atmosphere [8,52]. Therefore, more extensive studies should focus on the absorbing GLP components and their solar radiation absorption at regional and global scales from now on. Solar radiation (shortwave and longwave), atmospheric components in gases, liquids, and particles (including BC and other absorption and scattering aerosols), and land (type and texture) play vital and fundamental roles in solar energy usage, e.g., Refs. [73,74], and distributions between atmosphere and land with multiple interactions; therefore, further investigation is needed for Antarctica [75] and other parts of the world.

5. Conclusions

The empirical EMGSI model previously developed using observational data in 2008–2011 for Dome C was applied to study the global solar radiation over 2018–2021. Better simulations of G from hourly to annual scales in 2018–2021 and 2006–2021 were still performed as those obtained during 2006–2016. This EMGSI is a useful tool to study global solar radiation, its transmittance through the atmosphere, and albedos at the TOAsur. The absorption and scattering losses and their total loss in 2018–2021 were calculated, and the GLA made a predominant contribution to the total loss. The albedos at the TOAsur in 2006–2021 were calculated and compared with the satellite-retrieved data (CERES, Edition 4.2). The empirical model and satellite-calculated albedos showed similar variation patterns at the TOA, as well as at the surface in 2006–2021. Reasonable agreements were obtained. The annual albedos in JFND were 0.684 and 0.793 at the TOAsur for the model estimates, respectively, and 0.694 and 0.728 for the satellite-derived values, respectively, indicating that the snow surface has a larger albedo than that at the TOA. Generally, the CERES data displayed better performance for the albedos at the TOAsur. The absorbing loss plays a dominant role (about 95%) in the total loss in 2018–2021 and 2006–2021, indicating that the absorbing GLPs are much more significant than the scattering GLPs in solar radiation transmittance through the atmosphere.
Long-term variations in G and its loss, albedos at the TOAsur, and meteorological parameters during 2006–2021 were investigated. As an example, the annual Gobs and Gcal decreased by 0.65% and 0.76% per year, respectively. They corresponded to increases in S/G of 0.92% and E of 0.63% per year. Air temperature increased by 0.16% (0.99 °C) per year. The absorbing, scattering, and total losses increased by 0.29%, 0.79%, and 0.31% per year, respectively. In short, there was still climate warming at Dome C over 16 years, and the fundamental mechanism of the air temperature increase was the same as that in 2006–2016, i.e., (1) the increases in absorption and scattering atmospheric GLPs, associated with the increases in GLA, GLS, and GL in the atmosphere, and (2) the increases in longwave radiation (LWU and LWD). The annual mean LWU and LWD during 2010–2021 increased by 1.23% and 2.58% per year, respectively. They were caused by changes in the surface type and increases in all GLPs, including GHGs. However, the above mechanisms varied with the GLPs, time scales, and sites. During 2006–2021, the calculated and satellite-derived albedos in JFND at the TOAsur displayed clear monthly variations; their annual mean albedos decreased.
A recommendation is proposed to control direct GLP emissions from all kinds of sources and new GLP formations through CPRs in the atmosphere from the directly emitted GLPs, so as to slow down regional climate warming. The above actions should be taken regionally and globally. The measurements of longwave radiation are necessary at solar radiation and weather stations, so as to thoroughly understand the Sun–atmosphere (including GLPs)–surface (including anthroposphere and biosphere) and their role in climate change.

Author Contributions

Methodology, investigation, and writing, J.B.; data curation, X.W.; satellite data, X.Z.; data curation and revision, A.L. and M.B. All authors have read and agreed to the published version of the manuscript.

Funding

This research was supported by the National Natural Science Foundation of China (Grant NO. 42261144751) and Dragon 5 projects (ID 59013).

Data Availability Statement

The Dome C data at minute resolution can be found at https://doi.org/10.1594/PANGAEA.935421, accessed on 15 May 2025.

Acknowledgments

Meteorological data and information were obtained from the IPEV/PNRA Project ‘Routine Meteorological Observation at Station Concordia’—http://www.climantartide.it (accessed on 15 May 2025). Satellite albedos can be accessed via the website https://ceres.larc.nasa.gov/products.php?product=EBAF-Product (accessed on 13 November 2025). We acknowledge the support of the Italian Polar Program (PNRA) through the AIR-FLOC PNRA OSS-04 project, as well as the French Polar Institute (IPEV), for their assistance in supporting the solar radiation measurement activities. The authors thank HongTao. Liu and YiMei Wu from the Institute of Atmospheric Physics, Chinese Academy of Sciences (IAP, CAS), for their assistance. The authors give special thanks to anonymous reviewers for their beneficial comments. The authors also give special thanks to Angelo Lupi, Maurizio Busetto, Vitale Vito, Christian Lanconelli, and Amelie Drieme for providing solar radiation data and technology for measurements at Dome C.

Conflicts of Interest

The authors declare no conflicts of interest.

References

  1. Vaughan, D.; Marshall, G.J.; Connolley, W.M.; Parkinson, C.; Mulvaney, R.; Hodgson, D.A.; King, J.C.; Pudsey, C.J.; Turner, J. Recent Rapid Regional Climate Warming on the Antarctic Peninsula. Clim. Change 2003, 60, 243–274. [Google Scholar]
  2. Turner, J.; Colwell, S.R.; Marshall, G.J.; Lachlan-Cope, T.A.; Carleton, A.M.; Jones, P.D.; Lagun, V.; Reid, P.A.; Iagovkina, S.V. Antarctic climate change during the last 50 years. Int. J. Climatol. 2005, 25, 279–294. [Google Scholar] [CrossRef]
  3. Vaughan, D.G.; Marshall, G.J.; Connolley, W.M.; King, J.C.; Mulvaney, R. Climate Change: Devil in the Detail. Science 2001, 293, 1777–1779. [Google Scholar] [CrossRef] [PubMed]
  4. Vaughan, D.G. British Antarctic Survey; Natural Environment Research Council, Madingley Road, Cambridge CB3 0ET, United Kingdom. 2007. Available online: http://www.homepages.ed.ac.uk/shs/Climatechange/Data%20sources/antarctic_peninsula.php.htm (accessed on 15 May 2025).
  5. Bai, J.; Heikkilä, A.; Zong, X. Long-Term Variations of Global Solar Radiation and Atmospheric Constituents at Sodankylä in the Arctic. Atmosphere 2021, 12, 749. [Google Scholar] [CrossRef]
  6. Bai, J.H.; Zong, X.M.; Ma, Y.M.; Wang, B.B.; Zhao, C.F.; Yang, Y.K.; Guang, J.; Cong, Z.Y.; Li, K.L.; Song, T. Long-term variations in global solar radiation and its interaction with atmospheric substances at Qomolangma. Int. J. Environ. Res. Public Health 2022, 19, 8906. [Google Scholar] [CrossRef]
  7. Wang, S.; Li, G.C.; Zhang, Z.H.; Zhang, W.Q.; Wang, X.; Chen, D.L.; Chen, W.; Ding, M.H. Recent warming trends in Antarctica revealed by multiple reanalysis. Adv. Clim. Change Res. 2025, 16, 447–459. [Google Scholar] [CrossRef]
  8. Bai, J.; Zong, X.; Lanconelli, C.; Lupi, A.; Driemel, A.; Vitale, V.; Li, K.; Song, T. Long-Term Variations of Global Solar Radiation and Its Potential Effects at Dome C (Antarctica). Int. J. Environ. Res. Public Health 2022, 19, 3084. [Google Scholar] [CrossRef]
  9. Solanki, S.K. Solar variability and climate change: Is there a link. Astron. Geophys. 2002, 43, 5.9–5.13. [Google Scholar] [CrossRef]
  10. Elminir, H.K. Relative influence of weather conditions and air pollutants on solar radiation—Part 2: Modification of solar radiation over urban and rural sites. Meteorol. Atmos. Phys. 2007, 96, 257–264. [Google Scholar] [CrossRef]
  11. Lean, J.; Rind, D. Climate forcing by changing solar radiation. J. Clim. 1998, 11, 3069–3094. [Google Scholar] [CrossRef]
  12. Andreae, M.O.; Ramanathan, V. Climate’s Dark Forcings. Sciences 2013, 340, 280–281. [Google Scholar] [CrossRef]
  13. García, R.D.; Cuevas, E.; García, O.E.; Cachorro, V.E.; Pallé, P.; Bustos, J.J.; Romero-Campos, P.M.; de Frutos, A.M. Reconstruction of global solar radiation time series from 1933 to 2013 at the Izaña Atmospheric Observatory. Atmos. Meas. Tech. 2014, 7, 3139–3150. [Google Scholar] [CrossRef]
  14. Rosenfeld, D.; Sherwood, S.; Wood, R.; Donner, L. Climate Effects of Aerosol-Cloud Interactions. Sciences 2014, 343, 379–380. [Google Scholar] [CrossRef]
  15. Williamson, C.E.; Zepp, R.G.; Lucas, R.M.; Madronich, S.; Austin, A.T.; Ballaré, C.L.; Norval, M.; Sulzberger, B.; Bais, A.F.; McKenzie, R.L.; et al. Solar ultraviolet radiation in a changing climate. Nat. Clim. Change 2014, 4, 434–441. [Google Scholar] [CrossRef]
  16. Calabrò, E.; Magazù, S. Correlation between Increases of the Annual Global Solar Radiation and the Ground Albedo Solar Radiation due to Desertification-A Possible Factor Contributing to Climatic Change. Climate 2016, 4, 64. [Google Scholar] [CrossRef]
  17. Bai, J.H.; Zong, X.M. Global solar radiation transfer and its loss in the atmosphere. Appl. Sci. 2021, 11, 2651. [Google Scholar] [CrossRef]
  18. Glower, J.; McGulloch, J.S.G. The empirical relation between solar radiation and hours of sunshine. Q. J. R. Meteorol. Soc. 1958, 84, 172–175. [Google Scholar] [PubMed]
  19. Zhang, J.; Zhao, L.; Deng, S.; Xu, W.; Zhang, Y. A critical review of the models used to estimate solar radiation. Renew. Sustain. Energy Rev. 2017, 70, 314–329. [Google Scholar] [CrossRef]
  20. Gueymard, C.A. Critical analysis and performance assessment of clear sky solar irradiance models using theoretical and measured data. Sol. Energy 1993, 51, 121–138. [Google Scholar] [CrossRef]
  21. Gueymard, C.A. Clear-sky solar irradiance predictions for large-scale applications using 18 radiative models: Improved validation methodology and detailed performance analysis. Sol. Energy 2012, 86, 2145–2169. [Google Scholar] [CrossRef]
  22. Badescu, V.; Gueymard, C.A.; Cheval, S.; Oprea, C.; Baciu, M.; Dumitrescu, A.; Iacobescu, F.; Milos, I.; Rada, C. Accuracy analysis for fifty-four clear-sky solar radiation models using routine hourly global irradiance measurements in Romania. Renew. Energy 2013, 55, 85–103. [Google Scholar] [CrossRef]
  23. Bayrakc, H.C.; Demircan, C.; Keceba, A. The development of empirical models for estimating global solar radiation on horizontal surface: A case study. Renew. Sustain. Energy Rev. 2018, 81, 2771–2782. [Google Scholar] [CrossRef]
  24. Antonanzas-Torres, F.; Urraca, R.; Polo, J.; Perpinan-Lamigueiro, O.; Escobar, R. Clear sky solar irradiance models: A review of seventy models. Renew. Sustain. Energy Rev. 2019, 107, 374–387. [Google Scholar] [CrossRef]
  25. Zang, H.; Cheng, L.; Ding, T.; Cheung, K.W.; Wang, M.; Wei, Z.; Sun, G. Estimation and validation of daily global solar radiation by day of the year-based models for different climates in China. Renew. Energy 2019, 135, 984–1003. [Google Scholar] [CrossRef]
  26. Psiloglou, B.; Kambezidis, H.; Kaskaoutis, D.; Karagiannis, D.; Polo, J. Comparison between MRM simulations, CAMS and PVGIS databases with measured solar radiation components at the Methoni station, Greece. Renew. Energy 2020, 146, 1372–1391. [Google Scholar] [CrossRef]
  27. Ohmura, A.; Dutton, E.G.; Forgan, B.; Frohlich, C.; Gilgen, H.; Hegner, H.; Heimo, A.; König-Langlo, G.; McArthur, B.; Muller, G.; et al. Baseline Surface Radiation Network (BSRN/WCRP): New Precision Radiometry for Climate Research. Bull. Amer. Meteor. Soc. 1998, 79, 2115–2136. [Google Scholar] [CrossRef]
  28. Driemel, A.; Augustine, J.; Behrens, K.; Colle, S.; Cox, C.; Cuevas-Agulló, E.; Denn, F.M.; Duprat, T.; Fukuda, M.; Grobe, H.; et al. Baseline Surface Radiation Network (BSRN): Structure and data description (1992–2017). Earth Syst. Sci. Data 2018, 10, 1491–1501. [Google Scholar] [CrossRef]
  29. Lupi, A.; Lanconelli, C.; Vitale, V. Basic and Other Measurements of Radiation at Concordia Station (2006-01 et Seq.); Institute of Atmospheric Sciences and Climate of the Italian National Research Council: Bologna, Italy, 2021. [Google Scholar] [CrossRef]
  30. Lanconelli, C.; Busetto, M.; Dutton, E.G.; König-Langlo, G.K.; Maturilli, M.; Sieger, R.; Vitale, V.; Yamanouchi, T. Polar baseline surface radiation measurements during the international polar year 2007–2009. Earth Syst. Sci. Data 2011, 3, 1–8. [Google Scholar] [CrossRef]
  31. Busetto, M.; Lanconelli, C.; Mazzola, M.; Lupi, A.; Petkov, B.; Vitale, V.; Tomasi, C.; Grigioni, P.; Pellegrini, A. Parameterization of clear sky effective emissivity under surface-based temperature inversion at Dome C and South Pole, Antarctica. Antarct. Sci. 2013, 25, 697–710. [Google Scholar] [CrossRef]
  32. Grigioni, P.; Antonelli, A.; Camporeale, G.; Ciardini, V.; De Silvestri, L.; Dolci, S.; Iaccarino, A.; Proposito, M.; Scarchilli, C. Radiosonde and AWS Data from Italian Antarctic Meteo-Climatological Observatory During Southern Hemisphere YOPP Special Observing Period (16-Nov-2018 15-Feb-2019); Institute of Atmospheric Sciences and Climate of the Italian National Research Council: Bologna, Italy, 2019. [Google Scholar] [CrossRef]
  33. Petkov, B.H.; Láska, K.; Vitale, V.; Lanconelli, C.; Lupi, A.; Mazzola, M.; Budíková, M. Variability in solar irradiance observed at two contrasting Antarctic sites. Atmos. Res. 2016, 172, 126–135. [Google Scholar] [CrossRef]
  34. Sixa, D.; Filya, M.; Alvainb, S.; Henryc, P.; Benoist, J. Surface characterisation of the Dome Concordia area (Antarctica) as a potential satellite calibration site, using Spot 4 Vegetation instrument. Remote Sens. Environ. 2004, 89, 83–94. [Google Scholar] [CrossRef]
  35. Candidi, M.; Lori, A. Status of the Antarctic Base at Dome C. Mem. S. A. It. 2003, 74, 29–36. [Google Scholar]
  36. Argentini, S.; Pietroni, I.; Mastrantonio, G.; Viola, A.P.; Dargaud, G.; Petenko, I. Observations of near surface wind speed, temperature and radiative budget at Dome C, Antarctic Plateau during 2005. Antarct. Sci. 2014, 26, 104–112. [Google Scholar] [CrossRef]
  37. Sakerin, S.M.; Vlasov, N.I.; Kabanov, D.M.; Lubo-Lesnichenko, K.E.; Prakhov, A.N.; Radionov, V.F.; Turchinovich, Y.S.; Holben, B.N.; Smirnov, A. Results of spectral measurements of atmospheric aerosol optical depth with sun photometers in the 58th Russian Antarctic Expedition. Atmos. Ocean. Opt. 2014, 27, 393–402. [Google Scholar] [CrossRef]
  38. Yang, Y.K.; Zhao, C.F.; Wang, Q.; Cong, Z.Y.; Yang, X.C.; Fan, H. Aerosol characteristics at the three poles of the Earth as characterized by Cloud-Aerosol Lidar and Infrared Pathfinder Satellite Observations. Atmos. Chem. Phys. 2021, 21, 4849–4868. [Google Scholar] [CrossRef]
  39. Tomasi, C.; Vitale, V.; Lupi, A.; Di Carmine, C.; Campanelli, M.; Herber, A.; Treffeisen, R.; Stone, R.S.; Andrews, E.; Sharma, S.; et al. Aerosols in polar regions: A historical overview based on optical depth and in situ observations. J. Geophys. Res. 2007, 112, D16205. [Google Scholar] [CrossRef]
  40. Bilbao, J.; Mateos, D.; De Miguel, A. Analysis and cloudiness influence on UV total irradiation. J. Climatol. 2011, 31, 451–460. [Google Scholar]
  41. Myers, D.R. Solar radiation modeling and measurements for renewable energy applications data and model quality. Energy 2005, 30, 1517–1531. [Google Scholar] [CrossRef]
  42. Post, E.; Alley, R.B.; Christensen, T.R.; Macias-Fauria, M.; Forbes, B.; Gooseff, M.N.; Iler, A.; Kerby, J.T.; Laidre, K.L.; Mann, M.E.; et al. The polar regions in a 2 °C warmer world. Sci. Adv. 2019, 5, eaaw9883. [Google Scholar] [CrossRef]
  43. Dickinson, R.E. Land surface processes and climate surface albedos and energy balance. Adv. Geophys. 1983, 25, 305–353. [Google Scholar]
  44. Li, Z.Q.; Garand, L. Estimation of Surface Albedo from Surface-A Parameterization for Global Application. J. Geophys. Res. 1994, 99, 8335–8350. [Google Scholar]
  45. Hudson, S.R.; Warren, S.G.; Brandt, R.E.; Grenfell, T.C.; Six, D. Spectral bidirectional reflectance of Antarctic snow: Measurements and parameterization. J. Geophys. Res. 2006, 111, D18106. [Google Scholar] [CrossRef]
  46. Psiloglou, B.E.; Kambezidis, H.D. Estimation of the ground albedo for the Athens area, Greece. J. Atmos. Sol.-Terr. Phys. 2009, 71, 943–954. [Google Scholar] [CrossRef]
  47. Loeb, N.G.; Doelling, D.R.; Wang, H.; Su, W.; Nguyen, C.; Corbett, J.G.; Liang, L.; Mitrescu, C.; Rose, F.G.; Kato, S. Clouds and the Earth’s Radiant Energy System (CERES) Energy Balanced and Filled (EBAF) Top-of-Atmosphere (TOA) Edition 4.0 Data Product. J. Clim. 2018, 31, 895–918. [Google Scholar] [CrossRef]
  48. Kato, S.; Rose, F.G.; Rutan, D.A.; Thorsen, T.J.; Loeb, N.G.; Doelling, D.R.; Huang, X.; Smith, W.L.; Su, W.; Ham, S.H. Surface Irradiances of Edition 4.0 Clouds and the Earth’s Radiant Energy System (CERES) Energy Balanced and Filled (EBAF) Data Product. J. Clim. 2018, 31, 4501–4527. [Google Scholar] [CrossRef]
  49. Sun, Y.J.; Wang, Z.H.; Qin, Q.M.; Han, G.H.; Ren, H.Z.; Huang, J.F. Retrieval of surface albedo based on GF-4 geostationary satellite image data. J. Remote Sens. 2018, 22, 220–233. [Google Scholar]
  50. Bai, J.H. A calibration method of solar radiometers. Atmos. Pollut. Res. 2019, 10, 1365–1373. [Google Scholar] [CrossRef]
  51. Bai, J.H. Photosynthetically active radiation loss in the atmosphere in North China. Atmos. Pollut. Res. 2013, 4, 411–419. [Google Scholar] [CrossRef]
  52. Bai, J.H.; Wan, X.W.; Arslan, E.; Zong, X.M. Global solar radiation and its interactions with atmospheric substances, and their effects on air temperature change in Ankara Province. Climate 2024, 12, 35. [Google Scholar] [CrossRef]
  53. Bai, J.; Wan, X.; Lupi, A.; Zong, X.; Arslan, E. Mitigating Climate Warming: Mechanisms and Actions. Atmosphere 2025, 16, 1170. [Google Scholar] [CrossRef]
  54. Vaida, V.; Daniel, J.S.; Kjaergaard, H.G.; Goss, L.M.; Tuck, A.F. Atmospheric absorption of near infrared and visible solar radiation by the hydrogen bonded water dimer. Q. J. R. Meteorol. Soc. 2001, 127, 1627–1643. [Google Scholar] [CrossRef]
  55. Lu, Z.F.; Streets, D.G.; Winijkul, E.; Yan, F.; Chen, Y.J.; Bond, T.C.; Feng, Y.; Dubey, M.K.; Liu, S.; Pinto, J.P.; et al. Carmichael. Light Absorption Properties and Radiative Effects of Primary Organic Aerosol Emissions. Environ. Sci. Technol. 2015, 49, 4868–4877. [Google Scholar] [CrossRef] [PubMed]
  56. Xu, L.; Lin, G.; Liu, X.; Wu, C.; Wu, Y.; Lou, S. Constraining light absorption of brown carbon in China and implications for aerosol direct radiative effect. Geophys. Res. Lett. 2024, 51, e2024GL109861. [Google Scholar] [CrossRef]
  57. Li, Y.M.; Fu, T.M.; Yu, J.Z.; Zhang, A.X.; Yu, X.; Ye, J.H.; Zhu, L.; Shen, H.Z.; Wang, C.; Yang, X.; et al. Nitrogen dominates global atmospheric organic aerosol absorption. Science 2025, 387, 989–995. [Google Scholar] [CrossRef]
  58. Crutzen, P.J.; Heidt, L.E.; Krasnec, J.P.; Pollock, W.H.; Seiler, W. Biomass burning as a source of atmospheric gases CO, H2, N2O, NO, CH3Cl and COS. Nature 1979, 282, 253–256. [Google Scholar] [CrossRef]
  59. Andreae, M.O. Biomass burning: Its history, use, and distribution and its impact. In Global Biomass Burning: Atmospheric, Climatic and Biospheric Implications; Levine, J.S., Ed.; MIT Press: Cambridge, UK, 1991. [Google Scholar]
  60. Andreae, M.O.; Fishman, J.; Garstang, M.; Goldammer, J.G.; Justice, C.O.; Levine, J.S.; Scholes, R.J.; Stocks, B.J.; Thompson, A.M.; van Wilgen, B. Biomass Burning in the Global Environment: First Results from the IGAC/BIBEX Field Campaign STARE/TRACE-A/SAFARI-92. In Global Atmospheric-Biospheric Chemistry; Prinn, R.G., Ed.; Springer: Boston, MA, USA, 1994; pp. 83–101. [Google Scholar]
  61. Andreae, M.O.; Metlet, P. Emission of trace gases and aerosols from biomass burning. Glob. Biogeochem. Cycles 2001, 15, 955–966. [Google Scholar] [CrossRef]
  62. Claeys, M.; Graham, B.; Vas, G.; Wang, W.; Vermeylen, R.; Pashynska, V.; Cafmeyer, J.; Guyon, P.; Andreae, M.O.; Artaxo, P.; et al. Formation of Secondary Organic Aerosols Through Photooxidation of Isoprene. Science 2004, 303, 1173–1176. [Google Scholar] [CrossRef] [PubMed]
  63. Carlton, A.G.; Wiedinmyer, C.; Kroll, J.H. A review of secondary organic aerosol (SOA) formation from isoprene. Atmos. Chem. Phys. 2009, 9, 4987–5005. [Google Scholar] [CrossRef]
  64. Riccobono, F.; Schobesberger, S.; Scott, C.E.; Dommen, J.; Ortega, I.K.; Rondo, L.; Almeida, J.; Amorim, A.; Bianchi, F.; Breitenlechner, M.; et al. Oxidation Products of Biogenic Emissions Contribute to Nucleation of Atmospheric Particles. Science 2014, 344, 717–721. [Google Scholar] [CrossRef]
  65. Jokinen, T.; Berndt, T.; Makkonen, R.; Kerminen, V.M.; Junninen, H.; Paasonen, P.; Stratmann, F.; Herrmann, H.; Guenther, A.B.; Worsnop, D.R.; et al. Production of extremely low volatile organic compounds from biogenic emissions Measured yields and atmospheric implications. Proc. Natl. Acad. Sci. USA 2015, 112, 7123–7128. [Google Scholar] [CrossRef]
  66. Bai, J.H.; Guenther, A.; Turnipseed, A.; Duhl, T.; Greenberg, J. Seasonal and interannual variations in whole-ecosystem BVOC emissions from a subtropical plantation in China. Atmos. Environ. 2017, 161, 176–190. [Google Scholar] [CrossRef]
  67. Santos, F.; Longo, K.; Guenther, A.; Kim, S.W.; Gu, D.S.; Oram, D.; Forster, G.; Lee, J.; Hopkins, J.; Brito, J.; et al. Biomass burning emission disturbances of isoprene oxidation. Atmos. Chem. Phys. 2018, 18, 12715–12734. [Google Scholar] [CrossRef]
  68. Chu, B.; Kerminen, V.M.; Bianchi, F.; Yan, C.; Petäjä, T.; Kulmala, M. Atmospheric new particle formation in China. Atmos. Chem. Phys. 2019, 19, 115–138. [Google Scholar] [CrossRef]
  69. Virkkula, A.; Grythe, H.; Backman, J.; Petaja, T.; Busetto, M.; Lanconelli, C.; Lupi, A.; Becagli, S.; Traversi, R.; Severi, M.; et al. Aerosol optical properties calculated from size distributions, filter samples and absorption photometer data at Dome C, Antarctica and their relationships between seasonal cycles of sources. Atmos. Chem. Phys. Discuss. 2022, 22, 5033–5069. [Google Scholar] [CrossRef]
  70. Bai, J.H. UV extinction in the atmosphere and its spatial variation in North China. Atmos. Environ. 2017, 154, 318–330. [Google Scholar] [CrossRef]
  71. Song, P.; Scholz, P.; Knorr, G.; Sidorenko, D.; Timmermann, R.; Lohmann, G. Regional conditions determine thresholds of accelerated Antarctic basal melt in climate projection. Nat. Clim. Change 2025, 15, 521–527. [Google Scholar] [CrossRef]
  72. Ansari, K.; Ramachandran, S. Enhancing accuracy in identifying absorbing aerosol types and their radiative impacts. NPJ Clim. Atmos. Sci. 2025, 8, 351. [Google Scholar] [CrossRef]
  73. Farahat, A.; Kambezidis, H.D.; Kampezidou, S.I. Effect of the ground albedo on the estimation of solar radiation on tilted flat-plate surface: The case of Saudi Arabia. Energies 2023, 16, 7886. [Google Scholar] [CrossRef]
  74. Kambezidis, H.D.; Kavadias, K.A.; Farahat, A.M. Solar energy received on flat-plate collectors fixed on 2-axis trackers: Effect of ground albedo and clouds. Energies 2024, 17, 3721. [Google Scholar] [CrossRef]
  75. Cavaliere, A.; Frangipani, C.; Baracchi, D.; Busetto, M.; Lupi, A.; Mazzola, M.; Pulimeno, S.; Vitale, V.; Shullani, D. Surface Broadband Radiation Data from a Bipolar Perspective: Assessing Climate Change Through Machine Learning. Climate 2025, 13, 147. [Google Scholar] [CrossRef]
Figure 1. Scatter plot of calculated versus observed hourly global solar exposure in 2018–2021 at Dome C under all-sky conditions (n = 13,634).
Climate 14 00043 g001
Figure 2. Monthly global solar exposures calculated and observed (G), observed diffuse exposure (S), and diffuse fraction (S/G) at Dome C under all-sky conditions. The error bars show the standard deviations of the observed and calculated values (1σ, black and bold for the observed values).
Climate 14 00043 g002
Figure 3. Monthly air temperature (T), water vapor pressure (E), and S/G at Dome C under all-sky conditions.
Climate 14 00043 g003
Figure 4. Annual air temperature (T), water vapor pressure (E), and S/G at Dome C under all-sky conditions.
Climate 14 00043 g004
Figure 5. Annual global solar exposure calculated and observed (G), observed diffuse solar exposure (S), and scattering factor (S/G) at Dome C under all-sky conditions. The error bars show the standard deviations of the observed and calculated values (1σ, black and bold for the observed G).
Climate 14 00043 g005
Figure 6. Monthly losses of global solar exposure (GLA, GLS) caused by absorption and scattering substances and total loss (GL) in the atmosphere under all-sky conditions.
Climate 14 00043 g006
Figure 7. Annual losses of global solar exposure (GLA, GLS) caused by absorption and scattering substances and total loss (GL = GLA + GLS) at Dome C under all-sky conditions.
Climate 14 00043 g007
Figure 8. Contributions (RLA, RLS) of monthly absorption and scattering losses to the monthly total loss at Dome C under all-sky conditions.
Climate 14 00043 g008
Figure 9. Monthly global solar exposures calculated and observed (G), observed diffuse exposure (S), and scattering factor (S/G) at Dome C under all-sky conditions.
Climate 14 00043 g009
Figure 10. Monthly air temperature (T), relative humidity (RH), and water vapor pressure (E) at Dome C under all-sky conditions.
Climate 14 00043 g010
Figure 11. Monthly losses of global solar exposure (GLA, GLS) caused by absorption and scattering substances and total loss (GL) in the atmosphere at Dome C under all-sky conditions.
Climate 14 00043 g011
Figure 12. Same as Figure 9, but for annual averages.
Climate 14 00043 g012
Figure 13. Same as Figure 10, but for annual averages.
Climate 14 00043 g013
Figure 14. Same as Figure 11, but for annual averages.
Climate 14 00043 g014
Figure 15. Monthly mean albedos calculated and satellite retrieved at the TOA and the surface under all sky conditions at Dome C.
Climate 14 00043 g015
Figure 16. Annual calculated and satellite-retrieved albedos in JFND at the TOAsur at Dome C under all-sky conditions.
Climate 14 00043 g016
Figure 17. Monthly downward and upward longwave radiation (LWD, LWU) expressed as irradiance and exposure ((top) and (bottom)) at Dome C from March 2010 to December 2021 under all-sky conditions.
Climate 14 00043 g017aClimate 14 00043 g017b
Figure 18. Annual downward and upward longwave exposures (LWD, LWU) at Dome C from 2010 to 2021 under all-sky conditions.
Climate 14 00043 g018
Table 1. The coefficients of the empirical model for global solar exposure (Equation (1)), developed previously using observations at Dome C during 2008–2011, together with statistical metrics, i.e., coefficient of determination (R2). The average of the absolute relative bias (δavg, %), NMSE (normalized mean square error), standard deviations of calculated and observed global solar exposure (σcal and σobs, respectively), the mean bias errors (MAD, in MJ m−2 and %), and the root mean square errors (RMSE, MJ m−2 and %) (n = 13,634) were calculated using the empirical model.
A1A2A0R2δavg NMSEσcalσobsMADRMSE
(MJ m−2)(%)(MJ m−2)(%)
5.610.75−1.100.9927.500.020.890.810.1219.940.15212.46
Table 2. Change rate (%) of the monthly mean solar radiation and other parameters (air temperature T and its change ΔT (°C), relative humidity RH (%), water vapor pressure E (hPa)) during September–April (situation a) and October–March (situation b) over 2018–2021, and January 2018–December 2021 (situation c). Change rate of each parameter was computed using c1 × 100/c0, and a linear relation between each variable (y) and time (month, x) was determined as y = c1x + c0.
SituationGobsGcalSTΔT (°C)RHES/GGLAGLSGL
a−0.37−0.450.10−0.10−1.06−0.050.330.630.010.390.03
b−0.59−0.57−0.780.787.51−0.490.31−0.38−0.67−0.44−0.66
c0.450.530.130.161.120.101.44−0.04−0.14−0.13−0.14
Table 3. Same as Table 2, but for annual averages.
SituationGobsGcalSTΔT (°C)RHES/GGLAGLSGL
a−4.12−4.55−0.60−0.65−0.660.10−0.588.391.387.031.62
b−2.11−2.10−0.781.011.251.253.105.670.554.800.73
c0.110.522.740.460.320.565.451.96−0.201.01−0.14
Table 4. Change rates (%) of monthly values of observed and calculated G (Gobs, Gcal), absorbing, scattering, and total losses (GLA, GLS, GL) of global solar exposure due to GLPs, air temperature (T), water vapor pressure (E), and scattering factor (S/G) at Dome C under all-sky conditions over three time periods—September–April, October–March, and November–February—during 2006–2021.
SituationGobsGcalGLAGLSGLT (% and °C)ES/G
Sep.–Apr.−0.04−0.05−0.010.07−0.0020.01 (0.10 °C)0.120.10
Oct.–Mar.−0.02−0.05−0.010.02−0.010.01 (0.64 °C)0.090.07
Nov.–Feb.−0.02−0.04−0.0020.101−0.0020.02 (2.03 °C)0.130.07
Table 5. As Table 4, but for mean annual change rate (%) during 2006–2021.
SituationGobsGcalGLAGLSGLT (% and °C)ES/G
Sep.–Apr.−0.65−0.760.290.790.310.16 (0.99 °C)0.630.92
Oct.–Mar.−0.41−0.580.220.760.240.07 (0.34 °C)1.340.29
Nov.–Feb.−0.35−0.530.210.980.240.25 (1.39 °C)1.591.07
Table 6. As Table 5, but for annual averages.
SituationGobsGLAGLSGLT (°C)ES/G
Sep.–Apr.1.313.850.194.04−41.650.1350.315
Oct.–Mar.1.293.840.184.03−41.670.1240.303
Nov.–Feb.1.443.700.183.87−36.040.1760.293
Disclaimer/Publisher’s Note: The statements, opinions and data contained in all publications are solely those of the individual author(s) and contributor(s) and not of MDPI and/or the editor(s). MDPI and/or the editor(s) disclaim responsibility for any injury to people or property resulting from any ideas, methods, instructions or products referred to in the content.