


Highlights
What are the main findings?
- Strong warming at Split–Marjan is accompanied by more frequent warm extremes and heatwaves.
- Precipitation change is characterised by intensity redistribution rather than uniform intensification of extremes.
What are the implications of the main findings?
- Warm–dry conditions are becoming more frequent under the warming coastal Mediterranean climate.
- Heavy hourly precipitation at Split–Marjan shows nonlinear temperature scaling, with a breakpoint near 21 °C.
Abstract
This station-scale study examines contrasting temperature and precipitation responses to climate change at Split–Marjan, Croatia, using daily observations (1948–2025) and hourly observations (1996–2025). Long-term trends, change points, temperature and precipitation extremes, compound events and conditional precipitation–temperature relationships were analysed. Annual mean air temperature increased by 0.581 °C decade−1 (p < 0.001) during 1996–2025, accompanied by increasingly frequent warm extremes and heatwaves. In contrast, annual precipitation totals showed no significant long-term trend, although daily and hourly observations revealed changes in precipitation frequency and intensity. Mean wet-hour precipitation intensity increased, while the relative contribution of the most intense wet hours decreased. Annual maximum precipitation accumulated over durations of 1–24 h exhibited no statistically significant trends. Compound conditions showed a pronounced increase in warm–dry days (+11.36 days decade−1, p < 0.001) and a decrease in cold–dry days (−10.00 days decade−1, p < 0.001). Heavy hourly precipitation exhibited nonlinear temperature scaling, with a dataset-specific empirical breakpoint at approximately 21 °C, below which conditional intensity increased with temperature and above which it decreased. Overall, the findings demonstrate pronounced warming accompanied by heterogeneous precipitation responses, emphasizing changes in the thermal characteristics of dry conditions and providing an observational basis for future investigations of climate-related impacts on coastal water resources.
1. Introduction
Climate change is one of the most clearly documented features of the contemporary climate system. Multiple independent observations demonstrate that the climate has undergone substantial changes since the latter half of the twentieth century [1,2]. The increase in global mean surface temperature has been accompanied by widespread changes in the frequency and intensity of temperature extremes, modifications of precipitation patterns, shifts in seasonality and changes in the occurrence of droughts and heavy precipitation events [1,2,3]. These changes directly affect the hydrological cycle by modifying evapotranspiration, soil moisture, runoff, groundwater recharge and the frequency and magnitude of hydrological extremes, with important consequences for freshwater availability, water security and water-resource management [3,4,5].
The Mediterranean is recognized as a climate-change hotspot because pronounced warming coincides with high hydroclimatic variability, recurrent drought and strong sensitivity of regional water resources to changes in precipitation [6,7,8]. This sensitivity is particularly relevant in the extensive karst regions surrounding the Mediterranean, where groundwater recharge is strongly controlled by the amount, seasonality and temporal concentration of precipitation. Changes in the frequency and intensity of rainfall, the duration of dry periods and atmospheric evaporative demand may alter karst recharge and spring-flow dynamics [9,10,11]. Observed and projected changes in Mediterranean climate include increasing air temperature, more frequent and persistent warm extremes, declining precipitation in parts of the region, longer dry spells and potentially stronger short-duration precipitation extremes even where annual precipitation decreases or remains highly variable [1,10]. Recent regional studies further demonstrate that these changes are not spatially uniform. Soldini and Darvini [12], analysing extreme-temperature indices in the Marche region of central Italy, found increasing intensity and frequency of extreme heat together with decreasing cold extremes. In contrast to this coherent temperature response, precipitation shows a more complex temporal structure. Varlas et al. [13], using ERA5 data for Greece and surrounding areas from 1950 to 2020, found pronounced spatial and inter-decadal variability, with declining trends particularly evident in winter over parts of western and eastern Greece and weaker or non-significant trends during other seasons. More recently, Retalis et al. [14], using ERA5-Land and E-OBS data for 1981–2020, examined precipitation according to intensity classes and climatic regions, further indicating that precipitation changes depend on location, precipitation intensity and the observational or reanalysis dataset considered. These contrasting responses are particularly important along Mediterranean coasts, where maritime influences moderate temperature variability, while complex coastal topography and convective processes can produce intense precipitation over short timescales that may cause karst flash floods [15,16,17].
Air temperature and precipitation are complementary indicators of climate change. Temperature provides a comparatively coherent signal of atmospheric warming, while precipitation exhibits stronger spatial and temporal variability. Consequently, changes in annual precipitation alone may provide an incomplete description of hydroclimatic change. A station may experience little or no trend in annual precipitation while simultaneously undergoing changes in the number of wet days, mean intensity on wet days, duration of dry periods, or the occurrence of high-intensity events [13,14]. Joint examination of temperature and precipitation can additionally reveal compound changes, such as an increasing frequency of warm and dry conditions, which may have greater environmental relevance than changes in either variable considered separately [18].
Long-term climatic series and various meteorological and hydrological indices are commonly analysed using non-parametric methods that are robust to non-normality and outliers. For example, the Mann–Kendall test is widely used to detect monotonic trends, while Sen’s slope provides a resistant estimate of trend magnitude [19,20,21]. Abrupt changes are examined with the Pettitt test [22]. Climate-extreme analyses often use percentile- and threshold-based indices derived from the Expert Team on Climate Change Detection and Indices (ETCCDI) framework, including warm-day frequencies, wet-day intensity, maximum daily precipitation and consecutive dry days [23,24]. Such indices allow temporal changes in the distribution and persistence of temperature and precipitation to be assessed, and their usefulness has been demonstrated in recent Mediterranean applications [12]. At sub-daily scales, analyses combining hourly precipitation with concurrent temperature provide information that cannot be obtained solely from trends in annual or daily temperature and precipitation indices [25,26]. In this context, the relationship between precipitation intensity and air temperature obtained by scaling provides an added perspective on how precipitation processes respond to a warmer atmosphere [27]. Precipitation–temperature scaling including mean and extreme values has been examined to investigate changes in extreme rainfall, understand regional climate responses, evaluate climate model performance and assess future flood risk. For example, Lenderink et al. [28] linked temperature scaling of extreme hourly precipitation to future increases in flash-flood-generating rainfall and climate adaptation planning. Zou et al. [29] used temperature-conditioned rainfall scaling to generate future rainfall scenarios and quantify changes in urban pluvial flood hazards.
For Croatia and the eastern Adriatic, earlier studies have documented substantial climatic variability and a pronounced warming signal, while precipitation changes are more heterogeneous in space, season and temporal scale [30,31]. Comparable behaviour has been found elsewhere in the central and eastern Mediterranean. Such regional heterogeneity emphasizes the importance of station-scale investigations and of considering daily and sub-daily information simultaneously [12,13,14]. The Split–Marjan meteorological station provides a particularly useful setting for such an analysis. The station is located on the central eastern Adriatic coast and is strongly influenced by the Adriatic Sea, Mediterranean atmospheric circulation and the surrounding Dinaric relief [31] (Figure 1). At the broader Balkan scale, Peneva et al. [32] demonstrated that Mediterranean climatic influence is clearly expressed through precipitation seasonality. Areas under stronger maritime Mediterranean influence are characterised by precipitation maxima during the colder part of the year and pronounced summer minima, while increasingly continental conditions are associated with a greater contribution of warm-season precipitation. Mediterranean cyclonic activity is an important control on the cold-season precipitation regime, while the alternation between maritime and continental influences contributes to substantial regional climatic variability [32]. This is consistent with the climatic setting of Split–Marjan, where the coastal position moderates the temperature but does not prevent strong summer heating, while precipitation is characterised by a pronounced seasonal cycle with dry summer conditions and wetter cool-season conditions. The proximity of complex Dinaric topography provides an added physical basis for substantial spatial variability in precipitation.
Figure 1.
Geographic position of meteorological station Split–Marjan.
The objective of this study is to characterise changes in the temperature and precipitation regime at Split–Marjan using complementary daily and hourly observations. Earlier research at this station documented changes in daily precipitation frequency and intensity [33], while precipitation–temperature scaling and its nonlinear behaviour have been extensively investigated in Mediterranean environments [27,34,35,36]. Building on these studies, the present work provides several added contributions. It extends the long-term daily observational record to 2025 and integrates it with 30 years of hourly observations (1996–2025), enabling a consistent assessment of climatic changes across daily and sub-daily timescales. It examines changes in precipitation occurrence, intensity distributions and short-duration extremes. It quantifies the temporal evolution of compound warm–dry, cold–dry, warm–very-wet and cold–very-wet conditions. Finally, it jointly examines temperature-dependent precipitation occurrence and conditional upper precipitation percentiles, including the identification of nonlinear scaling and temperature breakpoints. The breakpoint is defined as the temperature at which the relationship between precipitation intensity and air temperature changes slope, separating two distinct scaling regimes. The principal scientific contribution is therefore an integrated, multi-timescale characterisation of the contrasting responses of temperature and precipitation at a central Adriatic coastal station, providing complementary evidence on how atmospheric warming is associated with changes in precipitation frequency, intensity and compound climatic conditions.
Although the analysis is restricted to meteorological observations, the identified changes may provide relevant climatic information for future investigations of water-resource systems in the surrounding Dinaric karst region. The study does not attempt to quantify hydrological responses but aims to establish an observational climatic basis for subsequent research integrating meteorological, hydrogeological and hydrological data.
2. Materials and Methods
2.1. Study Area, Data and Meteorological Setting
The city of Split is in the central part of the eastern Adriatic coast of Croatia. It lies within the Dinaric karst region, one of the most extensive and well-developed karst areas in Europe [6]. Split–Marjan is the main meteorological station situated on the Marjan Peninsula, a prominent coastal hill covered predominantly by Mediterranean vegetation (Figure 1). Marjan extends approximately 3 km in an east–west direction and reaches an elevation of about 178 m a.s.l. The meteorological station is located at approximately 43°30′30” N and 16°25′35” E, at an elevation of 122 m a.s.l., in an exposed position with strong maritime influence. Its location outside the most densely built-up part of Split makes the station particularly suitable for long-term investigation of climatic variability and change in the central Adriatic coastal environment.
The climate of the Split area is Mediterranean, characterised by hot, dry summers and mild, wet winters. According to the Köppen–Geiger classification, the coastal area around Split belongs to the Csa climate type [37]. Earlier analyses based on observations from the Split–Marjan station confirm the pronounced Mediterranean seasonality of precipitation and its suitability for detecting long-term changes in the regional precipitation regime [33]. The wider Croatian coastal region is characterised by longer dry spells than the mountainous parts of the country, reflecting the strong seasonal concentration of rainfall and the persistence of dry conditions during the warm part of the year [38].
The geographic position of Split strongly affects its air-temperature regime. The proximity of the Adriatic Sea produces a pronounced maritime influence that moderates both diurnal and annual temperature variability. As a result, winter temperatures are mild and range between 0 °C and 15 °C, with rare extremes outside that range. Summer temperatures are generally lower than those in inland areas and typically range between 18 °C and 35 °C. Nevertheless, persistent subtropical anticyclonic conditions and high solar radiation often result in prolonged periods of elevated summer temperatures. The exposed coastal position of the Marjan station makes the record particularly valuable for investigating the response of Mediterranean coastal climates to large-scale warming [31,32].
Precipitation formation is controlled by a combination of Mediterranean cyclones, frontal passages, mesoscale processes and convection. Moist maritime air masses interacting with the complex coastal and Dinaric topography produce strong spatial gradients in precipitation and, under favourable circulation patterns, substantial orographic enhancement [39,40]. During autumn and winter, cyclonic activity and associated frontal systems provide most of the annual precipitation, while summer is characterised by stable subtropical circulation and infrequent rainfall. Warm-season precipitation is therefore less frequent but can occur as intense convective events, often enhanced by mesoscale convergence and coastal topography [39]. Recent Croatian studies further show that the Adriatic coast exhibits a distinct seasonal and diurnal regime of sub-daily precipitation extremes compared with continental and mountainous regions [41].
This study was based on meteorological observations provided by the Croatian Meteorological and Hydrological Service (DHMZ). Two complementary datasets were used: a long-term daily record of air temperature and precipitation for 1948–2025 and a higher-resolution hourly record for 1996–2025. Daily precipitation has been measured using a Hellmann rain gauge since 1948, while hourly precipitation measurements have been obtained using a Lambrecht recording rain gauge (ombrograph), which has been in operation since 1992. The daily record provides the long-term climatic context, while the hourly record enables more detailed characterisation of temperature extremes, sub-daily precipitation, compound temperature–precipitation conditions and precipitation–temperature scaling. Data-quality control found only 145 missing or invalid hourly precipitation observations during 1996–2025, corresponding to approximately 0.055% of the complete hourly record (262,992 h), with all 30 years meeting the 99% completeness threshold, whereas 19 years met the 100% completeness criterion. The 145 missing or invalid hourly observations were excluded from all precipitation-based analyses and were not interpreted as zero precipitation. Wet and dry spells and moving-window precipitation accumulations were considered valid only when all observations within the corresponding spell and window were available. This treatment prevents missing observations from artificially reducing precipitation totals, extending dry spells, or biasing short-duration precipitation maxima.
2.2. Methods
The methods are organised by research topic: long-term temperature change (Section 2.2.1), precipitation amount and extremes (Section 2.2.2), joint temperature–precipitation occurrence and scaling (Section 2.2.3) and statistical inference (Section 2.2.4). The indicator definitions and available units are provided in Appendix A (Appendix A.1: temperature; Appendix A.2: precipitation; Appendix A.3: compound conditions). A list of abbreviations and acronyms is also provided in Appendix A.
2.2.1. Temperature Analysis
For the 1948–2025 daily record, four temperature indicators from the list presented in Appendix A.1 were used in the long-term analysis. Tmean_mean represents the annual mean of daily mean air temperatures (Tmean) and characterizes the overall thermal state of each year. Tmean_max represents the annual maximum of Tmean and describes the highest daily mean temperature reached within a year. Warm-day frequency (T90p) is expressed as the percentage of days in a year when Tmean exceeded the corresponding calendar-day 90th-percentile threshold, whereas cold-day frequency (T10p) is expressed as the percentage of days when Tmean was below the corresponding calendar-day 10th-percentile threshold. These indicators were used to evaluate long-term trends and to compare thermal conditions between two periods, 1948–1995 and 1996–2025. They were selected to distinguish changes in the central tendency (Tmean_mean), annual high-temperature conditions (Tmean_max) and the frequency of unusually warm or cold days (T90p and T10p).
The detailed analysis for 1996–2025 was based on Tmean, daily maximum (Tmax) and daily minimum (Tmin) air temperatures. Annual means of these three variables characterise overall, daytime and night-time thermal conditions, respectively. The upper part of the temperature distribution was additionally described by the annual maximum of Tmax (TXx) and the annual maximum of Tmin (TNx). These indicators provide information on the highest daytime and night-time temperatures.
Four fixed-threshold indicators were used as complementary measures of high-temperature frequency: the annual numbers of days with Tmax exceeding 25 °C and 30 °C (SU25 and SU30, respectively) and the annual numbers of days with Tmin exceeding 20 °C and 25 °C (TR20 and TR25, respectively). SU25 and TR20 correspond to commonly used climate-extreme indices, while SU30 and TR25 were included as more restrictive indicators of particularly hot daytime and night-time conditions relevant to the climate of the study area. The 25 °C and 30 °C maximum-temperature thresholds distinguish warm from hotter days; the 20 °C and 25 °C minimum-temperature thresholds distinguish tropical from particularly warm nights.
Relative changes in warm daytime and night-time conditions were quantified using two indicators: the percentage of days in a year when Tmax exceeds the corresponding calendar-day 90th-percentile threshold (TX90p) and the percentage of days when Tmin exceeds its calendar-day 90th-percentile threshold (TN90p). For these detailed percentile-based indicators, calendar-day thresholds were calculated separately for Tmax and Tmin using a centred 5-day calendar window. For each calendar day, observations from that day and the two preceding and two following calendar days were pooled to estimate the respective percentile threshold. This moving-window procedure accounts for the pronounced seasonal cycle while increasing the sample available for percentile estimation [23,24]. Unlike absolute thresholds, calendar-day percentile thresholds account for the seasonal temperature cycle and allow warm and cold anomalies to be compared throughout the year. It should be noted that the indicators T90p/T10p use daily mean temperature, while TX90p/TN90p use daily maximum and minimum temperature, respectively. Leap days were explicitly retained in the percentile calculations by mapping all observations onto a common 366-day calendar, with 29 February treated as a separate calendar day and dates after February aligned consistently across leap and non-leap years.
Changes in the relationship between daytime and night-time temperatures were assessed using the diurnal temperature range (DTR), calculated as the annual mean of the daily differences between Tmax and Tmin. The persistence of unusually warm conditions was assessed using the warm spell duration index (WSDI), defined as the annual number of days belonging to periods of at least six consecutive days during which Tmax exceeded the corresponding calendar-day 90th-percentile threshold. DTR and WSDI follow established climate-extreme concepts and complement the separate analysis of mean and threshold-based temperature conditions [23,24].
A complementary analysis was performed using a shorter minimum-duration criterion. A heatwave was defined as a period of at least three consecutive days during which Tmax exceeded the same calendar-day 90th-percentile threshold used for WSDI. Three annual heatwave indicators were then derived: the heatwave duration (HWD), representing the mean duration of heatwave events occurring within a year; the heatwave frequency (HWF), representing the annual number of heatwave events; and the heatwave intensity (HWI), calculated as the mean positive exceedance of Tmax above the corresponding calendar-day 90th-percentile threshold during heatwave days. The common percentile threshold ensures methodological consistency between the WSDI and heatwave analyses, while the different duration criteria provide complementary information on prolonged warm spells and shorter extreme-heat episodes. The six-day WSDI criterion targets sustained warm spells under the established climate-index convention, while the three-day heatwave criterion captures shorter but still persistent episodes that the six-day definition would miss. The indicators HWF, HWD and HWI were retained separately because more events need not imply longer or more intense individual events.
2.2.2. Precipitation Analysis
Precipitation variability was characterised using a set of annual indicators designed to describe complementary aspects of the precipitation regime, including annual precipitation amount, occurrence and frequency of wet hours, precipitation intensity, persistence of wet and dry conditions, short-duration precipitation maxima, upper-tail precipitation intensity and the contribution of heavy precipitation to annual totals. The selection of indicators was based on the general framework of internationally established climate-extreme indices [23,24,42], with modifications and additional metrics appropriate for the hourly temporal resolution of the Split–Marjan dataset. The precipitation indicators used in the analyses of both periods are summarized in Appendix A.2.
For the long-term daily record (1948–2025), six precipitation indicators were used. Annual total precipitation (RTOT) is calculated as the sum of all daily precipitation observed within each calendar year. A wet day was defined as a day with precipitation ≥ 1 mm, whereas a dry day was defined as a day with precipitation < 1 mm. The annual number of wet days is denoted by WetDays. The mean precipitation intensity during wet days or the simple daily intensity index (SDII) is calculated as the total annual precipitation during wet days divided by the corresponding number of wet days. The annual maximum number of consecutive dry days (CDD) characterizes the persistence of dry periods. The annual 95th percentile of wet-day precipitation (R95pw1day) describes the upper part of the daily precipitation distribution or very-wet day precipitation. The annual maximum daily precipitation (Rx1day) characterizes extreme daily precipitation events.
For the 1996–2025 hourly record, a wet hour was defined as an hour with precipitation ≥ 0.1 mm, while a dry hour was defined as an hour with precipitation < 0.1 mm. The occurrence of hourly precipitation was characterised by the annual number of wet hours (NWH). Mean precipitation intensity during wet hours (SPII1hr) was calculated as the total annual precipitation during wet hours divided by the corresponding NWHs. This hourly formulation follows the conceptual basis of the commonly used SDII, adapted here to the hourly temporal resolution of the available data [23,24].
The frequency of moderate and heavy hourly precipitation was quantified using four fixed thresholds, R1hr10mm, R1hr15mm, R1hr20mm and R1hr30mm, representing the annual number of hours with precipitation equal to or exceeding 10, 15, 20 and 30 mm, respectively. Threshold-based indicators provide a straightforward means of evaluating changes in the frequency of precipitation events of specified intensity [24]. The simultaneous use of several thresholds allows changes in different parts of the high-intensity precipitation distribution to be examined. The progressively higher thresholds were chosen to compare moderately heavy and rarer, intense hourly rainfall within the observed distribution using consistent, readily interpretable cut-offs.
The persistence of precipitation and precipitation-free conditions was described using the maximum length of wet spell (MxLWS) and the maximum length of dry spell (MxLDS). These indicators are hourly analogues of duration-based wet- and dry-spell indices commonly applied to daily precipitation series [23,24] and represent the longest continuous sequences of wet and dry hours, respectively, observed within each calendar year.
Short-duration precipitation extremes were characterised by annual maximum accumulated precipitation over seven durations: Rx1hr, Rx2hr, Rx3hr, Rx6hr, Rx12hr, Rx18hr and Rx24hr. For each duration, precipitation totals were calculated using continuously moving hourly windows, and the largest valid accumulated precipitation amount within each year was retained. This approach extends the concept of annual maximum precipitation indicators to sub-daily timescales. The range of 1–24 h durations was chosen to distinguish short convective-scale accumulations from longer storm totals without requiring sub-hourly data. Moving windows avoid dependence on arbitrary clock-hour boundaries.
Upper-tail precipitation behaviour was further investigated using the annual 95th and 99th percentile of wet-hour precipitation denoted as R95pw1hr and R99pw1hr, respectively. These two indicators were calculated as the 95th and 99th percentile of precipitation amounts during wet hours within each calendar year. To complement these intensity-based measures, 95th and 99th percentile contributions were also calculated as the percentage contributions of precipitation from wet hours exceeding the corresponding annual 95th and 99th percentile thresholds of wet-hour precipitation. These indicators, denoted by R95pw1hrP and R99pw1hrP, quantify the degree to which annual precipitation is concentrated in the heaviest precipitation events and therefore provide information complementary to precipitation totals, event frequencies and percentile intensities. They were calculated independently for each calendar year from all valid wet-hour precipitation amounts (≥0.1 mm), and the corresponding contributions were expressed as percentages of the annual precipitation total.
It should be noted that the precipitation indicators were grouped by purpose: totals and wet-day or wet-hour counts measure amount and occurrence; SDII and SPII1hr measure intensity conditional on precipitation; threshold exceedance counts characterise the frequency of heavier hours; spell lengths quantify persistence; moving-window maxima capture accumulation over durations relevant to short and sustained rainfall; and upper percentiles and their contributions distinguish tail intensity from its share of annual rainfall.
2.2.3. Compound Temperature–Precipitation Analysis
Compound weather and climate events arise from combinations of multiple climatic drivers and/or hazards whose joint behaviour may produce conditions that cannot be adequately characterised by considering the individual variables separately [18]. Compound temperature–precipitation indicators were used to characterise the joint occurrence and interdependence of thermal and precipitation conditions. The complete set of compound indicators and associated parameters used in the analysis is summarized in Appendix A.3. Compound indicators address whether dry or very-wet conditions increasingly coincide with unusually warm or cold days, a question not answered by trends in temperature or precipitation considered separately.
Daily compound conditions were derived from daily mean air temperature (Tmean) and daily precipitation (RD). Warm and cold temperature conditions were identified using calendar-day percentile thresholds calculated from the entire reference period. A centred 5-day calendar window was applied for the calculation of the 90th (T90) and 10th (T10) percentiles. Warm days were defined by Tmean > T90 and cold days by Tmean < T10. Precipitation conditions were classified using a 1.0 mm wet-day threshold and season-specific 90th percentiles of wet-day precipitation. Therefore, dry days were defined by RD < 1 mm and wet days by RD ≥ 1 mm. Very-wet days were defined by RD exceeding the season-specific 90th percentile of wet-day precipitation. Separate very-wet-day thresholds were therefore calculated for December–January–February (DJF), March–April–May (MAM), June–July–August (JJA) and September–October–November (SON) to account for the seasonality of the precipitation regime. Four categorical compound indicators were later obtained by combining temperature and precipitation conditions: Warm/Dry (WD), Warm/Very-Wet (WW), Cold/Dry (CD) and Cold/Very-Wet (CW). Their annual and seasonal frequencies are expressed as the number of days satisfying both component criteria. This classification provides a direct measure of changes in the co-occurrence of thermal and precipitation conditions and is consistent with the multivariate concept of compound climate events [18]. Days with missing or invalid daily temperature or precipitation observations were excluded from the calculation of compound indicators and were not classified as WD, WW, CD or CW conditions. The percentile-based temperature thresholds were kept fixed throughout the analysis period to provide a common climatic reference for evaluating changes in the frequency of warm and cold conditions. Consequently, changes in WD, WW, CD and CW frequency reflect changes in the joint occurrence of temperature and precipitation conditions compared to this reference.
The interdependence between air temperature and frequency of precipitation was determined by discretising air temperature into bins. Each wet hour with precipitation ≥ 0.1 mm was paired with air temperature recorded during the same hour. The paired observations were grouped into fixed 2 °C air-temperature bins, represented by their bin-centre temperature. The number of wet hours was calculated within each bin. The frequency of precipitation for each bin was obtained by dividing the number of wet hours by the total number of hours within each bin. In addition to the entire dataset, the relationship was also calculated separately for four seasons (DJF, MAM, JJA, and SON). Seasonal interdependencies were calculated because the same air temperature can occur under different moisture and circulation regimes in winter and summer. The resulting relationships between temperature and wet-hour frequency complement the conditional precipitation–temperature scaling analysis by distinguishing temperatures with the most frequent precipitation occurrence.
The conditional precipitation–temperature (P–T) scaling analysis was also based on binning. Hourly precipitation was paired with air temperature using fixed 2 °C air-temperature bins. To limit instability associated with sparsely populated temperature bins, only bins containing at least 20 wet-hour observations were retained for the scaling analysis. Within each retained bin, the conditional 90th, 95th and 99th percentiles of wet-hour precipitation (P90, P95 and P99) were calculated. For each percentile, Pq, its interdependence with temperature was represented by the log-linear relationship ln(Pq) = a + bT, where T is the temperature-bin centre, a is the intercept, and b is the slope. The corresponding scaling rate was calculated as S = 100[exp(b) − 1] and is expressed as % °C−1. This formulation facilitates comparison with the approximately 6–7% °C−1 increase in atmospheric saturation water-vapour capacity expected from the Clausius–Clapeyron relationship [34,43,44]. Regression was used to model the Pq–T relationship, with goodness of fit assessed using the coefficient of determination (R2) [45]. Because the Pq–T relationship is not monotonic, a piecewise log-linear model was applied. Candidate turning (breakpoint) temperatures corresponding to the discrete 2 °C bin centres were systematically evaluated. For each candidate breakpoint, separate log-linear regressions were fitted to the lower- and higher-temperature branches, with the breakpoint bin included in both branches (T ≤ Tb for the low-temperature branch and T ≥ Tb for the high-temperature branch). The breakpoint temperature, Tb, was defined as the candidate value that provided the best overall fit of the two regression branches, determined by minimising the combined residual sum of squares. Separate low- and high-temperature scaling rates (Low-T and High-T, respectively) were subsequently calculated from the corresponding regression slopes. To characterise uncertainty in the fitted relationships, 95% pointwise confidence bands were calculated separately for the low- and high-temperature regression branches using the residual standard errors of the log-linear fits and Student’s t distribution. The P–T scaling analysis therefore describes how upper wet-hour precipitation percentiles vary with concurrent temperature. Two-degree bins balance temperature resolution against the number of wet observations in each bin; the 20-wet-hour minimum removes the sparsest bins but does not eliminate uncertainty in high-percentile estimates. Consequently, the fitted breakpoint temperature represents the temperature at which the selected two-branch regression changes slope; it is an empirical change in scaling direction, not necessarily a mathematical inflection point or a causal physical threshold.
The complete compound-indicator framework therefore integrates three levels of information. The WD, WW, CD and CW indicators quantify the co-occurrence of temperature and precipitation states. The seasonal relationships between temperature and frequency of wet hours characterise the temperature interdependence with precipitation occurrence. The conditional P90, P95 and P99 together with Tb, Low-T scaling and High-T scaling characterise the temperature interdependence with heavy and extreme precipitation.
2.2.4. Statistical Analysis
Monotonic temporal trends in data and indicators were evaluated using the non-parametric Mann–Kendall test, and trend magnitudes were quantified using Sen’s slope estimator [19,20,21]. Abrupt changes in the central tendency of annual indicator series were assessed using the Pettitt change-point test [22]. Statistical differences between two periods were evaluated using a two-sided Mann–Whitney U test [46]. Statistical significance in all analyses was evaluated at α = 0.05.
To evaluate the potential influence of serial dependence on trend significance, following established principles of statistical trend assessment in hydrometeorological time series [45] and the trend-free pre-whitening approach described by Yue et al. [47], an additional robustness analysis was performed for selected annual temperature and hourly precipitation indicators over 1996–2025. The bootstrap analysis used 2000 replicates for each block length to examine the sensitivity of statistical significance to the assumed temporal dependence structure. The resulting p-values are sensitivity estimates conditional on the selected resampling scheme. Lag-1 autocorrelation was estimated after removing the Sen trend from each annual series. The sensitivity of Mann–Kendall significance was then assessed using trend-free pre-whitening (TFPW) and circular moving-block bootstrap (MBB) resampling with block lengths of three and five years. The two-sided Mann–Kendall p-values were independently verified using Python and the SciPy (1.15) statistical library, accounting for tied observations. The robustness of Pettitt change-point significance was also examined using MBB resampling. Detailed results are discussed in Section 3.4.
Given the large number of annual and seasonal indicators examined, the statistical tests were interpreted primarily as exploratory assessments of climate variability and change. No formal adjustment for multiple comparisons was applied; therefore, individual p-values, particularly those close to the significance threshold of 0.05, were interpreted with greater emphasis placed on the consistency, magnitude, and physical plausibility of the observed changes.
The statistical analyses were implemented in Python (3.14.6; Python Software Foundation, Wilmington, DE, USA) using established scientific computing libraries. NumPy (2.4.0) and SciPy (1.15) were used for numerical calculations, non-parametric statistical tests, correlation analysis and regression procedures. The TFPW procedure was implemented using the pyMannKendall package, while MBB resampling was performed using tsbootstrap (0.5.0). The computational procedures followed the methodological definitions and parameter settings specified in the preceding subsections. No novel statistical algorithms were developed specifically for this study.
3. Results
3.1. Long-Term Changes from the 1948–2025 Daily Record
The analysis of daily air temperature at Split–Marjan for 1948–2025 confirmed a pronounced and statistically significant warming trend. All long-term air-temperature indicators were statistically significant. A summary of trend characteristics for these indicators is presented in Table 1. The annual mean air temperature (Tmean_mean) increased at a Sen’s slope of 0.231 °C decade−1 (p < 0.001). The temporal evolution of annual temperature also shows a distinct transition towards persistently higher values during the later part of the record (Figure 2). Pettitt analysis identified a statistically significant change point in 1996 (p < 0.001). The warming signal was also evident in the upper part of the temperature distribution, with the annual maximum daily temperature (Tmean_max) increasing by 0.318 °C decade−1 (p < 0.001). Percentile-based temperature indicators, T90p and T10p, showed particularly pronounced changes, with a significant increase in warm-day frequency and a simultaneous decrease in cold-day frequency.
Table 1.
Summary of long-term trend and two periods’ difference for air-temperature indicators at Split–Marjan (1948–2025). Statistically significant values are found at p < 0.05. Indicator definitions and units are given in Appendix A.1, as applicable
Figure 2.
Annual mean air temperature, five-year moving average, Sen’s slope trend and Pettitt change point at Split–Marjan (1948–2025).
In Table 1, the division of the complete record into the periods 1948–1995 and 1996–2025 corresponds to the statistically identified temperature change point in 1996. The comparison reveals substantial differences in thermal conditions between the two periods, although the identified statistical change point alone does not establish the climatic origin of the observed transition. Tmean_mean increased from 16.09 °C to 17.18 °C, corresponding to a difference of approximately +1.09 °C (p < 0.001). Tmean_max increased from approximately 30.65 °C to 31.97 °C. T90p also increased significantly from 11.12% to 23.84%, while T10p decreased from 9.44% to 6.25%, with T90p and T10p thresholds derived from the entire 1948–2025 record.
In contrast to temperature, annual precipitation totals (RTOT) did not show a statistically significant monotonic trend over 1948–2025 (Figure 3). Consequently, precipitation indicators showed less uniform long-term changes. A summary of trends and period differences for long-term precipitation indicators is presented in Table 2.
Figure 3.
Annual total precipitation, five-year moving average and Sen’s slope trend at Split–Marjan (1948–2025).
Table 2.
Summary of long-term trend and two periods’ difference for long-term precipitation indicators at Split–Marjan (1948–2025). Statistically significant values are found at p < 0.05. Indicator definitions and units are given in Appendix A.2, as applicable.
The number of wet days (WetDays) decreased, while the simple daily intensity index (SDII) and annual maximum 1-day precipitation (Rx1day) increased significantly. The annual 95th percentile of wet-day precipitation (R95pw1day) showed a non-significant trend over the complete period, as did consecutive dry days (CDD), for which the trend also did not reach the adopted significance level. The contrast between precipitation amount and precipitation intensity is particularly clear when the two periods are compared. RTOT changed only from 803.90 to 816.20 mm (+1.5%), and the difference was statistically insignificant (p = 0.813). Wet-day frequency decreased by approximately 5.9%, but the difference between the periods was also not significant (p = 0.130). CDD also showed no statistically significant difference between the two periods (p = 0.579). On the other hand, precipitation-intensity indicators were significantly higher during the 1996–2025 period. SDII increased by 7.7% (p = 0.005), Rx1day by 17.2% (p = 0.005) and R95pw1day by 24.9% (p = 0.040) compared to 1948–1995. It should be noted that, for example, R95pw1day was significantly higher in the later period (+24.9%, p = 0.040), although its monotonic trend over the complete record was not statistically significant (p = 0.113). Conversely, WetDays exhibited a significant decreasing monotonic trend (p = 0.019), but the difference between the two periods was not significant (p = 0.130). The Mann–Kendall trend test and Mann–Whitney U test address different aspects of temporal variability and therefore do not necessarily yield identical significance results. The Mann–Kendall test evaluates the presence of a monotonic trend over the complete 1948–2025 period, while the Mann–Whitney U test assesses differences in the distributions of annual indicator values between 1948–1995 and 1996–2025.
Table 1 and Table 2 and Figure 2 and Figure 3 show a clear contrast between temperature and precipitation changes at Split–Marjan. Temperature indicators show coherent and statistically significant changes towards warmer conditions. In comparison, total precipitation remains relatively stable, while several indicators describing precipitation intensity and extremes are significantly higher during 1996–2025. These results establish the principal long-term changes detected in the daily 1948–2025 record.
3.2. Temperature and Precipitation Characteristics from the 1996–2025 Hourly Record
Annual variability and Sen’s slope trends for six selected complementary temperature indicators are presented in Figure 4a–f. These indicators showed substantial interannual variability. The percentage of days with Tmax above the calendar-day 90th percentile (TX90p) ranged from approximately 2 to 18% and the percentage of days with Tmin above the calendar-day 90th percentile (TN90p) from about 2 to 19%. The annual number of hot days (SU30) varied roughly between 20 and 80 days, while the number of very warm nights (TR25) ranged from almost 0 to more than 50 days. The warm spell duration index (WSDI) also displayed substantial year-to-year variability, ranging from 0 to about 25 days, while the heatwave frequency (HWF) varied between 0 and 8 events per year.
Figure 4.
Annual variability and Sen’s slope trends in selected temperature indicators at Split–Marjan (1996–2025): (a) percentage of days with Tmax above the calendar-day 90th percentile (TX90p), (b) percentage of days with Tmin above the calendar-day 90th percentile (TN90p), (c) number of days with Tmax > 30 °C (SU30), (d) number of days with Tmin > 25 °C (TR25), (e) warm spell duration index (WSDI) and (f) heatwave frequency (HWF).
Trend statistics are presented in Table 3. The occurrence of warm conditions increased markedly. TX90p increased by 3.092 percentage points per decade (p < 0.001) and TN90p increased by 2.740 percentage points per decade (p < 0.001). The increase was also clear for threshold-based indicators, with SU30 increasing by 10.830 days per decade (p < 0.001), tropical nights (TR20) by 8.824 days per decade (p = 0.003) and TR25 by 8.750 days per decade (p = 0.002). The persistence and frequency of anomalously warm conditions also changed. WSDI exhibited a statistically significant positive trend of 0.909 days per decade (p = 0.034), while HWF increased by 1.538 events per decade (p = 0.005). On the other hand, neither heatwave duration (HWD) nor heatwave intensity (HWI) displayed a statistically significant trend. Diurnal temperature range (DTR) was also statistically insignificant.
Table 3.
Statistical characteristics of trends and change points for selected temperature indicators at Split–Marjan (1996–2025). Statistically significant values are found at p < 0.05. Indicator definitions and units are given in Appendix A.1, as applicable.
Change-point analysis found a clustering of statistically significant shifts. Significant Pettitt change points occurred in 2010 for Tmean, TX90p, TN90p and HWF. SU30 alone exhibited an earlier significant change point in 2007. These results show that several complementary measures of warm extremes, including mean annual temperature, underwent detectable shifts towards warmer conditions within the 1996–2025 period.
The precipitation indicators showed a different pattern. Only four indicators from the list in Appendix A.2 were statistically significant. Annual variability and Sen’s slope trends for these four indicators are presented in Figure 5a–d. They showed narrower relative ranges than temperature indicators. Mean wet-hour precipitation intensity (SPII1hr) varied between 1.2 and 1.9 mm h−1, while annual 95th percentile of wet-hour precipitation (R95pw1hr) ranged from about 4.4 to 7.5 mm. The share of precipitation above the 95th-percentile threshold (R95pw1hrP) ranged from 30 to 44% of total precipitation, while R99pw1hrP varied from about 10 to 22%. These ranges illustrate interannual variability in the intensity and contribution of heavy hourly precipitation at Split–Marjan.
Figure 5.
Annual variability and Sen’s slope trends in selected hourly precipitation indicators at Split–Marjan (1996–2025): (a) mean wet-hour precipitation intensity (SPII1hr), (b) annual 95th percentile of wet-hour precipitation (R95pw1hr), (c) contribution of precipitation above the annual 95th-percentile wet-hour threshold (R95pw1hrP) and (d) contribution of precipitation above the annual 99th-percentile wet-hour threshold (R99pw1hrP).
Statistical characteristics of trends and change points for statistically significant precipitation indicators are presented in Table 4. SPII1hr increased by approximately 0.080 mm h−1 per decade (p = 0.024), with a significant Pettitt change point in 2010 (p = 0.028). This change occurred despite the absence of a significant trend in total annual precipitation. Changes were also detected in the upper part of the wet-hour precipitation distribution. R95pw1hr increased significantly, with a Sen’s slope of 0.400 mm per decade (p = 0.026), while R99pw1hr showed no statistically significant trend. The significant increase was therefore evident at the 95th-percentile level but not at the more extreme 99th-percentile level. The share of precipitation above the annual percentile thresholds showed the opposite tendency. R95pw1hrP decreased by approximately 1.658% per decade (p = 0.049), while R99pw1hrP decreased by approximately 1.608% per decade (p = 0.038). Both indicators exhibited significant Pettitt change points in 2006.
Table 4.
Statistical characteristics of trends and change points for selected precipitation indicators derived from the 1996–2025 hourly record. Statistically significant values are found at p < 0.05. Indicator definitions and units are given in Appendix A.2, as applicable.
The observed changes in hourly precipitation should be distinguished between absolute intensity and relative contribution to annual precipitation totals. SPII1hr and R95pw1hr increased significantly, indicating higher mean wet-hour precipitation intensity and a higher annual 95th percentile of wet-hour precipitation, respectively. In contrast, R95pw1hrP and R99pw1hrP decreased significantly, indicating that precipitation from hours exceeding the corresponding annually calculated percentile thresholds accounted for a smaller proportion of annual precipitation. This indicates that declining percentage contributions do not necessarily imply declining absolute precipitation amounts during the most intense hours. Moreover, because annual maximum precipitation over durations of 1–24 h and fixed-threshold exceedance frequencies did not exhibit statistically significant trends, the observed changes are not generalised to all aspects of extreme precipitation. It should also be noted that the p-values are close to 0.05, and significance of some upper-tail trends is sensitive to the treatment of serial dependence (Section 3.4).
Several principal features emerge from the higher-resolution analysis. For temperature, significant changes are expressed particularly through the increasing frequency of warm extremes and heatwaves. For precipitation, changes are concentrated in the distribution of precipitation among wet hours, particularly the increase in the intensity of precipitation and the decrease in the relative contributions above the 95th- and 99th-percentile thresholds. At the same time, no significant trends were detected in annual sub-daily precipitation maxima, fixed-threshold exceedance frequencies, or wet/dry spell durations.
3.3. Compound Temperature–Precipitation Characteristics
The first part of the analysis focused on compound warm–dry (WD), cold–dry (CD), warm–very-wet (WW) and cold–very-wet (CW) conditions. A pronounced redistribution between WD and CD conditions was observed over the study period, while neither WW nor CW conditions exhibited a statistically significant annual or seasonal trend. Statistically significant results for WD and CD conditions are presented in Table 5. The annual number of WD days increased significantly, with a Sen’s slope of +11.36 days decade−1 (p < 0.001), while CD days decreased significantly by −10.00 days decade−1 (p < 0.001). Thus, the clearest compound change during the investigated period was a shift in the thermal character of dry conditions. The seasonal results further show that this redistribution was not confined to a single part of the year. WD frequency increased significantly in DJF (1.603 days decade−1, p = 0.039), JJA (3.448 days decade−1, p = 0.021) and SON (2.144 days decade−1, p = 0.048). Conversely, CD frequency decreased significantly in DJF (−3.333 days decade−1, p = 0.007), JJA (−2.143 days decade−1, p < 0.001) and SON (−2.500 days decade−1, p = 0.005). Statistically insignificant seasonal trends were detected in MAM. The annual and seasonal results presented in Table 5, therefore, show that the WD–CD transition represents a multi-seasonal feature of the 1996–2025 record. Although several seasonal trends in WD and CD frequency were statistically significant, results with p-values close to 0.05 should be interpreted cautiously. The seasonal findings are therefore considered complementary to the more pronounced annual trends in WD and CD frequency rather than independent evidence of equally robust changes in every season.
Table 5.
Annual and seasonal (DJF, JJA, and SON) trends in selected compound temperature–precipitation indicators at Split–Marjan (1996–2025). Statistically significant values are found at p < 0.05. Indicator definitions and units are given in Appendix A.3, as applicable.
The magnitude of changes was further evaluated by comparing the mean annual numbers of WD and CD days for two equally long subperiods, 1996–2010 and 2011–2025. The annual variability and temporal trends of both indicators are presented in Figure 6. The mean annual number of WD days increased from 20.93 to 41.27 days per year, corresponding to a relative increase of 97.1%. Conversely, the mean annual number of CD days decreased from 33.07 to 16.13 days per year, representing a reduction of 51.2%. These substantial differences complement the statistically significant trends of +11.36 and −10.00 days decade−1 for WD and CD, respectively, and demonstrate a pronounced shift in the thermal characteristics of dry conditions at Split–Marjan.
Figure 6.
Annual variability and Sen’s slope trends in compound temperature–precipitation conditions at Split–Marjan (1996–2025): (a) warm–dry (WD) days and (b) cold–dry (CD) days. Horizontal segments indicate mean annual frequencies for 1996–2010 and 2011–2025.
In the second part of the compound analysis, the relationship between air temperature and wet-hour frequency was examined for the complete hourly dataset and separately for the four meteorological seasons (Figure 7). For the complete dataset, the highest wet-hour frequencies occur at approximately 10–11 °C. However, the temperature corresponding to maximum wet-hour frequency varies seasonally. In particular, the summer (JJA) relationship reaches its maximum at higher temperatures, approximately 14–17 °C. At higher temperatures, wet-hour frequency decreases, with a particularly pronounced decline during summer. These differences reflect the seasonal characteristics of precipitation occurrence and the contrasting atmospheric conditions under which precipitation develops. At sub-zero temperatures, wet-hour frequencies remain low but non-zero, indicating occasional precipitation during cold winter conditions. Because sub-zero temperatures are relatively infrequent at Split–Marjan, these bins contain comparatively few observations and should be interpreted with caution. The analysis does not distinguish between liquid and solid precipitation.
Figure 7.
Wet-hour frequency as a function of air temperature for the complete hourly dataset and individual meteorological seasons (DJF, MAM, JJA and SON) at Split–Marjan (1996–2025). Temperature was grouped into fixed 2 °C bins.
The third part of the compound analysis involved the hourly precipitation–temperature scaling analysis. The upper percentiles of precipitation displayed a distinct nonlinear interdependence with air temperature. This behaviour is illustrated for P95 in Figure 8, where the optimal breakpoint occurs at approximately 21 °C. Below this temperature, P95 increased by 6.84% °C−1 (p < 0.001; R2 = 0.972), whereas above the breakpoint the relationship reversed, with a scaling rate of −14.39% °C−1 (p = 0.003; R2 = 0.965). Figure 8 therefore shows that the temperature interdependence with heavy hourly precipitation cannot be represented by a single monotonic scaling relationship across the full observed temperature range. A similar breakpoint structure occurred for the other upper precipitation percentiles. P90 increased by 5.67% °C−1 below its 19 °C breakpoint, while P99 exhibited the strongest low-temperature response, increasing by 10.31% °C−1 below a breakpoint of approximately 17 °C. Above their respective breakpoints, all three percentiles showed negative scaling. The P95 relationship presented in Figure 8 is therefore representative of a broader nonlinear response of upper hourly precipitation percentiles to increasing air temperature. Figure 8 additionally displays 95% pointwise confidence bands for each fitted regression branch and the wet-hour sample sizes supporting the conditional P95 estimates. The higher-temperature fit is based on fewer temperature bins and declining wet-hour counts towards the warm end of the distribution; these features warrant caution when interpreting its fitted scaling rate.
Figure 8.
Conditional 95th percentile of wet-hour precipitation (P95) as a function of concurrent air temperature at Split–Marjan (1996–2025). Points represent empirical P95 values within 2 °C bins; dashed lines show 95% pointwise confidence bands conditional on the selected breakpoint of 21 °C. The lower panel shows the number of wet hours in each bin (logarithmic axis).
3.4. Statistical Robustness of Trends
The statistical robustness assessment confirmed that the principal temperature trends were largely insensitive to the treatment of serial autocorrelation (Table 6). The significant positive trends in annual mean temperature (Tmean), warm-day and warm-night frequencies (TX90p and TN90p), summer days (SU30), tropical nights (TR20 and TR25), and warm-spell duration (WSDI) remained significant after trend-free pre-whitening (TFPW) and moving-block bootstrap (MBB) resampling with block lengths of three and five years. Most of these indicators retained high statistical significance (p < 0.01), while WSDI showed a weaker but still robust signal (TFPW p = 0.040). Heatwave frequency (HWF) also remained significant across all procedures. Conversely, diurnal temperature range (DTR), heatwave duration (HWD), and heatwave intensity (HWI) consistently exhibited non-significant trends. Precipitation indicators showed greater sensitivity to the statistical procedure. The increasing trend in mean wet-hour precipitation intensity (SPII1hr) remained significant under all methods (p = 0.014–0.033), supporting its statistical robustness. In contrast, the trend in the 95th-percentile wet-hour precipitation intensity (R95pw1hr) remained significant under both MBB configurations but became non-significant after TFPW (p = 0.081). Similar method-dependent significance was observed for the relative precipitation contributions above the 95th and 99th percentiles (R95pw1hrP and R99pw1hrP), particularly following TFPW (p = 0.129 and 0.053, respectively).
Table 6.
Statistical robustness of selected annual temperature and hourly precipitation indicators at Split–Marjan (1996–2025), evaluated using the original Mann–Kendall test, trend-free pre-whitening, and circular moving-block bootstrap resampling with block lengths of three and five years. Lag-1 autocorrelation coefficients and change-point sensitivity results are also provided.
Overall, the results provide strong evidence that the detected warming, increasing frequency of warm extremes and rising mean wet-hour precipitation intensity are robust to the examined statistical treatments. Conversely, trends involving the upper tail of the hourly precipitation distribution should be interpreted more cautiously because their statistical significance depends partly on the treatment of temporal dependence.
4. Discussion
The results reveal a pronounced asymmetry in the evolution of temperature and precipitation at Split–Marjan. Temperature showed a coherent and statistically robust warming signal across multiple indicators and timescales, while precipitation changes were more heterogeneous and depended on the temporal scale and metric considered. This contrast is consistent with the broader Mediterranean climate-change signal, characterised by pronounced warming and increasing temperature extremes but substantially greater spatial and temporal variability in precipitation [9,10,48,49].
The temperature regime shows a broad shift towards warmer conditions, encompassing mean temperature, warm-day and warm-night extremes and heatwave occurrence. Similar increases in warm days, warm nights, summer days, tropical nights and warm-spell duration have been reported for the central Adriatic coast [50], while Mediterranean-wide analyses emphasize particularly strong increases in tropical nights in coastal environments [51]. The 1996–2025 record further demonstrates significant increases in percentage of days with daily maximum air temperatures above the corresponding calendar-day 90th-percentile threshold (TX90p), percentage of days with Tmin above the calendar-day 90th percentile (TN90p), number of days with Tmax > 30 °C (SU30), number of days with Tmin > 20 °C (TR20), number of days with Tmin > 25 °C (TR25), warm spell duration index (WSDI) and heatwave frequency. However, heatwave duration (HWD), heatwave intensity (HWI) and diurnal temperature range (DTR) show no significant trends, indicating that recent heatwave change is expressed primarily through increasing event frequency rather than systematic lengthening or intensification [23,24,48].
Precipitation shows a less coherent response. Earlier analysis of Split and other Croatian stations found precipitation redistribution, fewer precipitation days and indications of intensification [33]. Consistently, the present results show increasing mean wet-hour intensity (SPII1hr) and 95th percentile of wet-hour precipitation (R95pw1hr) but no significant trends in 99th percentile of wet-hour precipitation (R99pw1hr) or annual precipitation maxima for durations of 1–24 h. The observed change is therefore better characterised as a redistribution of precipitation intensity than as uniform intensification of extremes [52]. Such contrasting precipitation responses are consistent with the strong variability, seasonality and spatial heterogeneity characteristic of Mediterranean climates [9,10,48,49]. However, it should be noted that trends in the upper percentiles of hourly precipitation and their relative contributions were sensitive to the statistical method, particularly trend-free pre-whitening. These findings reinforce the conclusion that changes in heavy precipitation should be interpreted cautiously, especially when statistical significance is close to the adopted threshold.
The strong increase in warm–dry (WD) conditions and decrease in cold–dry (CD) conditions show that dry periods increasingly occur under warmer atmospheric conditions, with significant changes extending beyond summer. The absence of significant annual trends in warm–very-wet (WW) and cold–very-wet (CW) conditions further shows that the dominant compound signal at Split–Marjan is associated with the changing thermal character of dry periods. This pattern is consistent with growing evidence of increasing compound warm–dry extremes across the Mediterranean [18,53,54,55]. Such compound conditions can amplify environmental stress because higher temperatures increase atmospheric evaporative demand during precipitation-deficient periods [18,48,53,55]. Karst recharge depends on precipitation, antecedent moisture conditions and evapotranspiration, so changes in temperature regime and redistribution of precipitation intensity may affect karst aquifers even when annual precipitation is still comparatively stable [56,57,58,59]. Warmer and drier conditions may also reduce effective groundwater recharge and prolong low spring-discharge regimes, with potential consequences for groundwater availability [54,55,60,61,62,63]. However, the magnitude and direction of these responses cannot be determined from the meteorological observations analysed in this study and require dedicated hydrogeological and hydrological investigations.
The pronounced shift in WD and CD conditions is further demonstrated by the comparison of the two subperiods, which shows an almost twofold increase in WD frequency and an approximately 50% decrease in CD frequency. These changes primarily reflect the marked redistribution of thermal conditions under the observed warming trend. Therefore, the results should not be interpreted as evidence of changes in dry-day frequency independently of temperature. The absence of statistically significant trends in WW and CW conditions indicates that the strong thermal redistribution was not accompanied by a similarly detectable change in the occurrence of compound very-wet events. Such events are influenced by atmospheric moisture availability, synoptic circulation, convective processes and precipitation seasonality, which may partly explain their different behaviour.
An important result of the analysis is the nonlinear relationship between heavy hourly precipitation and temperature, which provides an empirical link between warming and rainfall intensity. P95 increases by approximately 6.84% °C−1 below the breakpoint near 21 °C, close to the thermodynamic reference implied by the Clausius–Clapeyron relationship. Above the breakpoint, scaling becomes negative. Positive scaling at lower temperatures followed by weak or negative scaling at higher temperatures produces the characteristic hook-shaped P–T relationship reported in earlier observational studies, including Mediterranean environments [27,34,35,36]. Since the obtained P–T scaling reflects not only thermodynamic moisture constraints but also other meteorological conditions, the resulting breakpoint represents an empirical value, and the resulting relationships represent conditional or apparent P–T scaling, describing how upper quantiles of wet-hour precipitation vary across the observed temperature distribution in the study area. The breakpoint near 21 °C should be interpreted as an empirical feature of the station-specific precipitation–temperature relationship rather than a precisely defined physical threshold, and its applicability to other coastal or inland locations remains to be established. The observed reversal in scaling at higher temperatures may reflect the combined influence of moisture availability, atmospheric circulation, precipitation seasonality and storm characteristics. However, the present analysis does not isolate or quantify the contributions of these factors, and the resulting relationships should therefore be interpreted as empirical conditional associations rather than evidence of specific causal mechanisms. These station-specific empirical relationships may provide useful information for future studies addressing design rainfall, urban drainage, flood hazards and climate adaptation, although their practical application would require additional hydrological analyses and validation [28,29].
The relationships between air temperature and wet-hour frequency reveal a pronounced seasonal dependence of precipitation occurrence. For the complete dataset, wet-hour frequency reaches its maximum at approximately 10–11 °C, whereas the summer maximum occurs at higher temperatures, approximately 14–17 °C. Despite these seasonal differences, precipitation occurrence generally decreases towards higher temperatures, particularly during summer. This behaviour is consistent with the strong Mediterranean seasonality of precipitation and the prevalence of relatively dry atmospheric conditions during the warmest part of the year [27]. The decrease in wet-hour frequency contrasts with the positive P95 precipitation–temperature scaling below the approximately 21 °C breakpoint, indicating that higher temperatures within this range may be associated with less frequent precipitation but greater conditional intensity when precipitation occurs. At still higher temperatures, both precipitation occurrence and conditional intensity decrease. These relationships are consistent with the combined influence of moisture availability, atmospheric circulation and seasonal precipitation processes rather than temperature alone.
The absence of statistically significant trends in annual 1–24 h precipitation maxima does not establish that short-duration precipitation extremes have remained unchanged at Split–Marjan. The 30-year record provides limited statistical power for detecting trends in rare events, while hourly temporal aggregation may mask changes in sub-hourly convective rainfall [41]. Potential short-duration changes in convective rainfall characteristics cannot be fully assessed from the available hourly precipitation record.
The present study was intentionally designed as a single-station investigation, taking advantage of the long daily observational record and the complementary 30-year hourly dataset available at Split–Marjan. This approach enables a detailed and internally consistent assessment of temperature and precipitation changes across multiple temporal scales at the same location. However, the results should be interpreted within the specific geographic and meteorological setting of the station rather than as representative of the entire central Adriatic or Mediterranean coastal region. The exposed position of the Marjan Peninsula and its proximity to the Adriatic Sea influence local thermal conditions through maritime temperature moderation and coastal atmospheric circulation. Precipitation characteristics may additionally be affected by local convergence, Mediterranean cyclonic activity and orographic influences associated with the surrounding Dinaric relief. These factors may contribute to station-specific precipitation occurrence, intensity and temperature-dependent scaling relationships. Although the detected changes are broadly consistent with previously reported Mediterranean climatic patterns, their spatial coherence cannot be established from the present single-station analysis. The results therefore provide a local climatic baseline, while future investigations combining observations from additional coastal and inland stations with regional gridded datasets are needed to evaluate the spatial representativeness of the identified changes.
The interpretation of long-term meteorological trends and change points requires consideration of possible non-climatic influences associated with changes in the surrounding environment. A published spatiotemporal inventory of detected homogeneity breaks for Croatia provided relevant context for assessing potential inhomogeneities [64]. This inventory reported no detected temperature homogeneity breaks at Split–Marjan during 1981–2018, which means that this finding does not establish homogeneity over the full 1948–2025 record. Formal relative homogeneity testing of precipitation against neighbouring reference stations was not available for this study. The identified change points should therefore be interpreted as statistical transitions in the observed series rather than unequivocal evidence of climatic regime shifts.
Overall, the multi-timescale analysis shows that temporal resolution influences which aspects of climate change can be detected, particularly for precipitation, where sub-daily processes may respond differently from daily or annual metrics [26,34,35,43]. The Split–Marjan record therefore illustrates a broader Mediterranean pattern: a coherent thermal response accompanied by a more complex redistribution of precipitation and increasing warm–dry conditions [18,57,58,59]. The nonlinear P–T relationship is consistent with precipitation intensity being associated with thermal and moisture regimes [27,34,35,65]. These findings emphasize the value of long-term, high-resolution meteorological observations for identifying local expressions of climate change. Given the location of Split within the Dinaric karst region, the observed changes in precipitation characteristics and warm–dry conditions may be relevant to future assessments of groundwater recharge and spring-flow variability. However, the magnitude and direction of potential hydrological responses cannot be determined from meteorological observations alone. The present findings should therefore be regarded as a climatic observational baseline that identifies potentially relevant changes and motivates further investigations combining meteorological records with groundwater-level observations, spring-discharge measurements and hydrological modelling [6,7,8,53,54,55,56,60,61].
5. Conclusions
The presented study provides a station-scale, multi-timescale assessment of temperature and precipitation changes at Split–Marjan, located on the central Adriatic coast of Croatia, using the long-term daily record for 1948–2025 and detailed hourly observations for 1996–2025. The combined analysis reveals a clear contrast between a strong and coherent local warming signal and a substantially more heterogeneous precipitation response.
The thermal regime at Split–Marjan has undergone a pronounced and systematic shift towards warmer conditions. The long-term record shows substantial warming, while the hourly record shows increasing frequencies of warm days, warm nights, summer and tropical conditions, warm spells and heatwaves. The recent period, therefore, differs from the earlier climatological period not only in mean temperature but also in the frequency of high-temperature conditions. Increasing heatwave frequency, despite the absence of significant trends in mean heatwave duration and intensity, shows that the principal change is currently expressed through more frequent heat episodes.
Changes in precipitation are considerably less uniform than those in temperature. Annual precipitation totals over 1948–2025 and annual maximum precipitation over durations ranging from one to 24 h during 1996–2025 showed no statistically significant trends. Nevertheless, the mean wet-hour precipitation intensity increased significantly and remained robust across the examined statistical procedures. An increase in the hourly 95th percentile and decreases in the relative contributions of the highest-intensity wet hours were significant in the original tests, but their significance was method-dependent in the robustness analysis. These findings suggest a redistribution of precipitation intensity rather than a uniform change in precipitation extremes.
Compound temperature and precipitation changes are expressed through the increasing occurrence of warm–dry and the decreasing occurrence of cold–dry conditions. This represents an important shift in the thermal characteristics of dry periods, without establishing an independent change in overall dry-day frequency. Both changes indicate that dry days are increasingly associated with warmer atmospheric conditions.
Precipitation occurrence and intensity exhibit distinctly different relationships with air temperature. Wet hours are generally most frequent at intermediate temperatures, while the intensity of heavier hourly precipitation follows a nonlinear, hook-shaped relationship. The observed conditional precipitation intensity increases with temperature below an empirical breakpoint near 21 °C and decreases above this temperature. This relationship may reflect the combined influence of atmospheric moisture availability, seasonality and circulation patterns, although the individual contributions of these factors cannot be established from the present analysis.
The combined findings demonstrate that pronounced atmospheric warming does not coincide with statistically detectable increases in annual maximum precipitation. Changes in precipitation occurrence, intensity and their dependence on temperature may develop differently across temporal scales. Consequently, the absence of significant trends in the most extreme annual precipitation values should not be interpreted as evidence that all characteristics of heavy precipitation have remained unchanged, especially at short-duration scales.
Although this study focuses exclusively on meteorological observations, the identified changes provide a climatic basis for future investigations of potential hydrological responses in the surrounding Dinaric karst region. The observed warming, increasing occurrence of warm–dry conditions and changes in precipitation intensity may be relevant to groundwater recharge, aquifer storage and spring-discharge variability, but these potential effects cannot be quantified from the present data. The principal limitations of the study include its single-station design, the shorter hourly observation period, uncertainties associated with historical measurement conditions and the exploratory interpretation of multiple statistical tests. Future research should therefore assess the spatial representativeness of the findings using additional meteorological stations, investigate the physical mechanisms underlying the observed precipitation–temperature relationships and integrate meteorological observations with groundwater and spring-discharge records and appropriate hydrological modelling.
Author Contributions
Conceptualization, D.J. and V.D.-J.; methodology, D.J.; software, D.J.; validation, D.J. and V.D.-J.; formal analysis, D.J. and V.D.-J.; investigation, D.J.; resources, D.J. and V.D.-J.; data curation, V.D.-J.; writing—original draft preparation, D.J. and V.D.-J.; writing—review and editing, D.J. and V.D.-J.; visualization, D.J.; supervision, D.J. and V.D.-J.; project administration, V.D.-J.; funding acquisition, D.J. and V.D.-J. All authors have read and agreed to the published version of the manuscript.
Funding
This work was supported by the RESILIO—Resilience and Vulnerability Assessment of Diocletian’s Palace project (IP-UNIST-19), funded through the Institutional Research Projects Program of the University of Split, financed by the Recovery and Resilience Facility of the European Union.
Data Availability Statement
The data presented in this study are available on request from the Croatian Meteorological and Hydrological Service.
Conflicts of Interest
The authors declare no conflicts of interest.
Abbreviations
The following abbreviations are used in this manuscript:
| CD | Cold–dry |
| CDD | Consecutive dry days |
| CW | Cold–very-wet |
| C–C | Clausius–Clapeyron |
| DHMZ | Croatian Meteorological and Hydrological Service |
| DJF | December–January–February |
| DTR | Diurnal temperature range |
| ETCCDI | Expert Team on Climate Change Detection and Indices |
| HWD | Heatwave duration |
| HWI | Heatwave intensity |
| JJA | June–July–August |
| MAM | March–April–May |
| MBB | Moving-block bootstrap |
| MK | Mann–Kendall |
| MxLWS | Maximum length of wet spell |
| MxLDS | Maximum length of dry spell |
| NWH | Annual number of wet hours |
| P90 | 90th percentile of wet-hour precipitation |
| P95 | 95th percentile of wet-hour precipitation |
| P99 | 99th percentile of wet-hour precipitation |
| R2 | Coefficient of determination |
| RD | Daily total precipitation |
| RTOT | Annual total precipitation |
| P–T | Precipitation–Temperature |
| R1hr10mm | Number of hours with precipitation ≥10 mm |
| R1hr15mm | Number of hours with precipitation ≥15 mm |
| R1hr20mm | Number of hours with precipitation ≥20 mm |
| R1hr30mm | Number of hours with precipitation ≥30 mm |
| R95pw1day | The annual 95th percentile of wet-day precipitation |
| R95pw1hr | Annual 95th percentile of wet-hour precipitation |
| R95pw1hrP | Contribution of precipitation above the annual 95th-percentile wet-hour threshold |
| R99pw1hr | Annual 99th percentile of wet-hour precipitation |
| R99pw1hrP | Contribution of precipitation above the annual 99th-percentile wet-hour threshold |
| Rx12hr | Annual maximum 12 h precipitation |
| Rx18hr | Annual maximum 18 h precipitation |
| Rx1day | Annual maximum 1-day precipitation |
| Rx1hr | Annual maximum 1 h precipitation |
| Rx24hr | Annual maximum 24 h precipitation |
| Rx2hr | Annual maximum 2 h precipitation |
| Rx3hr | Annual maximum 3 h precipitation |
| Rx6hr | Annual maximum 6 h precipitation |
| SDII | Simple daily intensity index |
| SON | September–October–November |
| SPII1hr | Mean wet-hour precipitation intensity |
| SU25 | Number of days with Tmax > 25 °C |
| SU30 | Number of days with Tmax > 30 °C |
| T10 | Calendar-day 10th-percentile temperature threshold |
| T10p | Percentage of days with daily mean air temperature below the calendar-day 10th percentile |
| T90 | Calendar-day 90th-percentile temperature threshold |
| T90p | Percentage of days with daily mean air temperature above the calendar-day 90th percentile |
| Tb | Breakpoint temperature |
| TFPW | Trend-free pre-whitening |
| Tmax | Daily maximum air temperature |
| Tmean | Daily mean air temperature |
| Tmean_max | Annual maximum daily air temperature |
| Tmean_mean | Annual mean daily temperature |
| Tmin | Daily minimum air temperature |
| TN90p | Percentage of days with Tmin above the calendar-day 90th percentile |
| TNx | Annual maximum of daily minimum air temperature |
| TR20 | Number of days with Tmin > 20 °C |
| TR25 | Number of days with Tmin > 25 °C |
| TX90p | Percentage of days with Tmax above the calendar-day 90th percentile |
| TXx | Annual maximum of daily maximum air temperature |
| WD | Warm–dry |
| WetDays | Number of wet days |
| WSDI | Warm spell duration index |
| WW | Warm–very-wet |
Appendix A
Appendix A.1
Temperature indicators used in the long-term daily (1948–2025) and detailed (1996–2025) analyses.
| Indicator | Description/Interpretation |
| Tmean | Daily mean air temperature. |
| Tmean_mean | Annual mean of daily mean air temperature; characterizes long-term changes in overall thermal conditions. |
| Tmean_max | Annual maximum of daily mean air temperature; represents the highest daily mean temperature reached in a year. |
| T90p | Percentage of days with daily mean air temperature above the corresponding calendar-day 90th-percentile threshold; represents warm-day frequency. |
| T10p | Percentage of days with daily mean air temperature below the corresponding calendar-day 10th-percentile threshold; represents cold-day frequency. |
| Tmax | Daily maximum air temperature; characterizes daytime thermal conditions. |
| Tmin | Daily minimum air temperature; characterizes night-time thermal conditions. |
| TXx | Annual maximum of daily maximum air temperature (Tmax); represents the highest daytime temperature reached in a year. |
| TNx | Annual maximum of daily minimum air temperature (Tmin); represents the highest night-time minimum temperature reached in a year. |
| SU25 | Annual number of days with Tmax > 25 °C; indicates the frequency of summer days. |
| SU30 | Annual number of days with Tmax > 30 °C; indicates the frequency of particularly hot daytime conditions. |
| TR20 | Annual number of days with Tmin > 20 °C; indicates the frequency of tropical nights. |
| TR25 | Annual number of days with Tmin > 25 °C; indicates the frequency of very warm night-time conditions. |
| TX90p | Percentage of days in a year when Tmax exceeds the corresponding calendar-day 90th-percentile threshold; indicates the frequency of unusually warm days. |
| TN90p | Percentage of days in a year when Tmin exceeds the corresponding calendar-day 90th-percentile threshold; indicates the frequency of unusually warm nights. |
| WSDI | Annual number of days belonging to periods of at least six consecutive days with Tmax above the calendar-day 90th-percentile threshold; measures persistence of prolonged warm spells. |
| DTR | Annual mean of the daily difference between Tmax and Tmin; describes diurnal temperature variability and relative changes in daytime and night-time temperatures. |
| HWD | Mean duration, in days, of heatwave events occurring within a year. A heatwave is defined as at least three consecutive days with Tmax above the calendar-day 90th-percentile threshold. |
| HWF | Annual number of heatwave events; measures how frequently heatwave episodes occur. |
| HWI | Mean positive exceedance of Tmax above the corresponding calendar-day 90th-percentile threshold during heatwave days; measures the thermal magnitude of heatwave events. |
Appendix A.2
Precipitation indicators used in the analysis.
| Indicator | Description/Interpretation |
| RTOT | Annual total precipitation. |
| WetDays | Annual number of days with precipitation ≥ 1.0 mm. |
| SDII | Mean precipitation intensity during wet days; calculated as annual total precipitation during wet days divided by the number of wet days. |
| CDD | Maximum number of consecutive dry days with precipitation < 1.0 mm within a calendar year. |
| R95pw1day | The annual 95th percentile of wet-day precipitation. |
| Rx1day | The annual maximum daily precipitation. |
| NWH | Annual number of wet hours with precipitation ≥ 0.1 mm; characterizes precipitation occurrence and frequency. |
| SPII1hr | Mean precipitation intensity during wet hours with precipitation ≥ 0.1 mm, calculated as annual total precipitation during wet hours divided by the number of wet hours. |
| R1hr10mm | Annual number of hours with precipitation ≥ 10 mm; characterizes the frequency of moderate-to-heavy hourly precipitation. |
| R1hr15mm | Annual number of hours with precipitation ≥ 15 mm; characterizes the frequency of heavy hourly precipitation. |
| R1hr20mm | Annual number of hours with precipitation ≥ 20 mm; characterizes the frequency of very heavy hourly precipitation. |
| R1hr30mm | Annual number of hours with precipitation ≥ 30 mm; characterizes the frequency of particularly intense hourly precipitation. |
| MxLWS | Longest continuous sequence of wet hours (P ≥ 0.1 mm) within a calendar year; characterizes persistence of wet conditions. |
| MxLDS | Longest continuous sequence of dry hours (P < 0.1 mm) within a calendar year; characterizes persistence of precipitation-free conditions. |
| Rx1hr | Annual maximum precipitation accumulated over 1 h; characterizes the most intense 1 h precipitation event. |
| Rx2hr | Annual maximum precipitation accumulated over a continuously moving 2 h window; characterizes short-duration precipitation extremes. |
| Rx3hr | Annual maximum precipitation accumulated over a continuously moving 3 h window; characterizes short-duration precipitation extremes. |
| Rx6hr | Annual maximum precipitation accumulated over a continuously moving 6 h window; characterizes precipitation extremes at the 6 h scale. |
| Rx12hr | Annual maximum precipitation accumulated over a continuously moving 12 h window; characterizes precipitation extremes at the 12 h scale. |
| Rx18hr | Annual maximum precipitation accumulated over a continuously moving 18 h window; characterizes precipitation extremes at the 18 h scale. |
| Rx24hr | Annual maximum precipitation accumulated over a continuously moving 24 h window; characterizes precipitation extremes at the 24 h scale. |
| R95pw1hr | Annual 95th percentile of precipitation amounts during wet hours (P ≥ 0.1 mm); characterizes the upper tail of the hourly precipitation-intensity distribution. |
| R99pw1hr | Annual 99th percentile of precipitation amounts during wet hours (P ≥ 0.1 mm); characterizes the most extreme part of the hourly precipitation-intensity distribution. |
| R95pw1hrP | Percentage contribution of precipitation from wet hours exceeding the annual P95 threshold to annual precipitation total; indicates the concentration of annual precipitation in heavy events. |
| R99pw1hrP | Percentage contribution of precipitation from wet hours exceeding the annual P99 threshold to annual precipitation total; indicates the concentration of annual precipitation in the most extreme events. |
Appendix A.3
Compound temperature–precipitation indicators and parameters used in the analysis.
| Indicator | Description/Interpretation |
| RD | Daily precipitation. |
| T90 | Calendar-day 90th-percentile threshold of Tmean, calculated using a centred 5-day calendar window; defines warm conditions. |
| T10 | Calendar-day 10th-percentile threshold of Tmean, calculated using a centred 5-day calendar window; defines cold conditions. |
| WD | Warm/Dry day: simultaneous occurrence of a warm condition (Tmean > T90) and a dry day (RD < 1.0 mm); measures warm–dry co-occurrence. |
| WW | Warm/Very-Wet day: simultaneous occurrence of a warm condition (Tmean > T90) and a very-wet day with RD exceeding the season-specific 90th percentile of wet-day precipitation; measures warm–very-wet co-occurrence. |
| CD | Cold/Dry day: simultaneous occurrence of a cold condition (Tmean < T10) and a dry day (RD < 1.0 mm); measures cold–dry co-occurrence. |
| CW | Cold/Very-Wet day: simultaneous occurrence of a cold condition (Tmean < T10) and a very wet day with RD exceeding the season-specific 90th percentile of wet-day precipitation; measures cold–very-wet co-occurrence. |
| Conditional P90 | 90th percentile of wet-hour precipitation, calculated within each 2 °C air-temperature bin; characterizes temperature interdependence with heavy hourly precipitation. |
| Conditional P95 | 95th percentile of wet-hour precipitation, calculated within each 2 °C air-temperature bin; characterizes temperature interdependence with heavy hourly precipitation. |
| Conditional P99 | 99th percentile of wet-hour precipitation, calculated within each 2 °C air-temperature bin; characterizes temperature interdependence with extreme hourly precipitation. |
| Tb | Scaling breakpoint—empirical breakpoint temperature separating low- and high-temperature branches of the precipitation–temperature relationship. |
| Low-T scaling | Percentage change in a selected conditional precipitation percentile per °C on the low-temperature branch of the piecewise log-linear P–T relationship. |
| High-T scaling | Percentage change in a selected conditional precipitation percentile per °C on the high-temperature branch of the piecewise log-linear P–T relationship. |
References
- IPCC. Climate Change 2021: The Physical Science Basis. Contribution of Working Group I to the Sixth Assessment Report of the Intergovernmental Panel on Climate Change; Masson-Delmotte, V., Zhai, P., Pirani, A., Connors, S.L., Péan, C., Berger, S., Caud, N., Chen, Y., Goldfarb, L., Gomis, M.I., et al., Eds.; Cambridge University Press: Cambridge, UK; New York, NY, USA, 2021. [Google Scholar]
- IPCC. Climate Change 2023: Synthesis Report; Core Writing Team, Lee, H., Romero, J., Eds.; Intergovernmental Panel on Climate Change: Geneva, Switzerland, 2023. [Google Scholar]
- Caretta, M.A.; Mukherji, A.; Arfanuzzaman, M.; Betts, R.A.; Gelfan, A.; Hirabayashi, Y.; Lissner, T.K.; Liu, J.; Lopez Gunn, E.; Morgan, R.; et al. Chapter 4: Water. In Climate Change 2022: Impacts, Adaptation and Vulnerability; Pörtner, H.-O., Roberts, D.C., Tignor, M., Poloczanska, E.S., Mintenbeck, K., Alegría, A., Craig, M., Langsdorf, S., Löschke, S., Möller, V., et al., Eds.; Cambridge University Press: Cambridge, UK; New York, NY, USA, 2022; pp. 551–712. [Google Scholar] [CrossRef] [Scilit]
- Yang, D.; Yang, Y.; Xia, J. Hydrological cycle and water resources in a changing world: A review. Geogr. Sustain. 2021, 2, 115–122. [Google Scholar] [CrossRef] [Scilit]
- Milly, P.C.D.; Betancourt, J.; Falkenmark, M.; Hirsch, R.M.; Kundzewicz, Z.W.; Lettenmaier, D.P.; Stouffer, R.J. Stationarity is dead: Whither water management? Science 2008, 319, 573–574. [Google Scholar] [CrossRef] [Scilit] [PubMed]
- Xanke, J.; Goldscheider, N.; Bakalowicz, M.; Barberá, J.A.; Broda, S.; Chen, Z.; Ghanmi, M.; Günther, A.; Hartmann, A.; Jourde, H.; et al. Carbonate rocks and karst water resources in the Mediterranean region. Hydrogeol. J. 2024, 32, 1397–1418. [Google Scholar] [CrossRef] [Scilit]
- Sivelle, V.; Jourde, H.; Bittner, D.; Mazzilli, N.; Tramblay, Y. Assessment of the relative impacts of climate changes and anthropogenic forcing on spring discharge of a Mediterranean karst system. J. Hydrol. 2021, 598, 126396. [Google Scholar] [CrossRef] [Scilit]
- Nerantzaki, S.D.; Nikolaidis, N.P. The response of three Mediterranean karst springs to drought and the impact of climate change. J. Hydrol. 2020, 591, 125296. [Google Scholar] [CrossRef] [Scilit]
- Giorgi, F. Climate change hot-spots. Geophys. Res. Lett. 2006, 33, L08707. [Google Scholar] [CrossRef] [Scilit]
- Lionello, P.; Scarascia, L. The relation between climate change in the Mediterranean region and global warming. Reg. Environ. Change 2018, 18, 1481–1493. [Google Scholar] [CrossRef] [Scilit]
- Cramer, W.; Guiot, J.; Fader, M.; Garrabou, J.; Gattuso, J.-P.; Iglesias, A.; Lange, M.A.; Lionello, P.; Llasat, M.C.; Paz, S.; et al. Climate change and interconnected risks to sustainable development in the Mediterranean. Nat. Clim. Chang. 2018, 8, 972–980. [Google Scholar] [CrossRef] [Scilit]
- Soldini, L.; Darvini, G. Variation in the extreme temperatures and related climate indices for the Marche Region, Italy. Climate 2025, 13, 58. [Google Scholar] [CrossRef] [Scilit]
- Varlas, G.; Stefanidis, K.; Papaioannou, G.; Panagopoulos, Y.; Pytharoulis, I.; Katsafados, P.; Papadopoulos, A.; Dimitriou, E. Unravelling precipitation trends in Greece since 1950s using ERA5 climate reanalysis data. Climate 2022, 10, 12. [Google Scholar] [CrossRef] [Scilit]
- Retalis, A.; Katsanos, D.; Lemesios, I.; Giannakopoulos, C. Analysis of precipitation climatology trends over Greece based on gridded observational and reanalysis databases. Climate 2026, 14, 41. [Google Scholar] [CrossRef] [Scilit]
- Bonacci, O.; Ljubenkov, I.; Roje-Bonacci, T. Karst flash floods: An example from the Dinaric karst (Croatia). Nat. Hazards Earth Syst. Sci. 2006, 6, 195–203. [Google Scholar] [CrossRef] [Scilit]
- Maréchal, J.C.; Ladouche, B.; Dörfliger, N. Karst flash flooding in a Mediterranean karst, the example of Fontaine de Nîmes. Eng. Geol. 2008, 99, 138–146. [Google Scholar] [CrossRef] [Scilit]
- Bailly-Comte, V.; Jourde, H.; Roesch, A.; Pistre, S. Mediterranean flash flood transfer through karstic area. Environ. Geol. 2008, 54, 605–614. [Google Scholar] [CrossRef] [Scilit]
- Zscheischler, J.; Westra, S.; van den Hurk, B.J.J.M.; Seneviratne, S.I.; Ward, P.J.; Pitman, A.; AghaKouchak, A.; Bresch, D.N.; Leonard, M.; Wahl, T.; et al. Future climate risk from compound events. Nat. Clim. Change 2018, 8, 469–477. [Google Scholar] [CrossRef] [Scilit]
- Mann, H.B. Nonparametric tests against trend. Econometrica 1945, 13, 245–259. [Google Scholar] [CrossRef] [Scilit]
- Kendall, M.G. Rank Correlation Methods, 4th ed.; Charles Griffin: London, UK, 1975. [Google Scholar]
- Sen, P.K. Estimates of the regression coefficient based on Kendall’s tau. J. Am. Stat. Assoc. 1968, 63, 1379–1389. [Google Scholar] [CrossRef]
- Pettitt, A.N. A non-parametric approach to the change-point problem. Appl. Stat. 1979, 28, 126–135. [Google Scholar] [CrossRef] [Scilit] [PubMed]
- Alexander, L.V.; Zhang, X.; Peterson, T.C.; Caesar, J.; Gleason, B.; Klein Tank, A.M.G.; Haylock, M.; Collins, D.; Trewin, B.; Rahimzadeh, F.; et al. Global observed changes in daily climate extremes of temperature and precipitation. J. Geophys. Res. Atmos. 2006, 111, D05109. [Google Scholar] [CrossRef] [Scilit]
- Zhang, X.; Alexander, L.; Hegerl, G.C.; Jones, P.; Klein Tank, A.; Peterson, T.C.; Trewin, B.; Zwiers, F.W. Indices for monitoring changes in extremes based on daily temperature and precipitation data. WIREs Clim. Change 2011, 2, 851–870. [Google Scholar] [CrossRef] [Scilit]
- Trenberth, K.E.; Dai, A.; Rasmussen, R.M.; Parsons, D.B. The changing character of precipitation. Bull. Am. Meteorol. Soc. 2003, 84, 1205–1217. [Google Scholar] [CrossRef] [Scilit]
- Westra, S.; Fowler, H.J.; Evans, J.P.; Alexander, L.V.; Berg, P.; Johnson, F.; Kendon, E.J.; Lenderink, G.; Roberts, N.M. Future changes to the intensity and frequency of short-duration extreme rainfall. Rev. Geophys. 2014, 52, 522–555. [Google Scholar] [CrossRef] [Scilit]
- Drobinski, P.; Alonzo, B.; Bastin, S.; Da Silva, N.; Muller, C. Scaling of precipitation extremes with temperature in the French Mediterranean region: What explains the hook shape? J. Geophys. Res. Atmos. 2016, 121, 3100–3119. [Google Scholar] [CrossRef] [Scilit]
- Lenderink, G.; de Vries, H.; Fowler, H.J.; Barbero, R.; van Ulft, B.; van Meijgaard, E. Scaling and Responses of Extreme Hourly Precipitation in Three Climate Experiments with a Convection-Permitting Model. Philos. Trans. R. Soc. A 2021, 379, 20190544. [Google Scholar] [CrossRef] [Scilit] [PubMed]
- Zou, W.; Li, R.; Wright, D.B.; Blagojevic, J.; Molnar, P.; Hussain, M.A.; Zhu, Y.; Li, Y.; Ni, G.; Peleg, N. A Process-Informed Framework Linking Temperature-Rainfall Projections and Urban Flood Modelling. Hydrol. Earth Syst. Sci. 2026, 30, 5097–5116. [Google Scholar] [CrossRef] [Scilit]
- Gajić-Čapka, M.; Cindrić, K. Secular trends in indices of precipitation extremes in Croatia, 1901–2008. Geofizika 2011, 28, 293–312. [Google Scholar]
- Bonacci, O.; Bonacci, D.; Patekar, M.; Pola, M. Increasing trends in air and sea surface temperature in the Central Adriatic Sea (Croatia). J. Mar. Sci. Eng. 2021, 9, 358. [Google Scholar] [CrossRef] [Scilit]
- Peneva, E.; Matov, M.; Tsekov, M. Mediterranean influence on the climatic regime over the Balkan Peninsula from 1901–2021. Climate 2023, 11, 68. [Google Scholar] [CrossRef] [Scilit]
- Bonacci, O.; Andrić, I.; Vrsalović, A.; Bonacci, D. Precipitation Regime Changes at Four Croatian Meteorological Stations. Atmosphere 2021, 12, 885. [Google Scholar] [CrossRef] [Scilit]
- Hardwick Jones, R.; Westra, S.; Sharma, A. Observed relationships between extreme sub-daily precipitation, surface temperature, and relative humidity. Geophys. Res. Lett. 2010, 37, L22805. [Google Scholar] [CrossRef] [Scilit]
- Berg, P.; Haerter, J.O.; Thejll, P.; Piani, C.; Hagemann, S.; Christensen, J.H. Seasonal characteristics of the relationship between daily precipitation intensity and surface temperature. J. Geophys. Res. Atmos. 2009, 114, D18102. [Google Scholar] [CrossRef] [Scilit]
- Drobinski, P.; Da Silva, N.; Panthou, G.; Bastin, S.; Muller, C.; Ahrens, B.; Borga, M.; Conte, D.; Fosser, G.; Giorgi, F.; et al. Scaling precipitation extremes with temperature in the Mediterranean: Past climate assessment and projection in anthropogenic scenarios. Clim. Dyn. 2018, 51, 1237–1257. [Google Scholar] [CrossRef] [Scilit]
- Beck, H.E.; Zimmermann, N.E.; McVicar, T.R.; Vergopolan, N.; Berg, A.; Wood, E.F. Present and future Köppen-Geiger climate classification maps at 1-km resolution. Sci. Data 2018, 5, 180214. [Google Scholar] [CrossRef] [Scilit] [PubMed]
- Cindrić, K.; Pasarić, Z.; Gajić-Čapka, M. Spatial and Temporal Analysis of Dry Spells in Croatia. Theor. Appl. Climatol. 2010, 102, 171–184. [Google Scholar] [CrossRef] [Scilit]
- Ivančan-Picek, B.; Horvath, K.; Strelec Mahović, N.; Gajić-Čapka, M. Forcing Mechanisms of a Heavy Precipitation Event in the Southeastern Adriatic Area. Nat. Hazards 2014, 72, 1231–1252. [Google Scholar] [CrossRef] [Scilit][Green Version]
- Ivušić, S.; Güttler, I.; Horvath, K. Overview of Mean and Extreme Precipitation Climate Changes Across the Dinaric Alps in the Latest EURO-CORDEX Ensemble. Clim. Dyn. 2024, 62, 10785–10815. [Google Scholar] [CrossRef] [Scilit]
- Starčević, A.; Cindrić Kalin, K.; Pasarić, Z. Climatology and Trends of Sub-Daily Precipitation Extremes in Croatia. Int. J. Climatol. 2026, 46, e70463. [Google Scholar] [CrossRef] [Scilit]
- Fowler, H.J.; Lenderink, G.; Prein, A.F.; Westra, S.; Allan, R.P.; Ban, N.; Barbero, R.; Berg, P.; Blenkinsop, S.; Do, H.X. Anthropogenic intensification of short-duration rainfall extremes. Nat. Rev. Earth Environ. 2021, 2, 107–122. [Google Scholar] [CrossRef] [Scilit]
- Lenderink, G.; van Meijgaard, E. Increase in hourly precipitation extremes beyond expectations from temperature changes. Nat. Geosci. 2008, 1, 511–514. [Google Scholar] [CrossRef] [Scilit]
- Utsumi, N.; Seto, S.; Kanae, S.; Maeda, E.E.; Oki, T. Does higher surface temperature intensify extreme precipitation? Geophys. Res. Lett. 2011, 38, L16708. [Google Scholar] [CrossRef] [Scilit]
- Helsel, D.; Hirsch, R.; Ryberg, K.; Archfield, S.; Gilroy, E. Statistical Methods in Water Resources 2020; Elsevier: Amsterdam, The Netherlands, 1993. [Google Scholar] [CrossRef] [Scilit]
- Mann, H.B.; Whitney, D.R. On a Test of Whether One of Two Random Variables Is Stochastically Larger than the Other. Ann. Math. Stat. 1947, 18, 50–60. [Google Scholar] [CrossRef] [Scilit]
- Yue, S.; Pilon, P.; Phinney, B.; Cavadias, G. The influence of autocorrelation on the ability to detect trend in hydrological series. Hydrol. Process. 2002, 16, 1807–1829. [Google Scholar] [CrossRef] [Scilit]
- Ali, E.; Cramer, W.; Carnicer, J.; Georgopoulou, E.; Hilmi, N.J.M.; Le Cozannet, G.; Lionello, P. Cross-Chapter Paper 4: Mediterranean Region. In Climate Change 2022: Impacts, Adaptation and Vulnerability; Pörtner, H.-O., Roberts, D.C., Tignor, M., Poloczanska, E.S., Mintenbeck, K., Alegría, A., Craig, M., Langsdorf, S., Löschke, S., Möller, V., et al., Eds.; Cambridge University Press: Cambridge, UK; New York, NY, USA, 2022; pp. 2233–2272. [Google Scholar] [CrossRef] [Scilit]
- Giorgi, F.; Lionello, P. Climate change projections for the Mediterranean region. Glob. Planet. Change 2008, 63, 90–104. [Google Scholar] [CrossRef] [Scilit]
- Scorzini, A.R.; Di Bacco, M.; Leopardi, M. Recent trends in daily temperature extremes over the central Adriatic region of Italy in a Mediterranean climatic context. Int. J. Climatol. 2018, 38, e741–e757. [Google Scholar] [CrossRef] [Scilit]
- Yavaşlı, D.D.; Erlat, E. Tropical nights in the Mediterranean: A spatiotemporal analysis of trends from 1950 to 2022. Int. J. Climatol. 2024, 44, 1472–1488. [Google Scholar] [CrossRef] [Scilit]
- Alpert, P.; Ben-Gai, T.; Baharad, A.; Benjamini, Y.; Yekutieli, D.; Colacino, M.; Diodato, L.; Ramis, C.; Homar, V.; Romero, R.; et al. The paradoxical increase of Mediterranean extreme daily rainfall in spite of decrease in total values. Geophys. Res. Lett. 2002, 29, 1536. [Google Scholar] [CrossRef] [Scilit]
- Bevacqua, E.; De Michele, C.; Manning, C.; Couasnon, A.; Ribeiro, A.F.S.; Ramos, A.M.; Vignotto, E.; Bastos, A.; Blesić, S.; Durante, F.; et al. Guidelines for studying diverse types of compound weather and climate events. Earth’s Future 2021, 9, e2021EF002340. [Google Scholar] [CrossRef] [Scilit]
- Lemus-Canovas, M. Changes in compound monthly precipitation and temperature extremes and their relationship with teleconnection patterns in the Mediterranean. J. Hydrol. 2022, 608, 127580. [Google Scholar] [CrossRef] [Scilit]
- Bevacqua, E.; Zappa, G.; Lehner, F.; Zscheischler, J. Precipitation trends determine future occurrences of compound hot–dry events. Nat. Clim. Chang. 2022, 12, 350–355. [Google Scholar] [CrossRef] [Scilit]
- Hartmann, A.; Goldscheider, N.; Wagener, T.; Lange, J.; Weiler, M. Karst water resources in a changing world: Review of hydrological modelling approaches. Rev. Geophys. 2014, 52, 218–242. [Google Scholar] [CrossRef] [Scilit]
- Hartmann, A.; Mudarra, M.; Andreo, B.; Marín, A.; Wagener, T.; Lange, J. Modelling spatiotemporal impacts of hydroclimatic extremes on groundwater recharge at a Mediterranean karst aquifer. Water Resour. Res. 2014, 50, 6507–6521. [Google Scholar] [CrossRef] [Scilit]
- Bresinsky, L.; Kordilla, J.; Hector, T.; Engelhardt, I.; Livshitz, Y.; Sauter, M. Managing climate change impacts on the Western Mountain Aquifer: Implications for Mediterranean karst groundwater resources. J. Hydrol. X 2023, 20, 100153. [Google Scholar] [CrossRef] [Scilit]
- Hepach, P.; Bresinsky, L.; Sauter, M.; Livshitz, Y.; Engelhardt, I. Comparison of methods to calculate groundwater recharge for karst aquifers under a Mediterranean climate. Hydrogeol. J. 2024, 32, 1377–1396. [Google Scholar] [CrossRef] [Scilit]
- Jódar, J.; Morales-González, A.L.; Urrutia, J.; Herrera, C.; Lambán, L.J.; Martos-Rosillo, S.; González-Ramón, A. Characterisation of mountain-Mediterranean karst aquifers as lighthouses for the assessment of global change impacts in the Mediterranean region: The Sierra Seca aquifer system (SE Spain). Sci. Total Environ. 2025, 985, 179719. [Google Scholar] [CrossRef] [Scilit] [PubMed]
- Lepore, D.; Allocca, V.; Coda, S.; Cusano, D.; De Vita, P. Estimating groundwater recharge coefficients and future scenarios in karst aquifers of the Apennines of southern Italy by Regional Climate Models. Groundw. Sustain. Dev. 2026, 34, 101662. [Google Scholar] [CrossRef] [Scilit]
- Allocca, V.; De Vita, P.; Manna, F.; Nimmo, J.R. Groundwater recharge assessment at local and episodic scale in a soil mantled perched karst aquifer in southern Italy. J. Hydrol. 2015, 529, 843–853. [Google Scholar] [CrossRef] [Scilit]
- Ren, H.; Wang, F.; Behzad, H.M.; Zhang, J.; Chen, H.; Fu, Z.; Nie, Y.; Lian, J. Effects of rainfall intensity distribution and extreme events on groundwater recharge dynamics in a shallow karst aquifer. J. Hydrol. 2025, 661, 133742. [Google Scholar] [CrossRef] [Scilit]
- Perčec Tadić, M.; Pasarić, Z.; Guijarro, J.A. Croatian high-resolution monthly gridded dataset of homogenised surface air temperature. Theor. Appl. Climatol. 2023, 151, 227–251. [Google Scholar] [CrossRef] [Scilit]
- Berg, P.; Moseley, C.; Haerter, J.O. Strong increase in convective precipitation in response to higher temperatures. Nat. Geosci. 2013, 6, 181–185. [Google Scholar] [CrossRef] [Scilit]
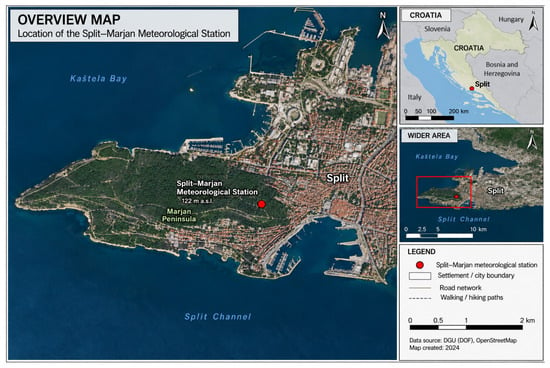
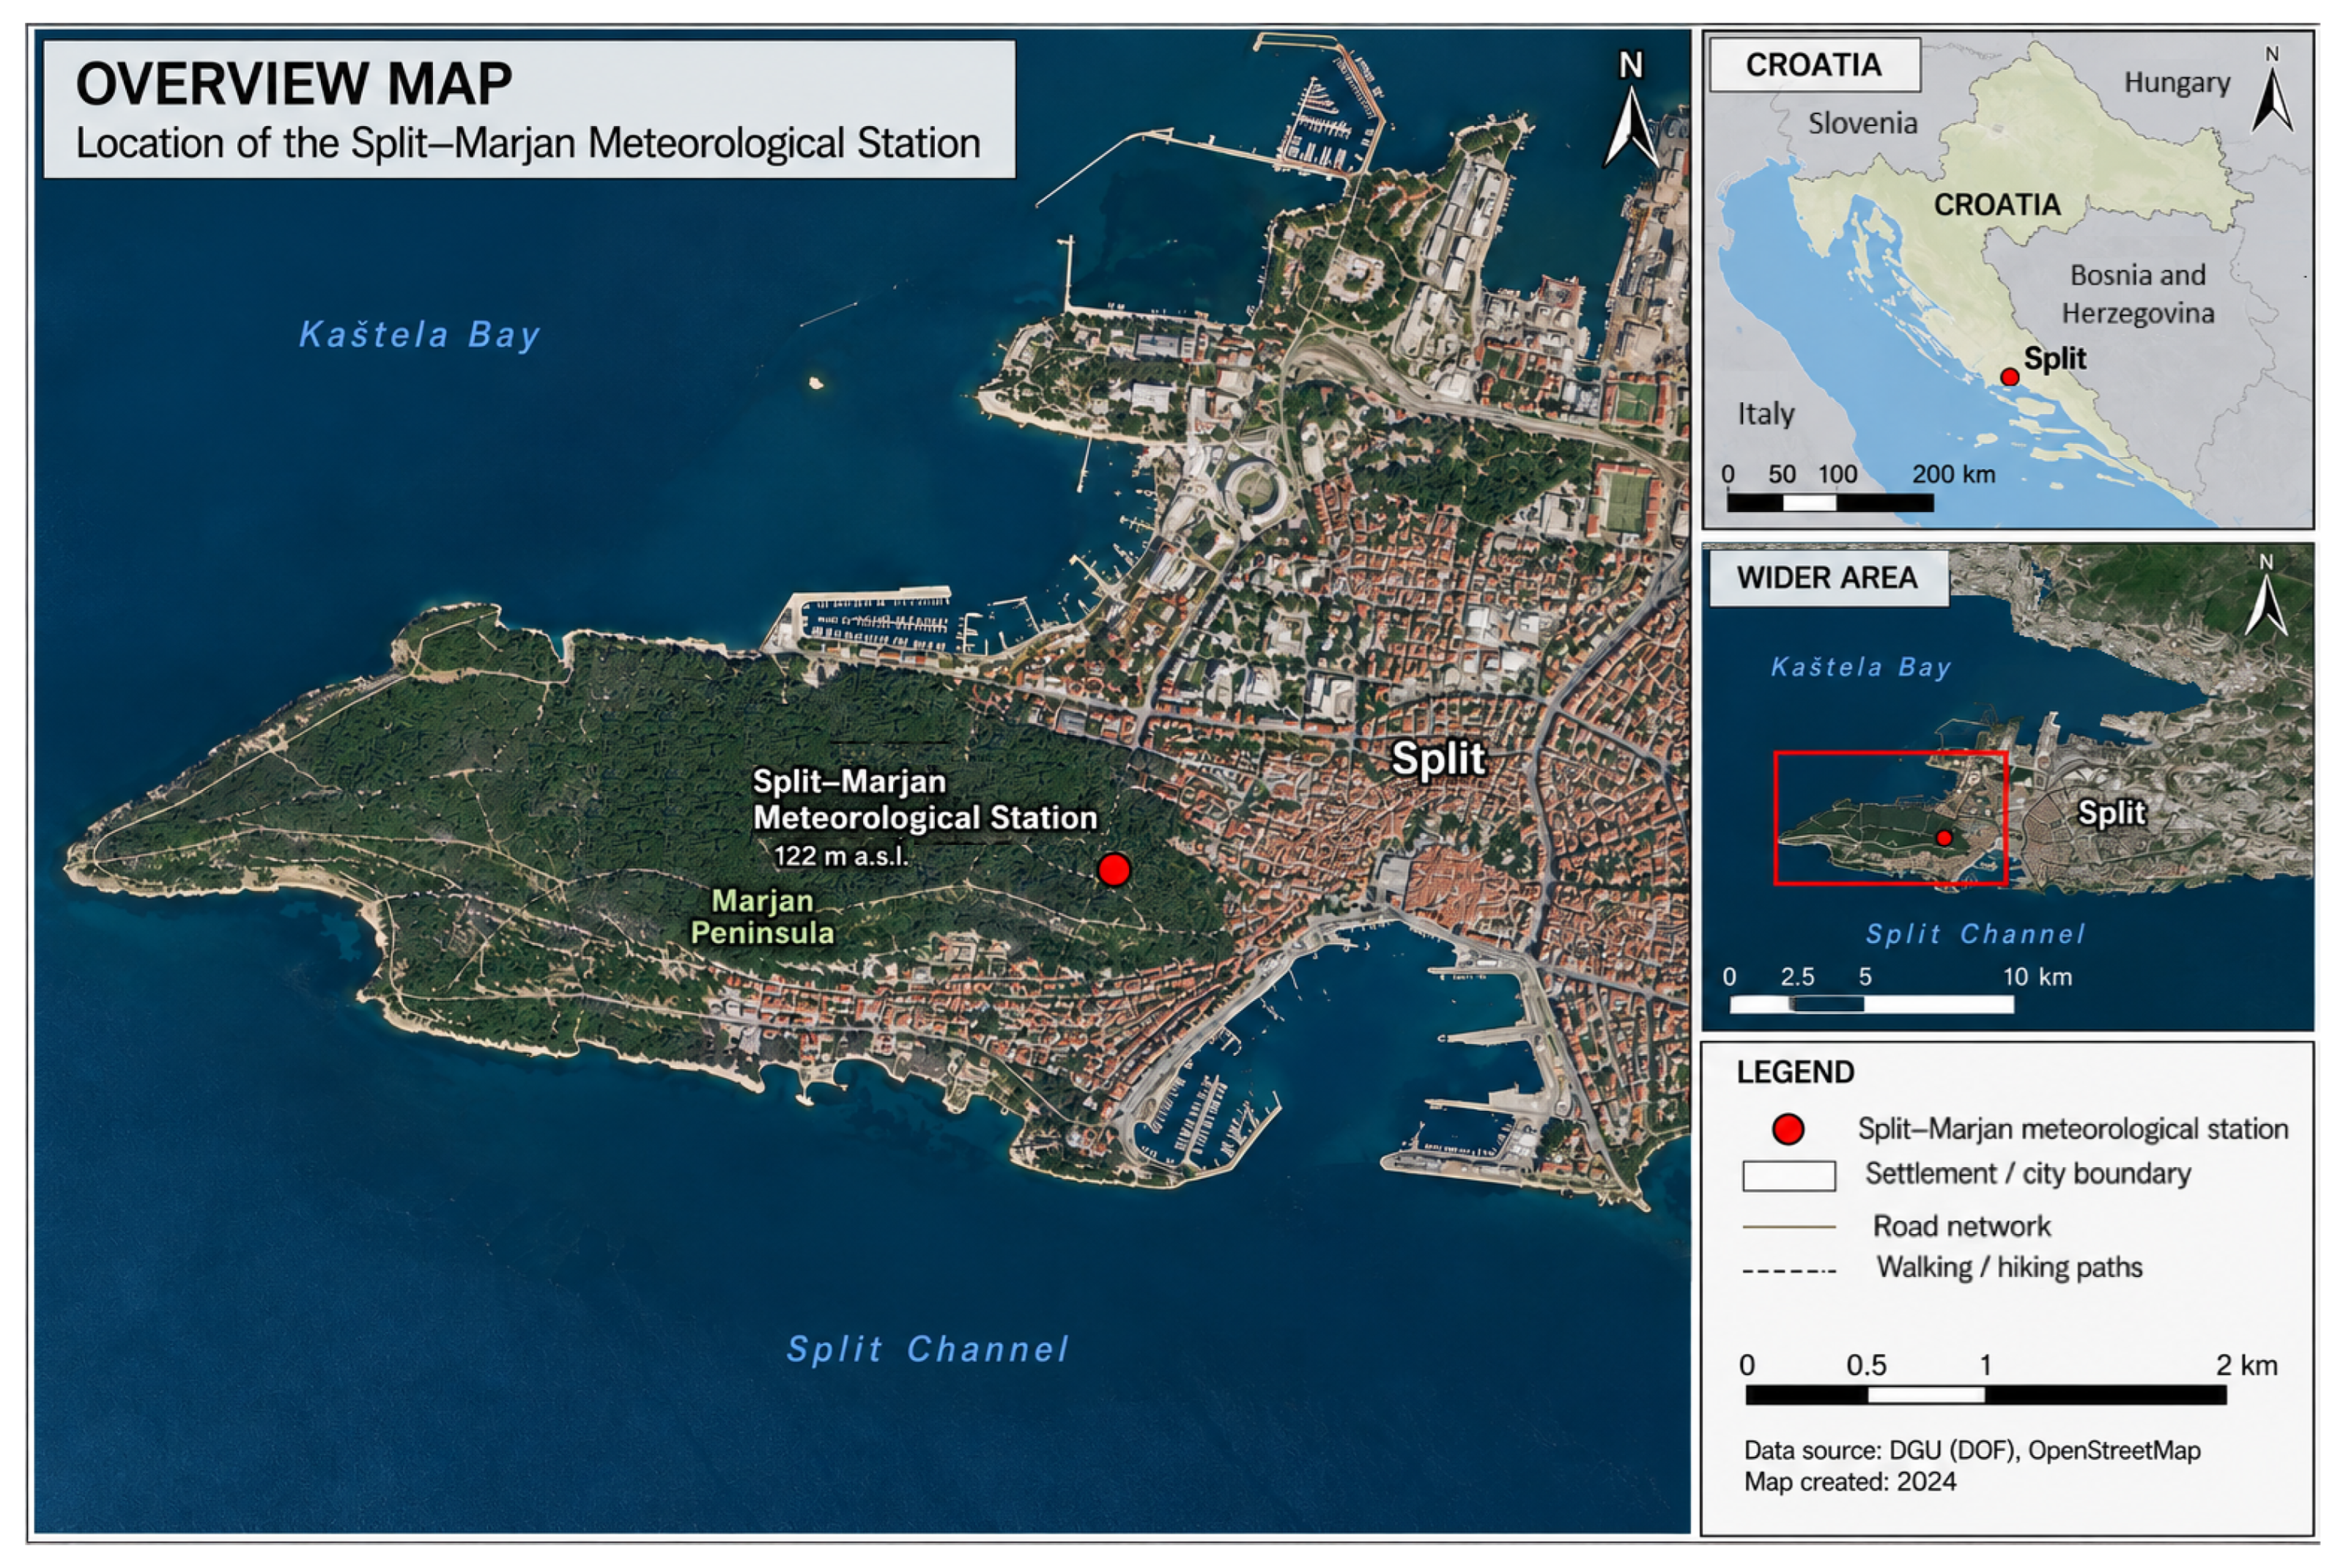
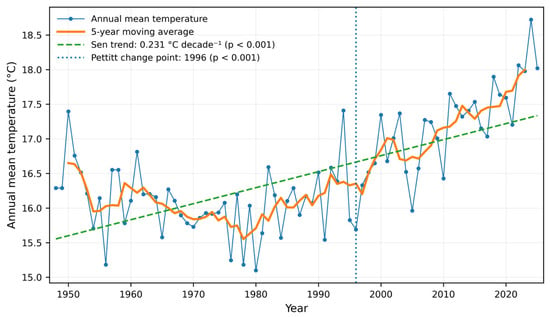
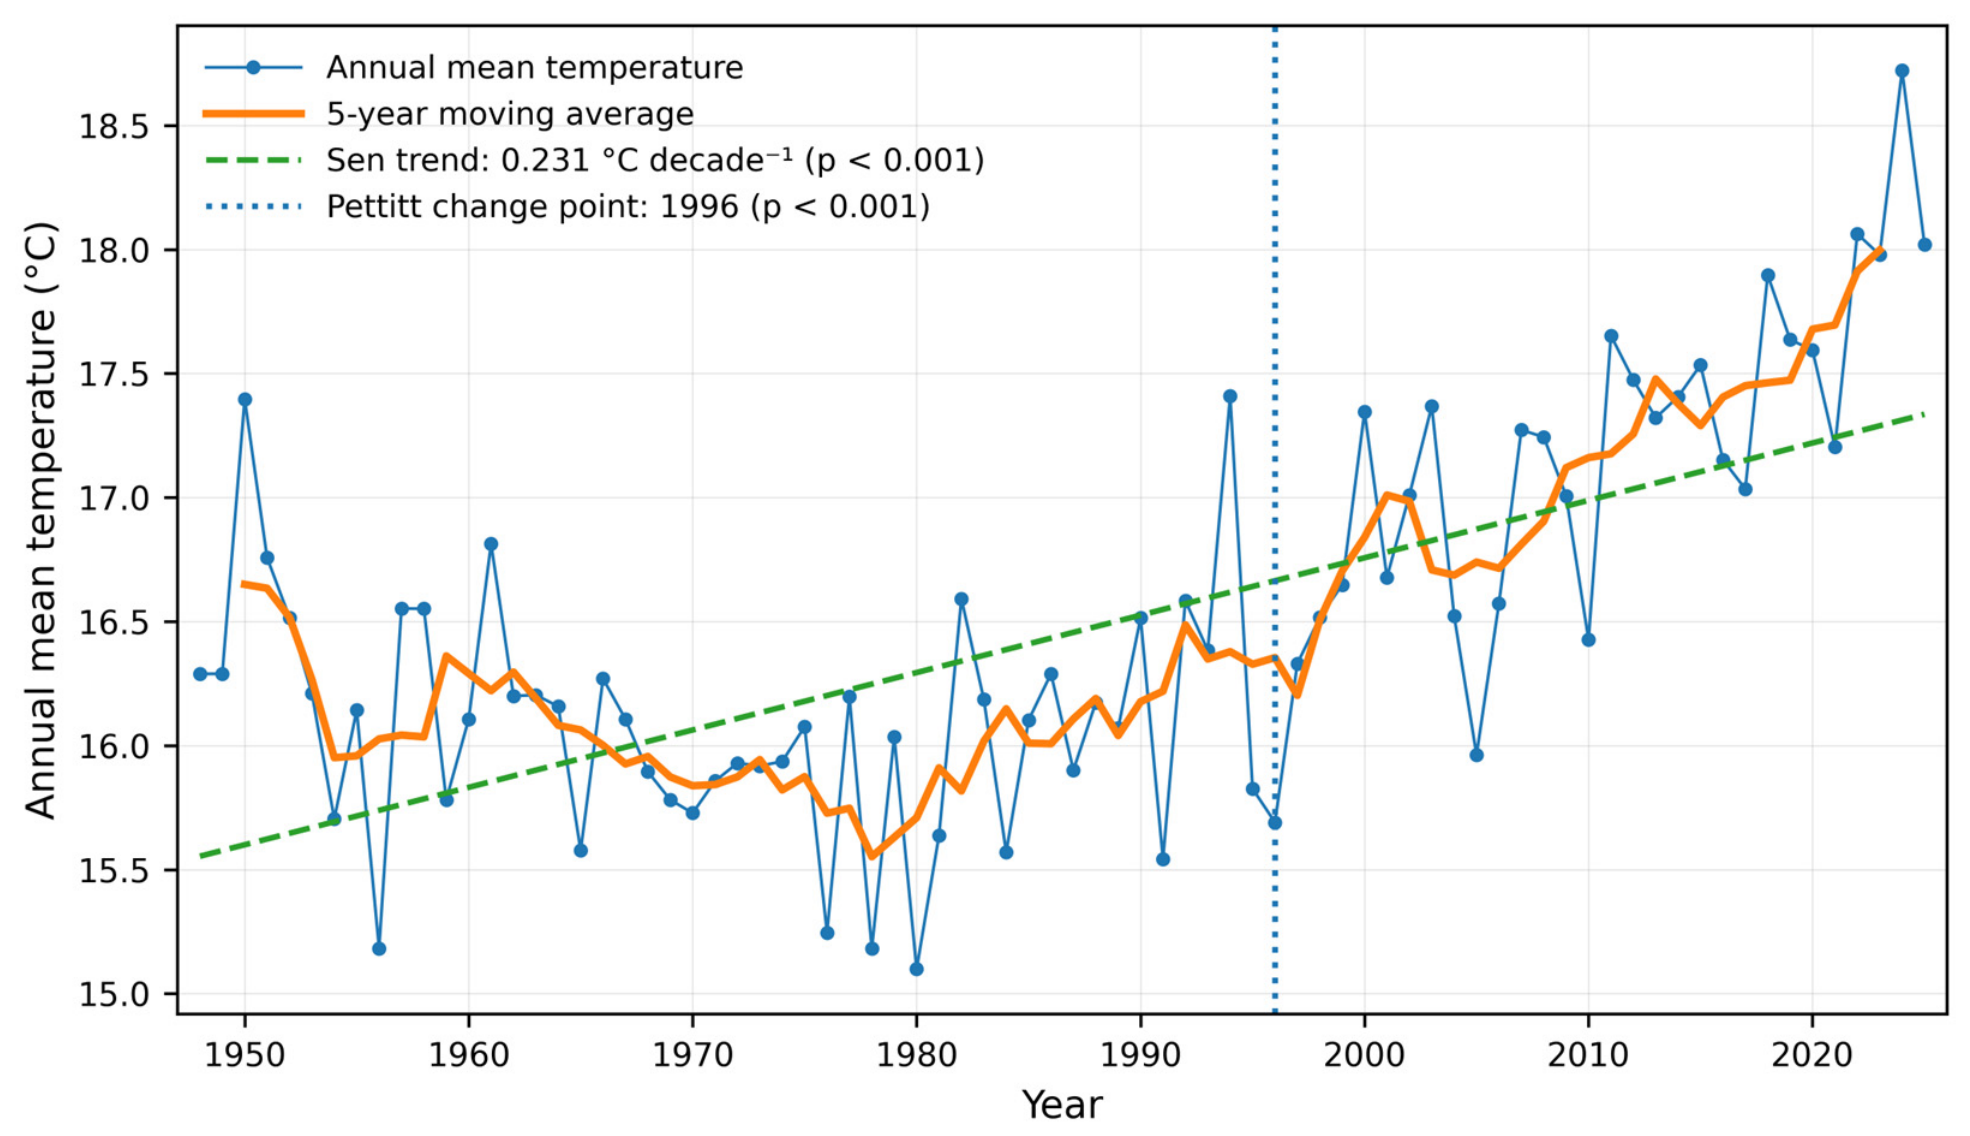
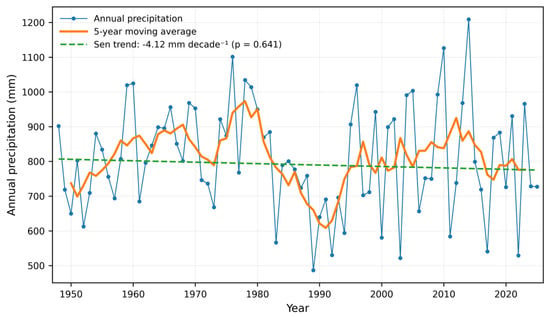
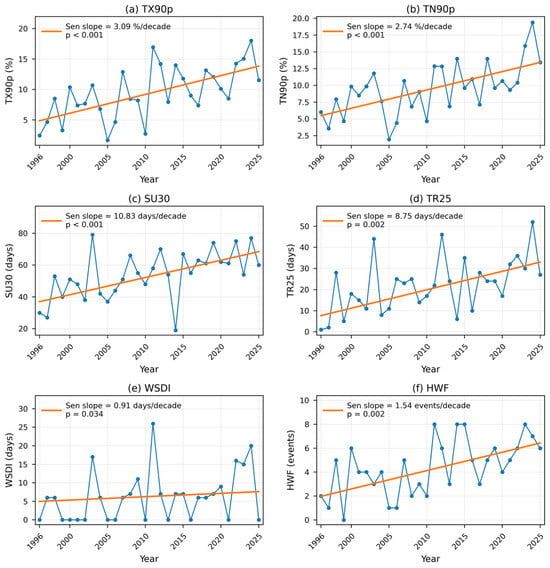
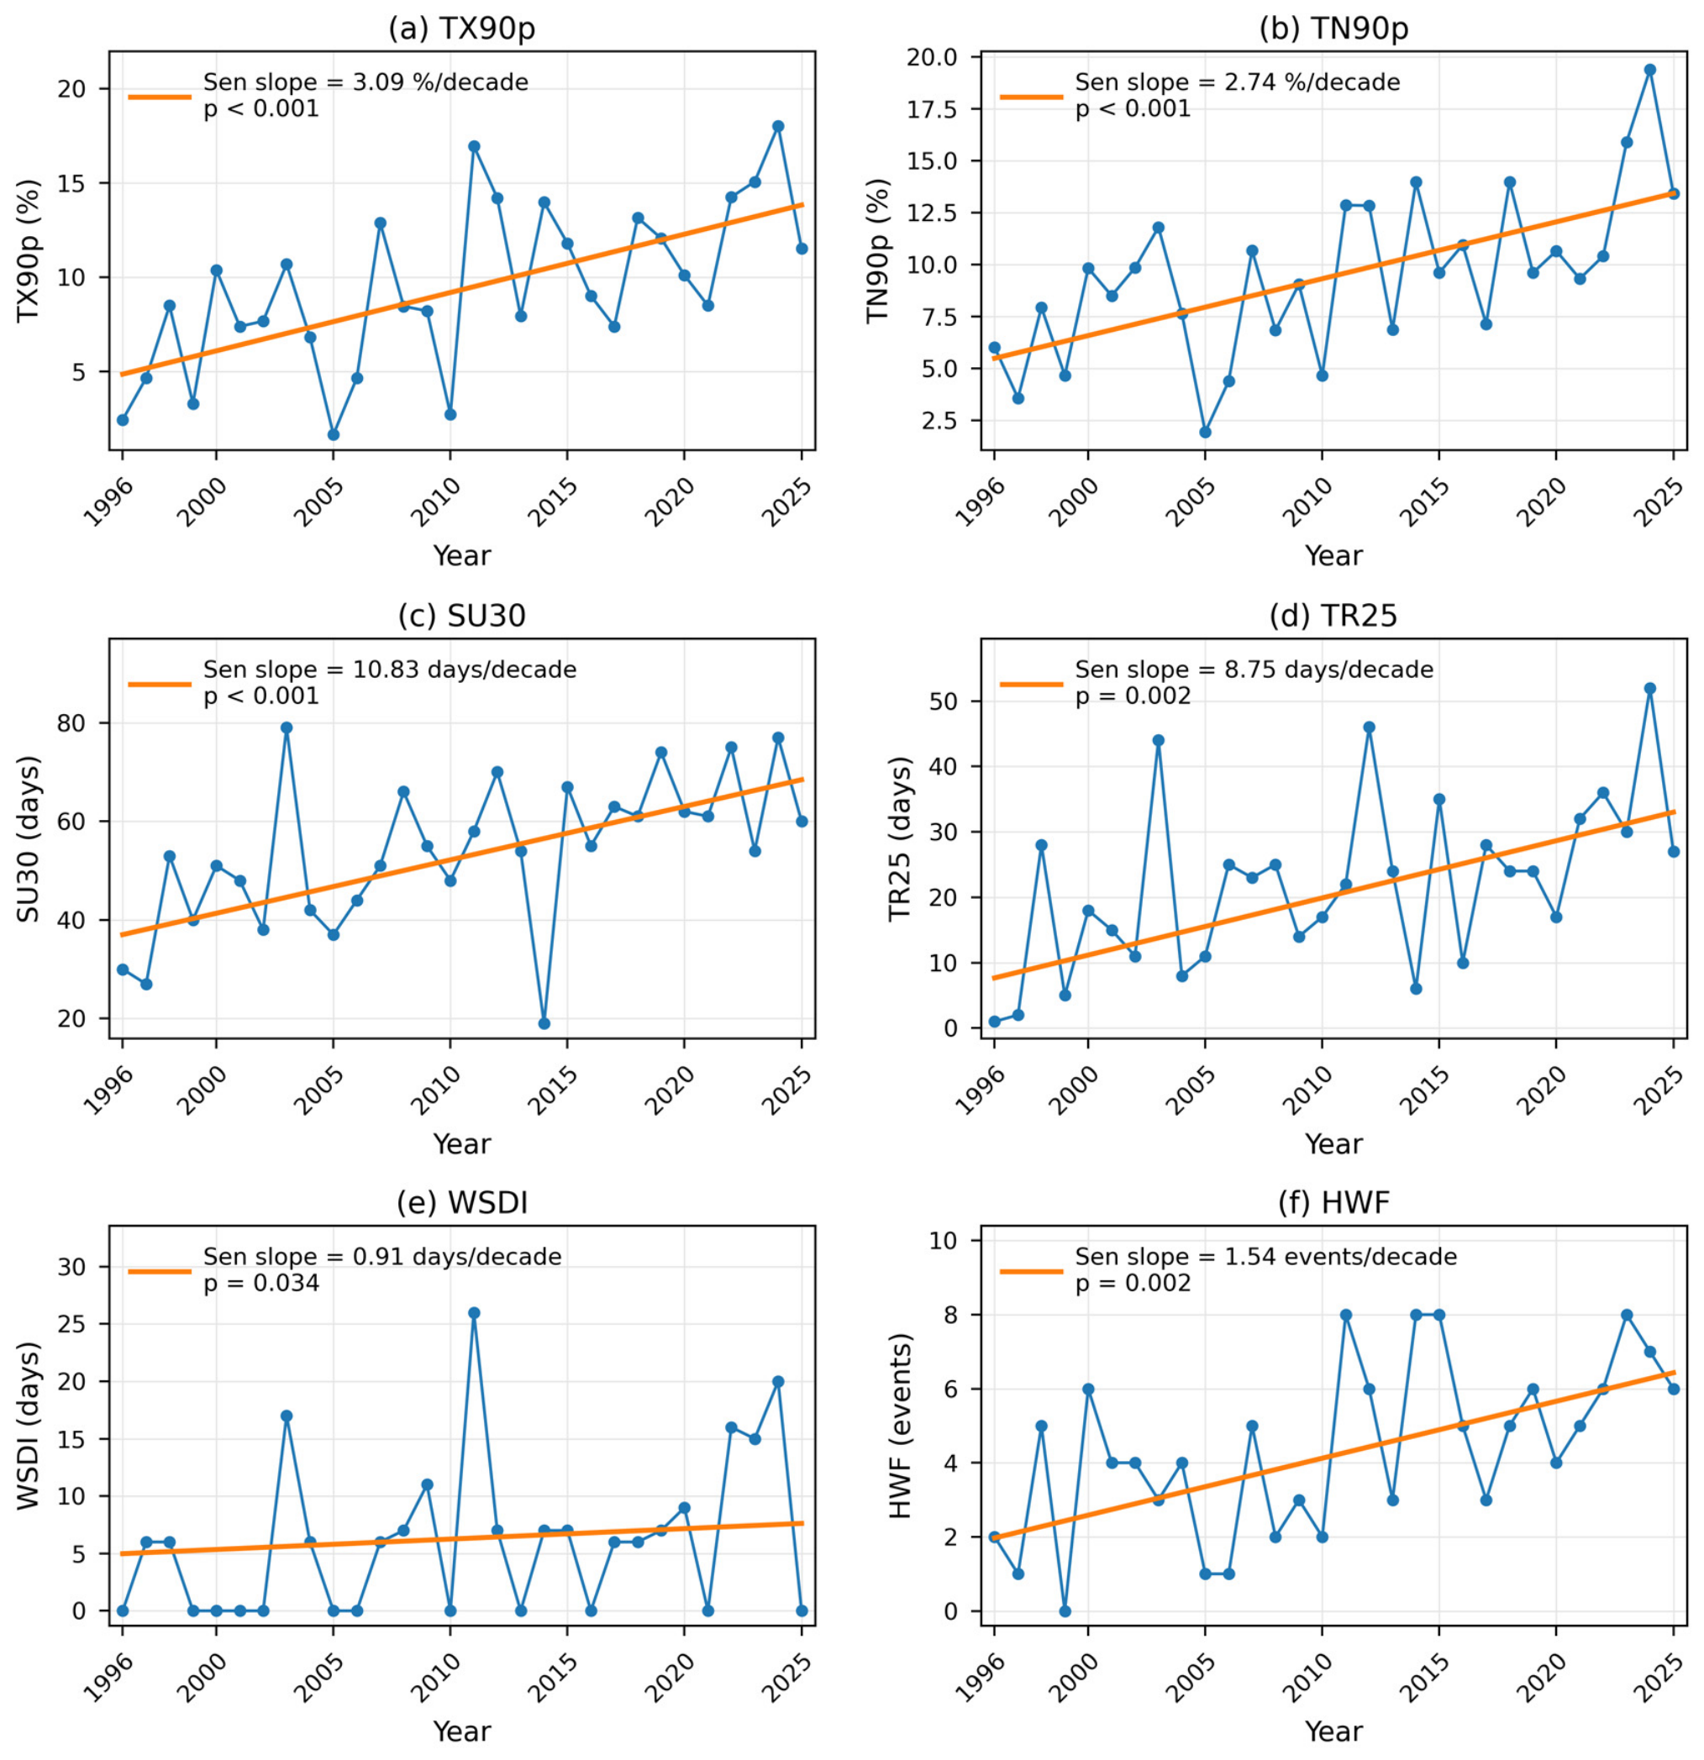
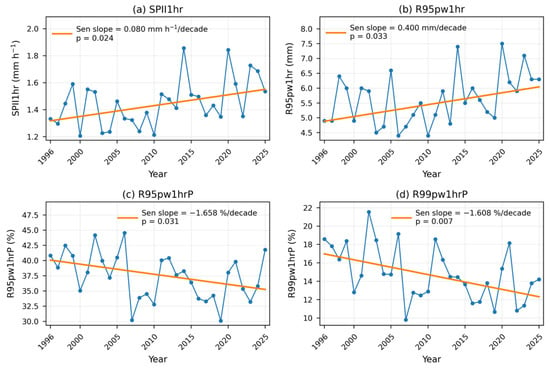
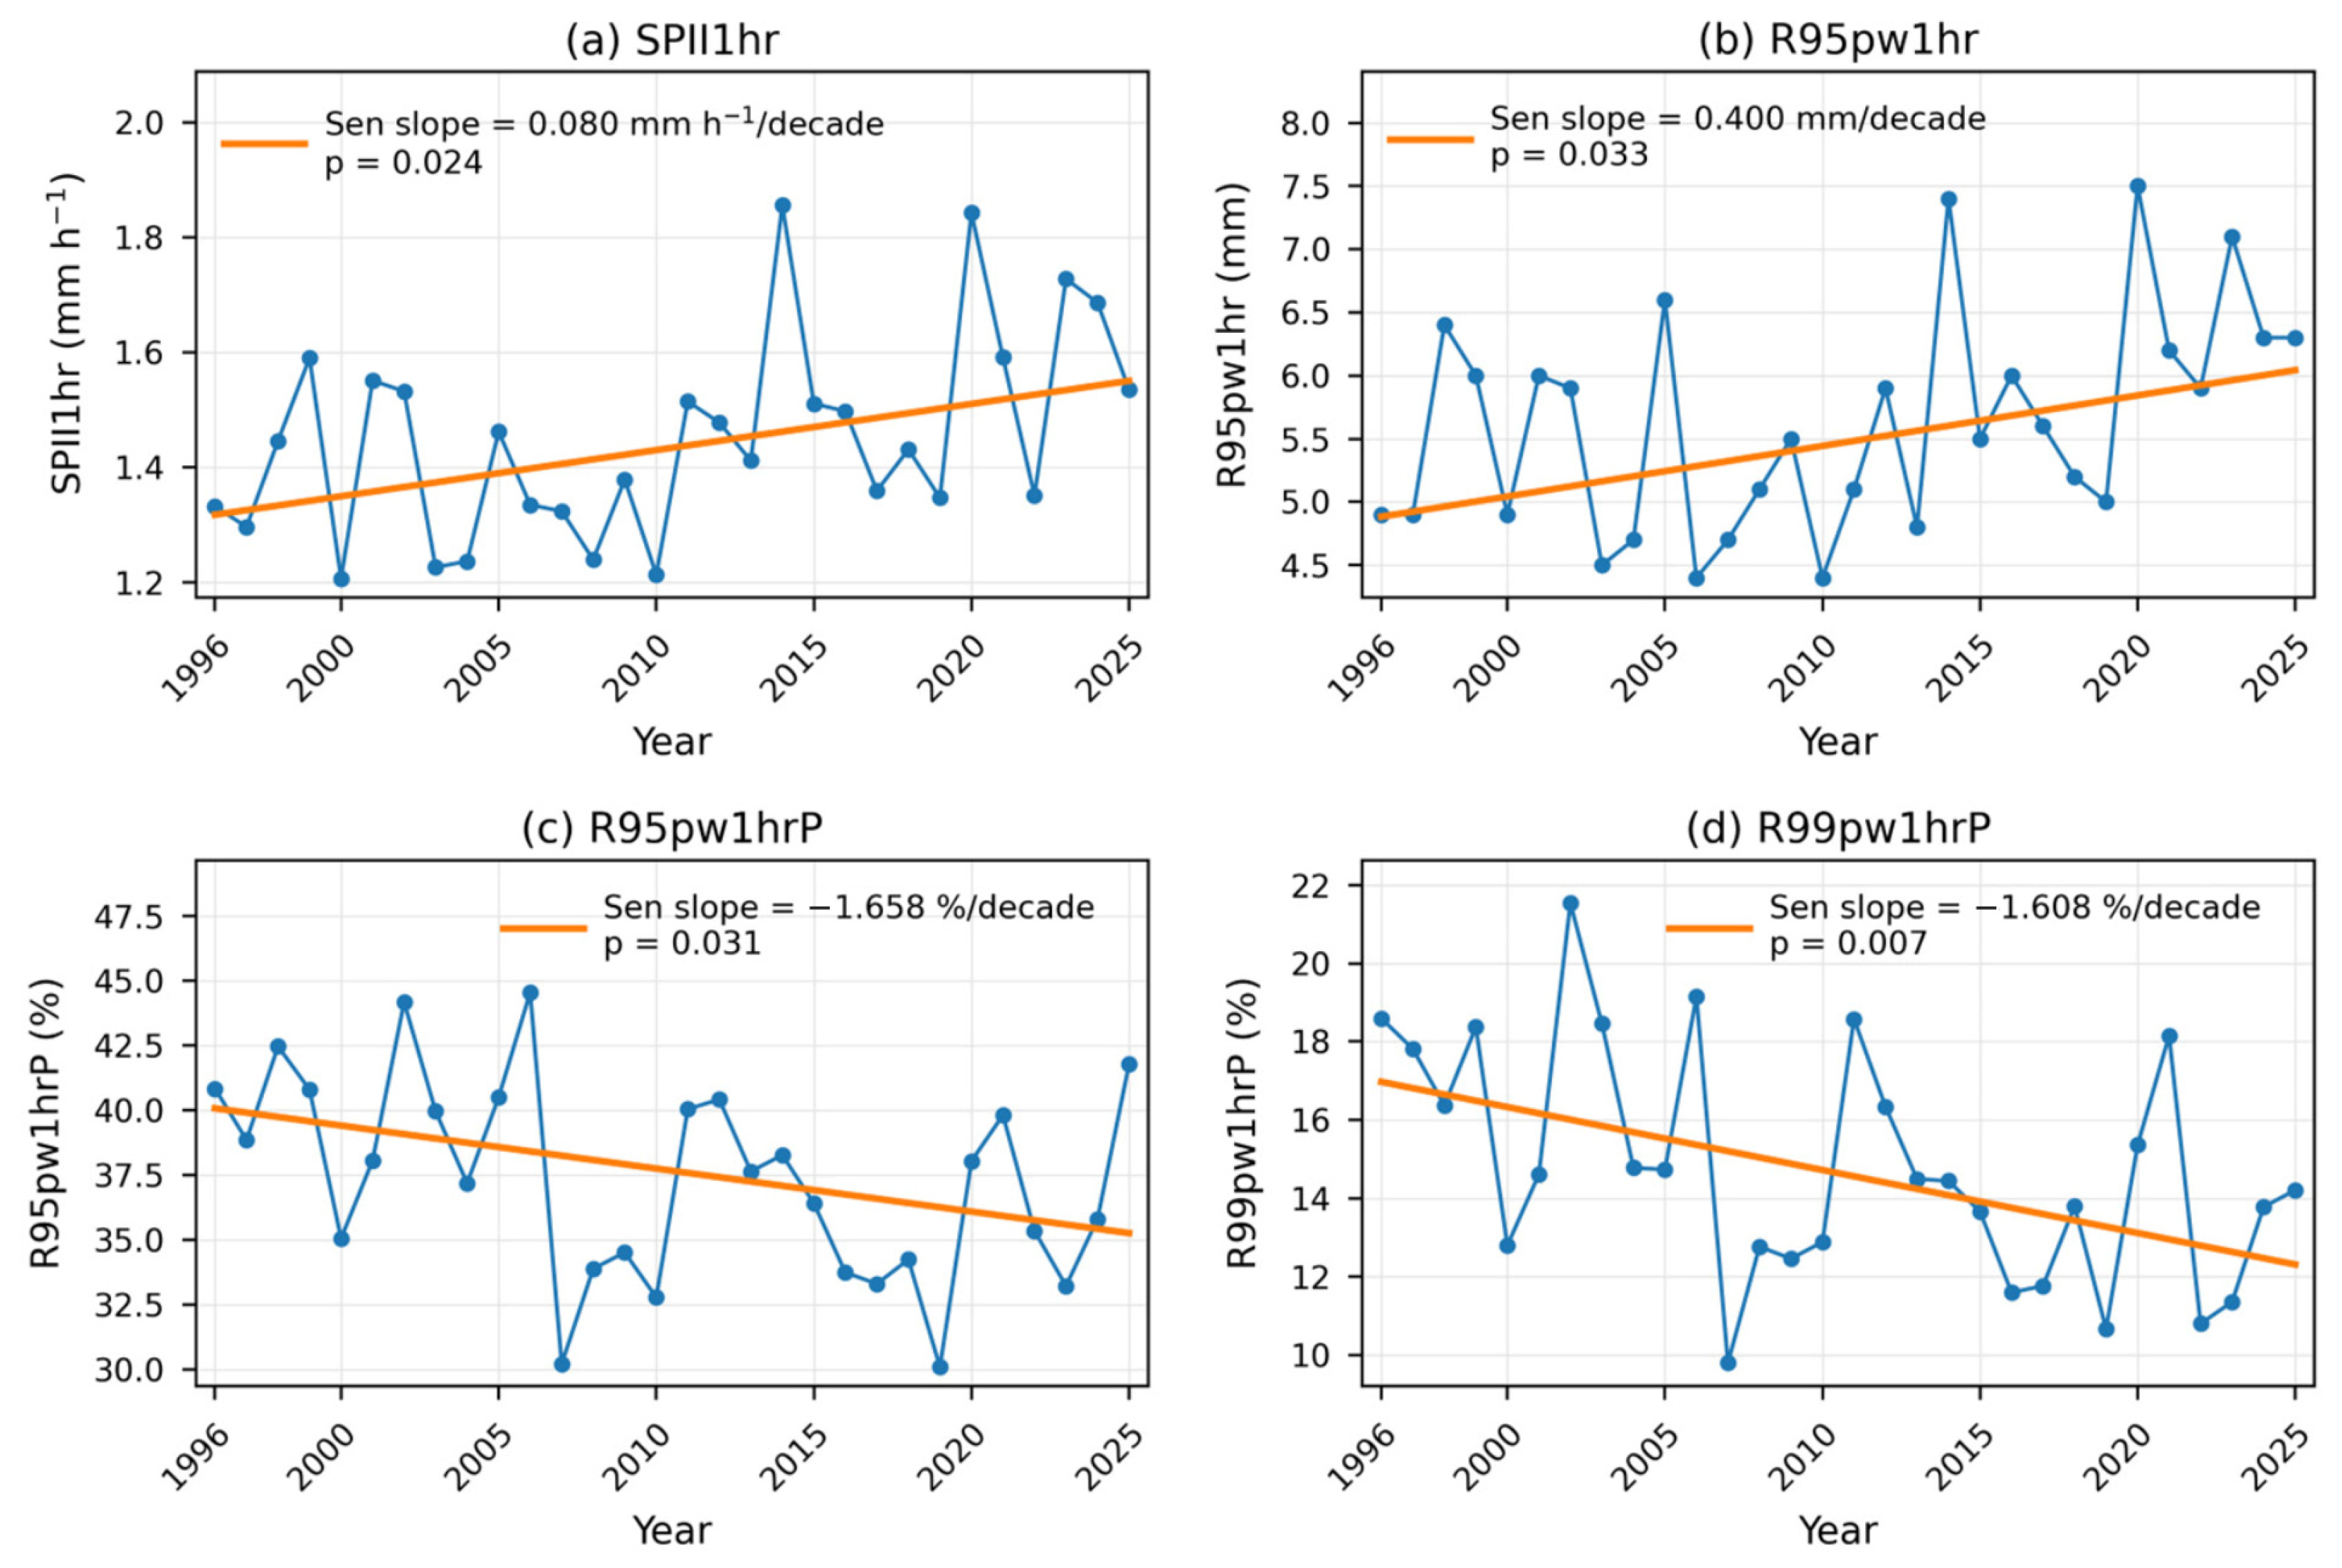
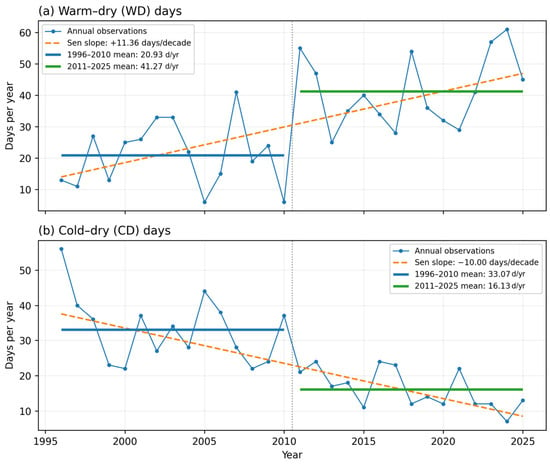
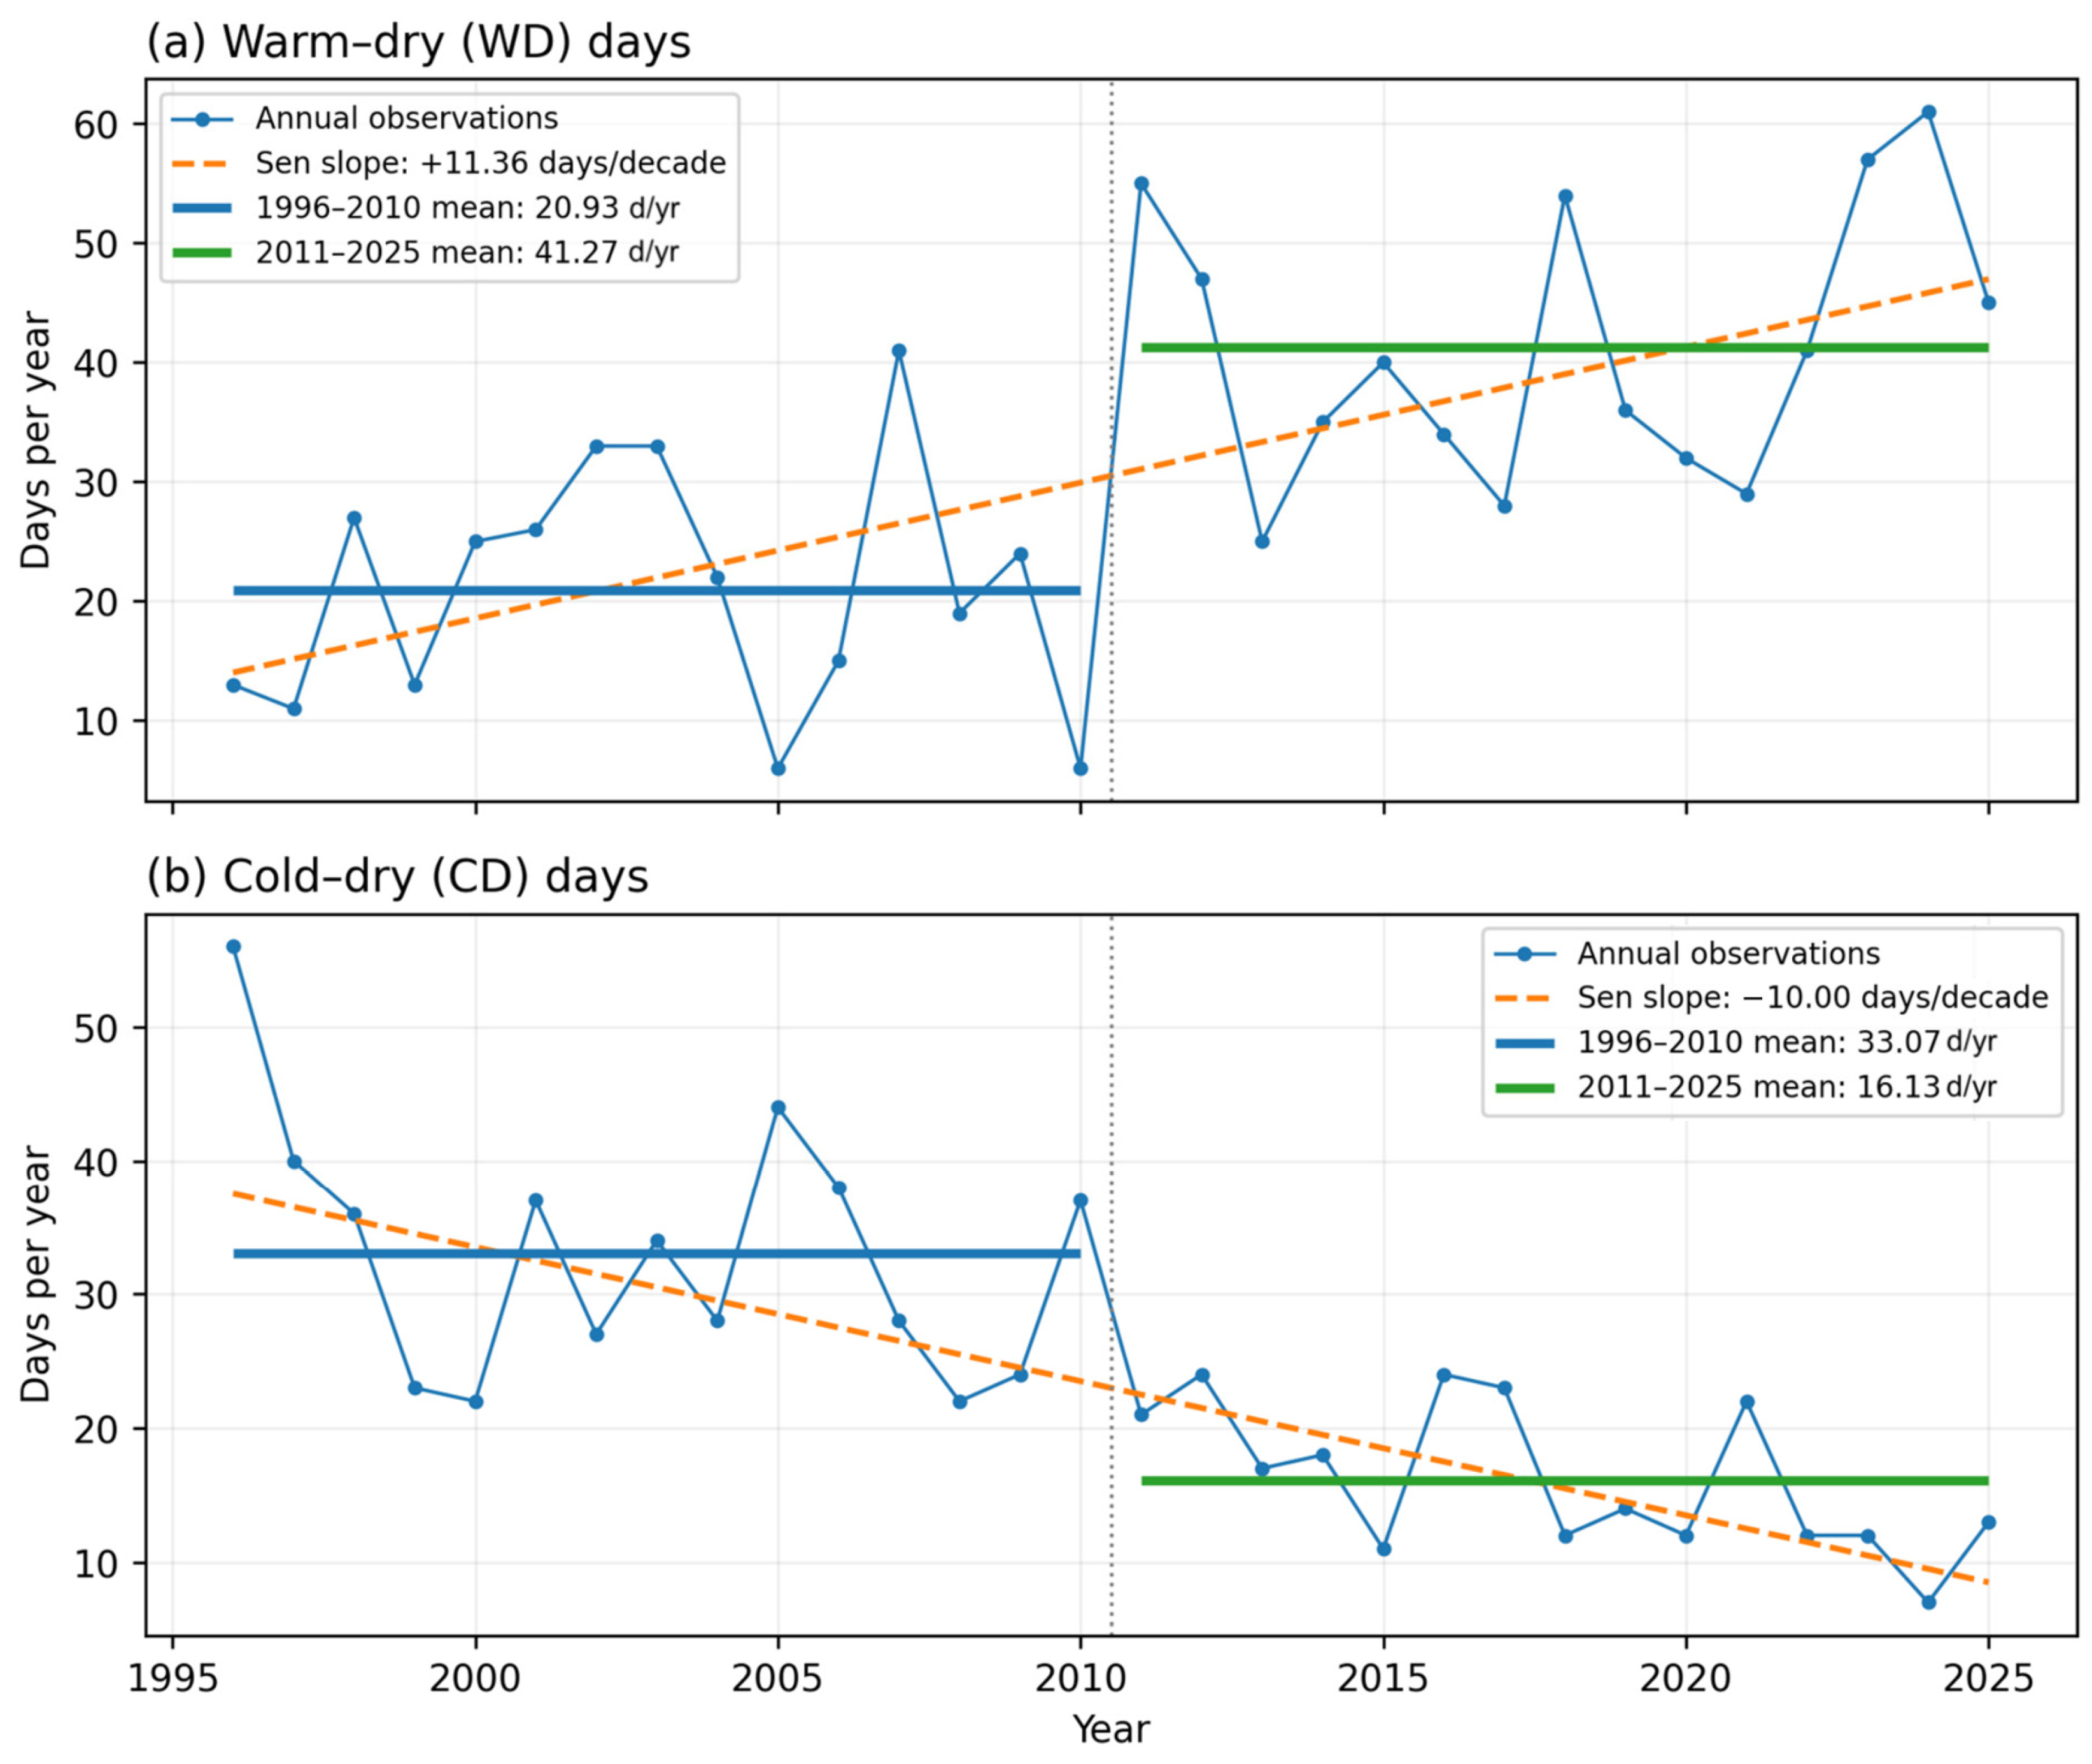
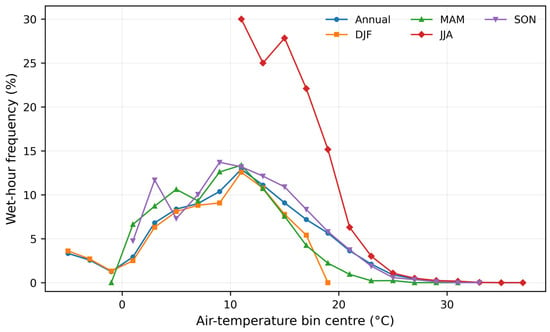
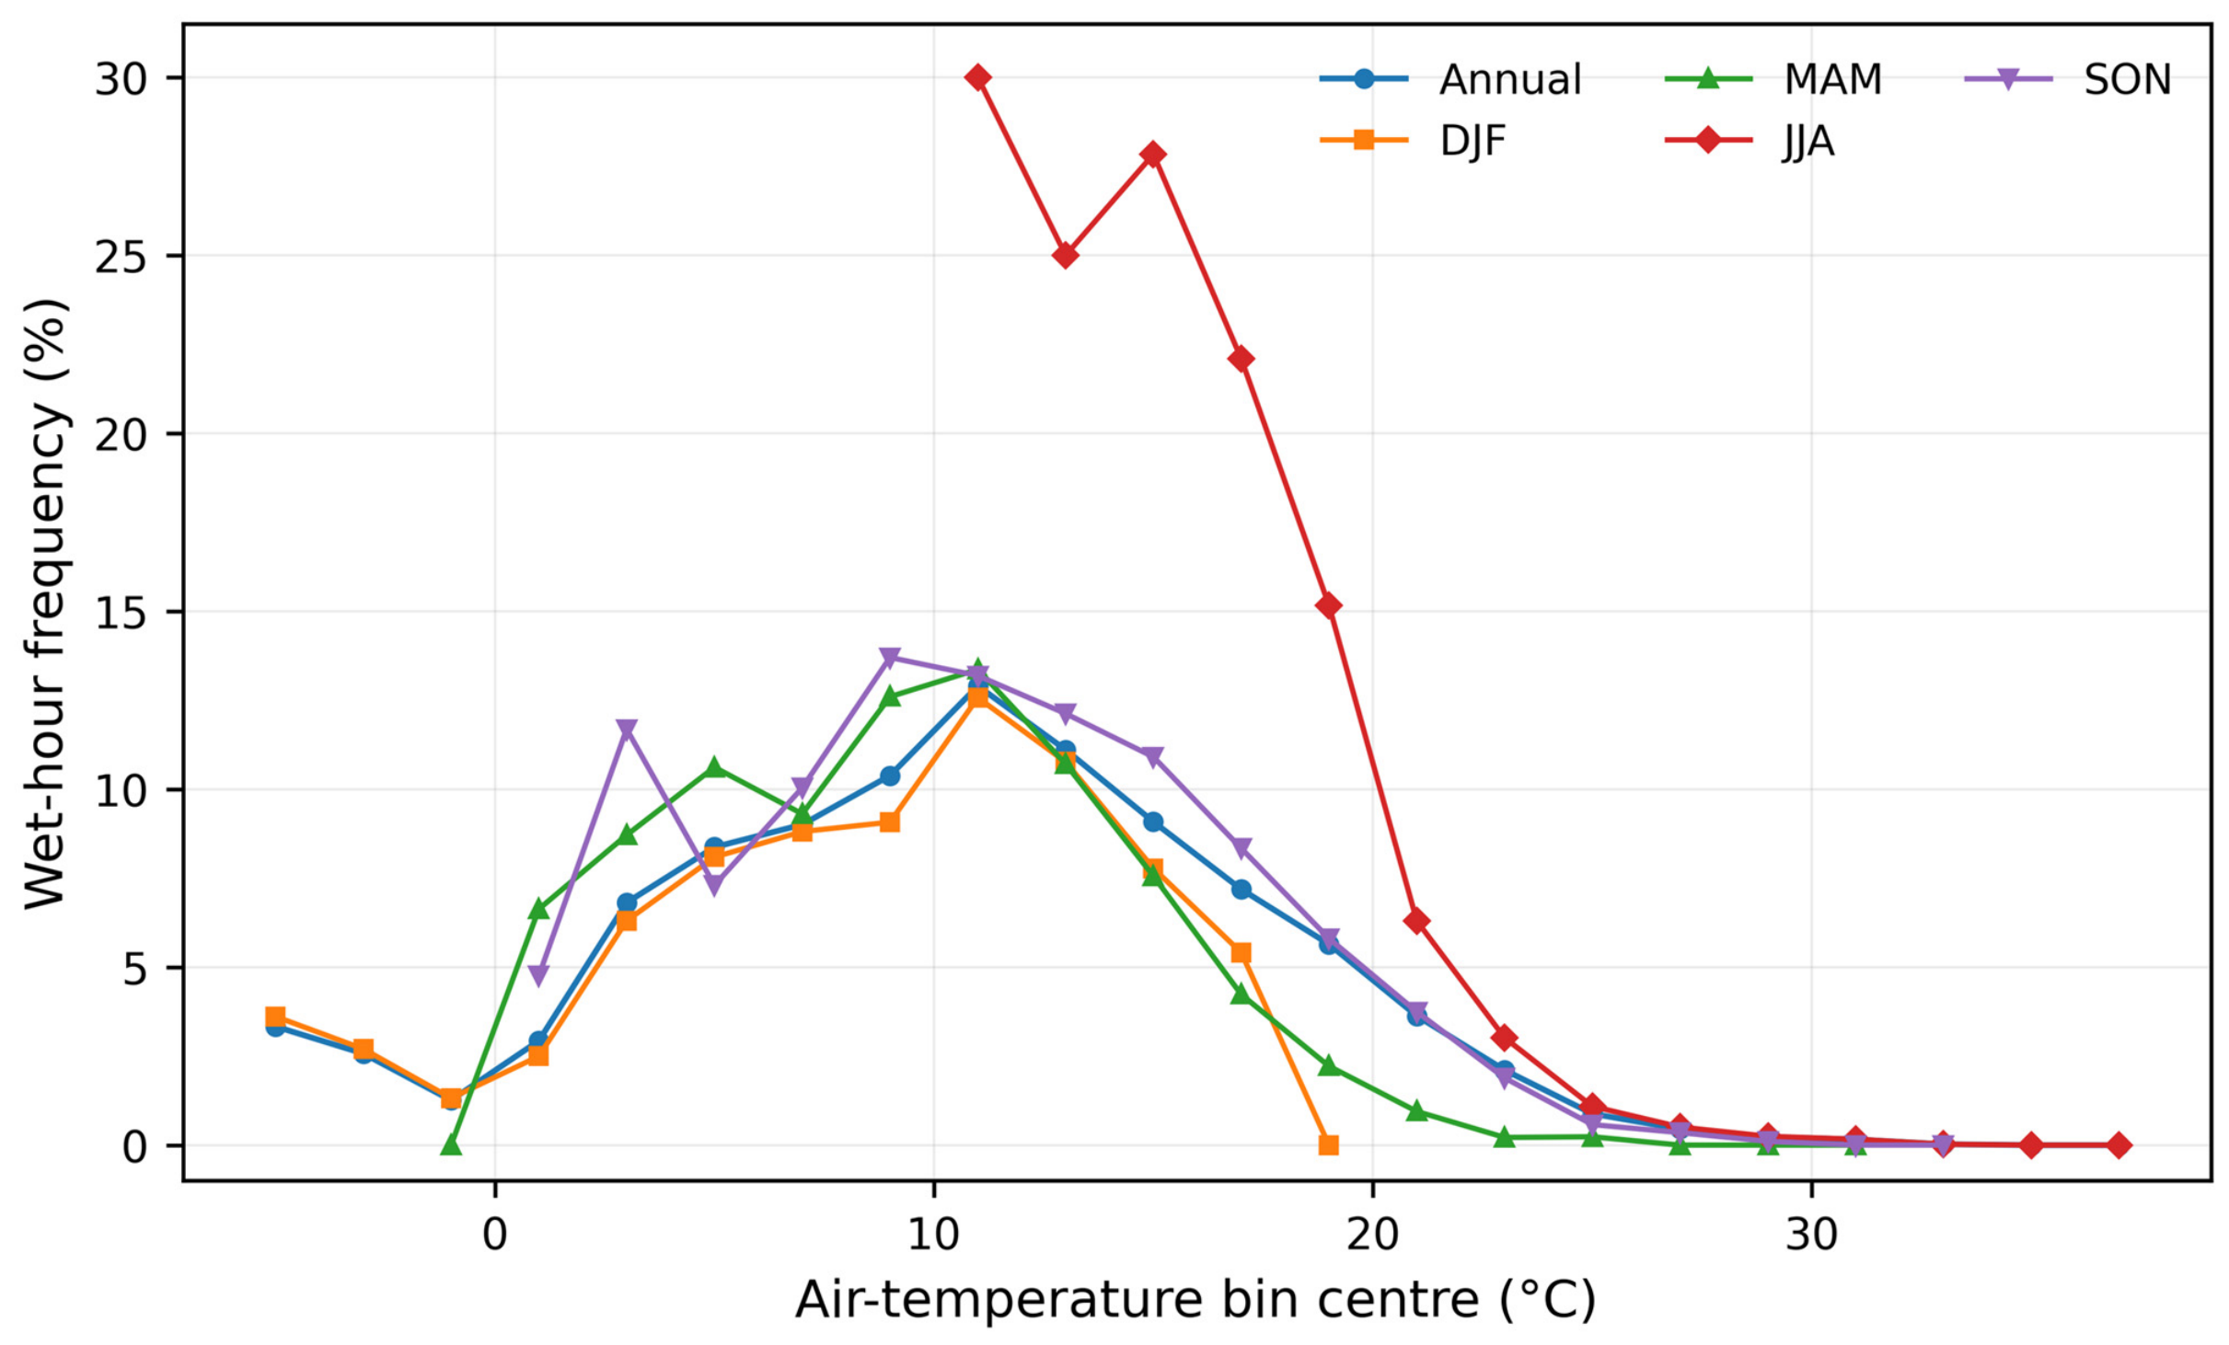
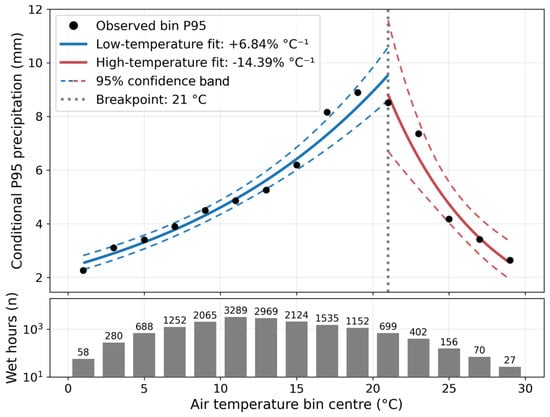
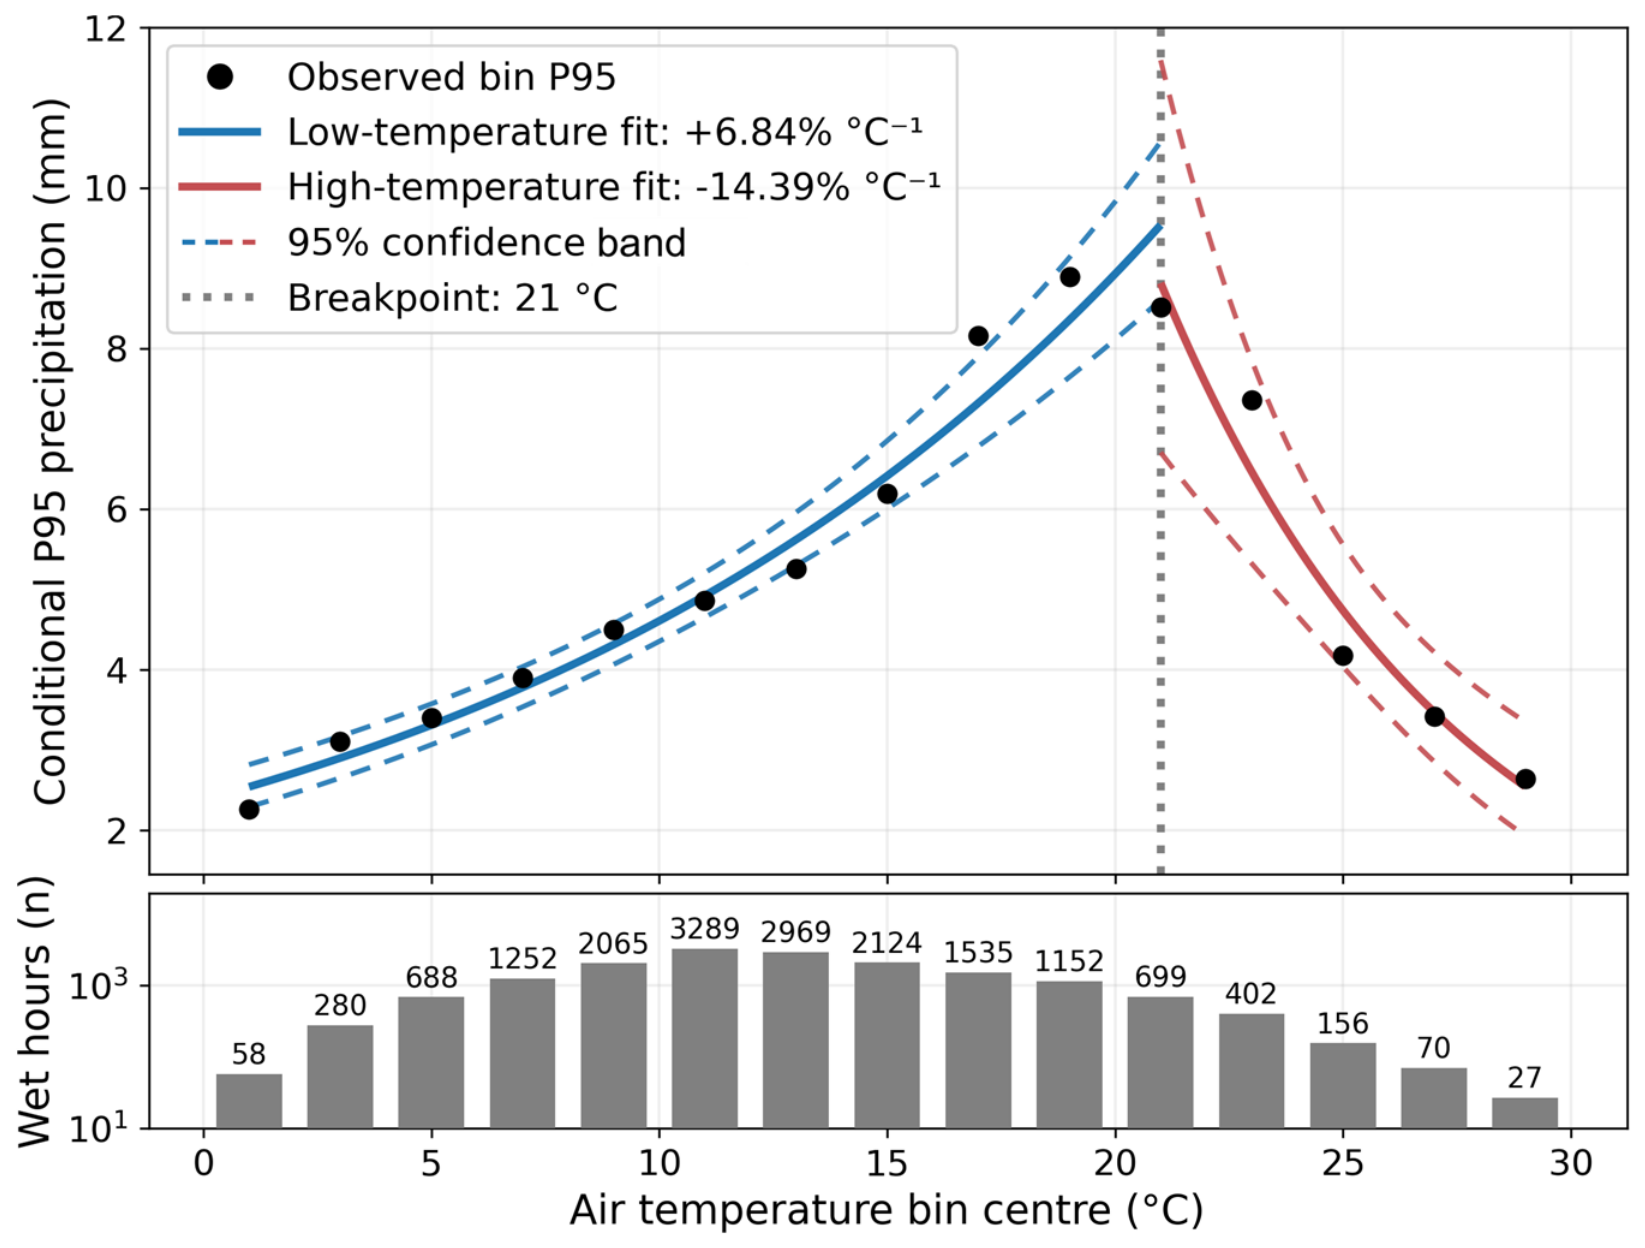

Disclaimer/Publisher’s Note: The statements, opinions and data contained in all publications are solely those of the individual author(s) and contributor(s) and not of MDPI and/or the editor(s). MDPI and/or the editor(s) disclaim responsibility for any injury to people or property resulting from any ideas, methods, instructions or products referred to in the content. |
© 2026 by the authors. Licensee MDPI, Basel, Switzerland. This article is an open access article distributed under the terms and conditions of the Creative Commons Attribution (CC BY) license.