


Abstract
This study comparatively assesses household climate vulnerability and adaptive capacity across cyclone-prone communities in Mozambique, Malawi, and Madagascar through a gendered lens. Drawing on 2618 primary household surveys, a Household Vulnerability Index (HVI) was constructed via Principal Component Analysis (PCA) within the IPCC exposure–sensitivity–adaptive capacity framework, with group differences evaluated using ANOVA and Bonferroni post hoc tests. The analysis tests three core hypotheses: cross-country differences in vulnerability (H1), gender as a determinant of vulnerability category membership (H2), and adaptive capacity as the primary driver of cross-country divergence (H3). Findings indicate that Mozambique’s study sites exhibit the highest vulnerability among the three countries, driven by compounding exposure, elevated sensitivity, and constrained adaptive capacity. Conversely, Malawi’s study sites present the lowest overall vulnerability as superior adaptive capacity offsets household vulnerability. Madagascar’s study sites occupy an intermediate position, with households concentrated in moderate vulnerability due to structural sensitivity and limited adaptive capacity. Although mean HVI scores are statistically indistinguishable across gender groups (F < 0.01; p = 0.980), category distributions reveal a gendered division of risk: male-headed households face higher direct occupational exposure, whereas female-headed households suffer structural deficits in adaptive capacity. These findings demonstrate that adaptive capacity, rather than physical exposure, is the primary driver of cross-country divergence in household vulnerability, and that gender restructures risk pathways rather than altering aggregate vulnerability levels. Targeted institutional investments in extension services, anticipatory action frameworks, and gender-responsive training are therefore critical pathways to vulnerability reduction in comparable low-income settings.
1. Introduction
Southern Africa faces growing exposure to droughts, floods, and cyclones that compromise livelihoods, ecosystems, and infrastructure [1,2,3,4]. These hazards pose a particular threat to countries marked by dependence on climate-sensitive sectors, widespread poverty, weak infrastructure, and limited adaptive capacity [4,5]. Recent projections indicate rising temperatures, more erratic rainfall, and more frequent extreme weather events with far-reaching consequences for agriculture, food security, water, and rural livelihoods across the region [1,2,6].
Climate vulnerability denotes the extent to which households or systems are susceptible to and unable to cope with the effects of climate variability [7,8]. According to the IPCC, vulnerability results from the interaction of three dimensions: exposure, sensitivity, and adaptive capacity [9]. Specifically, exposure refers to the extent to which households are subjected to climate hazards (cyclones, floods, and droughts), sensitivity reflects the degree to which livelihoods and living conditions are affected by such stressors, and adaptive capacity refers to the ability of households and communities to anticipate, respond to, and recover from climate shocks [7,8,10].
In this study, each IPCC dimension is operationalized through indicators selected on the basis of established theoretical frameworks and prior empirical application in flood- and cyclone-prone contexts [7,8,10]. Exposure is captured through realized household-level asset losses; sensitivity through livelihood and structural conditions; and adaptive capacity through institutional access, social capital, material endowments, and liquid capital reserves. Full indicator definitions and justifications are provided in Table 2.
Despite sharing common climate risks, the three countries differ markedly in their vulnerability profiles, owing to distinct institutional settings, socioeconomic conditions, and adaptive capacity. Mozambique is highly exposed to climate-related disasters—including tropical cyclones, floods, and droughts—due to its long coastline and extensive low-lying areas, compounded by high poverty rates, with 60% of the population living below the international poverty line of USD 2.15 per person per day [11,12]. Malawi, although landlocked, remains vulnerable due to its heavy dependence on rain-fed agriculture, recurrent flooding within the Shire Valley basin, limited livelihood diversification, and high poverty rates—with approximately 70.3% of the population living below USD 2.15 per person per day [2]. In Madagascar, vulnerability reflects exposure to cyclones, weak infrastructure, and cumulative household asset loss from repeated climate shocks, compounded by extreme poverty: approximately 75.2% of the population lives below USD 2.15 per person per day [3,11].
Climate vulnerability does not fall equally across social groups. Evidence from Sub-Saharan Africa consistently demonstrates that women are disproportionately affected by climate change due to unequal access to productive assets, land, education, climate information, financial services, agricultural technologies, and decision-making processes—barriers that systematically undermine the adaptive capacity of female-headed households and amplify their vulnerability to climate shocks [13,14,15]. Such inequalities are magnified in rural areas where households depend on climate-sensitive sectors such as agriculture, fisheries, and livestock.
The literature on climate vulnerability has grown considerably, yet key empirical gaps remain. Most existing studies focus either on specific countries or on isolated dimensions of vulnerability, offering limited comparative evidence across different national contexts. In particular, cross-country studies integrating exposure (EXP), sensitivity (SE), adaptive capacity (AC), and gender dimensions simultaneously remain scarce in Southern Africa. Many vulnerability assessments also focus on mean or aggregate outcomes, giving limited attention to the dispersion, intensity, and heterogeneity of risk within and across contexts.
To address these gaps, this study evaluates household climate vulnerability and adaptive capacity across Mozambique, Malawi, and Madagascar, drawing on the distinct geographical, institutional, and macroeconomic profiles outlined above. By leveraging micro-level household survey data, the paper examines how institutional environments, livelihood structures, and gender dynamics shape household vulnerability across distinct macroeconomic settings. While vulnerability is also stratified by age, disability, household size, and ethnicity, this study focuses explicitly on gender as the primary social stratifier, given its decisive role in governing access to resources and institutional support in the study contexts [13,14,15,16]. Specifically, this study tests three interconnected hypotheses:
H1.
Household climate vulnerability differs significantly across Mozambique, Malawi, and Madagascar, reflecting distinct underlying profiles of exposure, sensitivity, and adaptive capacity.
H2.
The gender of the household head is a statistically significant determinant of vulnerability category membership, with female-headed households exhibiting structural deficits in adaptive capacity.
H3.
Adaptive capacity serves as the primary explanatory factor driving cross-country divergence in composite Household Vulnerability Index (HVI) scores.
The remainder of this paper is organized as follows: Section 2 outlines the study area and site selection; Section 3 details the data sources, indicator selection, and HVI construction methodology; Section 4 presents and discusses the empirical findings across vulnerability dimensions and gender groups and closes with the study’s methodological limitations; Section 5 presents the conclusions; and Section 6 discusses the policy and strategic implications of the findings.
2. Study Area
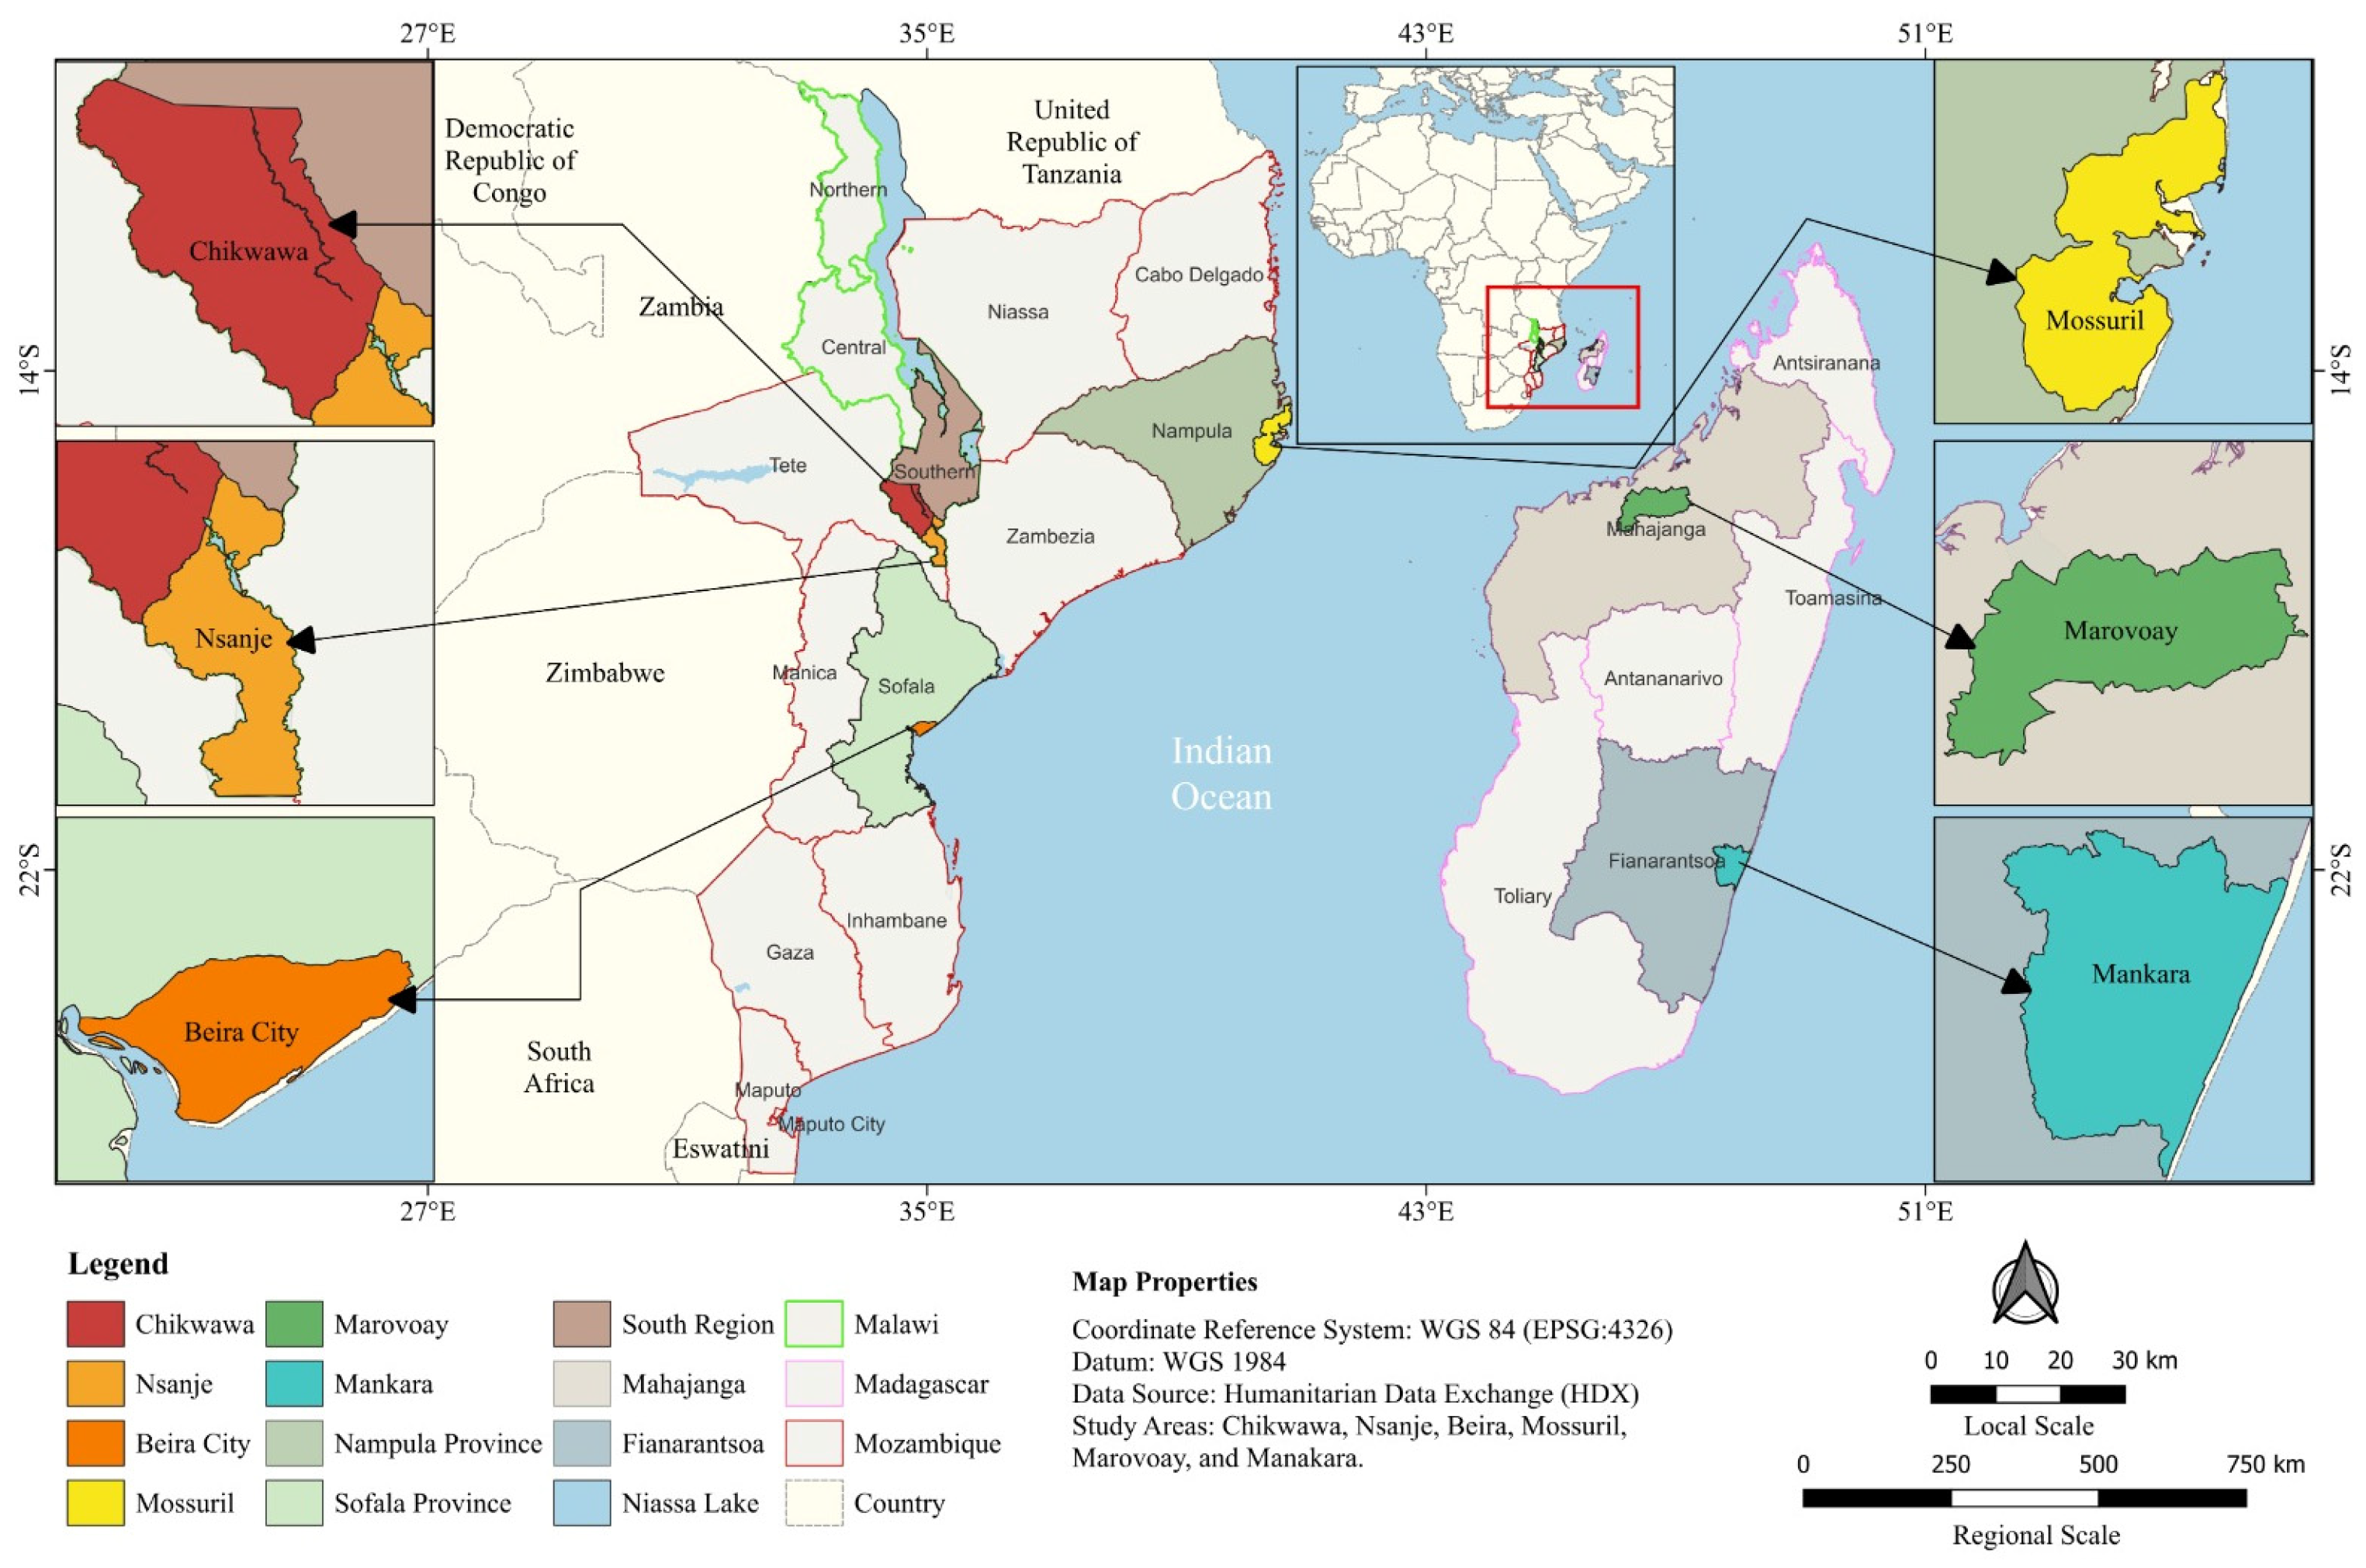
This study was conducted across three countries in Southern Africa: Mozambique (MOZ), Malawi (MWI), and Madagascar (MAD). The empirical analysis focuses on two distinct areas per country: Beira and Mossuril (Mozambique), Chikwawa and Nsanje (Malawi), and Marovoay and Manakara (Madagascar). These six sites represent diverse socioeconomic, ecological, and institutional contexts within a shared high-exposure region, enabling a systematic cross-national comparative assessment (Figure 1).
Figure 1.
Geographic location of study sites in Mozambique (Beira and Mossuril), Malawi (Chikwawa and Nsanje), and Madagascar (Marovoay and Manakara). Source: Authors.
2.1. Socioecological Context of Mozambique
Mozambique is among the most disaster-prone countries in Southern Africa, highly exposed to tropical cyclones, recurrent flooding, and severe droughts due to its extensive low-lying coastline and extreme climatic variability. National life expectancy stands at 60.8 years for men and 67.1 years for women—a demographic gap reflecting the heavy combined burden of poverty, infectious disease, and climate-related health risks [17,18]. Both study sites feature a predominantly young population, consistent with the national demographic profile in which approximately 45% of the population is under 15 years of age [18,19]. Primary data were collected in two sites exhibiting contrasting urbanization and climate profiles:
- Beira (Sofala Province): A major coastal city and regional logistics hub located in a low-lying zone acutely vulnerable to sea-level rise, storm surges, and tropical cyclones [17,20], and marked by pronounced socioeconomic inequality [21]. According to the 2017 National Population and Housing Census, Beira recorded 533,825 inhabitants with a population density of 843 inhabitants/km2 [19]. The city is classified under a tropical savanna climate (Aw) [22], characterized by a distinct dry season, high interannual rainfall variability, and an average annual precipitation of 1594 mm (1991–2020 climatological normal) [23].
- Mossuril (Nampula Province): A predominantly rural district where livelihoods rely heavily on rain-fed subsistence agriculture and artisanal fishing [24]. The 2017 census recorded 174,641 inhabitants (48.4% female) at a population density of approximately 120 inhabitants/km2 [19]. Mossuril falls within a semi-arid tropical climate zone (BSh) [22], experiencing lower annual rainfall (800–1000 mm) and pronounced susceptibility to extended droughts and erratic precipitation patterns.
2.2. Socioecological Context of Malawi
In Malawi, extreme weather events, including severe floods, droughts, and tropical storms have intensified in both frequency and severity, particularly across the southern region [25]. Between 2010 and 2023, the country suffered multiple major flood disasters, notably the catastrophic 2015 floods that displaced hundreds of thousands, and Cyclone Freddy in 2023, which triggered severe landslides and widespread crop devastation [26]. National life expectancy at birth is 64.3 years for men and 70.8 years for women, with females outnumbering males nationally (sex ratio: 95.3 males per 100 females) [18]. Research in Malawi was conducted in two districts located in the Shire Valley basin, a region of fertile lowlands highly susceptible to seasonal flooding [27]:
- Chikwawa District: According to the 2018 Population and Housing Census, Chikwawa had a population of 564,684 (50.9% female) across 126,792 households, with a population density of 116 inhabitants/km2 [28]. Notably, 53.9% of households were female-headed.
- Nsanje District: The 2018 census recorded 299,168 inhabitants (52.0% female) across 58,061 households, with a population density of 154 inhabitants/km2 [28]. Female-headed households comprised 57.3% of the district total.
Both districts mirror the national demographic profile, where roughly 47% of the population is under 15 years of age [28]. The local economy relies heavily on subsistence farming and small-scale fishing; however, high poverty rates and constrained access to basic infrastructure exacerbate vulnerability [25]. Both districts fall within a tropical wet-dry climate (Aw) [22], marked by high seasonal rainfall variability and a pronounced dry season, forcing strong economic dependence on annual flood cycles for recession agriculture [2].
2.3. Socioecological Context of Madagascar
In Madagascar, tropical cyclones account for approximately 85% of annual natural disaster losses, causing severe destruction to infrastructure, housing, and rural agricultural systems [3]. Recent high-intensity disasters such as Cyclones Batsirai and Emnati (2022) and Cyclone Freddy (2023) underscore the regional footprint of extreme events across the Southwest Indian Ocean [6]. National life expectancy stands at 61.6 years for men and 65.7 years for women, among the lowest in Southern Africa [18]. The age structure is similarly youthful, with approximately 43% of the population under 15 years of age [18,29]. The study evaluated two distinct coastal and inland agro-ecological zones:
- Marovoay District (Northwestern Region): Covers 3804 km2 with an estimated population of 182,742 inhabitants (density: approximately 48 inhabitants/km2) [29]. The district features a tropical dry climate (As/Aw) [22], a prolonged dry season, high drought vulnerability, and an economy anchored in subsistence crop cultivation and livestock rearing.
- Manakara District (Southeastern Coast): Situated along the direct cyclone landfall track, Manakara features a tropical monsoon climate (Am) [22] receiving annual rainfall in excess of 2000 mm. The urban municipality recorded 44,237 inhabitants at a high population density of approximately 1500 inhabitants/km2 in the 2018 census [29]. Its agricultural economy is relatively more diversified but remains highly vulnerable to direct storm impacts [3,30].
3. Materials and Methods
3.1. Data and Sampling Design
The study used a three-stage sampling design. In the first stage, two districts in each country were purposively selected based on documented high vulnerability to tropical cyclones and floods, as evidenced by national disaster risk databases, post-disaster assessment reports, and recent extreme weather events. Specifically, Beira and Mossuril (Mozambique) were selected based on their classification as high-risk zones in the INGD national disaster database [31] and exposure to Cyclone Idai (2019) and Cyclone Gombe (2022) [32]. Chikwawa and Nsanje (Malawi) were selected based on their location in the Shire Valley basin, a region chronically prone to seasonal flooding and documented as a high-vulnerability region [25]. Marovoay and Manakara (Madagascar) were selected based on their high cyclone frequency and official classification as high-exposure zones in national disaster risk assessments [3,33].
In the second stage, the most vulnerable localities within each district were purposively selected to capture contextual differences and account for spatial heterogeneity. In the third stage, households were randomly selected at the community level. Because the first two stages of selection were purposive rather than probability-based, the resulting sample is representative of the surveyed communities and is not intended to be statistically representative of the national populations of the three countries. Inferences are therefore confined to the study areas and comparable high-exposure contexts.
Household lists were obtained from local administrative authorities (district government offices) in each study area and served as the sampling frame for the third-stage random selection. The minimum required sample size was calculated using a standard formulation for finite populations at a 95% confidence level (see Supplementary Materials, Document S1). Households were selected using systematic random sampling, with the starting point determined randomly from the household list. The sample size in each locality was proportional to the total number of households in the respective district. In cases of household absence on the day of the survey, one replacement was permitted using the next household on the list. Households that declined to participate were recorded but accounted for less than 8% of total contacts at any given site and were replaced using the same systematic procedure. Questionnaires were administered orally by trained enumerators using the KoboToolbox platform; all questions were explained in local languages. All participants gave informed consent before the survey and were assured of data confidentiality.
A total of 2662 questionnaires were administered across the three countries: in Mozambique, surveys were conducted in two rounds—Mossuril (June 2024) and Beira (August 2024); in Malawi, data collection was conducted in May 2024; and in Madagascar, surveys took place between October and November 2024. Following data quality screening—which excluded incomplete questionnaires and records with implausible or inconsistent values—the final analytical sample comprised 2618 households: 1107 from Mozambique (Beira: 666; Mossuril: 441), 808 from Malawi, and 703 from Madagascar. Of these, 1454 were female-headed (55.6%) and 1164 were male-headed (44.4%). District-level administrative data disaggregated by sex of household head were not available from administrative registers at the time of data collection. Response rates—ranging from 89% (Nsanje) to 99% (Beira)—are reported in Table 1.
Table 1.
Survey overview: study sites, data collection periods, household sample distribution by sex of household head, and response rates.
3.2. Data Analysis
Descriptive statistics—including means, frequencies, and standard deviations—were generated using Stata version 17 to characterize household socioeconomic and environmental conditions and assess variation across study areas. The HVI was subsequently constructed following the methodology described below.
Construction of the Household Vulnerability Index
Composite indices are well established in climate vulnerability assessment [9,34]. Unlike single-indicator approaches, the HVI integrates exposure, sensitivity, and adaptive capacity within one framework, following the IPCC formulation [8,9,10]: higher exposure and sensitivity increase vulnerability, while stronger adaptive capacity reduces it.
Before constructing the HVI, variables representing the three dimensions were selected based on the empirical literature related to cyclones and floods [10,35,36], as detailed in Table 2. To ensure comparability across indicators with different units of measurement, all variables were standardized using z-scores prior to PCA (Equation (1)). Z-score standardization was preferred over min–max normalization because it centers each variable at zero with unit variance, preserving the original distribution and preventing variables with large scales or outliers from dominating the PCA solution—a risk that min–max normalization does not eliminate. In Equation (1), represents the standardized value (z-score) of variable i for household j; Xij denotes the observed value of variable i for household j; denotes the mean of variable i; and Si denotes the standard deviation of variable i.
Table 2.
Variables and indicators considered for the construction of the Household Vulnerability Index, with KMO-based screening outcomes reported in Table A3.
The sampling adequacy of the indicator set for each vulnerability dimension was evaluated using the Kaiser–Meyer–Olkin (KMO) measure of sampling adequacy, and variables failing the minimum threshold (KMO < 0.50) were excluded (Table A3). Prior to PCA, Bartlett’s test of sphericity confirmed that the correlation matrices for each vulnerability dimension were significantly different from the identity matrix (Exposure: χ2 (6) = 235.374, p < 0.001; Sensitivity: χ2 (10) = 112.789, p < 0.001; Adaptive Capacity: χ2 (91) = 2359.599, p < 0.001), supporting the factorability of the retained indicator sets. The overall KMO measures of sampling adequacy for the retained variable sets were 0.526 (Exposure), 0.535 (Sensitivity), and 0.596 (Adaptive Capacity), all exceeding the minimum threshold of 0.50 (Table A5).
PC1 factor score coefficients were used to assess whether retained indicators loaded coherently as measures of the same underlying construct. Although the HVI is not a psychometric scale—it is built from behavioral and administrative measures, not attitude items—PCA yields weights that reflect the data structure rather than arbitrary assumptions.
PCA was conducted on the pooled sample to ensure cross-national comparability. Continuous HVI scores were then classified into three categories—high, moderate, and low—using equal-interval thresholds derived from the pooled distribution, and applied uniformly across the three countries. The first principal component (PC1) was retained for each dimension because it explained the largest share of the total variance—accounting for 47.8% of variance in exposure, 46.7% in sensitivity, and 44.2% in adaptive capacity—and best represented the underlying structure of the indicators (see Table A4). This procedure is commonly used in vulnerability index construction studies [37,38,39]. The dimensional scores were combined to calculate the HVI as follows:
In Equation (2), the term represents the exposure component, where Ykj corresponds to the standardized (z-score) value of exposure-related variable k for household j, with standardization applied as specified in Equation (1), while Bk denotes factor score coefficient for exposure indicators. Similarly, the term denotes the sensitivity component, where Zlj corresponds to the standardized value of sensitivity-related variable l for household j, and Cl denotes the factor score coefficient for sensitivity indicators. Finally, the term represents the adaptive capacity component, where Xij corresponds to the standardized value of adaptive capacity-related variable i for household j, and Ai denotes the actor score coefficient for adaptive capacity indicators.
Agricultural, livestock, and fishing losses serve as proxies for household exposure to climate shocks. Although asset losses could theoretically be classified under either the exposure or the sensitivity dimension, this study follows the approach of Pandey and Jha [10] and Kim and Kwon [34], who treat direct climate-attributable losses as exposure proxies, capturing realized impact rather than structural susceptibility. Sensitivity thus captures the livelihood and housing conditions that make households susceptible to climate-related damage and loss, while exposure captures the actual losses incurred. The ‘house repair’ variable is operationalized as an indicator of household sensitivity rather than adaptive capacity: it captures whether the dwelling was recently damaged and required structural repair, reflecting the degree to which housing conditions are affected by climate stressors, not the household’s independent capacity to finance improvements.
3.3. Statistical Analysis
Statistical tests were selected according to each variable’s measurement level. The chi-square (χ2) test was used to test for distributional differences in categorical variables across countries and household groups. The homogeneity of variances was assessed using Bartlett’s test prior to comparing means across groups. One-way analysis of variance (ANOVA) was then applied to compare group means. Where ANOVA indicated significant differences, Bonferroni post hoc tests identified pairwise group differences. With samples exceeding 700 households per country, ANOVA results are expected to be reasonably robust to departures from normality, consistent with the Central Limit Theorem. Statistical significance was set at 5% (α = 0.05).
4. Results and Discussion
4.1. Sociodemographic Characteristics of Households
Cross-country and gender-disaggregated comparisons reveal statistically significant differences across all evaluated sociodemographic parameters (p < 0.001; Table 3), reflecting distinct demographic structures, institutional frameworks, and livelihood portfolios across the study sites. Mozambique’s study sites exhibit a younger overall age profile among household heads, whereas Madagascar’s sites contain a higher concentration of elderly household heads. Across all three countries, female household heads are markedly less represented in the highest age bracket (≥75 years) relative to their male counterparts (Table 3), a structural pattern consistent with headship dynamics in patriarchal rural societies [14].
Table 3.
Sociodemographic characteristics of surveyed households by country and gender (%).
Educational profiles vary substantially across national contexts: Mozambique exhibits the highest secondary and tertiary attainment levels among the surveyed populations while Malawi shows the heaviest concentration in primary-level education, alongside the largest share of household heads without formal schooling. Madagascar displays the most pronounced gender gap, with female household heads lagging significantly behind males in educational completion.
These patterns align with regional policy variations. In Mozambique, Law No. 18/2018 extended compulsory basic education to grade 9 (Grades 1–9), enabling more people to attain secondary and tertiary education. In Malawi, free primary education was introduced in 1994, though resource constraints limit secondary transition rates and reduce the possibility of further studies [40]. In Madagascar, Law No. 2022-018 mandates basic education for children aged 6–14; however, structural poverty continues to depress effective completion rates. These institutional divergences partially explain the educational gradients observed across the study areas.
Regarding livelihoods, although across all sites households depend on crop production, livestock husbandry, artisanal fishing, and informal self-employment, their structural composition varies. Households in Malawi’s study sites depend overwhelmingly on rain-fed crop agriculture, exposing them directly to climate shocks. In Madagascar’s study sites, households feature higher structural diversification across farming, livestock, and trade. Similar to Madagascar, households in Mozambique’s study sites show diversification across farming, livestock, fishing, formal and informal employment and petty trading. Nonetheless, a clear gendered division of labor emerges in Mozambique with male-headed households showing significantly higher participation in primary natural resource sectors (crops, livestock, and fishing), whereas female-headed households rely predominantly on informal petty trade and self-employment (Table 3).
4.2. Exploring the Three Dimensions of Vulnerability
4.2.1. Sensitivity Levels by Country and Gender
Sensitivity varies considerably across the three study countries: the highest proportion of high-sensitivity households is found in Madagascar’s study sites (30.4%), followed by Mozambique’s study sites (13.5%) and Malawi’s study sites (5.6%) (Table 4). This gradient reflects a combination of factors: Madagascar’s acute dependence on climate-sensitive livelihoods and more constrained macroeconomic conditions contribute to its elevated sensitivity levels, while Malawi’s comparatively lower sensitivity may partly reflect localized agricultural support structures. These descriptive trends are corroborated by formal statistical tests: sensitivity category distributions differ significantly across the surveyed countries (χ2 (4) = 277.32; p < 0.001; Table 4). ANOVA further confirms significant differences in mean sensitivity scores (F = 163.90; p < 0.001; Table A1); Bartlett’s test indicates significant heterogeneity of variance across groups (p < 0.001), a precondition that was accounted for in the interpretation of group differences.
Table 4.
Cross-country distribution of exposure, sensitivity, and adaptive capacity categories (%).
Gender disparities in sensitivity are similarly pronounced. Contrary to patterns commonly reported in the vulnerability literature, in Madagascar’s and Mozambique’s study sites male-headed households account for a disproportionate share of the high-sensitivity category. In the pooled sample, 20.6% of male-headed households fall within the high-sensitivity category, compared to 11.6% of female-headed households (Table 5). The chi-square analysis confirms a significant association between household head gender and sensitivity category (χ2 (2) = 42.62; p < 0.001; Table 5), an association further supported by ANOVA (F = 53.22; p < 0.001; Table A2); Bartlett’s test likewise indicates significant variance heterogeneity between gender groups (p < 0.001), consistent with the distributional differences observed. Male-headed households show higher scores on variables associated with climate-dependent economic activities—agriculture, fishing, and livestock husbandry (Table 3)—a pattern that reflects differential livelihood exposure to climate shocks rather than broader socioeconomic disadvantage.
Table 5.
Distribution of exposure, sensitivity, and adaptive capacity categories by country and gender.
These patterns align with Harvey et al. [41], who document the acute vulnerability of Madagascar’s smallholder systems to climate shocks. By contrast, the lower sensitivity levels observed in Malawi’s study sites may reflect the partial mitigating role of targeted agricultural support programs documented in the literature for this region [42], even within heavily agriculture-dependent communities.
4.2.2. Exposure Levels by Country and Gender
Exposure to climate hazards varies markedly across the three countries. High exposure is heavily concentrated among surveyed households in Malawi’s study sites (58.3%) and Mozambique’s study sites (35.0%), while Madagascar’s study sites show a lower proportion (27.3%) in this category (Table 4). The chi-square test confirms significant cross-country variation in exposure categories (χ2 (4) = 173.87; p < 0.001). Continuous exposure scores corroborate this pattern: mean values differ significantly (F = 126.68; p < 0.001), with significant heteroscedasticity across groups (Bartlett’s p < 0.001). Bonferroni post hoc tests confirm that Malawi’s study sites demonstrate the highest exposure, significantly above both Madagascar and Mozambique, while the latter two are statistically comparable (Table A1).
While country-level differences are substantial, gender-based exposure differentials are comparatively moderate. In Mozambique’s study sites, male-headed households exhibit a higher concentration in the high-exposure category (42.6%) than female-headed households (28.6%), whereas in Malawi’s study sites both groups show similar proportions (male-headed: 56.3%; female-headed: 59.9%). In Madagascar’s study sites, high-exposure frequencies are lower for both groups, standing at 32.1% for male-headed and 23.7% for female-headed households (Table 5). The chi-square analysis confirms a statistically significant association between gender and exposure category in the pooled sample (χ2 (2) = 14.49; p < 0.001; Table 5). Further, ANOVA confirms distinct mean exposure scores across groups (F = 29.85; p < 0.001; Table A2). Bartlett’s test indicates no significant heterogeneity of variance between groups (p = 0.374), supporting the homogeneity assumption underlying the parametric test.
These findings agree with empirical evidence showing that regional smallholders are concentrated in production systems and geographic micro-zones structurally susceptible to climate-induced asset loss [27]. The near-total absence of low-exposure households across all demographic groups (Table 5) demonstrates that climate exposure is a pervasive, structural condition across Southern Africa rather than a localized or subgroup-specific phenomenon [3,17,25]. In Mozambique and Malawi, localized livelihood profiles and physical exposure explain the elevated index values [1,2,31]. In Madagascar, household-level indicators capture a lower burden of direct asset loss at the selected survey sites, a site-level pattern further evaluated alongside composite HVI scores in Section 4.2.4.
4.2.3. Adaptive Capacity Across Countries and Gender
Adaptive capacity differs sharply across the three study contexts (Table 4). Among the sites analyzed, Malawi’s study sites show the highest proportion of households in the high adaptive capacity category (12.0%), compared with Mozambique’s and Madagascar’s study sites (both at 1.4%), which show considerably lower values. Conversely, Mozambique’s study sites show the highest concentration within the low adaptive capacity category (56.6%), followed by Madagascar’s study sites (37.1%). Across all sites, only 4.7% of households fall within the high adaptive capacity category—a finding that points to a profound and widespread resilience deficit. The chi-square test further confirms that the distribution of adaptive capacity categories differs significantly across countries (χ2 (4) = 310.26; p < 0.001). Continuous scores corroborate this pattern, varying significantly across countries (F = 222.79; p < 0.001; Table A1). Bartlett’s test indicates significant heterogeneity of variance across country groups (p < 0.001), a precondition that was accounted for in the interpretation of group differences. Bonferroni post hoc comparisons confirm that all three pairwise country comparisons (Mozambique–Malawi, Mozambique–Madagascar, and Malawi–Madagascar) yield statistically significant differences (Table A1).
Gender disparities further differentiate adaptive capacity patterns. In the pooled sample, male-headed households are disproportionately represented in the high adaptive capacity category (7.2% vs. 2.6%), particularly in Malawi’s and Madagascar’s study sites. In contrast, the gender gap in Mozambique’s study sites is most evident at the lower end of the distribution, where 62.8% of female-headed households fall within the low adaptive capacity category, compared to 49.1% of male-headed counterparts. The chi-square analysis confirms that gender-based differences in adaptive capacity distributions are statistically significant in the pooled sample (χ2 (2) = 76.07; p < 0.001).
Continuous score comparisons substantiate this disparity: male-headed households achieve significantly higher mean adaptive capacity scores than female-headed households (μ = 0.30 vs. μ = −0.24; p < 0.001; Table A2). Furthermore, variance differs significantly by gender (Bartlett’s p < 0.001), with male-headed households demonstrating greater internal score heterogeneity, whereas female-headed households cluster tightly at lower, homogeneous adaptive capacity levels (Table A2). These empirical findings confirm substantial cross-country and gender-based disparities in institutional and structural adaptive capacity, driven by distinct configurations of support mechanisms and asset endowments as the PCA factor score coefficients in Section Exploring the Determinants of Adaptive Capacity further demonstrate. This systemic deficit aligns with macro-level evidence on the structural determinants of climate vulnerability in rural Sub-Saharan Africa [2,43].
Exploring the Determinants of Adaptive Capacity
PC1 factor score coefficients reveal that adaptive capacity is shaped by the interplay of socioeconomic, institutional, and infrastructural factors across the three countries (Table 6). In Mozambique’s study sites, the leading positive contributors are climate-smart agriculture (0.41), agricultural extension services (0.34), training participation (0.33), drainage access (0.26), and livestock adaptation practices (0.20). These factor score coefficients point to the importance of technical support and local infrastructure for households chronically exposed to cyclones, floods, droughts, and coastal hazards. In Malawi’s study sites, PC1 is driven primarily by training participation (0.40), extension service access (0.39), anticipatory action adoption (0.33), climate group membership (0.28), and emergency aid access (0.27). These coefficients highlight the central role of institutional networks and collective platforms in building household resilience. In Madagascar’s study sites, the highest positive coefficients fall on livestock adaptation practices (0.44), livestock ownership (0.43), climate-smart agriculture (0.37), and elevated housing location (0.32); institutional extension services carry a comparatively modest coefficient of 0.27.
Table 6.
Factor score coefficients and variable rankings from the first principal component (PC1) of adaptive capacity by country.
Negative factor score coefficients point to structural gaps in adaptive capacity. In Madagascar’s study sites, access to drainage systems (−0.34) and access to cyclone early warning (−0.16) show the most pronounced negative coefficients, suggesting that households with access to these infrastructure-dependent mechanisms do not necessarily exhibit higher composite adaptive capacity—likely because such access is not accompanied by the institutional and livelihood conditions that enable their effective use. In Mozambique’s study sites, education level (−0.36) is the strongest negative contributor, suggesting that, in the specific institutional context of Mozambique’s coastal zones, formal schooling alone does not confer adaptive advantages without complementary access to technical support and productive resources. Taken as a whole, these patterns underscore that adaptive capacity is conditioned not by resource access alone, but by the broader institutional environment within which households operate and mobilize available inputs.
Negative factor score coefficients do not denote missing data; rather, they indicate that households utilizing these specific mechanisms correlate inversely with the primary latent variance axis (PC1). All variables displaying negative coefficients met the Kaiser–Meyer–Olkin criterion (KMO ≥ 0.50; Table A3), confirming their statistical validity within the indicator set.
These country-specific PC1 configurations provide empirical support for Hypothesis 3 (H3) that adaptive capacity is the primary factor distinguishing composite HVI outcomes across countries. Malawi’s low overall vulnerability stems not from reduced physical exposure or lower sensitivity, but from a dense institutional framework that includes training programs, extension services, and anticipatory action networks that carry a consistently strong coefficient on PC1. Conversely, Madagascar’s reliance on private productive assets and Mozambique’s negative education coefficient reflects adaptive capacity regimes that are either self-reliant or institutionally constrained. Adaptive capacity is therefore not merely one of three equivalent IPCC dimensions; it serves as the primary axis along which cross-country vulnerability diverges.
4.2.4. Household Vulnerability Index Across Countries and Gender
HVI scores reveal both significant level differences and distinct dispersion patterns across the three study countries. HVI scores range from −3.82 to 6.41 in Mozambique’s study sites, −3.60 to 6.33 in Malawi’s study sites, and −3.21 to 5.09 in Madagascar’s study sites (Table 7).
Table 7.
Household Vulnerability Index scores and categorical classification across countries.
Mozambique’s study sites exhibit the widest spread of HVI scores, reflecting marked within-country heterogeneity where resilient households, mostly in urban Beira, coexist alongside severely exposed and asset-poor ones, mostly in rural Mossuril. Conversely, Madagascar’s study sites show a narrower range, pointing to a more uniform vulnerability profile, where few households accumulate sufficient adaptive assets to transition into low-vulnerability strata. Categorical breakdowns further illustrate these national vulnerability profiles. Mozambique’s study sites record the highest proportion of households in the high-vulnerability category (26.0%), followed by Madagascar’s study sites (17.4%) and Malawi’s study sites (10.6%). Madagascar’s study sites concentrate heavily in the moderate-vulnerability category (77.4%), driven by severe adaptive capacity constraints despite moderate physical exposure. Finally, Malawi’s study sites exhibit the highest proportion of low-vulnerability households (19.2%), illustrating a strong buffering effect driven by social and institutional capital as evidenced by the PC1 results.
The empirical patterns defy a simple, linear physical risk gradient. Malawi’s surveyed sites illustrate this directly: they record the highest physical exposure in the sample yet the lowest overall composite vulnerability, an inversion driven by robust institutional adaptive capacity rather than reduced hazard intensity. Madagascar’s study sites show the reverse pattern: despite the lowest physical exposure among the three countries, composite vulnerability remains high, because severe adaptive capacity deficits prevent households from translating lower hazard exposure into actual climate resilience.
From a macroeconomic perspective, the three countries also present contrasting structural drivers of vulnerability. Mozambique (GDP per capita ~USD 632) [11] presents high vulnerability scores reflecting severe fiscal constraints that limit public investment in disaster risk reduction, adaptive rural infrastructure, and formal agricultural extension networks. Madagascar (GDP per capita ~USD 656) [11] presents a different structural pattern: lower physical exposure in the researched communities keeps most households out of the highest vulnerability bracket, but near-total institutional and asset deficits lock 77.4% of households into moderate vulnerability. Finally, in Malawi (GDP per capita ~USD 733) [11], despite comparable poverty levels, targeted investments in extension systems, community resilience groups, and anticipatory action frameworks successfully buffer households against extreme physical climate risks.
One-way ANOVA confirms statistically significant cross-country differences in composite HVI scores (F = 97.95; p < 0.001). Bartlett’s test reveals significant variance heterogeneity across groups (p < 0.001). Bonferroni post hoc pairwise comparisons indicate that mean HVI scores differ significantly between Mozambique and Malawi (p < 0.001) and between Malawi and Madagascar (p < 0.001), whereas Mozambique and Madagascar are statistically comparable (Table A1). These results provide strong empirical confirmation for Hypothesis 1 (H1) that composite climate vulnerability varies significantly across national study contexts due to distinct structural configurations of exposure, sensitivity, and adaptive capacity.
Categorical distributions reveal distinct gender asymmetries in climate vulnerability across the studied contexts. In the pooled sample, male-headed households are unexpectedly represented at a higher proportion within the high-vulnerability category (20.9%) compared to female-headed households (17.4%). Country-level disaggregation demonstrates clear contextual divergence. Mozambique’s study sites exhibit the sharpest gender gap, with 31.1% of male-headed households occupying the high-vulnerability category compared to 21.8% of female-headed households. Malawi inverts this pattern, with female-headed households showing higher high-vulnerability prevalence (12.6%) than male-headed households (8.1%). Madagascar’s study sites display negligible gendered variations, with both groups heavily concentrated in the moderate-vulnerability category (Table 8).
Table 8.
Distribution of household vulnerability categories by country and gender (%).
Chi-square tests confirm statistically significant associations between gender and vulnerability category membership in Mozambique’s study sites (p < 0.001), Malawi’s study sites (p < 0.001), and the pooled sample (χ2 (2) = 19.96; p < 0.001). In contrast, no statistically significant association is observed in Madagascar’s study sites (χ2 (2) = 1.53; p = 0.465). Continuous score comparisons reveal a nuanced statistical property: aggregate mean HVI scores between male- and female-headed households are virtually identical (F < 0.01; p = 0.980; Table A2). However, score variance and dispersion differ significantly across gender groups (Bartlett’s test, p < 0.001). Disparities manifest strongly in distributional and categorical profiles but disappear entirely in mean-level comparisons, which is a critical empirical insight with direct implications for vulnerability assessment methodology.
These findings partially confirm Hypothesis 2 (H2) that household head gender significantly conditions vulnerability while requiring an important analytical qualification that includes:
- Distributional Confirmation: H2 holds at the distributional and categorical levels in Mozambique’s and Malawi’s study sites, and in the pooled sample, as well as across the individual adaptive capacity component where female-headed households experience persistent, systemic deficits.
- Mean-Level Rejection: H2 is rejected at the aggregate mean level (p = 0.980), demonstrating that gender restructures the structural pathways of vulnerability rather than altering aggregate average index scores.
Male-headed households face a distinct form of vulnerability, occupational exposure through primary sector activities (farming, fishing, livestock) that standard vulnerability frameworks often underestimate. Conversely, female-headed households face chronic structural constraints in asset accumulation and social capital access. Policy interventions relying solely on mean HVI comparisons risk failing on two fronts: underestimating the severe adaptive capacity deficits of female-headed households while ignoring the occupational climate risks concentrated among male-headed households.
Limitations
While this study provides robust empirical insights into household vulnerability dynamics, several methodological and conceptual constraints must be considered:
- Cross-Sectional Design: The cross-sectional dataset captures a single temporal baseline, precluding the longitudinal tracking of household vulnerability dynamics, seasonal asset shifts, or multi-year recovery trajectories following climate shocks.
- Composite Index Aggregation: Although the composite Household Vulnerability Index (HVI) integrates multi-dimensional IPCC indicators, index construction inherently simplifies complex, localized social and institutional relationships.
- Sensitivity Proxy Operationalization: Utilizing primary livelihood participation indicators as proxies for structural sensitivity may not capture fine-scale micro-climatic or biophysical hazard dynamics. Observed gender-differentiated sensitivity scores thus reflect differential sector exposure and resource dependencies rather than intrinsic structural susceptibility.
- Contextual Specificity: Empirical findings reflect the socioeconomic, environmental, and climatic conditions of the study area and should not be directly extrapolated to contrasting geographical or ecological zones.
- Sampling Design and Generalizability: The three-stage purposive-random sampling framework targeted administrative units with high baseline hazard exposure. Consequently, findings cannot be generalized to broader national populations. Purposive site selection may introduce upward selection bias, resulting in higher aggregate vulnerability levels than would be observed in nationally representative samples.
- Data Scope: The analytical framework relies exclusively on quantitative survey metrics. Integrating qualitative and ethnographic approaches in future work would yield deeper operational insights into local adaptive strategies and intra-household decision-making.
5. Conclusions
Across three cyclone-prone contexts with comparable poverty and primary-production dependence, this study shows that institutional adaptive capacity—not physical exposure intensity—is the dominant driver of cross-country differences in household vulnerability. Single-country studies risk conflating physical exposure with composite vulnerability; only a cross-national framework that contextualizes findings within comparable macroeconomic conditions makes this distinction visible. The case of Madagascar is particularly instructive: despite recording the lowest physical exposure among the three study areas, composite vulnerability remains intermediate rather than low—a decoupling that demonstrates how severely constrained adaptive capacity can override exposure advantages, preventing households from translating lower hazard intensity into reduced vulnerability. These findings carry a clear policy implication: under severe macroeconomic constraints, targeted institutional investment in extension services, anticipatory action frameworks, and community-based training is associated with resilience outcomes that income growth alone appears insufficient to produce at observed poverty levels. The pathway to resilience is nonetheless context-specific, as the institutional and asset-based configurations discussed below make clear; one-size-fits-all approaches are therefore unlikely to be effective.
The gendered division of risk—adaptive capacity deficits among female-headed households and occupational exposure concentration among male-headed ones—carries direct policy consequences that mean-level comparisons would mask. Policies targeting livelihood diversification disproportionately benefit male-headed households, whereas those expanding institutional access disproportionately benefit female-headed households. Gender-responsive climate adaptation in comparable low-income, climate-exposed settings must address both pathways simultaneously.
Although these findings are specific to cyclone- and flood-prone rural and coastal communities, the key patterns identified here—the primacy of adaptive capacity over physical exposure, and the gendered differentiation of vulnerability pathways—are likely relevant to other low-income, climate-exposed settings where formal insurance and livelihood diversification remain limited. Future research should examine how vulnerability changes over time and how gender intersects with age, disability, and ethnicity as compounding dimensions of risk.
6. Policy and Strategic Implications
These patterns point to specific gaps within each country’s existing disaster risk architecture, rather than calling for new institutional frameworks. Mozambique’s National DRR Master Plan 2017–2030, implemented by the National Institute for Disaster Management (INGD) under the Disaster Management Act No. 15/2014, already treats prevention and preparedness as strategic pillars. What this study adds is where the Plan’s district-level rollout should concentrate: climate-smart agriculture, extension access, and training carry the strongest adaptive capacity weight in Beira and Mossuril (0.41, 0.34, and 0.33; Table 6), while education level loads negatively (−0.36), suggesting extension programming should not assume formal schooling as a precondition for uptake.
In Malawi, the Department of Disaster Management Affairs (DoDMA) already runs community-based disaster committees and extension networks under the 2015 National Disaster Risk Management Policy. Training participation and extension access are Malawi’s leading adaptive capacity drivers (0.40 and 0.39; Table 6), which plausibly explains why Malawi shows the lowest composite vulnerability despite the highest physical exposure of the three countries. Sustaining and expanding DoDMA’s extension and anticipatory-action work in Chikwawa and Nsanje follows directly from this pattern.
Madagascar’s disaster strategy (SNGRC 2016–2030), coordinated by BNGRC, currently centers on early warning and post-disaster response. In Marovoay and Manakara, however, livestock ownership and livestock adaptation practices—not institutional extension access (0.27)—carry the highest adaptive capacity weight (0.44 and 0.43; Table 6). This points to a gap the current strategy does not cover: asset protection and livestock micro-insurance, which would complement rather than replace the early-warning focus already in place.
Supplementary Materials
The following supporting information can be downloaded at: https://www.mdpi.com/article/10.3390/cli14110236/s1, Document S1: Sample size estimation.
Author Contributions
N.B. was responsible for the conceptualization, literature review, data processing and analysis, and writing the original manuscript; L.A. contributed to funding acquisition, scientific supervision, and critical revision of the manuscript; B.C. and G.S. contributed to the data analysis, validation of the results, and manuscript review and editing. All authors have read and agreed to the published version of the manuscript.
Funding
This research was funded by the Resilience and Preparedness to Tropical Cyclones in Southern Africa (REPRESA) Project, supported by the UK Foreign, Commonwealth & Development Office (FCDO) and the International Development Research Centre (IDRC) of Canada. The first author received a scholarship from the CO-LOCAL Project (Co-creating Knowledge for Local Adaptation to Climate Change) to pursue a Master’s degree (2024–2026).
Informed Consent Statement
Informed consent was obtained from all participants involved in this study.
Data Availability Statement
The raw data supporting the conclusions of this article will be made available by the corresponding author upon request.
Acknowledgments
The authors thank the governments and local communities of Madagascar, Malawi, and Mozambique for their collaboration in this research.
Conflicts of Interest
The authors declare no conflicts of interest.
Appendix A
Table A1.
Parametric analysis of differences in exposure, sensitivity, adaptive capacity, and household vulnerability across countries.
Table A2.
Parametric analysis of differences in exposure, sensitivity, adaptive capacity, and household vulnerability by gender.
Table A3.
Kaiser–Meyer–Olkin (KMO) screening results for all candidate variables by vulnerability dimension.
Table A4.
Principal Component Analysis results: variance explained by the first principal component (PC1) for each vulnerability dimension.
Table A5.
Bartlett’s test of sphericity and Kaiser–Meyer–Olkin (KMO) measure of sampling adequacy for retained indicator sets, by vulnerability dimension.
Table A6.
Factor score coefficients from the first principal component (PC1), by vulnerability dimension and country.
References
- Kajumba, T. Climate Risk Assessment—Mozambique; Irish Aid: Dublin, Ireland, 2018. Available online: https://www.iied.org/sites/default/files/pdfs/2023-11/22081g.pdf (accessed on 10 April 2025).
- Kajumba, T. Climate Risk Assessment—Malawi; Irish Aid: Dublin, Ireland, 2018. Available online: https://www.iied.org/sites/default/files/pdfs/2023-11/22076g.pdf (accessed on 10 April 2025).
- World Bank. Madagascar Country Climate and Development Report; World Bank: Washington, DC, USA, 2024. [Google Scholar] [CrossRef] [Scilit]
- Mutengwa, C.S.; Mnkeni, P.; Kondwakwenda, A. Climate-smart agriculture and food security in Southern Africa: A review of the vulnerability of smallholder agriculture and food security to climate change. Sustainability 2023, 15, 2882. [Google Scholar] [CrossRef] [Scilit]
- Mugiyo, H.; Magadzire, T.; Choruma, D.J.; Chimonyo, V.G.P.; Manzou, R.; Jiri, O.; Mabhaudhi, T. El Niño’s effects on Southern African agriculture in 2023/24 and anticipatory action strategies to reduce the impacts in Zimbabwe. Atmosphere 2023, 14, 1692. [Google Scholar] [CrossRef] [Scilit]
- ACAPS. Madagascar: Cyclone Exposure and Vulnerabilities; ACAPS: Geneva, Switzerland, 2024; Available online: https://www.acaps.org/fileadmin/Data_Product/Main_media/20241019_ACAPS_Thematic_Madagascar-cyclone_exposure_and_vulnerabilities.pdf (accessed on 10 February 2026).
- Awiti, A.O. Climate change and gender in Africa: A review of impact and gender-responsive solutions. Front. Clim. 2022, 4, 895950. [Google Scholar] [CrossRef] [Scilit]
- McCarthy, J.J.; Intergovernmental Panel on Climate Change (Eds.) Climate Change 2001: Impacts, Adaptation, and Vulnerability: Contribution of Working Group II to the Third Assessment Report of the Intergovernmental Panel on Climate Change; Cambridge University Press: Cambridge, UK, 2001.
- Brooks, N.; Adger, W.N.; Kelly, P.M. The determinants of vulnerability and adaptive capacity at the national level and the implications for adaptation. Glob. Environ. Change 2005, 15, 151–163. [Google Scholar] [CrossRef] [Scilit]
- Pandey, R.; Jha, S. Climate vulnerability index—Measure of climate change vulnerability to communities: A case of rural Lower Himalaya, India. Mitig. Adapt. Strateg. Glob. Change 2012, 17, 487–506. [Google Scholar] [CrossRef] [Scilit]
- Smit, B.; Wandel, J. Adaptation, adaptive capacity and vulnerability. Glob. Environ. Change 2006, 16, 282–292. [Google Scholar] [CrossRef] [Scilit]
- International Monetary Fund. World Economic Outlook Database; IMF: Washington, DC, USA, 2026. Available online: https://www.imf.org/en/publications/weo (accessed on 15 April 2026).
- World Bank. Poverty Assessment in Mozambique 2023; World Bank Group: Maputo, Mozambique, 2023. Available online: https://pt.scribd.com/document/687817570/Relato-rio-da-Avaliac-a-o-da-Pobreza-em-Moc-ambique-2023-v2 (accessed on 4 December 2025).
- Anjum, G.; Aziz, M. Climate change and gendered vulnerability: A systematic review of women’s health. Women’s Health 2025, 21, 17455057251323645. [Google Scholar] [CrossRef] [Scilit] [PubMed]
- Nchanji, E.B.; Kabuli, H.; Nyamolo, V.O.; Cosmas, L.; Chisale, V.; Matumba, A. Gender differences in climate-smart adaptation practices amongst bean-producing farmers in Malawi: The case of Linthipe Extension Planning Area. Front. Sustain. Food Syst. 2022, 6, 1001152. [Google Scholar] [CrossRef] [Scilit]
- Jerneck, A. What about gender in climate change? Twelve feminist lessons from development. Sustainability 2018, 10, 627. [Google Scholar] [CrossRef] [Scilit]
- World Bank. Mozambique Country Climate and Development Report; World Bank: Washington, DC, USA, 2023. Available online: https://www.worldbank.org/en/country/mozambique/publication/mozambique-afe-country-climate-and-development-report-ccdr (accessed on 15 June 2025).
- World Bank. World Development Indicators: Life Expectancy at Birth by Sex; World Bank Group: Washington, DC, USA, 2024. Available online: https://data.worldbank.org/indicator/SP.DYN.LE00.I (accessed on 17 July 2026).
- Instituto Nacional de Estatística. Resultados Definitivos do IV Recenseamento Geral da População e Habitação (RGPH 2017) [Final Results of the IV General Population and Housing Census (RGPH 2017)]; INE: Maputo, Mozambique, 2019. Available online: https://www.ine.gov.mz/en/censo-2017 (accessed on 19 July 2026).
- Mandamule, U. Surviving After a Disaster: Post-Idai Resettlement, Land Access and Food (in)Security in Búzi, Sofala; Observatório do Meio Rural: Maputo, Mozambique, 2023; Available online: https://omrmz.org/destaque_rural/dr-255-sobreviver-apos-um-desastrereassentamento-pos-idai-acesso-a-terra-e-inseguranca-alimentar-em-buzi-sofala/ (accessed on 20 January 2026).
- Fobra, D.; Zaqueu, D.; João, J.; Mavundla, L.; dos Santos, H. Inequality and poverty in focus: A comprehensive analysis of socioeconomic reality in Sofala Province, Mozambique. REVES—Rev. Relações Soc. 2023, 6, 17814. [Google Scholar] [CrossRef] [Scilit]
- Kottek, M.; Grieser, J.; Beck, C.; Rudolf, B.; Rubel, F. World map of the Köppen-Geiger climate classification updated. Meteorol. Z. 2006, 15, 259–263. [Google Scholar] [CrossRef] [Scilit] [PubMed]
- World Meteorological Organization. Climate Normals for Beira (Beira Airport), Mozambique: 1991–2020; WMO: Geneva, Switzerland, 2023. Available online: https://worldweather.wmo.int (accessed on 13 July 2026).
- Trentini, D. Nampula. In Oxford Research Encyclopedia of African History; Oxford University Press: Oxford, UK, 2024. [Google Scholar] [CrossRef] [Scilit]
- Wood, L.; Morinière, L. Malawi Climate Change Vulnerability Assessment; USAID: Washington, DC, USA, 2013. Available online: https://www.scribd.com/document/934589904/Malawi-Climate-Change-Vulnerability-Assessment-Full (accessed on 8 February 2026).
- Van Rooyen, M. Malawi: Geographic Futures; Institute for Security Studies: Pretoria, South Africa, 2025; Available online: https://futures.issafrica.org/geographic/countries/malawi (accessed on 12 May 2026).
- Coulibaly, J.Y.; Mbow, C.; Sileshi, G.W.; Beedy, T.; Kundhlande, G.; Musau, J. Mapping vulnerability to climate change in Malawi: Spatial and social differentiation in the Shire River Basin. Am. J. Clim. Change 2015, 4, 282–294. [Google Scholar] [CrossRef]
- National Statistical Office. Malawi Population and Housing Census: Main Report; National Statistical Office: Zomba, Malawi, 2019. Available online: https://malawi.unfpa.org/en/publications/malawi-2018-population-and-housing-census-main-report (accessed on 16 July 2026).
- Institut National de la Statistique. Résultats du Troisième Recensement Général de la Population et de l’Habitation—RGPH3 2018 [Results of the Third General Population and Housing Census—RGPH3 2018]; INSTAT: Antananarivo, Madagascar, 2020. Available online: https://www.instat.mg (accessed on 15 July 2026).
- Institut National de la Statistique. Annuaire Statistique 2020: Données Régionales [Statistical Yearbook 2020: Regional Data]; INSTAT: Antananarivo, Madagascar, 2020.
- INGD. Study on the Impact of Climate Change on Disaster Risk in Mozambique; Instituto Nacional de Gestão de Calamidades: Maputo, Mozambique, 2016. Available online: https://pure.iiasa.ac.at/id/eprint/9007/ (accessed on 5 October 2025).
- Mozambique Red Cross. Cyclone Gombe Situation Report; CVM: Maputo, Mozambique, 2022; Available online: https://prddsgofilestorage.blob.core.windows.net/api/appeals/MDRMW015/IBGombe11032022.pdf (accessed on 5 March 2026).
- Rakotoarison, N.; Raholijao, N.; Razafindramavo, L.M.; Rakotomavo, Z.A.P.H.; Rakotoarisoa, A.; Guillemot, J.S.; Randriamialisoa, Z.J.; Mafilaza, V.; Ramiandrisoa, V.A.M.P.; Rajaonarivony, R.; et al. Assessment of risk, vulnerability and adaptation to climate change by the health sector in Madagascar. Int. J. Environ. Res. Public Health 2018, 15, 2643. [Google Scholar] [CrossRef] [Scilit] [PubMed]
- Kim, J.; Kwon, H. Calculation of a climate change vulnerability index for Nakdong watersheds considering non-point pollution sources. Appl. Sci. 2022, 12, 4775. [Google Scholar] [CrossRef] [Scilit]
- Cools, J.; Innocenti, D.; O’Brien, S. Lessons from flood early warning systems. Environ. Sci. Policy 2016, 58, 117–122. [Google Scholar] [CrossRef] [Scilit]
- IPCC. Climate Change 2022: Impacts, Adaptation, and Vulnerability. Contribution of Working Group II to the Sixth Assessment Report of the Intergovernmental Panel on Climate Change; Cambridge University Press: Cambridge, UK, 2022. Available online: https://www.ipcc.ch/report/ar6/wg2/ (accessed on 3 June 2026).
- Abdi, H.; Williams, L.J. Principal component analysis. WIREs Comput. Stat. 2010, 2, 433–459. [Google Scholar] [CrossRef] [Scilit]
- Jambu, M. Principal components analysis. In Exploratory and Multivariate Data Analysis; Elsevier: Amsterdam, The Netherlands, 1991; pp. 125–167. [Google Scholar] [CrossRef] [Scilit]
- Jolliffe, I.T. Principal Component Analysis, 2nd ed.; Springer: New York, NY, USA, 2002. [Google Scholar]
- Kadzamira, E.; Rose, P. Can free primary education meet the needs of the poor? Evidence from Malawi. Int. J. Educ. Dev. 2003, 23, 501–516. [Google Scholar] [CrossRef] [Scilit]
- Harvey, C.A.; Rakotobe, Z.L.; Rao, N.S.; Dave, R.; Razafimahatratra, H.; Rabarijohn, R.H.; Rajaofara, H.; MacKinnon, J.L. Extreme vulnerability of smallholder farmers to agricultural risks and climate change in Madagascar. Philos. Trans. R. Soc. B Biol. Sci. 2014, 369, 20130089. [Google Scholar] [CrossRef] [Scilit] [PubMed]
- Francis, M.T.; Julius, M.; Abdil, K.E.; Edwin, K. Determinants of adoption of multiple climate change adaptation strategies in Southern Malawi: An ordered probit analysis. J. Dev. Agric. Econ. 2017, 9, 1–7. [Google Scholar] [CrossRef] [Scilit]
- Mate, F. Gender Analysis in Disaster Risk Management in Mozambique; American Red Cross: Washington, DC, USA, 2023; Available online: https://www.arc.int/gender-platform/IMG/pdf/moz-genderanddrmanalysisreport.pdf (accessed on 22 April 2026).

Disclaimer/Publisher’s Note: The statements, opinions and data contained in all publications are solely those of the individual author(s) and contributor(s) and not of MDPI and/or the editor(s). MDPI and/or the editor(s) disclaim responsibility for any injury to people or property resulting from any ideas, methods, instructions or products referred to in the content. |
© 2026 by the authors. Licensee MDPI, Basel, Switzerland. This article is an open access article distributed under the terms and conditions of the Creative Commons Attribution (CC BY) license.