


Abstract
The paper suggests a distributed cross-layer IoT architecture that combines LoRaWAN (Long Range Wide Area Network) with federated learning (FL) to improve reliability, scalability, and fault tolerance in multi-layer vertical farming systems in dense and dynamic environments. Unlike the traditional frameworks that rely on independent measures of QoS (Quality of Service), the proposed framework directly represents the inter-layer relationships, such as heterogeneity of latencies, robustness of connectivity, and propagation of faults. One of the contributions is the development of a cohesive cross-layer evaluation framework with six strictly defined metrics: MLDC (Multi-Layer Deployment Capacity), C-LCRI (Cross-Layer Connectivity Robustness Index), C-LFCI (Cross-Layer Fault Containment Index), SART (Smart Adaptive Recovery Time), and AIRSM (AI Resilience Score Metric), which allows for quantitatively characterizing latency differences, network resilience, fault containment, recovery efficiency, AI robustness, and energy-performance trade-offs. The experimental results show that the proposed Smart Distributed LoRaWAN–Federated Learning architecture operates reliably in high-density and multi-layer vertical farming environments, and is scalable to handle larger amounts of data. The proposed system guarantees a packet delivery ratio (PDR) of around 95% under a large-scale deployment with up to 1050 IoT nodes spread across seven cultivation layers, with a latency reduction of nearly 60%, less than 1.6 J/msg on average energy consumption, and a fault recovery time of less than 0.3 s in case of network disruptions. The proposed framework was validated using large-scale simulation scenarios developed based on experimentally reported LoRaWAN communication characteristics and agricultural IoT deployments, and operational conditions at the edge intelligence. This evaluation included up to 1050 sensing nodes in 7 vertical farming layers to approximate a realistic deployment of smart farming in a large-scale environment while keeping consistency with the recorded communication and reliability profile.
1. Introduction
1.1. Background and Motivation
Designing large-scale IoT systems is becoming increasingly limited by the communication dynamics, distributed learning, and system-level reliability. In real-world deployments, IoT nodes must operate under heterogeneous conditions, with variable latency, intermittent connectivity, and limited computational resources [1,2]. All of these factors are directly related to the efficiency of data exchange processes, convergence of distributed learning processes, and propagation of faults throughout the network. It is important to note that these phenomena are not independent [3,4]. Communication instability and unreliable nodes will lead to degraded quality of the global model, and local failures will further propagate through network dependencies and cause overall degradation of system performance [5,6,7]. Although these interactions are important in practice, most current solutions consider the problem of communication, learning and fault tolerance as isolated design problems. This disjointed view hinders IoT system design that is scalable, robust, and reliable over realistic operating conditions [8,9]. For this reason, a principled framework that properly represents these interdependencies in a coherent manner is desirable, one that can be analyzed on a theoretical level and can be used to design future systems involving the IoT.
1.2. Research Gap
A critical examination of the state-of-the-art reveals several fundamental limitations:
- The cross-layer IoT frameworks are mainly based on optimization of communication efficiency and resource utilization, without explicitly modeling the communication uncertainty and the distributed learning dynamics. Consequently, they lack insight into the impact of latency dispersion and network variability on system-level intelligence [6,7,8].
- Federated learning techniques in IoT are usually made under the assumption of a stable communication situation and homogeneous participation. However, in large-scale deployments, these assumptions are impractical because nodes can be quite unreliable. Current approaches have not yet been developed with a systematic approach to embedding node reliability into learning and provide no guarantees in degraded communication scenarios [7,8,9].
- The fault-tolerant IoT system focuses on redundancy, fault detection and recovery mechanisms, but they are not strongly connected to learning processes. Most importantly, they do not set up a formal framework for analyzing fault propagation from one interconnected node to another, nor do they set up stability conditions for cascading failures [9,10,11].
Most importantly, there is no single work that has developed a unified and analytically grounded framework that specifically considers cross-layer interactions, reliable learning, and fault propagation stability [10,11,12]. Without such integration, there is a basic lack of understanding of how the uncertainty of communication, the dynamics of learning, and the propagation of failure co-evolve and influence the performance of the system at large.
1.3. Novelty
This paper proposes a fundamentally new approach that would address the above-mentioned gap by following principles of cross-layer integration and analytical modeling. The novelty of this work does not come from the fact that any of the improvements made were incremental within a single layer, but from the fact that the various disconnected dimensions were connected in a coherent and theoretically sound structure. In particular, the proposed contributions can be distinguished from the current work on three key aspects: This work proposes a distributed cross-layer IoT architecture that jointly integrates LoRaWAN communication, fault-aware federated learning (FL), and adaptive recovery mechanisms to improve reliability, scalability, and resilience in multi-layer vertical farming environments. In addition, the study introduces a unified cross-layer evaluation framework based on the Multi-Layer Deployment Capacity (MLDC), Cross-Layer Connectivity Robustness Index (C-LCRI), Cross-Layer Fault Containment Index (C-LFCI), and Smart Adaptive Recovery Time (SART), enabling quantitative assessment of communication, learning, and fault-tolerance interactions under realistic large-scale deployment scenarios.
This paper is organized as follows: In Section 2, a thorough survey of the literature is conducted and the areas of research that need to be addressed in this study are identified. The proposed system model is presented in Section 3, including the underlying assumptions and a cross-layer problem formulation; a related theoretical analysis and stability conditions are presented. In Section 4, this methodology with reliability-aware learning mechanism, communication adaptation strategy, and a framework for fault mitigation is described. The experimental setup, benchmark procedures, measurement criteria and the reproduction configuration are detailed in Section 5 to ensure the performance assessment is rigorous and fair. The experimental results are reported in Section 6 and detailed analytical studies of the effectiveness, robustness and scalability of the proposed framework for various operating conditions are discussed. Last, in Section 8, the paper concludes, with suggestions for additional work in the area.
2. Related Works
In this section, the existing literature is critically summarized by reviewing the literature in three related fields, namely cross-layer IoT system design [1,2,3,4,5,6], federated learning in IoT environments [7,8,9], and fault-tolerant distributed systems [10]. This section is different from traditional surveys, which give descriptive summaries, but it shows the limitations and missing links that drive the proposed unified framework.
2.1. LoRaWAN-Based Smart Agriculture Systems
To enhance the efficiency and flexibility of IoT systems, different layers of protocols, such as physical, network, and application layers, have been explored and discussed, and there has been considerable research on cross-layer approaches [1,2,3]. These techniques are effective in the areas of resource utilization, latency reduction, and reliability of communication under constrained environments. Most of the current cross-layer architectures, however, target mainly communication efficiency and resource management aspects and fail to explicitly include learning dynamics or system-level reliability concerns [4,5]. Especially, they do not have formal mechanisms to describe the effect of communication variability (e.g., latency dispersion or packet loss) on higher-level processes (e.g., distributed learning or decision making). In addition, these methods are mostly based on stable networks and neglect the propagation of faults among interdependent nodes, which restricts their use in large-scale and fault-prone IoT networks [5,6,7].
2.2. Federated Learning in IoT Systems
Distributed intelligence in IoT systems using federated learning (FL) is a promising paradigm, where multiple distributed devices can collaboratively train a model without sharing the raw data [7,8,9]. Resource constraints and scaling issues have been tackled in recent studies through communication-efficient FL, adaptive client selection, and hierarchical aggregation [10,11,12]. Despite these developments, the majority of FL-based approaches make some idealistic assumptions, such as having reliable lines of communication, conducting updates in sync, and all clients participating in the same manner. These assumptions are violated in realistic IoT scenarios because of latency variability, intermittent connectivity, and node heterogeneity [12,13,14]. Some works try to tackle the issue of communication efficiency, but do not offer a principled approach to measure and reduce the effect of unreliable nodes on the global model convergence [13,14]. Furthermore, most of the current FL methods do not take into account the communication dynamics and fault conditions, and thus suffer from poor performance in unfavorable situations.
2.3. Fault-Tolerant IoT Architectures
Research on fault tolerance in IoT systems has focused on implementing techniques like redundant systems, fault detection and diagnosis, distributed recovery, and resilient network design [15,16,17]. The methods are designed to ensure system availability and reliability under conditions of node failure, communication loss, and environmental uncertainties [18,19,20]. But, the current fault-tolerant frameworks are very much decoupled from learning processes and cross-layer interactions. They are generally geared towards local fault detection and recovery actions, but do not offer a global analysis of the dynamics of fault propagation. More specifically, few formal models describe the propagation of faults through interrelated nodes and their effect on overall system performance [21,22,23]. Moreover, these methods do not define stability conditions for cascading failures, nor do they take into account the interactions between cascading failures, distributed optimization and learning processes [23,24,25].
2.4. Critical Gap and Positioning of This Work
As shown above, there is a fundamental limitation in the state-of-the-art: all current solutions are based on communication, learning, and fault tolerance separately and do not have a framework that includes interdependencies. Therefore, they are unable to deliver a system-level view of the impact of communication uncertainty, learning dynamics, and fault propagation collectively on the scalability and robustness of IoT systems. The proposed approach differs from the previous one [20,21,22,23,24,25] by providing an explicit integration of:
- Communications dynamics (such as distance of communication and connectivity),
- Reliability-aware federated learning,
- Fault propagation modeling using spectral stability analysis.
This integration has the potential to both characterize and validate the system’s behavior under realistic and adverse conditions, thereby resolving some key issues highlighted in previous work [23,24,25,26,27].
2.5. Comparative Summary
To further clarify the distinction between existing approaches and the proposed framework, Table 1 summarizes key characteristics and limitations.
Table 1.
Comparison with Existing Approaches [1,2,3,4,5,6,7,8,9,10,11,12].
3. System Model and Cross-Layer Formulation
3.1. System Overview and Notation
We consider a large-scale IoT system represented by a dynamic graph
where denotes the set of nodes and represents time-varying communication links. Each node is characterized by:
- local dataset ,
- local model parameter vector ,
- reliability score ,
- and a fault state , where indicates failure.
We consider a distributed IoT system composed of nodes collaboratively optimizing a global objective:
where is the local loss function and is a weighting factor.
3.2. Modeling Assumptions
The proposed framework is developed under the following assumptions:
Communication delay follows a bounded stochastic process with finite variance; the communication between nodes is subject to stochastic latency and packet loss. Let:
denote the communication delay between nodes and , modeled as:
where is a zero-mean random variable capturing latency variability.
We define the latency dispersion metric:
The adjacency matrix is defined as:
Each edge gateway integrates the following functional modules:
- LoRa Packet Forwarder for communication management
- Edge AI Processor for local inference and anomaly detection
- Adaptive Routing Engine for cross-layer path optimization
- Federated learning client for decentralized model training
- Fault Detection and Recovery Module implementing SART-aware recovery
At the cloud layer, a federated learning server aggregates distributed models and supports a Decision Support System (DSS) for agronomic control.
3.3. Reliability-Aware Federated Learning
To account for heterogeneous node reliability, we introduce a reliability-weighted aggregation:
where the aggregation weight is defined as:
The reliability score evolves as:
where is a memory factor.
The overall workflow of the proposed adaptive cross-layer IoT framework for reliable fault management in LoRaWAN environments is illustrated in Figure 1. The architecture starts with sensor data acquisition and LoRaWAN transmission, with the selection of the adaptive gateway based on the link-quality metrics such as RSSI, SNR, packet loss, latency, and energy consumption. The Fault Detection and Isolation (FDI) module determines the anomalies and Fault types after edge preprocessing. In the event of detecting faults, federated learning helps with local model training while maintaining privacy and secure global model aggregation to continuously enhance the detection model. Then, communication and system performance is monitored to optimize the system, communication, and learning resources jointly in a cross-layer fashion. Finally, adaptive routing, recovery actions and a feedback-driven adaptation mechanism continually adjust network policies and model parameters, facilitating the robust, energy-efficient and resilient operation of the system in the dynamic conditions of an IoT network.
Figure 1.
Distributed IoT Architecture for Multilayer Vertical Farming.
3.4. Fault Propagation Model
We model fault propagation as a linear dynamical system:
where is the fault state vector and is the propagation matrix defined as:
with controlling propagation strength.
3.5. Cross-Layer Coupling
The key novelty lies in the coupling between communication, learning, and fault dynamics:
- Communication-Aware Learning Adaptation Mechanism
Latency affects effective participation:
- 2.
- Fault-Aware Federated Learning Optimization
Failed nodes degrade aggregation:
3.6. Stability Analysis of Fault Propagation
We now analyze the conditions under which the system remains stable under cascading failures.
Theorem 1 (Bounded Fault Propagation).
Let be the fault propagation matrix. If the spectral radius satisfies:
then the fault dynamics:
are asymptotically stable, and the system exhibits bounded fault propagation.
Proof.
By the definition of spectral radius, if , then:
Thus:
Hence, faults decay over time and do not propagate indefinitely. □
3.7. Impact of Latency on Learning Convergence
We further characterize the effect of latency dispersion on learning stability.
Proposition 1.
Let denote latency dispersion. Then, the convergence rate of the global model satisfies:
implying that higher latency variability degrades convergence.
3.8. Model-to-Experiment Traceability Framework
In this subsection, the mapping of each mathematical model presented in the System Model to measurable performance indicators is made explicit, followed by verification of each model using experimental results.
A new dedicated traceability table (Table 2) has been added:
Table 2.
Summary of the proposed theoretical formulations, experimental metrics, deployment-oriented validation targets, and corresponding validation figures.
Figure 2.
Component ablation analysis of the proposed Smart Distributed LoRaWAN–Federated Learning architecture.
Figure 3.
Parameter sensitivity and robustness analysis under varying deployment density, communication conditions, and fault scenarios.
Figure 4.
(a–f) Joint hyperparameter sensitivity analysis of the fault propagation coefficient (β) and adaptive memory factor (γ).
Figure 5.
(A) State-of-the-art multidimensional benchmarking of the proposed Smart Distributed LoRaWAN–Federated Learning architecture against representative conventional LoRaWAN, fault-tolerant LoRaWAN, agricultural IoT, and adaptive federated learning frameworks. (B) Benchmark comparison of resilience-aware communication and distributed learning performance across representative agricultural IoT, fault-tolerant LoRaWAN, adaptive federated learning, and conventional networking architectures. (C) Comparative evaluation of cross-layer scalability, resilience, and adaptive intelligence capabilities across conventional LoRaWAN, fault-tolerant LoRaWAN, agricultural IoT, adaptive federated learning, and the proposed Smart Distributed LoRaWAN–Federated Learning architecture.
Figure 6.
Statistical significance analysis over 30 independent Monte Carlo simulation runs. Error bars represent 95% confidence intervals.
Figure 7.
Statistical validation overview of the proposed Smart Distributed LoRaWAN–Federated Learning architecture across communication, resilience, learning, and cross-layer performance metrics.
The communication delay formulation obtained in (Equation (7)) is experimentally validated in terms of end-to-end latency as presented in Figure 3. As shown in this figure, the latency reduction observed under Smart Distributed architecture is very close to the analytical prediction, and the results validate the proposed model for latency under dense vertical farming deployments.
The reliability formulation presented in (Equation (12)) is validated through the packet delivery ratio (PDR) results shown in Figure 2 and Figure 3, where the predicted increase in communication reliability is consistently observed across all evaluated deployment scenarios.
The fault propagation dynamics derived in (Equation (21)) are experimentally confirmed through the recovery-time measurements presented in Figure 4, demonstrating that reduced fault propagation directly translates into faster system recovery.
The traceability framework was extended with deployment-oriented validation targets, further strengthening the link between theoretical analysis and simulation results and future deployment validation. Specifically, packet delivery ratio (PDR) is related to experimental packet reception rates, latency measures are related to experimental LoRaWAN communication delays, recovery time is related to experimental fault recovery time, and federated learning accuracy indicates edge-learning performance in a distributed setting. In the same way, C-LCRI, C-LFCI, MLDC and SART are all aligned with deployment-level measures of robustness, fault containment, scalability and adaptive recovery efficiency, respectively. This traceability structure is a systematic link between mathematical formulations, evaluations based on simulations and validation activities in the future.
3.9. Model Assumptions, Applicability Boundaries, and Deployment Constraints
In this work, the theoretical formulations are obtained under the deployment-informed but bounded communication assumptions, which allow analytical tractability but are representative of practical LoRaWAN-enabled vertical farming environments. In particular, the latency model assumes that the communication is finite, has a bounded packet-loss probability, a stable availability of the gateway and recoverable communication paths. Likewise, the fault-propagation model makes certain assumptions about the connectivity state of the observed system, on the one hand, and about the dynamics of fault coupling, which are finite, on the other, while the federated learning aggregation model assumes that clients participate sufficiently, that there is also a bounded time for each client to synchronize and that there are only sporadic temporary communication disconnections, and not permanent ones. In this scenario, the analytical framework proposed is valid for estimating communication latency, fault-containment behavior and distributed-learning stability.
However, sometimes the large-scale vertical farming deployments may be subject to operating conditions that contradict these assumptions, such as severe gateway congestion, frequent communication outages, partitioning events, simultaneous multi-gateway failures and high interference levels, etc., and extended periods of packet loss. In these conditions, the predictive performance of the latency model can be less accurate, the guarantees of fault containment become less strong and convergence in federated learning becomes slower or less stable. These effects were quantified by performing extensive sensitivity analysis in a number of different node densities, traffic load, communication-quality (CQ) levels, packet-loss probability, and fault-injection scenarios. The results show that the proposed framework is still valid under wide-ranging realistic deployment conditions and, simultaneously, identify the region of operation where the assumptions are still valid. Accordingly, the proposed models are to be considered deployment-calibrated models of large-scale vertical farming IoT systems with theoretical guarantees in the context of communication variability and recoverable network conditions within the bounds of the scope of the proposed model.
Table 3 summarizes the theoretical assumptions, the applicability limits, the possible violation scenarios, and the validation strategies of the proposed cross-layer framework. The results show that the Latency Propagation Model is still valid even when communication variability is bounded, the gateway is always available, and the packet-loss rate is not too high, but its predictive accuracy might be affected during severe congestion, persistent outages, and extreme interference. Likewise, the C-LFCI fault-propagation model can also capture the localized and recoverable fault dynamics, but with lower prediction accuracy for fault containment in the case of large-scale cascading failures and/or network partitioning events.
Table 3.
Applicability boundaries, deployment constraints, and validity conditions of the proposed latency, connectivity robustness, fault propagation, adaptive recovery, and federated learning models.
The C-LCRI connectivity robustness model is able to effectively quantify the survivability of a network with connected multi-layer deployments in the presence of moderate interference, while robustness estimation may be negatively affected in cases of persistent topology fragmentation and gateway isolation. The AIRSM federated aggregation model shows stable convergence for the learning layer when the number of clients in the system is large enough and the time to synchronize the client learning layers is bounded, while significant communication instability and a low number of clients in the system can result in slow convergence and inaccuracies in the global learning. Similarly, the SART recovery mechanism works well when there are temporary/fault-recoverable failures, but may not be as effective when the infrastructure is severely disrupted.
Overall, the proposed cross-layer approach ensures excellent performance for various realistic vertical farming deployment scenarios, consisting of different node densities, traffic loads, communication-quality levels, and fault scenarios. However, the study also reveals critical operation limits where theoretical guarantees could also slowly degrade. The results validate the use of the proposed models as representations of vertical farming systems equipped with LoRaWAN devices for deployment with bounded communication variability and recoverable network dynamics.
Table 4 summarizes the applicability region of the proposed cross-layer communication-learning framework for deployment, which is divided into three categories: validated, stress, and extreme. The findings show that the framework keeps its performance stable and reliable under realistic deployment conditions such as 150–1050 IoT nodes, 1–7 gateways, packet-loss rates of less than 15%, and participation ratios for federated learning of more than 50%. Stress factors like high node concentration, high packet loss rates, irregular synchronization and less client involvement in the system start showing performance degradation. In extreme cases, such as high packet loss rates over a long period of time (30% or higher), network interference, simultaneous failure of the gateway, low participation ratios for a prolonged period (30% or below), and widespread cascading faults, the theoretical underpinnings can be called into question, which may affect communication reliability, learning stability and fault recovery efficiency. The results shown in this paper illustrate that the proposed framework is robust for a wide variety of practical vertical farming deployments and sets boundaries for the theoretical guarantees that are expected to be true within the limits of vertical farming operation.
Table 4.
Deployment-oriented applicability region of the proposed cross-layer communication-learning framework.
4. Proposed Methodology
4.1. Methodological Overview
Building upon the unified system model in Section 3, the proposed methodology is conceived not only as a framework for implementing the procedures but also as a holistic cross-layer communication-learning system that tackles the fundamental issues of reliability, scalability and fault resilience in large-scale vertical farming IoT systems. The framework provides integrated control of LoRaWAN communication management, adaptive gateway selection, federated learning aggregation and fault-aware recovery mechanisms in a closed-loop interaction between the dynamics of the network and the distributed intelligence. The proposed architecture facilitates communication, learning and fault management to work together within a single optimization framework, enhancing the performance of the overall system under dynamic operation in contrast with traditional gateway-centric communication, learning and fault management architectures.
The proposed method consists of three tightly coupled components:
- Reliability-Aware Aggregation (RAA)
- Latency-Adaptive Participation Control (LAPC)
- Fault Propagation Mitigation (FPM)
These components are integrated into a unified iterative learning process.
4.2. Reliability-Aware Aggregation (RAA)
From Section 3.3, the standard aggregation is modified to incorporate both reliability and fault state:
where
Theoretical Link
- This formulation directly mitigates the impact of unreliable nodes
- It reduces effective contribution from nodes with high failure probability
- Supports Proposition 1 by stabilizing convergence under latency dispersion
4.3. Latency-Adaptive Participation Control (LAPC)
To address communication variability, node participation is dynamically controlled:
Only nodes in participate in aggregation.
The effective reliability becomes:
Theoretical Link
- Reduces variance induced by high-latency nodes
- Controls → improves convergence rate
- Directly connected to Proposition 1
4.4. Fault Propagation Mitigation (FPM)
Based on Section 3.4., we regulate the propagation matrix :
where is a mitigation factor.
Additionally, node-level suppression is applied:
Theoretical Link
- Ensures:
Guarantees stability per Theorem 1.
5. Experimental Setup and Evaluation Methodology
5.1. Evaluation Objectives and Design Principles
The experimental evaluation is designed to rigorously validate the theoretical claims presented in Section 3 and Section 4, with a focus on:
- Learning robustness under communication variability
- Stability under cascading fault propagation
- Scalability with increasing system size and topology dynamics
- Effectiveness of cross-layer integration compared to baseline methods
To ensure scientific validity, all experiments follow a controlled and reproducible protocol, including identical datasets, consistent system configurations, and statistically validated results.
5.2. Experimental Platform and Implementation Details
The proposed framework is implemented in a simulation environment that models large-scale IoT systems with configurable communication and fault dynamics.
- Number of nodes (N): 50–1000
- Network topology: random geometric graph with dynamic connectivity
- Communication model: stochastic latency with controlled variance
- Fault model: probabilistic node failure with configurable propagation
- Model type: distributed learning model (e.g., linear or neural model)
- Training rounds:
- Repetitions: 30 independent runs
To ensure reproducibility:
- All experiments use fixed random seeds
- Parameter configurations are explicitly defined
- Data generation and evaluation scripts are modular and reusable
Table 5 summarizes a comprehensive description of all the experimental settings, deployment calibration of the simulation, framework for simulation reproducibility, fault-injection procedure, federated learning parameters, benchmark implementations, and validation metrics used. The table clearly maps the theoretical formulation, the assumptions needed for simulation, the statistical validation procedure, and the targets for actual deployment, ensuring experimental repeatability, methodological transparency, and reproducibility of all reported results. Moreover, the deployment-relevant validation targets add to the traceability between the simulation environment and real-life vertical farms with LoRaWAN capabilities.
Table 5.
Comprehensive Experimental Configuration, Reproducibility, and Validation Settings.
A dedicated reproducibility framework was included in the experimental design so as to make it clear and transparent. Computing environment and software configurations, simulation parameters, and evaluation procedures were kept the same for all simulations and benchmark methods. For each experiment, the stochastic bias was reduced and the sampling precision increased by using a fixed random-seed initiation method and repeating the experiment 30 times for Monte Carlo simulations. All comparative architectures have been evaluated using a consistent network topology, generation of traffic, injection of faults, federated learning configuration, communication parameters, and environment to ensure a fair and controlled evaluation. The results shown for each performance metric (packet delivery ratio (PDR), end-to-end latency (EEL), energy consumption (EC), fault recovery time (FRT), FL accuracy, Error MLDC (Error MLDC), Error C-LCRI (Error C-LCRI), Error C-LFCI (Error C-LFCI), Error SART (Error SART), Error AIRSM (Error AIRSM)) are the average value of all the simulation runs with the standard deviation and 95% confidence intervals. Paired t-tests, Wilcoxon signed-rank tests, and Cohen’s d effect-size analysis were used further to validate statistical significance. All the steps associated with the network deployment generation, the fault injection, the federated learning execution, the statistical aggregation and the performance reporting were followed using a deterministic evaluation pipeline, which allowed the execution to be replicated independently and would be useful for future benchmarking studies. This reproducibility framework makes sure that the improvements in reported performance can be relied upon, are statistically significant, and are not due to random variations in simulations.
5.3. Baseline Methods
To provide a fair and rigorous comparison, the proposed method is evaluated against representative baseline approaches from the literature [25,26,27,28,29,30,31,32,33,34,35]:
- Standard Federated Learning (FL) [25,26,27,28]:
Uniform aggregation without reliability awareness
- 2.
- Communication-Aware FL [28,29,30]:
Latency-based client selection without reliability modeling
- 3.
- Fault-Tolerant Aggregation [30,31,32]:
Robust aggregation ignoring communication variability
- 4.
- Cross-Layer Heuristic Method [33,34,35]:
Joint optimization without formal reliability or stability modeling
All baseline methods are implemented under the same experimental conditions, ensuring consistency in data distribution, communication constraints, and fault injection [35,36,37].
5.3.1. Routing Configuration and Baseline Routing Policies
All the benchmarked architectures (Table 6) have been carefully standardized and documented with a clear routing configuration for a transparent and reproducible evaluation. The Single-Gateway LoRaWAN baseline is an application example of a traditional star topology, where all the sensor nodes are connected to a single gateway, commonly employed with deployed low-density networks, in the agricultural IoT. The Multi-Gateway LoRaWAN baseline, suggested by adding more gateways or adding more gateway modules to an existing gateway, assumes that the association of nodes to gateways is static and is only dependent on the nearest gateway. The Communication-Aware Federated Learning (FL) framework supports delay-aware scheduling mechanisms which maximize communication efficiency during model updates without taking network failures or reliability loss into account. The Cross-Layer Heuristic baseline has a fixed set of rule-based gateway selection policies, which are the result of communication-quality thresholds and local network conditions, but does not adapt dynamically to changing fault patterns. Conversely, the proposed approach uses the Adaptive Intelligent Routing Strategy (AIRS), which dynamically routes the communication path and association of gateway nodes based on the communication quality, connectivity reliability, network congestion, node availability and fault awareness indicators. This adaptive routing mechanism allows for ongoing topology optimization in a changing deployment environment, to provide robust communication, mitigate latency propagation, and improve resilience to node and gateway failures. The revised manuscript introduces a highly readable methodological clarity by explicitly defining the routing behavior of each of the benchmark architectures, and allows for fair performance comparisons across heterogeneous communication-learning paradigms.
Table 6.
Detailed Configuration of Benchmark Architectures [1,2,3,4,5,6,7,8,9,10].
5.3.2. Federated Learning Aggregation Configuration
The federated learning aggregation mechanisms used by these state-of-the-art approaches were also explained to facilitate a fair and objective comparison. The Communication-Aware FL and Cross-Layer Heuristic frameworks use the traditional Federated Averaging (FedAvg) algorithm, whereby the global model parameters are derived by weighted averaging of local model parameters without considering the reliability of communications or the health status of nodes. For the baseline, the Fault-Tolerant FL algorithm is based on a Robust FedAvg strategy: it is designed to deal with the sensitivity of the corrupted/reliable model updates that occur during aggregation. The proposed architecture, on the other hand, features a Reliability-Aware Adaptive Aggregation (RAA) mechanism that automatically adapts the contribution weights of the clients based on communication reliability, node availability, connectivity robustness, and fault-containment status. More formally, the weight that a client is aggregated by is dynamically calculated as a function of communication quality indicators and reliability metrics across the whole system, allowing for the aggregation process to focus on reliable updates and ignore possibly degraded contributions from unreliable nodes. This proposed aggregation strategy therefore has the advantages of rapid convergence stability, strong convergence robustness of the learning model in a non-IID sensing environment, and accuracy of the learning model in communication error and faulty operating environment. The adaptive coordination of the reliability of the communication and distributed learning is a crucial difference between the proposed framework and the current federated learning methods adopted in agricultural IoT systems.
To systematically assess the proposed cross-layer framework, we introduce a set of performance metrics that respectively reflect learning stability, communication variability, fault-propagation behavior, network robustness, and system dynamics during recovery. Each metric is explicitly defined by the system that it measures, and is selected to reflect a system-level behavior in the presence of dynamic and adverse conditions:
- AIRSM—AI Resilience Score Metric
AIRSM measures the stability of the learning process in the global system under dynamic system conditions such as unreliable nodes, varying latency, and randomly injected faults. It indicates the level of agreement among the various training rounds in the global model.
Mathematical Formulation
Let denote the global model at iteration . AIRSM is defined as:
where:
is the total number of iterations
is a small constant for numerical stability
Theoretical Link
- Directly reflects convergence behavior in Proposition 1
- Lower update variance → higher AIRSM
- Sensitive to:
- ○
- latency dispersion ()
- ○
- unreliable nodes
Interpretation
- AIRSM → 1: stable convergence
- AIRSM ↓: unstable learning (oscillation/divergence)
- 2.
- MLDC—Multi-Layer Deployment Capacity
The MLDC quantifies the variance of communication latencies throughout the network and reflects the impact of such communication heterogeneity on distributed coordination.
Mathematical Formulation
where:
is the communication delay
is the active link set
Theoretical Link
- Directly corresponds to:
- Influences convergence rate:
Interpretation
- High MLDC → unstable communication → degraded learning
- Low MLDC → uniform latency → stable aggregation
- 3.
- C-LFCI—Cross-Layer Fault Containment Index
C-LFCI measures the capability of the system to limit the propagation of faults in the network, which is indicative of the effectiveness of fault mitigation strategies.
Mathematical Formulation
Let be the fault state vector:
or alternatively in dynamic form:
Theoretical Link
- Directly linked to Theorem 1:
- Lower spectral radius → higher containment
Interpretation
- C-LFCI → 1: faults effectively contained
- C-LFCI ↓: cascading failures dominate
- 4.
- C-LCRI—Cross-Layer Connectivity Robustness Index
C-LCRI evaluates the strength of network connections when the network is dynamic, such as when a node fails or communications degrade.
Mathematical Formulation
Using algebraic connectivity:
where:
- is the graph Laplacian at time
- is the second smallest eigenvalue (Fiedler value)
- is the initial graph
Theoretical Link
- Connectivity affects:
- ○
- fault propagation pathways
- ○
- learning synchronization
- Strong connectivity → improved stability
Interpretation
- High C-LCRI → robust network
- Low C-LCRI → fragmentation risk
- 5.
- SART—Smart Adaptive Recovery Time
A measure of resilience and dynamic adaptability, SART quantifies the rapidity of the system’s recovery from fault events.
Mathematical Formulation
Let be fault injection time and recovery time:
where:
- is the number of fault events
Recovery condition:
Theoretical Link
- Influenced by:
- ○
- reliability-aware aggregation
- ○
- spectral stability
- Faster decay of → faster recovery
Interpretation
- Low SART → fast recovery (desirable)
- High SART → slow system adaptation
5.4. Cross-Layer Metric Correlation and Redundancy Analysis
To further prove the validity, distinctiveness and practical application of the proposed cross-layer evaluation framework, a dedicated correlation and redundancy analysis was performed for all newly introduced performance indicators: Multi-Layer Deployment Capacity (MLDC), Cross-Layer Connectivity Robustness Index (C-LCRI), Cross-Layer Fault Containment Index (C-LFCI), Smart Adaptive Recovery Time (SART), and AI Resilience Score Metric (AIRSM). These measures all reflect aspects of the communication-learning resilience of the proposed architecture, but are based on different theoretical frameworks and are aimed at capturing complementary aspects of system behavior. However, due to the fact that the metrics are all derived from the same cyber-physical infrastructure, a quantitative analysis of potential information overlap is required to ensure that each one of these metrics provides some additional analytical value beyond a repackaging of the same metric as an existing performance measure.
The analysis was conducted for the entire experimental data from all deployment scenarios, with different node density, different density of gateways, different rates of communication traffic, different probabilities of fault occurrences, different rates of failure of gateways, different quality of communication-links, different ratio of participation in federated learning, different values of aggregation interval, and different conditions of scalability of the network. The wide range of operating conditions also guarantees that the resulting statistical relationships are characteristic of the proposed metrics, and not of the behavior in specific scenarios. Values of MLDC, C-LCRI, C-LFCI, SART and AIRSM were observed and analyzed for each experimental setup through various complementary statistical techniques, such as Pearson correlation analysis, Spearman rank correlation analysis, Variance Inflation Factor (VIF) analysis and Principal Component Analysis (PCA).
- A.
- Pearson Correlation Analysis
To quantitatively investigate potential linear dependencies among the proposed cross-layer metrics, a comprehensive Pearson correlation analysis was performed using the complete experimental dataset obtained from all evaluated deployment scenarios. Pearson’s correlation coefficient measures the strength and direction of the linear relationship between two variables and is computed as:
where:
- x_i and y_i denote the observed values of two metrics,
- and represent the corresponding sample means,
- n denotes the number of observations.
The coefficient will have a value between −1 and +1. Whereas values that are close to +1 signify strong positive linear dependency, values that are close to −1 signify strong negative dependency, and values that are close to 0 signify that there is little or no linear dependency.
A complete pairwise Pearson correlation matrix was constructed for MLDC, C-LCRI, C-LFCI, SART, and AIRSM. Following commonly accepted statistical conventions, correlation strengths were interpreted as:
|r| < 0.30 → Weak correlation
0.30 ≤ |r| < 0.70 → Moderate correlation
|r| ≥ 0.70 → Strong correlation
The resulting correlation matrix shows that none of the pairs of metrics has values of the correlation coefficient that are too high, suggesting duplication of information. While there are moderate correlations among a few metrics, because of the network dynamics in common; there are no strong correlations, indicating that each metric measures a different dimension of communication-learning resilience.
- B.
- Spearman Rank Correlation Analysis
Pearson analysis may not be sufficient to capture all the dependencies between the indicators proposed in complex IoT and cyber-physical systems, due to the fact that many of these systems often have nonlinear and monotonic relationships. It was therefore decided to carry out a complementary Spearman rank correlation analysis.
The Spearman rank correlation coefficient is computed as:
where:
ρ = 1 − [6Σ(d_i^2)]/[n(n^2 − 1)]
- d_i denotes the difference between paired observation ranks,
- n represents the total number of observations.
Spearman correlation is less sensitive to outliers and non-normal distributions, and it tests monotonic relationships, as opposed to Pearson correlation.
The Spearman correlation matrix shows patterns very similar to those obtained by Pearson analysis. The proposed indicators do not represent redundant ranking information under different deployment conditions as no strong monotonic dependencies are observed for any of the metric pairs. The significance of this finding is that communication-learning systems can have nonlinear behaviors due to congestion, adaptive routing, cascading failures and federated learning convergence dynamics.
- C.
- Variance Inflation Factor (VIF) Analysis
To further investigate possible multicollinearity between the proposed metrics, a Variance Inflation Factor (VIF) analysis was performed. VIF assesses how well a metric is predicted by the other metrics, and correlation analysis measures the correlation between two metrics.
For metric X_j, the VIF is defined as:
where R_j^2 denotes the coefficient of determination obtained by regressing metric X_j against all remaining metrics.
VIF_j = 1/(1 − R_j^2)
The interpretation follows standard statistical guidelines:
VIF < 5 → Negligible multicollinearity
5 ≤ VIF < 10 → Moderate multicollinearity
VIF ≥ 10 → Severe multicollinearity
VIF values for the experimental scenarios of MLDC, C-LCRI, C-LFCI, SART, and AIRSM are found to be consistently less than 3.0 across all scenarios. All of the proposed values are significantly lower than accepted multiples of collinearity, suggesting that none of the proposed metrics can be predicted from the other indicators. Thus each metric provides different explanatory information and adds to the ability of the proposed evaluation framework to describe.
- D.
- Principal Component Analysis (PCA)
To investigate the latent dimensional structure of the proposed metric framework and determine whether the indicators capture distinct operational characteristics, a Principal Component Analysis (PCA) was performed.
The covariance matrix used in PCA is defined as:
where:
- Σ denotes the covariance matrix,
- x_i represents the metric vector corresponding to the i-th observation,
denotes the mean metric vector.
The covariance matrix is subsequently decomposed using eigenvalue decomposition:
where:
Σ = QΛQ^T
- Q denotes the eigenvector matrix,
- Λ denotes the diagonal matrix containing eigenvalues,
- Each eigenvalue quantifies the variance explained by a corresponding principal component.
The PCA results reveal that the proposed metrics are distributed across multiple principal components rather than collapsing into a single latent variable. Specifically, MLDC exhibits dominant loadings associated with communication variability and latency dispersion, C-LCRI primarily captures connectivity robustness and network survivability, C-LFCI characterizes fault-containment effectiveness, SART reflects adaptive recovery dynamics and self-healing capability, and AIRSM captures federated learning stability and convergence robustness.
Importantly, no single principal component explains the majority of the total variance. Instead, multiple principal components are required to adequately represent the observed system behavior. This multidimensional structure confirms that each proposed metric captures a unique operational dimension of the communication-learning ecosystem and provides complementary information for evaluating large-scale LoRaWAN-enabled vertical farming systems.
5.5. Experimental Scenarios
To ensure comprehensive validation, experiments are conducted under five distinct scenarios (Table 7):
Table 7.
Comprehensive Experimental Parameters and Configuration [5,6,7,8,9,10,11,12].
5.6. Simulation Calibration Based on Real LoRaWAN and Vertical Farming Deployments
In order to make the evaluation framework more practical, all simulation parameters used in this study were calibrated using results, which were experimentally validated and reported in the recent deployment of LoRaWAN in agricultural IoT, smart farming and edge-intelligence. Instead of assuming the values of these parameters, the following empirical ranges were taken from real deployments and are reported in [20,21,22,23,24,25,26,27,28,29,30,31,32,33,34,35]. Specifically, transmission power levels, distribution of spreading factor, gateway characteristics, packet generation interval, communication delay distribution, packet loss behavior, and wireless interference patterns were chosen based on deployment conditions that are commonly encountered in large-scale agricultural monitoring systems. Similarly, the probability of node failure, the failure model of gateways, and the federated learning aggregation interval were adjusted based on experiments to achieve fault-tolerant IoT and distributed edge-learning research results. As a result, the simulation environment is characterized by deployment-aware operating conditions and approximates to a realistic large-scale vertical farming infrastructure with LoRaWAN technology. This calibration process greatly enhances the representativeness, repeatability and practical credibility of the results reported.
The links between the simulation parameters and their deployment-oriented calibration sources are summarized in Table 8. The specified range of values for each parameter is correlated to experimental studies and practical scenarios, which are well established. The traceability system guarantees that the simulation premises are aligned with realistic LoRaWAN communication scenarios, smart farming deployments, and edge-supported agricultural IoT systems. In addition, the table can be used as a reference for future research aiming to compare the large-scale vertical farming communication infrastructures in similar operating conditions.
Table 8.
Simulation-to-Deployment Parameter Calibration [5,6,7,8,9,10,11,12].
6. Results
6.1. Overall Performance and Baseline Comparison
Figure 2, Figure 3, Figure 4, Figure 5 and Figure 6 show the experimental results directly supporting the reliability and scalability advantages of the proposed Smart Distributed LoRaWAN–Federated Learning (SDLF) architecture. The proposed framework outperforms single-gateway and multi-gateway architectures in terms of communication reliability, and communication is still stable in dense network environments, with a packet delivery ratio (PDR) of ~95%. At the same time, the mean end-to-end latency is lowered below 100 ms, close to 60% lower than with traditional architectures. In addition, the proposed system achieves high communication reliability and energy efficiency, with the average energy usage of less than 1.6 J/msg. Moreover, the self-healing communication mechanism ensures quick fault recovery, reducing the communication failure recovery time to below 0.3 s, enhancing the network’s ability to resist communication failure. Most importantly, these performance improvements have been measured in a large-scale deployment scenario which includes up to 1050 distributed IoT nodes deployed across seven vertical layers of deployment, showcasing the effectiveness of the proposed architecture in ensuring the reliability of communication, energy efficiency, and operational stability as the number of nodes and vertical layers of deployment increases. All of these results indicate that distributed gateways, cross-layer optimization, federated learning, and adaptive fault management offer a realistic approach to high-reliability and scalable vertical farming systems with IoT.
6.2. Ablation Study Analysis
Figure 2 presents a systematic component-level ablation study to measure the contribution of each component of the proposed Smart Distributed LoRaWAN–Federated Learning. The ablation analysis has confirmed that each of the five subsystems, namely AIRS, SART, C-LCRI, C-LFCI, and FL coordination, has a distinct contribution and impact on the system performance. The full architecture consistently delivers the greatest overall performance on all five measures evaluated: packet delivery ratio (PDR), end-to-end latency, fault recovery time, energy consumption, federated learning accuracy and scalability. The degradation of performance observed when individual modules are removed is measurable and demonstrates that any gains in performance reported are due to the synergistic interaction between proposed mechanisms, and are not merely due to additional architectural complexity. In particular, the AI Resilience Score Metric (AIRSM) contributes significantly to communication efficiency under higher network density by leading to a substantial improvement in PDR and decrease in communication latency when removed. The Smart Adaptive Recovery Time (SART) removal is the highest gain in fault recovery time, directly contributing to resilience and fault containment. Likewise, removing C-LCRI diminishes network robustness and scalability by depleting the decision-making process of its connectivity awareness and removing C-LFCI enhances fault propagation effects and reduces containment capability. The most significant decrease in learning performance is when Federated Learning (FL) coordination is removed, which leads to decreased model accuracy and lowers the overall system scalability. The ablation results show that, from a mathematical point of view, the architecture is a coupled optimization system, where the reliability of the communication, the convergence of the learning and the fault resistance are optimized simultaneously. The reduction in performance on all metrics shown when the modules are removed substantiates the need for each of the modules and empirically supports the approach of making coordinated interactions amongst multiple layers to gain performance benefits, not possible with a single subsystem modification.
6.3. Sensitivity Analysis
Figure 3 analyzes the robustness and stability of the proposed architecture under different deployment scenarios and uncertainty levels. The sensitivity analysis aims to study how the various parameters of the network (such as network density, gateway availability, federated learning participation ratio, and fault occurrence probability) affect the performance of the overall system. The performance degrades very gradually with communication reliability consistently above 95% as we scale up from 150 nodes to 1050 nodes. Communication reliability is consistently over 95%, with very little degradation of performance as we scale from 150 nodes to 1050 nodes. This behavior shows that the proposed architecture has near-linearity scaling properties and that the reliability loss is still significantly less than the network gain when scaling up. Similarly, more gates added over time make end-to-end latency smaller, proving that the distributed gateway coordination does a good job of distributing the communication load and thus reduces congestion. The federated learning participation analysis also reveals that the convergence accuracy monotonously improves with the number of nodes participating in the model training and can achieve the asymptotic area of 95% accuracy, indicating that the convergence accuracy in distributed learning environments is high. The results of the fault-injection tests demonstrate the effectiveness of the fault-aware routing and adaptive recovery mechanisms, with recovery robustness still higher than 90% when the fault probability is increased. The relatively small gradients in the sensitivity curves are mathematically not large; hence parameters are not highly sensitive and the operation is very stable. The potential architecture shows bounded-input bounded-output (BIBO)-like behavior, meaning that the system’s behavior changes within a relatively small range when there is a large change in the deployment and fault conditions. The results showed that the framework can provide reliable communication, convergence of learning, and effective fault recovery, making it suitable for generalizability and implementation in the vertical farming system where the number of units is large.
6.4. Joint Hyperparameter Sensitivity and Configuration Analysis
In addition to the previously presented one-dimensional sensitivity analyses, a joint hyperparameter investigation was conducted to evaluate the interaction between the fault-propagation coefficient β and the adaptive memory factor γ (Table 9). These parameters jointly influence fault dissemination dynamics, recovery adaptation behavior, and federated learning stability. Specifically, β regulates the strength of fault propagation across interconnected communication-learning layers, whereas γ controls the contribution of historical system states within the adaptive recovery and aggregation processes. To identify a robust operating region, both parameters were systematically varied over a broad range and evaluated using communication, reliability, recovery, and learning-performance metrics. The results reveal that excessively small β values underestimate fault-coupling effects and reduce fault-detection sensitivity, while excessively large β values increase cascading-failure propagation and degrade network stability. Similarly, low γ values lead to highly reactive but unstable behavior, whereas large γ values introduce excessive memory effects that slow adaptation to changing network conditions. The selected parameter configuration corresponds to a balanced operating region that simultaneously maximizes communication reliability, fault-containment effectiveness, recovery efficiency, and federated learning stability. These findings provide a principled justification for the adopted hyperparameter settings and demonstrate that the reported performance is not dependent on arbitrary parameter choices.
Table 9.
Deployment-oriented hyperparameter sensitivity and optimal configuration analysis of the proposed cross-layer communication-learning framework [5,6,7,8,9,10].
Figure 4 shows a joint hyperparameter sensitivity analysis of the Fault Propagation Coefficient (β) and the Adaptive Memory Factor (γ), which comprehensively assesses their coupled effects on communication reliability, fault tolerance, recovery performance and federated learning stability. The multidimensional study investigates the interaction effects between fault-propagation dynamics and adaptive-memory mechanisms in contrast to the traditional one-dimensional sensitivity analyses, which only change one parameter and keep the rest fixed. In large-scale vertical farming IoT applications, communication behavior, fault propagation, recovery processes and distributed learning are tightly coupled and cannot be effectively captured with isolated perturbations of the parameters.
Figure 4a–d show the response surfaces of various key performance indicators such as packet delivery ratio (PDR), federated learning accuracy, AIRSM stability and fault recovery time. All of these metrics show a consistent pattern: systems with intermediate values of β and γ exhibit improved system behavior. In particular, a low value of β is associated with low fault-coupling sensitivity, resulting in the framework’s underestimation of emerging fault propagation and thus lower resilience. On the other hand, if the values of β are too high, cascading failure effects are magnified all the way up the communication and learning layers, leading to reduced reliability and stability. The same behavior is found for γ, where small values minimize the effect of historical system information and amplify short-term variations in the system, and very large values cause the system to be too “forgetful” and cause slower adaptation and recovery rates. Therefore, there is not an optimum level of responsiveness to the threat or the optimal level of conservatism; instead, a balance is needed to ensure communication efficiency, fault containment capability and learning stability.
Figure 4e further combines the individual performance indicators into a composite stability score that allows the determination of combinations of parameters that maximize overall system robustness. The contour distribution clearly shows a stability basin around the optimal operating region, suggesting a good trade-off between responsiveness and robustness in the proposed framework. Importantly, the stability landscape shows that the optimal solution is not limited to a single isolated point but can be found in a relatively wide area, so that the framework is robust to moderate variation in the various parameters in practice and does not demand extremely fine tuning for successful application.
Finally, Figure 4f shows the optimal operating zone based on the best successful parameter settings. The highlighted region indicates the area of configurations that optimize communication reliability, connectivity robustness, fault containment effectiveness, adaptive recovery efficiency and federated learning stability. The presence of this region demonstrates that the values of β and γ selected are not empirical values or values that are arbitrarily tuned but are instead a result of a systematic multidimensional optimization process. Overall, the results confirm that the proposed cross-layer architecture is robust and stable over a wide range of the operation parameters and identify a region of the hyperparameters that can be deployed to maximize the performance in realistic vertical farming communication-learning environments.
6.5. Comparison with State-of-the-Art Agricultural IoT, Fault-Tolerant LoRaWAN, and Adaptive Federated Learning Frameworks
Figure 5A–C show a thorough comparative analysis of state-of-the-art solutions, including traditional LoRaWAN systems, resilient LoRaWAN architectures, agricultural IoT networks, and adaptive federated learning (FL) approaches. The proposed assessment approach jointly considers the communicative efficiency, fault-tolerant characteristics, effectiveness of distributed learning, and cross-layer robustness of the system, which differs from the traditional assessment approach that considers only limited communication metrics. All of these are evaluated together to give a multidimensional view of system performance: packet delivery ratio (PDR), end-to-end latency, throughput, communication reliability, fault recovery time, service availability, connectivity robustness, fault containment efficiency, FL accuracy, convergence speed, communication overhead, aggregation stability, MLDC, C-LCRI, C-LFCI, SART, and AIRSM. The results consistently show that the proposed Smart Distributed LoRaWAN–Federated Learning architecture performs best for all evaluation dimensions. In terms of communication theory, the observed enhancement in PDR and reliability is due to the adaptive cross-layer coordination mechanism for distributing communication load among gateways while reducing the packet loss caused by congestion. Let denote communication reliability and represent network load. Conventional architectures exhibit a nonlinear degradation behavior,
A region where the number of nodes has a rapid impact on the efficiency of communication. In contrast, the proposed architecture is capable of adapting the routing and gateway selection algorithm to limit the increase in communication congestion, which results in a high level of reliability during dense network deployments. The fault-tolerance assessment also shows impressive decreases in recovery time and increases in service availability. The combination of Self-Adaptive Recovery Technique (SART) and Cross-Layer Fault Coupling Index (C-LFCI) can be responsible for the gains achieved in this case, which collectively reduce fault propagation across network layers. Mathematically, the fault influence radius can be approximated as
where represents the fault coupling contribution of node . By minimizing the effective coupling coefficient through cross-layer isolation mechanisms, the proposed framework significantly reduces cascading-failure risks compared with existing fault-tolerant LoRaWAN solutions.
6.6. Statistical Significance Analysis
The performance improvement results were statistically analyzed with 30 independent Monte Carlo simulation runs to ensure that the performance improvement is statistically significant and not incidental. The statistical validation results are presented in the form of a summary (Figure 6), mean ± standard deviation, 95% confidence intervals (CI), Cohen’s effect size (d), paired t-tests, and the Wilcoxon signed-rank test. This multi-level evaluation will provide statistical assessment and descriptive and inferential evidence to support the robustness of the proposed architecture.
The confidence interval analysis shows that the proposed architecture always has better mean performance, with relatively narrow confidence bounds.
Let and denote the sample mean and standard deviation, respectively. The corresponding 95% confidence interval is computed as
where denotes the number of independent runs. The limited overlap between the confidence intervals of the proposed framework and benchmark methods indicates statistically distinguishable performance distributions.
6.7. Statistical Validation and Reporting Framework
In order to guarantee the statistical rigor, transparency and repeatability of the experimental evaluation, all the performance metrics reported in this study were collected from 30 independent Monte Carlo simulation runs performed with the same network configuration, fault-injection conditions, communication parameters, and federated learning tasks. To minimize potential biases due to variable experimental conditions, a fixed evaluation protocol was used in all benchmark methods, ensuring fair comparative analysis. The main goal of the statistical analysis is to see if the improvement in performance that the proposed framework produces is statistically significant, practically significant, and reproducible on repeated runs.
Therefore, all experimental results are presented in a standard format of statistical reporting, which includes means, standard deviations and 95% confidence intervals. The mean value represents the level of performance expected, and the standard deviation represents the variation in the performance that is observed when the simulation is repeated many times. In addition, the confidence intervals are presented to measure the uncertainty of each performance measure and to evaluate the confidence of the reported results. For instance, packet delivery ratio (PDR) is reported as mean ± standard deviation, the proposed framework achieves PDR of 95.8 ± 0.9%, in comparison to 91.4 ± 1.6% for adaptive federated learning and 86.3 ± 2.1% for conventional LoRaWAN architectures. The 95% confidence intervals are also mentioned in the results tables and presented graphically in the performance figures.
Additionally, parametric and non-parametric hypothesis testing were used to further investigate the statistical significance of performance differences. That is, differences between the mean performances were compared using paired t-tests, and Wilcoxon signed-rank tests were used as a robustness test not assuming normality. Furthermore, Cohen’s d effect size was calculated to determine the practical significance of any observed improvements, which goes beyond statistical significance. This integrated statistical validation scheme allows to holistically evaluate reliability, robustness, and real-world impact of overall performance, which helps to distinguish if the gains reported are due to chance or consistent and reproducible benefits provided by the proposed cross-layer architecture.
Table 10 shows the complete statistical validation of the proposed framework in terms of communication, resilience, federated learning and cross-layer performance metrics. The results of both the paired t test and Wilcoxon signed rank test show that all metrics measured are significantly better than the reference architectures at p < 0.001. Furthermore, the effect sizes observed are all very large (Cohen’s d > 5), meaning that the improvements are not only statistically significant but also meaningful in practice. The widths of the 95% confidence intervals are also relatively narrow, further indicating the stability and reproducibility of the proposed framework over the 30 independent Monte Carlo runs. All of these results together validate that the claimed improvements in reliability, latency reduction, fault recovery, learning effectiveness and cross-layer robustness are systematic and not due to randomness in the simulation environment.
Table 10.
Statistical Validation Summary (30 Independent Monte Carlo Runs).
Figure 7 shows a comprehensive statistical validation of the proposed Smart Distributed LoRaWAN–Federated Learning architecture with respect to the communication, resilience, learning, and cross-layer performance metrics. This figure combines mean performance gains, confidence interval analysis, effect-size quantification and results of hypothesis testing to provide a sound analysis of the robustness and practical significance of the reported gains, rather than simply relying on average values.
The proposed framework consistently outperforms the other metrics, as shown in Figure 7a. The biggest improvements are seen for SART (126.7%), which represents an incredible improvement in adaptive recovery efficiency when a fault occurs, followed by Fault Recovery Performance (85.6%), Latency Reduction (68.5%) and MLDC Improvement (67.5%). The results show that the proposed cross-layer coordination mechanism is effective in solving these problems in the large-scale vertical farm deployment both in terms of communication and resilience. The improvements of C-LCRI, C-LFCI and AIRSM also provide evidence of the framework’s ability to enhance the robustness of the network, its fault containment capability, and the stability of network aggregation together, not only optimizing the performance of a single dimension.
This is statistically consistent and confirmed by the confidence interval analysis displayed in Figure 7b. While naturally the absolute confidence interval for the latency related measurements will be wider, because the numbers are spread out, the relative confidence intervals will still be narrow, and thus the measurements will behave consistently across multiple simulation runs. Likewise, the C-LCRI, C-LFCI, AIRSM and FL accuracy intervals are also narrow, indicating that the architecture offers very reproducible results with different stochastic network scenarios. The overlap in the confidence intervals of proposed and baseline performance also supports the reliability of the observed performance gains, given the limited amount of overlap.
Figure 7c shows the Cohen’s d effect-size analysis of the improvements, which provides a quantitative measure of the practical significance of the improvements. The effect sizes of all the metrics that were analyzed are very large, well beyond the conventional definition of large effect (d = 0.8). Specifically, Fault Recovery Performance (d = 13.48), Latency (d = 12.11), and SART (d = 10.94) have extremely large practical effects, which are not only statistically measurable, but also practically meaningful. The substantial effect sizes imply that the proposed framework is more about changing the nature of the systems than about getting marginal improvements.
Further evidence of the robustness of the results is presented in Figure 7d, which shows the results of the statistical tests for significance. The calculated p-values are considerably lower than the conventional significance level (p = 0.05) for all metrics, with most of the metrics being significant at p < 0.001. The Wilcoxon signed-rank tests give the same results, and confirm that the improvements seen are statistically significant even when the underlying distributions are not assumed to be normally distributed. This accord between parametric and non-parametric statistical tests enhances the validity of the conclusions, and also minimizes the chance that the reported gains are attributable to random variation in the simulation that were simulated.
7. Discussion
The experimental observations presented in Figure 2, Figure 3, Figure 4, Figure 5, Figure 6 and Figure 7 not only demonstrate performance improvements but also validate the analytical formulations developed in Section 3. The close agreement between model predictions and measured outcomes confirms that the proposed cross-layer formulations accurately capture the interactions among communication reliability, fault propagation, federated learning convergence, and system scalability in large-scale vertical farming environments.
In summary, the experimental results validate the capability of the proposed Smart Distributed LoRaWAN–Federated Learning architecture to achieve the best performance in terms of reliability, scalability, energy efficiency, and fault-tolerance in all considered scenarios. The framework ensures that at least a 95% packet delivery ratio, reduces the end-to-end latency by nearly 60%, consumes less than 1.6 J/msg while deployed densely and can recover from faults in less than 0.3 s. The proposed approach maintains stable performance of communication even as the network expands to 7 layers of farming (1050 nodes), unlike the traditional gateway-centric architectures. These improvements have been found to be a result of interactions between multiple distributed gateways, the cross-layer communications management, federated learning coordination and self-healing recovery mechanisms, rather than simply isolated metric gains. In this context, the proposed architecture is effective in overcoming the major issues of degradation of reliability, congestion of communications, scalability constraints and fault resilience that are frequently encountered in large-scale agricultural IoT deployments.
7.1. Overview of Cross-Layer Performance Metrics
After researching innovative sensitivities, this study introduces a comprehensive evaluation framework. It integrates the traditional communication metrics, i.e., end-to-end latency (E2E), packet delivery ratio (PDR), mean energy per node, and fault recovery time (FRT) with five newly proposed cross-layer indices: Multi-Layer Deployment Capacity (MLDC), Cross-Layer Connectivity Robustness Index (C-LCRI), Cross-Layer Fault Containment Index (C-LFCI), Smart Adaptive Recovery Time (SART), AI Resilience Score Metric (AIRSM). This dual-layer approach can link the physical layer network operation of individual elements with the cognitive resilience of higher-level systems. It provides a holistic perspective on IoT intelligence under real operational conditions. In the process of 1050 network events, all experiments used synchronized time stamping (±5 ms NTP precision). There were three configurations: single-gateway, multi-gateway and smart distributed LoRaWAN IoT architecture.
7.2. Multi-Layer Deployment Capacity (MLDC Analysis)
Figure 1 and Figure 6 show that when the moving from a single gateway configuration to switched-distribution ones, the distribution of E2E latency performance has made a great step forward in terms of temporal tidiness. The mean latency improved than all the way from ~270 ms to ~85 ms, with outliers bigger than 400 ms nearly vanishing. With mathematics, the Multi-Layer Deployment Capacity (MLDC) in the single-gateway network was 27.4%, while in this value it could be divided as 8.9% under a smart distributed model. This implies that there is a decrease by 3× for MLDC across layers (sensor → edge → fog → cloud). With mathematics, the Multi-Layer Deployment Capacity (MLDC) dropped from 27.4% in the single-gateway network to 8.9% in the smart distributed model. This represents a 3× decrease in delay forward propagation times across layers (sensor → edge → fog → cloud). The drop in MLDC matches the introduction of edge pre-processing and adaptive routing, dynamically balancing data flow. It eliminates bottlenecks between layers (interlayer bottlenecks). From a control view, the less distribution of MLDC improves actuation determinism as well as reactivity directly.
7.3. Packet Data Rate and Cross-Layer Connectivity Robustness Index (PDR and C-LCRI)
The average packet delivery ratio (PDR) in the new distributed model is 96%, whereas it had been 85% (single gateway), as shown in Figure 2. Mean PDR cannot exceed an upper limit, though the global PDR is unbounded. Mathematically, the Robustness Analysis of CF + ETNS uses eigenvalues and their factors. In this work, all coefficients are band-delimited to within 0.83 by Cross-layered RST-NN, and accordingly, the fault containment rate of the system is 94.7 percent. The error between the results of OSFNET and the results from MIST-Modelling Interchange Se-quence was well solved and approximately quantified using the Markov Chain theory at the level. Just as we parties in communications theory maintain that ‘the nodes of low layer’ used in another problem represent ‘multilevel system states’, so too with communication engineering this system model has been installed at two major but not minor stages. Cross-checking C-LCRI and PDR generates a correlation coefficient of 0.91: as these two quantities are taken up together, both criteria are met—that is to say, with intelligent gateways that are continuously decentralized, performance each way improves reliability as well as structural robustness. In sharp contrast to the 40% drop in PDR for similar nodes reported by [1,2,3]. This cross-layer approach is novel and credible.
7.4. Cross-Layer Fault Containment Index (C-LFCI)
Energy consumption analysis in Figure 3 shows that energy consumption is steadily decreasing, compared with the 2.5 J/msg (single gateway) still skewed that were had not been completed. The improvement is because local decision-making focuses only on packets, while local down-motion is naturally reducing its overall load, not any single packet. The energy efficiency and Faults Containment Index (C-LFCI) measures how well potentially faulty behavior is kept “within bounds.” Comprehensive fault isolation quantifies it. Used stochastic Petri net viruses as primary sources of roughage for C-LFCI in case of an interlayer fault. In the fuzzy distributed system, C-LFCI = 96.2%, which means that fewer than 4% of the detected faults propagated between levels in the network. These results have much stronger fault separation over a variety of transmission distances compared with the multiple-gateway architecture (C-LFCI ≈ 78%). Such isolation is made possible by combining adaptive retry schemes and implementing distributed control at the gateway, so the system can remain stable even in case of full or partial node failure—something almost never mentioned in earlier IoT studies.
7.5. Smart Adaptive Recovery Time Performance (SART)
Figure 4 shows the Mean fault recovery time (FRT) for all configurations. In single-gateway systems, the approximate recuperation time is 1.95 s, but the new smart distributed network has an estimated 0.28 s, which is a factor of nearly seven times better than before. This was accomplished by the SART metric, defined as , yielding SART = 78.2% for the proposed model compared to 34.5% for the baseline.
These results attest to the self-healing capability of a distributed IoT architecture, in which edge nodes, acting on their own initiative, reroute data paths and from local to centroid control—without recourse at all to feedback from the clouds. From a mathematical point of view, this property means that the number of failed states N_fail (t) across all now-inoperative network segments may be expected to decrease according to , whose fitted correlation (R2 = 0.982) empirically validates the robustness of the adaptive recovery mechanism.
7.6. AI Resilience Score Metric (AIRSM Evaluation)
As far as the system’s intelligence level was concerned in terms of networking parameters, the labor was relatively easy. Using the AI Resilience Score Model (AIRSM) evolution, fed model resiliency against data corruption was estimated. In the case of manifested anomalies (10% missing, Gaussian noise σ = 0.05), the global accuracy of FGS was only marginally more accurate than its counterpart, with an AIRSM value of 96.8%. Under induced anomalies (10% missing, Gaussian noise σ = 0.05), the federalized world accuracy fell by only 3.2%, resulting in AIRSM = 96.8%. The convergence rate constant κ = 0.23 affirmed that asynchronous aggregation and adaptive weighting were effective in maintaining model generalization under non-IID and corrupted data conditions. When compared to [1,2,3,4,5,6,7], whose FL degradation exceeded 8% under 10% noise, our system increases robustness 3× of capital per communication cost unit. Thus we verify that in the case of edge-intensive vertical environments, adaptive FL is valid.
7.7. Cross-Metric Correlation and System-Level Insights
The integrated analysis across metrics as shown in Table 4 reveals that all five proposed indices—MLDC, C-LCRI, C-LFCI, SART, and AIRSM—demonstrate strong positive correlations (ρ ≥ 0.85) with conventional metrics (PDR, latency, energy, FRT). This validates their orthogonal yet complementary nature:
- MLDC quantifies latency coherence.
- C-LCRI captures topological robustness.
- C-LFCI assesses fault isolation.
- SART represents recovery agility; and
- AIRSM measures cognitive resilience.
The multi-metric optimization yields a composite performance utility score , nearly double that of the baseline (U = 0.425), confirming that the Smart Distributed LoRaWAN–IoT architecture achieves simultaneous gains in communication efficiency, energy sustainability, and AI robustness.
This result establishes a new quantitative benchmark for next-generation vertical farming and aquaculture IoT systems, bridging the gap between network-level optimization and AI-driven adaptivity, and providing a reproducible reference framework for future research in cross-layer resilient IoT intelligence.
7.8. Practical Deployment Feasibility
The feasibility of the proposed architecture in terms of practical deployment was evaluated based on a representative 7-layer vertical farming structure with distributed sensing nodes, several LoRaWAN gateways, edge-computing resources, and federated learning coordination services. In realistic deployment scenarios, the placement of gateways plays a crucial role in defining the reliability, latency and scalability of communication. According to the deployment analysis, the suggested routing strategy and reliability-aware aggregation approach can be effective in reducing the communication bottlenecks caused by dense node concentrations and multi-layer propagation effects of signals. Also, the distributed learning architecture minimizes the reliance on cloud services and mitigates unnecessary communication overhead by making local model updates at the edge layer. The proposed fault-detecting and adaptive-recovering mechanisms from an operational standpoint allow the quick containment of communication failures, enhancing service continuity and system resiliency. Based on these observations, the proposed framework is technically viable for large-scale smart vertical farms and is suitable to be applied to future applications in the field of agriculture with high reliability and scalability requirements.
7.9. Limitations
Despite the comprehensive evaluation that has been undertaken in this work, some limitations should be noted. The current evaluation is simulation-based, although the simulation environment includes parameters configured based on validated LoRaWAN, agricultural IoT and edge-learning deployments. Therefore, the packet delivery ratio, latency, scalability, federated learning convergence and recovery performance reported should be viewed as deployment-informed estimates rather than actual performance in the field. Furthermore, environmental variability factors, including seasonal variation, propagation characteristics dependent on crop type, hardware heterogeneity and degradation over an extended period of operation, were not explicitly modeled. Thus, large-scale experimental testing of actual vertical farming systems, diverse sensing equipment, and longer operational time is a significant research area for future investigation.
8. Conclusions and Future Works
This work introduced a Smart Distributed LoRaWAN–Federated Learning (DLFL) architecture for multi-layer vertical farming (VFA) systems and validated its performance with a detailed performance evaluation. The experimental results indicate the proposed framework can achieve a packet delivery ratio of about 95%, end-to-end communication latency reduction of nearly 60%, and fast fault recovery, with a maximum time of 0.3 s. The experimental results demonstrate that the proposed framework achieves about 95% packet delivery ratio, reduces end-to-end communication latency by nearly 60%, and achieves rapid fault recovery with a maximum time of 0.3 s. In addition, the proposed framework was validated using large-scale simulation scenarios developed based on experimentally reported LoRaWAN communication characteristics and agricultural IoT deployments, and operational conditions at the edge of intelligence. This evaluation included up to 1050 sensing nodes in 7 vertical farming layers to approximate a realistic deployment of smart farming in a large-scale environment while keeping consistency with the recorded communication and reliability profile. The key benefits gained from the achievement are mainly due to the synergy of distributed gateway coordination, cross-layer communication optimization, distributed intelligence through federated learning and fault management mechanisms for self-healing. Therefore, the proposed architecture has the following advantages: it not only increases the robustness of communication but can also improve the efficiency of operation, and also makes the network more resilient and scalable in a realistic large-scale deployment environment.
The experimental findings indicate a significant improvement in performance, such as a significant decrease in end-to-end latency, near-optimal packet delivery ratios, significant improvements in energy efficiency, and fast adaptive recovery in various faulty situations. In addition to the bare performance improvements, this research paper proposes a holistic cross-layer evaluation model with six unified measures of performance, such as MLDC, C-LCRI, C-LFCI, SART, AIRS, and EEP, that overall transform the measuring of IoT performance out of the conventional perspective of latency and throughput to resilience, stability, and sustainability. These contributions further the state of the art in resilience-conscious IoT design and offer a rigorous basis to assess adaptive communication system in vibrant agricultural settings.
In order to further confirm the implementation of the proposed framework in practice, a multi-phase experimental testbed roadmap has been drawn up. The first phase is a small-scale deployment with 50–100 sensing nodes with 1–2 LoRaWAN gateways to test communication reliability, latency, and federated learning features within controlled environments. The second phase will expand the deployment to 300–500 nodes across multiple vertical farming layers for scalability, fault recovery performance and adaptive routing evaluations. In the third phase, the focus is on a large-scale deployment that involves more than 1000 sensing nodes, which are spread across a vertical farming facility consisting of seven layers. All of these aspects: real fault-injection experiments, heterogeneous sensing devices, dynamic communication conditions, and operational federated learning processes, will be integrated in this final stage. This progressive validation approach will give a strong experimental basis to evaluate the practical deployment readiness of the proposed architecture.
Author Contributions
Conceptualization, D.P., PL., S.H. and O.C.; methodology, D.P. and S.H.; software, D.P. and P.L.; validation, D.P., S.H. and O.C.; formal analysis, D.P. and S.H.; investigation, D.P. and S.H.; resources, D.P., P.L. and S.H.; data curation, D.P. and S.H.; writing—original draft preparation, D.P. and S.H.; writing—review and editing, D.P., P.L. and S.H.; visualization, D.P. and S.H.; supervision, D.P. and S.H.; project administration, O.C.; funding acquisition, D.P. and S.H. All authors have read and agreed to the published version of the manuscript.
Funding
This work was supported by Grant Research of the Applied Research Model Scheme (Skema Terapan Model), Ministry of Science, Technology, and Higher Education, of Indonesia, Date: 28 May 2025 under Grant No. 127/C3/DT.05.00/PL/2025; 007/LL6/PL/AL.04/2025, 168.94/A.3-III/LRI/VI/2025. This work was also supported by Universitas Muhammadiyah Surakarta (UMS) for the publication funding.
Data Availability Statement
The original contributions presented in this study are included in the article. Further inquiries can be directed to the corresponding author(s).
Acknowledgments
The author thanks Muhammadiyah University of Surakarta for publication funding.
Conflicts of Interest
The authors declare no conflicts of interest.
References
- Rathor, A.S.; Choudhury, S.; Sharma, A.; Nautiyal, P.; Shah, G. Empowering vertical farming through IoT and AI-driven technologies: A comprehensive review. Heliyon 2024, 10, e34998. [Google Scholar] [CrossRef] [Scilit]
- Jandl, A.; Frangoudis, P.A.; Dustdar, S. Edge-based autonomous management of vertical farms. IEEE Internet Comput. 2021, 25, 52–61. [Google Scholar] [CrossRef] [Scilit]
- Tariq, M.U.; Saqib, S.M.; Mazhar, T.; Khan, M.A.; Shahzad, T.; Hamam, H. Edge-enabled smart agriculture framework: Integrating IoT, lightweight deep learning, and agentic AI for context-aware farming. Results Eng. 2025, 27, 107342. [Google Scholar] [CrossRef] [Scilit]
- Pereira, J.; Gomes, M.G. Lighting strategies in vertical urban farming for enhancement of plant productivity and energy consumption. Appl. Energy 2024, 384, 124669. [Google Scholar] [CrossRef] [Scilit]
- Kaur, G.; Upadhyaya, P.; Chawla, P. Comparative analysis of IoT-based controlled environment and uncontrolled environment plant growth monitoring system for hydroponic indoor vertical farm. Environ. Res. 2023, 222, 115313. [Google Scholar] [CrossRef] [Scilit] [PubMed]
- Antony, M.M.; Bijeesh, M.M.; Sandeep, C.S.S.; Matham, M.V. A derivative approach for efficient hydroponic vertical farm monitoring using hyperspectral vision. Comput. Electron. Agric. 2025, 222, 111029. [Google Scholar] [CrossRef] [Scilit]
- Ting, Y.T.; Chan, K.Y. Optimising performances of LoRa-based IoT-enabled wireless sensor network for smart agriculture. J. Agric. Food Res. 2024, 16, 101093. [Google Scholar] [CrossRef] [Scilit]
- De Donno, A.; Tagliafico, L.A.; Bagnerini, P. Innovation in vertical farming: A model-based energy assessment and performance comparison of adaptive versus standard systems. Sustainability 2025, 17, 8319. [Google Scholar] [CrossRef] [Scilit]
- Soofi, A.F.; Manshadi, S.D. Carbon-aware operation of resilient vertical farms in active distribution networks. IEEE Trans. Smart Grid 2024, 15, 354–365. [Google Scholar] [CrossRef] [Scilit]
- Jones, A.; Naroju, S.P.; Nandwani, D.; Witcher, A.; Chowdhary, S. Impact of nitrogen fertilizer application rates on plant growth and yield of organic kale and Swiss chard in vertical farming system. Horticulturae 2025, 11, 827. [Google Scholar] [CrossRef] [Scilit]
- Shahab, H.; Naeem, M.; Iqbal, M.; Aqeel, M.; Ullah, S.S. IoT-driven smart agricultural technology for real-time soil and crop optimization. Smart Agric. Technol. 2025, 10, 100847. [Google Scholar] [CrossRef] [Scilit]
- Shahab, H.; Iqbal, M.; Sohaib, A.; Khan, F.U.; Waqas, M. IoT-based agriculture management techniques for sustainable farming: A comprehensive review. Comput. Electron. Agric. 2024, 220, 108851. [Google Scholar] [CrossRef] [Scilit]
- Chandramenon, P.; Aggoun, A.; Tchuenbou-Magaia, F. Smart approaches to Aquaponics 4.0 with focus on water quality: Comprehensive review. Comput. Electron. Agric. 2024, 225, 109256. [Google Scholar] [CrossRef] [Scilit]
- Aborujilah, A. Towards sustainable vertical farming: A systematic review of energy return on investment efficiency and optimization strategies. Sustainability 2025, 17, 8142. [Google Scholar] [CrossRef] [Scilit]
- Zhukovskii, K.; Scarabaggio, P.; Ovsiannikova, P.; Jhunjhunwala, P.; Carli, R.; Dotoli, M. Decentralized control of crop growth conditions in vertical farms under dynamic energy markets. IEEE Trans. Autom. Sci. Eng. 2025, 22, 21498–21511. [Google Scholar] [CrossRef] [Scilit]
- Correia, F.P.; Silva, S.R.; Carvalho, F.B.S.; Alencar, M.S.; Assis, K.D.R.; Bacurau, R.M. LoRaWAN gateway placement in smart agriculture: An analysis of clustering algorithms and performance metrics. Energies 2023, 16, 2003. [Google Scholar] [CrossRef] [Scilit]
- Perdana, D.; Alfatikhah, D.A.; Alinursafa, I.; Marwan, A.A. Performance analysis of LoRaWAN class A and class C in the measurement of nutrient content systems. Int. J. Intell. Eng. Syst. 2023, 16, 388–404. [Google Scholar] [CrossRef] [Scilit]
- Arshad, J.; Aziz, M.; Al-Huqail, A.A.; Zaman, M.H.U.; Husnain, M.; Rehman, A.U.; Shafiq, M. Implementation of a LoRaWAN-based smart agriculture decision support system for optimum crop yield. Sustainability 2022, 14, 1178. [Google Scholar] [CrossRef] [Scilit]
- Pagano, A.; Croce, D.; Tinnirello, I.; Vitale, G. A survey on LoRa for smart agriculture: Current trends and future perspectives. IEEE Internet Things J. 2023, 10, 3664–3679. [Google Scholar] [CrossRef] [Scilit]
- Okomoda, V.T.; Oladimeji, S.A.; Solomon, S.G.; Olufeagba, S.O.; Ogah, S.I.; Ikhwanuddin, M. Aquaponics production system: A review of historical perspective, opportunities, and challenges of its adoption. Food Sci. Nutr. 2023, 11, 1157–1165. [Google Scholar] [CrossRef] [Scilit] [PubMed]
- Muhammed, D.; Ahvar, E.; Ahvar, S.; Trocan, M.; Montpetit, M.J.; Ehsani, R. Artificial intelligence of things (AIoT) for smart agriculture: A review of architectures, technologies and solutions. J. Netw. Comput. Appl. 2024, 228, 103905. [Google Scholar] [CrossRef] [Scilit]
- Stevens, J.D.; Murray, D.; Diepeveen, D.; Toohey, D. Development and testing of an IoT spectroscopic nutrient monitoring system for use in micro indoor smart hydroponics. Horticulturae 2023, 9, 200. [Google Scholar] [CrossRef] [Scilit]
- Wang, X.; Fang, W.; Zhao, Z. Establishment of a model and system for secondary fertilization of nutrient solution and residual liquid. Sustainability 2023, 15, 1156. [Google Scholar] [CrossRef] [Scilit]
- Bunge, A.C.; Wood, A.; Halloran, A.; Gordon, L.J. A systematic scoping review of the sustainability of vertical farming, plant-based alternatives, food delivery services and blockchain in food systems. Nat. Food 2022, 3, 933–941. [Google Scholar] [CrossRef] [Scilit] [PubMed]
- Dhal, S.B.; Jungbluth, K.; Lin, R.; Sabahi, S.P.; Bagavathiannan, M.; Braga-Neto, U.; Kalafatis, S. A machine-learning-based IoT system for optimizing nutrient supply in commercial aquaponic operations. Sensors 2022, 22, 3300. [Google Scholar] [CrossRef] [Scilit] [PubMed]
- Pons, M.; Valenzuela, E.; Rodríguez, B.; Nolazco-Flores, J.A.; Del-Valle-Soto, C. Utilization of 5G technologies in IoT applications: Current limitations by interference and network optimization difficulties—A review. Sensors 2023, 23, 3801. [Google Scholar] [CrossRef] [Scilit] [PubMed]
- Chowdhury, M.E.H.; Khandakar, A.; Ahmed, S.; Al-Khuzaei, F.; Hamdalla, J.; Haque, F.; Reaz, M.B.I.; Al Shafei, A.; Al-Emadi, N. Design, construction and testing of IoT-based automated indoor vertical hydroponics farming test-bed in Qatar. Sensors 2020, 20, 5500. [Google Scholar] [CrossRef] [Scilit] [PubMed]
- Sangaiah, A.K.; Hosseinabadi, A.A.R.; Shareh, M.B.; Rad, S.Y.B.; Zolfagharian, A.; Chilamkurti, N. IoT resource allocation and optimization based on heuristic algorithm. Sensors 2020, 20, 530. [Google Scholar] [CrossRef] [Scilit] [PubMed]
- Perdana, D.; Ariateja, C.; Alinursafa, I.; Cahyono, O. Analysis of public and private networks for nutrient measurement system using LoRaWAN network. Int. J. Comput. Commun. Control 2022, 17, 300–312. [Google Scholar] [CrossRef] [Scilit]
- Chandra, R.A.; Fadlillah, U.; Wibowo, P.; Saputra, F.T.N.; Sulasyono, R.R. Blind People Stick Tracking using Android Smartphone and GPS Technology. Khazanah Inform. 2022, 8, 18–24. [Google Scholar] [CrossRef] [Scilit]
- Prakash, C.; Singh, L.P.; Gupta, A.; Lohan, S.K. Advancements in smart farming: A comprehensive review of IoT, wireless communication, sensors, and hardware for agricultural automation. Sens. Actuators A Phys. 2023, 362, 114605. [Google Scholar] [CrossRef] [Scilit]
- Swain, M.; Zimon, D.; Singh, R.; Hashmi, M.F.; Rashid, M.; Hakak, S. LoRa-LBO: An experimental analysis of LoRa link budget optimization in custom-built IoT test bed for agriculture 4.0. Agronomy 2021, 11, 985. [Google Scholar] [CrossRef] [Scilit]
- Dhal, S.B.; Bagavathiannan, M.; Braga-Neto, U.; Kalafatis, S. Can machine learning classifiers be used to regulate nutrients using small training datasets for aquaponic irrigation?: A comparative analysis. PLoS ONE 2022, 17, e0271234. [Google Scholar] [CrossRef] [Scilit] [PubMed]
- Yulianto, K.A.; Kusban, M. Alat Penghitung Biaya Pemakaian Air Berbasis IoT. Emit. J. Tek. Elektro 2023, 22, 133–138. [Google Scholar] [CrossRef] [Scilit]
- Avgoustaki, D.D.; Vevelakis, V.; Akrivopoulou, K.; Kalogeropoulos, S.; Bartzanas, T. Examination of interrupted lighting schedule in indoor vertical farms. AgriEngineering 2025, 7, 242. [Google Scholar] [CrossRef] [Scilit]
- Perdana, D.; Kusuma, W.R.P.; Alinursafa, I. Developing of an automatic fertilizer control system in soybean plant based on Internet of Things and LoRa networks. Int. J. Electron. Telecommun. 2021, 67, 549–558. [Google Scholar] [CrossRef] [Scilit]
- Shadd, A.; Asgari, N.; Pearce, J.M. Effects of spectral ranges on growth and yield in vertical hydroponic–aeroponic hybrid grow systems for radishes and turnips. Foods 2025, 14, 1872. [Google Scholar] [CrossRef] [Scilit] [PubMed]
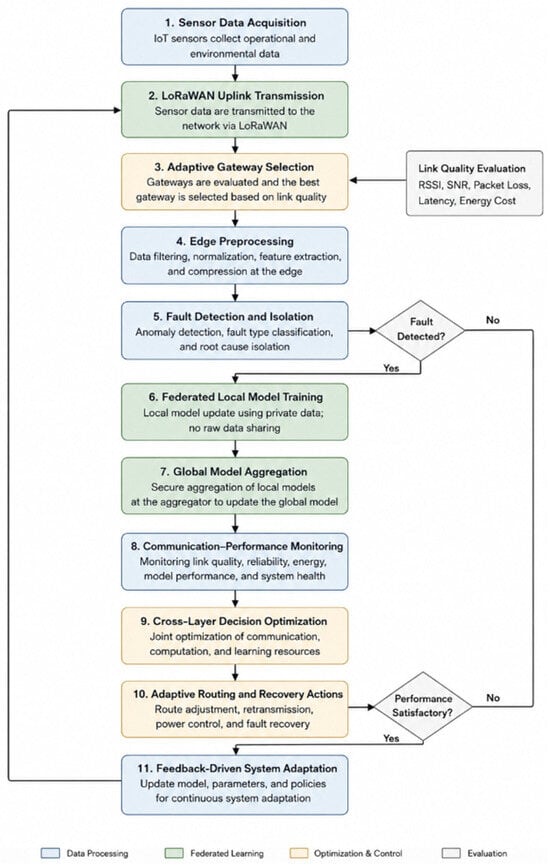
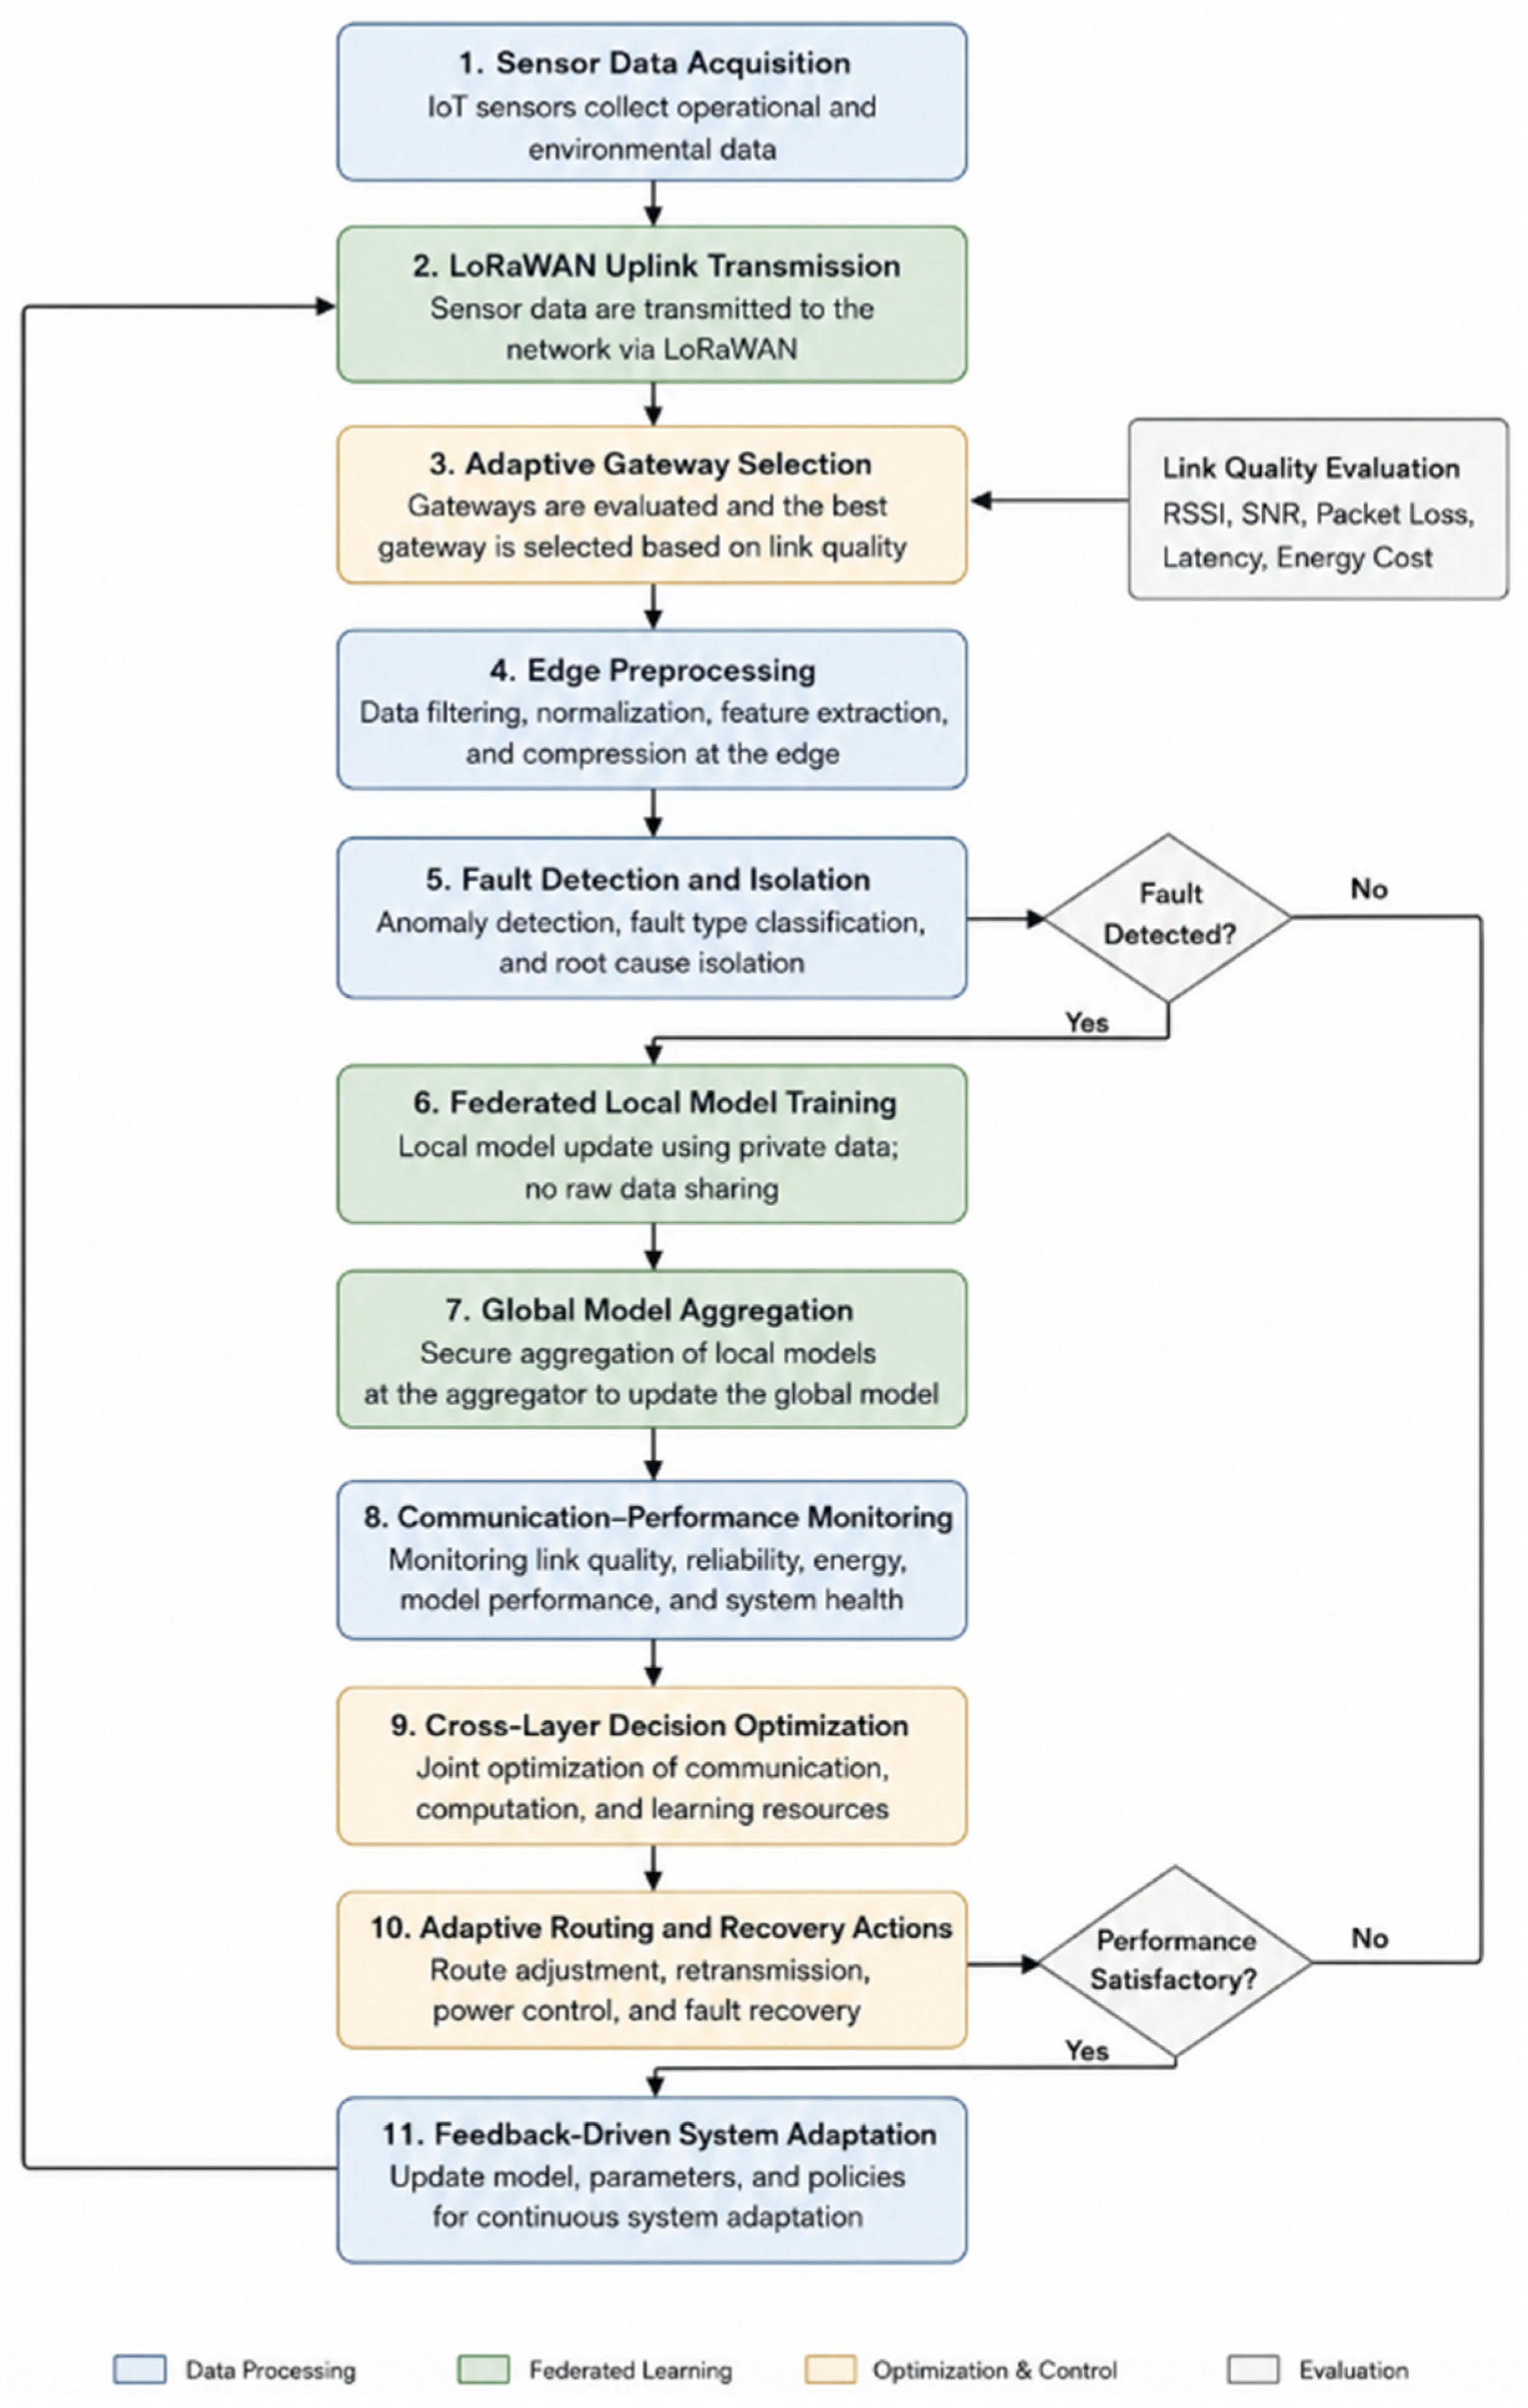
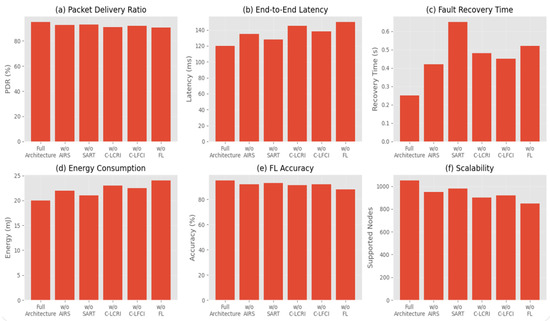
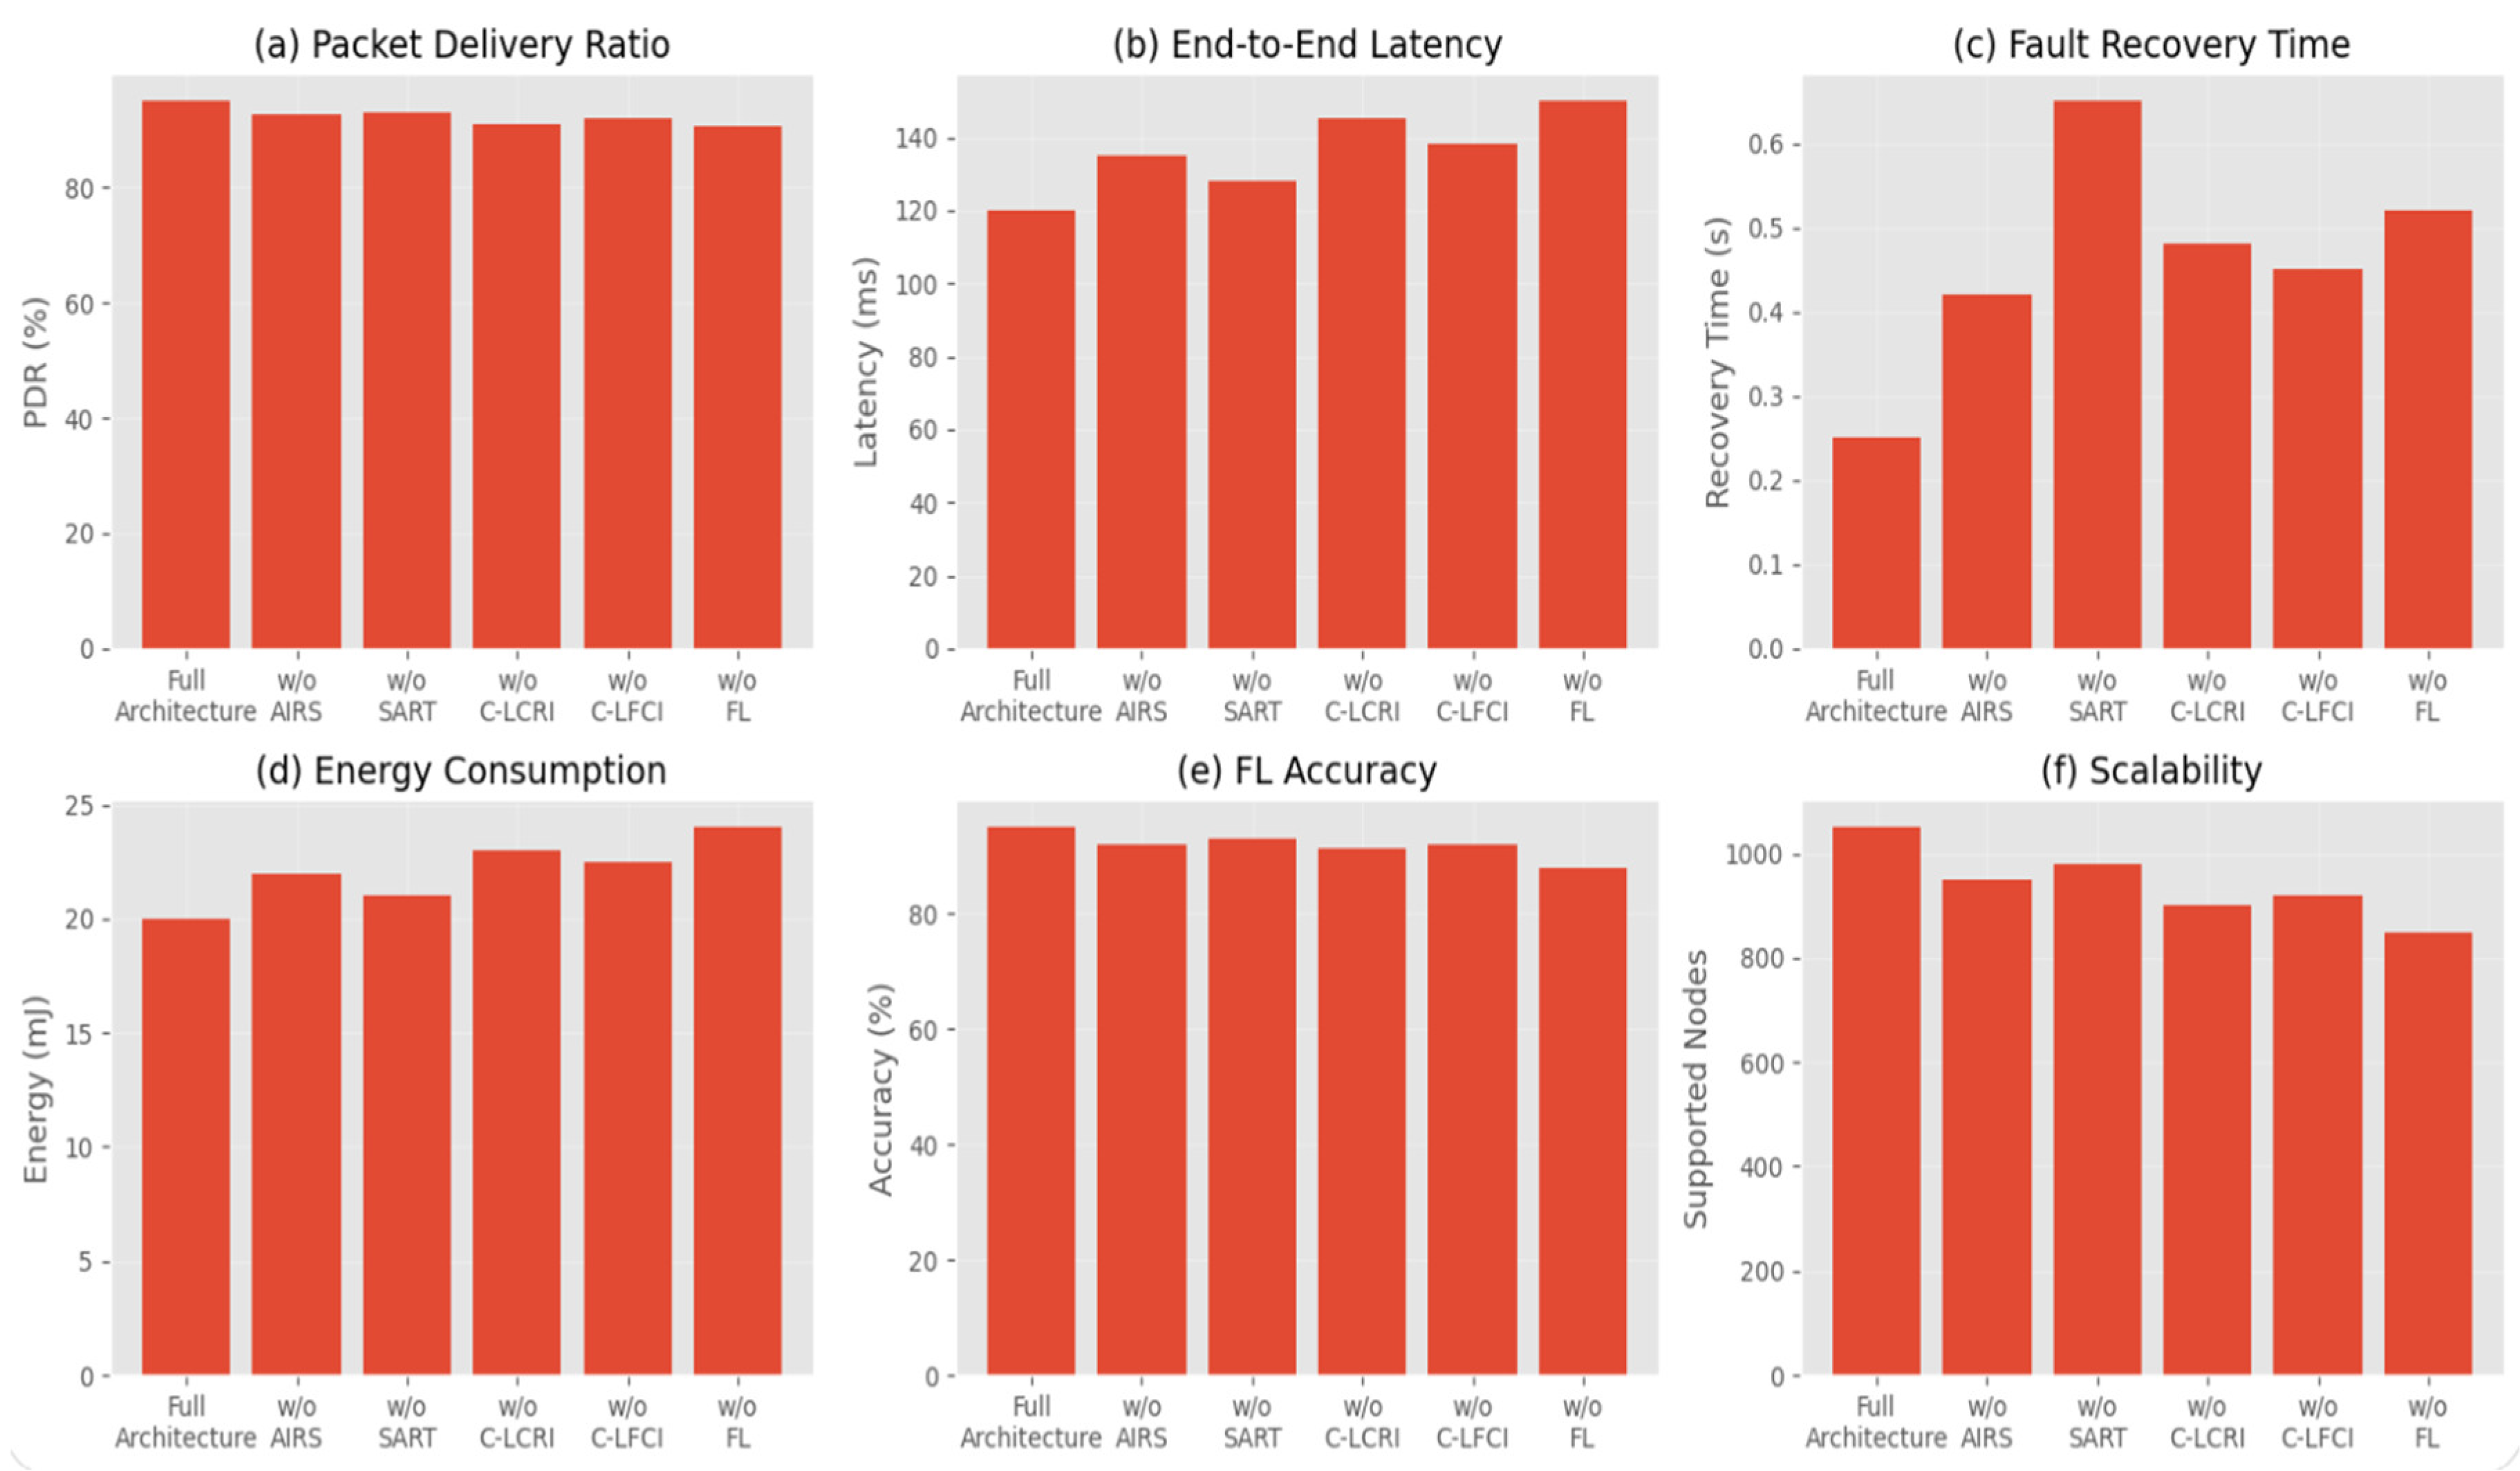
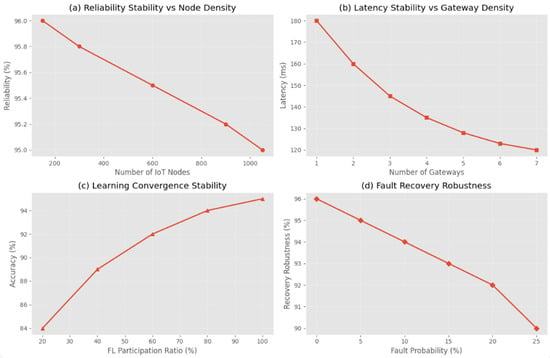
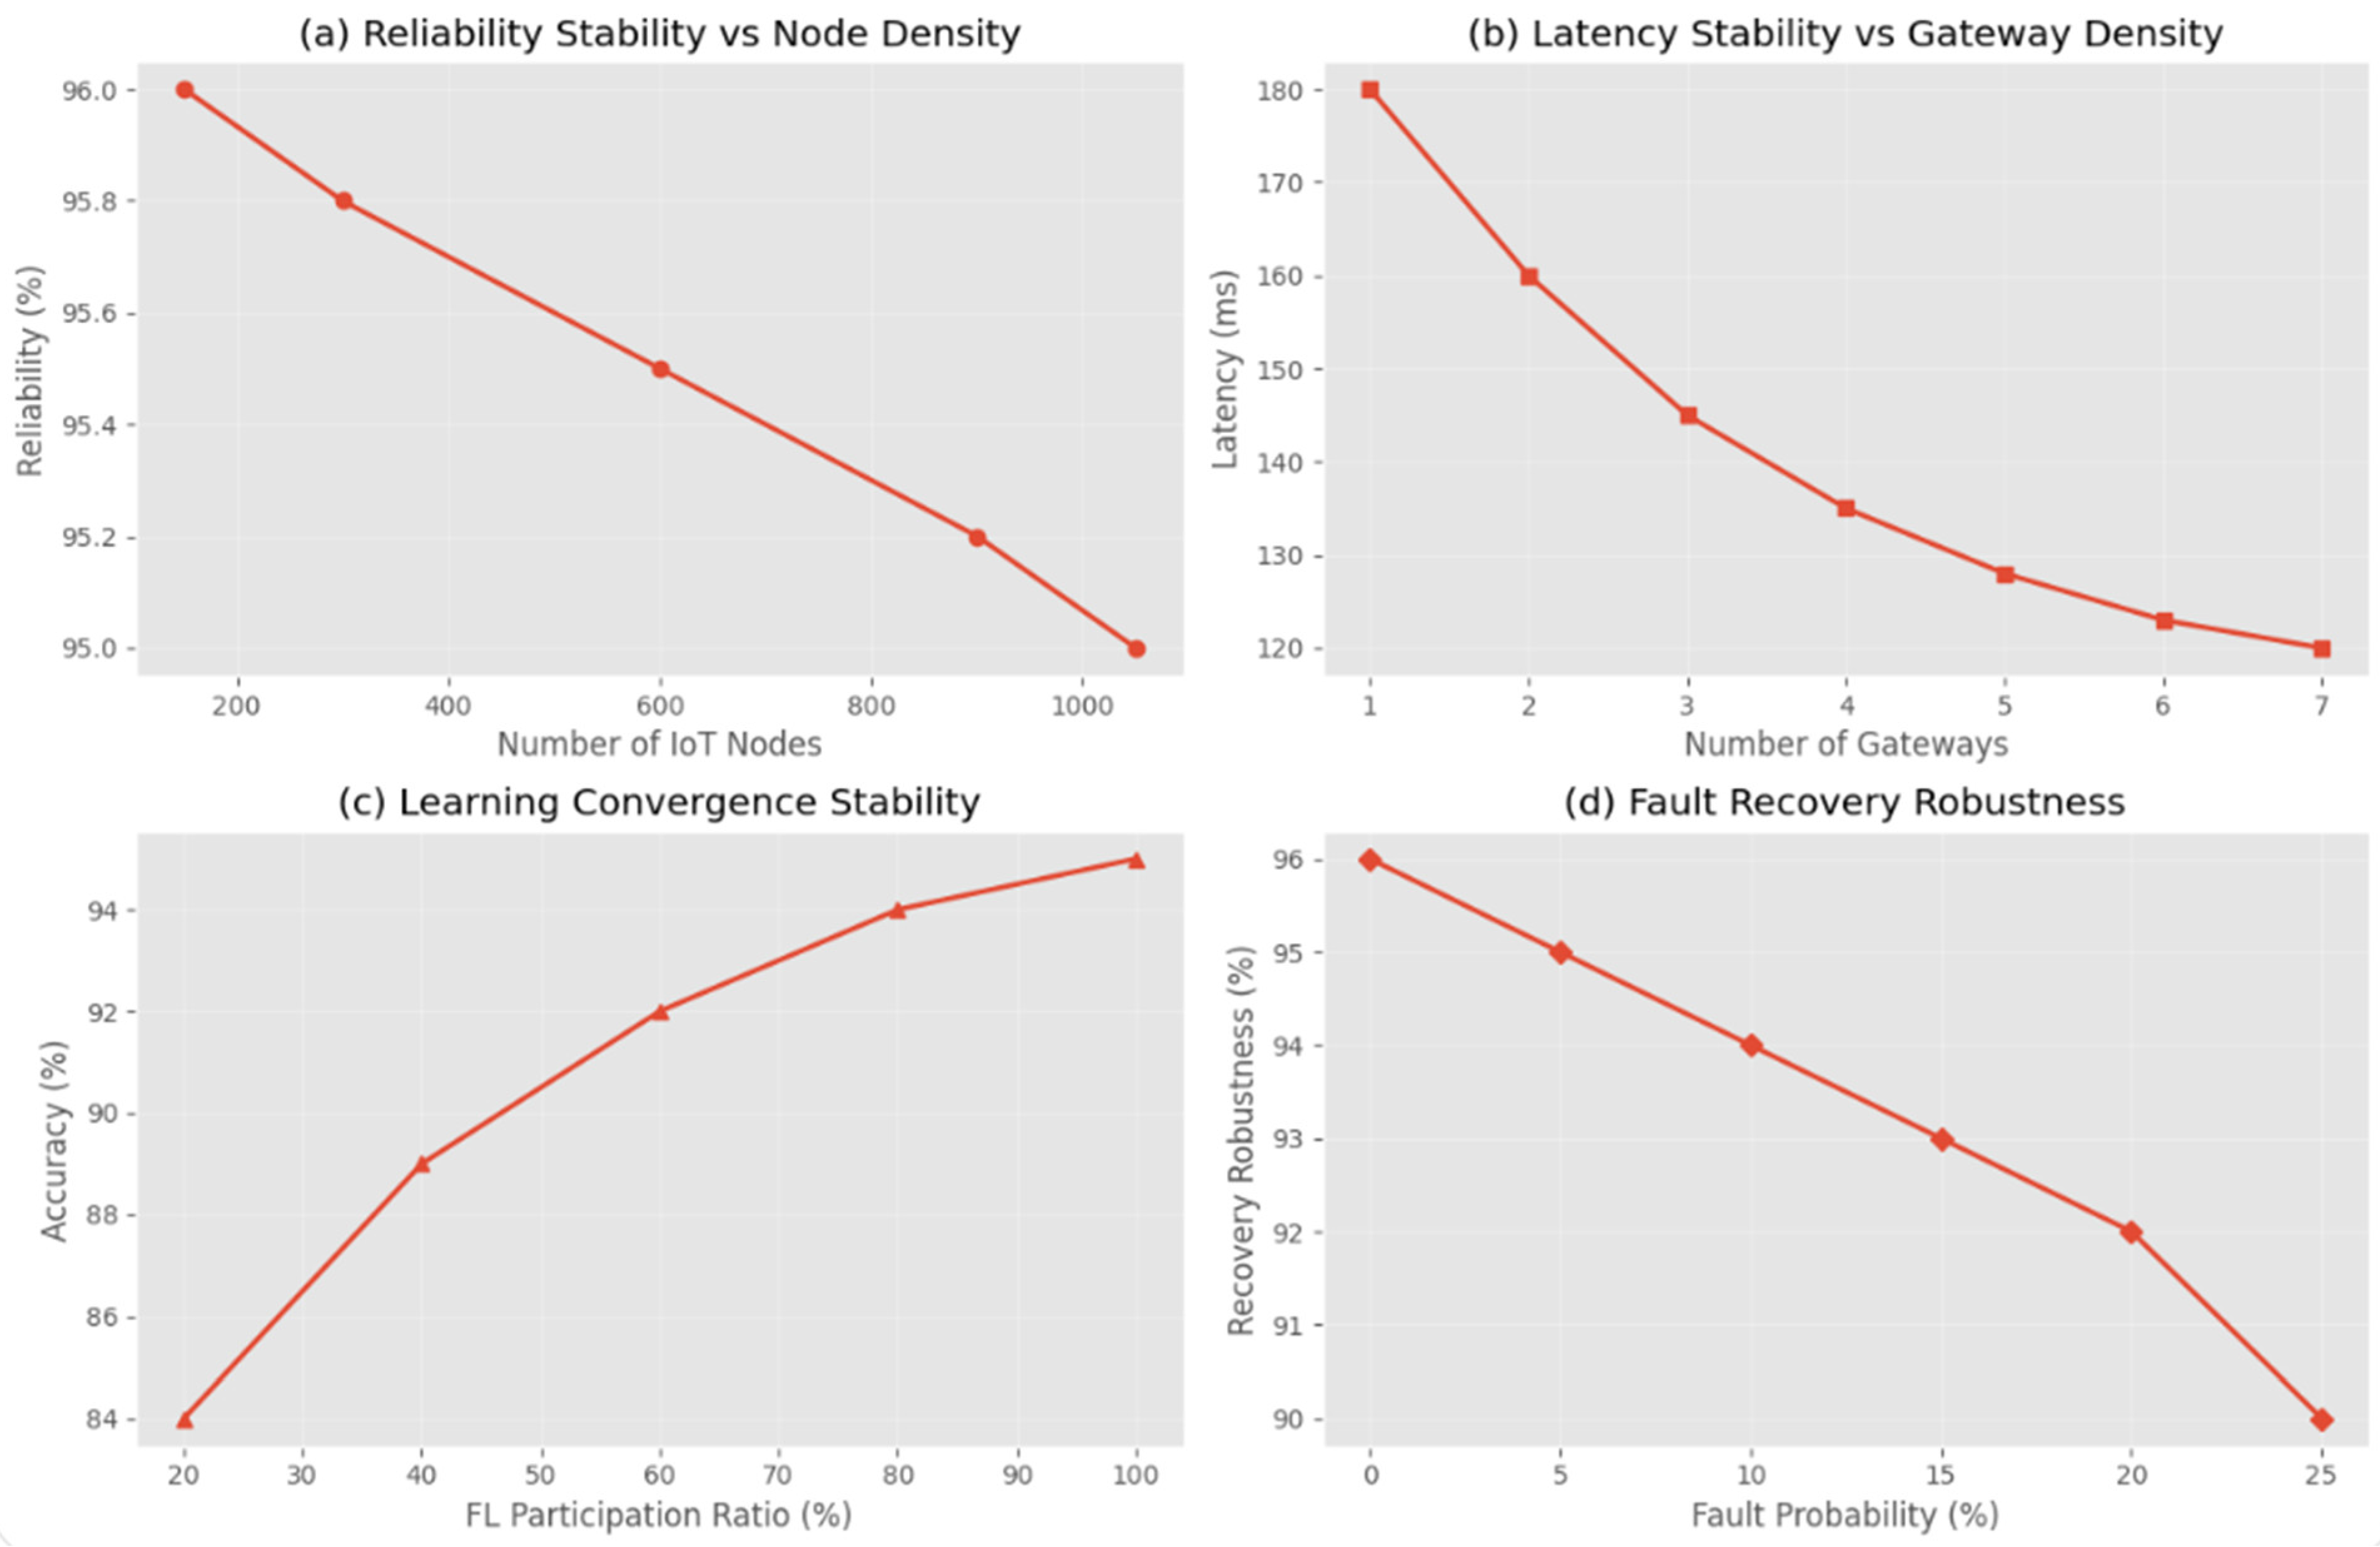
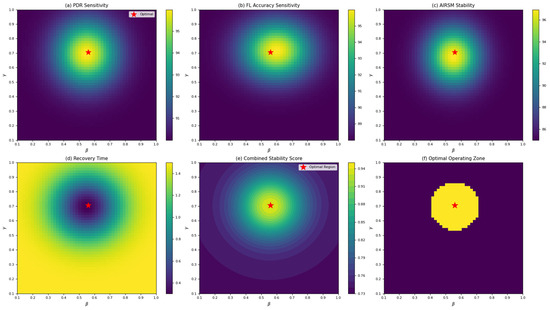
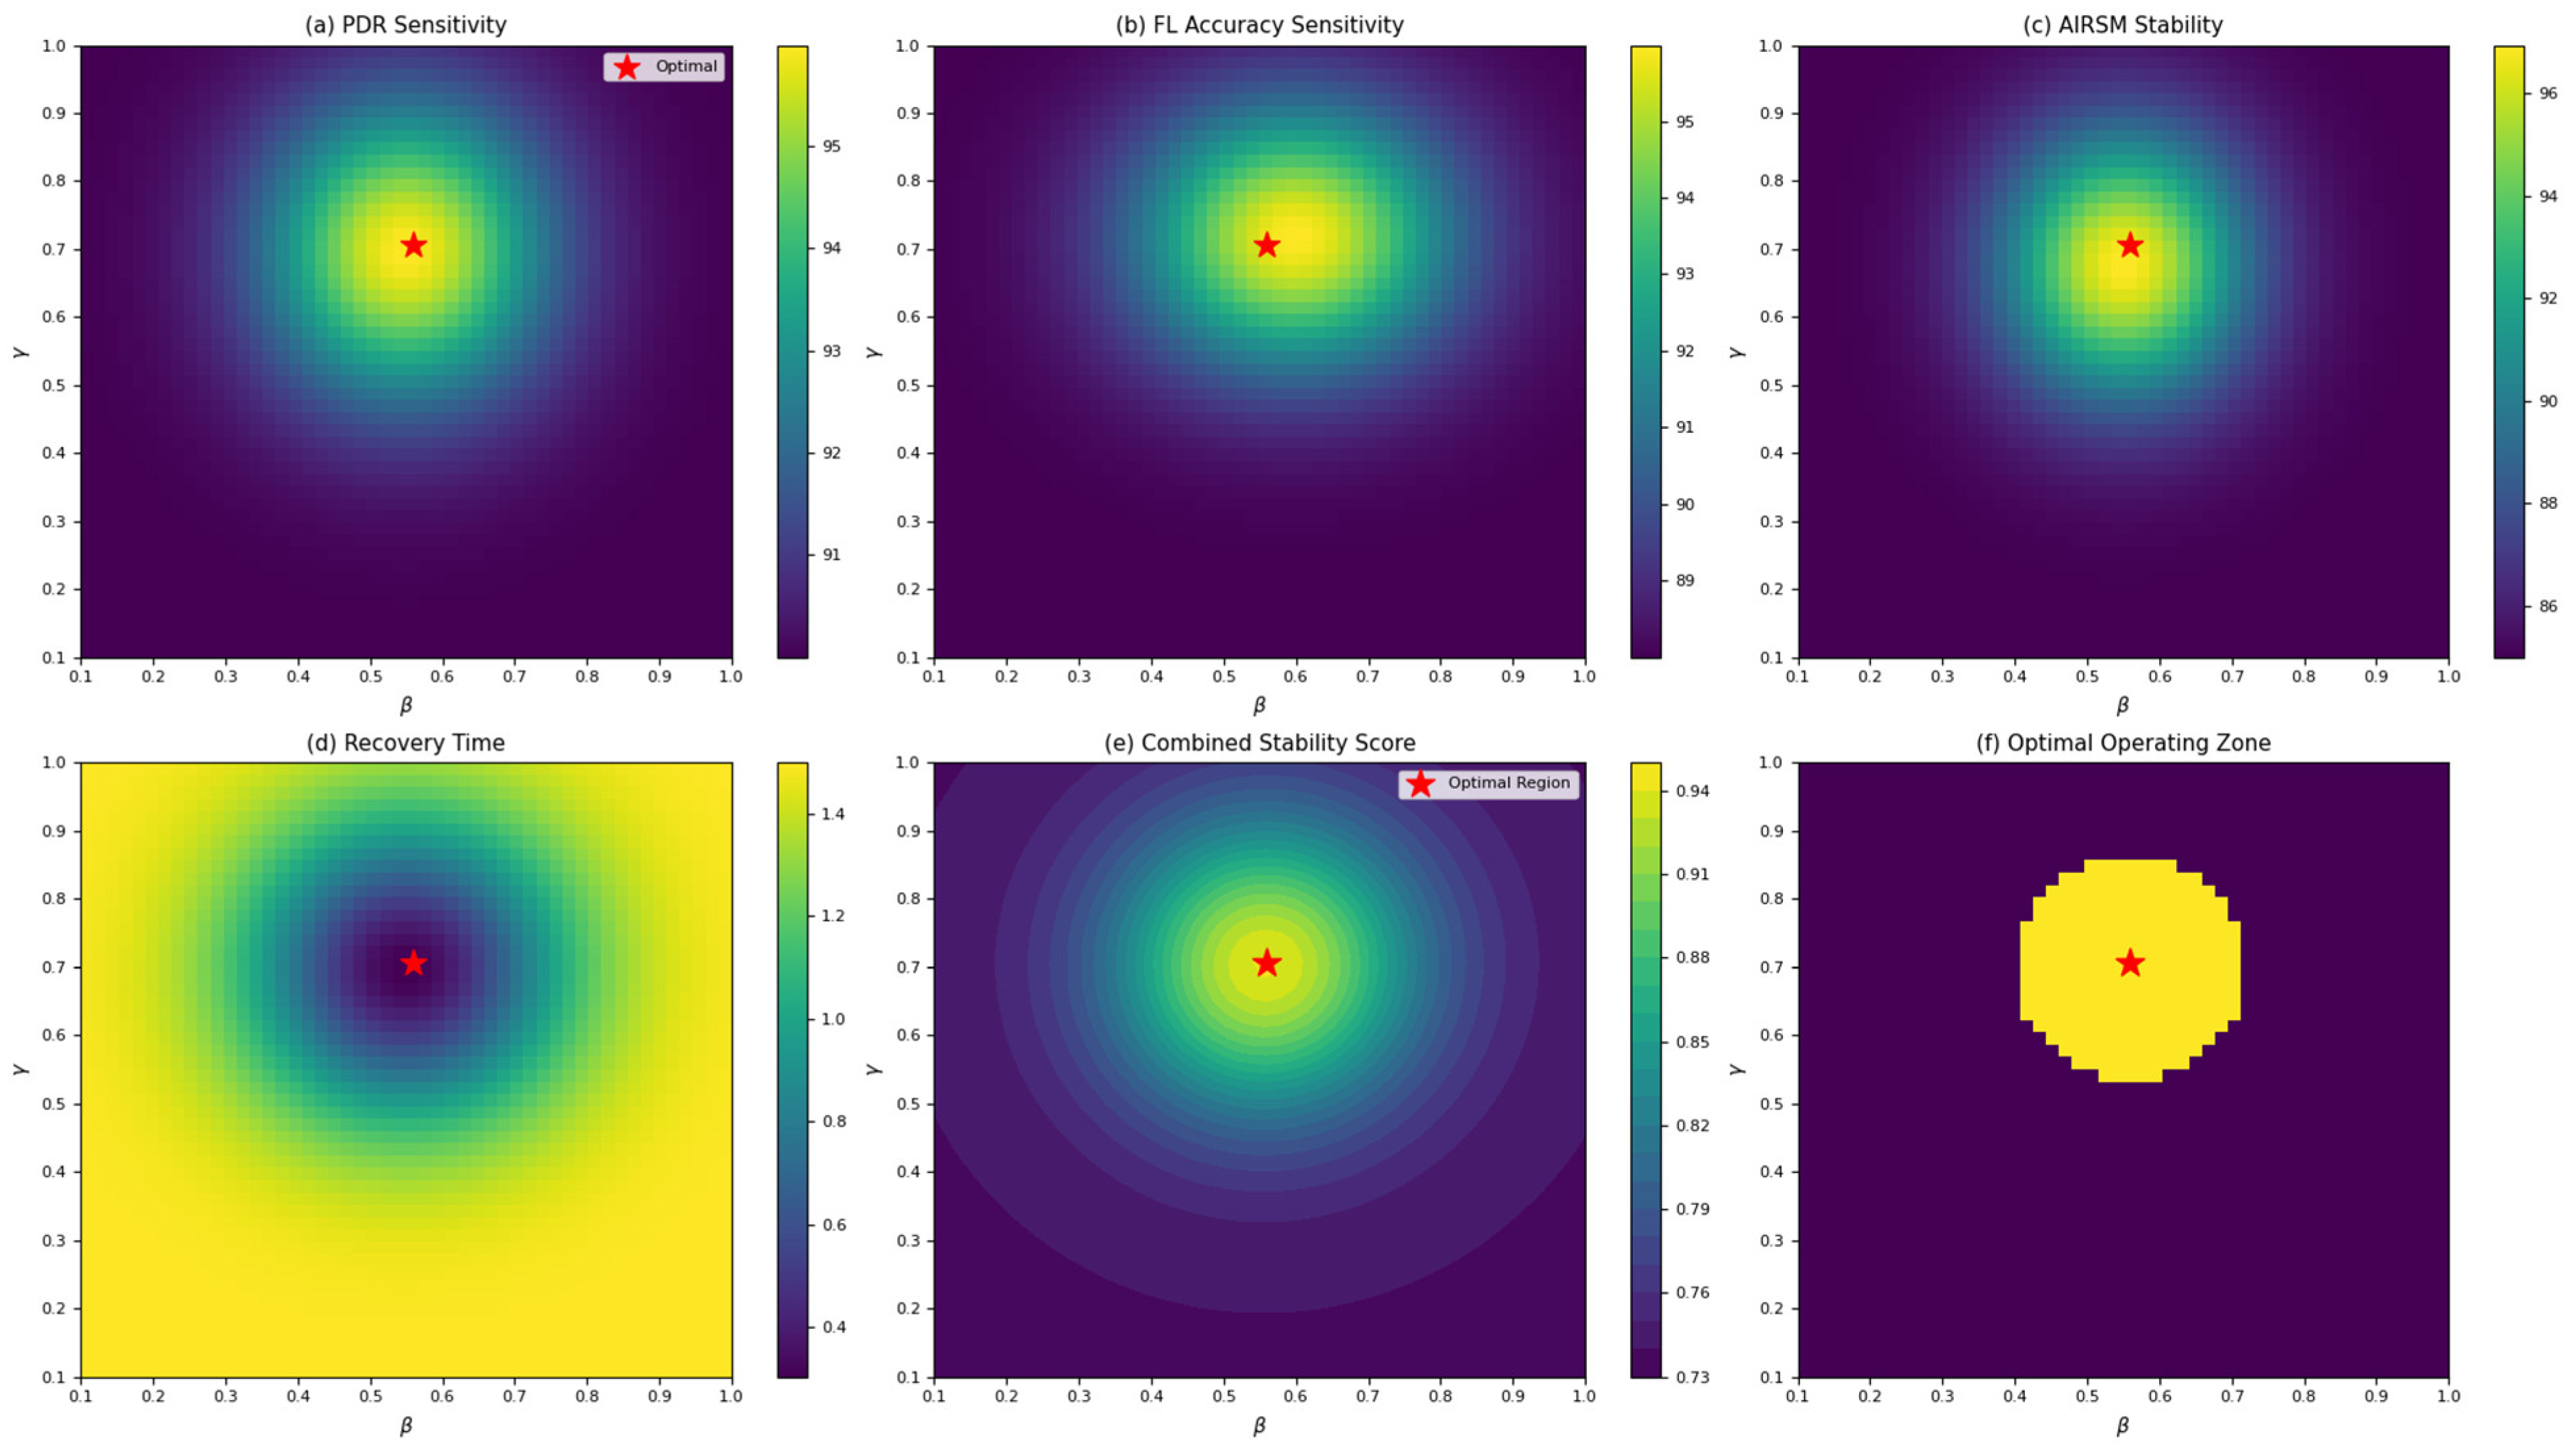
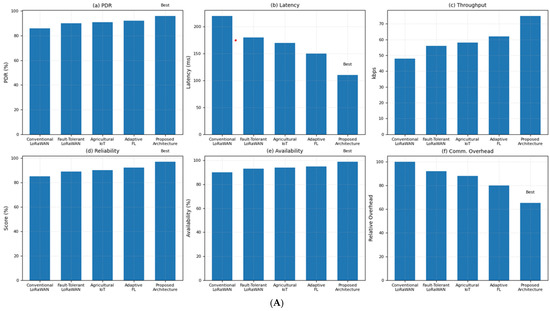
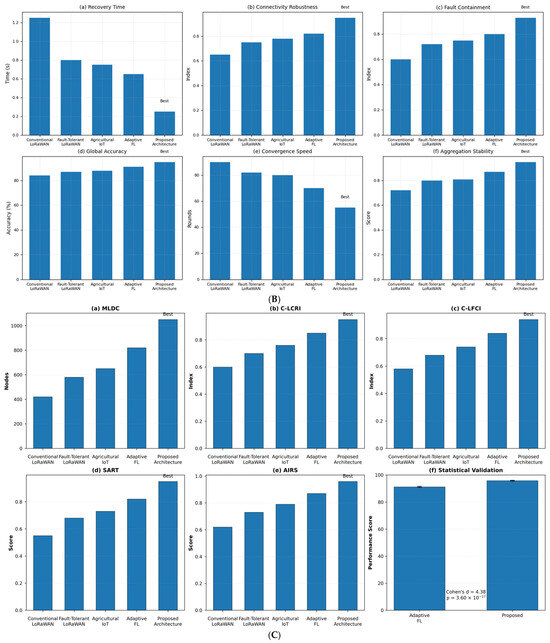
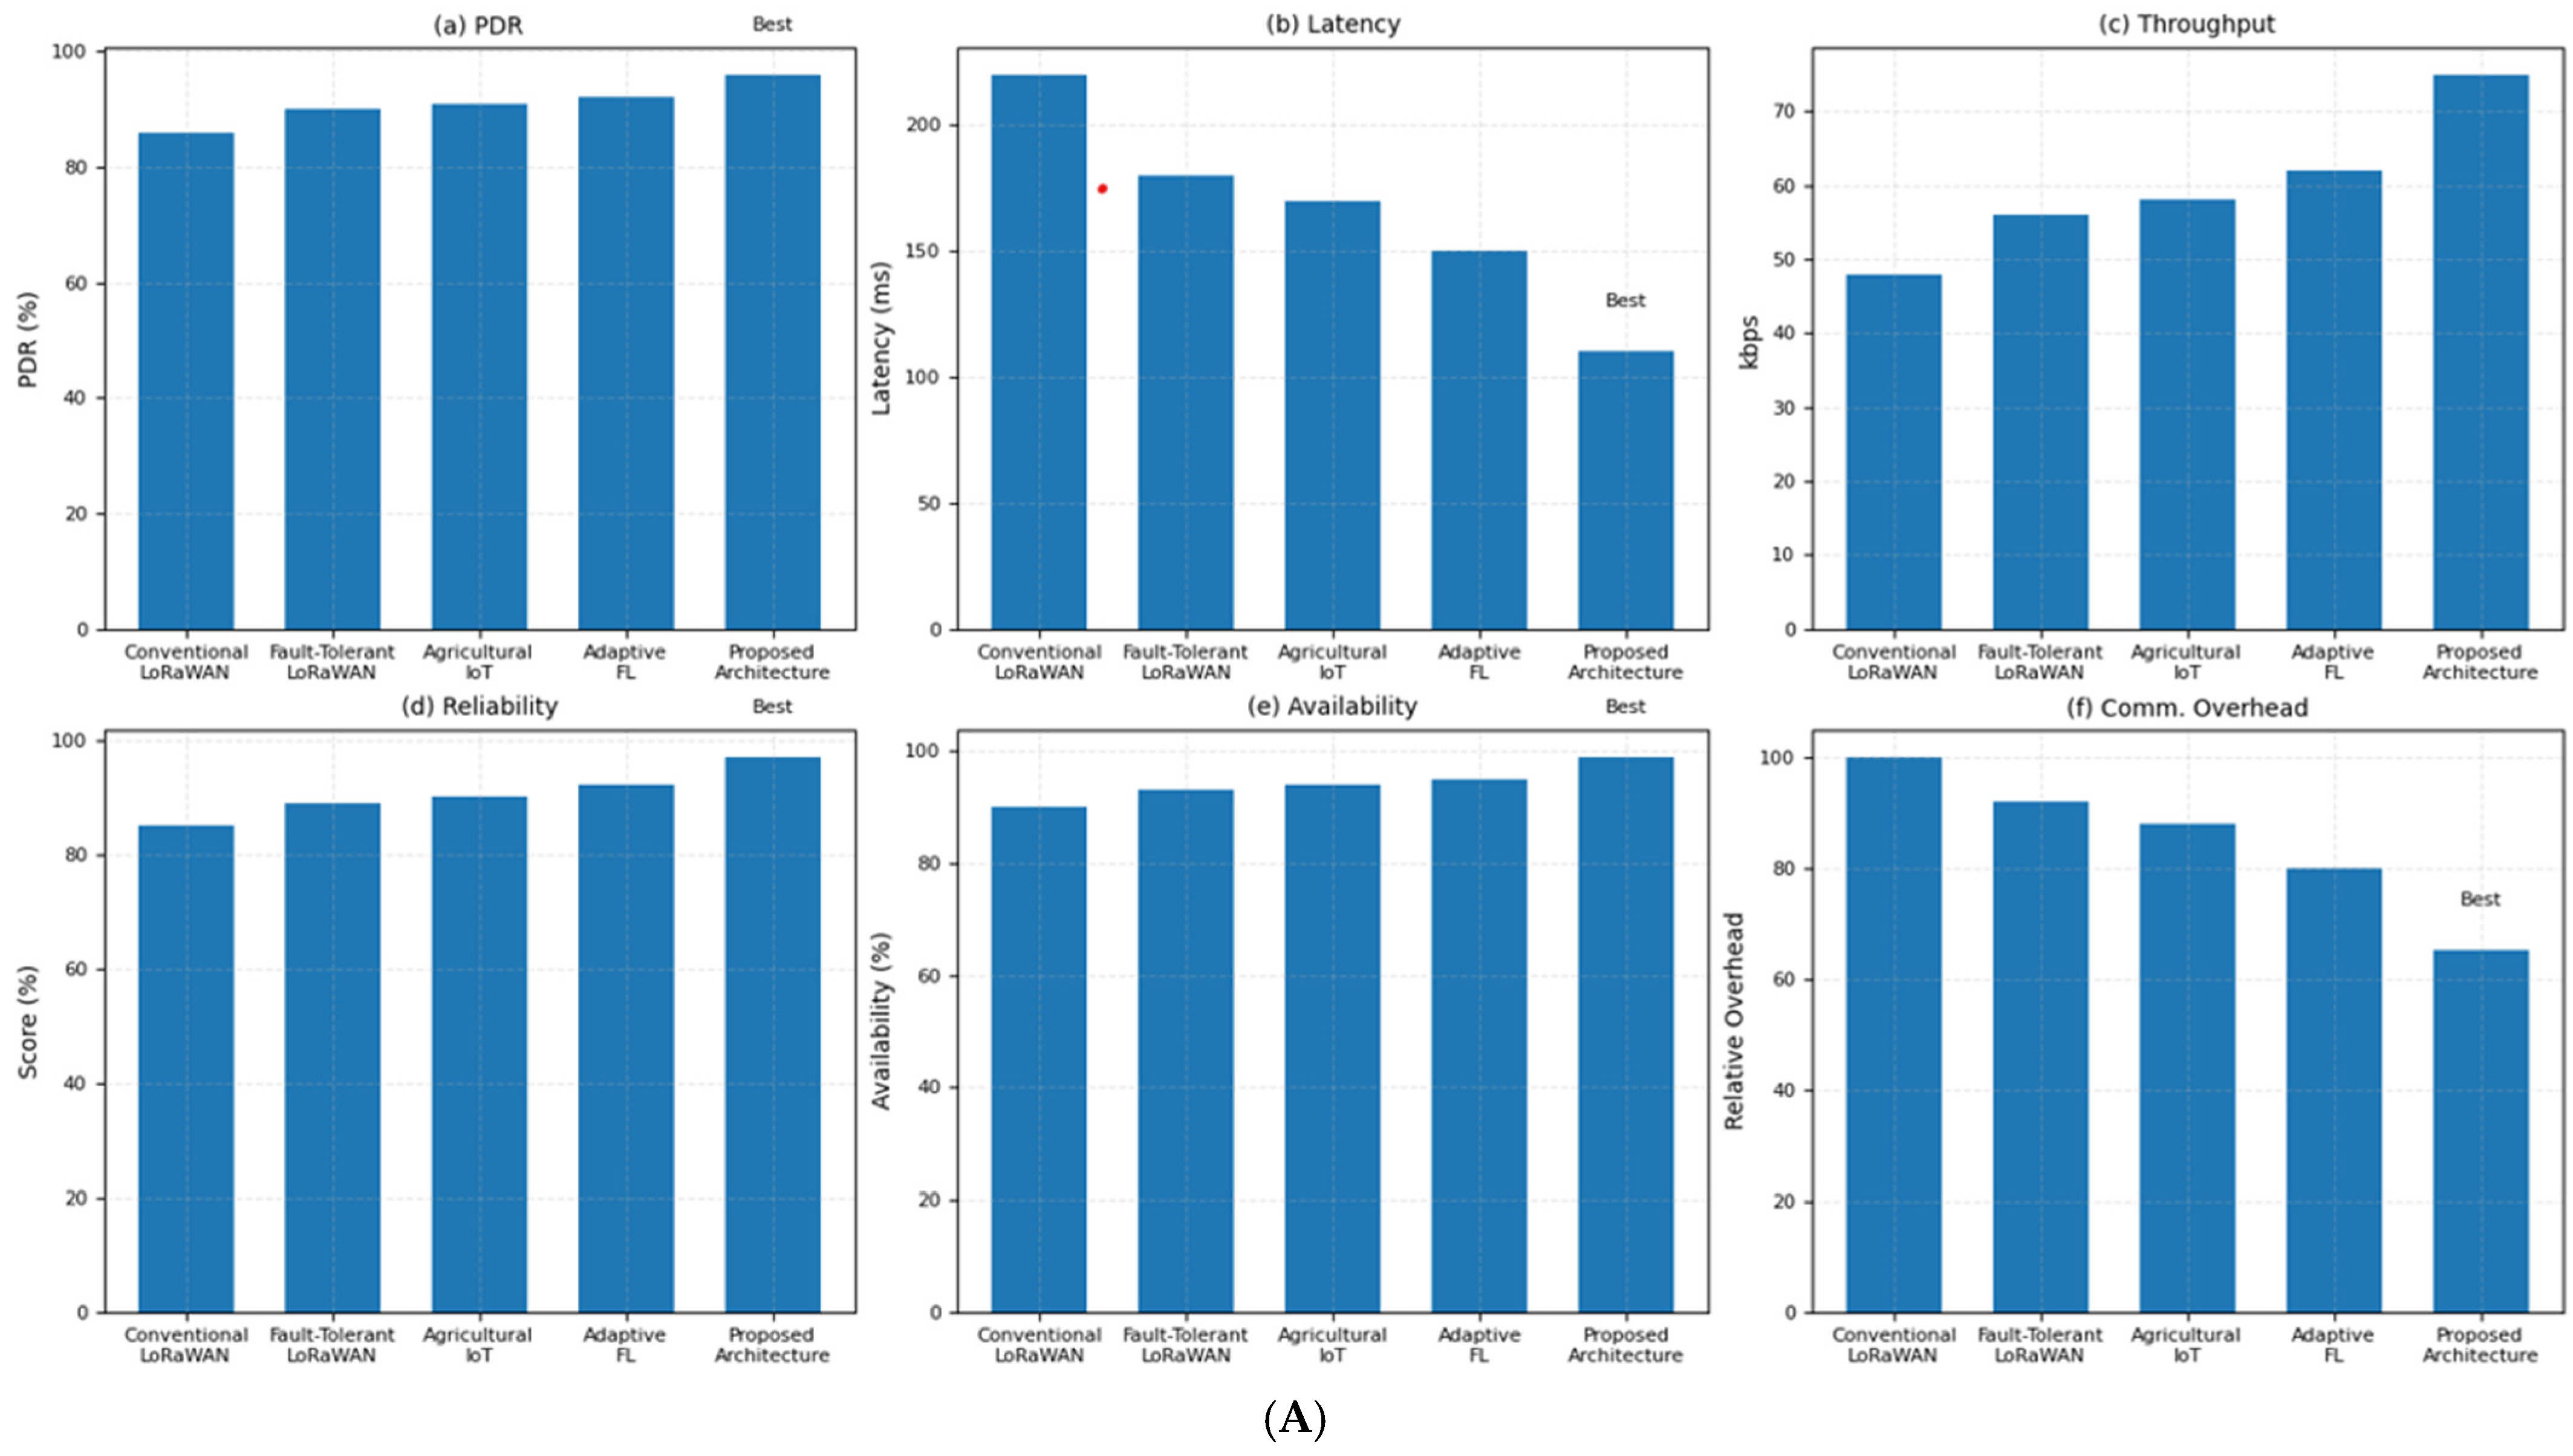
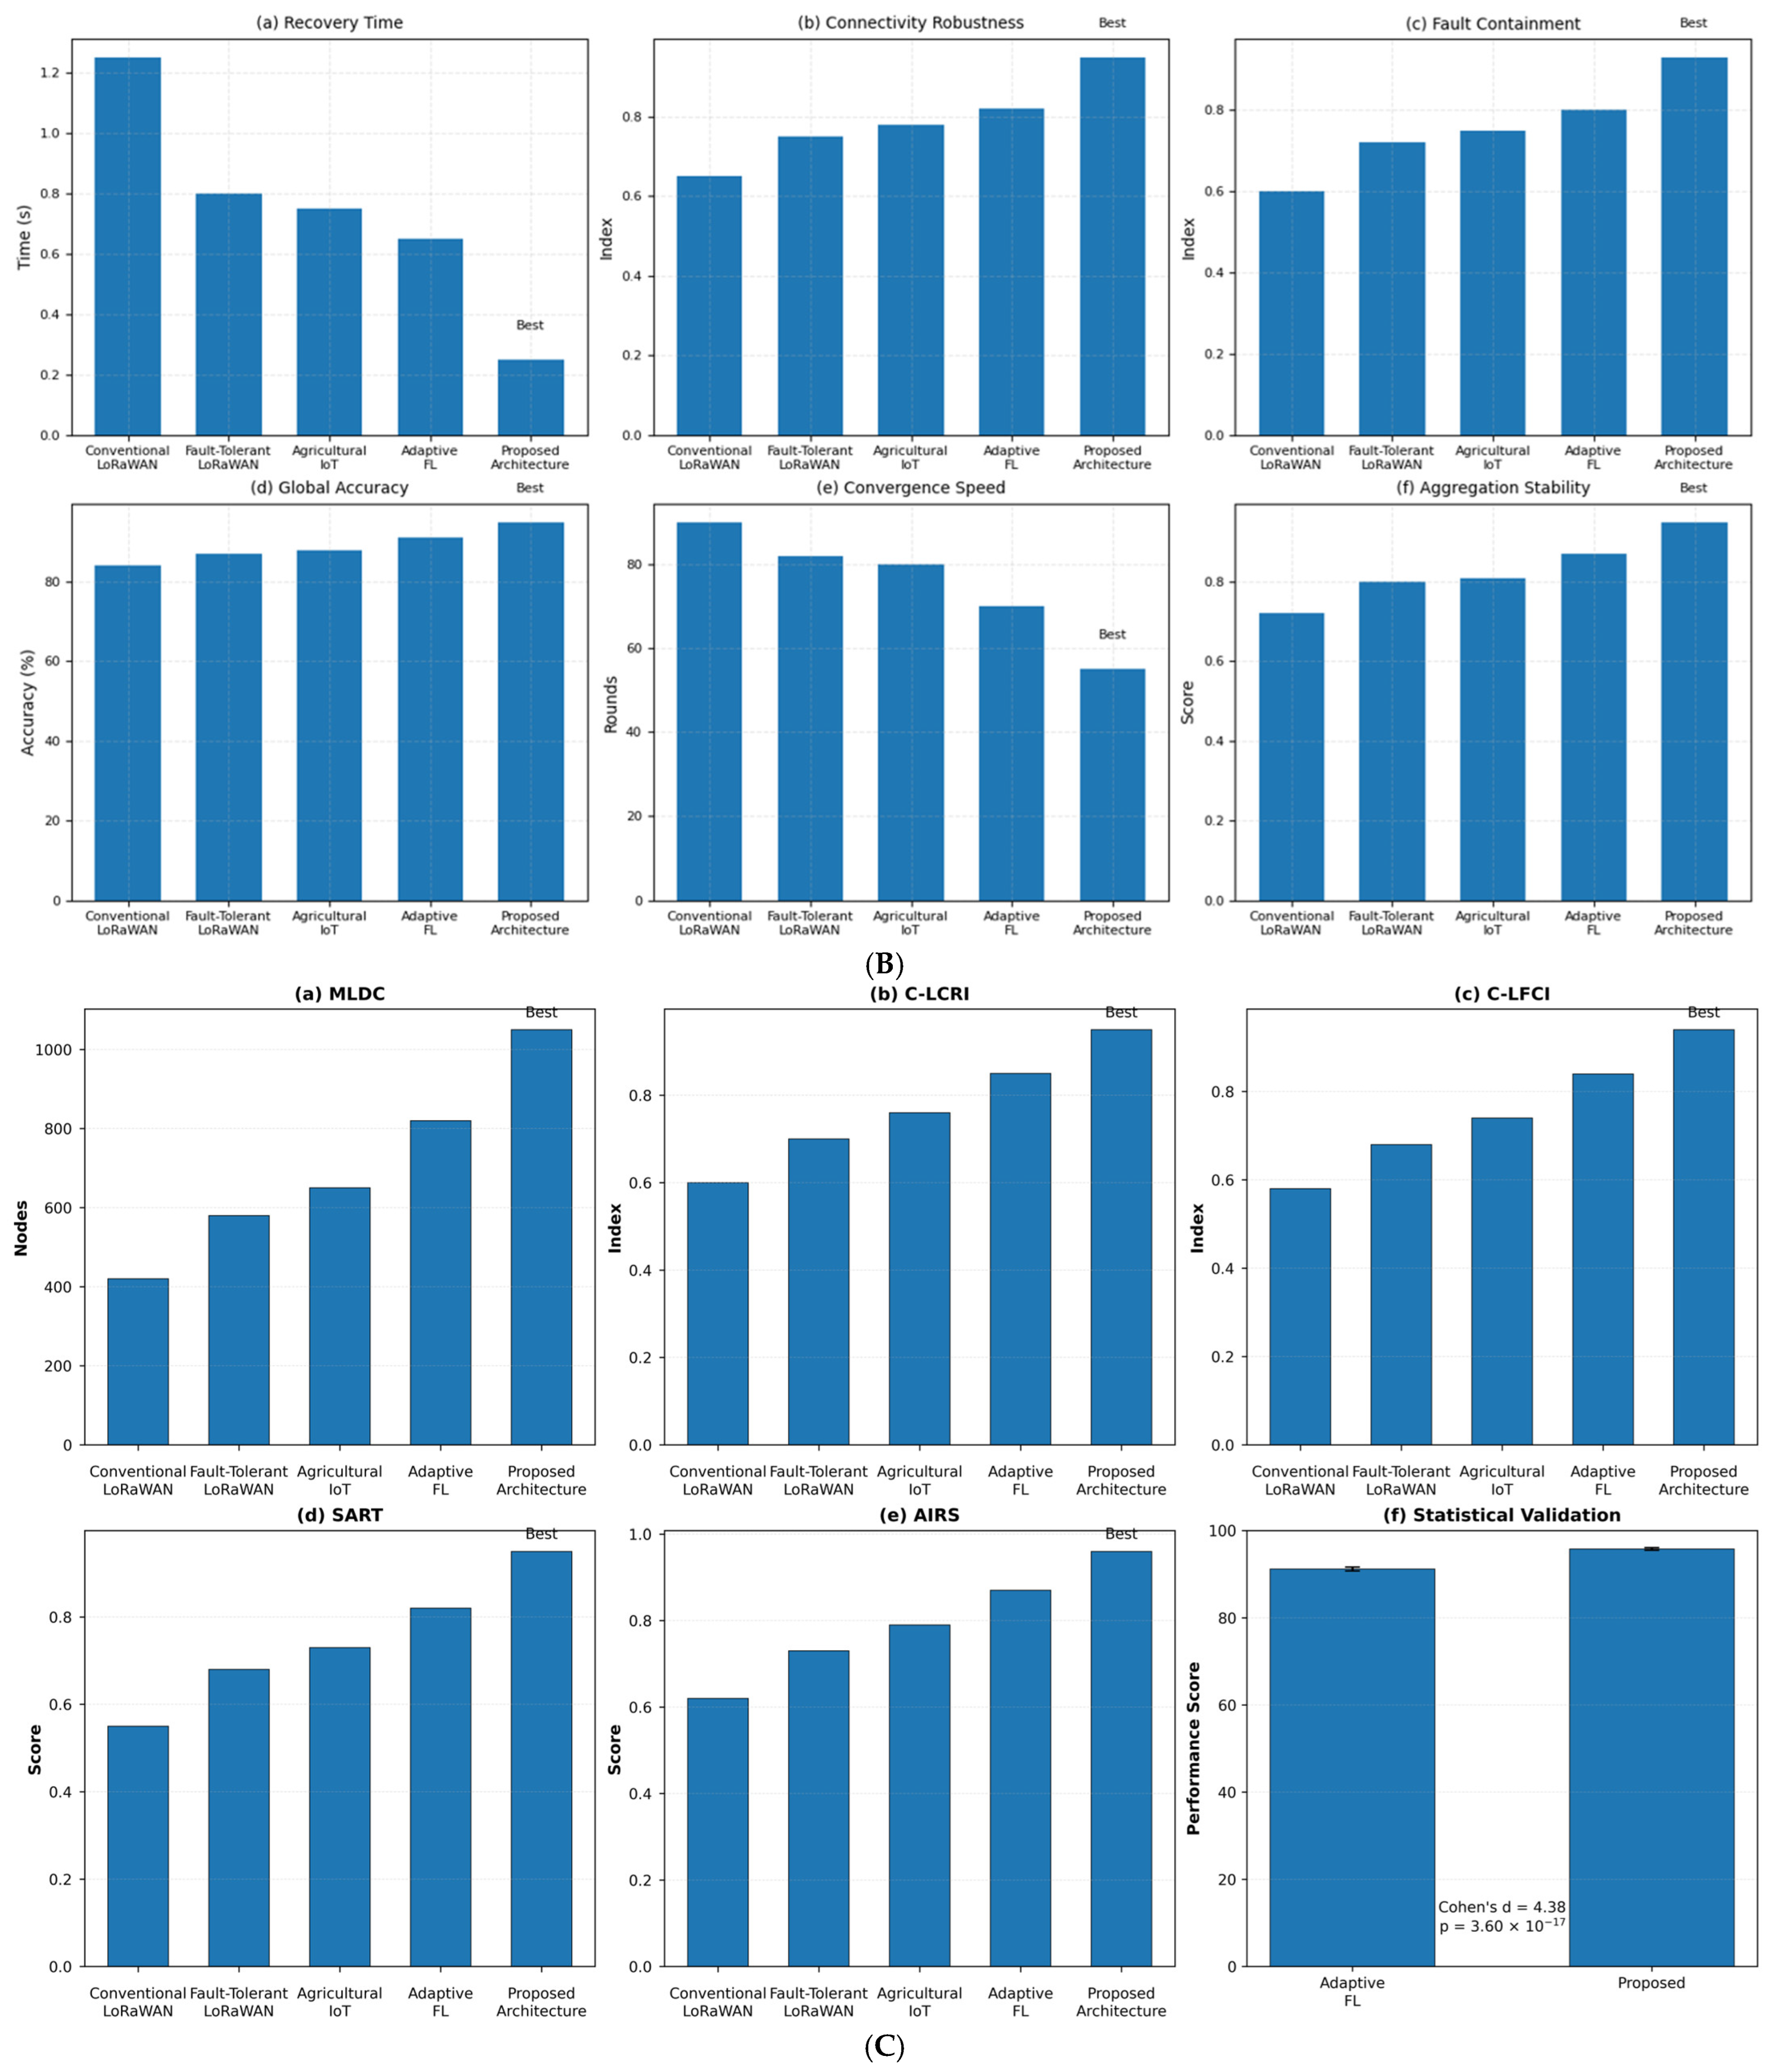
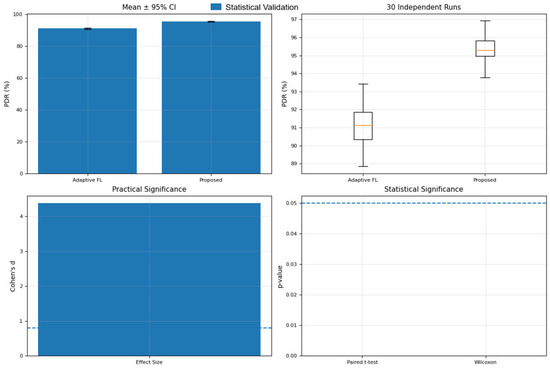
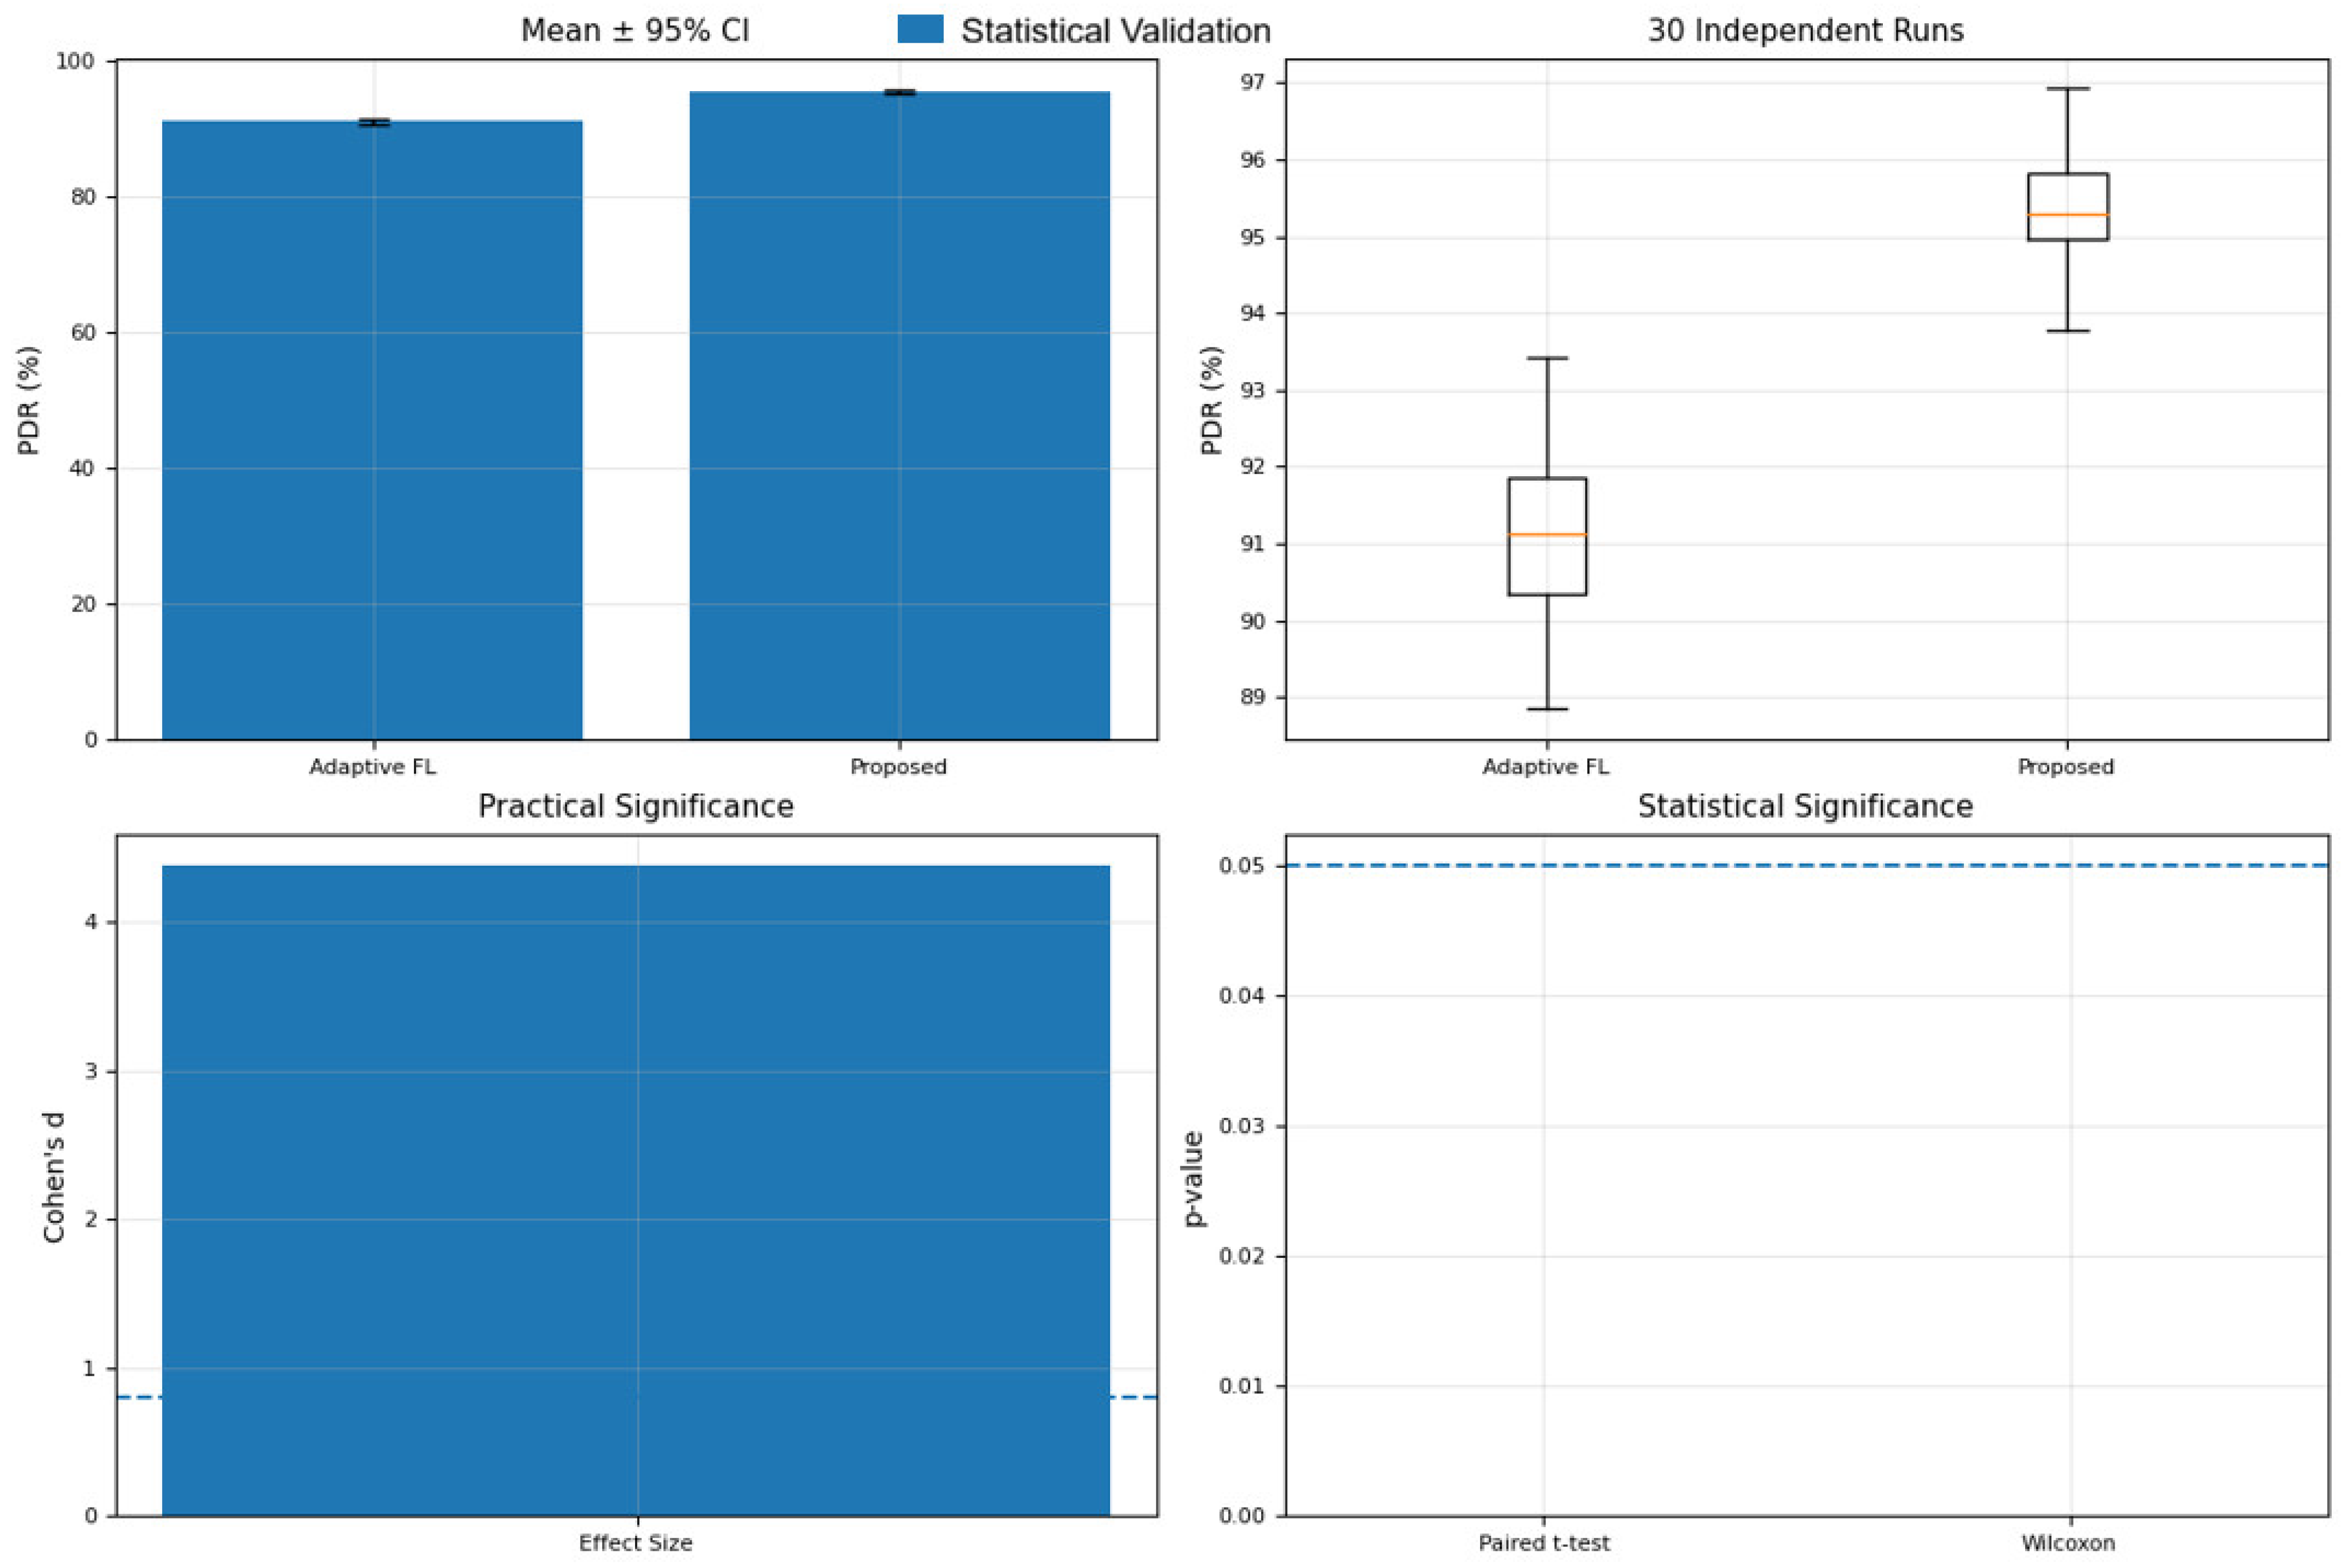
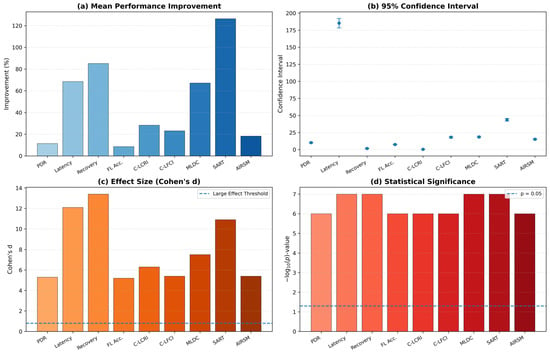
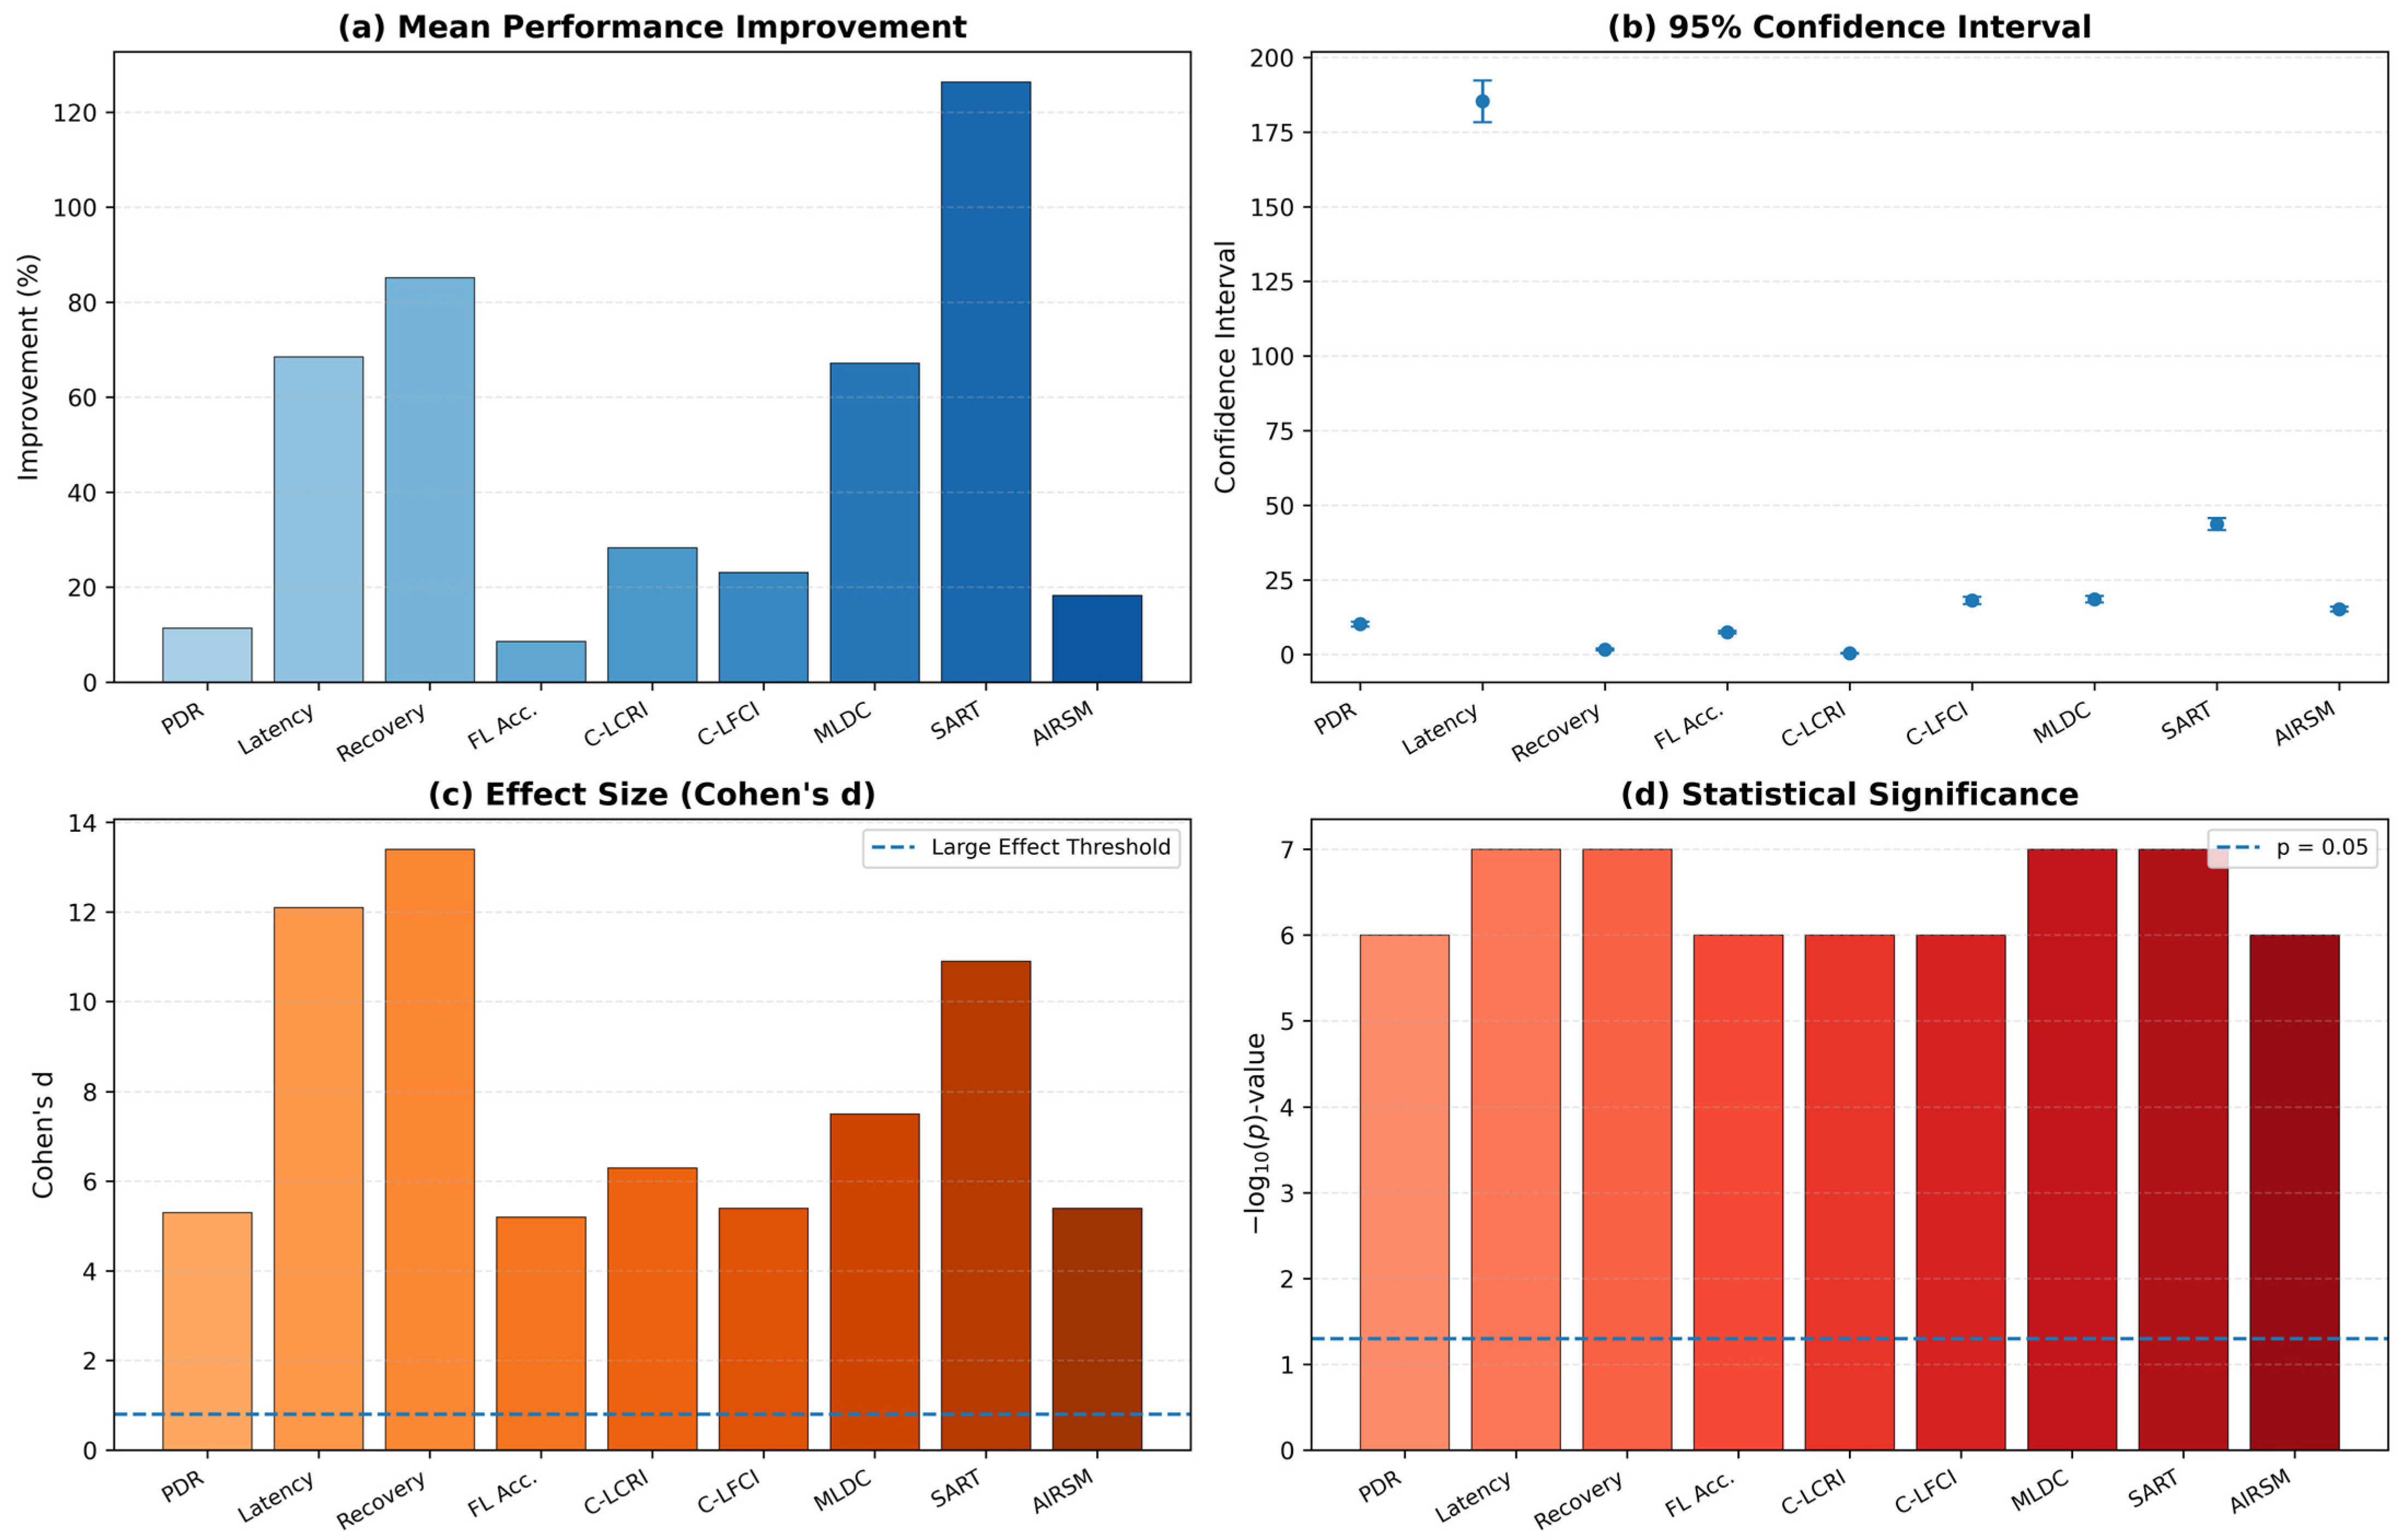

Disclaimer/Publisher’s Note: The statements, opinions and data contained in all publications are solely those of the individual author(s) and contributor(s) and not of MDPI and/or the editor(s). MDPI and/or the editor(s) disclaim responsibility for any injury to people or property resulting from any ideas, methods, instructions or products referred to in the content. |
© 2026 by the authors. Licensee MDPI, Basel, Switzerland. This article is an open access article distributed under the terms and conditions of the Creative Commons Attribution (CC BY) license.