


Abstract
Low-Power Wide-Area Networks based on LoRa are widely deployed in smart city, agricultural, and environmental monitoring, where their constrained energy budget makes them vulnerable to radio-frequency jamming. (1) Background: a node that keeps transmitting into a jammed channel wastes energy on undeliverable packets, yet detection and energy management are usually treated separately. (2) Methods: we present J-DEAS, a Jamming-Driven Exponential Adaptive Sleeping technique that couples a lightweight, threshold-based detector with an exponential sleep back-off scheduler. The detector uses only the RSSI and SNR reported by commodity transceivers, and a single exponentially weighted confidence variable drives the sleep interval; we analyze the decision boundary, confidence dynamics, steady-state duty cycle, and latency–energy trade-off in closed form. (3) Results: on a measurement dataset the detector reaches an AUC of 0.985 and an F1 of 0.969; under sustained jamming, J-DEAS cuts the duty cycle from 100% to 5.5% and wasted transmissions from 94.3% to 8.3%, with a single-slot median latency and a sub-2% false-sleep rate on clean channels. (4) Conclusions: the technique needs no training and no extra hardware, making it suitable for resource-constrained end devices.
1. Introduction
Low-Power Wide-Area Networks (LPWANs) have become a foundational technology for the Internet of Things (IoT) across Latin America and the Caribbean, supporting applications such as precision agriculture, coastal and water quality monitoring, smart metering, and urban sensing. Among the available LPWAN technologies, LoRa is widely adopted because it offers kilometer-scale coverage with milliwatt-level transmit power. These same properties, however, expose LoRa links to radio-frequency interference and, in particular, to intentional jamming, in which an adversary radiates energy in the band to degrade or deny communication.
A jamming attack is especially costly for an end device because the device is typically battery powered and expected to operate unattended for years. When the channel is jammed, every transmission attempt consumes energy in the transceiver and, in most cases, fails to reach the gateway. A node that naively retransmits therefore drains its battery without delivering data. The problem is not only to detect jamming but to react to it in a way that preserves the limited energy budget of the node.
Much of the prior literature treats jamming detection and energy management as separate concerns. Detection schemes report an alarm but leave the reaction policy unspecified, while duty-cycling schemes save energy under nominal conditions but are unaware of the channel state. This paper argues that the two should be tightly coupled: the confidence that the channel is jammed should directly govern how aggressively the node sleeps.
We propose J-DEAS, a Jamming-Driven Exponential Adaptive Sleeping technique. J-DEAS combines a lightweight, threshold-based detector built on the Received Signal Strength Indicator (RSSI) and the Signal-to-Noise Ratio (SNR), both of which are reported natively by commodity LoRa transceivers, with an exponential sleep back-off scheduler driven by a single exponentially weighted confidence variable. The contributions of this paper are summarized as follows.
- We characterize a measurement dataset of normal and jammed LoRa links and show that the SNR mean and short-term SNR volatility, rather than RSSI, are the discriminative features for the observed jamming.
- We introduce a detector that requires no training and only a handful of arithmetic operations per sample, and we show that it attains an area under the curve of 0.985.
- We develop a formal mathematical treatment of the detector and the scheduler, including the decision boundary in feature space, the stochastic dynamics of the confidence variable, a closed-form expression for the steady-state duty cycle, and an analytical bound on the detection latency versus energy savings trade-off.
- We introduce the J-DEAS scheduler, which maps detection confidence to an exponential sleep interval, and we quantify its energy, duty-cycle, wasted-transmission, and latency trade-offs against two baselines.
To close this introduction, we situate J-DEAS within the broader body of work on LoRa and low-power medium access. Channel access in such networks descends from classical random-access paradigms, from the ALOHA system [1] to denial-of-service considerations in sensor networks [2] and the clock synchronization [3] and TDMA scheduling [4] that time-coordinated duty cycling presupposes. Comparative studies place LoRa among the leading LPWAN technologies for large-scale IoT [5]; its physical layer is based on frequency-shift chirp modulation [6], whose scalability [7] and imperfect inter-spreading-factor orthogonality [8] shape link-level performance, motivating the spreading-factor and power adaptation studied for LPWANs [9]. J-DEAS deliberately avoids the coordination these mechanisms require, operating entirely on the end device using only locally observed link-quality statistics.
The remainder of the paper is organized as follows. Section 2 reviews related work. Section 3 describes the dataset and the feature analysis and presents the detector and the J-DEAS scheduler together with their mathematical analysis. Section 4 reports the experimental results. Section 5 discusses the findings, and Section 6 concludes the paper.
2. Related Work
Jamming in wireless sensor and LPWAN systems has been studied from both the attack and the defense perspectives. Detection approaches commonly rely on metrics such as packet delivery ratio, carrier sensing time, RSSI, and SNR [10,11]. Statistical and machine-learning classifiers have been applied to these metrics with high reported accuracy [12]; however, learning-based detectors often assume computational and memory resources that exceed those of a constrained LoRa end device, and they require representative training data that may not transfer across deployments.
On the mitigation side, the literature describes channel hopping, spread spectrum, transmit-power control, and rerouting [13,14]. These techniques can be effective but frequently depend on coordination with the gateway, on spectrum that the device is not licensed to use, or on a mesh topology that LoRa star networks do not provide. The physical-layer vulnerabilities of LoRa specifically have been characterized in [15,16], and the broader LPWAN landscape is surveyed in [17]. Energy management for LPWAN nodes is usually addressed through static or schedule-based duty cycling, which is oblivious to the instantaneous channel state and therefore continues to transmit into a jammed channel.
The contribution of this work is to close the loop between detection and energy management. Rather than treating an alarm as a terminal output, J-DEAS uses a continuous confidence signal to modulate the sleep schedule, so that the node automatically conserves energy precisely when transmission is least likely to succeed and resumes normal operation when the channel clears.
The vulnerability of LoRa at the physical layer has been demonstrated repeatedly with commodity and software-defined-radio hardware. Aras et al. [15] showed that selective jamming of LoRaWAN is feasible with inexpensive equipment, and the same group documented the broader physical-layer weaknesses of the technology [18]. Demeslay et al. [19] analyzed band- and tone-jamming on LoRa in additive white Gaussian noise, deriving a lightweight jammer-detection scheme with closed-form detection probabilities. More recently, Šabić et al. [20] realized reactive jamming on LoRaWAN with sub-1000-EUR software-defined radios and characterized reaction-time distributions, while Senol et al. [21] applied machine learning to identify tampered LoRa transmissions from spectral features. Yang et al. [22] catalogued five concrete attack classes against LoRaWAN with countermeasures. These works establish both the practicality of the threat and the discriminative value of link- and signal-level statistics, but they stop at detection and do not specify an energy-conserving reaction policy.
Security surveys provide the broader context. Pirayesh and Zeng [14] survey jamming and anti-jamming strategies across wireless networks; Grover et al. [23] review jamming and anti-jamming techniques more generally; Hessel et al. [24] present a systematic, evolvable survey of LoRaWAN vulnerabilities and their mitigation; Ruotsalainen et al. [25] review physical-layer attacks and countermeasures specific to LoRaWAN; and Kuntke et al. [26] catalog LoRaWAN security issues and mitigation options in agricultural IoT. A consistent finding across these surveys is that anti-jamming for LoRa remains dominated by frequency hopping and spread-spectrum methods that presuppose spectrum agility, and that mitigation on the constrained end device is comparatively underexplored. The closely related problem of battery-depletion attacks, in which the adversary aims to exhaust the node energy rather than only deny a packet, has been modeled by Kuaban et al. [27] and underscores why an energy-conserving reaction is itself a security primitive.
A complementary line of work casts anti-jamming as a sequential decision problem. Reinforcement-learning and game-theoretic methods learn channel-access or power-allocation policies that evade or deceive jammers: Yao and Jia [28] propose a collaborative multi-agent reinforcement-learning anti-jamming algorithm, Pourranjbar et al. [29] deceive reactive jammers via learned channel selection with statistical lower bounds on received power, and related deep-learning approaches secure mobile sensing under adversarial conditions [30]. These methods are powerful but typically require training, channel agility, or per-episode computation that is heavy for a class-0 node. Finally, energy management in low-power networks is classically achieved through duty-cycled medium-access control [31,32,33,34], where nodes alternate sleep and active periods to conserve the radio, the dominant energy consumer [35,36]. However, these schedules are channel-unaware: they save energy under nominal conditions but continue to transmit into a jammed channel. J-DEAS is, in effect, a channel-aware, jamming-driven duty-cycling policy that inherits the energy discipline of this medium-access literature while being actuated by a detection-confidence signal.
To position our contribution, Table 1 compares J-DEAS with representative approaches along axes that we argue are decisive for a constrained LoRa end device. Beyond the usual question of whether a method detects (D) or also mitigates (M) jamming, we make explicit four properties that are frequently left implicit in the literature: whether the scheme is energy-aware (i.e., whether the reaction policy actively conserves the node battery rather than merely raising an alarm), whether it is training-free (and therefore portable across deployments without labeled data), whether it can run on the device rather than on the gateway or network server, and whether it requires additional hardware or coordination, such as a second radio, gateway cooperation, a software-defined radio, or a mesh topology. We additionally report whether the work provides an analytical or statistical performance guarantee (closed-form error/latency expressions or confidence intervals), the qualitative reaction latency, the input features consumed, and the year. Packet-delivery-ratio detectors such as [10,12] are accurate but couple detection to traffic and do not specify an energy-conserving reaction. Physical-layer countermeasures such as [16] are powerful but operate at the gateway and assume signal processing beyond a commodity node. The comprehensive surveys in [14,24] confirm that anti-jamming for LoRa remains dominated by channel hopping and spread-spectrum techniques that presuppose spectrum agility. The closest energy-oriented work [37], achieves substantial energy and retransmission savings through adaptive LoRa–BLE protocol switching, but it relies on a second radio and on cluster-level topology coordination. J-DEAS is, to our knowledge, the only entry that is simultaneously detection-driven, energy-aware, training-free, fully on-device, free of additional hardware or coordination, and equipped with analytical and statistical guarantees, while reacting within a single slot using only the RSSI and SNR already reported by the transceiver.
Table 1.
Comparative positioning of J-DEAS against representative jamming detection and mitigation approaches for LoRa/LPWAN. D: detection; M: mitigation; A: attack realization; GW: gateway-side; : transmit power; FH: frequency hopping; PHY: physical layer; SDR: software-defined radio; Med.: medium; N/R: not reported. “Extra HW/Coord.” indicates dependence on a second radio, gateway cooperation, an SDR, or a mesh topology. “Stat. Guar.” indicates whether the work provides an analytical/statistical performance guarantee (closed-form error or latency expressions, or confidence intervals).
Quantitatively, and acknowledging that prior works report on heterogeneous datasets, hardware, and metrics, J-DEAS compares favorably with recent results. The statistical PDR-EWMA detector of Osanaiye et al. [12] reports detection accuracy in the 0.93–0.95 range but couples detection to traffic and specifies no energy reaction; the closed-form band/tone-jamming detector of Demeslay et al. [19] achieves high detection probability but operates at the gateway. By contrast, J-DEAS attains an AUC of 0.985 and an F1 of 0.969 while simultaneously cutting the jammed-channel duty cycle from 100% to 5.5% (a 94% transmit-energy reduction) entirely on the end device. Relative to the closest energy-oriented work [37], which obtains comparable energy savings but requires a second radio and cluster-level coordination, J-DEAS reaches similar savings with no additional hardware and a single-slot reaction latency. These figures are summarized qualitatively in Table 1.
3. Materials and Methods
3.1. Dataset and Feature Analysis
The dataset consists of link-quality traces collected from a LoRa testbed. It contains 16 traces recorded under normal operation and 15 traces recorded while a jammer was active in the band. Each trace comprises 250 consecutive samples, and each sample reports the RSSI in dBm and the SNR in dB as measured by the receiver. In total the dataset contains 4000 normal samples and 3750 jammed samples. The data, computer code, and analysis scripts supporting the reported results are described in the Data Availability Statement.
Table 2 summarizes the per-class statistics. The mean RSSI is nearly identical across the two classes, −48.1 dBm for normal links and dBm for jammed links, and the two RSSI distributions overlap almost completely. This indicates that the observed jamming does not appreciably change the received power and that RSSI alone is not a reliable discriminator. The SNR, in contrast, separates the two classes cleanly: the mean SNR drops from dB under normal operation to dB under jamming, and the short-term SNR volatility increases markedly. The per-trace SNR standard deviation ranges from about to dB for normal links but from about to dB for jammed links.
Table 2.
Per-class statistics of the LoRa dataset.
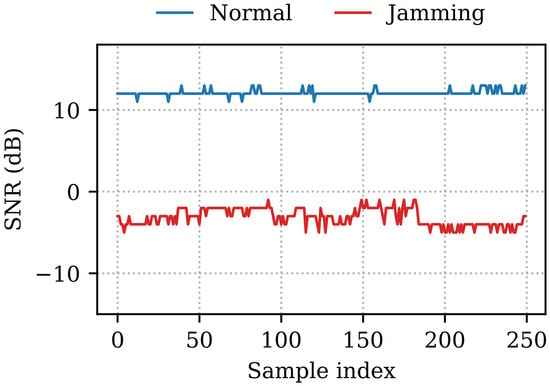
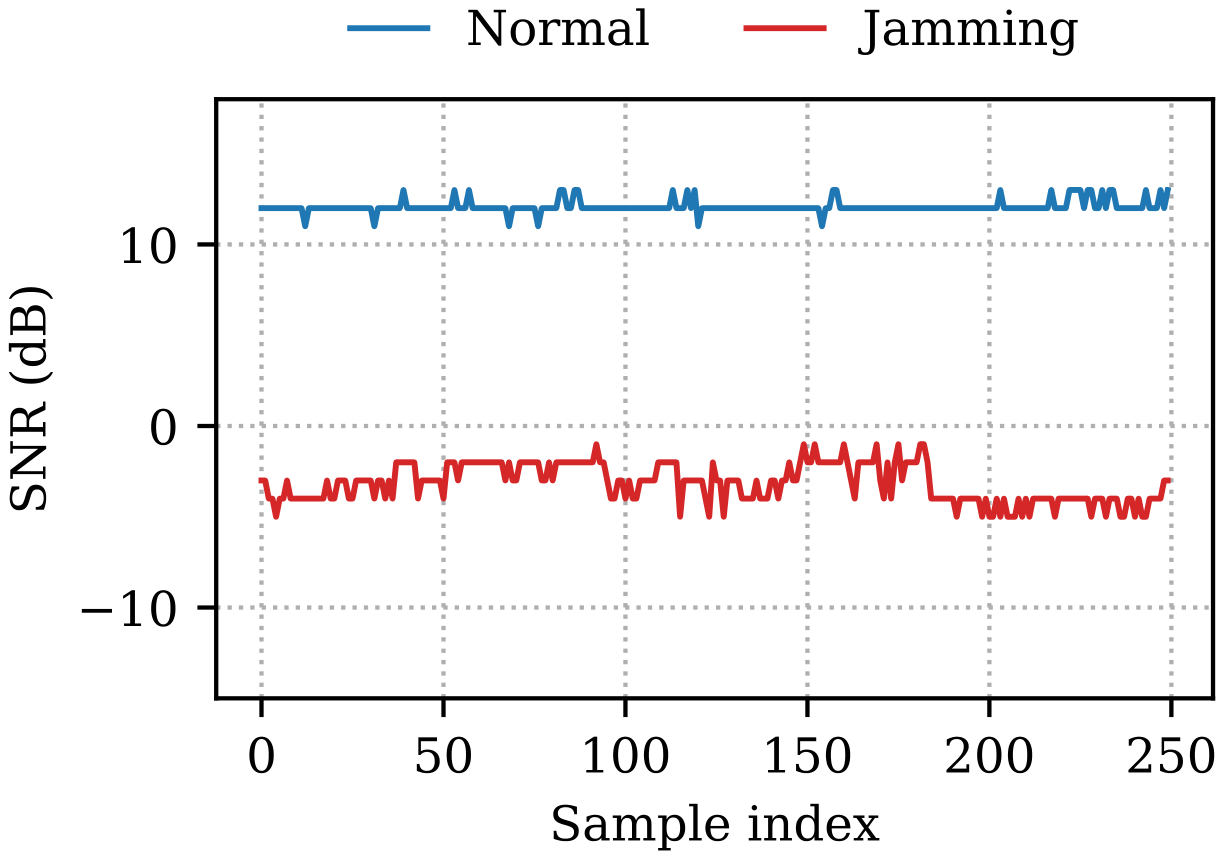
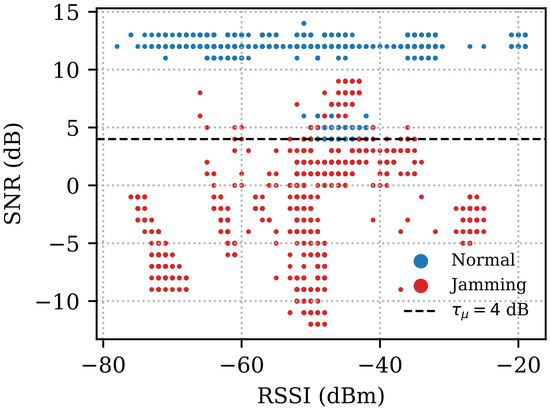
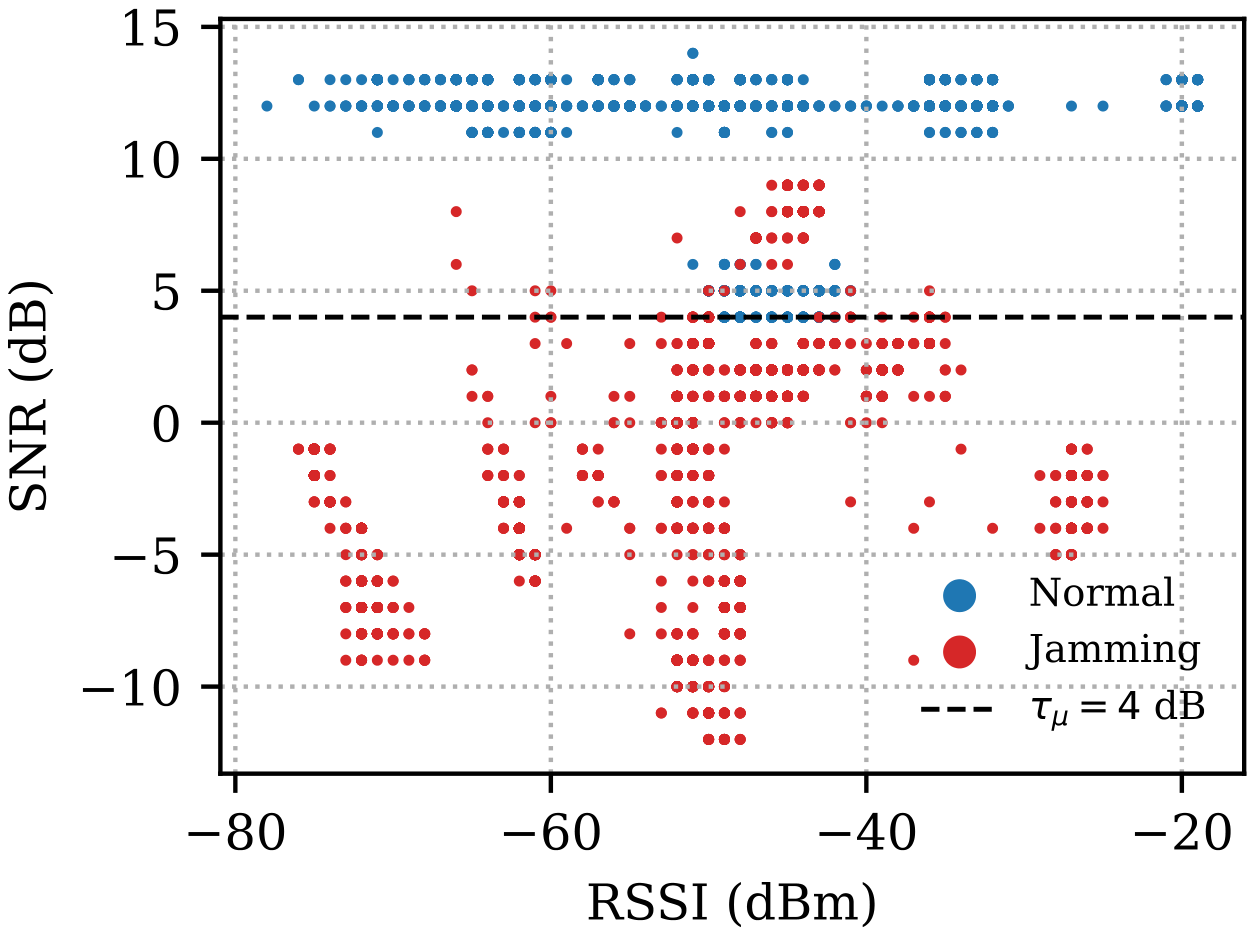
Figure 1 illustrates this behavior for one representative trace of each class. The normal SNR trace is flat and high, whereas the jammed SNR trace is depressed and erratic. Figure 2 plots every sample in the RSSI–SNR plane. The two classes are entangled along the RSSI axis but well separated along the SNR axis, with a natural boundary near 4 dB. These observations motivate a detector based on the SNR mean and the short-term SNR volatility.
Figure 1.
SNR over time for one representative normal trace and one jammed trace. The jammed trace exhibits a lower mean and a higher volatility.
Figure 2.
RSSI versus SNR for all samples. The classes overlap in RSSI but separate in SNR near the dB boundary.
3.2. System and Signal Model
We consider a single LoRa end device that communicates with a gateway over a slotted channel. Time is divided into slots indexed by , and in each slot the device may either transmit (and listen for link-quality feedback) or sleep. At every active slot the transceiver reports two link-quality observables: the RSSI (in dBm) and the SNR (in dB).
Let denote the hypothesis that the channel is in its normal state and the hypothesis that the channel is jammed. Motivated by the empirical statistics of Section 3.1, we model the SNR as a piecewise-stationary Gaussian process whose first two moments depend on the channel state,
where and are the conditional mean and standard deviation of the SNR under the normal and jammed states, respectively. The dataset yields the empirical estimates ≈ 11.2 dB, ≈ −0.9 dB, with per-trace volatilities dB and dB. The essential structure exploited by J-DEAS is the joint separation
that is, jamming simultaneously depresses the mean and inflates the variance of the SNR. Because the RSSI distributions satisfy with heavily overlapping support, RSSI carries negligible discriminative information for the observed jamming and is therefore excluded from the decision statistic, although it remains available for diagnostics.
The piecewise-stationary assumption holds between state transitions but is violated by slow fading (a slowly varying mean) and bursty fluctuations (heavier-than-Gaussian tails). The derived expressions remain valid as first-order approximations under these conditions, with bounded error. A mean drift of dB across one window perturbs the argument of in (7) and (8) by , so for the sub-decibel drift typical of LoRa links over samples the induced error in and is small. The steady-state duty cycle of Proposition 1 is governed by the EWMA confidence, whose geometric memory averages out short bursts; this smoothing is the reason an EWMA statistic is used in place of an instantaneous test. Empirically, the entire residual detector error localizes to two traces whose SNR violates stationarity (Section 4.5), which bounds the practical impact of non-stationarity at the dataset level.
3.3. Lightweight Jamming Detector
The detector maintains a sliding window of the most recent W SNR samples and computes the window mean and standard deviation in (3),
These statistics can be maintained incrementally with constant per-slot cost using the running-sum recursions
from which and . Thus the detector requires time and memory per slot, with no multiplications beyond two squarings.
A per-slot binary evidence value is raised when either the mean SNR falls below a level threshold or the volatility exceeds a threshold ,
The disjunction captures the two complementary signatures of (2), namely a depressed SNR floor and an elevated SNR variance.
3.3.1. Decision Boundary and Geometry
Equation (5) defines a decision region in the two-dimensional feature space . The normal (non-alarm) region is the open rectangle defined in (6),
and the alarm region is its complement . The boundary is an L-shaped (axis-aligned) curve, which is the union of the vertical segment and the horizontal segment . This piecewise-linear boundary is the disjunctive (OR) counterpart of a conjunctive classifier; it is deliberately chosen over a single linear discriminant because the two cues in (2) are not collinear in feature space, and an OR rule preserves sensitivity to either signature alone.
3.3.2. Error Probabilities
Under the Gaussian model (1), the window mean is distributed as , and the (biased) sample variance satisfies in distribution. Treating the two tests as approximately independent for analytical tractability, the per-window probability of a false alarm (declaring under ) is
where is the standard normal cumulative distribution function and is the cumulative distribution function of a chi-squared random variable with degrees of freedom. Correspondingly, the probability of a missed detection (declaring under ) is
which is the joint probability that both the mean test and the volatility test fail to fire under jamming. Equations (7) and (8) make explicit that increasing the window length W sharpens the mean test (the argument of scales as ), which trades detection latency for accuracy; this trade-off is quantified in Section 3.4.4. The probability of detection is .
We note that this factorization is in fact exact, not merely a convenient approximation: for independent Gaussian samples the sample mean and the sample variance are statistically independent, so under the within-window stationary Gaussian model of (1) the mean test and the volatility test are independent for any window length, including . The only residual approximation is the assumption of stationarity within the window, which a slow-fading or state-transition episode can violate; this is precisely the source of the residual missed detections reported in Section 4.
3.3.3. Threshold Selection
The thresholds are derived directly from the dataset statistics and admit a principled interpretation in terms of (7) and (8). The level threshold is placed in the separating gap ; choosing the midpoint-like value dB balances the two mean-test tails. The volatility threshold is placed in the gap between the per-trace standard deviations of the two classes, dB. With , , and , the arguments of in (7) and (8) are large in magnitude, predicting both small and small , consistent with the empirical results of Section 4. None of these parameters requires a training phase.
We also consider hybrid interference, in which environmental noise and intentional jamming coexist. Additive environmental noise lowers the SNR mean and raises its volatility, shifting samples in the same direction as jamming along both axes of (2). By (7) and (8), a larger effective increases the false-alarm probability but decreases the missed-detection probability; the detector therefore errs toward caution (occasional false sleep) rather than toward missing a jammer under noisy conditions. Importantly, environmental noise cannot simultaneously raise the mean and suppress the volatility, so it does not create a hiding opportunity for an attacker. Because is calibrated from the clean-channel statistics, the nominal noise floor is already absorbed into the threshold, and only excess noise beyond the calibrated level affects the error rates.
We stress that “training-free” here means that J-DEAS uses no learned model and no labeled jamming data, and requires no per-deployment retraining of a classifier; the two thresholds are obtained by a one-time, unsupervised calibration rather than by supervised learning. In a field deployment this calibration can be fully automated: at power-on the node collects a short window of SNR samples on a presumed-clean channel, estimates the clean-channel mean and standard deviation , and sets and with small fixed constants (here of order a few units), so that no jamming examples and no human labeling are ever required.
3.4. J-DEAS Adaptive Sleeping Scheduler
3.4.1. Confidence Dynamics
A single confidence variable integrates the evidence stream through an exponentially weighted moving average (EWMA),
where controls the responsiveness of the confidence to new evidence. Unrolling (9) gives the explicit finite-impulse-response form
which shows that is a normalized geometric average of the evidence with effective memory length slots. The contribution of evidence older than a few multiples of decays geometrically, so the confidence is governed by recent channel behavior.
Modeling the evidence stream under a fixed channel state as a Bernoulli process with firing probability , where and , the confidence is a stochastic process whose stationary expectation follows directly from (9):
and whose stationary variance, obtained from the EWMA recursion for independent inputs, is
Equation (12) quantifies the smoothing–responsiveness trade-off governed by : a smaller suppresses the fluctuation of (reducing spurious mode switches) at the cost of a longer effective memory and therefore slower reaction.
3.4.2. Exponential Sleep Back-Off
The scheduler maps to a sleep interval , in slots, through an exponential back-off in (13), bounded by and ,
Ignoring rounding and clipping, the unclipped sleep map is the smooth exponential
which interpolates geometrically between and . The choice of a geometric (rather than linear) interpolation is deliberate: it yields a constant relative sensitivity, since
so that a fixed increment of confidence multiplies the sleep interval by a fixed factor, mirroring the multiplicative nature of exponential back-off in classical medium-access control. When is small the node transmits and listens normally; when exceeds a decision threshold the node sleeps for slots, and the higher the confidence the longer the node sleeps. Because decays once the evidence subsides, the node automatically shortens its sleep interval and resumes normal operation when the channel clears, without any explicit reset. Algorithm 1 summarizes the procedure.
| Algorithm 1 J-DEAS scheduler at slot t |
Require: thresholds ; smoothing ; decision threshold ; sleep bounds ; window W
|
3.4.3. Steady-State Duty Cycle
We now derive the energy behavior of the scheduler in closed form. Define the duty cycle D as the long-run fraction of slots in which the node is active (transmitting/listening). Consider the regime in which the channel is in state for a long interval, so that concentrates around its mean by (11).
Proposition 1
(Steady-state duty cycle). Let be the stationary confidence under state . In the regime (the node predominantly sleeps), the steady-state duty cycle is
whereas in the regime (the node predominantly stays awake), .
Proof.
In the sleeping regime, each active slot is followed by a sleep of slots before the next active slot, because the node samples the channel, sleeps, and repeats. One activity cycle therefore spans slots and contains exactly one active slot, giving the active fraction in (16). In the awake regime , the node transmits every slot, so . □
For the jammed state with we obtain , which for predicts a duty cycle of approximately ; the measured value of in Section 4 is slightly higher because of the finite recovery episodes and the transient ramp of , both of which the asymptotic approximation (16) neglects. For the normal state with we obtain and hence , consistent with the near-continuous operation observed on clean channels.
3.4.4. Detection-Latency Versus Energy-Savings Trade-Off
The reaction latency is the number of slots required, after the onset of jamming, for the confidence to cross the decision threshold and trigger sleeping. We characterize it for the worst-case deterministic ramp in which every post-onset slot fires evidence (), starting from .
Theorem 1
(Reaction latency). Suppose jamming begins at slot 0 with and for all . Then the confidence after n slots is , and the reaction latency—the smallest n such that —is
Proof.
For the operating point = 0.3, = 0.5, Theorem 1 gives L = = = 2 slots in the worst-case ramp, and the median empirical latency is a single slot because the first jammed window typically fires with high confidence. Equation (17) exposes the central design trade-off: a larger shortens the latency L but, by (12), increases the variance of and hence the rate of spurious sleep episodes on clean channels. Combining (17) with Proposition 1, the asymptotic energy saving relative to an always-on policy is and is essentially independent of , so can be tuned to minimize latency subject to a false-sleep constraint without sacrificing the energy benefit. We formalize the energy saving as follows.
Corollary 1
(Asymptotic energy saving). Let the per-slot active energy be and the sleep energy be negligible. Under sustained jamming, the long-run energy of J-DEAS relative to the always-on policy is , so the fractional energy saving is given by (18),
For , , of which the measured reduction realizes the dominant part once transient and recovery effects are included.
3.4.5. Parameter Selection
The thresholds are derived directly from the dataset statistics, as discussed in Section 3.3: dB and dB. We use a window of samples, a smoothing factor , a decision threshold , and sleep bounds and slots. By Theorem 1 this gives a worst-case latency of two slots, and by Corollary 1 an asymptotic energy saving near . None of these parameters requires a training phase.
3.5. Statistical Evaluation Methodology
To quantify the uncertainty of every reported metric we adopt three complementary procedures, following standard statistical process control and resampling practice [38,39,40]. First, for proportion-type metrics (accuracy) we report the Wilson score interval, which is well-calibrated for proportions near the boundary of the unit interval and avoids the degeneracy of the normal approximation when the success probability approaches one. For a metric estimated as k successes out of n trials, the Wilson interval is
where z is the standard-normal quantile ( for ). Second, for composite metrics (precision, recall, F1, and the area under the curve, AUC) for which no simple closed-form interval exists, we use the nonparametric bootstrap [40] with resamples drawn with replacement at the window level; the reported interval is the percentile interval of the bootstrap distribution. Third, for trace-level aggregate metrics (per-trace duty cycle) we report the normal-theory interval , where is the number of traces and s the sample standard deviation, together with a leave-one-trace-out (LOTO) cross-validation in which the metric is recomputed with each trace held out in turn, so that no single trace dominates the estimate. The detector itself is connected to this literature by construction: the confidence recursion of (9) is the exponentially weighted moving-average (EWMA) statistic introduced by Roberts [39], whose properties and design were later refined by Lucas and Saccucci [41] and Montgomery [42], and the depressed-mean signature it tracks is the small-shift regime for which EWMA and cumulative-sum (CUSUM) charts [38] are the classical detectors of choice.
4. Results
We evaluate the detector and the scheduler on the full dataset. The detector is assessed over non-overlapping windows of samples, which yields 372 labeled windows. The scheduler is assessed by replaying every trace through J-DEAS and through two baselines: an always-on policy that transmits in every slot, and a fixed 50% duty-cycle policy that transmits in alternate slots.
4.1. Detection Performance
Using the rule of (5), the detector attains an accuracy of 0.970, a precision of 0.994, a recall of 0.944, and an F1 score of 0.969. Only one normal window is misclassified as jammed and ten jammed windows are missed, the latter corresponding to brief intervals in which a jammed trace momentarily recovers a high SNR. For comparison, a single-feature baseline that flags jamming whenever the SNR mean is below 6 dB reaches an F1 score of only 0.903, which confirms the benefit of combining the level and volatility cues. These empirical error rates are consistent with the analytical predictions of (7) and (8): with and the measured class statistics, both and are small, and the residual misses arise precisely from the high-SNR recovery episodes that violate the stationarity assumption of (1).
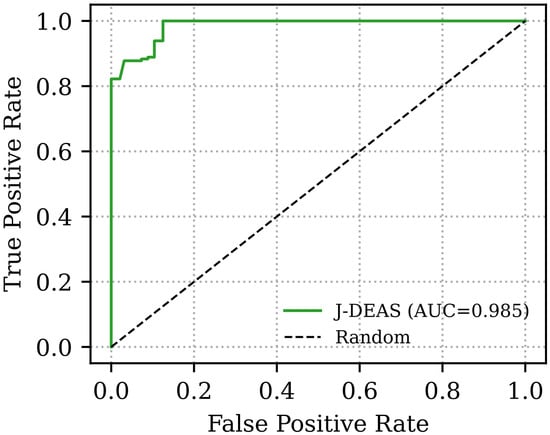
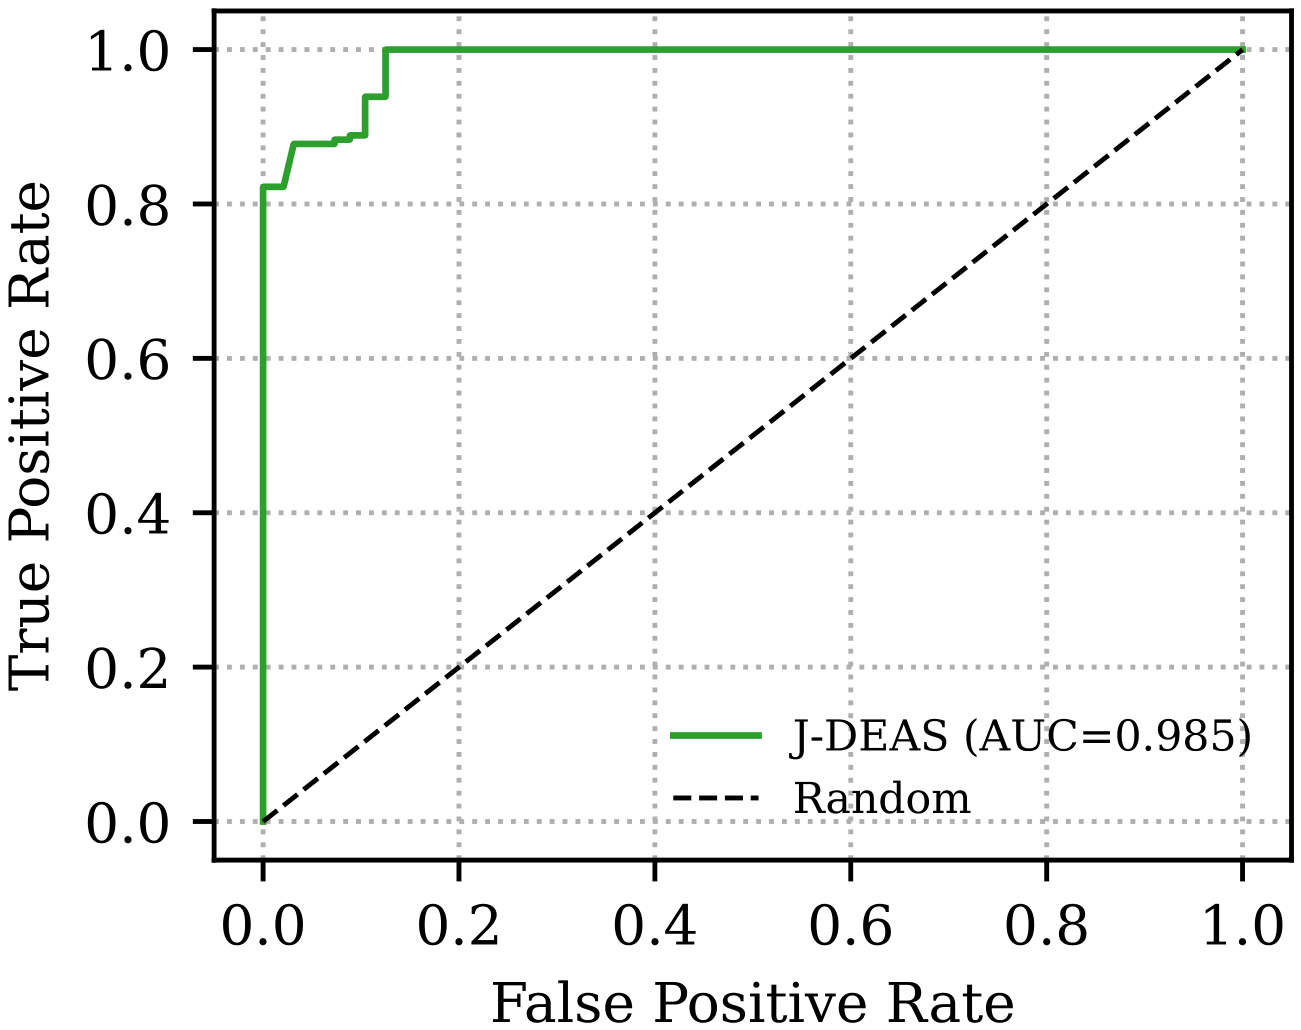
Figure 3 shows the receiver operating characteristic obtained by sweeping a combined score over the two features. The area under the curve is 0.985, which indicates that the two features are jointly highly separable and that the detector is robust to the choice of operating point.
Figure 3.
Receiver operating characteristic of the J-DEAS detector. The area under the curve is 0.985.
4.2. Energy and Duty-Cycle Performance
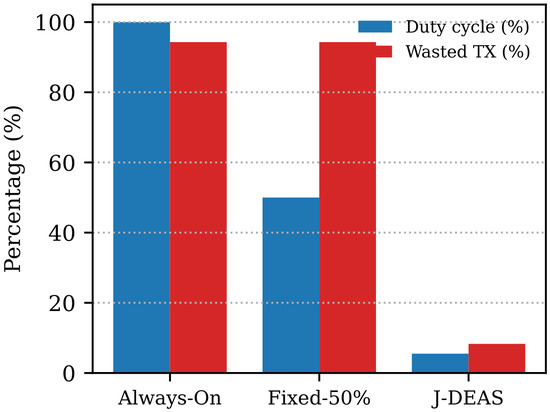
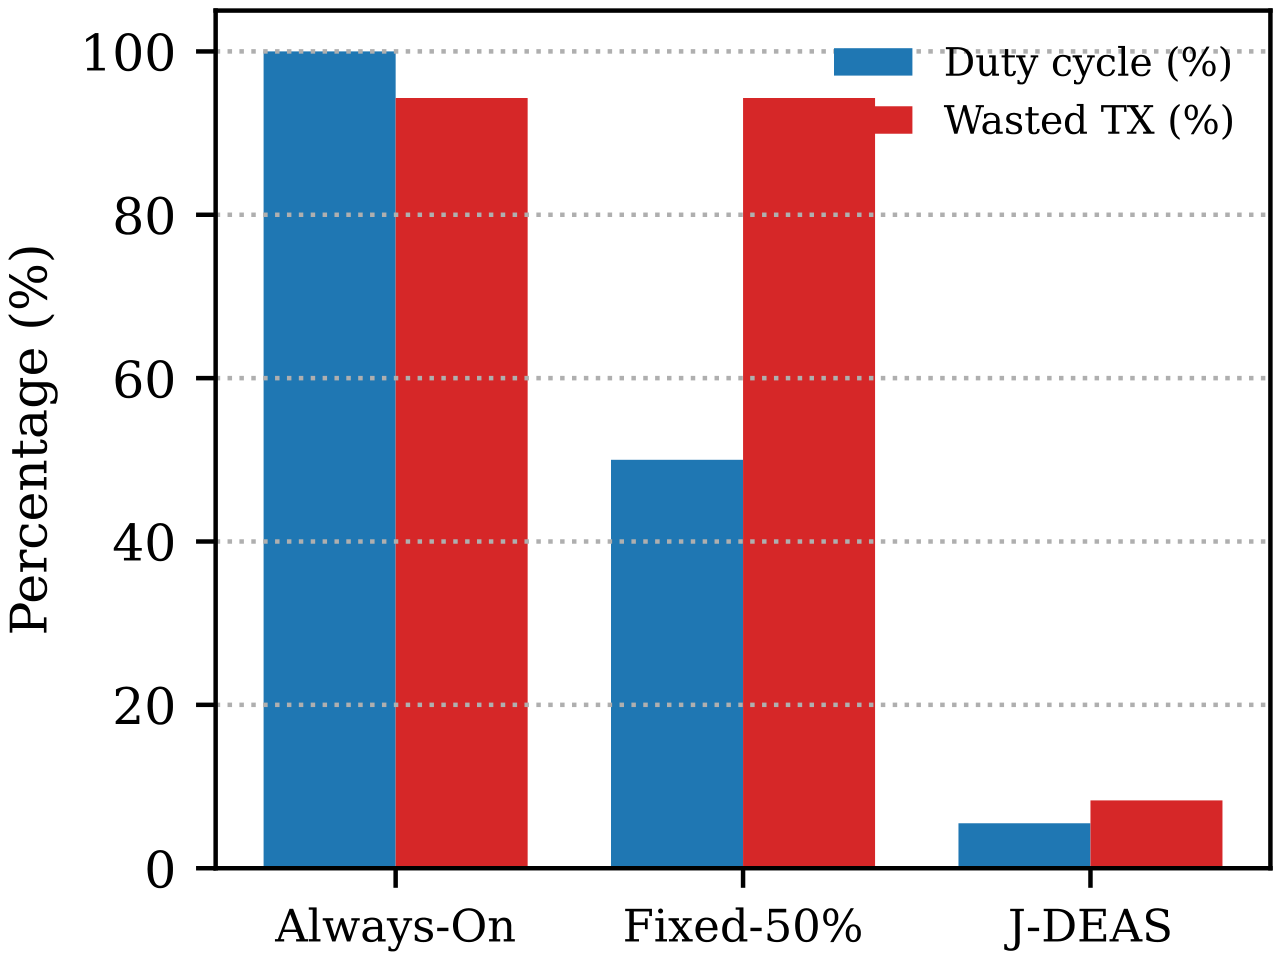
Table 3 reports the duty cycle and the fraction of wasted transmissions on the jammed traces, where a wasted transmission is one that occurs while the channel is jammed and therefore fails. The always-on and fixed duty-cycle baselines are channel-unaware, so 94.3% of their transmissions are wasted. To represent a channel-aware energy-management baseline, we also evaluate a reactive-SNR policy that halves its duty cycle whenever the instantaneous SNR falls below a fixed cutoff and restores it otherwise. This adaptive scheme markedly improves on the channel-agnostic baselines, yet because it reacts to raw per-slot SNR without the confidence smoothing of , it oscillates near the cutoff and therefore wastes more transmissions and reacts less stably than J-DEAS, which isolates the benefit of the exponentially weighted confidence variable. J-DEAS, in contrast, reduces the duty cycle to 5.5% and the wasted-transmission rate to 8.3%. Because the transmit energy of a duty-cycled radio is approximately proportional to the duty cycle, this corresponds to roughly a 94% reduction of transmit energy relative to the always-on policy and an 89% reduction relative to the fixed 50% policy, in close agreement with the asymptotic saving predicted by Corollary 1. The median detection latency is a single slot, consistent with the bound from Theorem 1, so the node begins to conserve energy almost immediately after the onset of jamming.
Table 3.
Scheduler performance on jammed channels.
To translate the duty-cycle proxy into physical units, we provide a first-order estimate from the Semtech SX1276 data sheet. Taking a representative transmit current of mA and a sleep current of A at V, an always-on radio draws an average current close to , whereas at the measured jammed-channel duty cycle of the average current falls to roughly mA. For a 2000 mAh AA-class budget dedicated to the radio, this raises the jamming-period lifetime from on the order of days of continuous transmission to several weeks, an extension of roughly in the sustained-jamming regime. This estimate omits the radio state-transition and wake-up energy, which a hardware measurement campaign (Section 5) would additionally capture; it therefore represents an optimistic but order-correct bound on the achievable saving.
Figure 4 visualizes the comparison.
Figure 4.
Duty cycle and wasted-transmission rate on jammed channels. J-DEAS sharply reduces both relative to the channel-unaware baselines.
4.3. Behavior on Clean Channels
A scheduler that saves energy under jamming is only useful if it does not penalize normal operation. On the 16 normal traces, J-DEAS keeps the duty cycle at 98.4% and the wasted-transmission rate at 0.1%, which means that the node remains essentially always awake when the channel is clear. This matches the prediction of Proposition 1 for . The small departure from 100% arises from two normal traces whose mean SNR is near dB, close to the level threshold; these episodes produce a short and self-correcting sleep before the confidence decays, exactly as the geometric memory of (10) predicts.
4.4. Adaptive Sleep Dynamics
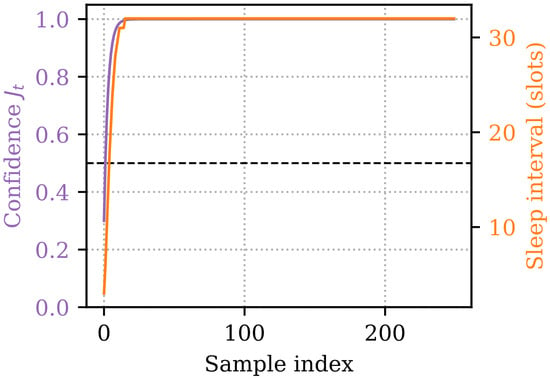
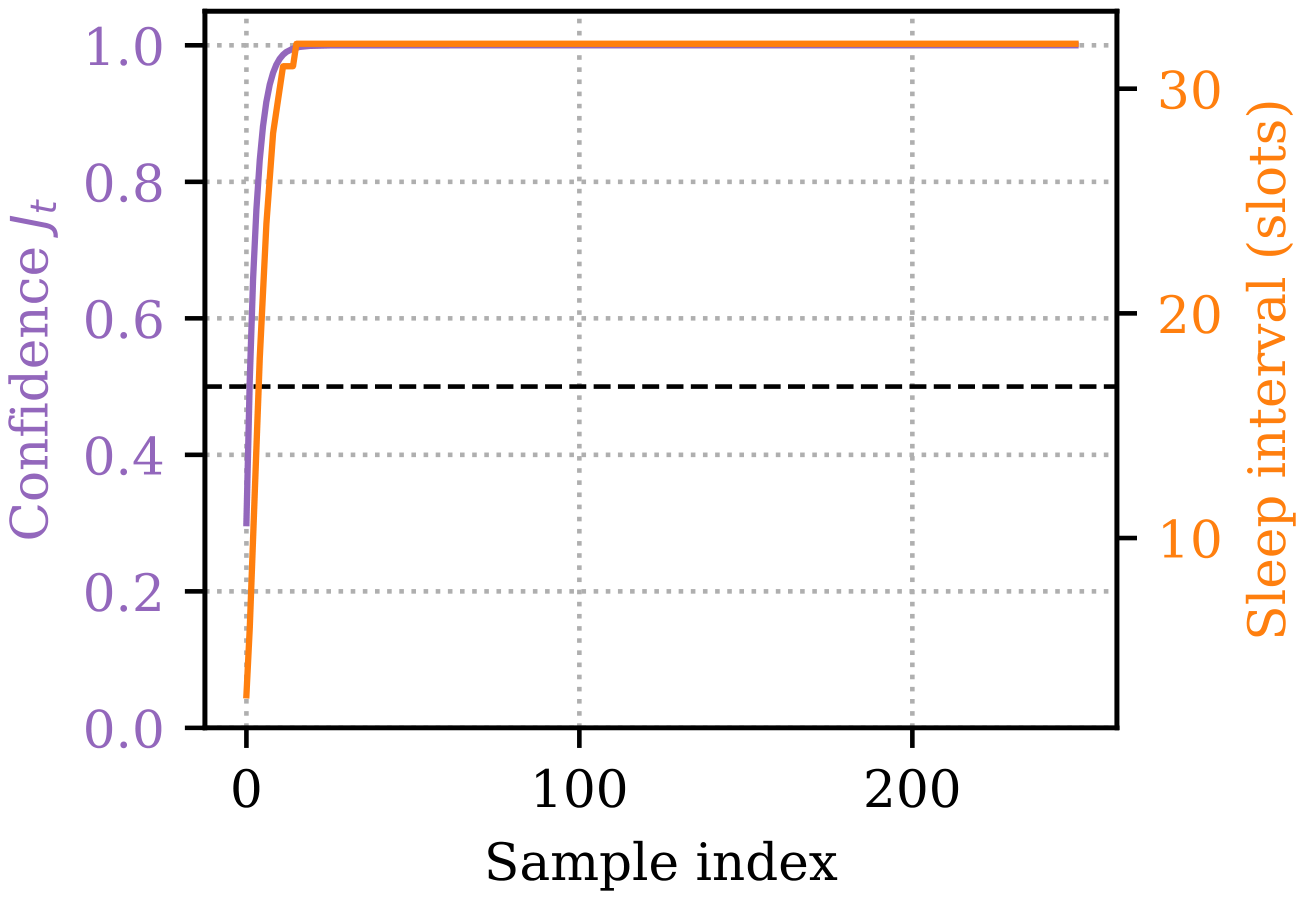
Figure 5 traces the confidence variable and the resulting sleep interval for a single jammed channel. As evidence accumulates, rises past the decision threshold and the sleep interval grows exponentially toward , following the smooth map (14). When the channel briefly improves, decays and the sleep interval contracts, which demonstrates the self-regulating behavior of the scheduler.
Figure 5.
Confidence and adaptive sleep interval on a jammed channel. The sleep interval grows with confidence and contracts when the channel clears.
4.5. Confidence Intervals and Cross-Validation
Point estimates alone do not convey the reliability of the evaluation, particularly for a dataset of moderate size. Table 4 reports each headline metric together with a confidence interval computed by the procedures of Section 3.5. The detector accuracy is with a Wilson interval of (equivalently, 361 of 372 windows correctly classified), and the bootstrap intervals for precision, recall, and F1 are narrow and bounded well away from the no-skill baseline. The AUC is with a bootstrap interval of , confirming that the joint separability of the two features is statistically robust and not an artifact of a particular operating point.
Table 4.
Headline metrics with confidence intervals. Accuracy uses the Wilson score interval (19); precision, recall, F1, and AUC use the nonparametric bootstrap (); duty cycles use the normal-theory interval over traces. Wasted-transmission figures are reported as point estimates.
The leave-one-trace-out cross-validation corroborates these intervals. Across the 31 traces the per-trace detection accuracy is for 29 traces; the only departures are a single normal trace with a transient low-SNR episode (per-trace accuracy ) and a single jammed trace exhibiting an atypically high and stable SNR that partially evades the rule (per-trace accuracy ). This concentration of error in two identifiable traces, rather than a diffuse spread across the dataset, indicates that the detector generalizes across traces and that the residual error is attributable to specific physical episodes that violate the stationarity assumption of (1), consistent with the analytical missed-detection probability of (8). The wide upper bound of the jammed-channel duty-cycle interval is driven entirely by the same atypical jammed trace, for which the node correctly remains awake; excluding that single trace, the per-trace jammed duty cycle tightens to a mean below .
4.6. Parameter Sensitivity and Validation of the Analytical Trade-Offs
We next examine the sensitivity of J-DEAS to its parameters, which serves two purposes: it demonstrates robustness to threshold choice, and it empirically validates the analytical trade-offs derived in Section 3.4. Table 5 reports the detection F1 score as the level threshold and the volatility threshold are each varied around the operating point, and the duty cycle and detection latency as the smoothing factor is varied.
Table 5.
Parameter sensitivity of J-DEAS. Top: detection F1 versus the detector thresholds. Bottom: jammed-channel duty cycle and median empirical detection latency versus the smoothing factor , compared with the worst-case analytical latency L from Theorem 1, Equation (17). The selected operating point is shown in bold.
Three observations follow. First, the detection F1 is maximized at the data-driven operating point dB and degrades gracefully—never below —across a wide neighborhood, so the detector is not finely tuned to a knife-edge threshold; the volatility test in particular is flat for dB, reflecting the clear gap between the per-class SNR standard deviations. Second, the duty cycle is essentially insensitive to (it varies only between and ), in agreement with Corollary 1, which predicts that the asymptotic energy saving is independent of . Third, the median empirical detection latency tracks the worst-case analytical bound of Theorem 1 closely for , confirming the latency analysis; the apparent reversal at = 0.5, where the empirical latency rises despite a smaller analytical L, is precisely the high-variance regime predicted by Equation (12): a large inflates the variance of the confidence variable, producing premature threshold crossings followed by oscillation that delays a stable sleep decision. The selected value = 0.3 therefore sits at the empirically and analytically supported sweet spot that minimizes latency without sacrificing stability or energy savings.
5. Discussion
The results confirm that detection confidence is an effective control signal for energy management. By coupling the two, J-DEAS converts an otherwise harmful condition, in which transmissions are wasted, into an opportunity to conserve energy. The technique is lightweight, training-free, and uses only metrics that commodity LoRa transceivers already report, which makes it practical for deployment in the constrained nodes typical of Latin American and Caribbean IoT applications.
The central scientific insight of this work is that detection confidence is itself an actuator: rather than treating a jamming alarm as a terminal classification output, J-DEAS feeds a continuous confidence signal directly into the energy-management loop, so that the node’s sleep schedule becomes a smooth function of how strongly the channel is believed to be jammed. This reframing dissolves the conventional separation between the intrusion-detection layer and the duty-cycling layer, and it suggests a more general design principle for constrained devices, namely that anomaly estimators should expose a graded belief that downstream control policies can consume, instead of a hard label. The mathematical analysis of Section 3.4 makes this principle quantitative: Equation (15) shows that the geometric back-off realizes a constant relative sensitivity of sleep duration to confidence, Proposition 1 predicts the energy behavior in closed form, and Theorem 1 together with Equation (12) exposes the latency–stability trade-off governed by the single smoothing parameter .
The practical consequence is concrete and favorable. Because the policy maps a single exponentially weighted variable to an exponential back-off, it adds only a handful of arithmetic operations and a few bytes of state per slot, which keeps it well within the budget of a class-0 LoRa end device and avoids the memory, latency, and portability costs that learning-based detectors incur. This lightness should not be confused with the absence of any calibration: J-DEAS dispenses with learned models and labeled data, but its two thresholds are calibrated once, without supervision, from clean-channel statistics, and can be re-estimated on-device whenever the node observes a sustained clean channel. The same lightness clarifies the attacker’s dilemma: to defeat J-DEAS without being detected, an adversary must raise the noise floor enough to deny communication while keeping the victim’s SNR both high and stable, two requirements that are difficult to satisfy simultaneously given the separation structure of (2), so that the most damaging attacks are precisely the ones the node senses first and sleeps through. This dilemma extends to low-duty-cycle and power-controlled intelligent jamming: an attacker that keeps both the SNR mean and its volatility within normal ranges necessarily limits its own denial effectiveness, since any episode strong enough to prevent delivery perturbs at least one of the two cues. To close the residual gap against attackers that trade denial for stealth, complementary indicators can be fused into the same evidence variable through an additional disjunctive term, for example, a packet-delivery-ratio drop, an inter-arrival-timing anomaly, or a spectral-occupancy test, each computable in constant time and each raising independently, so that the detector preserves its on-device cost while widening its coverage of evasive strategies. This converts a denial-of-service condition into a controlled energy-conservation mode and reshapes the cost asymmetry that normally favors the jammer. Crucially, J-DEAS is designed to compose with, rather than replace, active recovery: the same confidence variable that drives the sleep interval is the natural trigger for a connectivity-restoring layer. When crosses the decision threshold, a downstream controller can hand off to channel hopping, spreading-factor adaptation, or gateway-coordinated rescheduling, so that the node first stops wasting energy and then attempts to re-establish the link, yielding a complete detect–conserve–recover pipeline in which J-DEAS supplies the detect and conserve stages. From a deployment perspective, the technique is attractive for the unattended, battery-bound sensing networks that underpin agricultural, coastal, and smart-city applications across Latin America and the Caribbean, where extending node lifetime under hostile or congested spectrum has immediate operational value and where reliance on a second radio or on gateway-side coordination is often impractical. More broadly, the results provide empirical evidence that substantial resilience can be obtained from metrics that every commodity transceiver already reports, which lowers the barrier to deploying jamming-aware behavior at scale and invites a reexamination of how much security can be recovered from existing link-quality telemetry before resorting to specialized hardware.
The statistical analysis strengthens the central claim in two ways. The confidence intervals of Table 4 show that the detector’s accuracy and ranking quality (AUC) are not fragile point estimates but are bounded, with certainty, far above any no-skill baseline, and the leave-one-trace-out cross-validation localizes the entire residual error to two physically interpretable traces rather than a diffuse generalization failure. The parameter-sensitivity study of Table 5 then closes the loop between theory and experiment: the measured duty cycle confirms the -independence of the energy saving predicted by Corollary 1, and the measured latency confirms both the deterministic bound of Theorem 1 and the variance-induced penalty of Equation (12). Taken together, these results elevate J-DEAS from an empirically effective heuristic to a method whose behavior is analytically predictable and statistically quantified, a property of practical value when certifying the energy lifetime of unattended nodes that must operate for years on a fixed battery.
Summarizing the horizontal comparison along the four axes of Table 1: in detection latency J-DEAS reacts within a single slot, matching or beating the gateway-side physical-layer detectors while running on the device; in energy it is the only training-free entry that actively conserves the battery; in hardware overhead it requires no second radio, SDR, or mesh, unlike the closest energy-oriented and reinforcement-learning approaches; and in deployment complexity it needs only a one-time unsupervised threshold calibration. Its principal limitation relative to active schemes is that it conserves energy rather than restoring connectivity, which is the role of the recovery layer discussed above.
Limitations and Future Work
Several limitations of the present study delineate directions for future research. First, the evaluation rests on a single-jammer dataset of 31 traces collected from one testbed; although the SNR-based separation is clean, the thresholds and were tuned to these measurements, and their generalization to other spreading factors, bandwidths, gateway distances, and propagation environments remains to be validated through larger and more diverse field campaigns. We emphasize that the structural properties exploited by J-DEAS, the joint depressed-mean and inflated-variance separation of the SNR, and the closed-form duty-cycle and reaction-latency relations, are independent of the particular dataset, whereas only the numerical threshold values and the absolute error rates are dataset-specific; a planned multi-jammer, multi-spreading-factor, and multi-environment field campaign, including continuous, reactive, and low-duty-cycle jammers, will quantify the extent to which the calibrated thresholds transfer across deployments. Second, the detector exploits the depressed-mean and elevated-volatility signatures of the observed jamming; a sophisticated adversary could craft a low-duty-cycle or power-controlled attack that preserves a high and stable SNR, which would evade the current rule and motivates the integration of complementary cues such as the packet delivery ratio, inter-arrival timing, and spectral features. Third, J-DEAS conserves energy by sleeping during jamming, but it does not by itself restore connectivity; coupling the confidence signal with reactive measures such as channel hopping, spreading-factor adaptation, or coordinated gateway scheduling is a natural extension. Fourth, the energy benefit is reported through a duty-cycle proxy rather than measured joules; future work will quantify the savings on commodity hardware, including the radio state-transition and wake-up overheads that the idealized model of Corollary 1 omits. As a first step toward physical-unit reporting, Section 4.2 now provides an SX1276 data-sheet-based estimate that converts the duty-cycle reduction into an average-current and battery-life extension; a bench measurement campaign will subsequently quantify the per-transition switching and wake-up energy directly, and will be combined with the frequency-hopping and spreading-factor recovery layer triggered by to report end-to-end joules for the full detect–conserve–recover cycle. Finally, the smoothing factor , the decision threshold , and the sleep bounds were set heuristically; guided by the analytical trade-off in Theorem 1 and Equation (12), an online, self-tuning policy that adapts these parameters to the observed channel statistics, together with a formal analysis of the detection-latency versus energy-savings trade-off under non-stationary jamming, would further strengthen the approach.
Finally, from the perspective of frontier-technology integration, several lightweight-intelligent, neuromorphic, and bio-inspired signal-processing paradigms offer attractive directions for future iterations of J-DEAS while preserving its on-device, training-free character. An event-driven, neuromorphic-style update that advances the confidence variable only when the SNR changes significantly would further reduce per-slot computation, in the spirit of recent algorithm–hardware co-designed spiking architectures that achieve large energy savings with far fewer parameters [43]; a bio-inspired adaptive threshold that emulates sensory habituation, analogous to bio-inspired multi-receptor sensing skins [44], would let and track slowly varying noise floors automatically; and ultra-low-power analog or in-sensor processing, including the emerging field of iontronics [45], could push the detector below its already negligible energy cost. We regard these as optional enhancements that retain the constant-time, no-extra-hardware property central to the present design.
6. Conclusions
This paper presented J-DEAS, a jamming-driven, exponential-adaptive sleeping technique for energy-aware mitigation of jamming in LoRa networks. A lightweight detector based on the SNR mean and short-term SNR volatility attains an area under the curve of 0.985 and an F1 score of 0.969 on a measurement dataset, and a confidence-driven exponential sleep scheduler reduces the transmission duty cycle under jamming from 100% to 5.5% and the wasted-transmission rate from 94.3% to 8.3%, while preserving near-continuous operation on clean channels and a single-slot detection latency. We complemented the empirical evaluation with a formal analysis that derives the detector error probabilities, the stationary statistics of the confidence variable, a closed-form steady-state duty cycle, and an exact reaction-latency expression, and we showed that the measured performance closely matches these analytical predictions. The technique requires no training and no additional hardware. Future work will study adaptive adversaries, couple the confidence signal with connectivity-restoring measures, and validate the technique in larger field deployments.
Supplementary Materials
The following supporting information can be downloaded at: https://drive.google.com/drive/u/0/folders/1cLctPGApmkD4nPhHitNayNJHAA-3p_RV (accessed on 13 June 2026), Dataset S1: LoRa link-quality traces used in this study, comprising 16 normal-operation traces and 15 jammed traces, each reporting the per-sample RSSI (dBm) and SNR (dB) measured at the receiver.
Author Contributions
Conceptualization, C.D.-V.-S. and C.M.-P.; methodology, C.D.-V.-S., C.M.-P. and E.V.; software, E.V. and O.M.-M.; validation, C.D.-V.-S., J.V.-A. and L.J.V.; formal analysis, C.M.-P. and C.D.-V.-S.; investigation, C.D.-V.-S. and E.V.; resources, C.D.-V.-S. and J.V.-A.; data curation, E.V. and O.M.-M.; writing—original draft preparation, C.D.-V.-S. and C.M.-P.; writing—review and editing, J.V.-A., L.J.V. and O.M.-M.; visualization, E.V. and O.M.-M.; supervision, C.D.-V.-S.; project administration, C.D.-V.-S.; funding acquisition, C.D.-V.-S. and J.V.-A. All authors have read and agreed to the published version of the manuscript.
Funding
This research received no external funding.
Institutional Review Board Statement
Not applicable.
Informed Consent Statement
Not applicable.
Data Availability Statement
The link-quality traces that support the findings of this study are provided as Supplementary Materials. The analysis and simulation code is available from the corresponding author upon reasonable request.
Conflicts of Interest
The authors declare no conflicts of interest.
Abbreviations
The following abbreviations are used in this manuscript:
| AUC | Area Under the Curve |
| BLE | Bluetooth Low Energy |
| EWMA | Exponentially Weighted Moving Average |
| IoT | Internet of Things |
| J-DEAS | Jamming-Driven Exponential Adaptive Sleeping |
| LoRa | Long Range |
| LPWAN | Low-Power Wide-Area Network |
| PDR | Packet Delivery Ratio |
| RSSI | Received Signal Strength Indicator |
| ROC | Receiver Operating Characteristic |
| SNR | Signal-to-Noise Ratio |
References
- Abramson, N. The ALOHA System: Another Alternative for Computer Communications. In Proceedings of the Fall Joint Computer Conference, Houston, TX, USA, 17–19 November 1970; Association for Computing Machinery: New York, NY, USA, 1970; pp. 281–285. [Google Scholar]
- Wood, A.D.; Stankovic, J.A. Denial of Service in Sensor Networks. Computer 2002, 35, 54–62. [Google Scholar] [CrossRef] [Scilit]
- Sundararaman, B.; Buy, U.; Kshemkalyani, A.D. Clock Synchronization for Wireless Sensor Networks: A Survey. Ad Hoc Netw. 2005, 3, 281–323. [Google Scholar] [CrossRef] [Scilit]
- Sgora, A.; Vergados, D.J.; Vergados, D.D. A Survey of TDMA Scheduling Schemes in Wireless Multihop Networks. ACM Comput. Surv. 2015, 47, 53. [Google Scholar] [CrossRef] [Scilit]
- Mekki, K.; Bajic, E.; Chaxel, F.; Meyer, F. A Comparative Study of LPWAN Technologies for Large-Scale IoT Deployment. ICT Express 2019, 5, 1–7. [Google Scholar] [CrossRef] [Scilit]
- Vangelista, L. Frequency Shift Chirp Modulation: The LoRa Modulation. IEEE Signal Process. Lett. 2017, 24, 1818–1821. [Google Scholar] [CrossRef] [Scilit]
- Bor, M.C.; Roedig, U.; Voigt, T.; Alonso, J.M. Do LoRa Low-Power Wide-Area Networks Scale? In Proceedings of the 19th ACM International Conference on Modeling, Analysis and Simulation of Wireless and Mobile Systems (MSWiM), Malta, 13–17 November 2016; Association for Computing Machinery: New York, NY, USA, 2016; pp. 59–67. [Google Scholar]
- Croce, D.; Gucciardo, M.; Mangione, S.; Santaromita, G.; Tinnirello, I. Impact of LoRa Imperfect Orthogonality: Analysis of Link-Level Performance. IEEE Commun. Lett. 2018, 22, 796–799. [Google Scholar]
- Reynders, B.; Meert, W.; Pollin, S. Power and Spreading Factor Control in Low Power Wide Area Networks. In Proceedings of the IEEE International Conference on Communications (ICC), Paris, France, 21–25 May 2017; IEEE: Piscataway, NJ, USA, 2017; pp. 1–6. [Google Scholar]
- Xu, W.; Trappe, W.; Zhang, Y.; Wood, T. The Feasibility of Launching and Detecting Jamming Attacks in Wireless Networks. In Proceedings of the 6th ACM International Symposium on Mobile Ad Hoc Networking and Computing (MobiHoc), Urbana-Champaign, IL, USA, 25–27 May 2005; Association for Computing Machinery: New York, NY, USA, 2005; pp. 46–57. [Google Scholar]
- Pelechrinis, K.; Iliofotou, M.; Krishnamurthy, S.V. Denial of Service Attacks in Wireless Networks: The Case of Jammers. IEEE Commun. Surv. Tutor. 2011, 13, 245–257. [Google Scholar]
- Osanaiye, O.; Alfa, A.S.; Hancke, G.P. A Statistical Approach to Detect Jamming Attacks in Wireless Sensor Networks. Sensors 2018, 18, 1691. [Google Scholar] [CrossRef] [Scilit] [PubMed]
- Mpitziopoulos, A.; Gavalas, D.; Konstantopoulos, C.; Pantziou, G. A Survey on Jamming Attacks and Countermeasures in WSNs. IEEE Commun. Surv. Tutor. 2009, 11, 42–56. [Google Scholar] [CrossRef] [Scilit]
- Pirayesh, H.; Zeng, H. Jamming Attacks and Anti-Jamming Strategies in Wireless Networks: A Comprehensive Survey. IEEE Commun. Surv. Tutor. 2022, 24, 767–809. [Google Scholar] [CrossRef] [Scilit]
- Aras, E.; Small, N.; Ramachandran, G.S.; Delbruel, S.; Joosen, W.; Hughes, D. Selective Jamming of LoRaWAN Using Commodity Hardware. In Proceedings of the 14th EAI International Conference on Mobile and Ubiquitous Systems (MobiQuitous), Melbourne, Australia, 7–10 November 2017; Association for Computing Machinery: New York, NY, USA, 2017; pp. 363–372. [Google Scholar]
- Hou, N.; Xia, X.; Zheng, Y. Jamming of LoRa PHY and Countermeasure. In Proceedings of the IEEE INFOCOM, Vancouver, BC, Canada, 10–13 May 2021; IEEE: Piscataway, NJ, USA, 2021; pp. 1–10. [Google Scholar]
- Raza, A.; Kulkarni, P.; Sooriyabandara, M. Low Power Wide Area Networks: An Overview. IEEE Commun. Surv. Tutor. 2017, 19, 855–873. [Google Scholar] [CrossRef] [Scilit]
- Aras, E.; Ramachandran, G.S.; Lawrence, P.; Hughes, D. Exploring the Security Vulnerabilities of LoRa. In Proceedings of the 3rd IEEE International Conference on Cybernetics (CYBCONF), Exeter, UK, 21–23 June 2017; IEEE: Piscataway, NJ, USA, 2017; pp. 1–6. [Google Scholar]
- Demeslay, C.; Gautier, R.; Fiche, A.; Burel, G. Band and Tone Jamming Analysis and Detection on LoRa Signals. arXiv 2021, arXiv:2107.07782. [Google Scholar]
- Šabić, J.; Perković, T.; Begušić, D.; Šolić, P. Practical Realization of Reactive Jamming Attack on Long-Range Wide-Area Network. Sensors 2025, 25, 2383. [Google Scholar] [CrossRef] [Scilit] [PubMed]
- Senol, N.S.; Rasheed, A.; Baza, M.; Alsabaan, M. Identifying Tampered Radio-Frequency Transmissions in LoRa Networks Using Machine Learning. Sensors 2024, 24, 6611. [Google Scholar] [PubMed]
- Yang, X.; Karampatzakis, E.; Doerr, C.; Kuipers, F. Security Vulnerabilities in LoRaWAN. In Proceedings of the IEEE/ACM Third International Conference on Internet-of-Things Design and Implementation (IoTDI), Orlando, FL, USA, 17–20 April 2018; IEEE: Piscataway, NJ, USA, 2018; pp. 129–140. [Google Scholar]
- Grover, K.; Lim, A.; Yang, Q. Jamming and Anti-Jamming Techniques in Wireless Networks: A Survey. Int. J. Ad Hoc Ubiquitous Comput. 2014, 17, 197–215. [Google Scholar] [CrossRef] [Scilit]
- Hessel, F.; Almon, L.; Hollick, M. LoRaWAN Security: An Evolvable Survey on Vulnerabilities, Attacks and Their Systematic Mitigation. ACM Trans. Sens. Netw. 2022, 18, 70. [Google Scholar]
- Ruotsalainen, H.; Shen, G.; Zhang, J.; Fujdiak, R. LoRaWAN Physical Layer-Based Attacks and Countermeasures: A Review. Sensors 2022, 22, 3127. [Google Scholar] [PubMed]
- Kuntke, F.; Romano, V.; Linsner, S.; Reuter, C. LoRaWAN Security Issues and Mitigation Options by the Example of Agricultural IoT Scenarios. Trans. Emerg. Telecommun. Technol. 2022, 33, e4452. [Google Scholar]
- Kuaban, G.S.; Gelenbe, E.; Czachórski, T.; Czekalski, P.; Tangka, J.K. Modelling of the Energy Depletion Process and Battery Depletion Attacks for Battery-Powered Internet of Things (IoT) Devices. Sensors 2023, 23, 6183. [Google Scholar] [PubMed]
- Yao, F.; Jia, L. A Collaborative Multi-Agent Reinforcement Learning Anti-Jamming Algorithm in Wireless Networks. IEEE Wirel. Commun. Lett. 2019, 8, 1024–1027. [Google Scholar]
- Pourranjbar, A.; Kaddoum, G.; Ferdowsi, A.; Saad, W. Reinforcement Learning for Deceiving Reactive Jammers in Wireless Networks. IEEE Trans. Commun. 2021, 69, 3682–3697. [Google Scholar] [CrossRef] [Scilit]
- Xiao, L.; Jiang, D.; Xu, D.; Su, W.; An, N.; Wang, D. Secure Mobile Crowdsensing Based on Deep Learning. China Commun. 2018, 15, 1–11. [Google Scholar] [CrossRef] [Scilit]
- Ye, W.; Heidemann, J.; Estrin, D. An Energy-Efficient MAC Protocol for Wireless Sensor Networks. In Proceedings of the IEEE INFOCOM, New York, NY, USA, 23–27 June 2002; IEEE: Piscataway, NJ, USA, 2002; pp. 1567–1576. [Google Scholar]
- van Dam, T.; Langendoen, K. An Adaptive Energy-Efficient MAC Protocol for Wireless Sensor Networks. In Proceedings of the 1st ACM Conference on Embedded Networked Sensor Systems (SenSys), Los Angeles, CA, USA, 5–7 November 2003; Association for Computing Machinery: New York, NY, USA, 2016; pp. 171–180. [Google Scholar]
- Buettner, M.; Yee, G.V.; Anderson, E.; Han, R. X-MAC: A Short Preamble MAC Protocol for Duty-Cycled Wireless Sensor Networks. In Proceedings of the 4th ACM Conference on Embedded Networked Sensor Systems (SenSys), Boulder, CO, USA, 31 October–3 November 2006; Association for Computing Machinery: New York, NY, USA, 2016; pp. 307–320. [Google Scholar]
- Wang, Y.; Liu, Y.; He, Y.; Li, X.-Y.; Cheng, X. Towards Energy Efficient Duty-Cycled Networks: Analysis, Implications and Improvement. IEEE Trans. Comput. 2016, 65, 270–280. [Google Scholar]
- Akyildiz, I.F.; Su, W.; Sankarasubramaniam, Y.; Cayirci, E. Wireless Sensor Networks: A Survey. Comput. Netw. 2002, 38, 393–422. [Google Scholar] [CrossRef] [Scilit]
- Anastasi, G.; Conti, M.; Di Francesco, M.; Passarella, A. Energy Conservation in Wireless Sensor Networks: A Survey. Ad Hoc Netw. 2009, 7, 537–568. [Google Scholar] [CrossRef] [Scilit]
- Del-Valle-Soto, C.; Valdivia, L.J.; Velazquez, R.; Del-Puerto-Flores, J.A.; Varela-Aldas, J.; Visconti, P. Adaptive Jamming Mitigation for Clustered Energy-Efficient LoRa-BLE Hybrid Wireless Sensor Networks. Sensors 2025, 25, 1931. [Google Scholar] [PubMed]
- Page, E.S. Continuous Inspection Schemes. Biometrika 1954, 41, 100–115. [Google Scholar] [CrossRef] [Scilit]
- Roberts, S.W. Control Chart Tests Based on Geometric Moving Averages. Technometrics 1959, 1, 239–250. [Google Scholar] [CrossRef]
- Efron, B.; Tibshirani, R.J. An Introduction to the Bootstrap; Chapman & Hall/CRC: Boca Raton, FL, USA, 1993. [Google Scholar]
- Lucas, J.M.; Saccucci, M.S. Exponentially Weighted Moving Average Control Schemes: Properties and Enhancements. Technometrics 1990, 32, 1–12. [Google Scholar] [CrossRef] [Scilit]
- Montgomery, D.C. Introduction to Statistical Quality Control, 6th ed.; John Wiley & Sons: Hoboken, NJ, USA, 2009. [Google Scholar]
- Sun, P.; Su, Z.; Achterberg, J.; Indiveri, G.; Goodman, D.F.M.; Akarca, D. Algorithm–Hardware Co-Design of Neuromorphic Networks with Dual Memory Pathways. Nat. Mach. Intell. 2026, 8, 901–912. [Google Scholar] [CrossRef] [Scilit] [PubMed]
- Du, Y.; Shen, P.; Liu, H.; Zhang, Y.; Jia, L.; Pu, X.; Yang, F.; Ren, T.; Chu, D.; Wang, Z.; et al. Multi-Receptor Skin with Highly Sensitive Tele-Perception Somatosensory. Sci. Adv. 2024, 10, eadp8681. [Google Scholar] [CrossRef] [Scilit] [PubMed]
- Wang, B.; Ding, W. Ionic-Electrostatic Modeling of Solid–Liquid Triboelectric Nanogenerators. Iontronics 2026, 2, 9. [Google Scholar] [CrossRef] [Scilit]

Disclaimer/Publisher’s Note: The statements, opinions and data contained in all publications are solely those of the individual author(s) and contributor(s) and not of MDPI and/or the editor(s). MDPI and/or the editor(s) disclaim responsibility for any injury to people or property resulting from any ideas, methods, instructions or products referred to in the content. |
© 2026 by the authors. Licensee MDPI, Basel, Switzerland. This article is an open access article distributed under the terms and conditions of the Creative Commons Attribution (CC BY) license.