


Abstract
Chile marks the southern frontier of maize diversification in the Americas. Along its steep latitudinal and altitudinal gradients, centuries of farmer selection and seed exchange gave rise to a distinctive set of local races, now conserved in the national collection of the Instituto de Investigaciones Agropecuarias (INIA). Yet this collection had never been characterized at the genome-wide level. We genotyped 1157 accessions as DNA pools with 20,956 DArTseq single-nucleotide polymorphism (SNP) markers to describe their genetic diversity, population structure and linkage disequilibrium and to build a core collection. The main genetic division followed geography rather than race, separating a homogeneous group of floury maize from the northern Andean highlands from a more diverse and admixed central-southern complex. At a finer scale, groups associated with specific races emerged, whereas some traditionally distinct races, such as Capio Chileno Chico and Grande, were genetically indistinguishable. Landraces carried 459 alleles absent from breeding materials and greater within-accession variation. Genomic data also helped classify accessions lacking passport information. A core collection of 231 accessions retained all detected alleles, all 22 standard races and 96% of the gene diversity. These results provide the first genomic framework for conserving and using the maize diversity of Chile.
1. Introduction
Maize (Zea mays L.) is one of the world’s major crops and one of the most genetically and phenotypically diverse cultivated species. It was domesticated approximately 9000 years ago in southwestern Mexico from Zea mays ssp. parviglumis and subsequently dispersed throughout the Americas, diversifying through human selection and adaptation to contrasting environments [1]. Archaeological and genomic evidence indicates that maize reached South America relatively early in its domestication history and diversified further through complex dispersal processes, gene flow, and adaptation to diverse environments and agricultural systems [2,3].
The southward expansion of maize eventually brought the crop into the highly heterogeneous environments of Chile. Archaeobotanical and isotopic evidence documents a long history of maize cultivation and consumption in pre-Hispanic Chile, with increasing importance in agricultural societies of central Chile [4,5]. Cultivation extends across pronounced latitudinal and altitudinal gradients, from extremely arid northern environments to Mediterranean and temperate rainy conditions farther south. Farmer selection, seed exchange, geographic differentiation, and environmental pressures may have contributed to the maintenance and differentiation of local populations. These landraces are represented in the Chilean national maize germplasm collection, alongside improved and advanced breeding materials, including those developed by the Instituto de Investigaciones Agropecuarias (INIA) during the second half of the twentieth century.
Previous molecular studies of Chilean maize have focused on specific germplasm groups or included few Chilean accessions in broader continental surveys [6,7,8]. In contrast, recent SNP-based studies have substantially expanded our understanding of maize genetic diversity elsewhere in the Americas. Genome-wide analyses have revealed genetic differentiation associated with highland adaptation in Mesoamerican and South American maize [9], dispersal history and endosperm type in South American lowland germplasm [10], and genetic structure among highland and lowland landraces from southern South America [11]. More recently, genotyping-by-sequencing of 423 Peruvian accessions revealed genetic diversity and population structure among highland maize races [12]. Despite these advances, the Chilean national maize germplasm collection remains uncharacterized using genome-wide SNP data.
Characterizing this diversity is important for both germplasm conservation and utilization. Landraces may retain variation underrepresented in modern breeding germplasm, and genome-wide studies have demonstrated their potential to broaden the genetic base available for maize improvement [13,14]. In South America, genomic information has also helped resolve relationships among landraces and support the conservation and utilization of locally adapted germplasm [10,11].
High-throughput SNP genotyping enables the characterization of large germplasm collections. Reduced-representation sequencing approaches such as DArTseq [15] generate large numbers of genome-wide markers and have been successfully applied to maize genetic resources, including South American landraces [10]. Genotyping DNA pools provides an efficient strategy for characterizing landrace diversity at the population level [16].
Here, we used DArTseq SNP genotyping to characterize the Chilean national maize germplasm collection conserved by INIA. Our objectives were to: (i) assess the extent and distribution of genetic diversity; (ii) characterize patterns of linkage disequilibrium; (iii) determine population structure and genetic relationships among accessions and germplasm groups; (iv) infer the population type and race of accessions with incomplete passport data; and (v) establish a representative core collection capturing the genetic diversity of the broader collection. The resulting characterization provides a genetic framework for conservation, management, and future use in maize research and breeding.
2. Results
2.1. Distribution of SNP Markers and Genetic Diversity
Of the 20,956 quality-filtered SNP markers, 11,698 (55.8%) were anchored to the 10 maize nuclear chromosomes using the B73 RefGen_v4 reference genome, while 9179 (43.8%) could not be uniquely aligned and were classified as unknown. The remaining markers comprised 72 SNPs (0.3%) not anchored to any nuclear chromosome and 7 (<0.1%) mapped to the mitochondrial genome. None mapped to the chloroplast genome (Figure 1). Of the 9258 markers that could not be assigned to one of the ten nuclear chromosomes, 72 aligned to unplaced B73 RefGen_v4 scaffolds not yet integrated into the ten pseudomolecules, while the remaining 9179 had no reported alignment position in the reference assembly.
Figure 1.
(A) Density distribution of quality-filtered SNP markers across maize chromosomes (1 Mb bins). (B) Number of SNP markers by genome location category.
The number of chromosome-anchored markers ranged from 785 on chromosome 10 to 1972 on chromosome 1. Marker density in 1 Mb windows was heterogeneous within chromosomes, with regions of reduced or absent coverage interspersed among regions of higher density.
Across all markers, mean minor allele frequency (MAF), gene diversity (GD), proportion of heterozygous calls (Ho), and Shannon–Wiener index (H) were 0.178, 0.253, 0.270, and 0.398, respectively, with 5.7% missing data (Table 1). For the 11,698 chromosome-anchored SNPs, diversity statistics were broadly consistent across chromosomes: MAF ranged from 0.154 (chromosome 4) to 0.173 (chromosome 9), GD from 0.227 to 0.246, H from 0.367 to 0.389, and missing data from 5.81% to 6.70% (Figure S1, Table S1). These chromosome-anchored markers were slightly less diverse and had slightly more missing data than the 9258 SNPs that could not be anchored to a chromosome (mean MAF = 0.198, GD = 0.274, H = 0.425, missing data = 5.09%); because the genome-wide means reported in Table 1 are computed across all 20,956 SNPs, they fall just outside the per-chromosome range reported here.
Table 1.
Genetic diversity statistics of the quality-filtered SNP dataset (n = 20,956 SNPs) for the entire germplasm collection and for the landrace and breeding material subsets.
Diversity was compared between 939 landraces and 172 breeding materials using all 20,956 SNPs; the 46 accessions of unknown population type were excluded (Table 1). Landraces had a higher proportion of heterozygous calls (0.292 vs. 0.123), but a smaller difference in GD (0.254 vs. 0.227). The GD of the entire collection (0.253) was close to that of landraces, while breeding materials retained substantial allelic diversity despite their lower proportion of heterozygous calls. MAF and H were also higher in landraces (0.180 vs. 0.158 and 0.400 vs. 0.362, respectively), whereas missing data were higher in breeding materials (14.2% vs. 4.2%). These frequency-based indices were calculated from the operational 0/0.5/1 coding of genotype calls; their sensitivity to this coding is evaluated in Section 3.3.
Alternative alleles were shared between landraces and breeding materials at 20,496 loci (97.8%). At 459 loci (2.2%), the alternative allele occurred exclusively in landraces, compared with one locus (<0.1%) exclusive to breeding materials. Thus, landraces contained allelic variation absent from the breeding-material subset.
Private alleles were assessed for each of the 22 standard races, using 759 landrace accessions (100 of unknown race and 80 of non-standard classification were excluded). Race sample sizes ranged from one accession in Marcame to 111 in Camelia. Alternative alleles occurred in two or more races at 20,951 loci (99.98%) and were absent from all races at one locus (<0.01%). Four loci carried race-private alleles: one locus each in Camelia (carried by LP243 and LP1159), Curagua (LP13), Morocho Blanco (LP804), and Capio Chileno Grande (LP201 and LP209). No private alleles were detected in the remaining 18 races.
2.2. Linkage Disequilibrium Decay
Pairwise linkage disequilibrium (LD, r2) was estimated for 105,700 SNP pairs separated by ≤1 Mb, using the 11,698 chromosome-anchored markers in the 939 landrace accessions. The unbinned distribution showed rapid LD decay with physical distance, approaching background levels within the shortest intervals examined (Figure S2).
Variable-width binning confirmed this pattern (Table S2). Mean r2 was 0.052 in the first interval (≤100 bp), already below the 0.10 threshold, and declined to approximately 0.013 beyond 500 kb. The overall mean across all pairs was 0.016. Because mean r2 was below 0.10 in the shortest interval, the decay distance could only be resolved to an upper bound of 100 bp when all SNPs were included. This estimate was sensitive to the marker set. Of the 4546 pairs in the first interval, 2861 (63%) were SNPs within the same DArTseq tag, with a mean r2 of 0.033. When the analysis was restricted to SNPs with MAF ≥ 0.10 in landraces (6500 SNPs; 34,210 pairs), mean r2 was 0.114 in the first interval, fell below 0.10 in the 100–1000 bp interval (0.084) and approached approximately 0.03 beyond 100 kb.
All ten chromosomes had mean r2 below 0.10 in the first 100 bp interval, with no detectable differences in decay distance at this resolution (Figure 2). Chromosome 9 showed comparatively higher mean r2 at intermediate distances (5–40 kb), but all chromosomes converged toward similar background levels of approximately 0.01–0.02 beyond 40 kb.
Figure 2.
Linkage disequilibrium (LD) decay by chromosome in the landrace subset (n = 939), based on pairwise r2 between SNP markers within 1 Mb of physical distance.
2.3. Structure Analysis
The ΔK distribution showed a clear primary peak at K = 2 (ΔK ≈ 15,685), with smaller secondary peaks at K = 6 (ΔK ≈ 5044) and K = 8 (ΔK ≈ 2728), indicating hierarchical genetic structure (Figure S3). Membership coefficients were highly consistent across the 10 independent runs at both K = 2 and K = 6 (mean pairwise H′ = 0.999 and 0.995, respectively). Group assignments were identical in all runs for all 1157 accessions at K = 2 and for 1155 accessions (99.8%) at K = 6; the two exceptions had maximum Q values at the 0.50 assignment threshold (Table S3). Results are presented first for K = 2, the broadest level detected.
At K = 2, 184 accessions (15.9%) were assigned to Group 1 and 534 (46.2%) to Group 2 using Q ≥ 0.80. The remaining 439 accessions (37.9%) were classified as admixed (Figure 3A, Table S4a).
Figure 3.
Population structure of the maize germplasm collection inferred using STRUCTURE. (A) K = 2. (B) K = 6. Each vertical bar represents one accession, and colors indicate the estimated membership coefficient (Q) for each inferred genetic cluster.
K2-Group 1 (n = 184), hereafter the northern Andean group, included 12 races, none accounting for more than ~13% of its accessions. The most frequent were Capio Chileno Grande (n = 24), Choclero (n = 17), Harinoso Tarapaqueño (n = 16), and Capio Chileno Chico (n = 16); 11 accessions were racially unclassifiable and 71 lacked racial classification. Among accessions with available passport data, 86% were collected in Arica y Parinacota, Tarapacá, and Antofagasta Regions at a mean elevation of 2656 m (range: 91–3660 m; median: 2857 m). Among the 141 accessions with morphological records, 89% had floury grain, 92% white endosperm, and 77% white cobs.
K2-Group 2 (n = 534) was most frequently represented by Ocho Corridas (n = 81), Diente de Caballo (n = 73), Camelia (n = 58), Cristalino Chileno (n = 51), and Araucano (n = 27). Among accessions with passport data, 77.4% were from Metropolitana, O’Higgins, Maule, Ñuble, Biobío and Araucanía Regions at a mean elevation of 293 m (range: 0–2518 m; median: 179 m). Among the 367 accessions with morphological records, ears were mainly cylindrical-conical (49%) or cylindrical (47%), grain texture was predominantly corneous/flint (56%), endosperm was most frequently orange (51%), and pericarp was predominantly colorless (98%). Breeding materials were more frequent in K2-Group 2 (23.2%, n = 124) than in K2-Group 1 (8.2%, n = 15). Mean within-group modified Rogers’ distance (MRD) was lower in K2-Group 1 than in K2-Group 2 (0.085 vs. 0.199).
At K = 6, Q ≥ 0.80 assigned accessions to only four groups and left 904 accessions (78.1%) classified as admixed. K6-Group 2 and K6-Group 6 had maximum Q values of 0.671 and 0.565, respectively (Figure 3B). Applying Q > 0.50 allowed assignments to all six groups and reduced the admixed set to 566 accessions (48.9%) (Table S4b). The resulting groups differed in racial composition, geographic distribution, and grain morphology:
- K6-Group 5 (n = 169) closely corresponded to the northern Andean group at K = 2. Among accessions with passport data, 92.0% were recorded in Arica y Parinacota, Tarapacá, and Antofagasta regions at a mean elevation of 2670 m. Grain was predominantly floury (90%) with white endosperm (93%).
- K6-Group 2 (n = 47) was dominated by Camelia (87%); its accessions were mainly from Coquimbo and Valparaíso Regions and had corneous grain (100%) and predominantly orange endosperm (97%).
- K6-Group 3 (n = 101) was dominated by Choclero (70%), with most accessions from Valparaíso and Metropolitana Regions and mixed grain characteristics (58% floury).
- K6-Group 4 (n = 205), the largest cluster, included Diente de Caballo (34%) and many accessions with unclassified or missing racial data. Accessions in Group 4 were collected mainly from the Metropolitana Region to the Maule Region and had semi-corneous grain (57%) and yellow endosperm (57%).
- K6-Group 6 (n = 12), the smallest cluster, was dominated by Ocho Corridas (92%). All accessions with passport data (n = 11) were from the southern Biobío and Araucanía Regions and grain was predominantly corneous (91%) with orange endosperm (91%).
- K6-Group 1 (n = 57) lacked a clear racial or geographic association. Morphological records were missing for 75% of its accessions, and breeding materials of undocumented origin predominated (72%, n = 41).
2.4. Hierarchical Cluster Analysis
Ward’s hierarchical clustering of the MRD matrix divided the 1157 accessions into three main clusters—A (n = 290), B.1 (n = 610), and B.2 (n = 257)—and six subclusters: A.1 (n = 124), A.2 (n = 166), B.1.1 (n = 295), B.1.2 (n = 315), B.2.1 (n = 44), and B.2.2 (n = 213) (Figure 4).
Figure 4.
Hierarchical dendrogram of the maize panel analyzed in this study, with branches colored according to genetic cluster membership inferred by STRUCTURE. (A) Branches colored by STRUCTURE K = 2 assignment (Group 1, red; Group 2, green). (B) Branches colored by STRUCTURE K = 6 assignment (Groups 1–6); labels indicate the main clusters (A, B.1, B.2) and subclusters (A.1, A.2, B.1.1, B.1.2, B.2.1, B.2.2). In both panels, a branch is colored only when all descendant accessions belong to the same genetic cluster; branches revert to grey when they merge with accessions assigned to a different cluster or with admixed accessions (grey).
Clustering corresponded closely with STRUCTURE assignments and principal coordinate analysis (PCoA) ordination. At the three-cluster level, Cluster A contained all accessions assigned to STRUCTURE K2-Group 1 and none assigned to K2-Group 2, while clusters B.1 and B.2 corresponded exclusively to subdivisions within STRUCTURE K2-Group 2. At the six-cluster level, all accessions in subcluster A.2 were assigned to STRUCTURE K6-Group 5, and 91% of those in subcluster B.2.1 were assigned to K6-Group 1. Cluster A had the most negative mean value on the first principal coordinate (PC1) (−0.0040) among the three main clusters, congruent with its distinct position along the first PCoA axis.
Across 100 locus-resampling bootstrap replicates, pairwise co-clustering stability was 99.4% and 100.0% for the two K = 2 STRUCTURE groups (Table S5). At K = 6, stability was 96.6% for the northern floury group, 93.1% for Ocho Corridas, 85.4% for Choclero, 78.5% for Camelia, and 74.9% for the Diente de Caballo group. The group associated with undocumented breeding materials showed lower stability (53.3%), in agreement with its heterogeneous genetic composition.
2.5. Principal Coordinates Analysis (PCoA)
The first three principal coordinates explained 11.18%, 5.81%, and 2.41% of the total genetic variation, respectively. All pairwise combinations were plotted, with accessions colored by their STRUCTURE assignments at K = 6 (Figure 5).
Figure 5.
Principal coordinate analysis (PCoA) of the 1157 accessions based on Rogers’ modified genetic distance. (A) PC1 (11.18%) versus PC2 (5.81%). (B) PC2 versus PC3 (2.41%). (C) PC1 versus PC3. In all panels, colors indicate the genetic clusters identified through STRUCTURE analysis at K = 6 (Q > 0.50), with the admixed group in grey.
The ordination corresponded closely with the STRUCTURE groups. The northern Andean floury-grain group (K6-Group 5) was clearly separated along PC1 (mean = −0.0052). K6-Group 1, K6-Group 6, and K6-Group 4—undocumented breeding materials, Ocho Corridas, and Diente de Caballo, respectively—occupied the opposite extreme with mean PC1 values of 0.0032, 0.0023, and 0.0019, while K6-Group 2 (Camelia) was near the center (0.0007). K6-Group 3 (Choclero) occupied an intermediate position (mean PC1 = −0.0026): 52% of its accessions fell between the ranges of K6-Group 5 and the remaining groups, 46% overlapped with K6-Group 5, and only 2% with the other groups (Figure 5). Accessions classified as Choclero by race (n = 114, including 25 breeding materials) likewise had an intermediate mean PC1 (−0.0019) between the northern races (−0.0053 to −0.0051) and the main central-southern races (0.0008 to 0.0021). This intermediate position was not observed along PC2 or PC3. K6-Group 1 separated distinctly along PC3 (mean = −0.0028). Admixed accessions occupied intermediate positions, consistent with their mixed ancestry.
PC1 was correlated with elevation (r = −0.82) and latitude (r = −0.83; n = 697 accessions with coordinates; p < 0.001 in both cases), reflecting the geographic and altitudinal gradient between the northern Andean highlands and central-southern valleys (Figure S5). In contrast, PC3 showed no association with elevation (r = 0.03), in accordance with its separation of breeding materials of undocumented provenance (K6-Group 1).
2.6. Population Distances
Pairwise fixation index (FST) was estimated among STRUCTURE groups at K = 2 and K = 6 and hierarchical clusters at the three- and six-cluster levels (HC-C3 and HC-C6), using the pool-size-weighted allele-frequency approach.
At K = 2, FST between STRUCTURE Groups 1 and 2 was 0.080 (Table 2). Among HC-C3 clusters, comparisons involving Cluster A showed greater differentiation (0.052–0.081) than B.1–B.2 (0.013), with the highest value for A–B.2 (0.081) (Table S6).
Table 2.
Pairwise FST among genetic groups identified through STRUCTURE analysis (K = 2 and K = 6), estimated using a pool-size-weighted allele frequency variance approach.
At K = 6, FST ranged from 0.011 between Groups 4 and 6 to 0.193 between Group 1 (undocumented breeding materials) and Group 5 (northern floury group). The second-highest value was between Group 4 (Diente de Caballo) and Group 5 (0.132). In agreement with its intermediate PCoA position, Group 3 was the least differentiated from Group 5 (0.050), compared with 0.081–0.193 for the other groups. Its differentiation from Groups 2, 4, and 6 was similarly low (0.049–0.053). Among HC-C6 subclusters, FST ranged from 0.008 for B.1.1–B.1.2 to 0.195 for A.2–B.2.1, following a pattern aligned with STRUCTURE (Table S6).
Analysis of molecular variance (AMOVA) detected significant differentiation in all three groupings tested (p ≤ 0.001). At K = 2, differences between groups accounted for 31.6% of total genetic variance, with 68.4% among accessions within groups. At K = 6 (Q > 0.50), these proportions were 26.4% and 73.6%, respectively. Pairwise AMOVA among the 22 standard landrace races (231 comparisons) revealed significant differentiation in 193 pairs (83.5%) after correction for multiple testing (false discovery rate (FDR), q < 0.05), with ΦST values ranging up to 0.540 (median 0.131) (Table S7). Of the 38 non-significant comparisons, 37 involved at least one race represented by fewer than 15 accessions. The only non-significant comparison between two races with at least 15 accessions each was Capio Chileno Chico vs. Capio Chileno Grande (ΦST = 0.006; q = 0.127). Four races (Araucano, Camelia, Cristalino Chileno and Diente de Caballo) were significantly differentiated from all other races.
2.7. Inference of Population Type and Race for Unclassified Accessions
Population type and race were inferred for the 46 accessions of unknown population type using the MRD-based k-nearest-neighbor (k-NN) approach (Tables S8 and S9). Population-type assignments were classified as high confidence for 43 accessions (93.5%), medium confidence for 2 (4.3%), and low confidence for 1 (2.2%). Across all confidence levels, 39 accessions (84.8%) were classified as landraces and 7 (15.2%) as breeding materials.
Race assignments were less confident among the 39 proposed landraces: 11 (28.2%) received high-confidence assignments, 22 (56.4%) medium-confidence assignments, and 6 (15.4%) low-confidence assignments. Among high-confidence assignments, eight were assigned to Diente de Caballo and one each to Camelia, Harinoso Tarapaqueño, and Maíz de Rulo. Across all confidence levels, Diente de Caballo was proposed for 21 of the 39 accessions. All medium-confidence assignments were consistent across k values but supported by fewer than 7 of the 10 nearest neighbors. The four Banco Base accessions, XBB29–XBB32, were consistently assigned to Harinoso Tarapaqueño across all k values, with high confidence for XBB32 and medium confidence for the other three.
2.8. Core Collection
The core collection comprised 231 accessions: 195 in the landrace stratum (188 landraces and 7 accessions of unknown type inferred as landraces) and 36 in the breeding-material stratum (34 breeding materials and 2 accessions of unknown type) (Table S10). All 41,912 alleles detected in the entire collection were retained. Mean GD and polymorphic information content (PIC) were 0.242 and 0.201, respectively, representing 95.9% and 96.5% of the full-collection values (0.253 and 0.208). Within strata, the landrace core retained 95.3% of GD and 95.9% of PIC, while the breeding-material core retained 100.0% and 99.9%, respectively.
All 22 standard races were represented. Thirteen included accessions selected during optimization in addition to their forced representative, most frequently Camelia (25 accessions), Curagua (23), Choclero (22 plus 1 unknown inferred as Choclero-medium confidence), Araucano (21), and Diente de Caballo (14 plus 3 unknown inferred as Diente de Caballo–medium confidence). Nine races were represented only by their forced accession: Capio Chileno Chico, Chutucuno, Harinoso Tarapaqueño, Limeño, Marcame, and Polulo, whose accessions were all assigned to the northern Andean group, together with Morocho Amarillo, Negrito Chileno, and Semanero. The four race-private alleles were retained, each carried by at least one accession of its own race.
The core covered 98.4%, 99.6%, and 100.0% of the ranges of PC1, PC2, and PC3, with core/collection variance ratios of 0.64, 0.92, and 1.02, respectively. The lower PC1 variance ratio reflects the reduced representation of the northern Andean group (STRUCTURE Group 1, K = 2; 6.1% of the core vs. 15.9% of the collection), half of whose core accessions were forced race representatives. Because these accessions occupy the negative extreme of PC1, their lower number reduced the variance along this axis even though 98.4% of its range was covered. Nevertheless, non-core northern Andean accessions were closer to their nearest core entry (mean MRD = 0.071) than central-southern or admixed accessions (0.144 in both cases), and the 14 northern Andean core accessions retained 96.2% of the GD of their group. However, they carried 80.0% of the alleles detected in the northern Andean group, compared with 99.2% for central-southern core accessions relative to their own group; the remaining alleles were retained in the core only through accessions of other groups. The distribution of core accessions within the genetic space of the collection is shown in Figure 6.
Figure 6.
Principal coordinate analysis (PCoA) based on Rogers’ modified genetic distance, showing the 231 accessions of the stratified core collection (colored symbols) within the entire germplasm collection (n = 1157; grey dots). Blue: landraces (n = 173) and red: breeding materials (n = 36) selected by Core Hunter 3; green triangles: race representatives forced into the core (n = 22).
The core included accessions from all 14 regions represented in the collection (Table S10). Among accessions with geographic coordinates, it covered the complete latitudinal (18.2° S–42.3° S) and longitudinal (67.9° W–73.7° W) ranges and nearly the entire altitudinal range (27–3660 m a.s.l.). Median latitude and elevation (35.5° S and 207 m) were close to those of the collection (35.3° S and 237 m). The largest regional contributions were Metropolitana (47 accessions), Valparaíso (23), La Araucanía (21), and Maule (20). Arica y Parinacota, Tarapacá, and Antofagasta together accounted for 13.3% of core accessions with regional data, compared with 17.7% in the collection. Arica y Parinacota (2.8% vs. 5.6%) and Tarapacá (4.4% vs. 8.0%) had lower representation, whereas Antofagasta had higher representation (6.1% vs. 4.1%). Eight of the 24 core accessions from these regions were forced race representatives.
Of the 36 breeding materials in the core, 28 had detailed passport records. These comprised 13 inbred lines derived from Chilean races—six Diente de Caballo, four Choclero, and three Camelia—one racial composite, eight advanced lines from the INIA La Platina breeding program, three segregating lines, and three international inbred lines introduced through the United States Department of Agriculture–Agricultural Research Service (USDA-ARS) North Central Regional Plant Introduction Station. The latter, Mo17, Oh43, and TZI 18, represented three of the five international lines present in the collection.
3. Discussion
3.1. The Chilean Maize Collection Within a Continental Framework of Racial Diversity
Chilean maize diversity reflects a broad environmental and cultural setting. The country spans over 30° of latitude and encompasses desert, semi-arid, Mediterranean, temperate rainy, and maritime climates, with maize cultivated across most of these environments. This climatic breadth is complemented by an altitudinal gradient of cultivation extending from sea level to above 3000 m. Historically, Atacameño, Diaguita, and Mapuche communities developed diverse culinary uses for maize, including roasted green ears, popcorn, fermented chicha, and lye-cooked muti [17,18]. This environmental and cultural breadth is reflected in the present collection, which represents 22 of the 23 Chilean races, from Harinoso Tarapaqueño and Capio Chileno Grande of the northern altiplano to the temperate, lowland-adapted Araucano and Ocho Corridas of south-central Chile.
The formal racial classification of Chilean maize began with the 19 provisional races described by Timothy et al. [17] and was subsequently refined, with 23 races recognized by Paratori et al. [19]. This national classification can also be viewed within the broader continental framework developed by Goodman and Bird [20]. Their analysis placed Chilean races in several racial complexes rather than a single cohesive group, providing a historical perspective on their differing affinities within Latin American maize. For example, Camelia, together with Curagua Grande, Cristalino, Araucano, and Dentado Comercial, was classified within the “Southern South American Races,” a complex resulting from the introduction and admixture of North American, European, and Mexican germplasm into southern Brazil, Uruguay, Argentina, and Chile; a pattern consistent with the historically documented introduction of exotic germplasm into Chilean breeding material [17].
Choclero, by contrast, was included in the Cravos group together with the Brazilian race Dente Riograndense Rugoso and the composite entry Cravo, which comprised Cravo Riograndense and Cravo Paulista. In describing this group, Goodman and Bird [20] noted its resemblance to the narrow-kernelled, shoepeg maize formerly cultivated in the southern United States and its historical presence in southern Brazil. They hypothesized that these corns originated partly from the Mexican race Pepitilla. This proposed relationship offers a historical context for Choclero’s distinct, intermediate genetic position relative to the other central-southern races in the present study. It remains a hypothesis, however, and does not establish Choclero’s ancestry or an independent introduction into Chile.
Capio Chileno Chico and Capio Chileno Grande were both placed by Goodman and Bird [20] within the central Andean complex, but remained separate entries under the authors’ minimum-distance criterion of 1.0. Their historical separation contrasts with the pairwise AMOVA in the present study, which detected no statistically significant genetic differentiation between them. Thus, the morphological distinction retained in the earlier classification was not accompanied by differentiation at the SNP markers examined here.
This continental perspective provides historical context for the primary genetic division recovered in the present study between a distinct northern Andean group and a more admixed central-southern complex. The races placed by Goodman and Bird in the central Andean complex, Capio Chileno Chico and Capio Chileno Grande, belong to the northern Andean genomic group, whereas those assigned to the Southern South American races, such as Camelia, Cristalino Chileno, Araucano and Curagua, belong to the central-southern group, and Choclero, placed in the Cravos group, occupies an intermediate position. This pattern is consistent with the heterogeneous composition of Chilean maize germplasm described in historical classifications and accounts of germplasm introductions and admixture.
3.2. Ecogeographic, Not Racial, Basis for the Primary Genetic Division
The primary division detected at K = 2 followed ecogeographic patterns more closely than racial classification. The northern Andean group comprised 184 accessions from 12 races, none accounting for more than 13% of its composition. Despite this racial diversity, accessions with available passport data were concentrated in the northernmost regions of Chile (86%), at a mean elevation of 2656 m. Morphological records likewise showed predominantly floury grain (89%) and white endosperm (92%). The central-southern group (n = 534), in contrast, was dominated by Ocho Corridas, Diente de Caballo, Camelia, Cristalino Chileno, and Araucano, with a lower mean elevation (293 m) and predominantly corneous grain and, most frequently, orange endosperm. The PCoA supported this division: PC1, which most clearly separated the groups, was strongly correlated with elevation (r = −0.82) and latitude (r = −0.83).
Earlier work on Chilean maize provides a complementary perspective on some of these racial affinities. Campbell et al. [18] analyzed grain samples from 306 Chilean lowland accessions using near-infrared transmittance spectroscopy (NITS), which captures chemical and physical grain properties rather than DNA variation. Their principal component analysis grouped Diente de Caballo, Camelia, Cristalino Chileno, and Semanero in one region of the ordination and Araucano and Ocho Corridas in another. For the latter pair, the authors interpreted spectral similarity as suggesting similar grain characteristics despite contrasting ear shapes. Several Choclero accessions were positioned relatively far from the origin of the NITS-based principal component analysis plot, and the authors also reported distinctive spectral patterns for this race. These observations complement the morphological relationships described by Goodman and Bird [20] and the genomic affinities recovered here. Because the NITS study examined lowland accessions, this correspondence concerns relationships within that germplasm rather than a direct test of the Andean–central-southern division.
The distinction between racial identity and genomic structure also appears in other American maize collections. In Mexico, Arteaga et al. [21] found that genomic variation was better explained by the interaction of altitude and latitude than by race. Caldu-Primo et al. [22] could distinguish the five Mexican races examined only after selecting highly differentiated SNPs, whereas the complete marker set did not clearly separate them. In the Peruvian Andes, Arbizu et al. [12] reported that races did not form monophyletic groups, with genetic clusters more closely related to the chronological and geographic origins of the germplasm. These studies show that morphological racial distinctions do not consistently correspond to the principal patterns of genomic variation. In the Chilean collection, the strongest pattern was the geographic and altitudinal contrast between northern Andean and central-southern accessions.
Within this broader pattern, Choclero occupied an intermediate position along PC1 between the northern floury group and the remaining central-southern groups. Two historical scenarios could account for this position, and they need not be mutually exclusive. Choclero may indicate gene flow or shared ancestry between northern and central-southern maize, or it may have a distinct introduction and diversification history. Its marked spectral differentiation in Campbell et al. [18] and its placement in the Cravos group by Goodman and Bird [20], discussed in Section 3.1, provide context for the second possibility. Neither observation establishes its ancestry, however. Distinguishing these scenarios requires broader comparative analyses that include Chilean germplasm and potentially related Mesoamerican and South American populations.
Because each accession was genotyped as a DNA pool, the membership coefficients estimated by STRUCTURE describe the average ancestry of the plants contributing to each bulk rather than that of a single diploid individual. A pool combining plants of different ancestry, or derived from a population with intermediate allele frequencies, may therefore appear admixed even if no individual plant is. The extensive admixture at K = 6, where 78.1% of accessions did not reach Q ≥ 0.80, may thus partly reflect within-accession heterogeneity and pooled representation, in addition to gene flow among central-southern races and their weak differentiation (pairwise FST = 0.011–0.053 among K = 6 Groups 2, 3, 4 and 6). In contrast, all 184 accessions of the northern Andean group were assigned to a single K = 6 cluster (median maximum Q = 0.986), indicating that pooling did not by itself generate admixture. We therefore regard the primary division and the main K = 6 groups, which were stable across independent runs and congruent with PCoA and hierarchical clustering, as robust, and interpret individual admixture proportions and finer-scale ancestry as approximate.
The magnitude of differentiation between the northern Andean and central-southern groups appears different when expressed as pool-size-weighted FST (0.080) or as the proportion of variance among groups in AMOVA (31.6%) because the two statistics refer to different totals. FST divides the variance in allele frequencies among groups by the total gene diversity, which in a pooled design includes the polymorphism present within each bulk. AMOVA treats each accession as a unit and partitions the variation among accessions, so within-bulk polymorphism is not part of its denominator. Partitioning the total gene diversity at K = 2 showed that 8.0% was found among groups, 37.8% among accessions within groups and 54.2% within accessions. Excluding the within-accession component raised the among-group proportion to 0.175. The remaining difference arises from the AMOVA variance-component estimator—which, for two groups of unequal size, yields an among-group component about 2.6 times larger than the weighted variance of group allele frequencies used for FST (ΦST = 0.367 with the same 0/0.5/1 coding)—and, to a lesser extent, the use of allele presence or absence in the BIO-R distance (ΦST = 0.316). With six groups, the two statistics were closer (FST across the K = 6 groups = 0.137; AMOVA, 26.4%). The two analyses are therefore consistent. The northern Andean and central-southern groups are significantly and moderately differentiated (FST of 0.080 with the 0/0.5/1 coding and 0.107 with read-based within-pool frequencies), and this division was stable across STRUCTURE runs and congruent with PCoA and hierarchical clustering. Nevertheless, most of the genetic diversity of the collection resides within groups and accessions rather than between the two groups, which is consistent with differentiation within a shared gene pool rather than isolation.
3.3. Diversity of Landraces and Breeding Materials: Biological Signal and Genotyping Design
Landraces showed higher genetic diversity than breeding materials for all indices calculated from the operational 0/0.5/1 coding, although the magnitude of this difference depended strongly on the metric considered and, for frequency-based indices, on how heterozygous pooled calls were represented. Previous studies have highlighted maize landraces as sources of allelic variation not fully represented in breeding materials [7,23]. The contrast was also evident in allele distribution: among the 20,956 SNPs analyzed, 459 alternative alleles (2.2%) were detected exclusively in landraces, compared with only one in breeding materials. These results indicate that landraces constitute the principal reservoir of genetic variation within the collection and contain allelic variation not detected in its improved germplasm.
The contrast between metrics clarifies the nature of this difference. Heterozygous calls were more than twice as frequent in landraces as in breeding materials (0.292 vs. 0.123), whereas frequency-based indices were only 10–14% higher in landraces (GD, 0.254 vs. 0.227; Shannon, 0.400 vs. 0.362; MAF, 0.180 vs. 0.158). In a pooled-DNA design, a heterozygous call indicates polymorphism within a bulk, whereas frequency-based indices mainly show diversity among accessions. The large difference in Ho therefore largely indicates the greater internal homogeneity of breeding materials, many of them inbred lines or derived from them, instead of an equivalent loss of allelic diversity, consistent with the 97.8% of SNPs shared between germplasm types. For the same reason, Ho from DNA bulks should not be interpreted as individual heterozygosity, and its exceeding GD in landraces reflects within-bulk polymorphism rather than an excess of heterozygous individuals.
Because heterozygous calls in DNA pools were coded as 0.5, frequency-based indices assume an intermediate allele frequency within each polymorphic bulk. We tested this assumption using within-pool allele frequencies estimated from DArTseq read counts (Table S11). At heterozygous calls, which accounted for 27.4% of non-missing data, the median within-pool frequency of the alternative allele was 0.33, and only half of these calls (49.7%) had frequencies between 0.25 and 0.75. With read-based frequencies, GD was similar in landraces and breeding materials (0.203 vs. 0.212), as were MAF and H. The higher frequency-based diversity of landraces under the 0/0.5/1 coding therefore arises largely from the treatment of their more frequent heterozygous calls. In contrast, the proportion of heterozygous calls and the exclusive alleles do not depend on frequency estimation, so the main distinction between germplasm types lies in within-accession polymorphism and in alleles restricted to landraces rather than in overall allele-frequency diversity. Genetic distances, PCoA, LD decay and the relative differentiation among STRUCTURE groups were robust to the coding, although FST values were on average about 30% higher with read-based frequencies (Table S11). Read-based frequencies are themselves imprecise estimates, limited by sequencing depth (median of 24 reads at heterozygous calls), and frequency-based estimates from pooled samples should be interpreted with this limitation in mind.
Part of the remaining difference, however, may reveal variation in sampling and genotyping performance. Breeding material accessions were represented by smaller DNA bulks on average (21.0 plants) than landraces (26.4 plants, with most represented by 30 plants) and showed a higher proportion of missing genotype calls (14.2% vs. 4.2%). Smaller bulks may reduce the representation of within-accession allelic variation and, together with differences in sequencing coverage, could contribute to lower diversity estimates, particularly for Ho, which depends directly on the detection of both alleles within each bulk. Therefore, although the greater within-accession polymorphism and larger number of exclusive alleles in landraces support a biological difference between germplasm types, its magnitude should be interpreted with some caution, and frequency-based comparison between germplasm groups in pooled genotyping designs depends on how within-pool allele frequencies are represented. A comparable pattern was observed between the 11,698 chromosome-anchored SNPs and the 9258 markers that could not be anchored—the latter showing higher diversity and less missing data—plausibly because unanchored probes originate from repetitive or structurally complex genomic regions that remain less fully resolved in the B73 reference assembly [24].
The diversity observed in the Chilean collection is broadly consistent with SNP-based estimates reported for American maize landraces. Gene diversity values of approximately 0.31 were reported for Mexican landraces genotyped with the MaizeSNP50 array [21], whereas values of 0.33–0.36 have recently been reported for Peruvian highland maize using genotyping-by-sequencing [12,25]. Direct numerical comparisons should nevertheless be treated cautiously because these studies differ in diversity metrics, marker platforms, filtering criteria, and sampling strategies. In addition, the Chilean values reported here are based on the 0/0.5/1 coding; read-based frequencies yielded lower values (GD = 0.207 for the entire collection (Table S11). Higher diversity estimates obtained with simple sequence repeat (SSR) markers in American maize collections (e.g., [6]) are also expected given the greater per-locus information content of multiallelic microsatellites relative to biallelic SNPs.
Guo et al. [26] provide an additional comparison based on pooled leaf tissue from multiple plants per accession and reduced-representation SNP genotyping. Their analysis of 244 Chinese maize landraces using specific-locus amplified fragment sequencing (SLAF-seq) retained 144,650 SNPs after filtering (MAF > 0.05 and missing data < 50%) and yielded mean heterozygosity and Shannon index values of 0.15 and 0.50, respectively, compared with 0.292 and 0.400 in the Chilean landraces. However, differences in sequencing platform, bulk size, marker filtering, and, particularly, the higher missing-data rate reported by Guo et al. (0.44) preclude a direct biological interpretation of these numerical differences. Overall, comparisons across studies support substantial genetic diversity in the Chilean landraces, while emphasizing that diversity estimates obtained from pooled SNP data should be interpreted in the context of the specific sampling and genotyping strategy used.
3.4. Racial Differentiation and Private Alleles
Among the 22 standard races, only four of the 20,956 SNPs carried race-private alleles. This scarcity should be interpreted in light of marker filtering and unequal race representation. Because the MAF ≥ 0.01 filter was applied to the entire panel (2314 allele copies), a minor allele required approximately 24 copies to be retained. Consequently, the eight races represented by fewer than 12 accessions (33 accessions in total) could not reach this threshold on their own, reducing the probability of detecting private alleles regardless of their genetic distinctiveness. This is in accordance with sampling theory showing that the detection and retention of rare alleles are strongly dependent on sample size [27].
Despite the scarcity of private alleles, pairwise differentiation revealed considerable race-level structure: 193 of the 231 race comparisons (83.5%) were significant after FDR correction (q < 0.05), and Araucano, Camelia, Cristalino Chileno, Diente de Caballo, Maíz de Rulo, and Ocho Corridas differed significantly from nearly all other races. Among the non-significant comparisons, Capio Chileno Chico versus Capio Chileno Grande was particularly informative because both races had comparatively adequate representation (n = 16 and 26, respectively) but showed negligible differentiation (ΦST = 0.006, q = 0.155). As these races are traditionally distinguished primarily by ear and kernel size, their genomic similarity suggests that their morphological differentiation may not correspond to substantial genome-wide differentiation. Most other non-significant comparisons involved at least one race represented by fewer than 15 accessions, making limited statistical power an important consideration.
The influence of marker selection and sampling on racial differentiation has also been observed in Mexican maize, where races that were poorly separated using the complete SNP dataset became distinguishable using highly differentiated markers [22]. At the aggregate level, AMOVA attributed 13.3% of total genetic variance in the Chilean collection to differences among races, compared with 4.52% reported for Peruvian highland maize [12]. Although this indicates race-level structure in the Chilean collection, direct numerical comparison should consider differences in sampling, marker systems, and analytical approaches among studies.
3.5. Rapid Linkage Disequilibrium Decay in the Chilean Maize Landrace Collection
LD in the Chilean landraces declined rapidly, with mean r2 already below 0.10 in the first 100 bp interval. This value, however, depends on the genotyping strategy and marker composition. Low-frequency SNPs limit the attainable r2; most pairs in the shortest interval were SNPs within the same DArTseq tag, and adjacent anchored markers were separated by a median of 35 kb. With SNPs of MAF ≥ 0.10, mean r2 fell below 0.10 between 100 and 1000 bp, and, with read-based within-pool frequencies, it fell to between 1 and 2 kb (Table S2). Moreover, because each accession is a DNA pool, r2 describes a composite association of allele frequencies among accessions rather than haplotypic LD within individuals. The decay distance can therefore only be bracketed at approximately 0.1–2 kb, and resolving it more precisely would require denser markers or resequencing of individual plants. The observed pattern nevertheless indicates that LD extends over relatively short physical distances in this germplasm.
Rapid decay has also been reported in other diverse maize panels. Tenaillon et al. [28], using sequence data from exotic landraces and U.S. inbred lines, found that intragenic LD generally declined within approximately 100–200 bp. Guo et al. [26] reported a decay distance of 0.98 kb at r2 = 0.10 for a panel comprising 244 Chinese landraces and seven reference inbred lines. These studies provide context for the short-distance LD observed here, although differences in sampling, genotyping platforms, marker density, and estimation methods limit direct numerical comparisons.
The Chilean pattern is in agreement with the predominantly outcrossing mating system of maize, in which repeated recombination and gene flow can reduce associations between neighboring loci. It may also reflect the historical processes of gene flow, recombination, and diversification represented in the collection. LD patterns alone, however, cannot establish the relative contribution of these processes.
From a practical perspective, rapid LD decay has to be considered in future studies using this germplasm, e.g., genome-wide association studies. Short-distance LD means that each marker represents a comparatively small surrounding genomic region. Detecting associations with traits of interest would therefore likely require denser marker coverage than that used to characterize diversity and population structure. The present findings can inform marker-density decisions for such studies, while the unresolved decay distance limits how precisely those requirements can be specified.
3.6. Genetic Inference as a Tool for Resolving Incomplete Passport Data
Incomplete passport records limit the characterization and use of conserved germplasm. In the Chilean collection, 46 accessions lacked population-type classification, including long-conserved Banco Base materials identified by XBB codes. Genetic nearest-neighbor inference provided high-confidence population-type assignments for 43 accessions (93.5%). Across all confidence levels, 39 were classified as landraces (84.8%) and seven as breeding materials (15.2%). Race assignments were less conclusive: only 11 of the 39 proposed landraces (28.2%) received a high-confidence assignment. This contrast suggests that genomic information was more effective for resolving broad germplasm categories than individual races, consistent with the unequal representation of some races in the collection.
These findings illustrate how genomic characterization can complement passport and phenotypic information, an application emphasized in genebank research [29] and increasingly relevant to the characterization and use of maize collections [12]. Its value lies in providing additional evidence for accessions whose documentary history is incomplete.
The XBB29–XBB32 accessions provide a specific example. All ten nearest neighbors supported their classification as landraces, and this assignment remained consistent across the three k values. Their proposed race was likewise consistently Harinoso Tarapaqueño, although only XBB32 reached high confidence at that level. The analysis therefore provided strong support for population type and a plausible racial affiliation for these long-conserved materials. Such assignments can guide documentary and morphological curation, but should remain working classifications subject to evaluation as additional passport, morphological, or genomic evidence becomes available.
3.7. Composition and Representativeness of the Core Collection
The core collection combined SNP-based optimization with stratification by population type and mandatory inclusion of one accession per standard race. These complementary criteria balanced the capture of genetic variation with the retention of distinct germplasm components, including races that might otherwise have been omitted because of their limited representation. This approach is consistent with recommendations to combine grouping criteria with genetic information when constructing core collections [27,30] and with marker-based stratified sampling strategies evaluated in maize [31].
Representativeness was also assessed through the coverage of the collection’s genetic space in the PCoA. Comparing the ranges retained along the first three coordinates provided a criterion for selecting among the tested core configurations. Their broad coverage indicates that the selected subset retained the extent of variation described by these coordinates, although it does not imply that the density of the original point cloud was reproduced. Retention of GD and PIC, neither used as an optimization objective, provided complementary evidence of the core’s representativeness. These measures describe genomic representativeness; agronomic and adaptive traits were not evaluated.
The core should nevertheless be evaluated along three distinct dimensions. Allele retention was complete and diversity indices were largely preserved (≥95% of GD and PIC), whereas population structure was represented less proportionally. This outcome is consistent with the purpose of a core collection, which is to represent the genetic diversity of the collection with a minimum of redundancy [30]. Under diversity-based criteria such as allele coverage and accession-to-nearest-entry distance, the number of entries drawn from a group depends on its diversity rather than its size [30], so homogeneous groups receive fewer entries than under proportional sampling. Accordingly, the lower proportion of northern Andean accessions reflects the genetic homogeneity of this group: the accession-to-nearest-entry objective covered it with few entries, its non-core accessions remained closer to the core than those of other groups, and mandatory race representatives preserved its racial coverage. However, about one-fifth of the alleles present in northern Andean accessions are represented in the core only by accessions of other groups, that is, outside their highland genetic background. Because multilocus combinations associated with highland adaptation may therefore be less well represented, the core complements rather than replaces the full collection, which remains the reference for conserving northern Andean germplasm [30]. Within the breeding-material stratum, the core retained both germplasms derived from Chilean races and introduced international lines. These features support the value of combining genetic optimization with explicit representation criteria to obtain a manageable subset that preserves the collection’s principal components of diversity.
3.8. Conservation Value and Breeding Use of the Collection
The Chilean maize collection maintains germplasm that has contributed to national breeding. Since the early 1970s, Chilean maize germplasm has supported the development of open-pollinated varieties and hybrids, including Choclero Platina, MA-3, MA-4, MA-6, MA-7, INIA-8, INIA-9, INIA 140, INIA 150, INIA 160, Choclero INIA 110, and Camelia INIA 145 [32,33,34,35]. These examples connect the diversity maintained in traditional maize populations with its practical application in crop improvement.
This contribution developed alongside a significant transformation of maize production in Chile. By the late 1980s, approximately 85% of the maize area was planted with hybrid seed. Open-pollinated varieties such as Camelia, Curagua, Ocho Corridas, and Araucano nevertheless remained in cultivation, although some were already considered scarce in the main maize-producing regions [36,37]. Conservation therefore preserves access to germplasm that became less prominent in commercial agriculture. Its potential remains relevant in a broader continental context, where only a fraction of Latin American maize racial diversity has historically been incorporated into breeding programs [20].
The genomic characterization presented here provides a basis for more informed management of these resources. Information on genetic differentiation and relationships among accessions can support conservation decisions by identifying distinct components of the collection and guiding the selection of material for further evaluation. The core collection translates this information into a manageable, non-redundant subset that retains all detected alleles and all standard races, prioritizing the conservation of the collection’s diversity. Because it concentrates this diversity in a small number of accessions, it can also serve as an entry point for phenotypic characterization, while the full collection remains the reference for conservation and accessing specific germplasm.
The breeding materials add a further link between conservation and use. They include inbred lines derived from Chilean races, reflecting the historical incorporation of local germplasm into breeding, together with international lines that broaden the genetic backgrounds available. Their inclusion in the core conserves these distinct materials together with the landraces. Although genomic diversity alone does not establish agronomic value, it can guide the choice of genetically distinct material for assessing traits of interest, supporting both conservation planning and the exploration of the collection’s value for breeding programs.
4. Materials and Methods
4.1. Plant Material
The Chilean national maize germplasm collection is maintained by the Instituto de Investigaciones Agropecuarias (INIA) at the INIA La Platina Germplasm Bank, with a safety duplicate at the INIA Vicuña Base Germplasm Bank. It comprises 1519 accessions: 1468 from Chile, 21 from other countries, and 30 of unknown origin. By germplasm type, these include 975 landraces, 448 breeding materials, and 96 accessions of unknown type. A total of 1303 accessions were selected for genotyping.
4.2. Plant Sampling and DNA Extraction
Seeds from 1303 maize accessions were sent to the Genetic Analysis Service for Agriculture (SAGA) at the International Maize and Wheat Improvement Center (CIMMYT), Texcoco, Mexico, for DNA extraction and genotyping. For each accession, 30 seeds were germinated under greenhouse conditions, and leaf tissue was collected after two weeks by pooling material from the available seedlings. The number of individuals contributing to each bulk ranged from 1 to 30 plants (Table S10). Thirty-plant bulks accounted for approximately 64% of the panel and single-plant samples for 0.5%. Samples were lyophilized, and genomic DNA was extracted in 96-well-plate format using the CIMMYT-modified cetyltrimethylammonium bromide (CTAB) protocol [38]. DNA quality and concentration were assessed by electrophoresis on 1% agarose gels. Of the 1303 accessions submitted, 133 were not genotyped because of germination failure or low DNA quality.
4.3. DArTseq Genotyping
A total of 1170 accessions were successfully genotyped using high-density DArTseq at SAGA (CIMMYT), generating approximately 2 million sequencing reads per accession. For library preparation, 25 μL of genomic DNA at 100 ng/μL per accession underwent complexity reduction using PstI and HpaII restriction enzymes. The resulting fragments were ligated to adapters containing sample-specific barcodes for accession identification after sequencing. Fragments were then amplified by PCR, and equimolar amounts of the polymerase chain reaction (PCR) products were pooled to prepare sequencing libraries. The libraries were purified, quantified, and sequenced on an Illumina NovaSeq 6000 platform (Illumina Inc., San Diego, CA, USA) according to the DArTseq protocol (Diversity Arrays Technology sequencing) [15,39,40,41].
4.3.1. Raw Read Quality Control and Variant Calling
Raw DArTseq reads were processed by the SAGA bioinformatics platform (CIMMYT) using its standard workflow. Reads were assessed for quality, trimmed to remove adapters and low-quality bases, and demultiplexed using sample-specific barcodes. Variant calling was performed with the proprietary reference-independent DArTsoft14 pipeline, which generates SNP and SilicoDArT markers [42]; only SNPs were used in this study. SNP-containing sequence tags were then aligned to the maize B73 RefGen_v4 genome [24] using Bowtie2 v2.5.5 [43], and markers without a unique alignment were retained as unmapped.
4.3.2. Quality Filtering Criteria
Following variant calling, SAGA (CIMMYT) delivered a processed marker matrix comprising 109,824 SNPs. Additional filtering was performed in R v4.5.2 using dartR v2.9.9.5 [44] to obtain a high-confidence dataset for genetic diversity analyses. Markers with ≥20% missing data or a minor allele frequency (MAF) <0.01 were excluded, as were accessions with ≥25% missing data across loci. No filtering based on Hardy–Weinberg equilibrium was applied because deviations are expected from population subdivision, partial inbreeding, and pooled sampling, and filtering could remove informative biological signals instead of technical artifacts.
After filtering, the dataset comprised 20,956 unimputed SNPs from 1157 accessions (13 of the 1170 genotyped accessions were removed for exceeding the missing data threshold): 939 landraces representing 22 of the 23 Chilean maize races, 172 breeding materials, and 46 accessions of unknown germplasm type. Regarding geographical origin, 1116 accessions (96.5%) originated from Chile, 16 from the United States, one from Mexico, and one from Nigeria; 23 had unknown origin. The study panel represents the broad geographical distribution of the national collection and includes accessions collected in Chile between 1939 and 2020. The geographical distributions of the national collection and study panel are shown in Figure 7, and detailed passport and germplasm information is provided in Table S10.
Figure 7.
Geographic distribution of the Chilean national maize germplasm collection and the genotyped study panel: genotyped panel (blue), accessions not genotyped (light gray), sites containing both genotyped and non-genotyped accessions (blue–gray). Circle size is proportional to the number of accessions recorded at each collection site (1–4, 5–9, or ≥10 accessions).
4.4. Genetic Diversity Analysis
Marker-level genetic diversity was assessed across the 20,956 quality-filtered SNPs using R [45]. Minor allele frequency (MAF), gene diversity (GD), proportion of heterozygous calls (Ho), the Shannon–Wiener diversity index (H), and the percentage of missing data were calculated for each marker. H and GD were calculated as:
where pi is the frequency of the ith allele at a given locus and k is the number of alleles (k = 2 for biallelic SNPs). These parameters were calculated for the entire collection and separately for the landrace and breeding-material subsets, with mean values obtained across loci for each group.
For these indices, genotype calls were coded as 0, 0.5 and 1 (homozygous reference, heterozygous and homozygous alternative) so that heterozygous calls in DNA pools were treated as an intermediate allele frequency. To assess the sensitivity of the results to this assumption, within-pool allele frequencies were also estimated from the DArTseq read-count file of the same genotyping run as the number of reads carrying the alternative allele divided by the total number of reads, after summing the technical-replicate columns of each accession. The presence or absence of reads for each allele reproduced the genotype calls exactly, so only heterozygous calls differed between codings. Diversity indices, pool-size-weighted FST among STRUCTURE groups, MRD and PCoA, and LD in the landrace subset were recalculated with read-based frequencies and compared with those obtained with the 0/0.5/1 coding (Table S11).
Private alleles were identified among the 22 standard races within the landrace subset, using passport information for racial assignments. An allele was considered private when detected in one or more accessions of a race and absent from all accessions of the other 21 races. Landraces of unknown or non-standard race and breeding materials were excluded. Counts were obtained without correction for unequal race sample sizes, and detection was conditional on the marker filtering criteria applied to the entire collection.
4.5. Linkage Disequilibrium Analysis
Linkage disequilibrium (LD) was estimated among the 939 landrace accessions using the 11,698 SNPs with valid physical positions on B73 RefGen_v4, out of the 20,956 quality-filtered markers. The analysis was restricted to landraces to reduce the effect of genetic differentiation between germplasm types on LD estimates, given their potentially different allele frequencies and breeding histories. Pairwise LD (r2) was calculated in Python v3.12.16 (NumPy v2.4.4 and SciPy v1.17.1). LD was computed as the squared Pearson correlation between SNP dosage values (0, 0.5 and 1) across landrace accessions, with missing values replaced by the locus mean. Because each accession is a DNA pool, r2 describes a composite, population-level association of allele frequencies rather than haplotypic LD within individuals. Only SNP pairs located on the same chromosome and separated by ≤1 Mb were considered.
The relationship between pairwise r2 and physical distance was initially examined to determine the scale of LD decay and define a variable-width binning scheme. Narrower intervals were used at short distances, where r2 declined most strongly, and wider intervals at greater distances, where it approached background levels. Mean r2 was calculated for all SNP pairs within each distance bin. For descriptive purposes, LD decay was defined as the physical distance at which mean r2 first decreased below 0.10. To assess the influence of low-frequency markers and the coding of heterozygous pooled calls, the analysis was repeated with SNPs having MAF ≥ 0.10 in the landrace subset, using both the 0/0.5/1 coding and read-based within-pool allele frequencies.
4.6. Population Structure
Population structure was assessed using STRUCTURE v2.3.4 [46], under an admixture model with correlated allele frequencies and no prior population information. Although computationally demanding for large genome-wide datasets, STRUCTURE was selected for its full Markov chain Monte Carlo (MCMC) estimation of accession admixture proportions and the ability to assess solution consistency across independent runs [47]. Values of K from 1 to 22 were tested, with 10 independent runs per K, each comprising 10,000 burn-in iterations followed by 50,000 MCMC iterations. Evanno’s ΔK method [48], implemented in STRUCTURE HARVESTER 0.6.93 [49], was used to identify the most likely number of genetic clusters.
For the K values corresponding to the primary and secondary ΔK peaks, accession assignments were based on the run with the highest mean log-likelihood among the 10 replicates. At K = 2, accessions with a membership coefficient (Q) ≥ 0.80 for a single cluster were assigned to that cluster; the remainder were classified as admixed. At K = 6, because members of some clusters did not reach Q ≥ 0.80, accessions were assigned to the cluster with the highest membership coefficient if Q > 0.50; the remainder were classified as admixed. Consistency of membership estimates among the 10 runs was assessed at K = 2 and K = 6 after aligning the cluster labels of each run to those of the reported run by testing all label permutations. Similarity between runs was quantified with the symmetric similarity coefficient H′ [50], and the proportion of accessions receiving the same assignment in all runs was calculated (Table S3).
4.7. Genetic Distance and Clustering
Pairwise Rogers’ modified genetic distance (MRD) [51] was calculated across the 20,956 quality-filtered SNPs in BIO-R v3.2 [52]. The distance was computed from the presence or absence of each allele (reference and alternative) in each pool, so it does not assume any within-pool allele frequency; the resulting matrix corresponds to the squared MRD. Hierarchical cluster analysis was performed using Ward’s minimum variance method ([53,54]; hclust(), R, method = “ward.D2”). The dendrogram was cut into three and six groups for comparison with STRUCTURE at K = 2 and K = 6, respectively. At K = 2, correspondence was assessed by mapping assignments because the two approaches yielded different numbers of groups. The dendrogram was visualized as a circular cladogram in Python v3.11.2 (Matplotlib 3.11.2), with branches colored by STRUCTURE group only where all descendant accessions shared the same assignment.
Cluster robustness was assessed by a locus-resampling bootstrap implemented independently in Python v3.12.16 (NumPy v2.4.4; SciPy v1.17.1). In each of 100 replicates, the 20,956 SNPs were resampled with replacement, converted to allele dosage (0, 0.5, 1; missing calls imputed by locus mean), and used to recompute the pairwise distance matrix and Ward dendrogram (scipy.cluster.hierarchy.linkage, method = “ward”). Each bootstrap dendrogram was cut into three or six clusters (scipy.cluster.hierarchy.fcluster, criterion = “maxclust”). For accession pairs sharing a STRUCTURE group at the corresponding K, stability was measured as the percentage of replicates in which they remained together. This co-clustering measure was used instead of node-support statistics, which are poorly suited to datasets exceeding 1000 accessions.
4.8. Principal Coordinate Analysis
Principal coordinate analysis (PCoA) was performed on the pairwise Rogers’ modified genetic distance (MRD) matrix to visualize genetic relationships among accessions. The proportion of variation represented by each principal coordinate was calculated in GenAlEx 6.51b2 [55]. Accessions were plotted along the first three principal coordinates, and their distribution was compared with the groups identified by STRUCTURE and Ward’s hierarchical cluster analysis.
4.9. Genetic Differentiation Analysis
Genetic differentiation among STRUCTURE groups was assessed using pairwise FST, which quantifies the proportion of total genetic variation attributable to differentiation among groups [56]. A study-specific variance-partitioning procedure accommodated the pooled samples of 1–30 plants per accession. SNP calls were converted to dosage values of 0, 0.5, or 1 and used as operational proxies for bulk-level allele frequencies. Accessions were weighted by the number of plants contributing to each bulk when calculating allele-frequency variance among and within groups:
where p is the bulk-level allele frequency at locus l, Varw is the variance among groups weighted by the number of plants per bulk, and p̄l is the weighted mean allele frequency across all bulks. The numerator and denominator were summed across loci before division, which avoids the instability of per-locus ratios at SNPs with low minor allele frequency. The procedure was implemented in Python v3.12.16 (NumPy v2.4.4) across all 20,956 quality-filtered SNPs and also applied to hierarchical clusters to compare differentiation between the two clustering approaches. To compare FST with AMOVA, the total gene diversity p̄(1 − p̄) was partitioned, with the same bulk-size weights, into components among groups, among accessions within groups, and within accessions (the weighted mean of p(1 − p) across bulks), each summed across loci.
Analysis of Molecular Variance (AMOVA [57]) was performed for STRUCTURE groups at K = 2 (Q ≥ 0.80; n = 718) and K = 6 (Q > 0.50; n = 591) and for the 22 standard races within the landrace subset (n = 759). Admixed accessions were excluded from the STRUCTURE-based analyses. AMOVA was implemented in Python v3.12.16 (NumPy v2.4.4), using the pairwise distance matrix calculated in Bio-R, which corresponds to the squared MRD, to partition variation among groups and among accessions within groups and calculate ΦST. This analysis did not incorporate bulk-size weighting; because it partitions variation among accessions, its among-groups proportion is not directly comparable in magnitude to the weighted FST estimates.
Statistical significance of the among-group variance component was assessed by comparing the observed ΦST against a null distribution generated from 999 random permutations of group labels among accessions, with the resulting p-value corresponding to the proportion of permuted ΦST values equal to or exceeding the observed value (including the observed value itself). Pairwise differentiation between races (231 comparisons) was assessed within the same AMOVA framework, with significance determined by 9999 permutations per pair; p-values were adjusted for multiple testing using the false discovery rate (FDR) procedure of Benjamini and Hochberg [58].
4.10. Nearest-Neighbor Classification of Unclassified Accessions
Population type and race were inferred for the 46 accessions of unknown population type using the pairwise MRD matrix calculated in BIO-R. For each unclassified accession, accessions of known population type were ranked by increasing MRD (numpy.argsort; Python v3.12.16, NumPy v2.4.4), and population type was assigned by majority vote among the k nearest neighbors. Race inference was performed only for accessions proposed as landraces, using the same neighbor set. Neighbors recorded as “Unknown” or “No Clasificable” for race were retained but did not contribute race votes; support was therefore always expressed relative to k.
The procedure was repeated with k = 3, 5, and 10. Confidence was determined by two criteria: consistency of the proposed category across all three k values and support from at least 70% of the neighbors at k = 10. Assignments meeting both criteria were classified as high confidence, those meeting one as medium confidence, and those meeting neither as low confidence and interpreted cautiously. Support from fewer than two neighbors at k = 10 resulted in low confidence regardless of the other criteria. When assignments differed across k values, the category supported at k = 10 was retained.
4.11. Development of the Core Collection
To conserve the collection’s diversity with minimal redundancy, a core collection of 231 accessions (20% of the collection [31]) was developed from the 1157 genotyped accessions using the R v4.5.2 package corehunter (Core Hunter 3 [59]), based on the 20,956 quality-filtered SNPs in biparental format. Sampling was stratified by population type, with the 46 accessions of unknown type assigned according to their k-NN inferred classification. Core positions were allocated proportionally: 195 from the landrace stratum (978 accessions) and 36 from the breeding-material stratum (179 accessions). Core Hunter was run independently within each stratum.
One accession per standard race was forced into the landrace core using the always-selected option to ensure representation of all 22 races. Representatives were chosen by passport status (typical > similar > mixed > hybrid) and then by the lowest mean MRD to other accessions of the same race. Ties were resolved by the lowest proportion of missing data.
Two objectives were combined: Coverage (CV), which maximizes the proportion of alleles retained, and Accession-to-Nearest-Entry distance (AN; Modified Rogers distance), which minimizes the distance between each accession of the collection and its closest accession in the core. Objectives were normalized and weighted 0.3 for CV and 0.7 for AN. This configuration provided the most complete overall coverage of the first three PCoA coordinate ranges among the configurations tested, including: CV/EN (Entry-to-Nearest-Entry distance) 0.7/0.3, CV/AN 0.3/0.7, CV/AN/EN 0.2/0.4/0.4, and CV/AN 0.5/0.5. Searches were run with a fixed random seed and terminated after 2000 steps without improvement. This stopping rule ended the search only after a prolonged period without improvement of the objective function; under it, allele coverage reached its maximum value (all alleles retained).
Retained genetic diversity was evaluated using polymorphic information content (PIC) and Nei’s gene diversity (GD), neither of which was included as an optimization objective. Both indices were averaged across the 20,956 SNPs and compared between the core and the entire collection.
5. Conclusions
This study provides the first genomic characterization of the Chilean national maize germplasm collection, revealing substantial genetic diversity preserved in both landraces and breeding materials. The primary genetic division of the collection separates the floury maize of the northern Andean highlands from the germplasm of the central-southern regions, reflecting the ecogeographic gradients of the country rather than traditional racial classification. At a finer scale, genetic groups were associated with specific races, geographic origins and grain types, and most races were genetically differentiated, while extensive admixture among several central Chilean races is consistent with gene flow and farmer-mediated seed exchange, although pooled genotyping may also contribute to the apparent admixture. Beyond describing this diversity, the genomic data strengthened the management of the collection, allowing the classification of accessions lacking passport information and the development of a stratified core collection that retains all detected alleles, all standard races, the geographic range and most of the gene diversity of the national collection in a manageable number of accessions, although the northern Andean group is represented in a lower proportion than in the full collection. Together, these results establish the basis for using Chilean maize germplasm in diverse environmental, nutritional and breeding contexts, laying the foundation for the conservation and sustainable utilization of the genetic diversity of national maize.
Supplementary Materials
The following supporting information can be downloaded at: https://www.mdpi.com/article/10.3390/plants15223541/s1, Figure S1: Distribution of diversity statistics per chromosome for chromosome-anchored SNP markers (n = 11,698 SNPs); Figure S2: Unbinned distribution of pairwise linkage disequilibrium (r2) as a function of physical distance among landrace accessions (n = 938); Table S1: Mean diversity statistics per chromosome for chromosome-anchored SNP markers (n = 11,698 SNPs); Table S2: Mean pairwise r2 by physical distance interval in the landrace subset (n = 939), for all chromosome-anchored SNPs and for SNPs with MAF ≥ 0.10; Figure S3: Determination of the most likely number of genetic clusters (K) in the Chilean maize collection (n = 1157 accessions) using the ΔK method, based on STRUCTURE results. ΔK = mean(|L″(K)|)/sd(L(K)), where L(K) is the mean log-likelihood of the data across replicate runs for each K. The highest ΔK value was observed at K = 2, followed by a secondary peak at K = 6; Figure S4: Principal coordinate analysis (PCoA) of the 1157 accessions of the Chilean maize collection based on Rogers’ modified genetic distance (MRD), showing the first two principal coordinates (PC1, 11.18%; PC2, 5.81%). Accessions are coloured by (a) race, according to passport data; (b) population type, highlighting breeding materials; and (c) country of origin, highlighting accessions introduced from the United States, Mexico, and Nigeria; Table S3: Consistency of STRUCTURE membership estimates across 10 independent runs at K = 2 and K = 6; Table S4a. Passport information and STRUCTURE-based genetic cluster assignment (K = 2 and K = 6) for all 1157 accessions of the Chilean maize germplasm collection; Table S4b.Composition of STRUCTURE K = 6 clusters at Q > 0.50; Table S5: Pairwise co-clustering stability of STRUCTURE genetic groups across 100 locus-resampling bootstrap replicates; Principal coordinate analysis (PCoA) of the 1157 accessions of the Chilean maize collection based on Rogers’ modified genetic distance (MRD), showing the first two principal coordinates (PC1, 11.18%; PC2, 5.81%). Accessions are coloured by (a) race, according to passport data; (b) population type, highlighting breeding materials; and (c) country of origin, highlighting accessions introduced from the United States, Mexico, and Nigeria; Figure S5: Relationship between the first principal coordinate (PC1) and the geographic origin of accessions in the Chilean national maize germplasm collection. (a) PC1 versus elevation of the collection site (m.a.s.l.). (b) PC1 versus latitude of the collection site (°S, negative values). PC1 was derived from a principal coordinate analysis (PCoA) based on modified Rogers’ distance and explains 11.18% of the total variation. Only accessions with passport coordinates are shown (n = 697 of 1157). Solid lines are least-squares linear regressions, and shaded bands are their 95% confidence intervals. Pearson’s correlation coefficients (r) are shown in each panel (p < 0.001 in both cases); Table S6: Pairwise FST among hierarchical clusters (HC-C3 and HC-C6), estimated using a pool-size-weighted allele frequency variance approach; Table S7. Pairwise genetic differentiation (ΦST) among the 22 standard landrace race, estimated by AMOVA on squared Modified Rogers distances. Below the diagonal: ΦST; above the diagonal: FDR-adjusted p-values (Benjamini–Hochberg). Significance based on 9999 permutations per pair; Table S8: Inferred population type by k-nearest-neighbor majority vote (k = 3, 5, 10); Table S9: Inferred race by k-nearest-neighbor majority vote (k = 3, 5, 10); Table S10: Passport data of the 1157 genotyped accessions of the Chilean maize germplasm collection, including DNA bulk size and core collection membership; Table S11: Sensitivity of the main results to the representation of heterozygous pooled calls: operational dosage (0, 0.5, 1) versus within-pool allele frequencies estimated from DArTseq read counts.
Author Contributions
Conceptualization, E.S.; methodology, E.S. and G.V.; validation, C.P. and G.V.; formal analysis, V.S., M.G. and E.S.; investigation, E.S.; resources, E.S. and C.P.; data curation, E.S., G.V. and C.P.; writing—original draft preparation, E.S.; writing—review and editing, E.S., M.G., C.P. and G.V.; visualization, E.S., V.S. and M.G.; supervision, E.S.; project administration, E.S. and C.A.; funding acquisition, E.S. All authors have read and agreed to the published version of the manuscript.
Funding
This research was funded by ANID—Fondo Nacional de Desarrollo Científico y Tecnológico (FONDECYT de Iniciación—grant number 11200894), ANID—Fomento a La Vinculación Internacional para Instituciones de Investigación (FOVI—grant number 220099) and Subsecretaría del Ministerio de Agricultura (Subsecretaría MINAGRI—grant number 501453-70).
Data Availability Statement
SNP data and the analysis scripts used in this study are openly available on GitHub at https://github.com/esalazar2026/plants-2026-Genetic-diversity-maize-ID4647368 (accessed on 6 November 2026).
Acknowledgments
During the preparation of this manuscript, the authors used Claude Opus 5.5 (Anthropic’AI) for assistance in writing and debugging R and Python scripts for data analysis, improving the visual presentation of figures, and editing the English text. The authors have reviewed and edited the output and take full responsibility for the content of this publication.
Conflicts of Interest
The authors declare no conflicts of interest.
References
- Matsuoka, Y.; Vigouroux, Y.; Goodman, M.M.; Sánchez, G.J.; Buckler, E.; Doebley, J. A single domestication for maize shown by multilocus microsatellite genotyping. Proc. Natl. Acad. Sci. USA 2002, 99, 6080–6084. [Google Scholar] [CrossRef] [Scilit] [PubMed]
- Kistler, L.; Maezumi, S.Y.; de Souza, J.G.; Przelomska, N.A.S.; Costa, F.M.; Smith, O.; Loiselle, H.; Ramos-Madrigal, J.; Wales, N.; Ribeiro, E.R.; et al. Multiproxy evidence highlights a complex evolutionary legacy of maize in South America. Science 2018, 362, 1309–1313. [Google Scholar] [CrossRef] [Scilit] [PubMed]
- Kistler, L.; Thakar, H.B.; VanDerwarker, A.M.; Domic, A.; Bergström, A.; George, R.J.; Harper, T.K.; Allaby, R.G.; Hirth, K.; Kennett, D.J. Archaeological Central American maize genomes suggest ancient gene flow from South America. Proc. Natl. Acad. Sci. USA 2020, 117, 33124–33129. [Google Scholar] [CrossRef] [Scilit] [PubMed]
- Falabella, F.; Planella, M.T.; Tykot, R.H. El maíz (Zea mays) en el mundo prehispánico de Chile central. Lat. Am. Antiq. 2008, 19, 25–46. [Google Scholar] [CrossRef] [Scilit]
- Tykot, R.H.; Falabella, F.; Planella, M.T.; Aspillaga, E.; Sanhueza, L.; Becker, C. Stable isotopes and archaeology in central Chile: Methodological insights and interpretative problems for dietary reconstruction. Int. J. Osteoarchaeol. 2009, 19, 156–170. [Google Scholar] [CrossRef] [Scilit]
- Vigouroux, Y.; Glaubitz, J.C.; Matsuoka, Y.; Goodman, M.M.; Sánchez, G.J.; Doebley, J. Population structure and genetic diversity of New World maize races assessed by DNA microsatellites. Am. J. Bot. 2008, 95, 1240–1253. [Google Scholar] [CrossRef] [Scilit] [PubMed]
- Salazar, E.; González, M.; Araya, C.; Mejía, N.; Carrasco, B. Genetic diversity and intra-racial structure of Chilean Choclero corn (Zea mays L.) germplasm revealed by simple sequence repeat markers (SSRs). Sci. Hortic. 2017, 225, 620–629. [Google Scholar] [CrossRef] [Scilit]
- Bedoya, C.A.; Dreisigacker, S.; Hearne, S.; Franco, J.; Mir, C.; Prasanna, B.M.; Taba, S.; Charcosset, A.; Warburton, M.L. Genetic diversity and population structure of native maize populations in Latin America and the Caribbean. PLoS ONE 2017, 12, e0173488. [Google Scholar] [CrossRef] [Scilit] [PubMed]
- Takuno, S.; Ralph, P.; Swarts, K.; Elshire, R.J.; Glaubitz, J.C.; Buckler, E.S.; Hufford, M.B.; Ross-Ibarra, J. Independent molecular basis of convergent highland adaptation in maize. Genetics 2015, 200, 1297–1312. [Google Scholar] [CrossRef] [Scilit] [PubMed]
- Costa, F.M.; Silva, N.C.d.A.; Vidal, R.; Clement, C.R.; Freitas, F.d.O.; Alves-Pereira, A.; Petroli, C.D.; Zucchi, M.I.; Veasey, E.A. Maize dispersal patterns associated with different types of endosperm and migration of indigenous groups in lowland South America. Ann. Bot. 2022, 129, 737–751. [Google Scholar] [CrossRef] [Scilit] [PubMed]
- Dominguez, P.G.; Gutierrez, A.V.; Fass, M.I.; Filippi, C.V.; Vera, P.; Puebla, A.; Defacio, R.A.; Paniego, N.B.; Lia, V.V. Genome-wide diversity in lowland and highland maize landraces from southern South America: Population genetics insights to assist conservation. Evol. Appl. 2024, 17, e70047. [Google Scholar] [CrossRef] [Scilit] [PubMed]
- Arbizu, C.I.; Bazo-Soto, I.; Flores, J.; Ortiz, R.; Blas, R.; García-Mendoza, P.J.; Sevilla, R.; Crossa, J.; Grobman, A. Genotyping by sequencing reveals the genetic diversity and population structure of Peruvian highland maize races. Front. Plant Sci. 2025, 16, 1526670. [Google Scholar] [CrossRef] [Scilit] [PubMed]
- Hölker, A.C.; Mayer, M.; Presterl, T.; Bolduan, T.; Bauer, E.; Ordas, B.; Brauner, P.C.; Ouzunova, M.; Melchinger, A.E.; Schön, C.-C. European maize landraces made accessible for plant breeding and genome-based studies. Theor. Appl. Genet. 2019, 132, 3333–3345. [Google Scholar] [CrossRef] [Scilit] [PubMed]
- Arca, M.; Gouesnard, B.; Mary-Huard, T.; Le Paslier, M.; Bauland, C.; Combes, V.; Madur, D.; Charcosset, A.; Nicolas, S.D. Genotyping of DNA pools identifies untapped landraces and genomic regions to develop next-generation varieties. Plant Biotechnol. J. 2023, 21, 1123–1139. [Google Scholar] [CrossRef] [Scilit] [PubMed]
- Sansaloni, C.; Petroli, C.; Jaccoud, D.; Carling, J.; Detering, F.; Grattapaglia, D.; Kilian, A. Diversity Arrays Technology (DArT) and next-generation sequencing combined: Genome-wide, high throughput, highly informative genotyping for molecular breeding of Eucalyptus. BMC Proc. 2011, 5, 54. [Google Scholar] [CrossRef] [Scilit]
- Arca, M.; Mary-Huard, T.; Gouesnard, B.; Bérard, A.; Bauland, C.; Combes, V.; Madur, D.; Charcosset, A.; Nicolas, S.D. Deciphering the genetic diversity of landraces with high-throughput SNP genotyping of DNA bulks: Methodology and application to the maize 50K array. Front. Plant Sci. 2021, 11, 568699. [Google Scholar] [CrossRef] [Scilit] [PubMed]
- Timothy, D.H.; Peña, V.B.; Ramírez, E.R.; Brown, W.L.; Anderson, E. Races of Maize in Chile; Publication 847; National Academy of Sciences–National Research Council: Washington, DC, USA, 1961. [Google Scholar]
- Campbell, M.R.; Anih, E.; Conatser, C.; Grau-Saavedra, B.; Pollak, L.M. Development of a core subset of Chilean lowland subtropical and temperate maize (Zea mays L.) populations using near infrared transmittance spectroscopy. Plant Genet Resour. Newsl. 2006, 148, 1–9. [Google Scholar]
- Paratori, O.; Sbarbaro, R.; Villegas, C. Catálogo de Recursos Genéticos de Maíz de Chile; Boletín Técnico No. 165; INIA, Estación Experimental La Platina: Santiago, Chile, 1990; 210p. [Google Scholar]
- Goodman, M.M.; Bird, R.M. The races of maize IV: Tentative grouping of 219 Latin American races. Econ. Bot. 1977, 31, 204–221. [Google Scholar] [CrossRef] [Scilit]
- Arteaga, M.C.; Moreno-Letelier, A.; Mastretta-Yanes, A.; Vázquez-Lobo, A.; Breña-Ochoa, A.; Moreno-Estrada, A.; Eguiarte, L.E.; Piñero, D. Genomic variation in recently collected maize landraces from Mexico. Genom. Data 2016, 7, 38–45. [Google Scholar] [CrossRef] [Scilit] [PubMed]
- Caldu-Primo, J.L.; Mastretta-Yanes, A.; Wegier, A.; Piñero, D. Finding a needle in a haystack: Distinguishing Mexican maize landraces using a small number of SNPs. Front. Genet. 2017, 8, 45. [Google Scholar] [CrossRef] [Scilit] [PubMed]
- Warburton, M.L.; Reif, J.C.; Frisch, M.; Bohn, M.; Bedoya, C.; Xia, X.C.; Crossa, J.; Franco, J.; Hoisington, D.; Pixley, K.; et al. Genetic diversity in CIMMYT nontemperate maize germplasm: Landraces, open pollinated varieties, and inbred lines. Crop Sci. 2008, 48, 617–624. [Google Scholar] [CrossRef] [Scilit]
- Jiao, Y.; Peluso, P.; Shi, J.; Liang, T.; Stitzer, M.C.; Wang, B.; Campbell, M.S.; Stein, J.C.; Wei, X.; Chin, C.-S.; et al. Improved maize reference genome with single-molecule technologies. Nature 2017, 546, 524–527. [Google Scholar] [CrossRef] [Scilit] [PubMed]
- García-Mendoza, P.J.; Saldaña, C.L.; Pérez-Almeida, I.B.; Prieto-Rosales, G.P.; Medina-Castro, D.E.; Taramona-Ruíz, L.A.; Arbizu, C.I. Genetic diversity and population structure of maize landraces from Huancavelica and Cajamarca provinces of Peru using SNP markers. Plant Genet. Resour. 2025, 23, 262–270. [Google Scholar] [CrossRef] [Scilit]
- Guo, R.; Li, T.; Zhang, Q.; Wang, J.; Guo, J.; Wang, L.; Song, L.; Yan, Y.; Zhang, D.; Wei, J.; et al. Genetic and molecular characterization of maize landraces from Central China. Agronomy 2024, 14, 1278. [Google Scholar] [CrossRef] [Scilit]
- Marshall, D.R.; Brown, A.H.D. Optimum sampling strategies in genetic conservation. In Crop Genetic Resources for Today and Tomorrow; Frankel, O.H., Hawkes, J.G., Eds.; Cambridge University Press: Cambridge, UK, 1975; pp. 53–80. [Google Scholar]
- Tenaillon, M.I.; Sawkins, M.C.; Long, A.D.; Gaut, R.L.; Doebley, J.F.; Gaut, B.S. Patterns of DNA sequence polymorphism along chromosome 1 of maize (Zea mays ssp. mays L.). Proc. Natl. Acad. Sci. USA 2001, 98, 9161–9166. [Google Scholar] [CrossRef] [Scilit] [PubMed]
- Mascher, M.; Schreiber, M.; Scholz, U.; Graner, A.; Reif, J.C.; Stein, N. Genebank genomics bridges the gap between the conservation of crop diversity and plant breeding. Nat. Genet. 2019, 51, 1076–1081. [Google Scholar] [CrossRef] [Scilit] [PubMed]
- van Hintum, T.; Brown, A.H.D.; Spillane, C.; Hodgkin, T. Core Collections of Plant Genetic Resources; IPGRI Technical Bulletin No. 3; International Plant Genetic Resources Institute: Rome, Italy, 2000. [Google Scholar]
- Franco, J.; Crossa, J.; Warburton, M.L.; Taba, S. Sampling strategies for conserving maize diversity when forming core subsets using genetic markers. Crop Sci. 2006, 46, 854–864. [Google Scholar] [CrossRef] [Scilit]
- Paratori, O. Camelia-INIA 145, un nuevo cultivar de maíz. Agric. Téc 1986, 46, 531. [Google Scholar]
- Paratori, O.; Villegas, C. Híbridos comerciales de maíz. IPA La. Platina 1984, 23, 55–56. [Google Scholar]
- Sbarbaro, R. Etapas para la obtención de un híbrido de maíz. IPA La. Platina 1989, 56, 7–11. [Google Scholar]
- Paratori, O.; Altamirano, S. (Eds.) El Cultivo Del Maíz; Instituto de Investigaciones Agropecuarias, Centro Regional de Investigación La Platina: Santiago, Chile, 1995. [Google Scholar]
- Paratori, O.; Villegas, C. Híbridos y producción de maíz. IPA La. Platina 1987, 42, 7–13. [Google Scholar]
- Chiron, C. Agriculture Familiale et Conservation des Variétés Traditionnelles: Le cas du Maïs Chilien. Undergraduate Thesis, ISTOM—École Supérieure d’Agro-Développement International, Angers, France, 2023. [Google Scholar]
- International Maize and Wheat Improvement Center (CIMMYT). Laboratory Protocols: CIMMYT Applied Molecular Genetics Laboratory, 3rd ed.; CIMMYT: Mexico City, Mexico, 2005. [Google Scholar]
- Cruz, V.M.; Kilian, A.; Dierig, D.A. Development of DArT marker platforms and genetic diversity assessment of the US collection of the new oilseed crop Lesquerella and related species. PLoS ONE 2013, 8, e64062. [Google Scholar] [CrossRef] [Scilit] [PubMed]
- Yang, X.; Ren, R.; Ray, R.; Xu, J.; Li, P.; Zhang, M.; Liu, G.; Yao, X.; Kilian, A. Genetic diversity and population structure of core watermelon (Citrullus lanatus) genotypes using DArTseq-based SNPs. Plant Genet. Resour. 2016, 14, 226–233. [Google Scholar] [CrossRef] [Scilit]
- Baloch, F.S.; Alsaleh, A.; Shahid, M.Q.; Çiftçi, V.E.; Sáenz de Miera, L.; Aasim, M.; Nadeem, M.A.; Aktaş, H.; Özkan, H.; Hatipoğlu, R. A whole genome DArTseq and SNP analysis for genetic diversity assessment in durum wheat from central fertile crescent. PLoS ONE 2017, 12, e0167821. [Google Scholar] [CrossRef] [Scilit] [PubMed]
- Sansaloni, C.; Franco, J.; Santos, B.; Percival-Alwyn, L.; Singh, S.; Petroli, C.; Campos, J.; Dreher, K.; Payne, T.; Marshall, D.; et al. Diversity analysis of 80,000 wheat accessions reveals consequences and opportunities of selection footprints. Nat. Commun. 2020, 11, 4572. [Google Scholar] [CrossRef] [Scilit] [PubMed]
- Langmead, B.; Salzberg, S.L. Fast gapped-read alignment with Bowtie 2. Nat. Methods 2012, 9, 357–359. [Google Scholar] [CrossRef] [Scilit] [PubMed]
- Gruber, B.; Unmack, P.J.; Berry, O.F.; Georges, A. Dartr: An r package to facilitate analysis of SNP data generated from reduced representation genome sequencing. Mol. Ecol. Resour. 2018, 18, 691–699. [Google Scholar] [CrossRef] [Scilit] [PubMed]
- R Core Team. R: A Language and Environment for Statistical Computing; R Foundation for Statistical Computing: Vienna, Austria, 2024; Available online: https://www.R-project.org/ (accessed on 16 July 2025).
- Pritchard, J.K.; Stephens, M.; Donnelly, P. Inference of population structure using multilocus genotype data. Genetics 2000, 155, 945–959. [Google Scholar] [CrossRef] [Scilit] [PubMed]
- Chhatre, V.E.; Emerson, K.J. StrAuto: Automation and parallelization of STRUCTURE analysis. BMC Bioinform. 2017, 18, 192. [Google Scholar] [CrossRef] [Scilit] [PubMed]
- Evanno, G.; Regnaut, S.; Goudet, J. Detecting the number of clusters of individuals using the software STRUCTURE: A simulation study. Mol. Ecol. 2005, 14, 2611–2620. [Google Scholar] [CrossRef] [Scilit] [PubMed]
- Earl, D.A.; VonHoldt, B.M. STRUCTURE HARVESTER: A website and program for visualizing STRUCTURE output and implementing the Evanno method. Conserv. Genet. Resour. 2012, 4, 359–361. [Google Scholar] [CrossRef] [Scilit]
- Jakobsson, M.; Rosenberg, N.A. CLUMPP: A cluster matching and permutation program for dealing with label switching and multimodality in analysis of population structure. Bioinformatics 2007, 23, 1801–1806. [Google Scholar] [CrossRef] [Scilit] [PubMed]
- Wright, S. Evolution and the genetics of populations. In Variability Within and Among Natural Populations; University of Chicago Press: Chicago, IL, USA, 1978; Volume 4. [Google Scholar]
- Pacheco-Gil, R.A.; Alvarado, G.; Rodríguez, F.; Burgueño, J. BIO-R (Biodiversity Analysis with R for Windows), Version 3.2. CIMMYT Research Data & Software Repository Network. 2016. Available online: https://hdl.handle.net/11529/10820 (accessed on 7 December 2024).
- Ward, J.H. Hierarchical grouping to optimize an objective function. J. Am. Stat. Assoc. 1963, 58, 236–244. [Google Scholar] [CrossRef]
- Murtagh, F.; Legendre, P. Ward’s hierarchical agglomerative clustering method: Which algorithms implement Ward’s criterion? J. Classif. 2014, 31, 274–295. [Google Scholar] [CrossRef] [Scilit]
- Peakall, R.; Smouse, P.E. GenAlEx 6.5: Genetic analysis in Excel. Population genetic software for teaching and research—An update. Bioinformatics 2012, 28, 2537–2539. [Google Scholar] [CrossRef] [Scilit] [PubMed]
- Weir, B.S. Genetic Data Analysis II: Methods for Discrete Population Genetic Data; Sinauer Associates: Sunderland, MA, USA, 1996; 445p. [Google Scholar]
- Excoffier, L.; Smouse, P.E.; Quattro, J.M. Analysis of molecular variance inferred from metric distances among DNA haplotypes: Application to human mitochondrial DNA restriction data. Genetics 1992, 131, 479–491. [Google Scholar] [CrossRef] [Scilit] [PubMed]
- Benjamini, Y.; Hochberg, Y. Controlling the false discovery rate: A practical and powerful approach to multiple testing. J. R. Stat. Soc. Ser. B Stat. Methodol. 1995, 57, 289–300. [Google Scholar] [CrossRef] [Scilit]
- De Beukelaer, H.; Davenport, G.F.; Fack, V. Core Hunter 3: Flexible core subset selection. BMC Bioinform. 2018, 19, 203. [Google Scholar] [CrossRef] [Scilit] [PubMed]
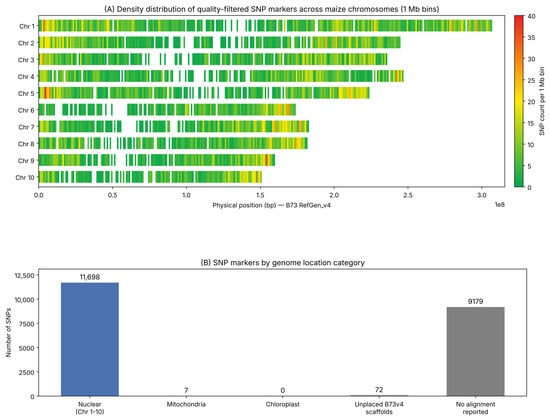
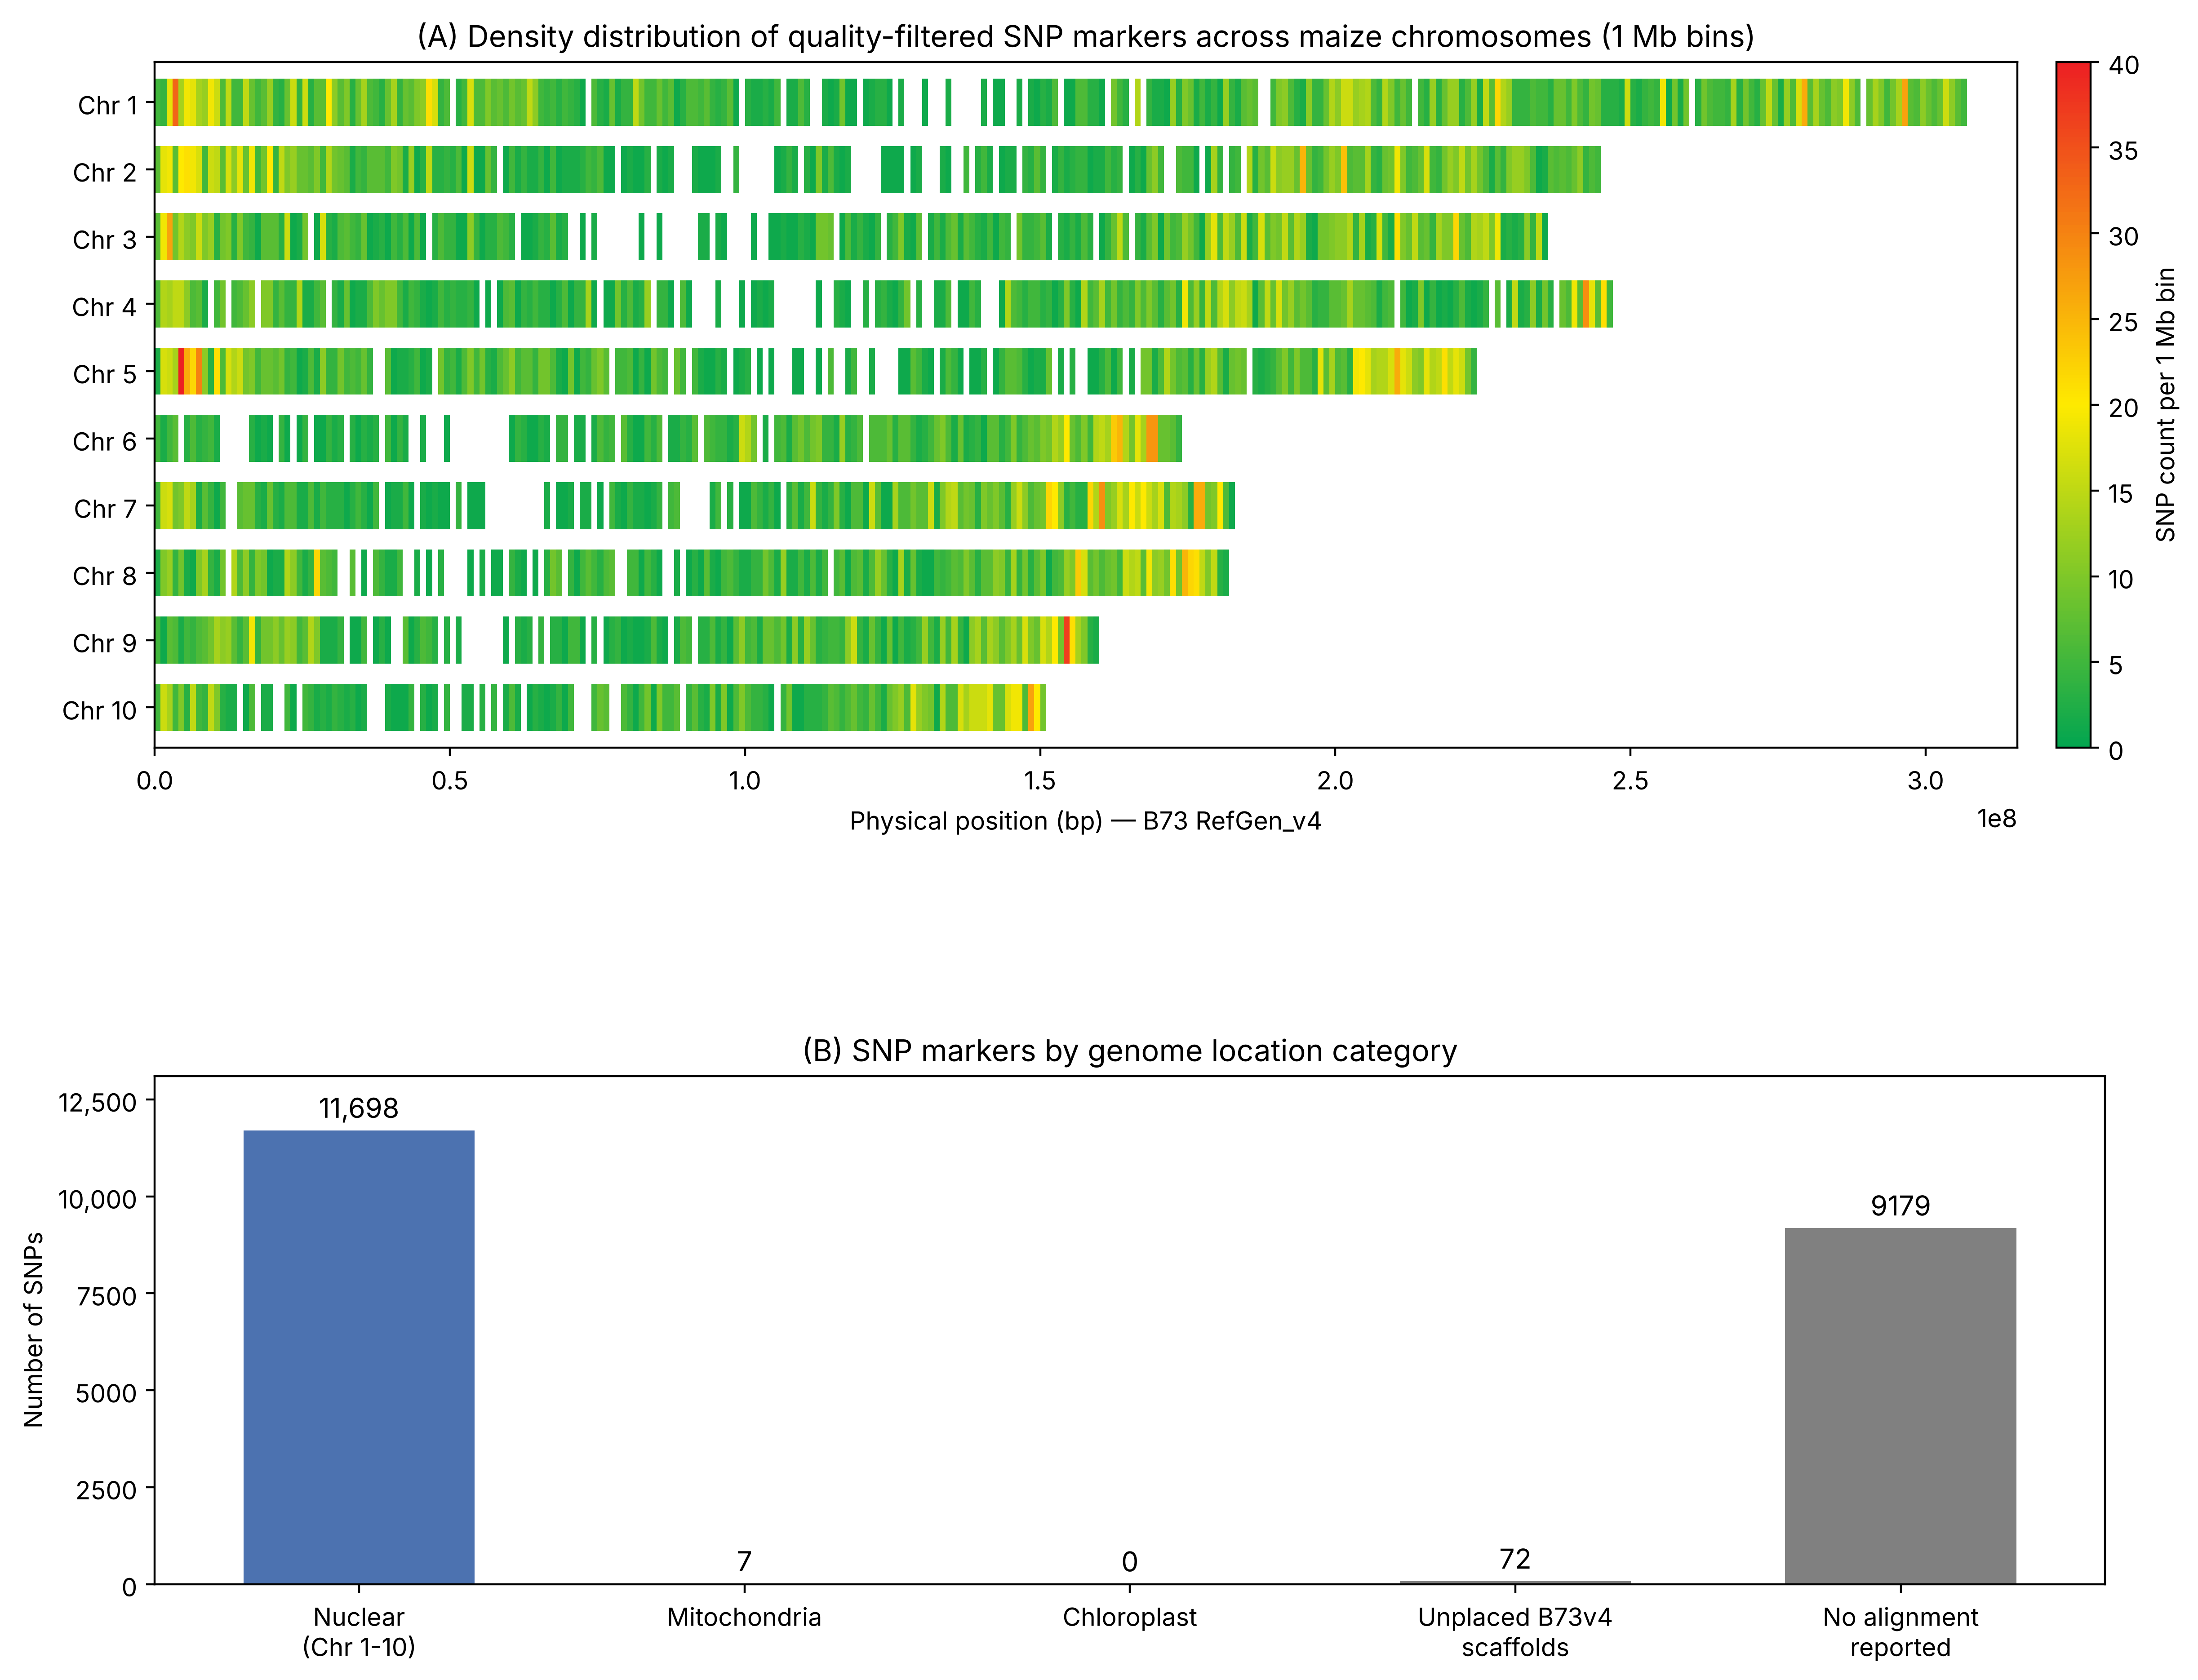
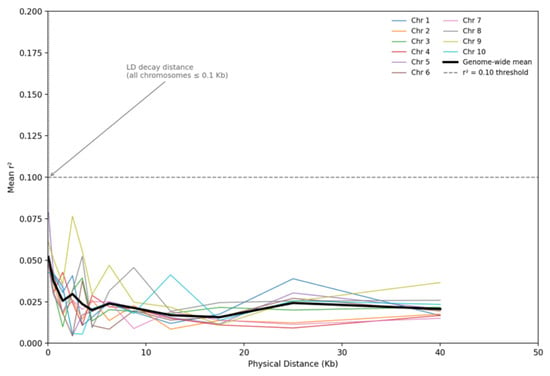
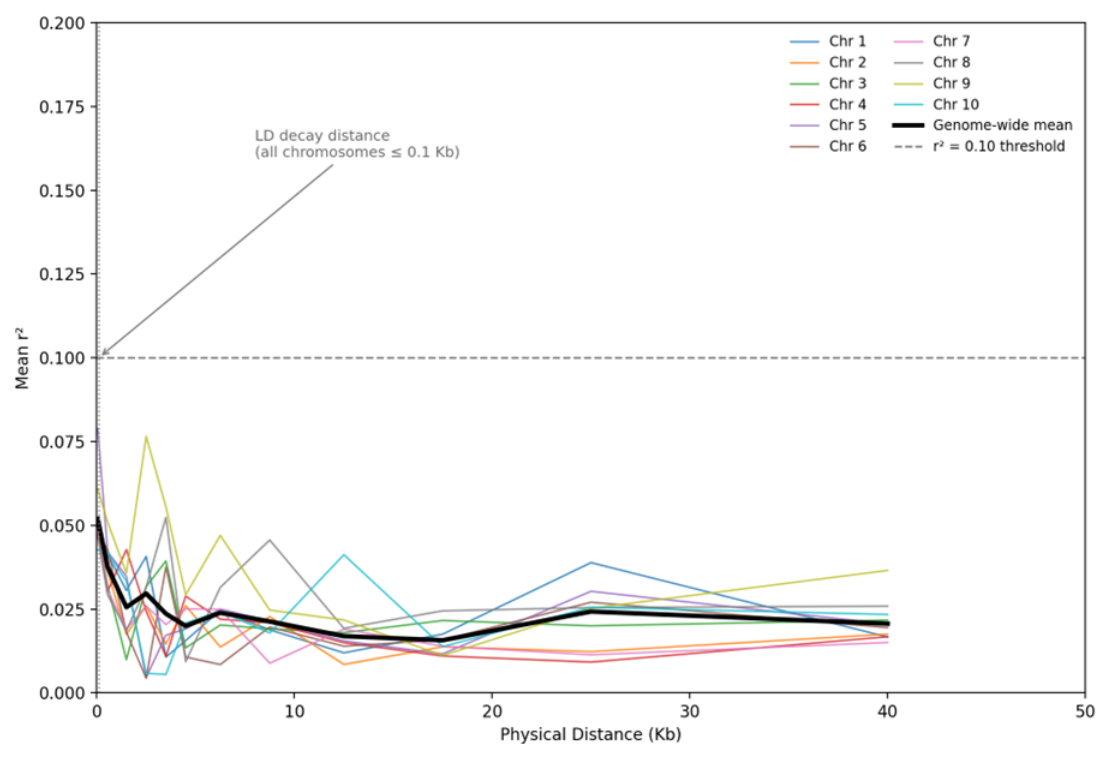
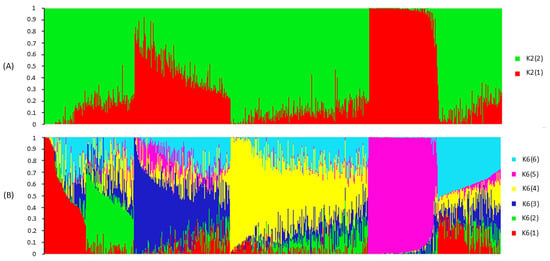
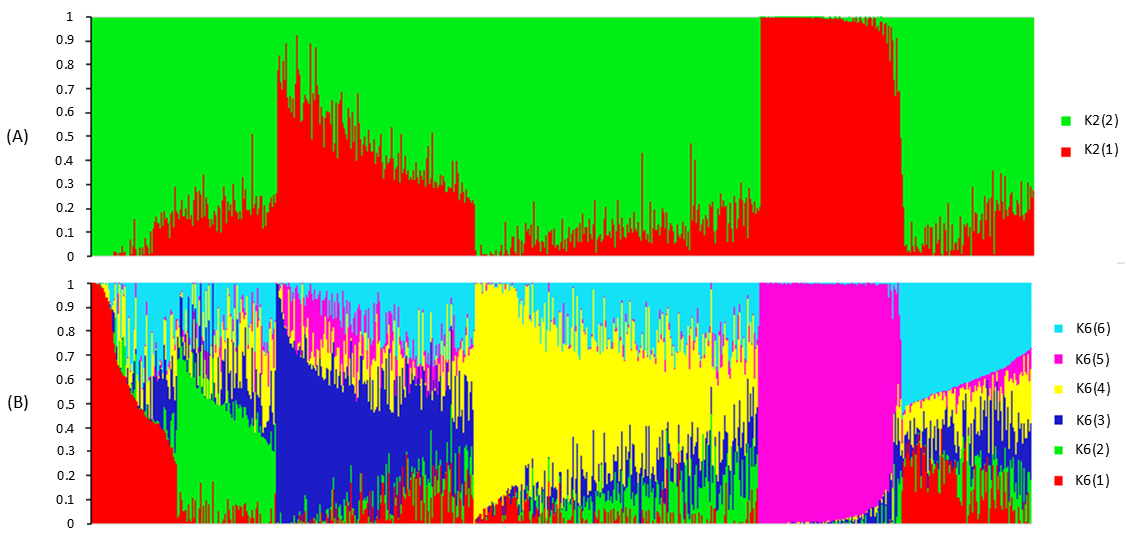
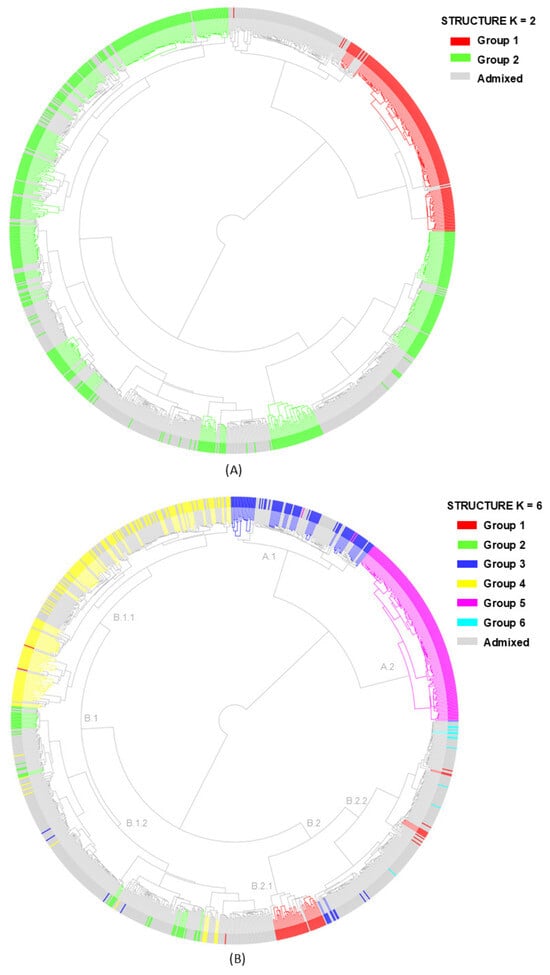
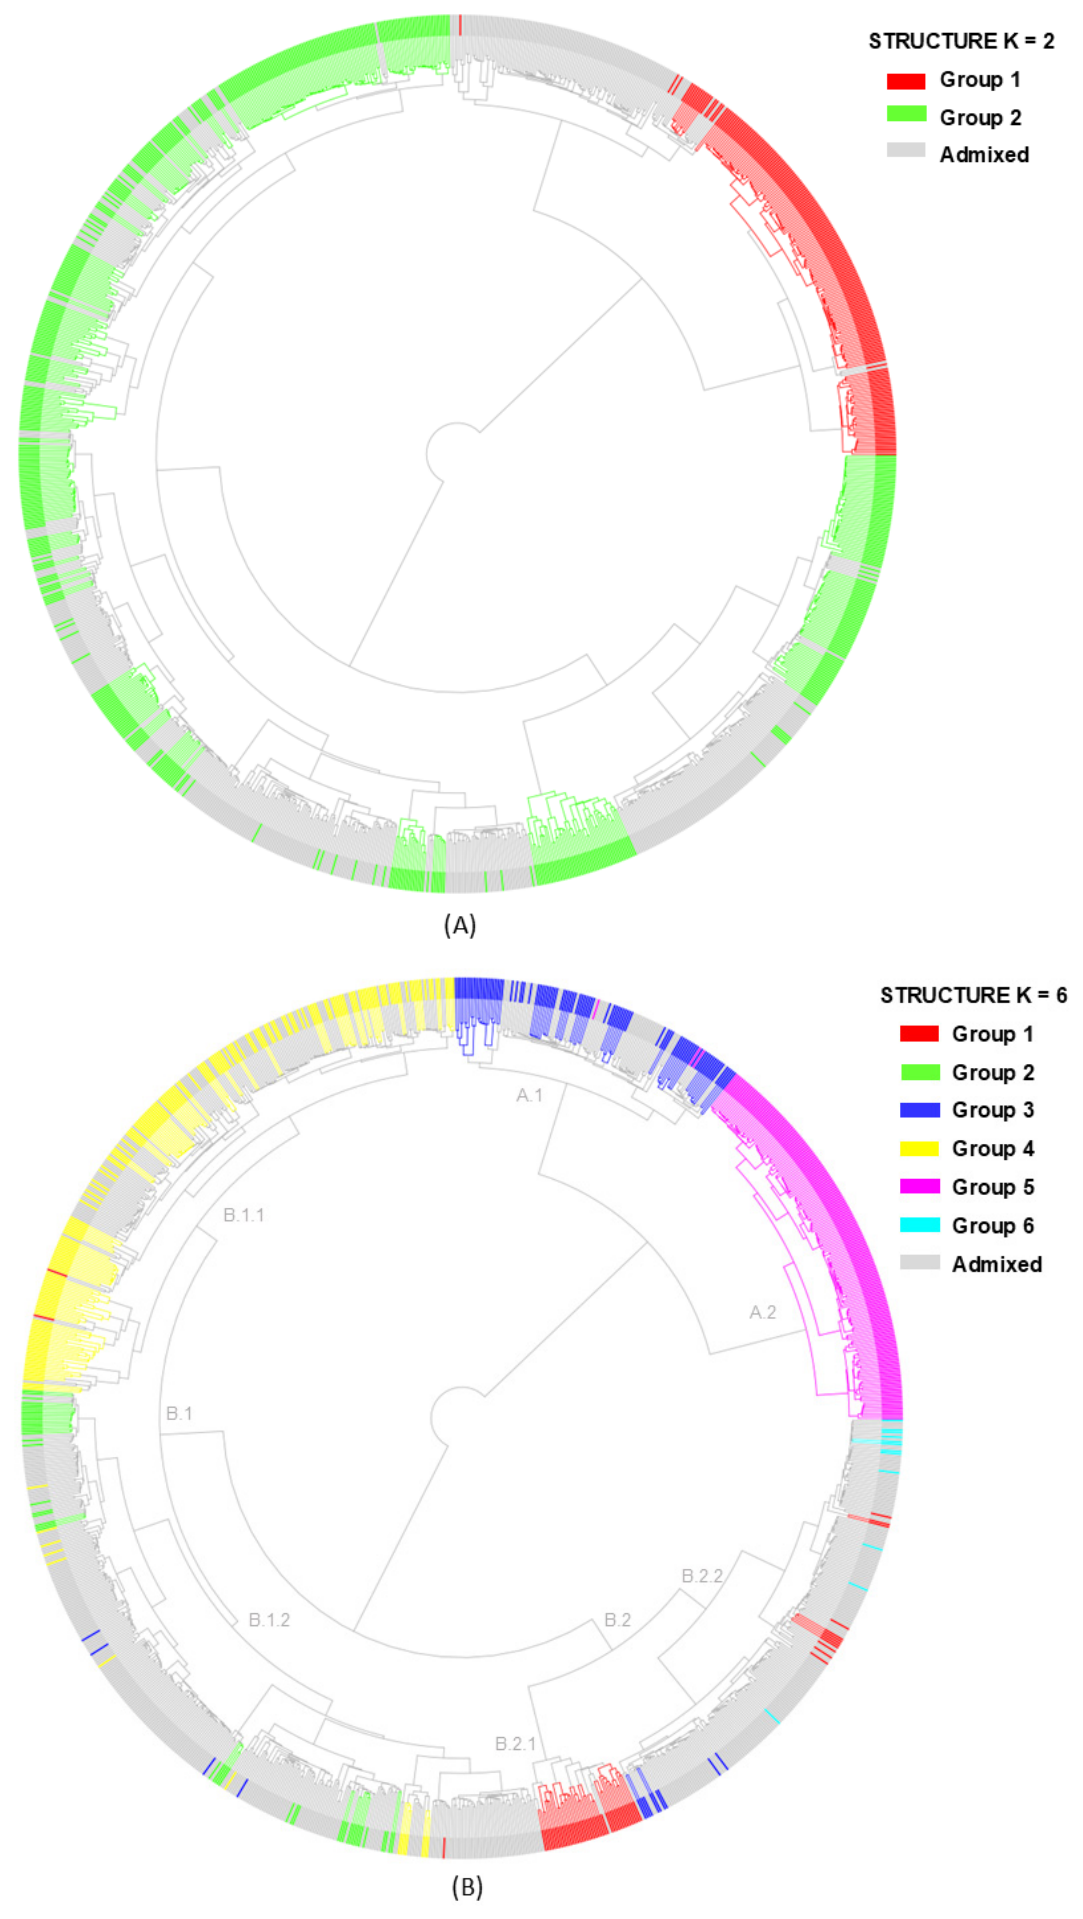
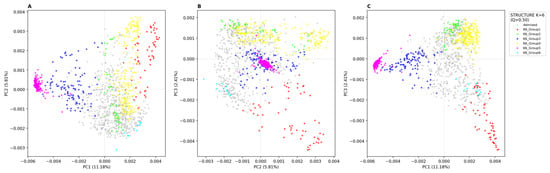
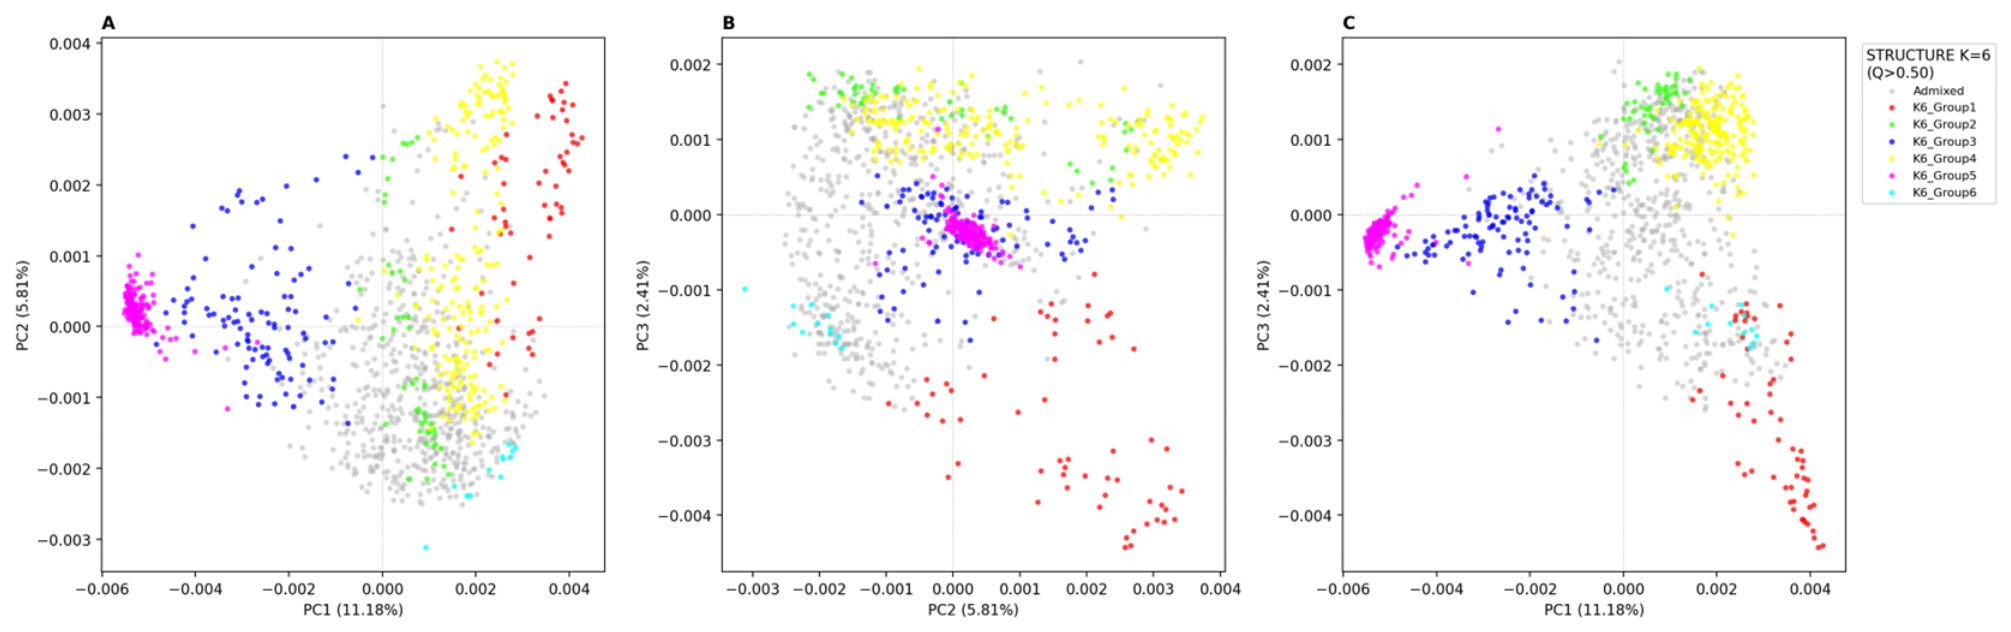
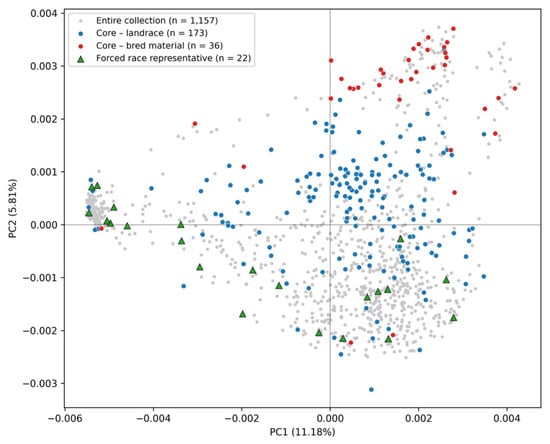
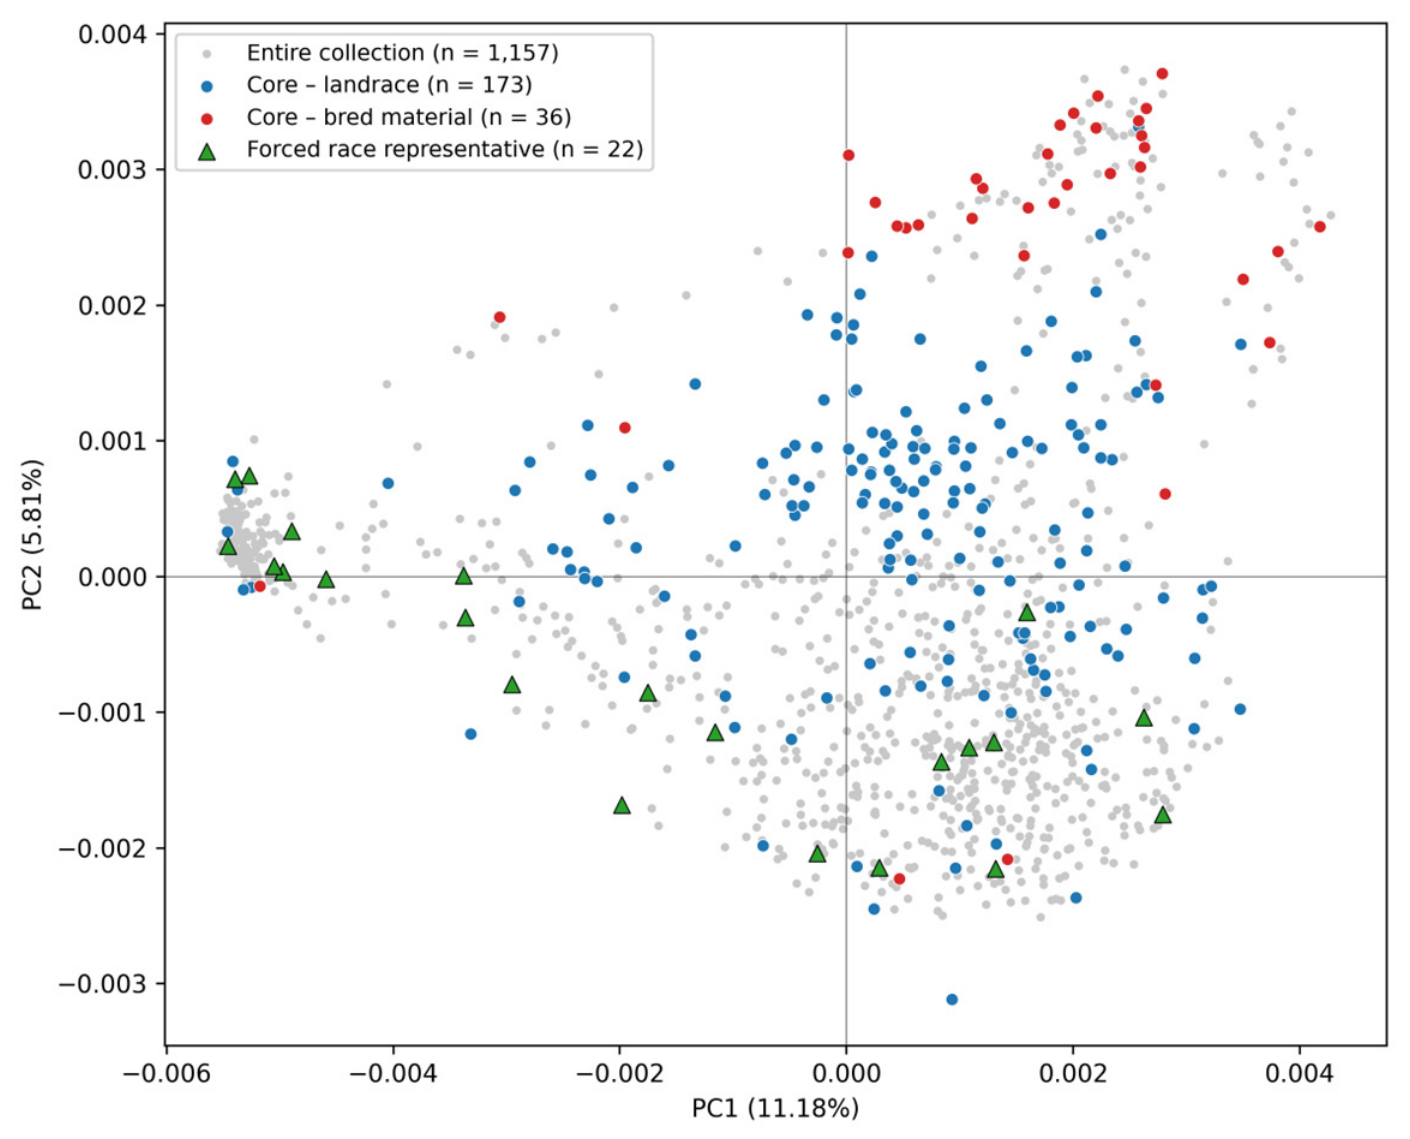
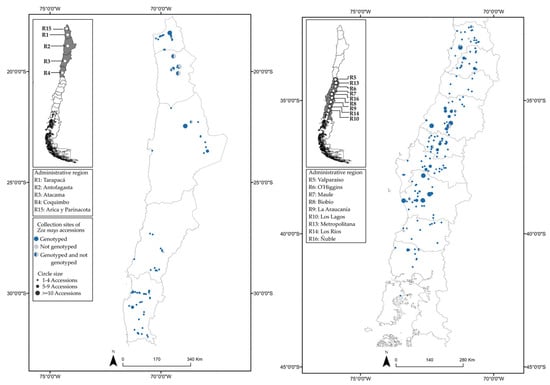
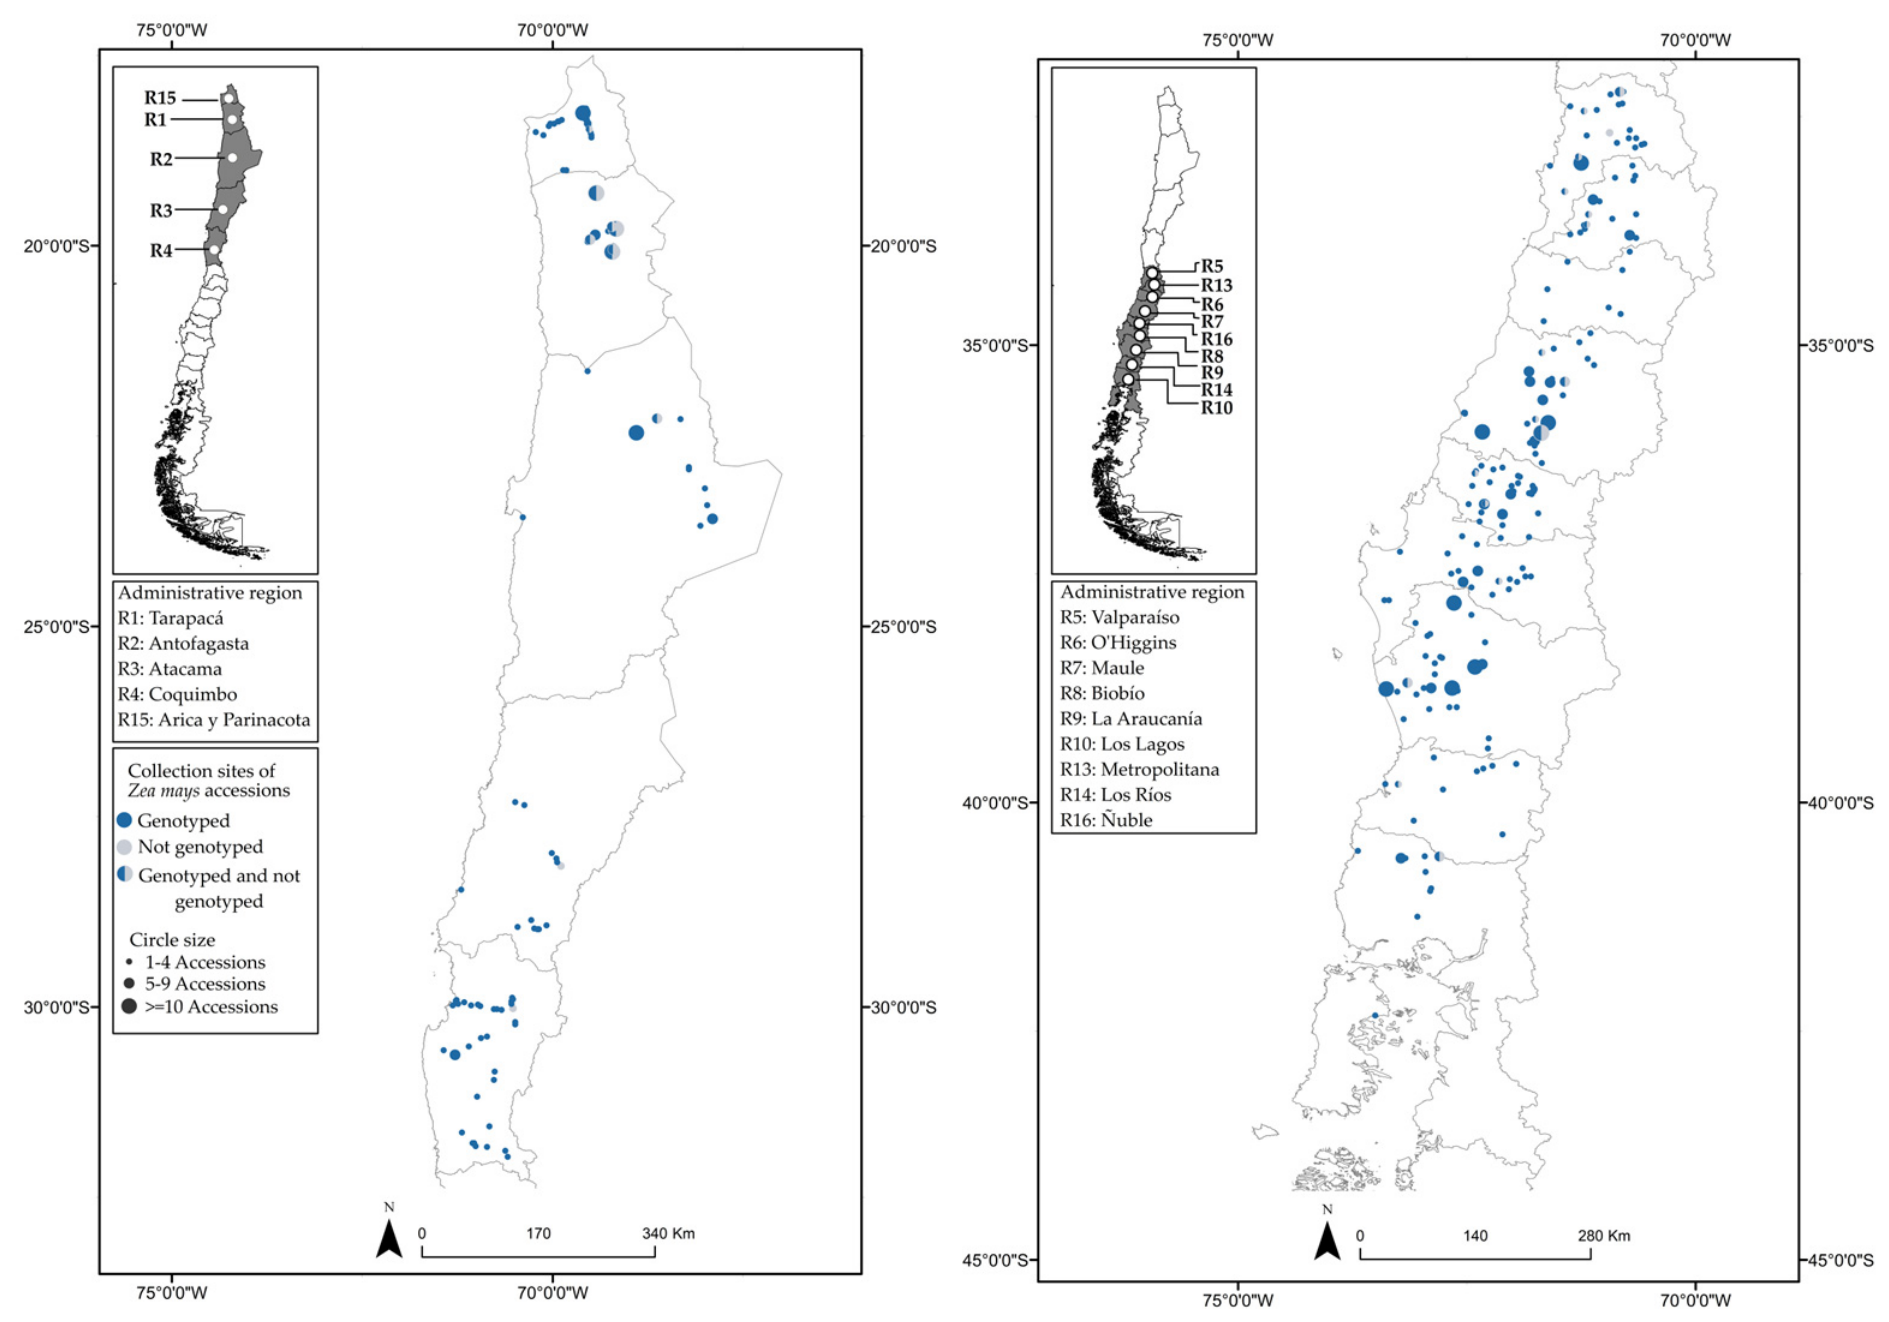

Disclaimer/Publisher’s Note: The statements, opinions and data contained in all publications are solely those of the individual author(s) and contributor(s) and not of MDPI and/or the editor(s). MDPI and/or the editor(s) disclaim responsibility for any injury to people or property resulting from any ideas, methods, instructions or products referred to in the content. |
© 2026 by the authors. Licensee MDPI, Basel, Switzerland. This article is an open access article distributed under the terms and conditions of the Creative Commons Attribution (CC BY) license.