


Abstract
Serine acetyltransferase 2 (sat2), rate-limiting for cysteine biosynthesis, is a candidate gene for grain protein content in durum wheat. We tested whether its intragenic variants are associated with protein content in bread winter wheat and how the effect depends on year, crop management, cultivar origin and other loci. Sixty-five cultivars were genotyped by Kompetitive Allele-Specific PCR for TDsat2.e9.1 (G>A, Gly325Ser) and TDsat2.i1.1 (G>T, intron 1). The variants were completely linked: only Hap1 (G; T; 32 cultivars) and Hap2 (A; G; 33 cultivars; the Chinese Spring reference haplotype) occurred. The 5913 observations (2021–2025; 16 year × management environments at one site) were analysed with a linear mixed model, the cultivar being the unit of replication. Hap1 exceeded Hap2 in protein content by 0.58% (95% CI 0.22–0.93; p = 0.0017; q = 0.014); the effect persisted with grain yield as a covariate and after adjustment for Glu-A1, Glu-D1 and 1BL.1RS, and haplotype frequencies were unrelated to cultivar origin and Rht-B1. Independently measured traits, including grain yield, did not differ. The effect kept its sign in all years but varied in size (p = 0.0013); no interaction with crop management was detected. The association requires confirmation in other collections.
1. Introduction
Bread wheat (Triticum aestivum L.) is one of the principal food crops of the world and the main source of plant protein for the populations of Europe and Asia [1]. In Russia it is the leading grain crop owing to its yield, adaptability and versatility of use [2].
Gluten is an insoluble complex of storage proteins, mostly glutenins (high- and low-molecular-weight subunits, HMW-GS and LMW-GS) and gliadins; HMW-GS forms its structural framework [3,4]. Gliadin genes lie in the Gli-1 and Gli-2 clusters of homoeologous groups 1 and 6 and glutenin genes in the Glu-1 and Glu-3 loci of group 1; allele frequencies at these loci differ between regional gene pools and between bread and durum wheat [5,6], and the two species also differ in the gliadin-to-glutenin ratio [7,8].
Regulatory factors act on grain quality alongside the structural genes. The NAC transcription factors Gpc accelerate senescence and nitrogen remobilisation to the grain [9], dwarfing Rht genes alter nitrogen partitioning between grain and biomass [10], the 1BL.1RS translocation improves disease resistance but can impair bread-making quality [11], and photoperiod sensitivity genes shift the timing of grain filling [12]. Weather in a given year affects grain quality on a scale comparable with that of the genotype [13,14].
Sulphur supply acts on grain quality through a separate route. Cysteine, which occurs mainly in glutenins, forms the intermolecular disulfide bridges that determine the elasticity of the gluten network [15,16], so genes of cysteine biosynthesis are candidates both for protein content and for gluten quality. The sat2 gene encodes serine acetyltransferase, which catalyses the formation of O-acetylserine, the rate-limiting step of cysteine biosynthesis. In durum wheat, a genome-wide association study on 190 accessions identified a locus on chromosome 4B for which sat2 was proposed as the candidate gene; the gene was sequenced and two polymorphisms were found. The missense variant Gly325Ser in exon 9 was associated with an increase in protein content of 1.33% in recombinant inbred lines (p = 0.003) and the intron 1 variant with an increase of 0.92% in an association panel of 230 accessions; KASP markers were developed for both [17]. Expression of the bread wheat homolog peaks in the aleurone and sub-aleurone layers 20–30 days after flowering, during storage protein accumulation [17].
Serine acetyltransferase does not act in isolation: its product, O-acetylserine, is converted to cysteine by O-acetylserine (thiol) lyase (OASTL), and the two enzymes form the cysteine synthase complex, whose assembly and dissociation regulate the flux of sulphur into cysteine [18,19,20]. The acetyltransferase step is rate-limiting and feedback-regulated, which makes sat2 rather than OASTL the stronger candidate for allelic variation affecting grain protein.
In bread wheat this locus has not been tested. We hypothesised that the sat2 haplotype associated with a higher protein content in durum wheat has the same direction of effect in bread winter wheat. The objectives were (i) to estimate the effect of the haplotype on protein content and eleven further traits across 16 year × management environments of five harvest years; (ii) to test whether the effect depends on the harvest year and on the crop management level; (iii) to test whether the association is explained by cultivar origin, by Rht-B1, by the glutenin loci Glu-A1 and Glu-D1 and the 1BL.1RS translocation, or by yield dilution; and (iv) to locate the exonic substitution in the predicted structure of the SAT2 protein.
2. Results
2.1. Association of sat2 with Grain Protein Content
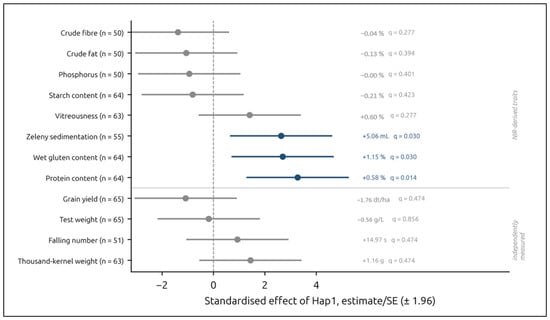
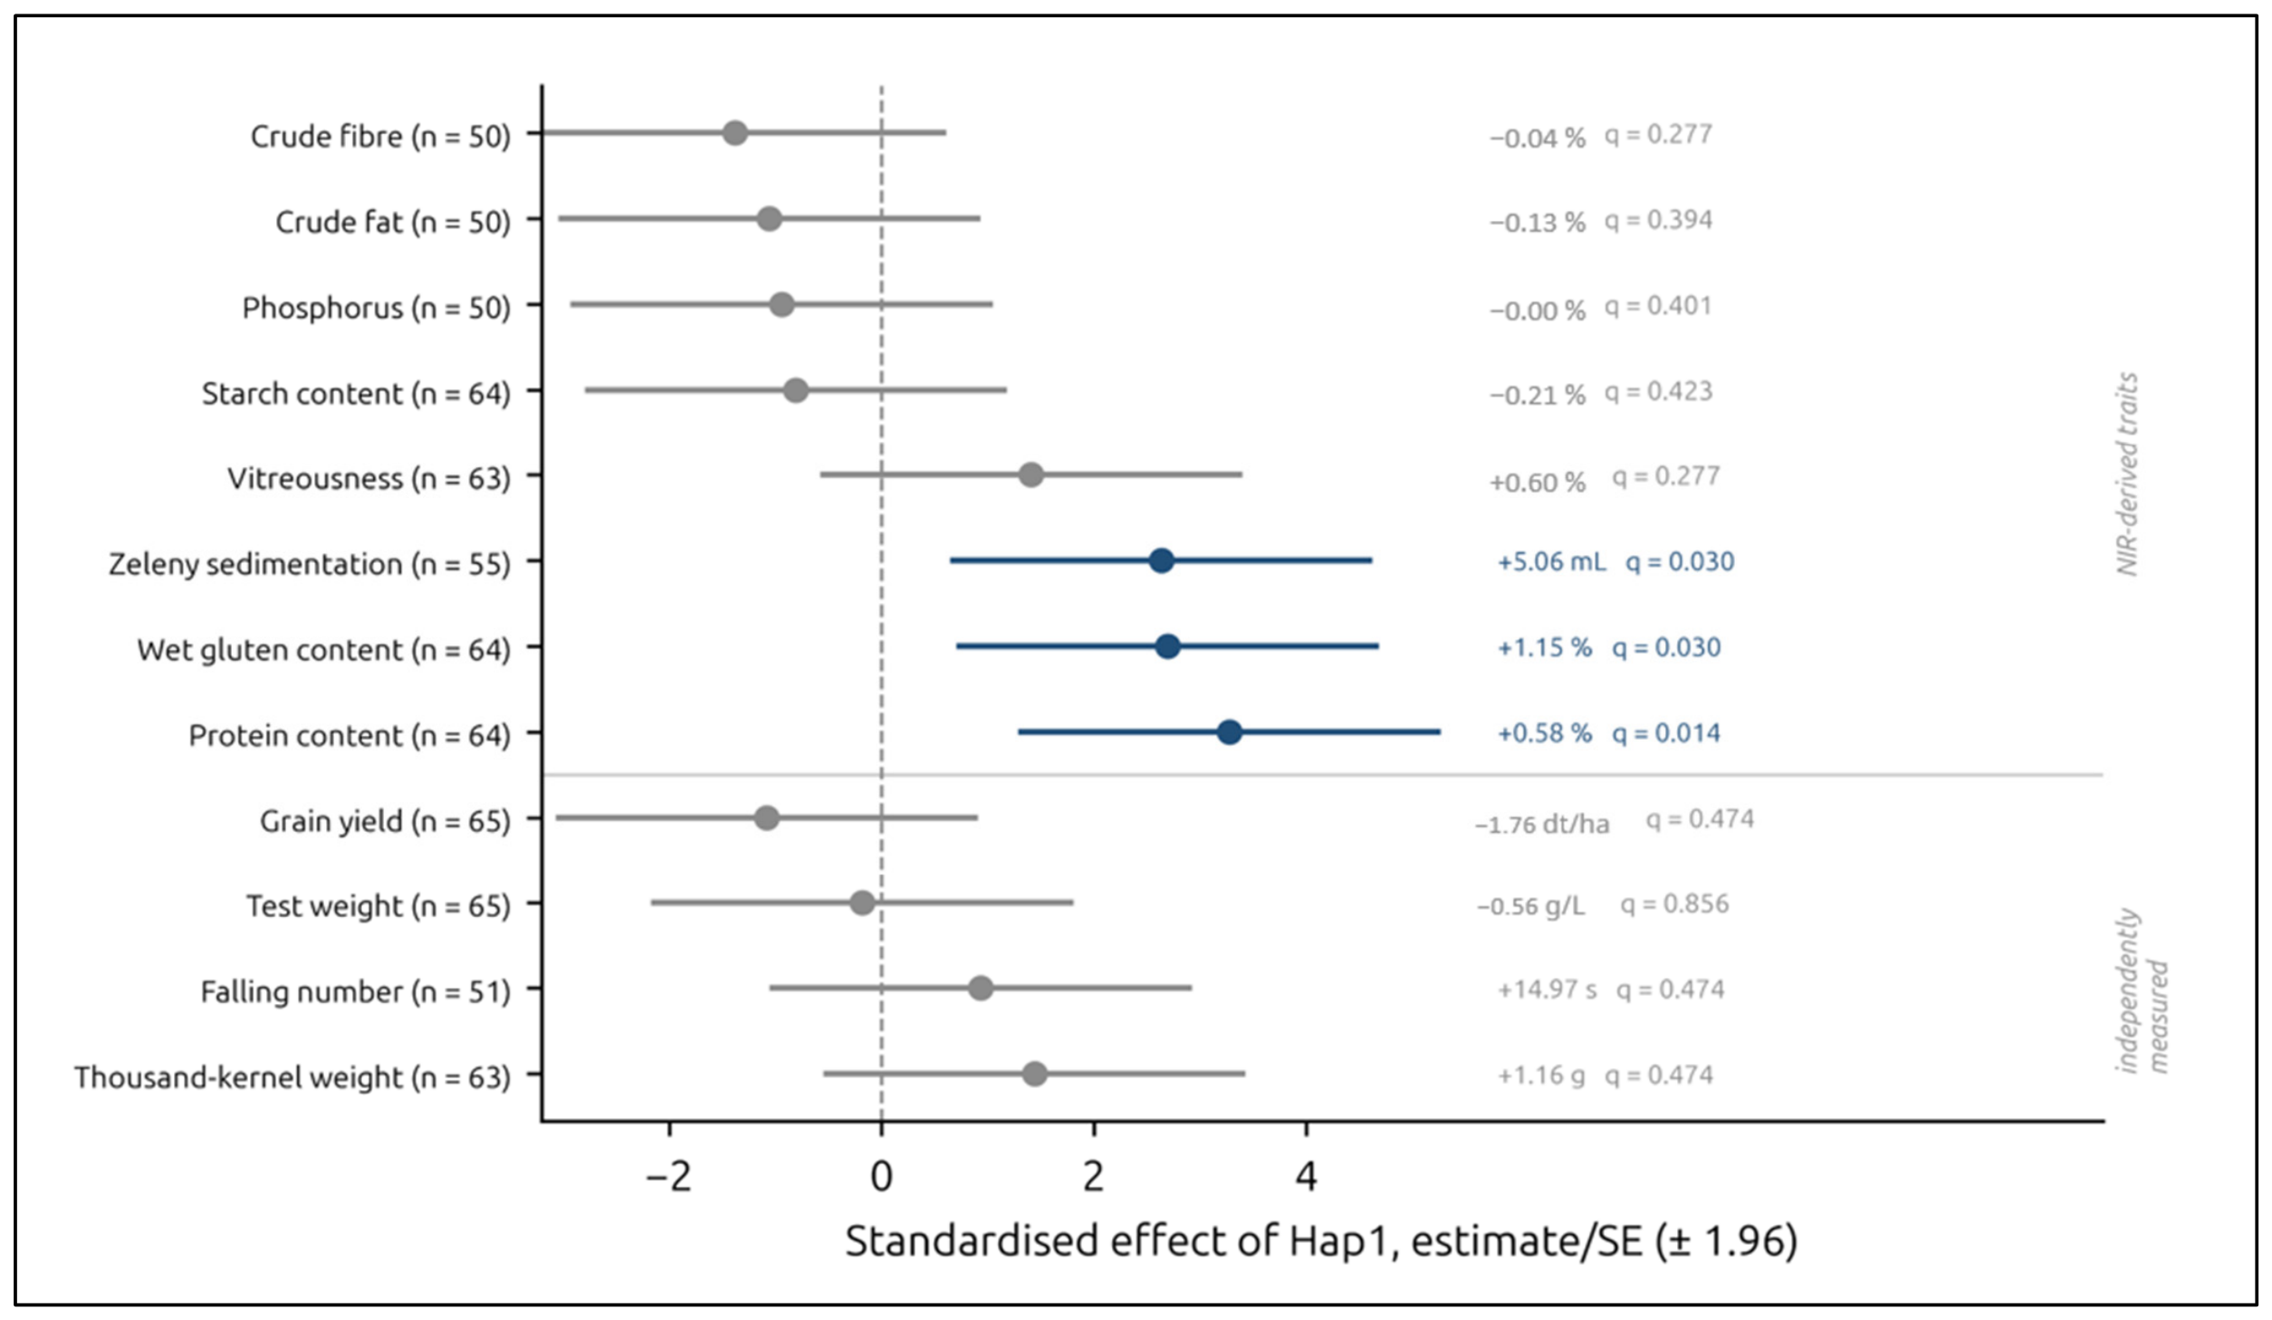
In the full data set (5913 observations, 65 cultivars, 16 year × management environments at one site) Hap1 exceeded Hap2 in protein content: +0.576%, SE 0.176, 95% CI 0.22–0.93, df = 61.8, p = 0.0017 (Figure 1, Table 1); after correction for multiplicity within the family of near-infrared (NIR)-derived indices (eight traits), q = 0.0139. Wet gluten content (+1.150%, q = 0.0296) and Zeleny sedimentation (+5.06 mL, q = 0.0296) differed in the same direction, but both are computed by the instrument from the same spectrum as protein content and are not independent confirmations (Section 2.2). The traits measured independently of NIR analysis did not differ: grain yield −1.76 dt/ha (p = 0.284), thousand-kernel weight +1.16 g (p = 0.155), test weight −0.56 g/L (p = 0.856) and falling number +15.0 s (p = 0.355); q ≥ 0.47 for all four. The remaining NIR-derived indices did not differ either (p = 0.16–0.42; Table 1).
Figure 1.
Effect of the sat2 haplotype (contrast Hap1 − Hap2) on twelve quality and productivity traits (65 cultivars, 16 environments formed by five harvest years and the crop management levels T1–T4 (2021) or T1–T3 (2022–2025) at one site). Points are standardised effects (estimate/SE) with ±1.96 intervals; the number of cultivars with data for each trait is given in the axis labels, and the estimate in trait units with the q value is printed on the right. The horizontal line separates indices computed by the near-infrared analyser (upper group) from independently measured traits (lower group); the Benjamini–Hochberg correction was applied separately within each group. Blue, q < 0.05; grey, q ≥ 0.05.
Table 1.
Effect of the sat2 haplotype (contrast Hap1 − Hap2) in the full data set (2021–2025, 16 year × management environments at one site). MDE (80%), minimum detectable effect at 80% power and α = 0.05, computed as 2.802 × SE of the contrast. Protein content is recorded for 64 of the 65 cultivars.
The two markers were completely concordant in the 65 cultivars (D′ = 1, r2 = 1; Table S1), so Hap1 and Hap2 coincide with the two alleles of each marker, and a model fitted to either marker alone is identical to the haplotype model. The locus accounts for 14.2% of the between-cultivar variance in protein content at an intraclass correlation of 0.64; for grain yield its contribution is negligible (0.2%; Table S2).
2.2. Wet Gluten and Zeleny Sedimentation Are Computed from the Same Spectrum as Protein
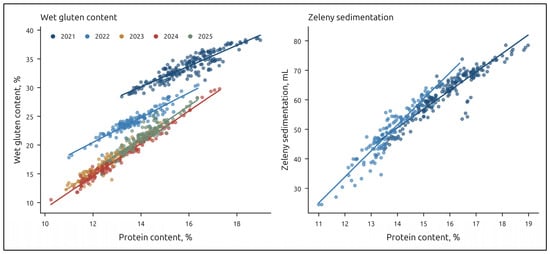
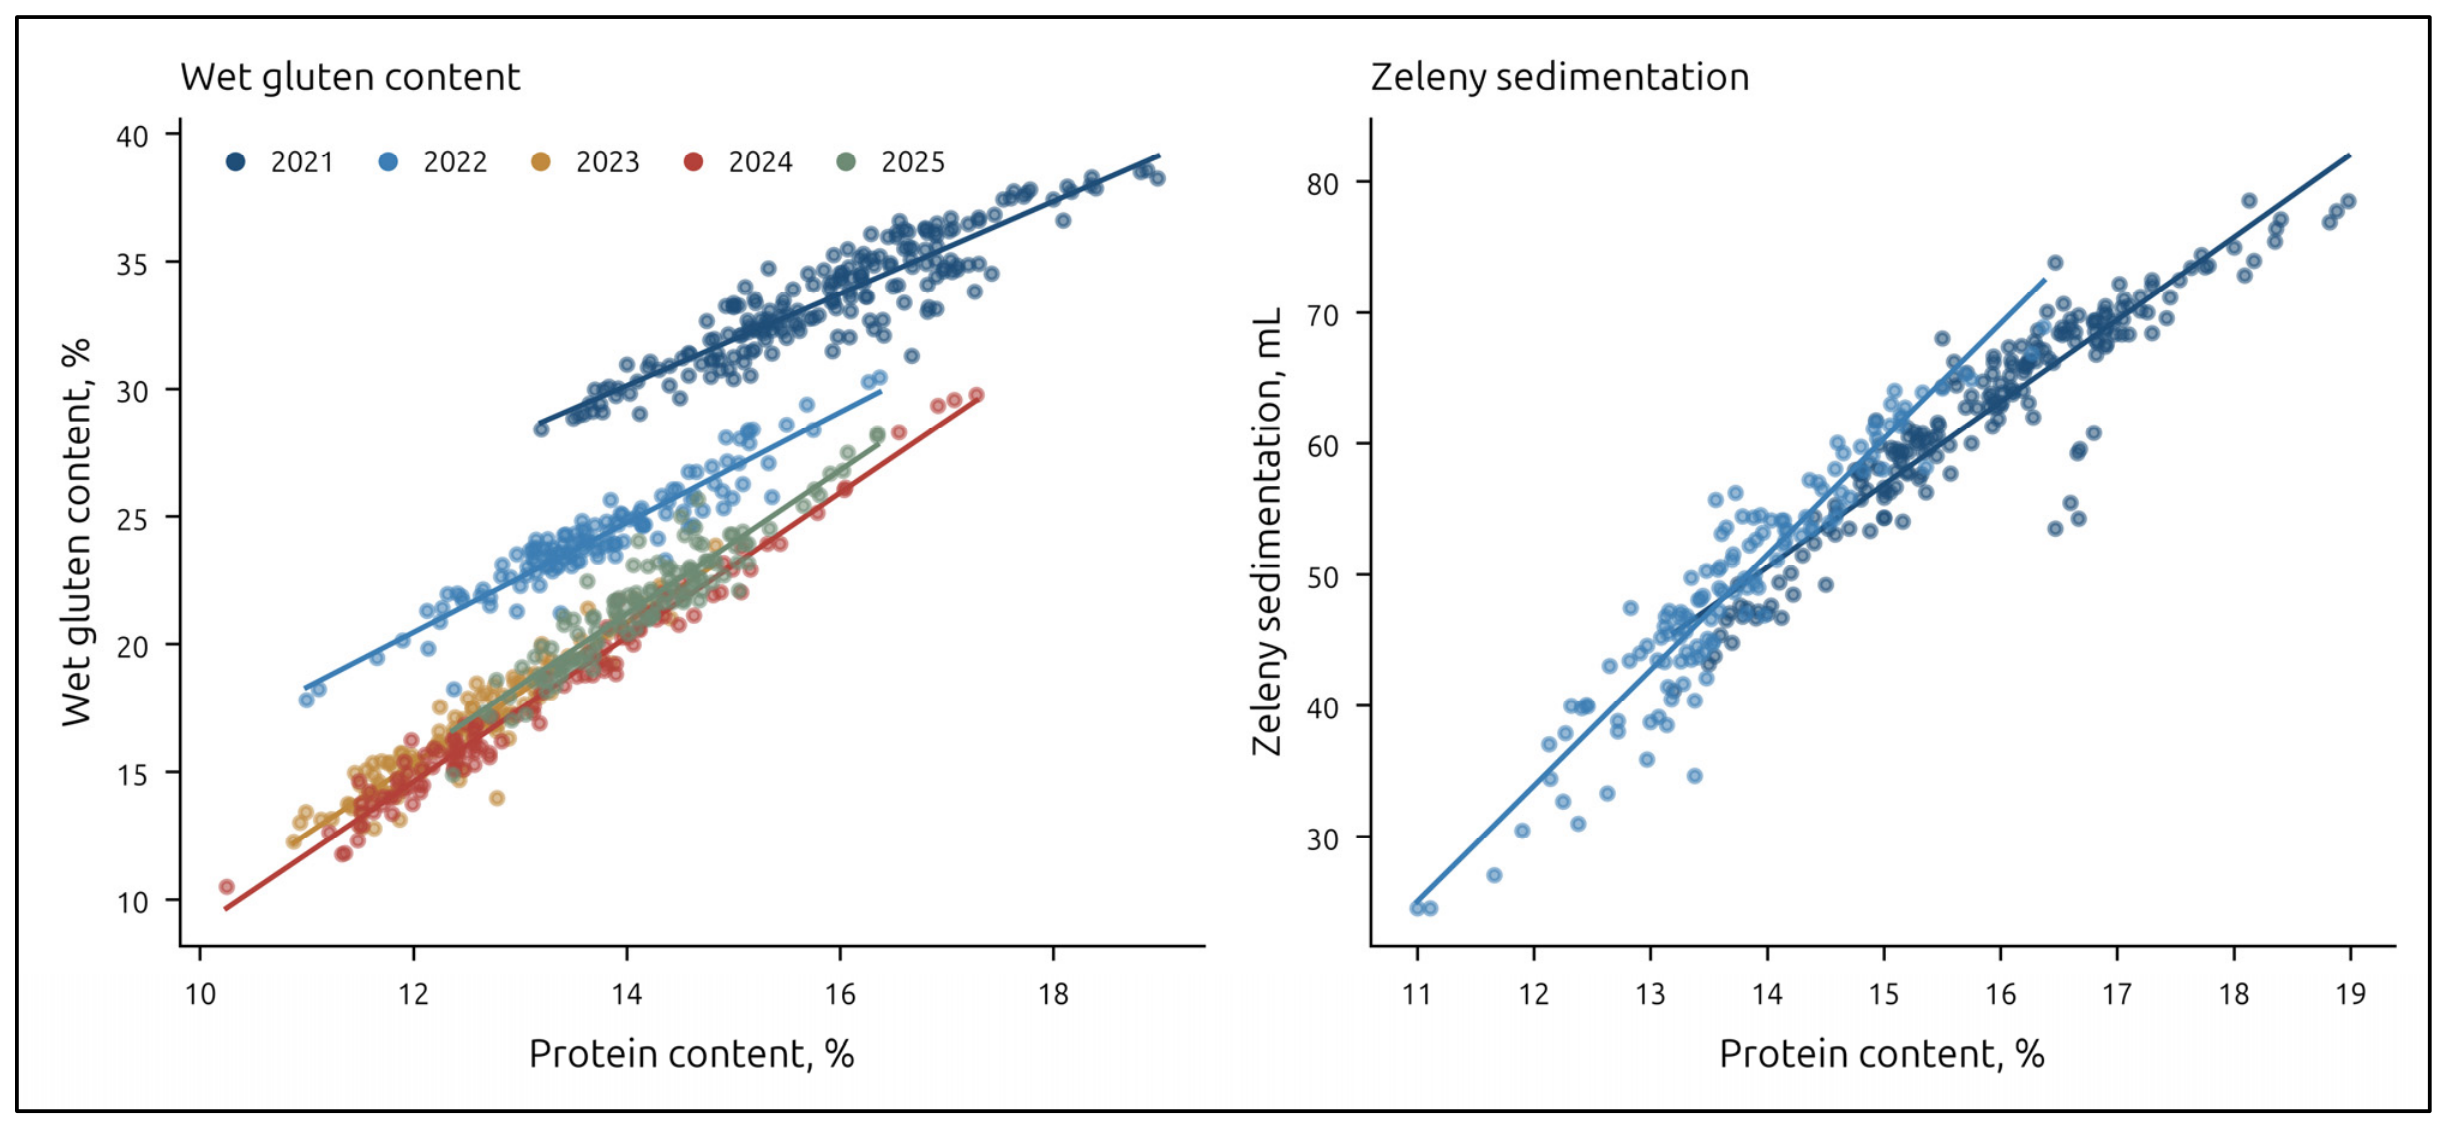
Wet gluten content and Zeleny sedimentation were not measured independently: the analyser computes them from the near-infrared spectrum from which protein content is obtained. The within-year coefficient of determination of wet gluten on protein content was 0.83–0.98, the regression slope shifted between years from 1.80 to 2.83 with changes of the calibration equation, and the ratio of the gluten effect to the protein effect within each year (1.84–2.66) followed this slope; for Zeleny sedimentation R2 was 0.87 (2021) and 0.89 (2022) (Figure 2, Table 2). The differences between haplotypes in these two indices therefore follow from the difference in protein content.
Figure 2.
Relationship of wet gluten content (left) and Zeleny sedimentation (right) to protein content within each harvest year. Each point is one cultivar in one environment; lines are within-year regressions, coloured by harvest year. The slope of wet gluten on protein content shifts between years from 1.80 to 2.83 with changes in the calibration equation of the instrument; coefficients of determination are given in Table 2. Zeleny sedimentation was recorded in 2021 and 2022 only.
Table 2.
Relationship of the NIR-derived quality indices to protein content within a harvest year.
2.3. The Effect Size Depends on the Year
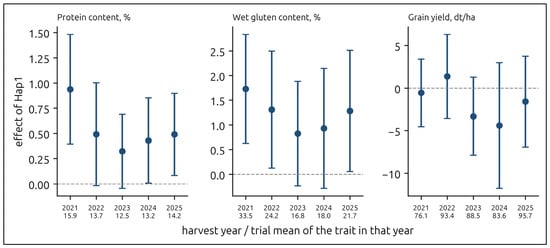
The effect was present in all five harvest years with the same sign but differed in magnitude: the sat2 × year interaction for protein content is significant (F = 4.52, p = 0.0013; q = 0.016 with correction across twelve traits). The effect was largest in 2021, the year with the highest trial mean protein content (15.9%) and the lowest precipitation: +0.937% (p = 0.0015). In the other years the estimates were +0.492% (2022), +0.323% (2023), +0.430% (2024) and +0.490% (2025, p = 0.023). In 2022–2024, with 41–43 cultivars in the yearly subsamples, the estimates did not reach significance; the minimum detectable effects of these subsamples (0.53–0.73%) are given in Table 3 (Figure 3).
Table 3.
Effect of Hap1 (contrast Hap1 − Hap2) within individual harvest years. MDE (80%), minimum detectable effect at 80% power and α = 0.05 (2.802 × SE of the contrast); a non-significant estimate smaller than the MDE should not be read as absence of an effect. Zeleny sedimentation was recorded in 2021 and 2022 only.
Figure 3.
Effect of Hap1 within individual harvest years for protein content, wet gluten content and grain yield. Points are the within-year contrast Hap1 − Hap2 with ± 95% confidence intervals; below the axis, the harvest year and the trial mean of the trait in that year. The sign of the protein effect is the same in all five years (sat2 × year: p = 0.0013), and grain yield did not differ between haplotypes in any year. Wet gluten content is computed by the near-infrared analyser from the same spectrum as protein content.
A sat2 × year interaction also passed the multiplicity correction for starch content (p = 0.0041; q = 0.024) and grain yield (p = 0.0096; q = 0.038). Neither trait showed a main effect of the haplotype, so these interactions reflect a year-to-year fluctuation of estimates around zero.
2.4. No Interaction with the Crop Management Level Was Detected
No interaction between the haplotype and the crop management level was detected. Across the three levels applied in all five harvest years (T1–T3; 15 environments) p = 0.283 for protein content, 0.152 for wet gluten content, 0.823 for Zeleny sedimentation and 0.867 for grain yield; none of the interactions with crop management pass the multiplicity correction (q ≥ 0.75; Table 4). Because a non-significant interaction does not establish equivalence, the simple effects within levels were estimated directly (Table S3): the protein content was +0.55% (95% CI 0.18–0.92) under T1, +0.49% (0.12–0.86) under T2 and +0.66% (0.29–1.03) under T3; the difference T3 − T1 was +0.11% (95% CI −0.10 to +0.33; minimum detectable difference 0.30%). Under T4, applied in 2021 only, the effect was +0.84% (0.25–1.43). The data are thus compatible with differences in the haplotype effect between the extreme levels of up to about 0.3% of protein content. Intensification itself raised grain yield under T3 relative to T1 by 8.7–20.2 dt/ha in every year, whereas its effect on protein content ranged from +0.06% (2022) to +2.26% (2024) (Table S4).
Table 4.
Tests of the haplotype × environment and haplotype × collection structure interactions (Kenward–Roger F tests; q, Benjamini–Hochberg correction within each interaction type). The crop management test uses levels T1–T3 of all five harvest years. Zeleny sedimentation was recorded in two harvest years only, so its interaction with year has one degree of freedom and F ≈ 0 (within-year estimates +5.08 and +5.03 mL in the interaction model; the separate within-year models in Table 3 give +5.14 and +4.39 mL).
2.5. Cultivar Origin and the Glutenin and 1BL.1RS Loci
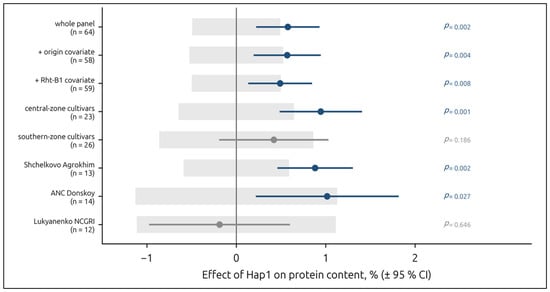
Haplotype frequencies were unrelated to the recorded origin group (χ2 = 4.28, df = 2, permutation p = 0.133) and to the breeding centre (permutation p = 0.54; Table S5), and the origin covariate left the estimate unchanged (+0.569%, p = 0.0037). Genome-wide marker data are not available for the collection, so population structure could not be controlled by a kinship matrix or principal components. An exploratory comparison showed a larger effect in cultivars of central-zone breeding (+0.944%, p = 0.00052, 23 cultivars) than of southern breeding (+0.419%, p = 0.19, 26 cultivars; minimum detectable effect 0.86%); the sat2 × origin interaction is not significant (F = 2.10, p = 0.15). Within centres the effect is significant in cultivars of Shchelkovo Agrokhim (+0.881%, p = 0.0016, 13 cultivars) and ANC Donskoy (+1.016%, p = 0.027, 14 cultivars) and absent in cultivars of the Lukyanenko centre (−0.188%, p = 0.65, 12 cultivars); these subsamples are small and the comparisons exploratory (Figure 4, Table S6).
Figure 4.
Effect of Hap1 on protein content with the origin and Rht-B1 covariates and in subsamples by origin zone and breeding centre. Points are estimates with ± 95% confidence intervals; the grey band is the minimum detectable effect of the subsample at 80% power and α = 0.05: an estimate inside the band could not be distinguished from zero at that number of cultivars. Blue, p < 0.05; grey, p ≥ 0.05. The haplotype × origin interaction is not significant (p = 0.15); the breeding-centre subsamples comprise 12–14 cultivars with protein records.
Three further quality loci genotyped in the collection were added as covariates: Glu-A1 (three alleles, 47 cultivars with an unambiguous call), Glu-D1 (two alleles, 45 cultivars) and the 1BL.1RS translocation (55 cultivars); Glu-B1 was nearly monomorphic (46 of 48 cultivars) and Gpc-B1 was not genotyped. Haplotype frequencies were not associated with these loci (Fisher’s exact test p = 0.08–0.88). On the cultivars typed for each locus the protein estimate changed from +0.86% to +0.71% with Glu-A1 (p = 0.0014), from +0.79 to +0.76% with Glu-D1 (p = 0.0011) and from +0.70 to +0.69% with 1BL.1RS (p = 0.0010); with all three covariates it changed from +0.84 to +0.71% (42 cultivars; p = 0.0039). Part of the effect is thus shared with Glu-A1, whose null allele is more frequent among Hap2 cultivars (six of 33 against one of 32). When the heterogeneous Glu-A1 and Glu-D1 samples are entered as separate factor levels instead of being treated as missing, the adjusted estimates are +0.47% (Glu-A1 and 1BL.1RS; 53 cultivars; p = 0.018) and +0.56% (all four loci; 47 cultivars; p = 0.015). The estimates without covariates on these subsamples exceed the whole-panel estimate because the cultivars lacking glutenin calls are not a random subset (Table S7).
2.6. Rht-B1 and Grain Yield as Covariates
Rht-B1 was typed for 60 cultivars (27 with the dwarfing alleles Rht-B1b or Rht-B1e, 33 with the wild-type Rht-B1a); its allelic state was distributed independently of the sat2 haplotype (χ2 = 0.000, permutation p = 1.00). On the 59 cultivars typed for both loci the effect is +0.491% (p = 0.0074) without and +0.490% (p = 0.0079) with the covariate, and no sat2 × Rht-B1 interaction was detected (p = 0.45 for protein content; Table S8); the difference from the whole-panel estimate reflects the composition of the subsample. With grain yield as a linear covariate the effect of Hap1 persists: +0.534% (SE 0.155; p = 0.0010); the yield coefficient is −0.022% protein per dt/ha, so a dilution effect is present in the data. The covariate entered uncentred, so the contrast is estimated at the mean yield of the data set (86.3 dt/ha); centring it changes only the intercept. The advantage of Hap1 is therefore retained at an equal yield level.
2.7. Structural Context of the Gly325Ser Substitution
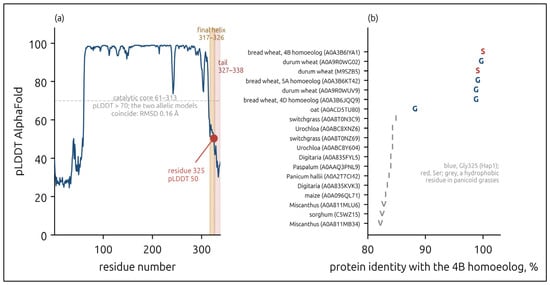
The substitution was located in the AlphaFold DB model of the subgenome B homoeolog of sat2 in bread wheat (UniProt A0A3B6IYA1, gene TraesCS4B02G330300, 338 residues), the chromosome 4B copy on which the polymorphism was identified in durum wheat [17]; the durum wheat entry of equal length (A0A9R0WG02) differs from it only at position 325 (Gly versus Ser), so both allelic states occur in the reference sequences of the two species. Gly325Ser lies at the C-terminal edge of the final helix (residues 317–326), thirteen residues from the C-terminus, in a region predicted with low confidence (pLDDT ≈ 50 at residue 325; 30–46 in the following disordered segment). The catalytic core (residues 61–313) is predicted with confidence (pLDDT > 70) and coincides in the models of the two allelic states to within 0.16 Å over Cα atoms, so no effect on the core is predicted (Figure 5).
Figure 5.
Structural context of the Gly325Ser substitution in the SAT2 protein, based on the AlphaFold DB model of the bread wheat 4B homoeolog (UniProt A0A3B6IYA1, gene TraesCS4B02G330300, 338 residues). (a) Prediction confidence (pLDDT) along the chain; the shaded bands mark the final helix (residues 317–326, orange) and the disordered C-terminal segment (327–338, red), and the dashed line marks pLDDT = 70. The predicted hydrogen bonds of Ser325 to the carbonyls of Glu321 (2.72 Å) and His322 (2.97 Å) are putative, as the local confidence at this residue is low (pLDDT ≈ 50). (b) Amino acid residue at the equivalent position in grass orthologs with more than 70% identity to the 4B homoeolog: blue, Gly325 (Hap1); red, Ser; grey, a hydrophobic residue in panicoid grasses, whose C-terminal sequence differs.
AlphaFold is not intended for evaluating single substitutions, so the local geometry is an illustration rather than evidence of a functional change. In the model the side chain of Ser325 is predicted to hydrogen bond the carbonyls of Glu321 and His322, capping the final turn of the helix; glycine cannot form this cap and leaves the following segment mobile. The C-terminal region of plant serine acetyltransferase participates in the formation of the cysteine synthase complex with OASTL [18,19,20], so a change in its mobility could shift the assembly equilibrium and the supply of cysteine to the developing grain; this remains a hypothesis that requires measurement of enzyme activity and complex formation for the two allelic forms. Among nineteen grass orthologs with more than 70% identity, position 325 is occupied by glycine in five sequences and by serine in two; in the panicoid grasses, whose C-terminal sequence differs, it is hydrophobic (Table S9). The position is not strictly conserved, which is compatible with the moderate magnitude of the effect.
3. Discussion
This is the first evidence that the sat2 polymorphism described as a candidate for protein content in durum wheat [17] is associated with grain protein content in bread winter wheat. Hap1, which carries G at TDsat2.e9.1 (Gly325) and T at TDsat2.i1.1, exceeded Hap2, the haplotype of the Chinese Spring reference genome, by 0.58% across 16 year × management environments of five harvest years at one site. The direction agrees with durum wheat, where the higher protein content is associated with nucleotide G of exon 9 [17]. Haplotype frequencies were unrelated to recorded cultivar origin and to Rht-B1, the effect persisted after adjustment for Glu-A1, Glu-D1, 1BL.1RS, and grain yield, and no interaction with the crop management level was detected within the power of the study.
The markers are not anonymous tags. Both polymorphisms lie inside sat2 on chromosome 4B, in subgenome B, which is shared by durum (AABB) and bread wheat (AABBDD), so they type the same homoeolog. The effect of the exonic variant was confirmed in durum wheat in recombinant inbred lines, where population structure is excluded by design, whereas the intronic variant rests on association evidence alone [17]. Together with the location of Gly325Ser in the regulatory C-terminal region of the enzyme, this provides a plausible functional hypothesis, not a demonstration of causality. The smaller effect in bread wheat (+0.58% against +0.92–1.33% in durum wheat [17]) may reflect homoeologous redundancy, since bread wheat carries a third copy of the gene in subgenome D, and the different genetic background of Russian winter cultivars.
The effect kept its sign in all five years but was about twice as large in 2021, the year with the highest trial mean protein content. Differences in the efficiency of sulphur use may become visible when protein accumulation is not constrained by other factors; with five harvest years and covarying weather variables this cannot be tested here and requires trials with a controlled sulphur supply.
For breeding, the haplotype can serve as an additional selection criterion in any year, most usefully in the pre-selection of parents and early-generation lines. The gain may be larger under conditions favourable for protein accumulation, but restricting selection to such environments is not warranted, because the differences between management levels are bounded by the data only to about ±0.3% (Section 2.4). Single-locus markers of this kind complement rather than replace genomic prediction and other data-driven approaches to crop breeding [21,22]; a locus with a confirmed effect, such as the sat2 haplotype, can enter genomic-prediction models as a fixed covariate, which would also test its contribution in broader germplasm. Because the effect was not detected in the cultivars of one breeding centre (Section 2.5), the association should be checked within a programme before the marker is applied to its material.
Whether the sat2 haplotype affects gluten quality itself, through the availability of cysteine for disulfide bond formation, remains open: in the present data wet gluten content and Zeleny sedimentation are computed from the same spectrum as protein content, and the question requires gluten washing, rheological tests and measurement of the cysteine content of the grain.
Limitations
The following limitations apply to this study.
- Wet gluten content, Zeleny sedimentation, starch content, vitreousness and the contents of crude fat, crude fibre and phosphorus are computed by the near-infrared analyser from a single spectrum and are not independent measurements; protein content is the output of the manufacturer’s calibration, whose reference method and accuracy are not available to the authors. Grain yield, thousand-kernel weight, test weight and falling number were measured independently.
- All cultivars were grown in a single trial at one site, so the 16 environments are year × management combinations at that site; the harvested plot area differed between years (17.3–41.1 m2) and between management levels within a year. Extrapolation to other regions requires multi-site trials.
- The minimum detectable effect for protein content at 80% power is 0.49%; equivalence of the haplotype effect across management levels was not established, the data bounding the difference between the extreme levels only to about ±0.3% of protein content (Table S3).
- Genome-wide marker data are not available for the collection, so population structure and relatedness could not be controlled by a kinship matrix or principal components; Glu-A1, Glu-D1 and 1BL.1RS were included as covariates only for the 42–55 cultivars typed for them, Gpc-B1 was not genotyped, and the breeding-centre subsamples comprise 12–14 cultivars with protein records.
- The nucleotide identity of the two variants is assigned from allele-specific PCR with primers designed on the gene sequenced in durum wheat [17]; the bread wheat cultivars studied here were not sequenced.
- The association was tested in a single collection of Russian bread winter wheat cultivars; confirmation in collections of different origin and genetic background is required before the marker is recommended beyond this gene pool.
4. Materials and Methods
4.1. Plant Material
The material was a germplasm panel of 65 registered cultivars and advanced breeding lines of bread winter wheat (Triticum aestivum L.) of different origin, maintained by Shchelkovo Agrokhim JSC for breeding purposes and not assembled for the present study (Table S5). It is not a mapping population: the accessions are independent cultivars from four Russian breeding centres and from foreign breeding, and no pedigree relationships beyond those recorded in Table S5 are known. Both sat2 markers were applied to the whole collection, and the analysis comprises the 65 cultivars with field data of the 2021–2025 harvests that carry one of the two frequent haplotypes (Section 4.2); the two cultivars carrying the rare third haplotype were excluded because no effect can be estimated from two carriers. High-molecular-weight DNA was extracted from four-day-old seedlings in three replicates by the CTAB method [23].
4.2. Genotyping
The allelic state of the two sat2 polymorphisms was determined by Kompetitive Allele-Specific PCR (KASP-PCR) with two markers developed at the All-Russian Research Institute of Agricultural Biotechnology (VNIISB) [17] for defined nucleotide polymorphisms of the gene (Table 5). The gene was identified in durum wheat as a candidate from a genome-wide association study and sequenced, so the polymorphisms are known at the sequence level: TDsat2.e9.1 types a G>A substitution in exon 9 that results in the amino-acid substitution Gly325Ser (nucleotide G corresponds to Gly325), and TDsat2.i1.1 a G>T substitution in intron 1 [17]. Both markers are intragenic and discriminate known nucleotide variants rather than anonymous polymorphisms.
Table 5.
KASP markers of the intragenic sat2 polymorphisms used in this study. Dye-to-nucleotide correspondence: TDsat2.i1.1, FAM = T, HEX = G; TDsat2.e9.1, FAM = G (Gly325), HEX = A (Ser325).
Haplotype classification was performed as follows. Each accession was assigned to one of the four possible two-marker haplotypes defined by the nucleotides at TDsat2.e9.1 and TDsat2.i1.1 (Table 6). In the 65 analysed cultivars the two markers were completely concordant: 32 cultivars carry Hap1 (G; T) and 33 carry Hap2 (A; G); Hap3 (G; G) was found in two cultivars of the collection (Zodiak and Lyutescens 982). With only two carriers no estimate of a haplotype effect is possible, so these cultivars were excluded from all models although their field records are available, and Hap4 (A; T) was not observed (D′ = 1 and r2 = 1 in the 65 cultivars; r2 = 0.89 over the 67 accessions with calls; Table S1). The bread wheat reference genome (cv. Chinese Spring, IWGSC RefSeq v1.0, gene TraesCS4B02G330300) carries A at TDsat2.e9.1 and G at TDsat2.i1.1, that is, Hap2; this was established by locating the allele-specific primers of Table 5 in the reference gene sequence. The haplotype and the call at each marker are given for every cultivar in Table S5.
Table 6.
Two-marker haplotypes of sat2, their nucleotide composition and occurrence in the collection.
Reactions were run in 96-well plates. A 10 µL mixture contained 5 µL of Master Mix KBS-1050-102 (LGC Biosearch Technologies, Hoddesdon, UK) with FAM, HEX and ROX dyes, the allele-specific and common primers (0.15 µM of each allele-specific primer and 0.375 µM of the common primer) and 5 µL of DNA (50 ng). Amplification was performed as follows: 94 °C for 15 min; 10 cycles of 94 °C for 20 s and 61 °C for 60 s with the annealing temperature decreasing by 0.6 °C per cycle; 35 cycles of 94 °C for 20 s and 55 °C for 60 s; and the signal was read at 37 °C for 60 s. Data were processed in Bio-Rad CFX Manager 3.1.
4.3. Field Trials
Trials were conducted in Oryol Oblast (52.9319° N, 36.0631° E, 194 m a.s.l.) on leached chernozem by NPO Betagran Seeds LLC as competitive variety trials of cultivars and breeding lines with check cultivars (Moskovskaya 39, Skipetr, Grom). Plots were sown with a Klin-1.5 drill (sown area 63 m2, 3 × 21 m; 15 cm row spacing; 3–5 cm seeding depth). The harvested plot area was smaller than the sown area and not constant: it ranged from 17.3 to 41.1 m2 between years and differed between management levels within a year (Table S10); yields were converted to decitonnes per hectare at 14% moisture in the primary records. The plot layout, the randomisation procedure and the positions of individual cultivars in different years were not recorded in the primary trial documentation.
The trials compared levels of crop management designated by the trial operator as technologies T1 (traditional), T2 (optimal-decision) and T3 (maximum-potential, the high-yield technology) in all five harvest years and, in 2021 only, a fourth level, T4, an integrated scheme intended to realise the genetic potential of the plants as fully as possible. According to the trial operator, the fertiliser scheme of T1–T3 was the same in all harvest years. The common background was a complex NPK(S) fertiliser (N5:P17:K36:S2) at 700 kg/ha. The differentiating applications were as follows: in autumn, ammonium sulphate (150 kg/ha) and, at T3 only, liquid complex fertiliser 11–37 (100 kg/ha); in early spring, ammonium nitrate (150 kg/ha) and UAN-32 (150 kg/ha) at all levels, with ammonium sulphate at T3 only; and at flowering, liquid complex fertiliser 11–37 (100 kg/ha at T3 and 50 kg/ha at T2) and magnesium sulphate (10 kg/ha, twice, at T3 and T2). Urea was applied at 20–30 kg/ha by growth stage and three times at T3 (10 + 20 + 20 kg/ha). T1 included plant protection products; T2 added foliar feeding with the preparations ‘Ultramag’ and ‘Biostim’ and fertilisers applied in dissolved form; T3 had an increased load of plant protection products and three foliar treatments. The 16 environments of the analysis are the combinations of harvest year and level (T1–T4 in 2021 and T1–T3 in each of 2022–2025) at this single site.
Grain yield (dt/ha), the contents of protein, wet gluten and starch, thousand-kernel weight, test weight, vitreousness, falling number and Zeleny sedimentation were recorded; the contents of crude fat, crude fibre and phosphorus were recorded in 2023–2025. The set of traits differed between years (Table S11); the analysis included 5913 observations. Growing seasons differed markedly (Table S11, Figure S1): the sum of active temperatures (>10 °C) ranged from 2343 °C (2021/22) to 3076 °C (2023/24) and annual precipitation from 517 mm (2020/21) to 779 mm (2023/24). The highest trial mean protein content (15.9%) was obtained in 2021, the year with the lowest precipitation.
4.4. Grain Quality Determination
The contents of protein, wet gluten, starch, vitreousness, crude fat, crude fibre and phosphorus and Zeleny sedimentation were taken from the near-infrared (NIR) whole-grain analyser InfraLum FT-12 (Lyumeks, Saint Petersburg, Russia), operated according to the manufacturer’s instructions with its standard calibration; each sample was measured in triplicate and the mean was used. Protein content is the directly calibrated variable, whereas wet gluten content and Zeleny sedimentation are computed by the instrument from the same spectrum (Section 2.2). Manual gluten washing and gluten deformation index measurements, which the laboratory uses as referee methods, were not recorded per plot in the primary record sheets and were not analysed. Details of the reference method underlying the manufacturer’s calibration and its accuracy are not available to the authors.
Grain yield was determined by weighing the grain from the harvested plot and converting it to a 14% moisture basis. Falling number was determined with ChP-3 and ChP-7 instruments (Biophysical Apparatus, Moscow, Russia) and test weight with a Purke PKh-1MTs tester (Priborinform, Rostov-on-Don, Russia), both according to the Russian state standards (GOST); thousand-kernel weight was determined by counting and weighing. These four traits were measured independently of NIR analysis.
4.5. Statistical Analysis
The sat2 polymorphism was the single a priori hypothesis of the work: the collection was typed with two markers of this gene, no locus was selected on the basis of the results, and the direction of the effect was specified from the durum wheat study [17] before the bread wheat data were analysed. Rht-B1 and the glutenin loci were added only as controls for possible collinearity. The composition of the collection was determined by the cultivars available at the partner breeding company and not by any trait or marker.
Computations were performed in R 4.5.3 (packages lme4, lmerTest, emmeans); the five-year test of the haplotype × crop management interaction was computed in R 4.6.0, which reproduces the main model exactly. The cultivar was the unit of replication for the genetic effect, because the haplotype is a property of the cultivar rather than of the plot. The main model was trait ~ sat2 haplotype + environment + (1 | cultivar), where the environment is the combination of harvest year and crop management level at the single site (16 levels); degrees of freedom were obtained by the Kenward–Roger approximation. Multiplicity was controlled by the Benjamini–Hochberg procedure separately within two trait families, eight NIR-derived indices and four independently measured traits; the interactions (sat2 × year, sat2 × crop management level T1–T3, sat2 × origin, sat2 × Rht-B1) were tested with the same correction within each interaction type. Because a non-significant interaction does not establish equivalence, the simple effects within each management level and the difference T3 − T1 were estimated with 95% confidence intervals and minimum detectable differences (Table S3). Additional models included the covariates of cultivar origin, Rht-B1, Glu-A1, Glu-D1, and 1BL.1RS (Tables S7 and S8), grain yield as an uncentred linear covariate, and the effect within individual years. The minimum detectable effect at 80% power and α = 0.05 was computed as 2.802 × SE of the contrast and is reported for every subsample. The association of haplotype frequencies with the origin group and with Rht-B1 was tested by a χ2 criterion with a permutation estimate of significance (20 000 permutations) and with the glutenin and 1BL.1RS loci by Fisher’s exact test.
The analysed data set comprised 65 cultivars for which both phenotypic data and a defined haplotype were available. Because the analysed data set contains one value per cultivar, environment and trait, within-trial error was estimated from the residual variance of the mixed model (Table S12). Quality data for 2023–2025 were taken from the primary record sheets. The full model outputs are given in Tables S1–S4, S6–S8 and S12–S14.
5. Conclusions
- Hap1 of sat2 (G at TDsat2.e9.1, Gly325; T at TDsat2.i1.1) exceeds Hap2 (A; G, the haplotype of the Chinese Spring reference genome) in grain protein content by 0.58% (95% CI 0.22–0.93; p = 0.0017; q = 0.014) across 16 year × management environments of five harvest years at one site. This is the first evidence of the association in Triticum aestivum L., and its direction agrees with durum wheat.
- The effect is not explained by yield dilution, by Rht-B1 or by recorded cultivar origin and persists (+0.71%) after adjustment for Glu-A1, Glu-D1 and the 1BL.1RS translocation; grain yield and the other independently measured traits do not differ between haplotypes.
- The effect kept its sign in all five years but was largest in the year most favourable for protein accumulation. No haplotype × crop management interaction was detected across levels T1–T3 of five harvest years; the data bound the difference between extreme levels to about ±0.3% of protein content.
- The Gly325Ser substitution lies in the regulatory C-terminal region of SAT2, which provides a plausible functional hypothesis for the association. Confirmation in collections of different origin and genetic background is required before the markers are recommended for marker-assisted selection beyond this gene pool.
Supplementary Materials
The following supporting information can be downloaded at https://www.mdpi.com/article/10.3390/plants15213340/s1, Table S1, linkage between the two markers and the Hap3 accessions; Table S2, full results of the statistical models and variance components; Table S3, simple effects of the haplotype within crop management levels and the difference between extreme levels; Table S4, differences between crop management levels in grain yield and protein content within harvest years; Table S5, characterisation of the collection studied, with the call at each sat2 marker and the haplotype of every cultivar; Table S6, stratification by origin and breeding centre; Table S7, the effect with the Glu-A1, Glu-D1 and 1BL.1RS covariates; Table S8, Rht-B1 as a covariate; Table S9, structural context of the Gly325Ser substitution; Table S10, harvested plot areas; Table S11, growing conditions and trait coverage by harvest year; Table S12, variance components of the main models; Table S13, tests of interactions; Table S14, the effect within harvest years; Figure S1, growing conditions by agronomic year.
Author Contributions
Conceptualization: M.D., A.C. and A.P.; methodology: M.A., K.K., T.V., E.O., A.P. and I.S.; validation: M.A. and K.K.; formal analysis: M.A., A.C. and M.D.; investigation: M.A., K.K., A.C., M.D., A.P., I.S., T.V. and E.O.; field trials and phenotypic data acquisition: A.P., S.K., I.S., T.V. and E.O.; resources: M.D., S.K. and A.P.; data curation: M.D., M.A., I.S. and A.P.; writing—original draft preparation: M.A.; writing—review and editing: M.D., A.C., A.P., S.K., I.S. and M.A.; visualization: M.A. and M.D.; project administration: M.D., A.C. and S.K.; funding acquisition: M.D. All authors have read and agreed to the published version of the manuscript.
Funding
This work was supported by the Ministry of Science and Higher Education of the Russian Federation (Federal Scientific and Technical Program for the Development of Genetic Technologies for 2019–2030, agreement No. 075-15-2025-480).
Data Availability Statement
The analytical data set used in all mixed models (cultivar, environment, sat2 haplotype, and values of the twelve traits; 5913 observations, 65 cultivars) is available from the corresponding author on reasonable request. The full model outputs are provided in Supplementary Tables S1–S14.
Conflicts of Interest
A.P. and S.K. are employees of Shchelkovo Agrokhim JSC, which owns the cultivar collection, developed the crop management levels and manufactures some of the fertilisers and plant-protection products used in them. I.S., T.V. and E.O. are employees of NPO Betagran Seeds LLC, which provided the trial site and conducted the field trials; T.V. and E.O. are also affiliated with RSAU-MTAA. These companies provided the plant material and the field and grain-quality data; genotyping, statistical analysis and interpretation were performed at VNIISB and RSAU-MTAA, and the companies had no role in the analysis, interpretation or decision to publish. The other authors declare no conflicts of interest. The funder had no role in the design of the study, in the analysis or interpretation of the data, or in the decision to publish.
Abbreviations
The following abbreviations are used in this manuscript:
| SAT2 | Serine acetyltransferase 2 protein |
| KASP-PCR | Kompetitive Allele-Specific PCR |
| HMW-GS | High-molecular-weight glutenin subunits |
| LMW-GS | Low-molecular-weight glutenin subunits |
| NAC | NAM/ATAF/CUC transcription factor family |
| Rht | Reduced height (dwarfing genes) |
| Gpc-B1 | Grain protein content B1 (NAC transcription factor) |
| 1BL.1RS | Translocation between chromosome 1B long arm and 1R short arm |
| CTAB | Cetyltrimethylammonium bromide |
| pLDDT | predicted Local Distance Difference Test |
| GOST | Russian state standards (for test methods) |
| VNIISB | All-Russian Research Institute of Agricultural Biotechnology |
| RSAU-MTAA | Russian State Agrarian University—Moscow Timiryazev Agricultural Academy |
| CI | Confidence interval |
| SE | Standard error |
| MDE | Minimum detectable effect (at 80% power and α = 0.05) |
| FDR | False discovery rate (Benjamini–Hochberg q value) |
| PCR | Polymerase chain reaction |
| Hap1–Hap4 | Two-marker haplotypes of sat2 defined by the nucleotides at TDsat2.e9.1 and TDsat2.i1.1 (Table 6) |
| NIR | Near-infrared (spectroscopy) |
| OASTL | O-acetylserine (thiol) lyase |
References
- Galimova, A.A.; Kuluev, B.R. Genetic determinants of bread-making quality of grain and the allelic state of waxy genes in bread wheat. Usp. Sovrem. Biol. 2021, 141, 611–621. (In Russian) [Google Scholar] [CrossRef] [Scilit]
- Temirbekova, S.K.; Kulikov, I.M.; Afanasyeva, Y.V.; Beloshapkina, O.O.; Kalashnikova, E.A.; Kirakosyan, R.N.; Dokukin, P.A.; Kucher, D.E.; Latati, M.; Rebouh, N.Y. The evaluation of winter wheat adaptation to climate change in the Central Non-Black Region of Russia: Study of the gene pool resistance of wheat from the N.I. Vavilov Institute of Plant Industry (VIR) world collection to abiotic stress factors. Plants 2021, 10, 2337. [Google Scholar] [CrossRef] [Scilit] [PubMed]
- Wang, Z.; Li, Y.; Yang, Y.; Liu, X.; Qin, H.; Dong, Z.; Zheng, S.; Zhang, K.; Wang, D. New insight into the function of wheat glutenin proteins as investigated with two series of genetic mutants. Sci. Rep. 2017, 7, 3428. [Google Scholar] [CrossRef] [Scilit] [PubMed]
- Janni, M.; Cadonici, S.; Bonas, U.; Grasso, A.; Dahab, A.A.D.; Visioli, G.; Pignone, D.; Ceriotti, A.; Marmiroli, N. Gene-ecology of durum wheat HMW glutenin reflects their diffusion from the center of origin. Sci. Rep. 2018, 8, 16929. [Google Scholar] [CrossRef] [Scilit] [PubMed]
- Utebayev, M.U.; Bome, N.A.; Zemtsova, E.C.; Kradetskaya, O.O.; Chilimova, I.V. Diversity of high-molecular-weight glutenin subunits and evaluation of genetic similarities in spring bread wheats from different breeding centers. Proc. Appl. Bot. Genet. Breed. 2021, 182, 99–109. (In Russian) [Google Scholar] [CrossRef] [Scilit]
- Korobkova, V.A.; Bespalova, L.A.; Ermolaev, A.S. Diversity of the allelic state of Glu-1 genes in a collection of durum wheat (Triticum durum Desf.) accessions. Sel’skokhozyaistvennaya Biol. 2023, 58, 840–851. (In Russian) [Google Scholar] [CrossRef] [Scilit]
- Wieser, H.; Koehler, P.; Scherf, K.A. Chemistry of wheat gluten proteins: Quantitative composition. Cereal Chem. 2023, 100, 36–55. [Google Scholar] [CrossRef] [Scilit]
- Janković, M.; Barać, M.; Pešić, M.; Dodig, D.; Kandić, V.; Žilić, S. The polypeptide composition, structural properties and antioxidant capacity of gluten proteins of diverse bread and durum wheat varieties, and their relationship to the rheological performance of dough. Int. J. Food Sci. Technol. 2015, 50, 2236–2245. [Google Scholar] [CrossRef] [Scilit]
- Uauy, C.; Distelfeld, A.; Fahima, T.; Blechl, A.; Dubcovsky, J. A NAC gene regulating senescence improves grain protein, zinc, and iron content in wheat. Science 2006, 314, 1298–1301. [Google Scholar] [CrossRef] [Scilit] [PubMed]
- Ageeva, E.V.; Leonova, I.N.; Likhenko, I.E. Lodging in wheat: Genetic and environmental factors and ways of overcoming. Vavilov J. Genet. Breed. 2020, 24, 356–362. [Google Scholar] [CrossRef] [Scilit] [PubMed]
- Korobkova, V.A.; Bespalova, L.A.; Yanovsky, A.S.; Chernook, A.G.; Kroupin, P.Y.; Arkhipov, A.V.; Yurkina, A.I.; Nazarova, L.A.; Mudrova, A.A.; Voropaeva, A.D.; et al. Permanent spreading of 1RS.1AL and 1RS.1BL translocations in modern wheat breeding. Plants 2023, 12, 1205. [Google Scholar] [CrossRef] [Scilit] [PubMed]
- Chumanova, E.V.; Efremova, T.T.; Kruchinina, Y.V. Effect of different dominant alleles of VRN loci and their combinations on the duration of developmental phases and productivity in bread wheat lines. Russ. J. Genet. 2020, 56, 805–818. (In Russian) [Google Scholar] [CrossRef] [Scilit]
- Kochetov, V.K. The winter wheat cultivar as the principal factor of raising productivity and obtaining grain and flour of the required quality. Nauchn. Zh. KubGAU 2012, 75, 1–13. (In Russian) [Google Scholar]
- Demina, I.F. Influence of weather conditions on the yield and quality of spring wheat grain in the forest-steppe of the Middle Volga region. Agrar. Nauka Evro-Severo-Vostoka 2022, 23, 433–440. (In Russian) [Google Scholar] [CrossRef] [Scilit]
- Zhang, H.H.; Li, Q.; Claver, I.P.; Zhu, K.X.; Peng, W.; Zhou, H.M. Effect of cysteine on structural, rheological properties and solubility of wheat gluten by enzymatic hydrolysis. Int. J. Food Sci. Technol. 2010, 45, 2155–2161. [Google Scholar] [CrossRef] [Scilit]
- Li, Y.; Fu, J.; Shen, Q.; Yang, D. High-molecular-weight glutenin subunits: Genetics, structures, and relation to end use qualities. Int. J. Mol. Sci. 2021, 22, 184. [Google Scholar] [CrossRef] [Scilit] [PubMed]
- Ermolaev, A.; Bespalova, L.; Korobkova, V.; Yanovsky, A.; Nazarova, L.; Kroupina, A.; Chernook, A.; Mudrova, A.; Voronezhskaya, V.; Kroupin, P.; et al. High-quality bonds: Serine acetyltransferase 2 gene revealed by GWAS is associated with grain protein content in spring durum wheat. Front. Plant Sci. 2025, 16, 1632673. [Google Scholar] [CrossRef] [Scilit] [PubMed]
- Bogdanova, N.; Hell, R. Cysteine synthesis in plants: Protein–protein interactions of serine acetyltransferase from Arabidopsis thaliana. Plant J. 1997, 11, 251–262. [Google Scholar] [CrossRef] [Scilit] [PubMed]
- Kumaran, S.; Yi, H.; Krishnan, H.B.; Jez, J.M. Assembly of the cysteine synthase complex and the regulatory role of protein–protein interactions. J. Biol. Chem. 2009, 284, 10268–10275. [Google Scholar] [CrossRef] [Scilit] [PubMed]
- Wirtz, M.; Birke, H.; Heeg, C.; Müller, C.; Hosp, F.; Throm, C.; König, S.; Feldman-Salit, A.; Rippe, K.; Petersen, G.; et al. Structure and function of the hetero-oligomeric cysteine synthase complex in plants. J. Biol. Chem. 2010, 285, 32810–32817. [Google Scholar] [CrossRef] [Scilit] [PubMed]
- Feng, W.; Gao, P.; Wang, X. AI breeder: Genomic predictions for crop breeding. New Crops 2024, 1, 100010. [Google Scholar] [CrossRef] [Scilit]
- Wang, P.; Li, Z.; Li, H.; Zhang, D.; Wang, W.; Xu, X.; Xie, Q.; Duan, Z.; Xia, X.; Guo, G.; et al. Smart crops. New Crops 2024, 1, 100007. [Google Scholar] [CrossRef] [Scilit]
- Rogers, S.O.; Bendich, A.J. Extraction of DNA from milligram amounts of fresh, herbarium and mummified plant tissues. Plant Mol. Biol. 1985, 5, 69–76. [Google Scholar] [CrossRef] [Scilit] [PubMed]

Disclaimer/Publisher’s Note: The statements, opinions and data contained in all publications are solely those of the individual author(s) and contributor(s) and not of MDPI and/or the editor(s). MDPI and/or the editor(s) disclaim responsibility for any injury to people or property resulting from any ideas, methods, instructions or products referred to in the content. |
© 2026 by the authors. Licensee MDPI, Basel, Switzerland. This article is an open access article distributed under the terms and conditions of the Creative Commons Attribution (CC BY) license.