


Abstract
Low-income residents are among the most vulnerable groups to climate change in urban areas, particularly regarding heat stress. However, their perceptions about heat and the impacts they face go often undocumented, and are seldom considered in decision-making processes delivering adaptation. This paper presents a robust tool to allow the integration of perception, concerns and impacts of different income groups in urban adaptation planning and governance, using the City of New York as a case study. Employing online interviews—a solid method to reach poorer households—and Fuzzy Cognitive Mapping, we compare impacts and adaptation perception to heat and simulate adaptation scenarios. Results reveal that lower income groups are more concerned about impacts of heat waves than middle- and high-income populations. All income groups see citizens more in charge of adaptation, although more people from the lower income groups regard it necessary to do much more to protect themselves, proportionately more people from the higher income groups think they are doing the right amount. The scenario analysis shows that, compared to investments in the water/electricity and health system, improvements in the transit system would yield the largest decrease in negative impacts during heat, benefitting all income groups jointly.
1. Introduction
Climate change increases the stress on urban areas through increasing the number of extreme events and hazards such as heat waves, inland floods, and storm surges which are affecting inhabitant’s lives and property, essential infrastructure and ecosystems [1]. Among these hazards, heat waves are the most deadliest, as in many countries they cause more fatalities than floods and hurricanes combined [2,3].
Globally there is strong evidence that heat waves will increase in duration and frequency over most land areas [4]. Impacts of heat waves on human and natural systems include direct effects caused by the direct exposure to higher temperatures and indirect effects, such as those on urban sectors such as water, energy, transportation and telecommunication [5]. Such indirect impacts may include a reduction of drinking water supply, increasing energy demand as well as heat-related mortality (death) and morbidity (illness) [6]. Furthermore, psychological health problems can occur and cause increasing violence and crime during heat events [7].
Heat wave impacts are stratified across the population, with certain socio-demographic groups being stronger affected than others. These vulnerable groups include infants, elderly, people with disabilities and health problems [2,6,8,9,10] and poor people and low-income groups. Low-income groups are among the most vulnerable to heat events due to their limitation to meet energy costs, their dependency on public facilities and problems in access to proper health care services [6]. Moreover, vulnerable and low-income populations may be concentrated in areas with increased exposure to risk. For instance, compared to higher-income populations, low-income communities tend to live in lower-standard or older buildings without the capacity to regulate temperature and humidity [8,11].
Whereas the relation between heat vulnerability and socio-demographic factors, such as age, race, gender, and poverty, is well examined [12,13,14,15,16], the role of economic factors such as different income levels (not only considering the poor and low-income, but also middle- and high-income people) is under-researched. Being a prominent vulnerability factor, income may play an important role in how citizens experience heat waves. It is the aim of this research to close this research gap, and compare the impacts and adaptation perceptions of different income groups in New York City. This information is then used to deduce socially sensible adaptation options, evaluating the effect of different adaptation scenarios on income groups.
The vulnerability concept is useful to understand and evaluate impacts and adaptation of climate change on human and environment system [6]. According to the IPCC Fifth Assessment Report (AR5), vulnerability is generally defined as “The propensity or predisposition to be adversely affected. Vulnerability encompasses a variety of concepts and elements including sensitivity or susceptibility to harm and lack of capacity to cope and adapt” [17] (p. 5). Vulnerability is also generally seen from two perspectives [17], described as:
- -
- Contextual vulnerability (starting-point vulnerability)
- -
- Outcome vulnerability (end-point vulnerability)
Contextual vulnerability assumes that certain socio-economic groups in society are more vulnerable than others even before an event happens. According to that understanding, groups such as the elderly, children, women, the poor and people with health issues belong to the most vulnerable, due to their existing circumstances making them more vulnerable than others. Outcome vulnerability assumes people only becoming vulnerable after a hazard occurred [18]. This can affect different groups in society and is not necessarily confined to the groups mentioned. Focusing on differences across income groups this research is based on the contextual vulnerability (starting-point vulnerability) concept, which is defined as: “A present inability to cope with external pressures or changes, such as changing climate conditions. The contextual vulnerability is a characteristic of social and ecological systems generated by multiple factors and processes” [19] (p. 1762).
For example, Rosenthal et al. [15] evaluated the socio-economic and build environment characteristics of places with high heat-related mortality in New York City. According to their results, there is a significant positive association between heat-related mortality and neighborhood characteristics, comprising less access to air conditioning (A/C), poor housing conditions, and poverty status. Energy costs associated with the use of air conditioning are also one of the major concern for low-income families during heat events. Low-income households who have access to A/C, do not use it due to the concerns about energy costs [20].
Air conditioning is one of the major and most frequent adaptation strategies to the impacts of heat waves in North American cities. However, to improve the effectiveness of air conditioning as an adaptive measure it is important to ensure access to functional air conditioners and sufficient energy for vulnerable groups [21]. Lemmen and Warren [21] suggest monetary support of low-income populations and programs for peak load and or voltage reduction. However, important to note, as long as traditional, non-renewable sources of energy are used to run A/Cs it is not a sufficient nor a sustainable solution, but has to be regarded as mal-adaptation instead [22]—as it may increase the vulnerability of natural and human systems over the long term. Nonetheless, the subsidization of air conditioning for low-income urban residents may entail new financial outlays and be offset by health-related cost savings due to the reductions in heat-related morbidity and mortality [6].
Adaptation in the context of climate change is defined as “Initiatives and measures to reduce the vulnerability of natural and human systems against actual or expected climate change effects” [12] (p. 69). Adaptation practices can take place at a different level from individual and household level to the community and institutional level. According to Jian Zuo et al. “The common mechanisms to deal with heat waves and the associated consequences include: structural/institutional, technological and cultural/behavioral” [10]. However, as Bolitho and Miller [23] argue, responses to extreme heat reflect a tension between a risk management paradigm (heat as an emergency) and a social vulnerability perspective (heat as chronic stress), whereas adaptation policy and planning that appreciates the interconnections between the two perspectives would likely reduce vulnerability and contribute to more urban sustainability [23]. Table 1 summarizes their views.
Table 1.
Heat wave adaptation measures with respect to risk management and vulnerability approaches. Source: [23] (p. 13).
In addition to these measures, infrastructure investments, particularly in vulnerable urban areas, urban greening programs such as green roofs, and building codes requiring reflective exterior surfaces are among the most effective and sustainable adaptation options, and should—according to the First Assessment Report of the Urban Climate Change Research Network (UCCRN)—therefore be strongly considered [1].
However, adaptation cannot be delivered by a top-down process, particularly in vulnerable urban communities, where residents’ views to impacts and adaptation needs and perceptions go often unheard and unrecognized [14]. Much in contrast the perception and views of vulnerable populations have to be integrated and made a vital part of adaptation planning, as citizens’ act on their beliefs and perceptions [24], which is vitally important for the success of adaptation on all levels—individual to community. To this end, it is also important to scientifically assess the residents’ views, making them part of urban research and community science for sustainable adaptation.
Innovative governance forms can help integrating vulnerable populations in research as well as the urban adaptation decision-making processes. The Organization for Economic Cooperation and Development (OECD) defines governance as “the formal and informal arrangements that determine how public decisions are made and how public actions are carried out, from the perspective of maintaining a country’s constitutional values in the face of changing problems” [25] cited in [26] (p. 5). Accordingly, climate change governance includes a broad spectrum of navigating mechanisms, which may include the collaboration of different actors and institutions according to hierarchical forms of principles and regulation [27]. Thereby, urban climate governance describes the ways in which private, public, and civil society actors articulate climate goals, exercise influence and authority, and organize urban climate planning and the process of implementation [28]. More precisely, as Chanza and De wit [29] argue, decentralization, autonomy, accountability, transparency, responsiveness, flexibility, participation and inclusion are basic elements of climate change governance.
Reviewing the state of the art on climate change governance, it is realized that the majority of studies focus primarily on mitigation and mitigation planning, set by the international and national levels of government. The more local dimension of adaptation and adaptation planning is not yet covered comprehensively [28,30,31].
We aim to assess the social sensibility and effectiveness of adaptation options by evaluating the potential consequences of adaptation scenarios on the reduction of detrimental impacts mentioned by the respondents. Respondents are distinguished by four groups: poverty, low-income, middle-income and high-income. To assess the consequences of adaptation scenarios across income groups, we use Fuzzy Cognitive Mapping (FCM) [32,33,34,35]. The importance of mental models and cognitive maps in identifying and evaluating the key elements of climate change impacts has been highlighted in adaptation research [32,33,34,36,37]. Cognitive maps are a representation of external reality by using individual’s perceptions, experiences, and knowledge structured by the respondents’ reasoning. Capturing groups or individual’s cognitive maps regarding climate change impacts clearly illustrates how individuals understand climate problems [36], which can be used to develop adaptation strategies. FCM is able to deduce socially sensible adaptation options by way of manipulations of the network denoting if-then-connotations, e.g., by way of adding elements—exemplifying new policies, cutting relations or lowering their link weight—exemplifying ceased or lowered influence, or by changing concept weight—exemplifying reduced importance of an element.
It should be highlighted that, by using perception data (not focusing on scientific facts) and by using online questionnaires to collect those, “hard to reach” populations such as people in poverty and low income groups are included as active stockholders in the research on adaptation planning. By that, we also hope to give these groups a voice in the climate change adaptation and planning process.
The main objective of this research is to develop an evaluation tool to simulate heat wave adaptation according to different income group’s perceptions especially hard to reach population such as in poverty group and low-income citizens. The research is structured along the following research questions in order to reach the main objective.
- -
- What are the main differences across income groups in regards to their concerns about future impacts of heat waves?
- -
- What are the main differences across income groups in regards to their opinion about citizens’ responsibility in heat wave adaptation and urban sector(s) most in need of adaptation actions during future heat waves in NYC?
- -
- What are the main differences between different income groups’ cognitive maps in regards to impacts of heat waves in NYC?
- -
- How do prominent adaptation options affect different income groups in NYC, i.e. lower the impacts of heat waves for each group?
2. Materials and Methods
This research focuses on New York City (NYC), for which heat events are projected to approximately triple in frequency by the end of the century [12,38]. Nevertheless, municipal climate change plans in NYC, such as PlaNYC (PlaNYC is a plan released first by New York City Mayor Michael Bloomberg in 2007 to prepare the city for one million more residents, strengthen the economy, combat climate change, and enhance the quality of life for all), focus more on the impacts of floods and coastal storms, as compared with the impacts of heat waves. Furthermore, New York City is one of the socially most unequal cities in the world and the third most unequal city in the U.S. regarding economic issues [39]. There is a huge difference between different income groups in New York City and economic characteristics of citizens seem to play an important role in how New York citizens experience impacts of heat waves, e.g., by changing the way residents’ can access adaptation options.
2.1. Data
The main data used in this research are the output of an online questionnaire conducted in November/December 2013 in New York City (the online interview was part of a research project sponsored by the Center for Research on Environmental Decisions (CRED), Columbia University under the direction of Dr. Diana Reckien (more info in: http://cred.columbia.edu/research/all-projects/socially-different-climate-change-impacts-and-adaptation-options-in-nyc/)). The interview includes individuals who are 18 years of age or older, living in the five boroughs. The interviews were conducted by using the professional survey provider Qualtrics and their survey software. More than 1200 attempts (complete and incomplete questionnaires) were initially registered. The final number of valid, fully completed questionnaires comprises 762 after rigorous automated and manual quality control, which should reduce concerns about the quality of the online questionnaire data to a minimum. The questionnaire lasted for approximately 30 min. Respondents were compensated with 4 US$ per completed questionnaire Automated quality control included IP address check, captcha code, attention questions, and valid ZIP code check, and completeness. Manual quality control comprised checking the understanding, truthfulness and reliability of the responses.
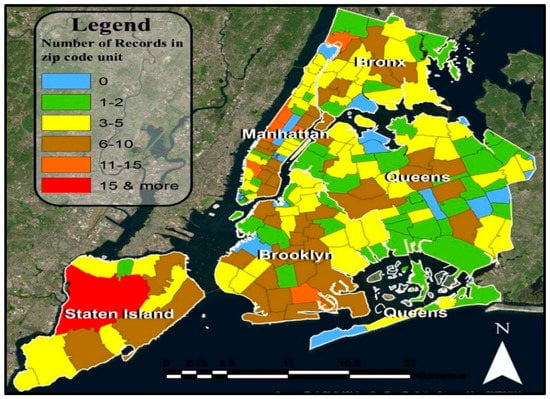
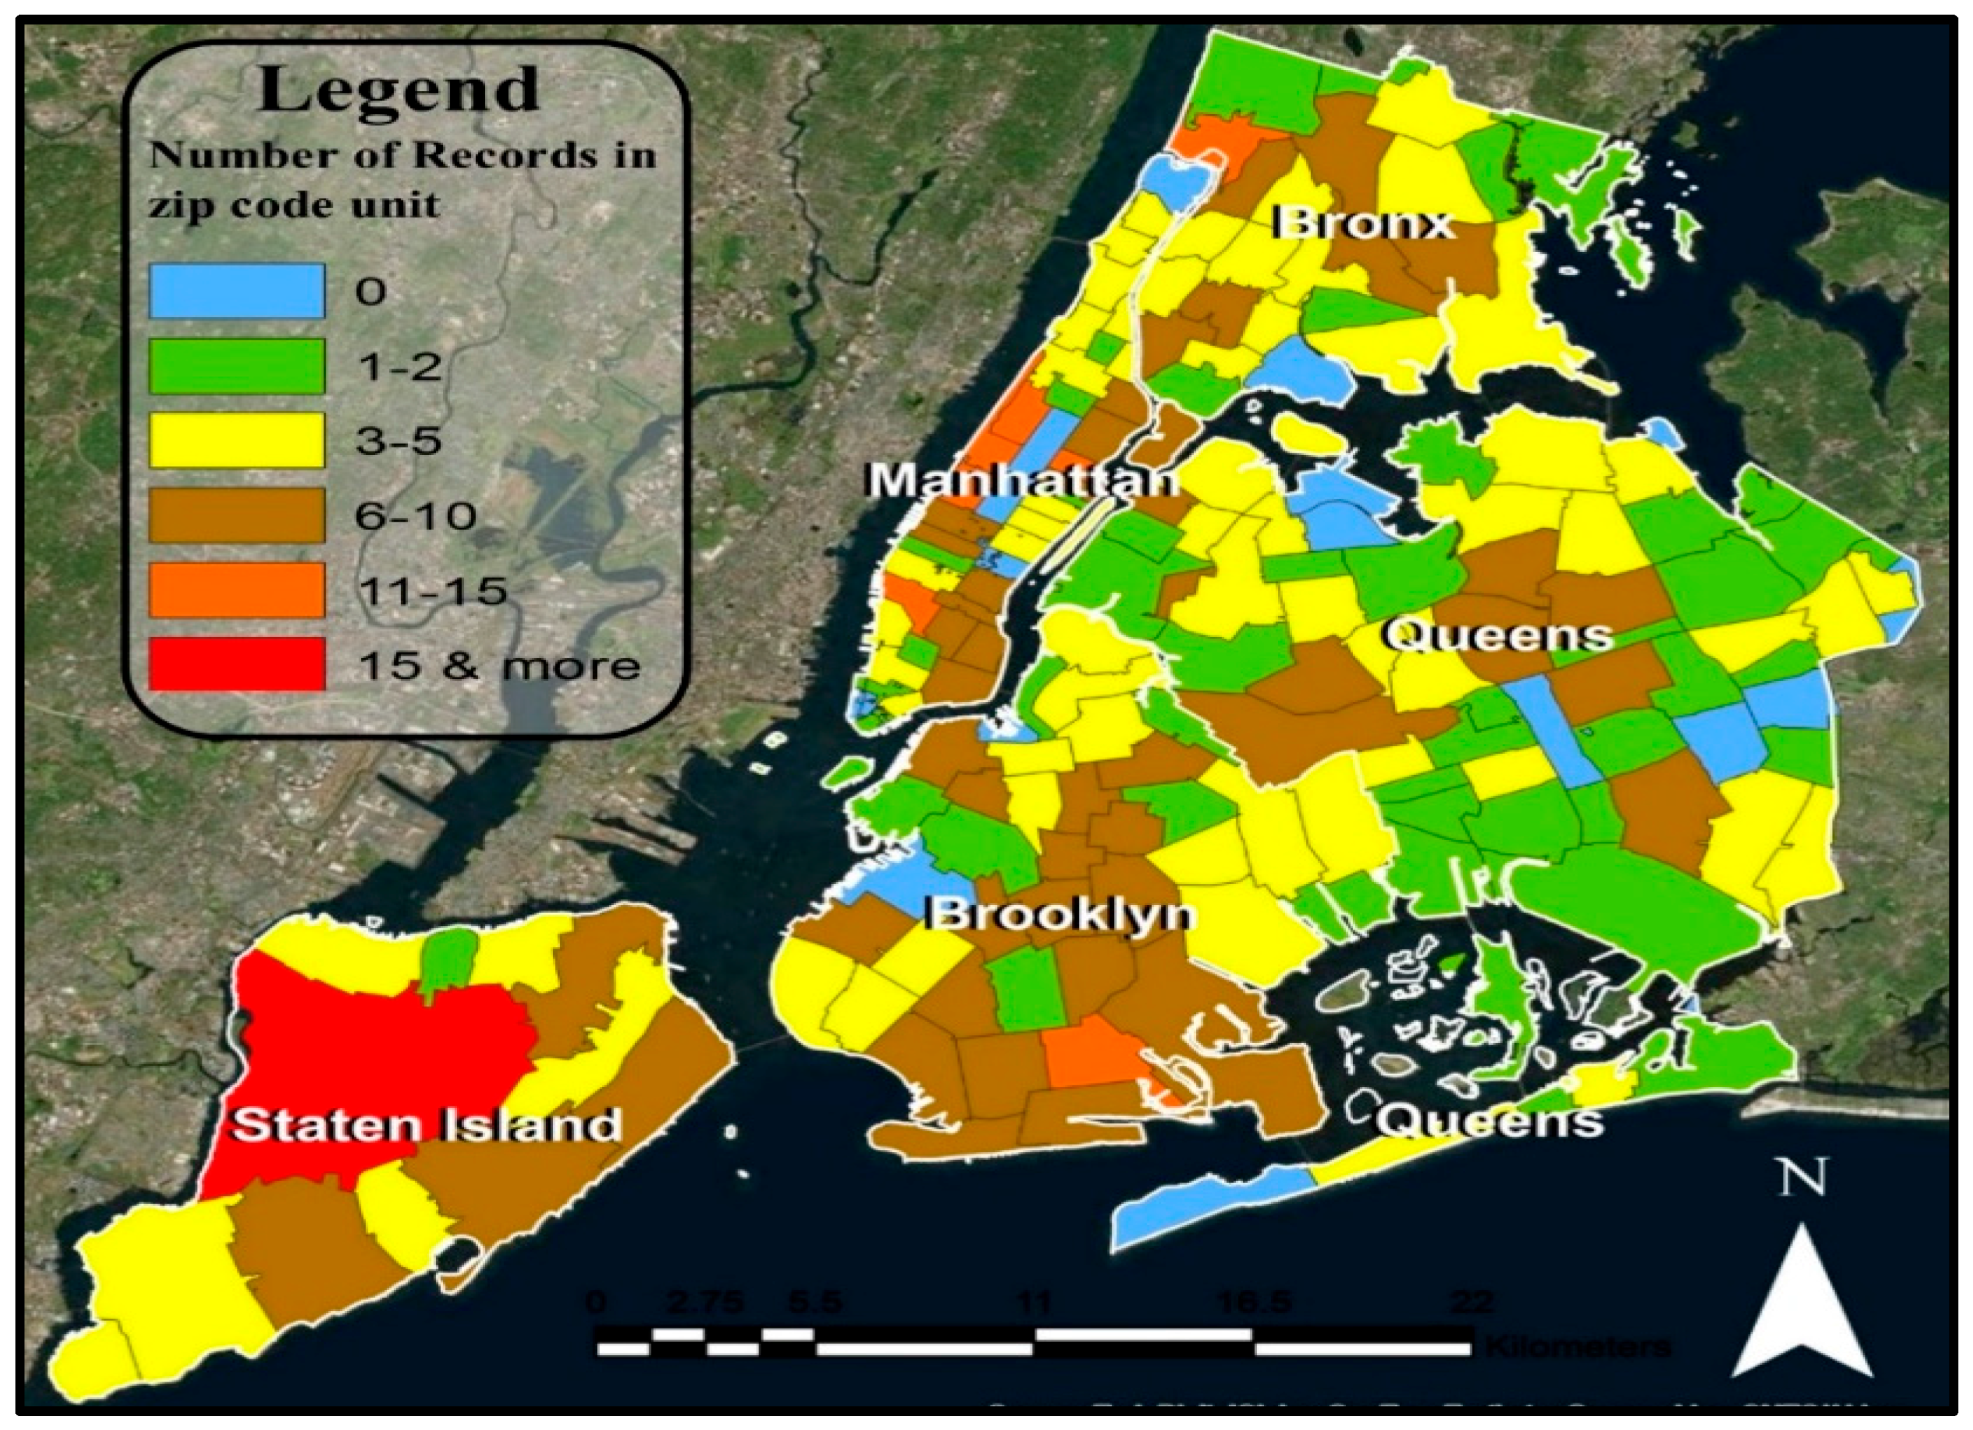
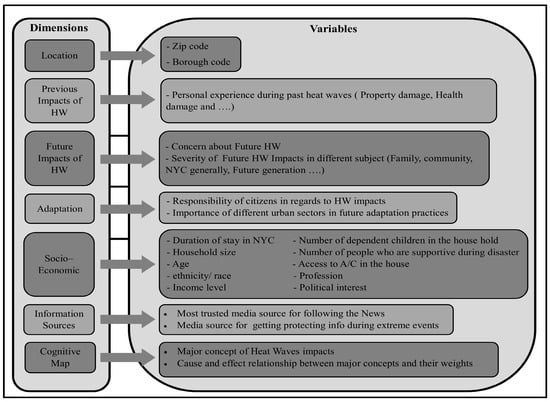
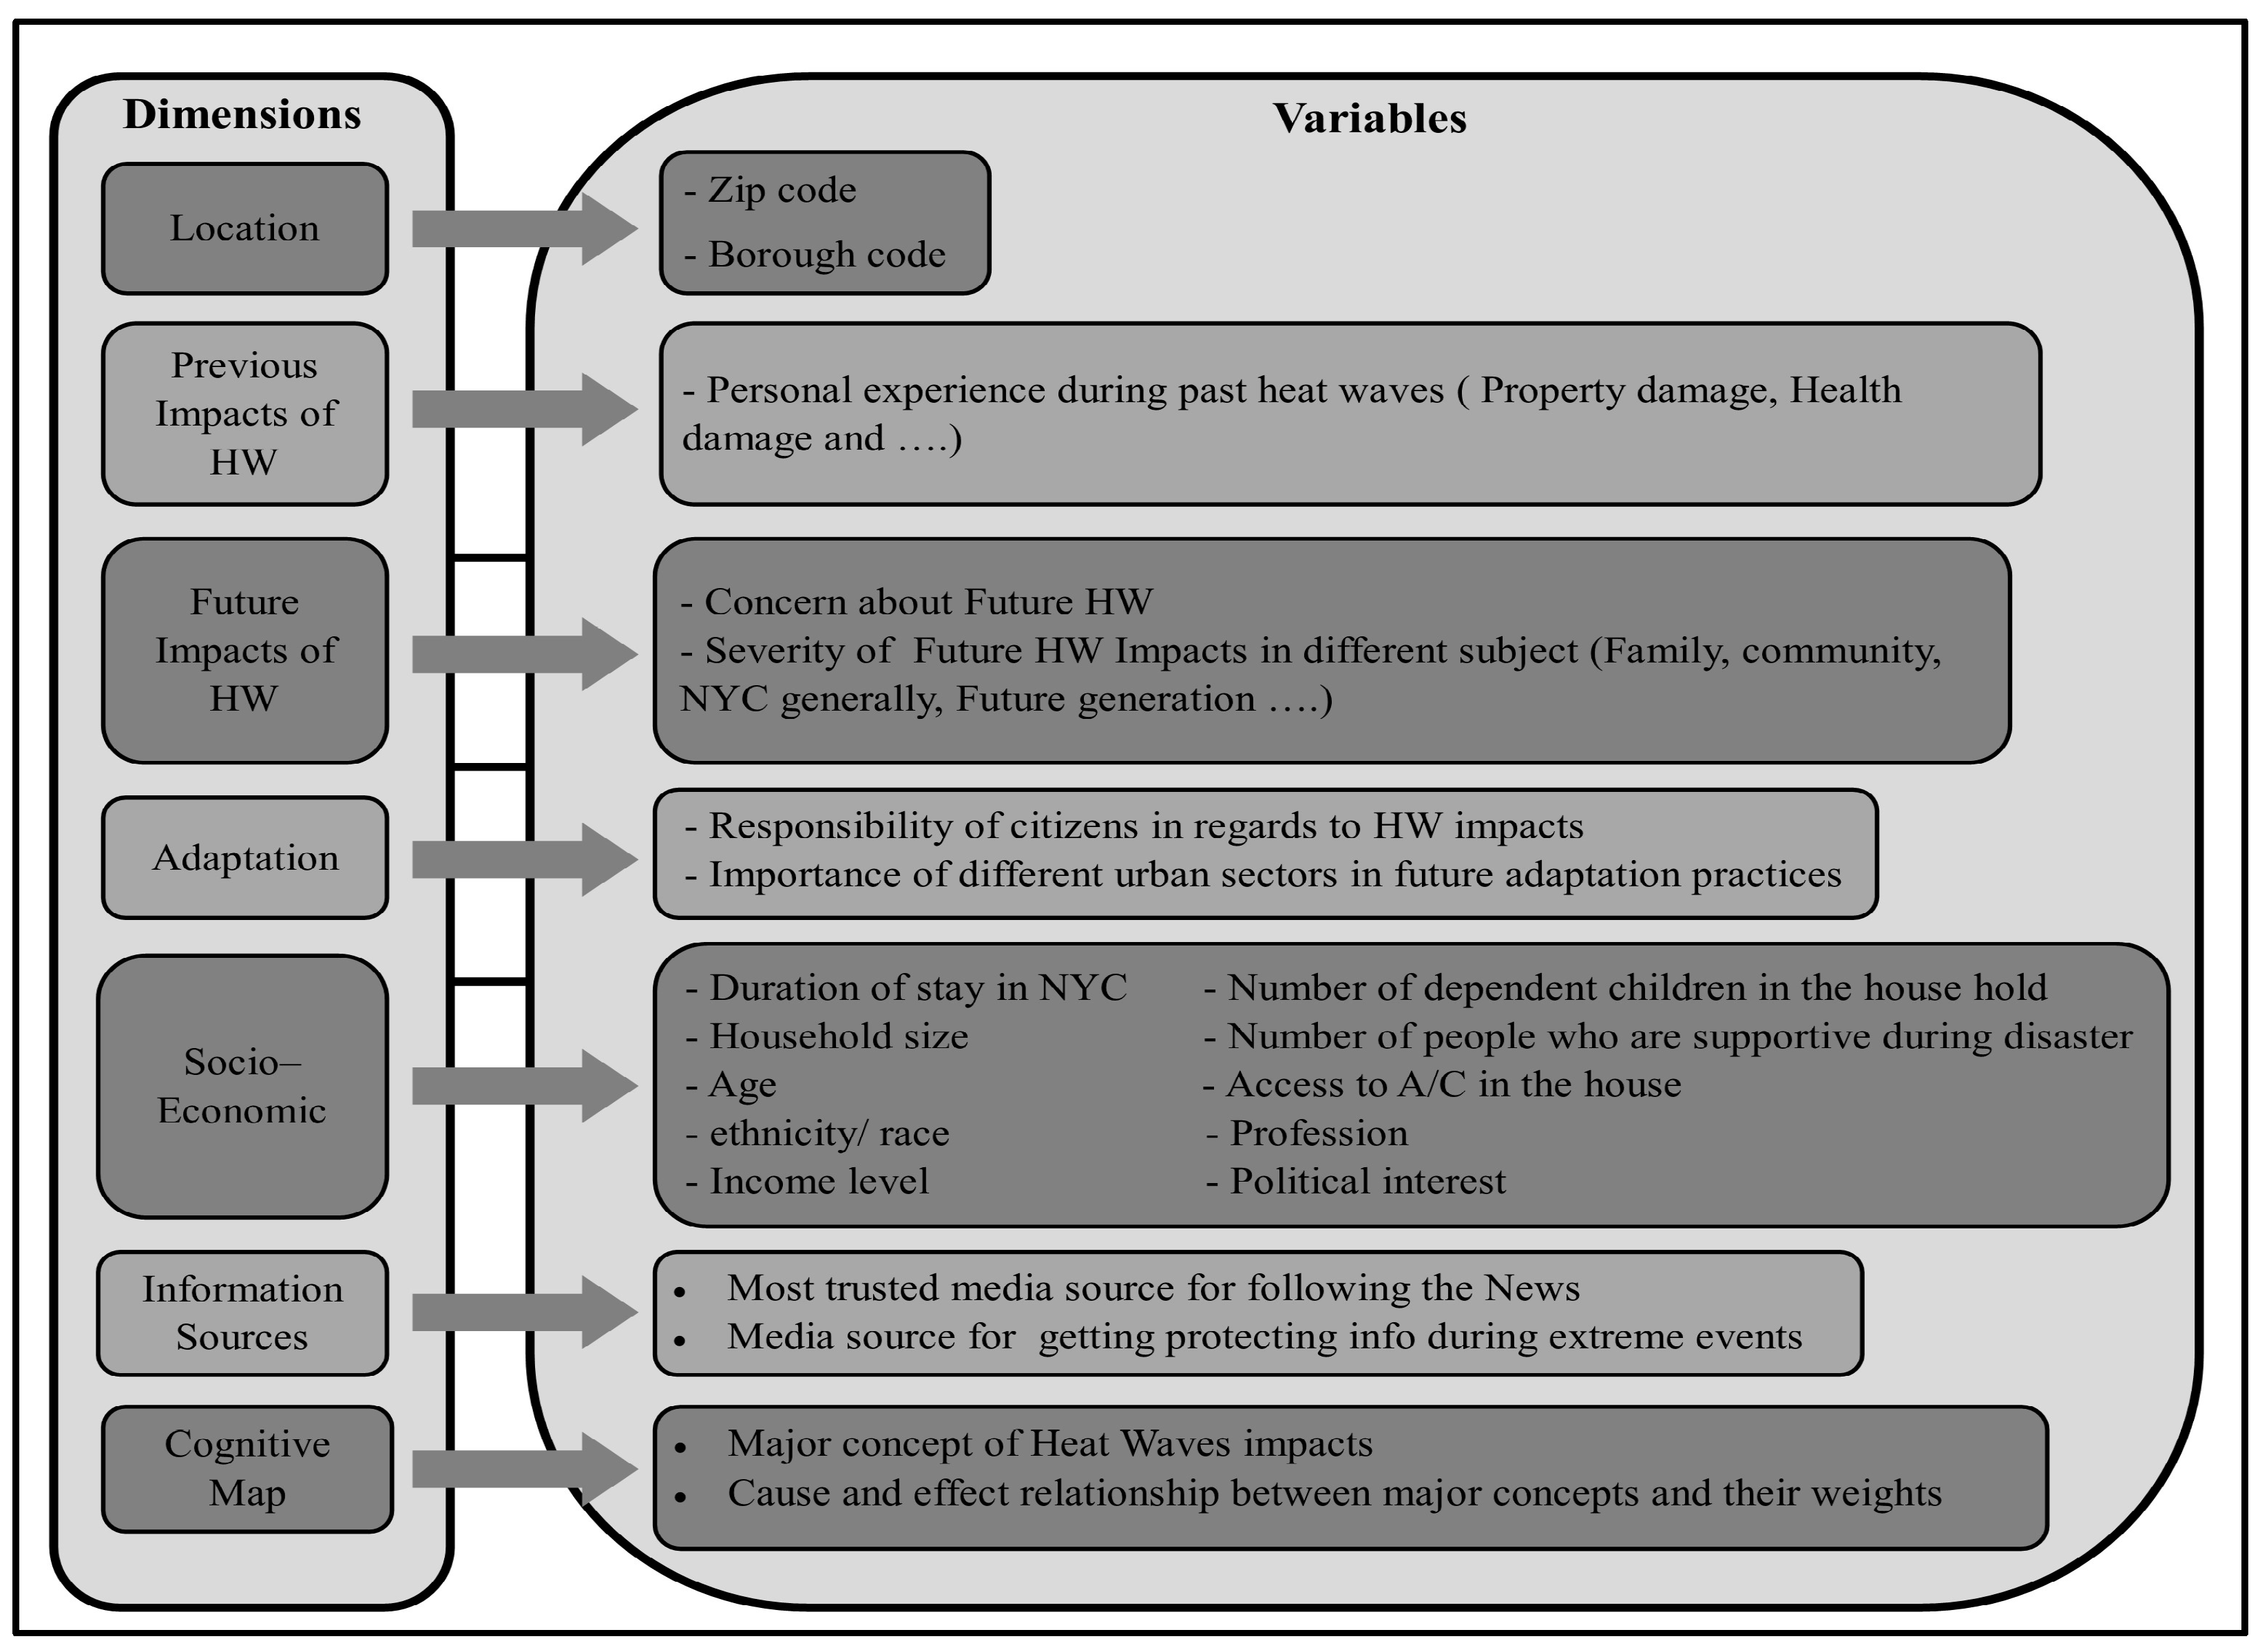
The distribution of dataset records across boroughs and NYC zip/postal codes is presented in Figure 1. The dataset includes participants from all over New York City; there are only few zip-codes without any participant. The dataset includes seven main dimensions, and each dimension includes different variables, which is presented in Figure 2.
Figure 1.
The distribution of dataset records across New York City on zip/postal code level.
Figure 2.
Structure of the dataset.
2.2. Methods
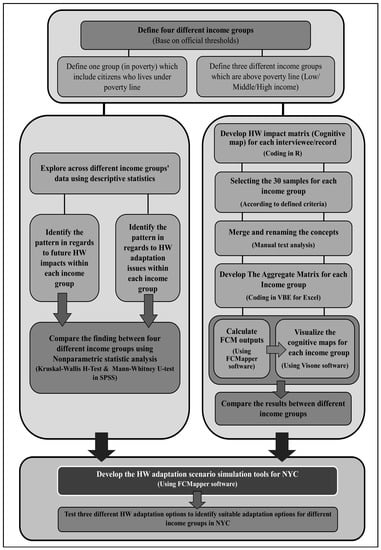
An overview of the applied research methodology is presented in Figure 3. To identify differences across income, the research defines four income groups:
Figure 3.
Flowchart of research methodology.
- -
- People living in poverty
- -
- Low-income group
- -
- Middle-income group
- -
- High-income group
The group of people living in poverty is defined based on suggested poverty thresholds by DeNavas-Walt and Proctor [40], using household income and household size variables available in the dataset. To define the other three groups, at least the threshold for the middle-income group had to be defined. It is important to consider that “there is no official government definition of who belongs to the middle class. The middle class may refer to a group with a common point of view or to those having similar incomes” [41] (p. 4). Accordingly, there are different methods to define the middle class. In this study, we used the method introduced in the Congressional Research Service report [41] and formulated by the Pew Research Center. Similar to Kiersz and Kane [42] using the Pew Research Center method and applying it to data of median income from the US Census Bureau’s American Community Survey 2013, we define the thresholds for middle-income groups in New York City based on our dataset.
Data analysis is split in two main parts. The first part is a statistical analysis to find significant differences across the four defined income groups with regard to future impacts of heat waves and related adaptation issues in New York City. We use non-parametric statistics, i.e., the Kruskal–Wallis H-Test, as the dataset mainly consists of nominal and ordinal variables [43,44]. To identify the particular differences between sample pairs, the Mann–Whitney U-test was selected.
The second section focuses on the FCM analysis. FCM is a semi-quantitative analysis method that is based on casual reasoning. The FCM method translates stakeholder knowledge, experience or perception to a network consisting of nodes as main concepts and weighted connections representing their causal relations in a system. By using this method, the cause–effect relationships between main concepts of a system can be quantified and simulated—important for adaptation decision making [32]. Olazabal and Reckien [32] provided a step by step guide to do so.
The FCM analysis starts with a transformation of the FCM data of each interviewee (record), i.e., impact networks of heat waves, into impact matrices using R programing language. As a next step, the sample for the FCM analysis is selected based on the socio-demographic characteristics of interviewees (records). In order to achieve a sufficient level of validity and reliability of the results accumulation curves are used, such as those suggested by Özesmi and Özesmi (2004). This resulted in samples of 30 records for each income group. The main criteria for selecting the sample are given below (from highest to lowest priority):
- Highest number of stated concepts (minimum 4 concepts must be stated)
- Equal distribution in different boroughs (according to database availability)
- Equal composition in age groups (according to database availability)
- Equal composition of gender (according to database availability)
In the next step, the FCM matrix of each interview analyzed was coded into one united format using manual text analysis. After that, the 30 individual cognitive maps in each income group were aggregated to one social cognitive map for each income group. Then, the social maps were visualized using Visone, analyzed by way of network statistics and structure analysis and simulated using FCMappers software (open access software accessible in www.FCMAPPERS.net).
FCM scenario simulation analysis focuses on the effect that each concept has on the other concepts in the network over a number of iterations or time steps (k) (normally 20−30 iterations) [45]. “Scenario generation has been recognized as one of the most valuable applications of FCM in general and in environmental management in particular” [45,46] cited in [32] (p. 158). To test the developed tools, three different scenarios are simulated and tested for each income groups:
- Investment in and development of the NYC public health sector
- Investment in and development of the NYC water and electricity system
- Investment in and development of the NYC transit sector
To conduct the scenario analysis, the concepts in the network belonging to each scenario (1, concepts regarding health; 2, concepts regarding water and electricity; and 3, concepts regarding public transportation) are fixed to one value throughout all iterations of the matrix multiplication. That means that after an initial value of 1 for all concepts, fixed concepts remain at 1, i.e., denoting steady increase, or are put to lower values or 0 for a particularly low or no influence. The change and effect on non-fixed concepts in the network is then compared to the matrix multiplication without an intervention (usually until a steady state is reached) [32].
The selected fixed value for concepts in scenario simulation must be between 0 to 1 (Olazabal and Reckien, 2015). The concepts with regard to health issues is mainly set to 0.1, which means the effect of that concept would be reduced to a minimum but still affect the system. For the other scenarios, i.e., the water and electricity scenario and transit sector scenario, the related concepts are mainly put to 0, which means that the effect of those concepts is completely removed. It should be considered that all these numbers are relative. For instance, a value of 0.9 compared to 0.1 does not mean that the effect of the first value is 9 times bigger than the smaller one—it is just “much stronger” or “a lot larger”. Detailed information to the selected values for each scenario is presented in the Appendix A.
3. Results
3.1. Perceived Extent of Climate Change Impacts in the Future
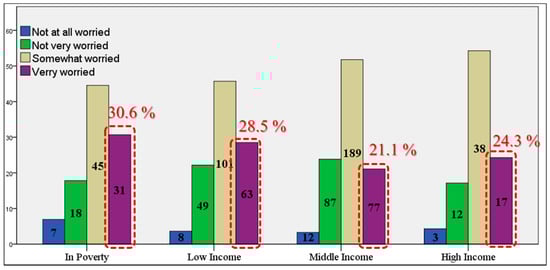
Figure 4 shows the residents’ worry about heat waves in the future, i.e., the next 20 years. According to our results, more people living in poverty and of low income than residents of middle and high income are very worried about future impacts of heat waves—the highest category. In contrast, more middle- and high-income residents are (only) somewhat worried.
Figure 4.
Concern about future impacts of heat waves across income level. The heights of the bars represent percentages, whereas numbers inside the bars represent number of respondents.
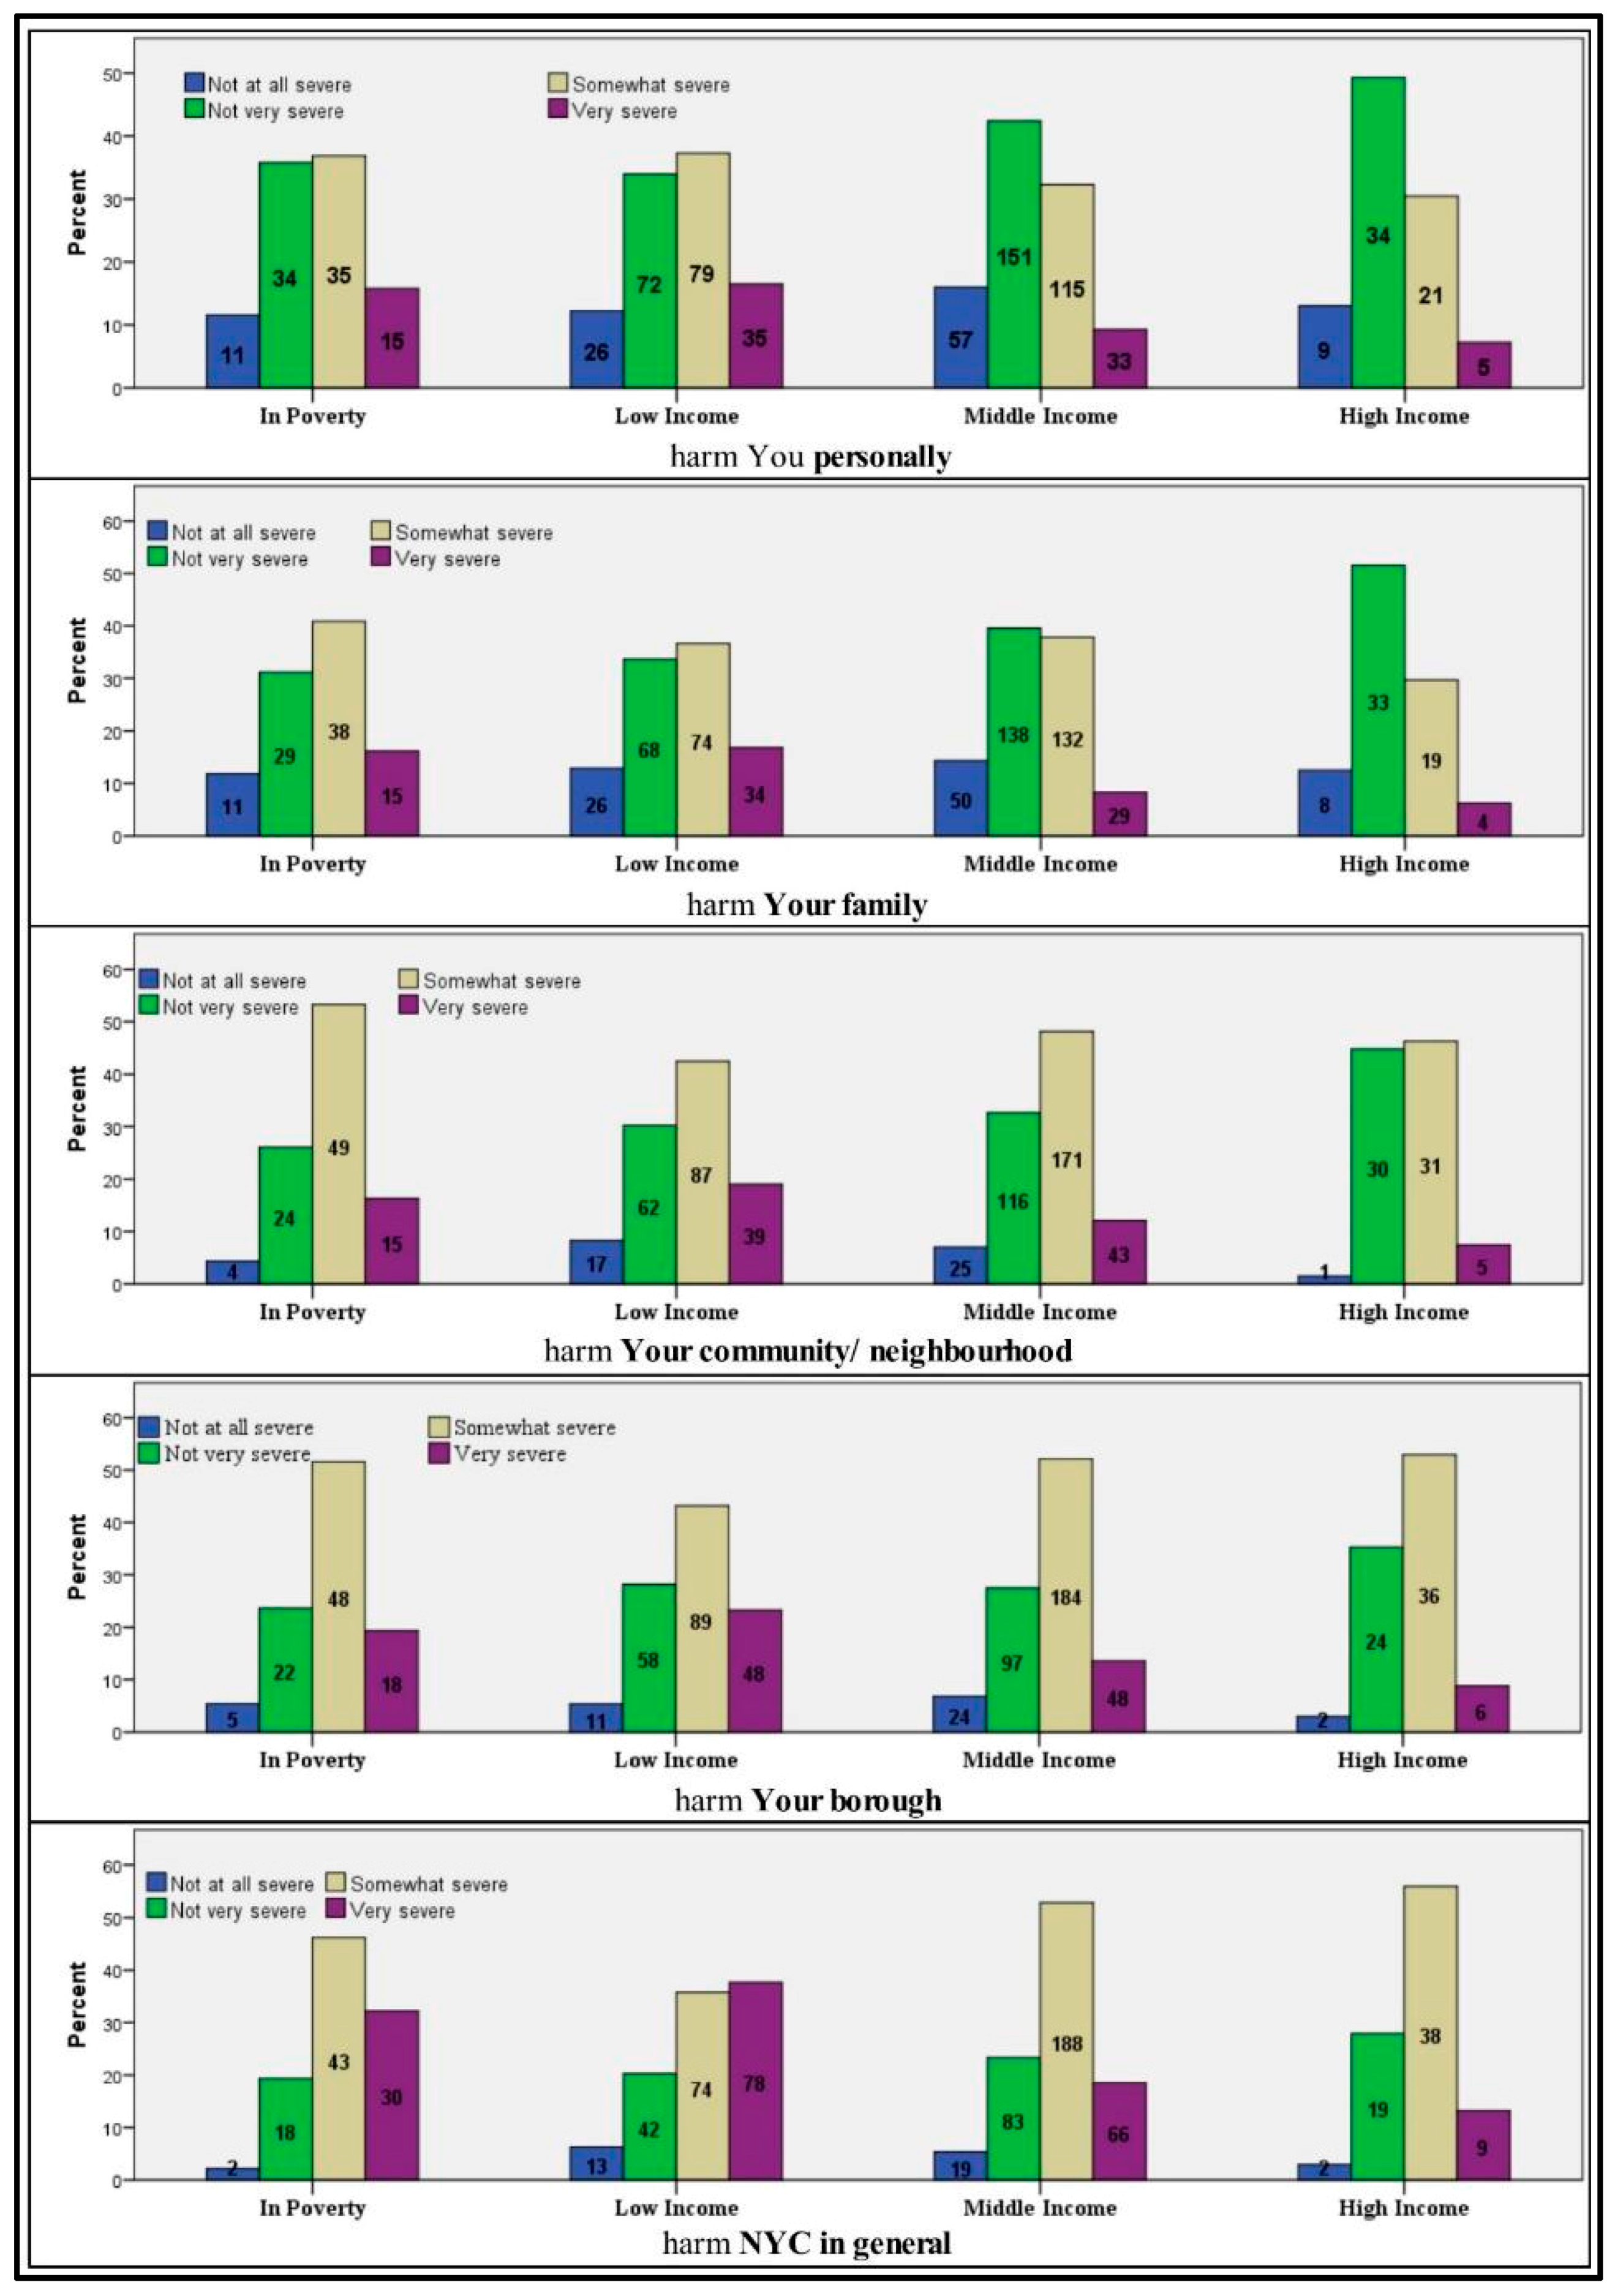
To gain a better understanding about the nature of concern regarding future impacts of heat waves the extent of perceived future impacts are evaluated. The question is “How much do you think the impacts of future heat waves will harm: you personally, your family, your community/ neighborhood, your borough, NYC in general, future generation, plant and animal, public property, people’s private property?”
Respondents expressed their views on a scale of: very severe, somewhat severe, not very severe, and not at all severe. Table 2 shows the results, with significant differences marked in red. The perception of income groups differ with regard to five aspects, i.e., future impacts on:
Table 2.
Results of Kruskal–Wallis H-Test regarding the sector of future impacts of heat waves. The underlined text shows aspects for which significant differences between income groups exist, i.e., the p-value is lower than 0.05.
- Personal life
- Family
- New York City in general
- Future generation
The Mann–Whitney U-test reveals which groups differ with respect to the five aspects mentioned (Table 3). There are no significant differences between the middle-income group and the high-income group. All significant differences identified are found between the lower income groups (in poverty and low income group) and the higher income groups (middle income and high income group). People living in poverty and of low income perceive future impacts on their personal life, their family, NYC in general, future generations and plant and animal species a lot more as “very severe” and “severe”, as compared with the middle and high income groups. In contrast, middle- and high-income residents perceive future impacts more often as being “not very severe” (see Appendix B).
Table 3.
Results of Mann–Whitney U-test regarding perceived extent of future impacts of heat waves. The underlined text shows the location of significant differences between income groups with p-values less than 0.05.
3.2. Perceived Responsibility of Citizens’ Regarding Heat Wave Adaptation
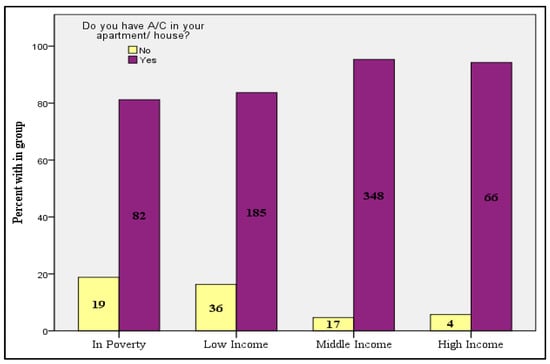
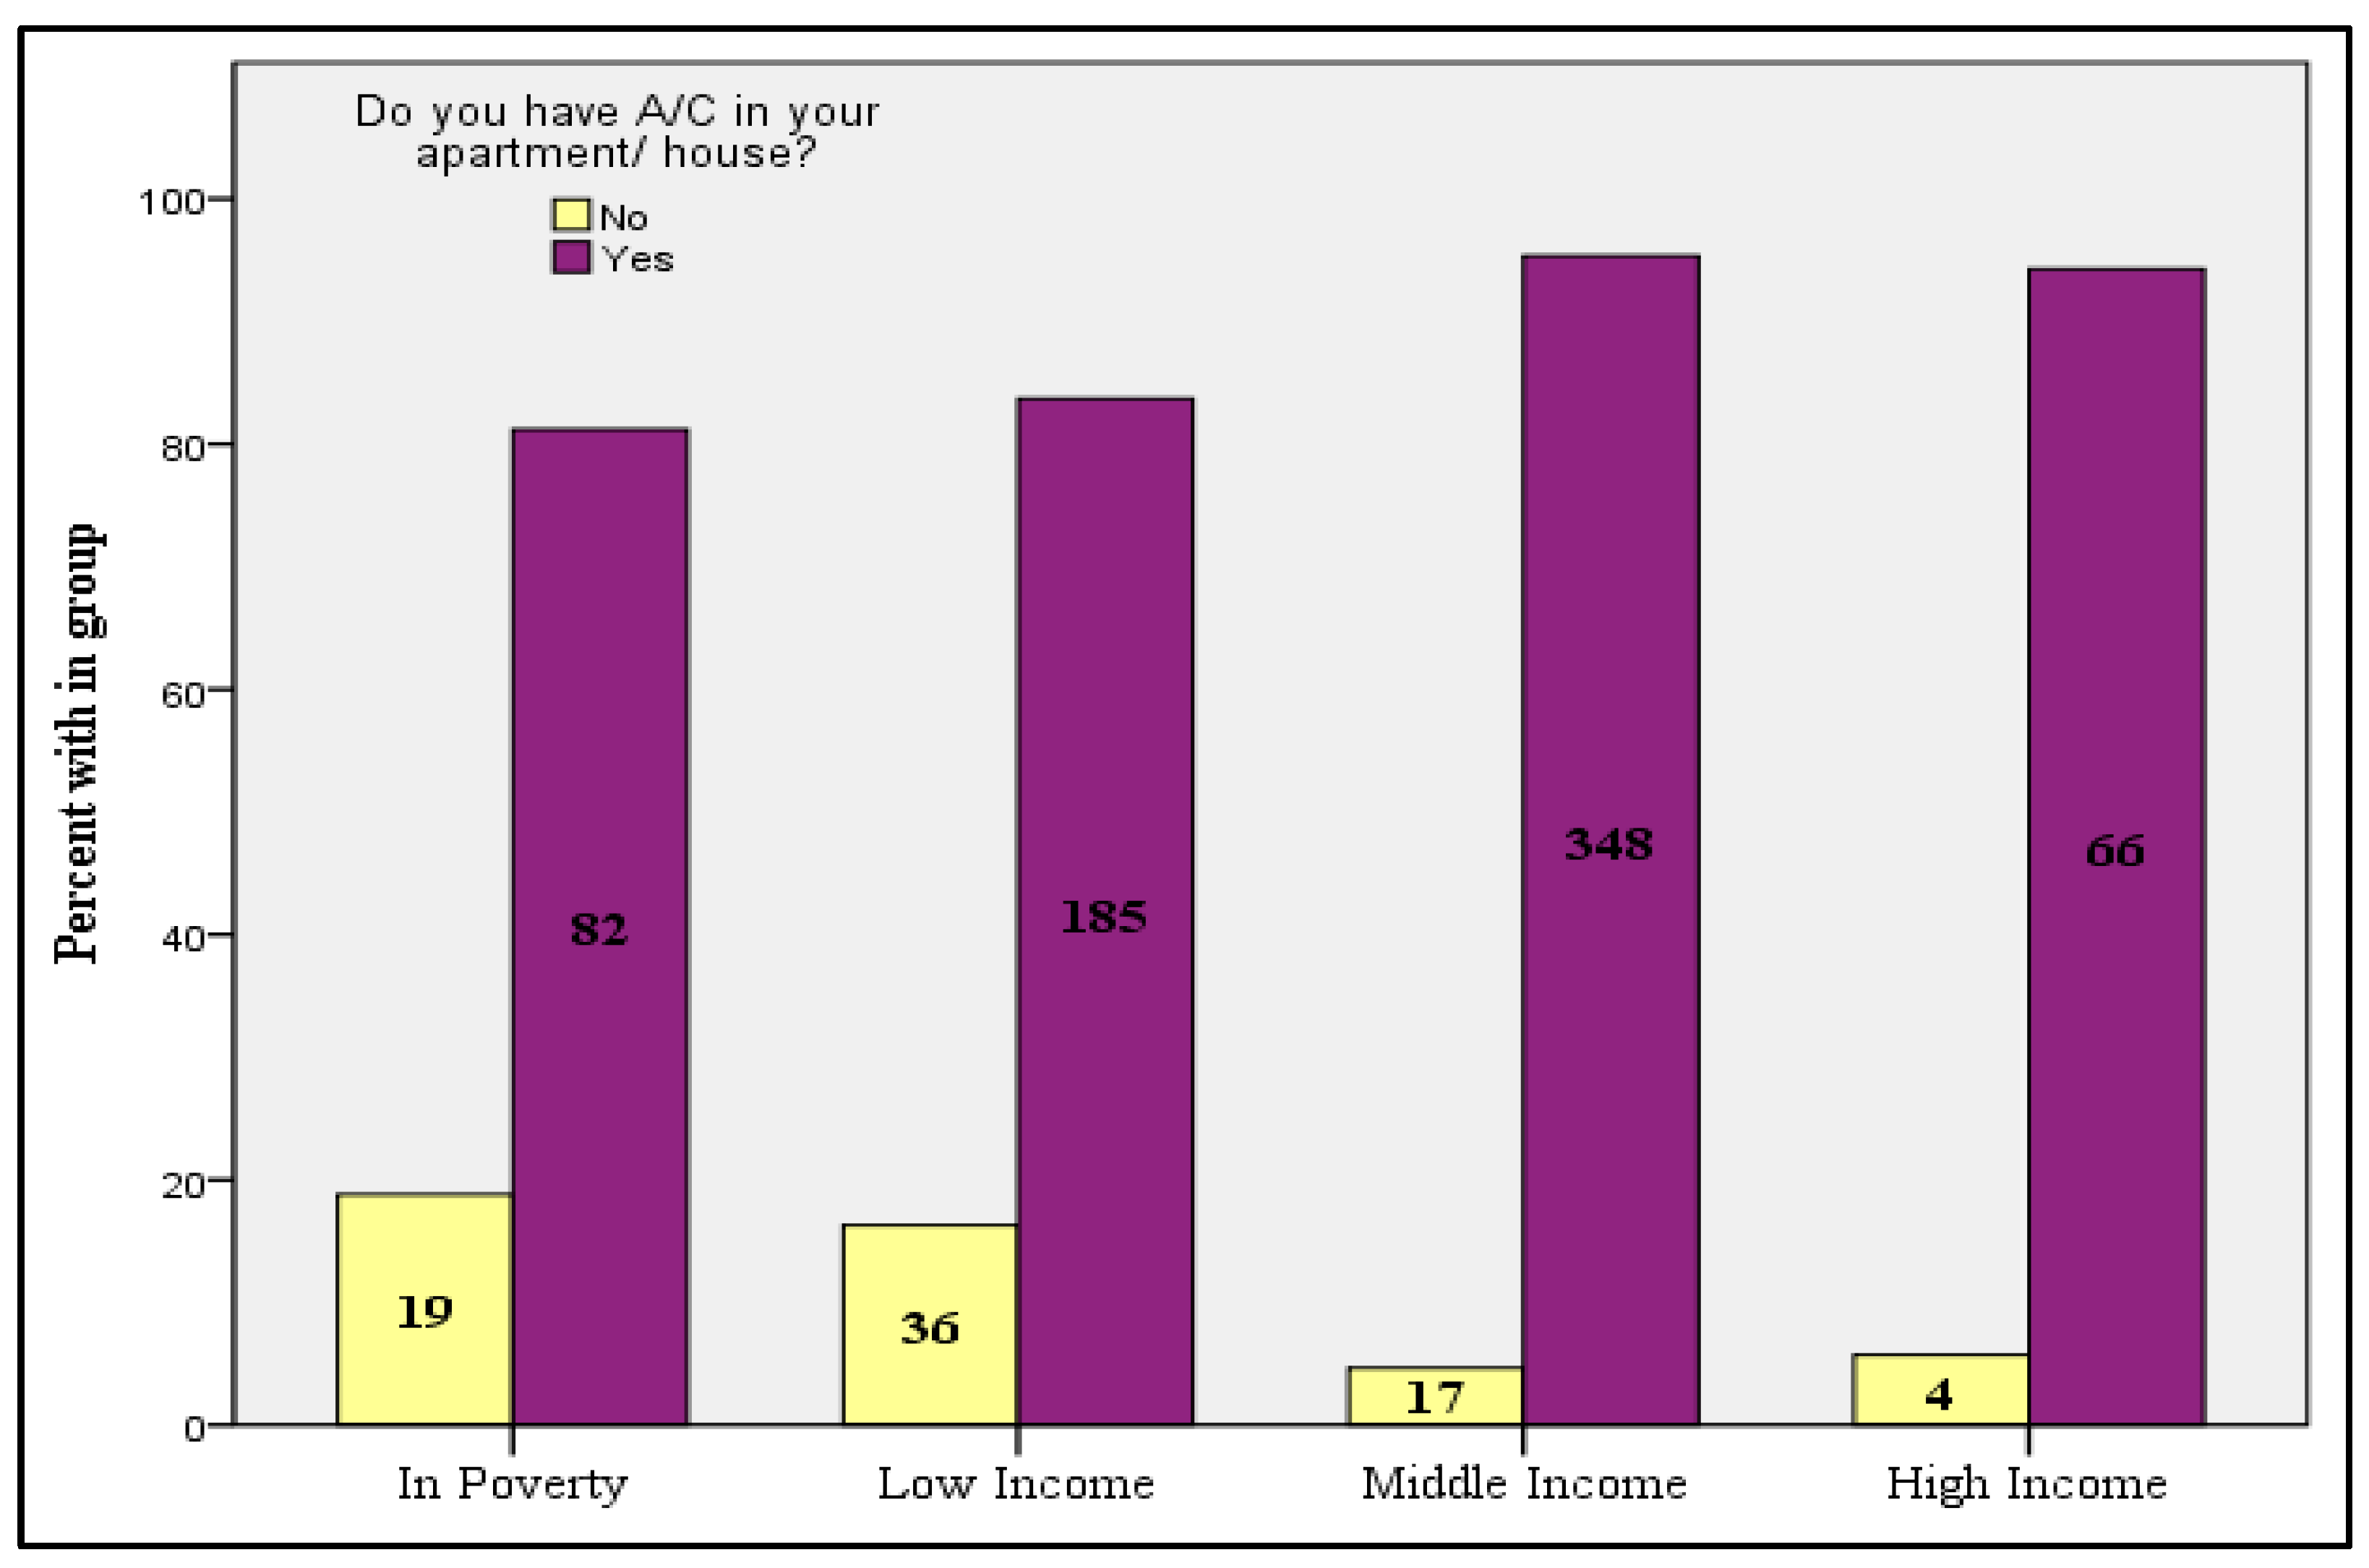
In NYC, air conditioning represents the major personal adaptation means to address heat in home during heat waves. However, as noted above many residents living in poverty or of low incomes might not be able to support air conditioning, because either investment costs or running costs are too high. Figure 5 shows the distribution of air conditioning across our sample, broken down by income groups. As one can see, most people have A/C in their house or apartment, particularly in the middle and high income groups. However, almost 20% of the respondents living in poverty or of low income have no A/C. The prevalence of A/C might influence the perception and views on citizen’s responsibility regarding adaptation to heat waves, which is shown below.
Figure 5.
Access to air conditioning (A/C) devices across different income groups. The numbers inside the bars represent the number of total respondents in the respective group.
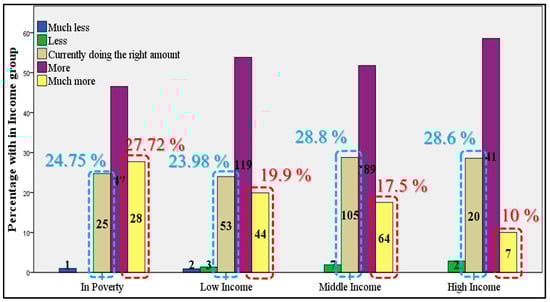
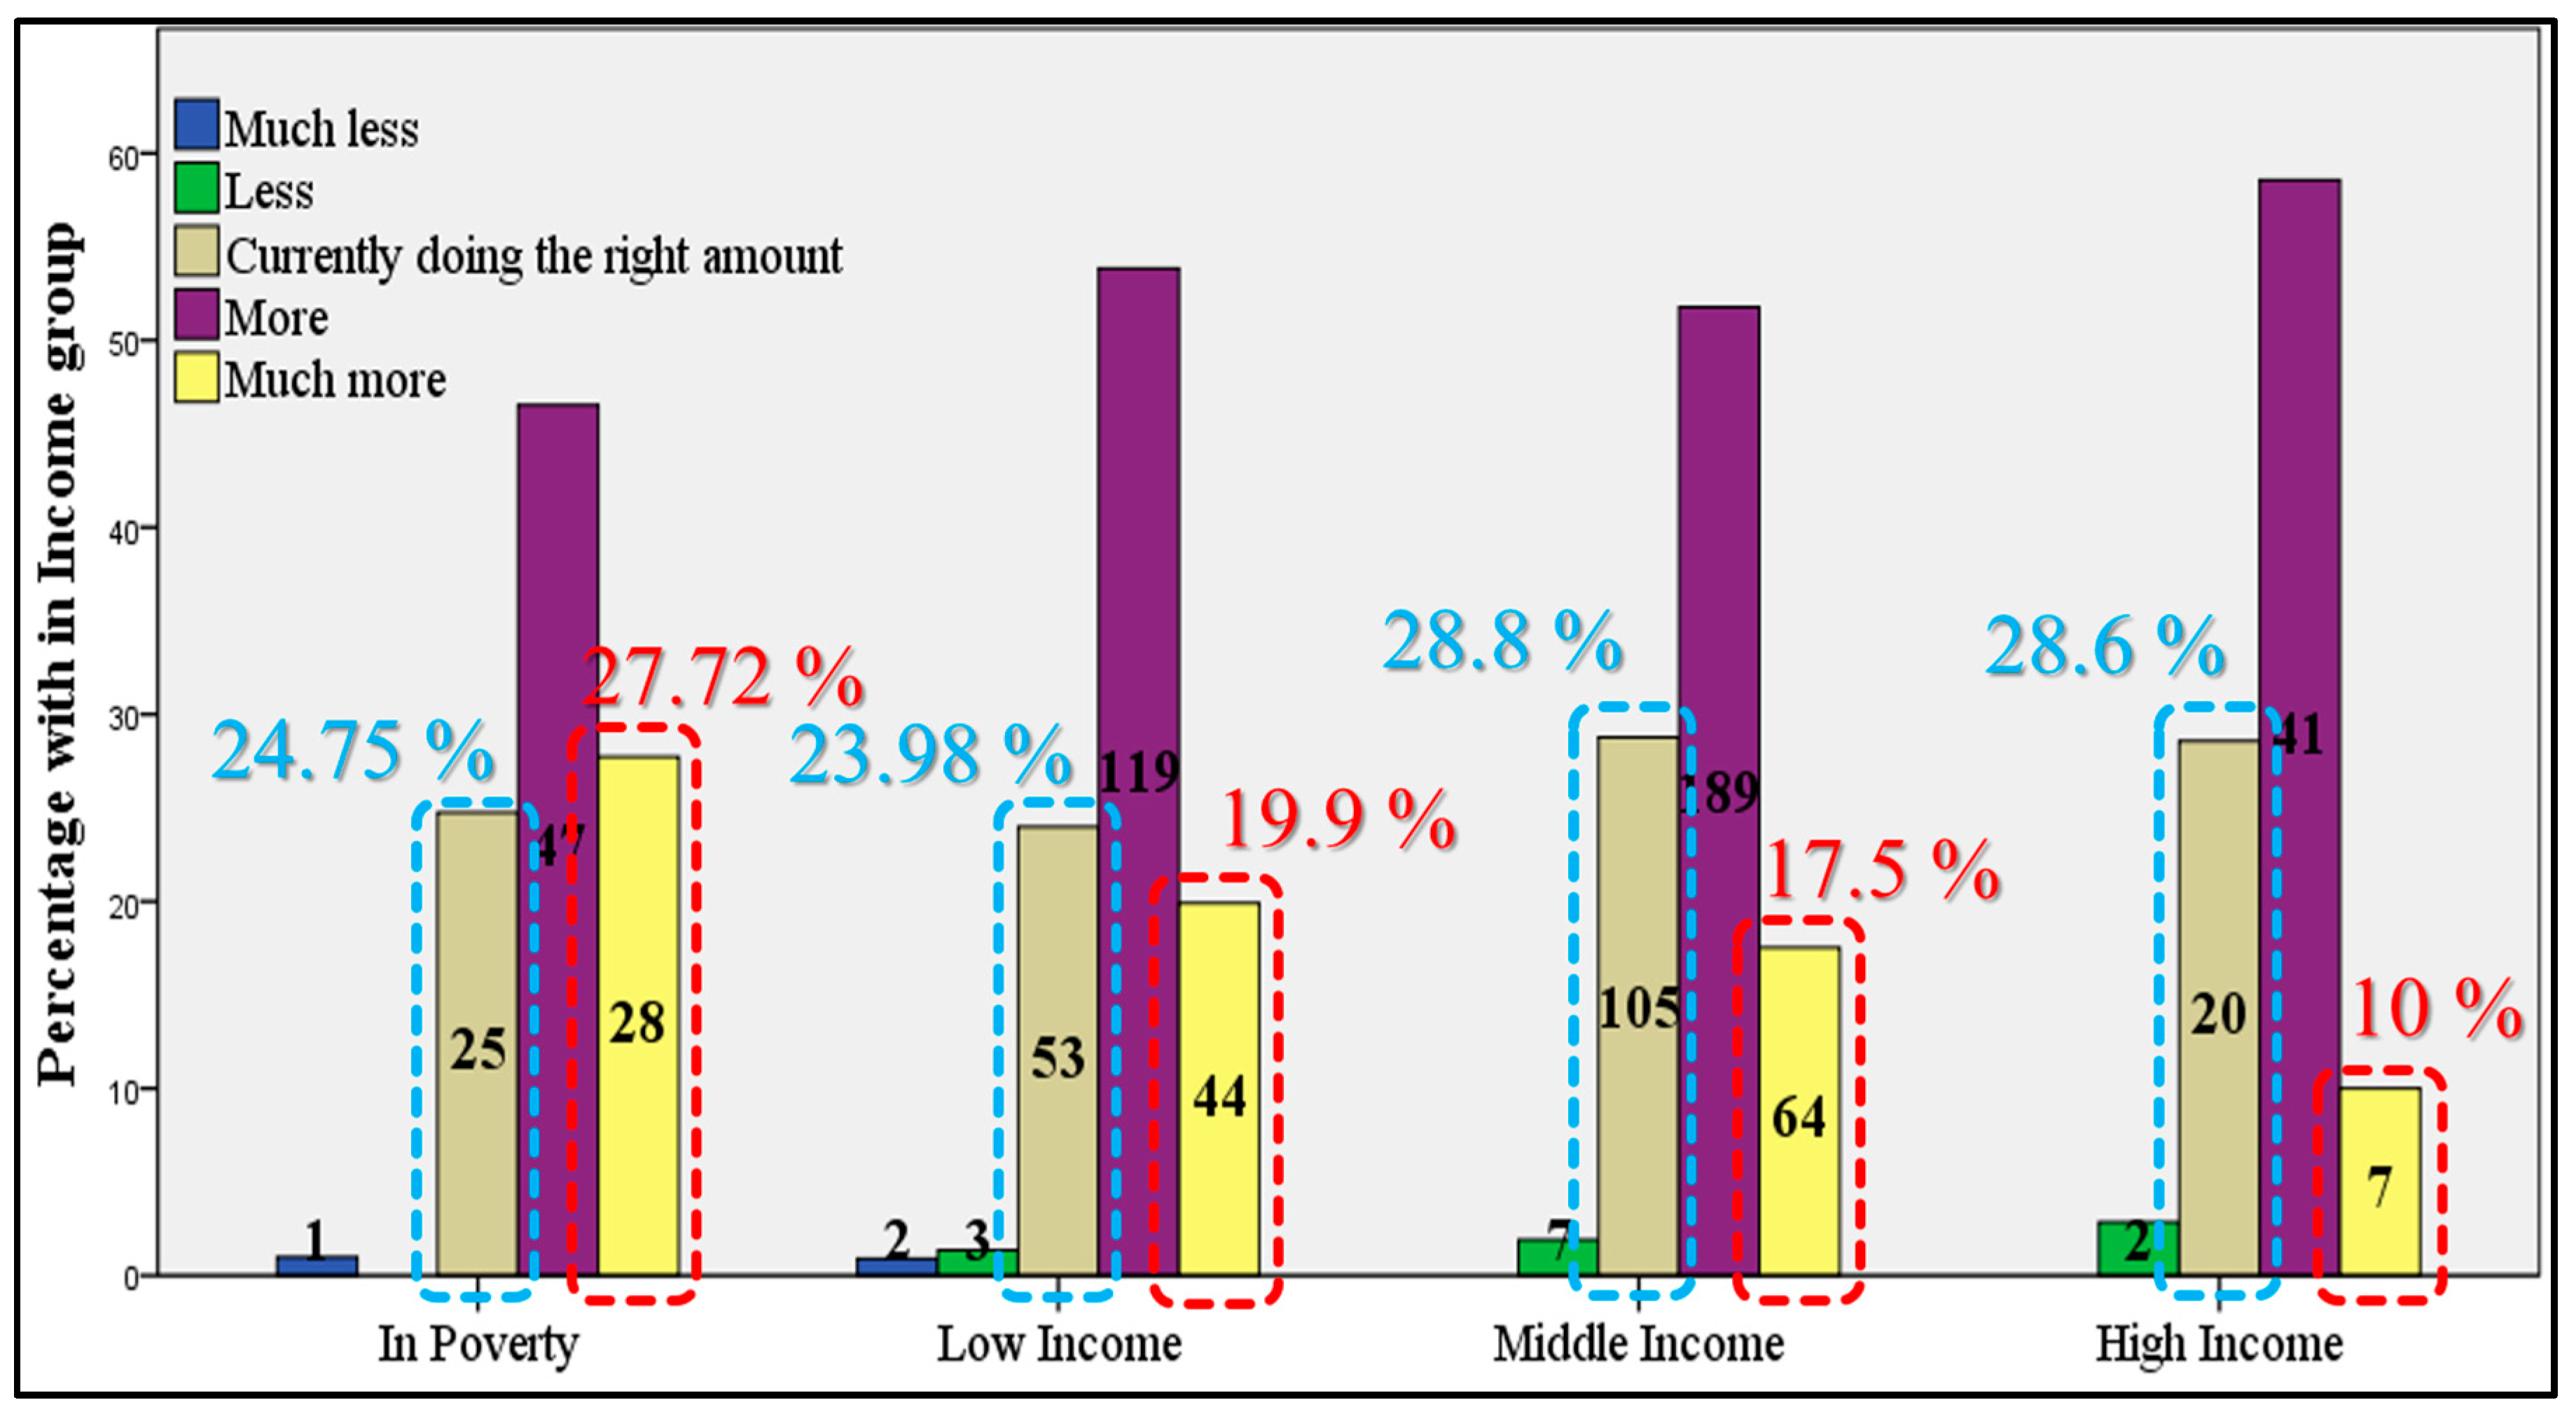
The question was “Do you think citizens themselves should be doing more or less to protect themselves from the impacts of heat waves?”
According to the results presented in Figure 6, the majority of citizens in each income group (more than 68% counting “more” or “much more”) state that citizens should be doing more or much more to prevent themselves from the impacts of heat waves in the future. However, proportionately more people from the higher incomes groups think they are doing the right amount, whereas proportionately more from the lower income groups regard it necessary to do much more to protect themselves.
Figure 6.
Different income groups expressions about citizens’ responsibility with regard to adaptation issues. The numbers inside the bars represent number of respondents.
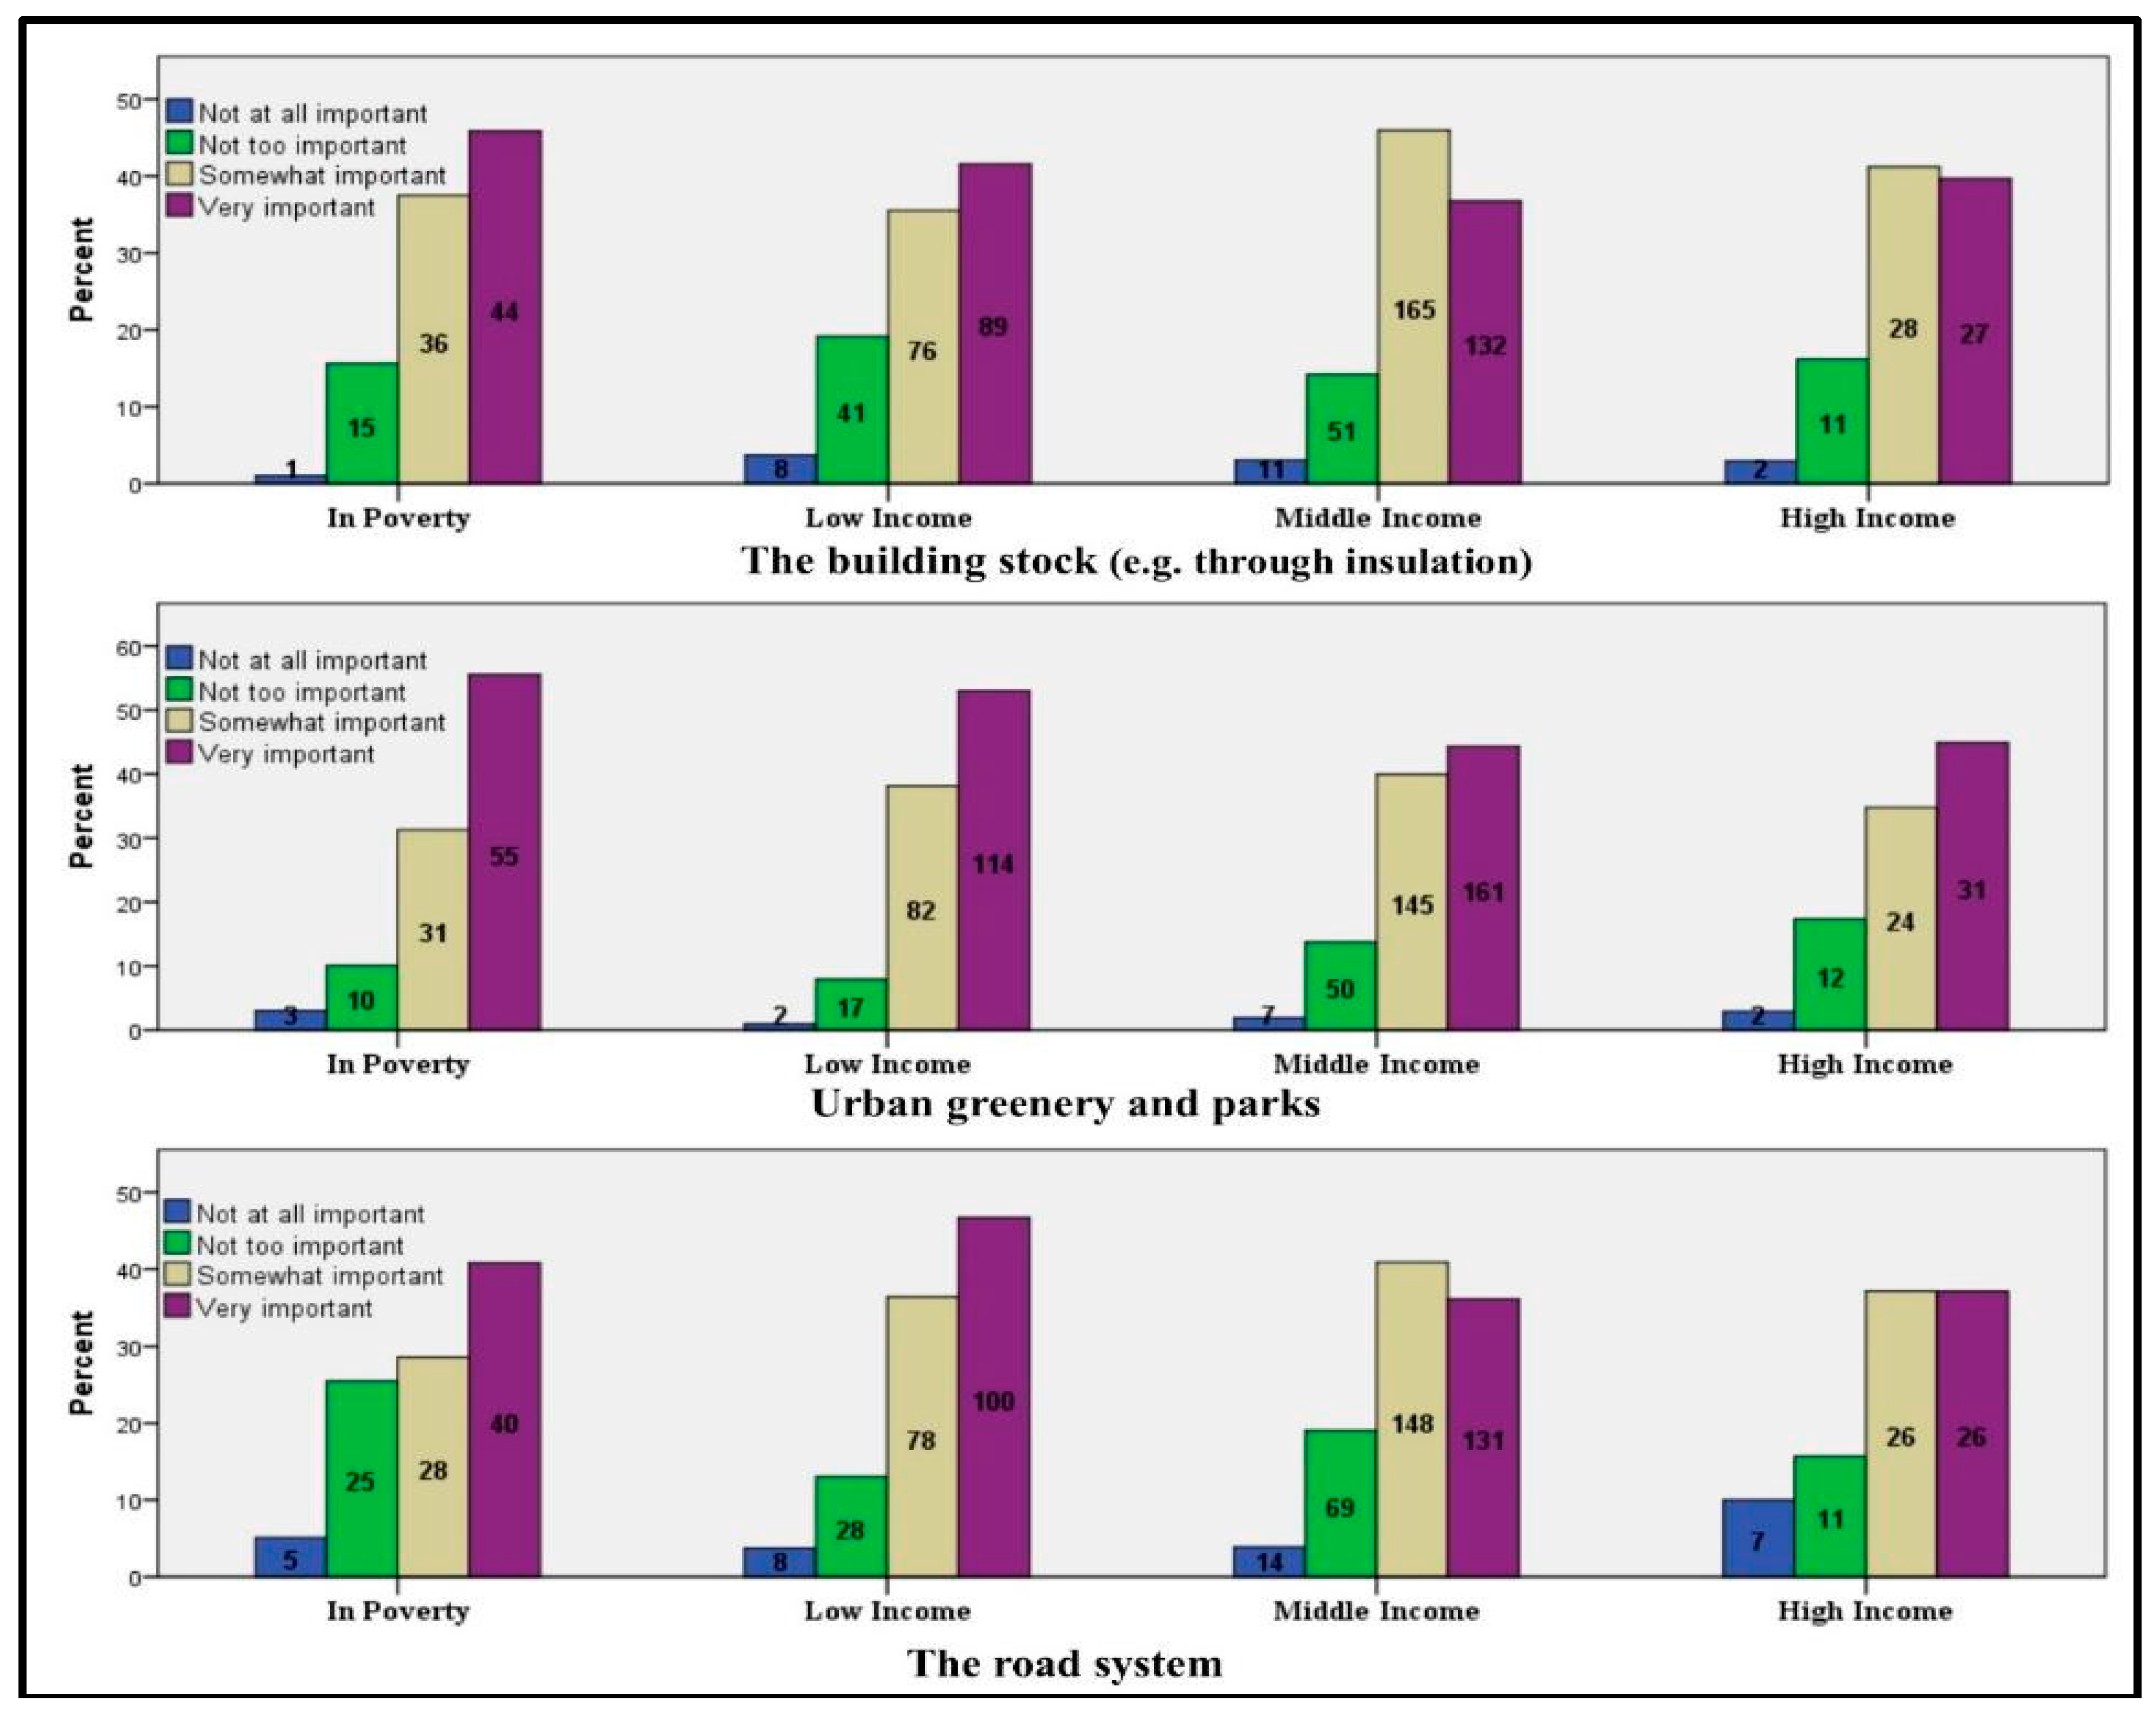
Table 4 shows which of the urban sectors respondents saw most in need of adaptation for future heat waves. Our results show that the majority of citizens across all income groups regard it as very important or somewhat important to invest in all adaptation sectors investigated. However, for almost all evaluated sectors, people living in poverty and of low income stated in higher shares that it adaptation is very important (see Appendix C). Despite this similarity, there are also differences across income groups, as shown in Table 3. The four income groups significantly differ in regard to the perceived importance of “Urban greenery and parks” (highlighted in red in Table 4).
Table 4.
Results of Kruskal–Wallis H-Test in regard to the importance of adaptation to heat waves for different urban sectors. The underlined text shows the significant differences between income groups with p-value less than 0.05.
According to the results of the Mann–Whitney U-test (Table 5) significant differences regarding the perceived importance “Urban greenery and parks” as adaptation strategy exist between the low and middle income group. The low income group regards it as significantly more important than the middle income group to invest in urban greenery and parks as adaptation strategy.
Table 5.
Results of Mann–Whitney U-test in regard to the importance of urban sectors in heat wave adaptation. The underlined text shows the location of significant differences between income groups with p-value less than 0.05.
3.3. FCM Analysis Results
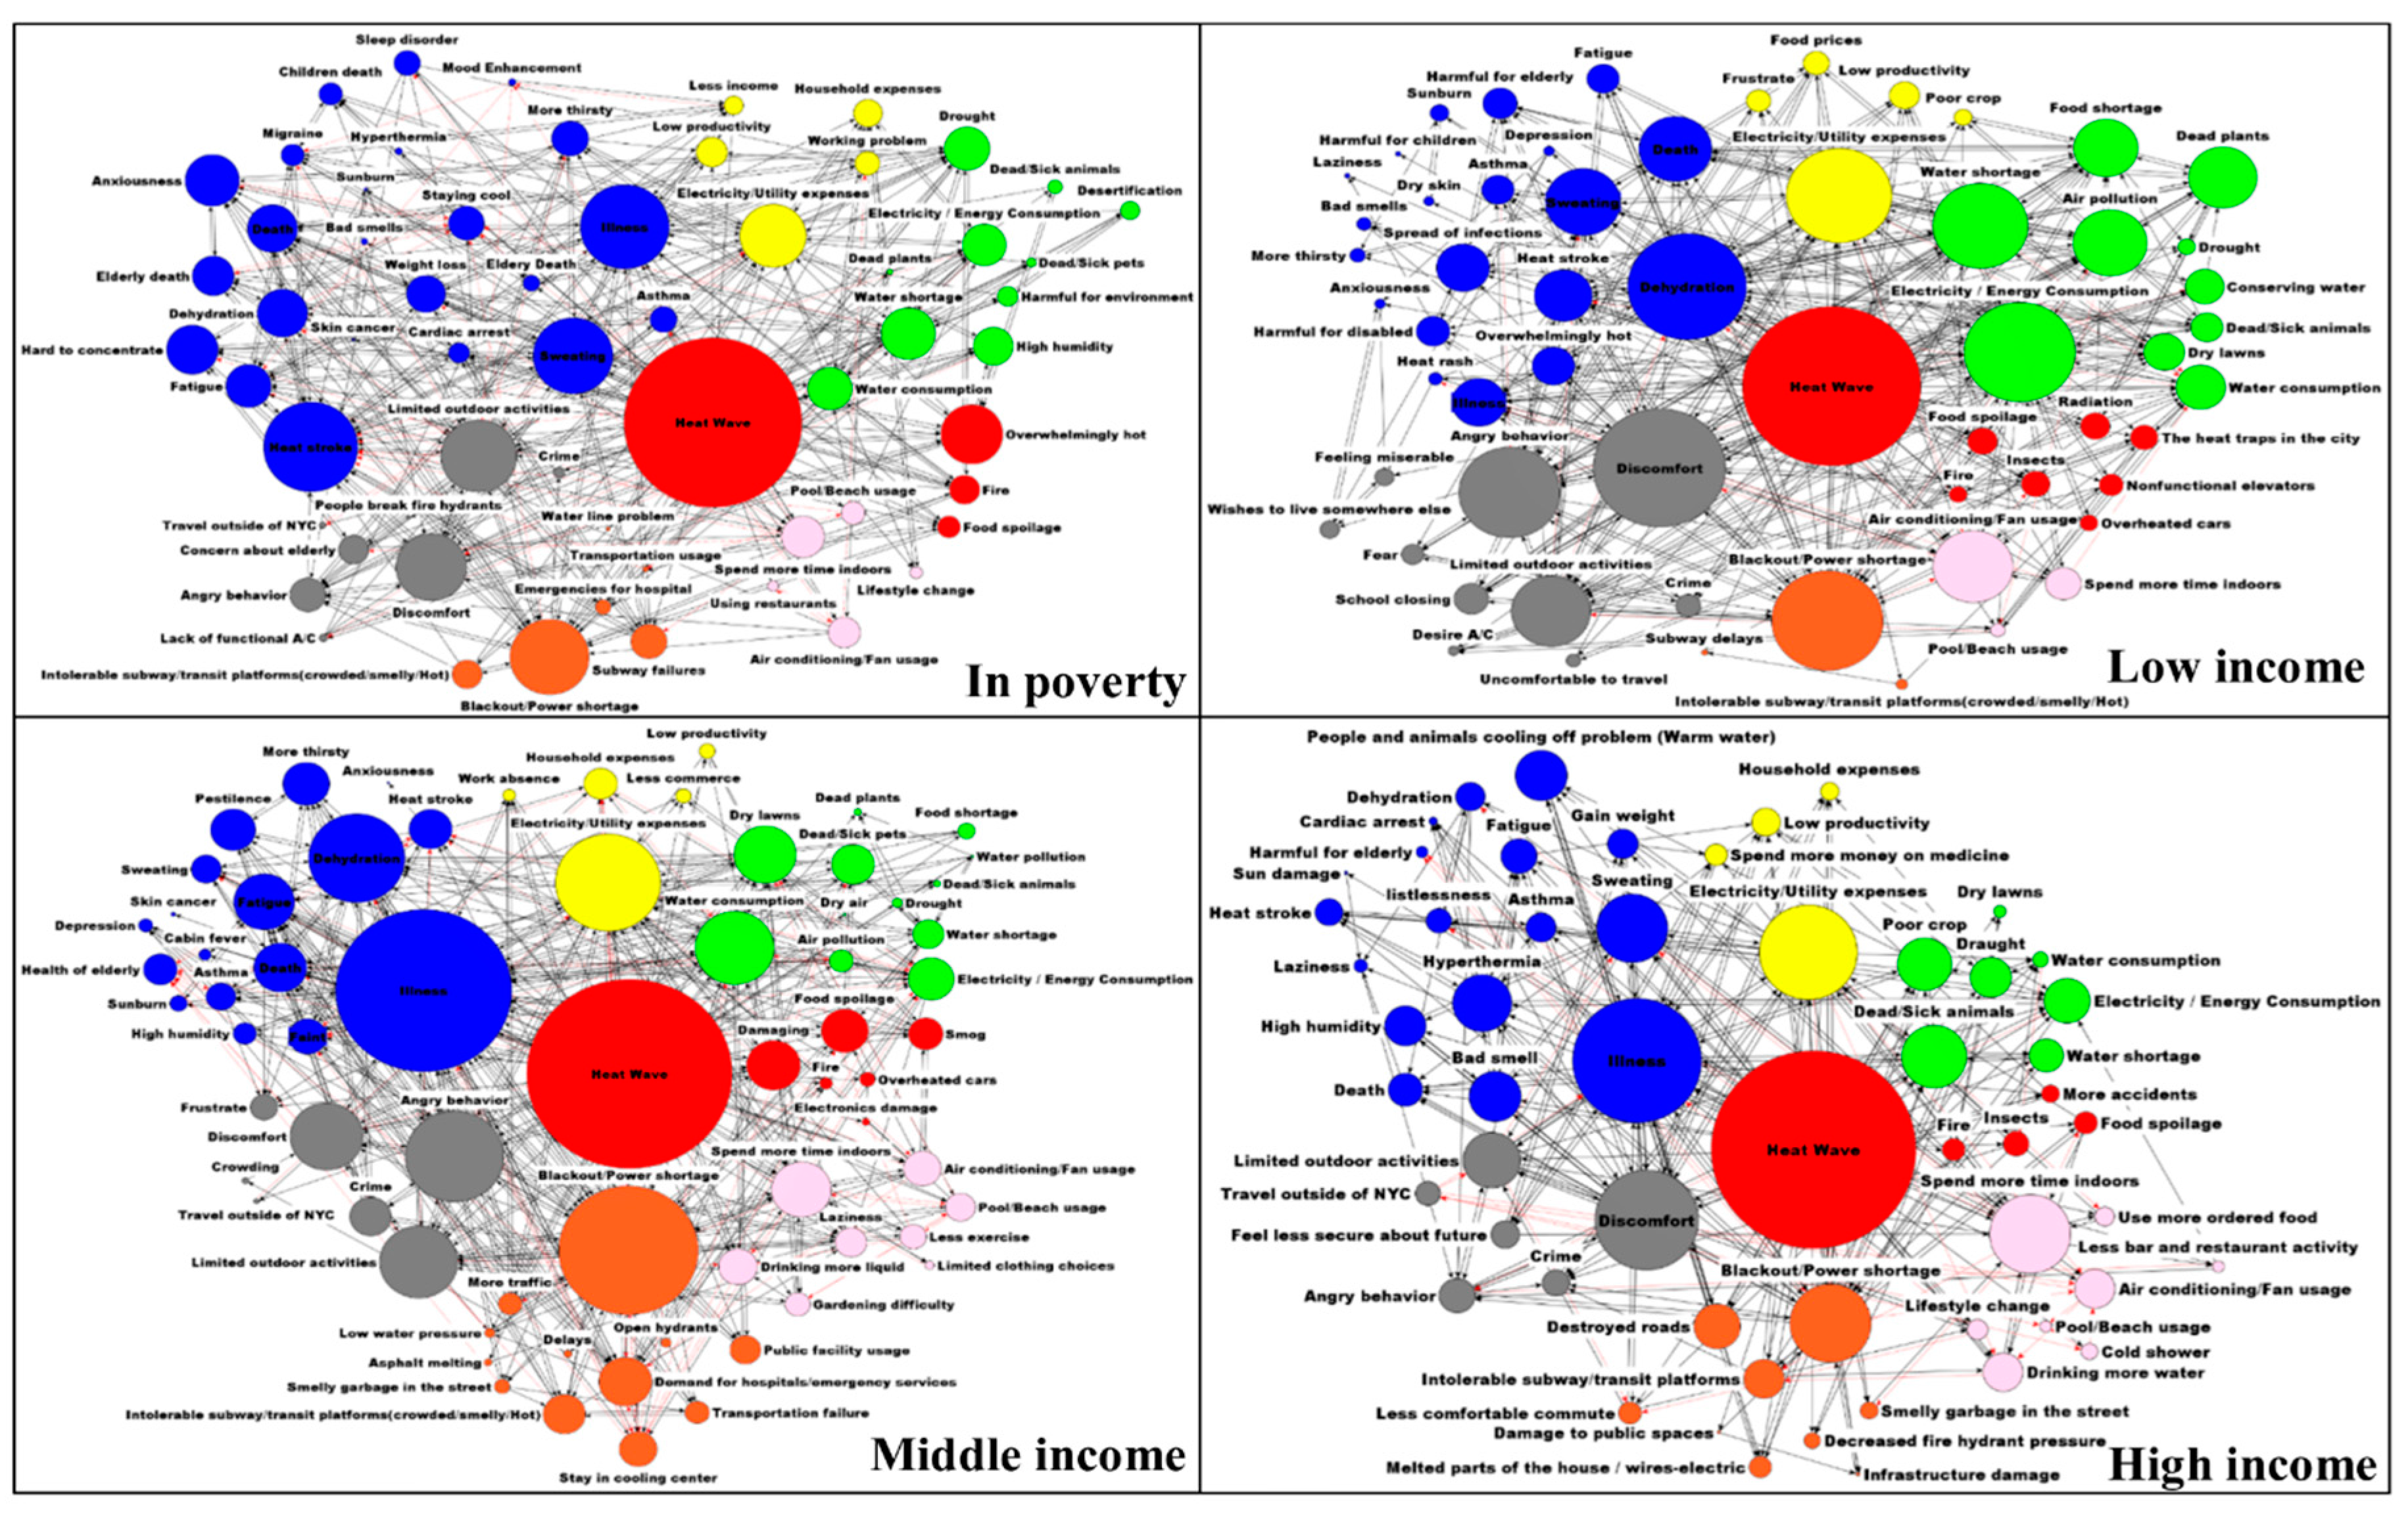
Following the perception on future impacts and impact sectors as well as adaptation responsibility and adaptation sectors we now present the results of the adaptation scenarios, asking which adaptation scenario would reduce the impacts for which income group the most. To do so we first present the cognitive maps of impacts of heat waves in New York City and respective statistics for each income group. Figure 7 shows the cognitive maps of each income group.
Figure 7.
Visualization of the cognitive map of each income group. Legend: The size of the nodes depict centrality. The colors refer to sectors, such as health, economic aspects, social aspects, energy and natural resources, infrastructure, hazard and damages, life style.
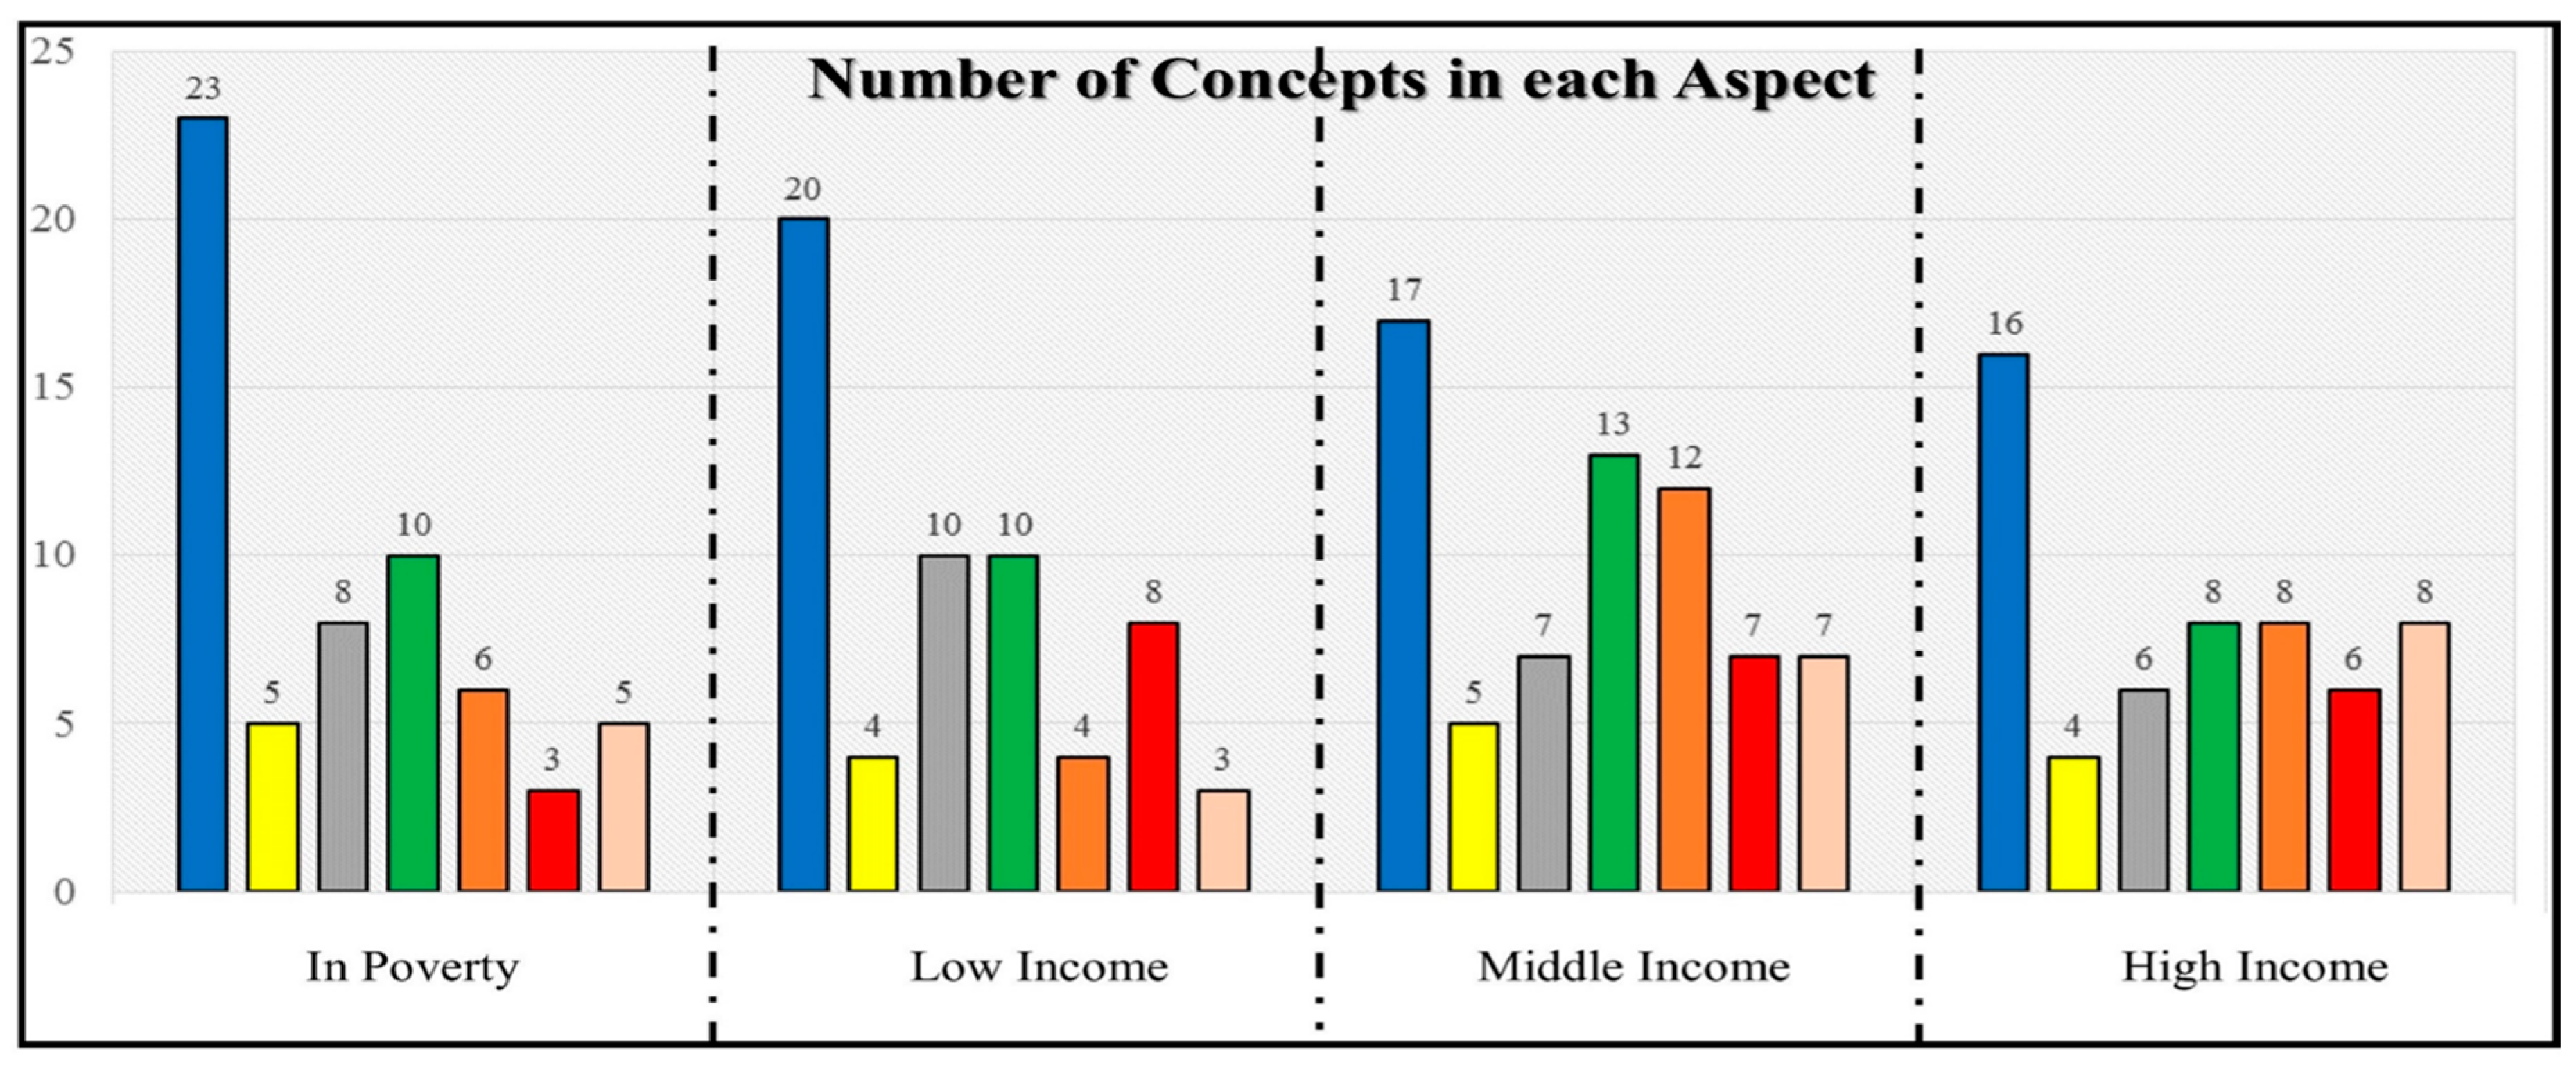
One can see that, e.g., the cognitive map of the people of middle income has a few larger concepts, depicting higher centrality. This means that a few concepts are very important for the network and have many in-going and out-going connections. Middle income people perceive a few aspects of being very central and important to the impact situation during heat waves in NYC. In contrast, the respondents living in poverty reported many concepts of smaller centrality, showing that many but small cause–effect relations determine the situation of heat wave impacts for this income group. Regarding sector it appears that people of low income mentioned aspects of energy and natural resources more often and more important than others. With regards to the other sectors, the picture seems mixed. Figure 8 brings clarity, showing the number of concepts per sector in each map. Health aspects are the most numerous in each cognitive map, although they have a larger share in the cognitive map of people living in poverty. Energy and natural aspects rank second. It shows that health, energy and other natural resources are the aspects that respondents most associate with impacts during heat waves.
Figure 8.
Frequency of concepts per sector in cognitive maps per income group. The colors refer to sectors as follows health, economic aspects, social aspects, energy and natural resources, infrastructure, hazard and damages, life style.
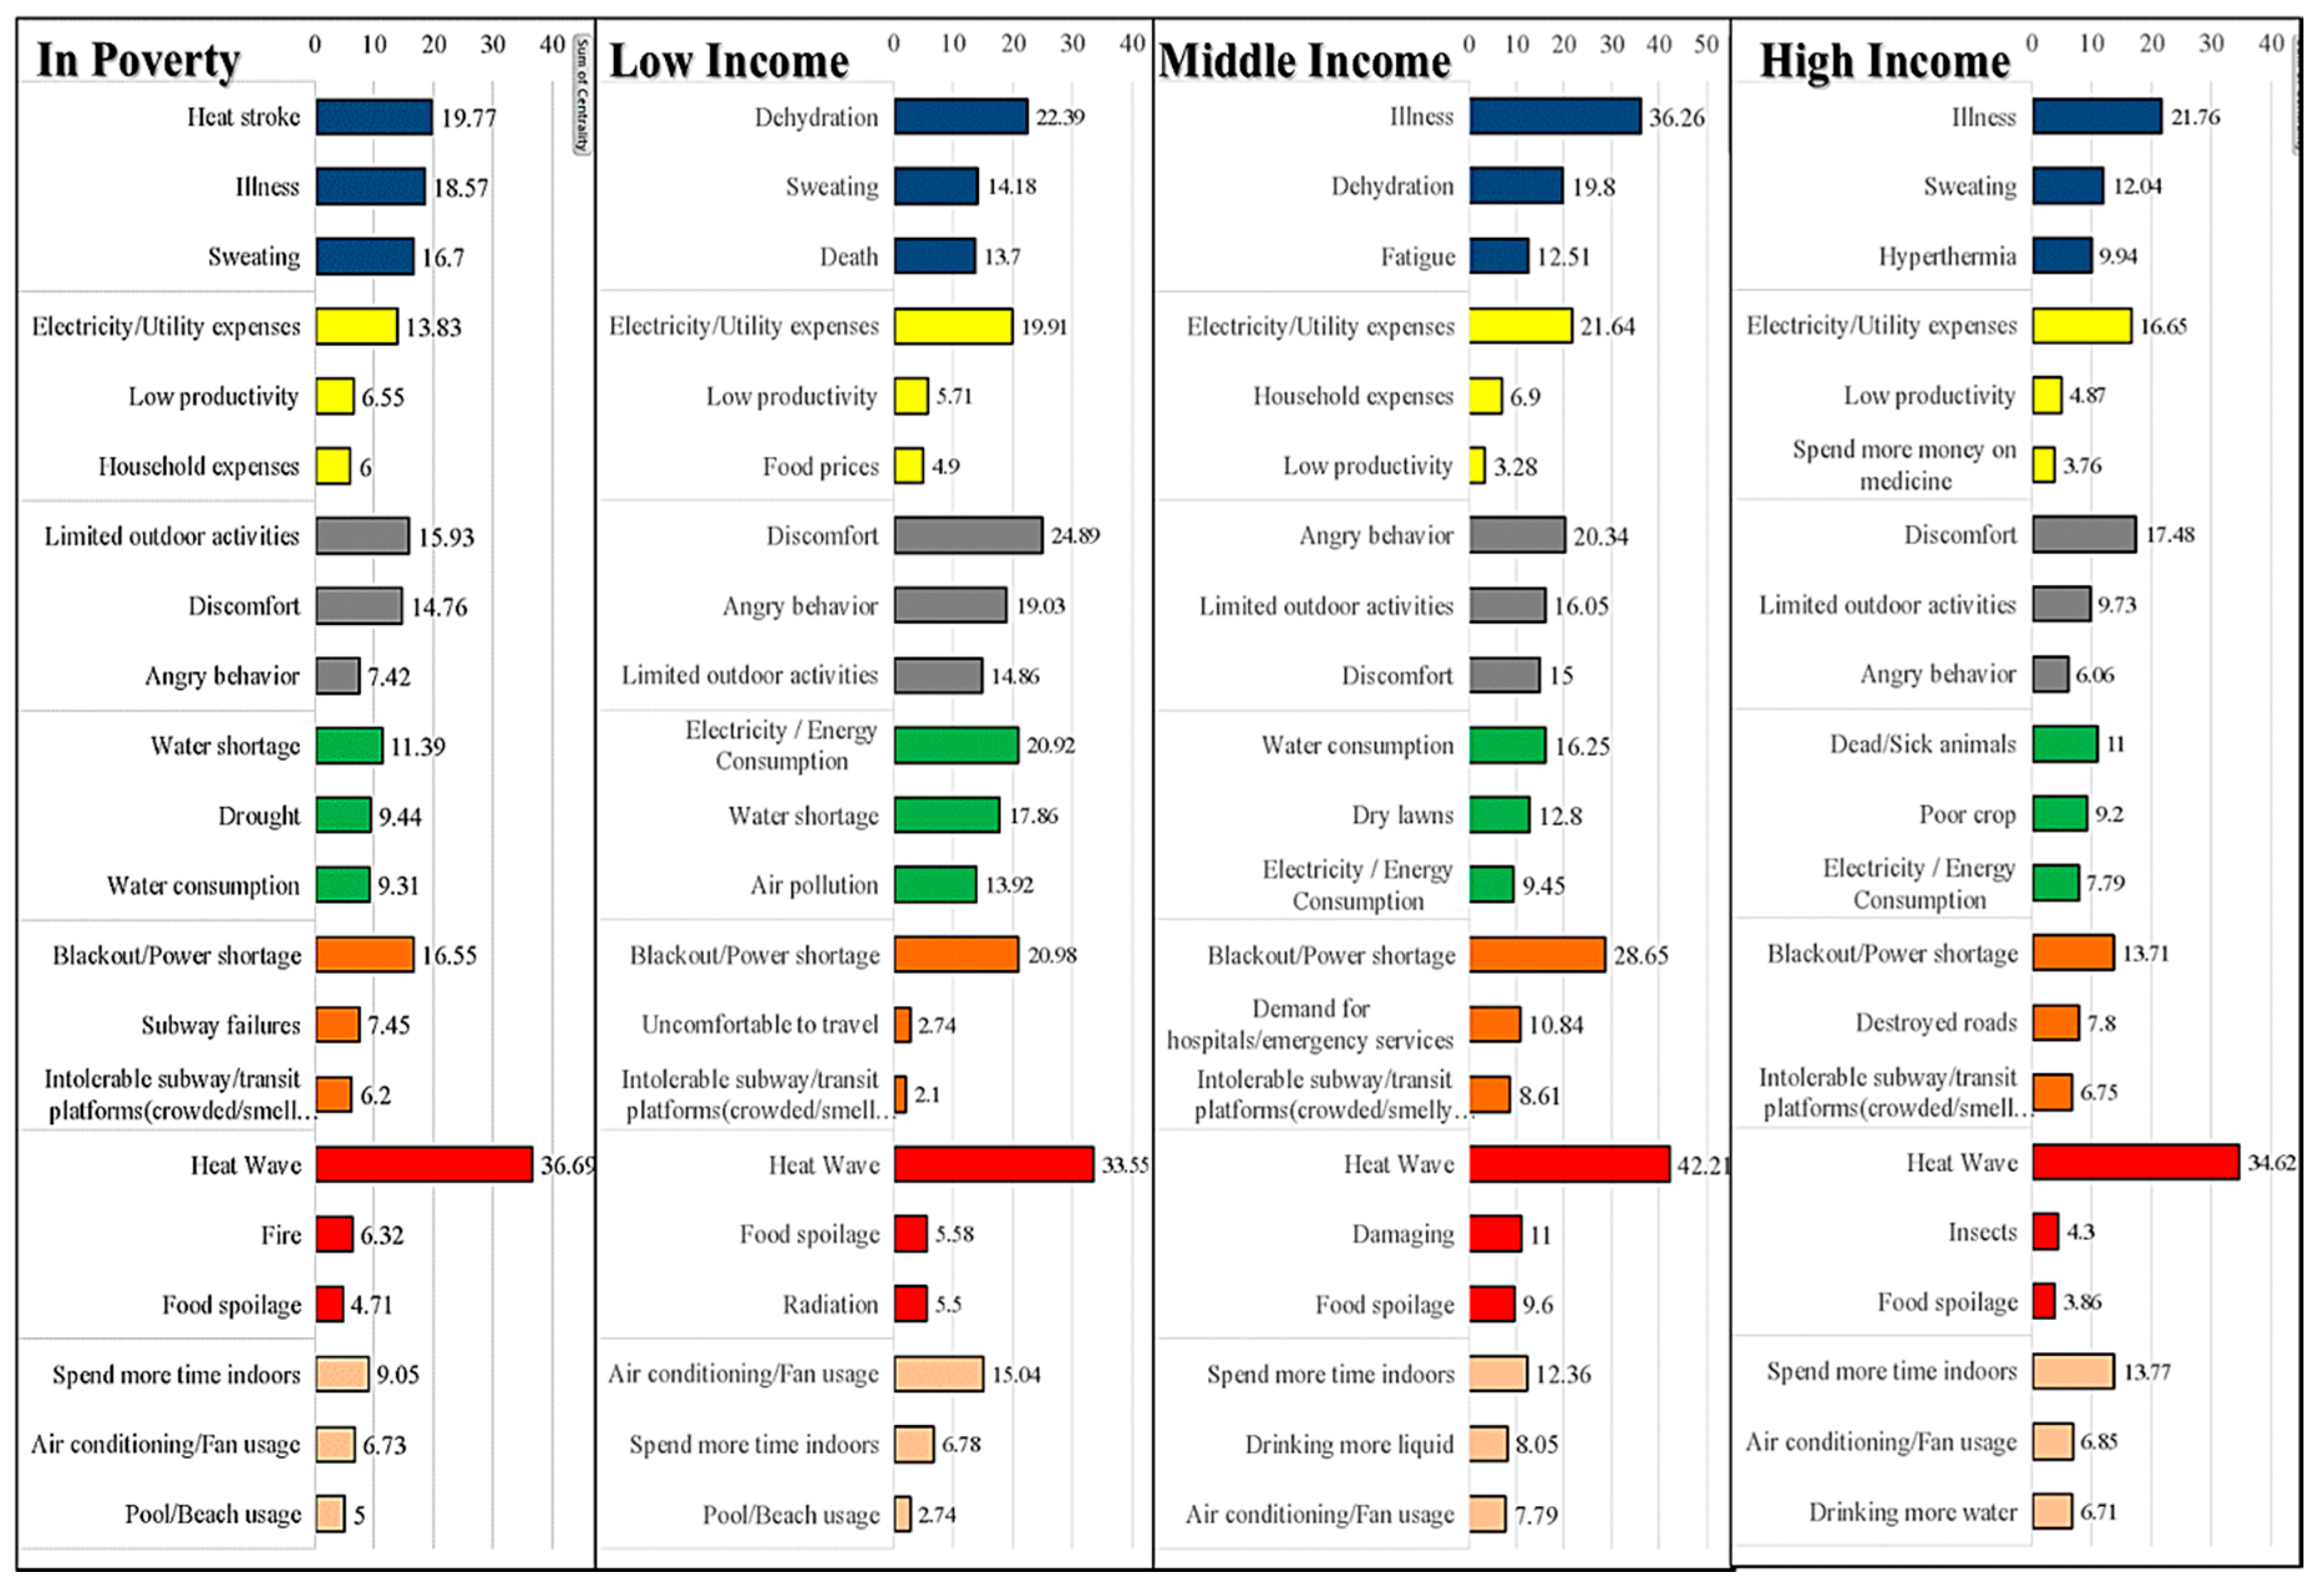
Figure 9 shows which of the concepts have the highest centrality per sector and network, depicting concepts of the largest influence. Centrality is the sum of the weight of in-going and out-going factors and therefore stands for both an aspect highly influenced and highly influential in the network.
Figure 9.
Concepts of highest centrality in the network per sector and income group. The colors refer to following sectors: health, economic aspects, social aspects, energy and natural resources, infrastructure, hazard and damages, life style.
There are some concepts which are similarly important in the maps such as illness in the health sector, electricity/utility expenses and low productivity among economic aspects, limited outdoor activities and angry behavior among social aspects, water and energy consumption among natural resources, blackout/power shortage and intolerable transit platforms as regards city infrastructure, food spoilage as concerns hazards/damages, air conditioning/fan usage and spending more time indoors with regard to lifestyle aspects. These similar and very important concepts can be considered as main drivers when developing and prioritizing general adaptation options to heat waves for all citizens. Other important concepts may be considered when developing income group specific adaptation options, especially for lower income groups which are regarded as more vulnerable than others. Some of these important concepts are: dehydration as regards health aspects, household expenses and food prices as economic aspects, water shortage and air pollution among natural resources, subway failure and uncomfortability to travel in city infrastructure, and fire hazards.
3.4. FCM Scenario Simulation Results
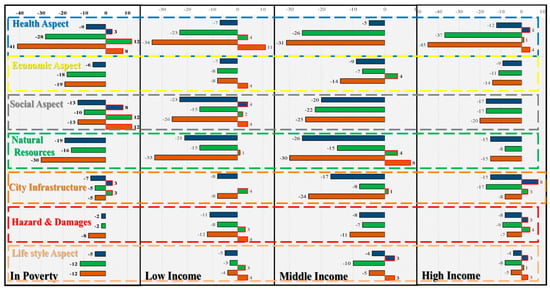
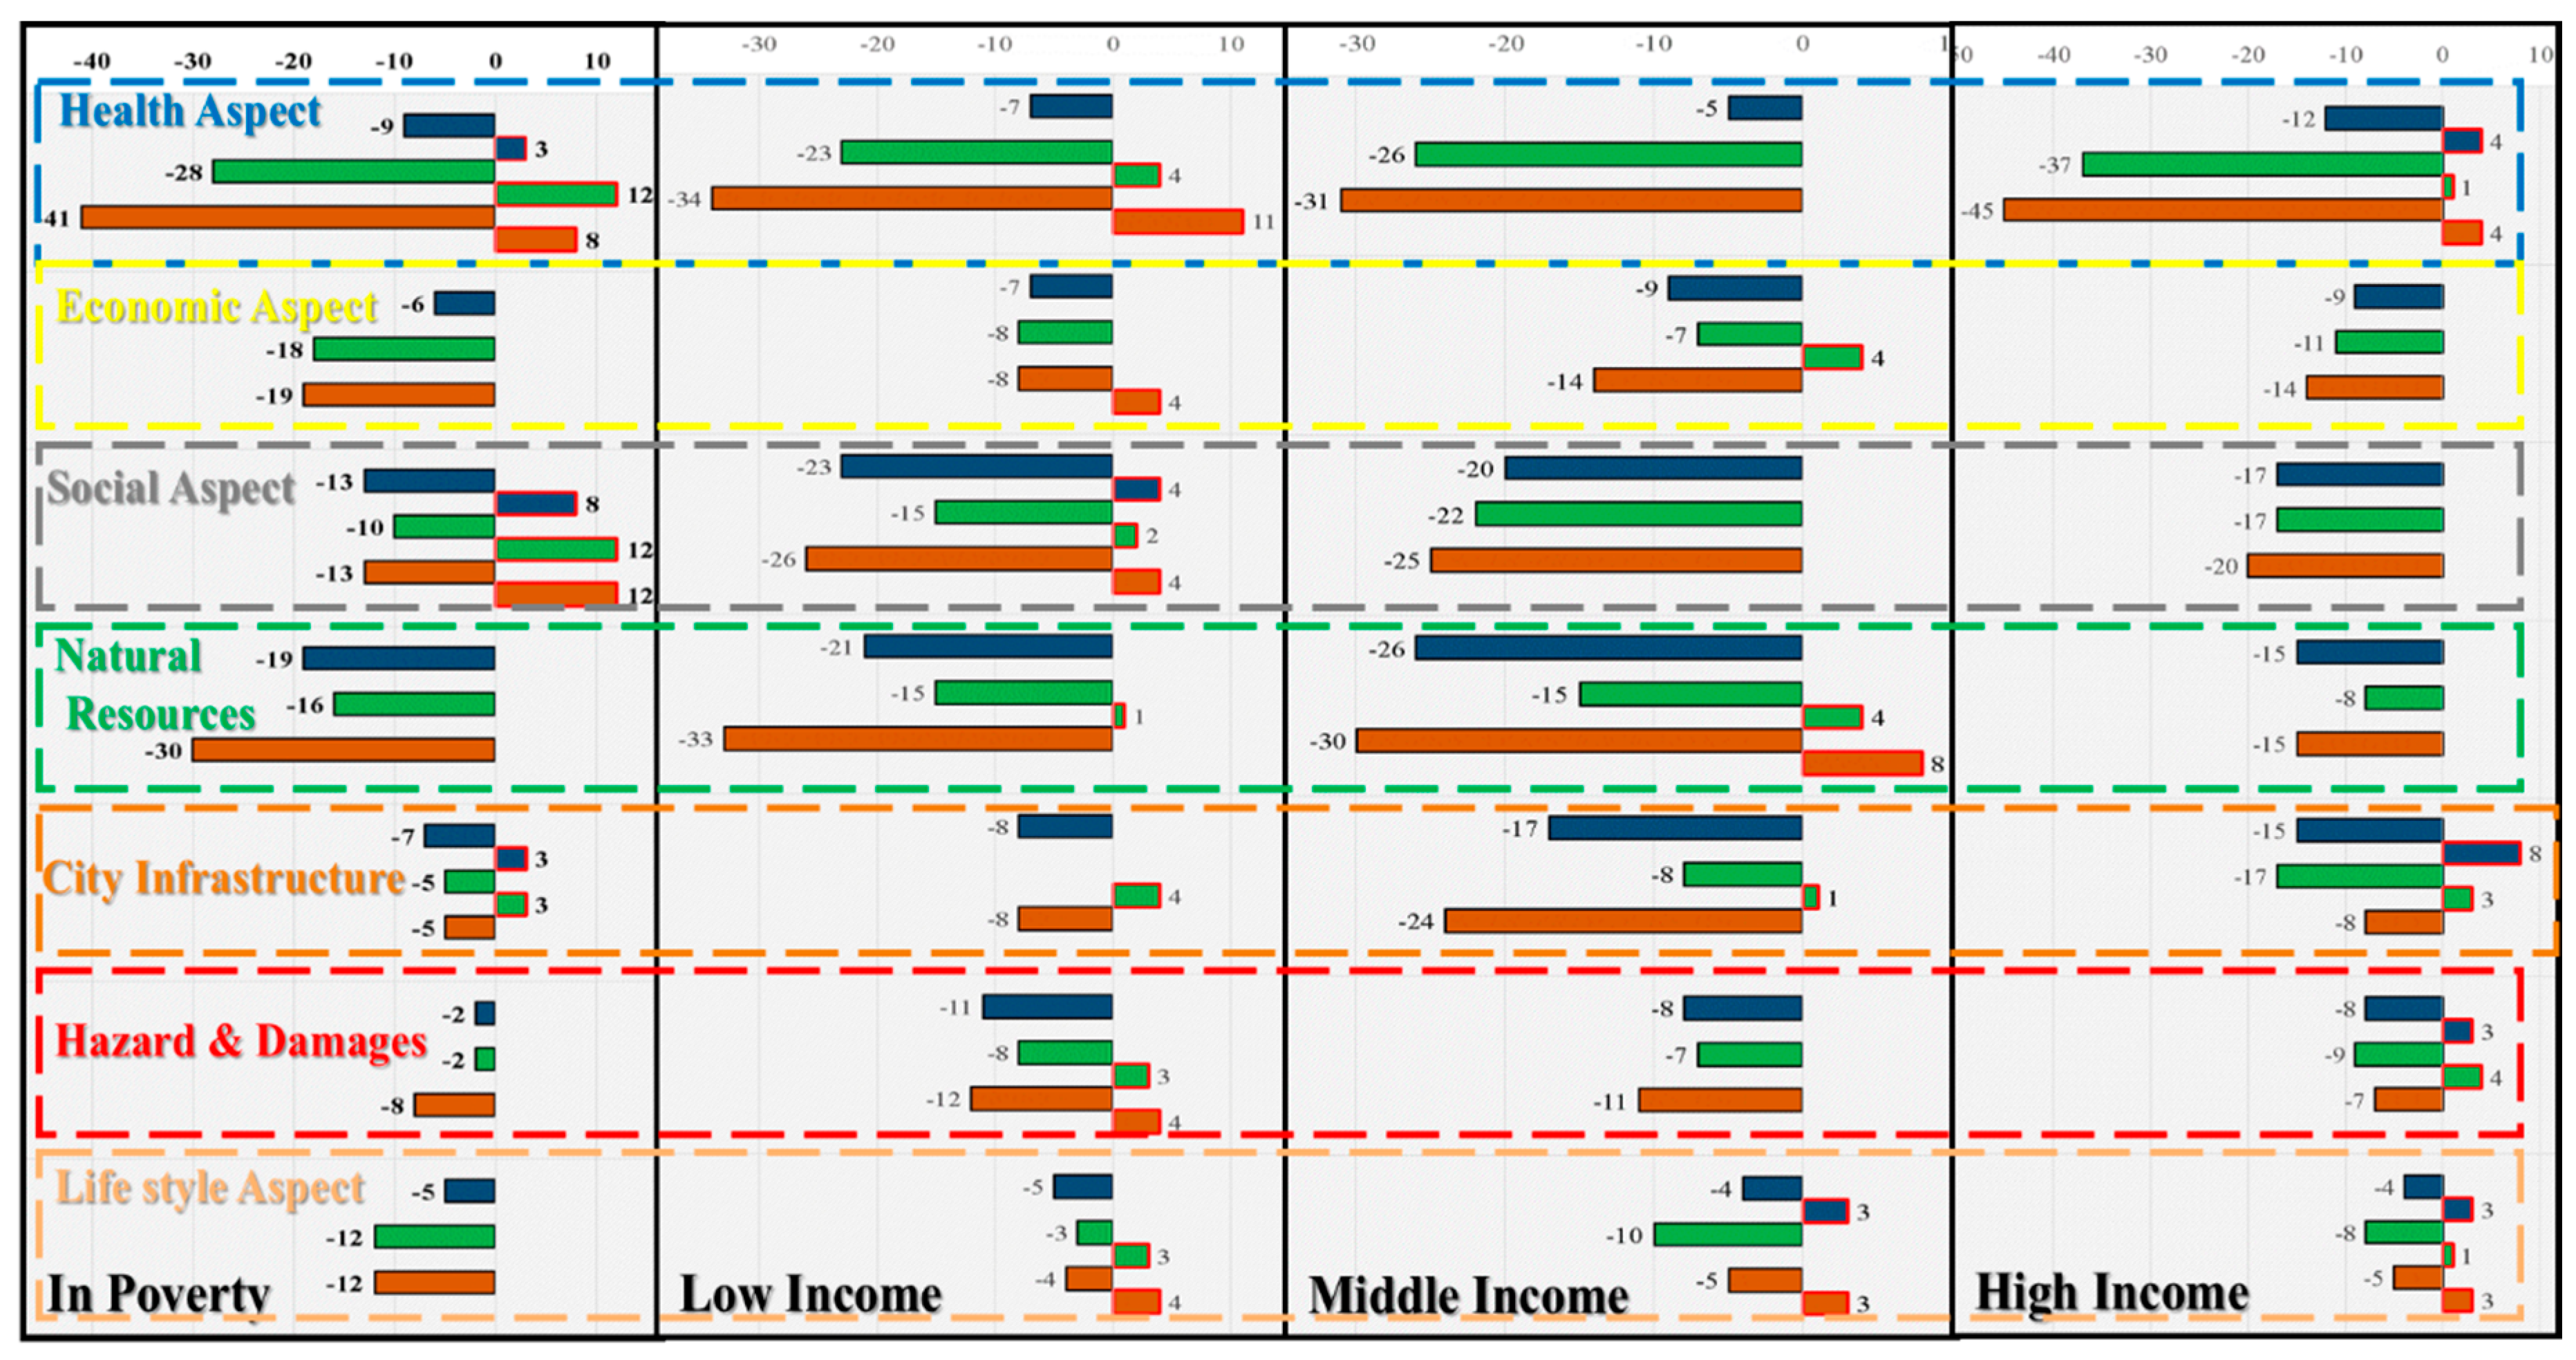
The results of three sample scenarios—investments in the public health sector, the water and electricity systems, and the transit sector—are presented in Figure 10, which shows the effect of each scenario on major concepts in the cognitive map of each income group.
Figure 10.
Comparing the effect of different scenarios on concepts per sector and income group. It should be highlighted that the negative numbers show the decrease in negative impacts (concepts) and positive numbers shows the increase in negative impacts. Legend: Blue bar represents the scenario: public health; green bar represents the scenario: water and electricity system; orange bar represents the scenario: transit system.
Figure 10 shows that investments in the transit sector compared to the other two tested scenarios would result in the strongest positive change (decrease in negative concepts) in most of the aspects. The result of this scenario in regards to health and natural resource aspects should be highlighted. With respect to the four income groups, the group of people living in poverty and of low income experience stronger negative impacts (increase in negative concepts) throughout all tested scenarios as compared with the middle class and high income group.
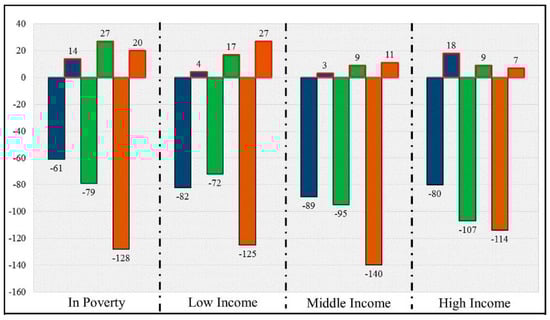
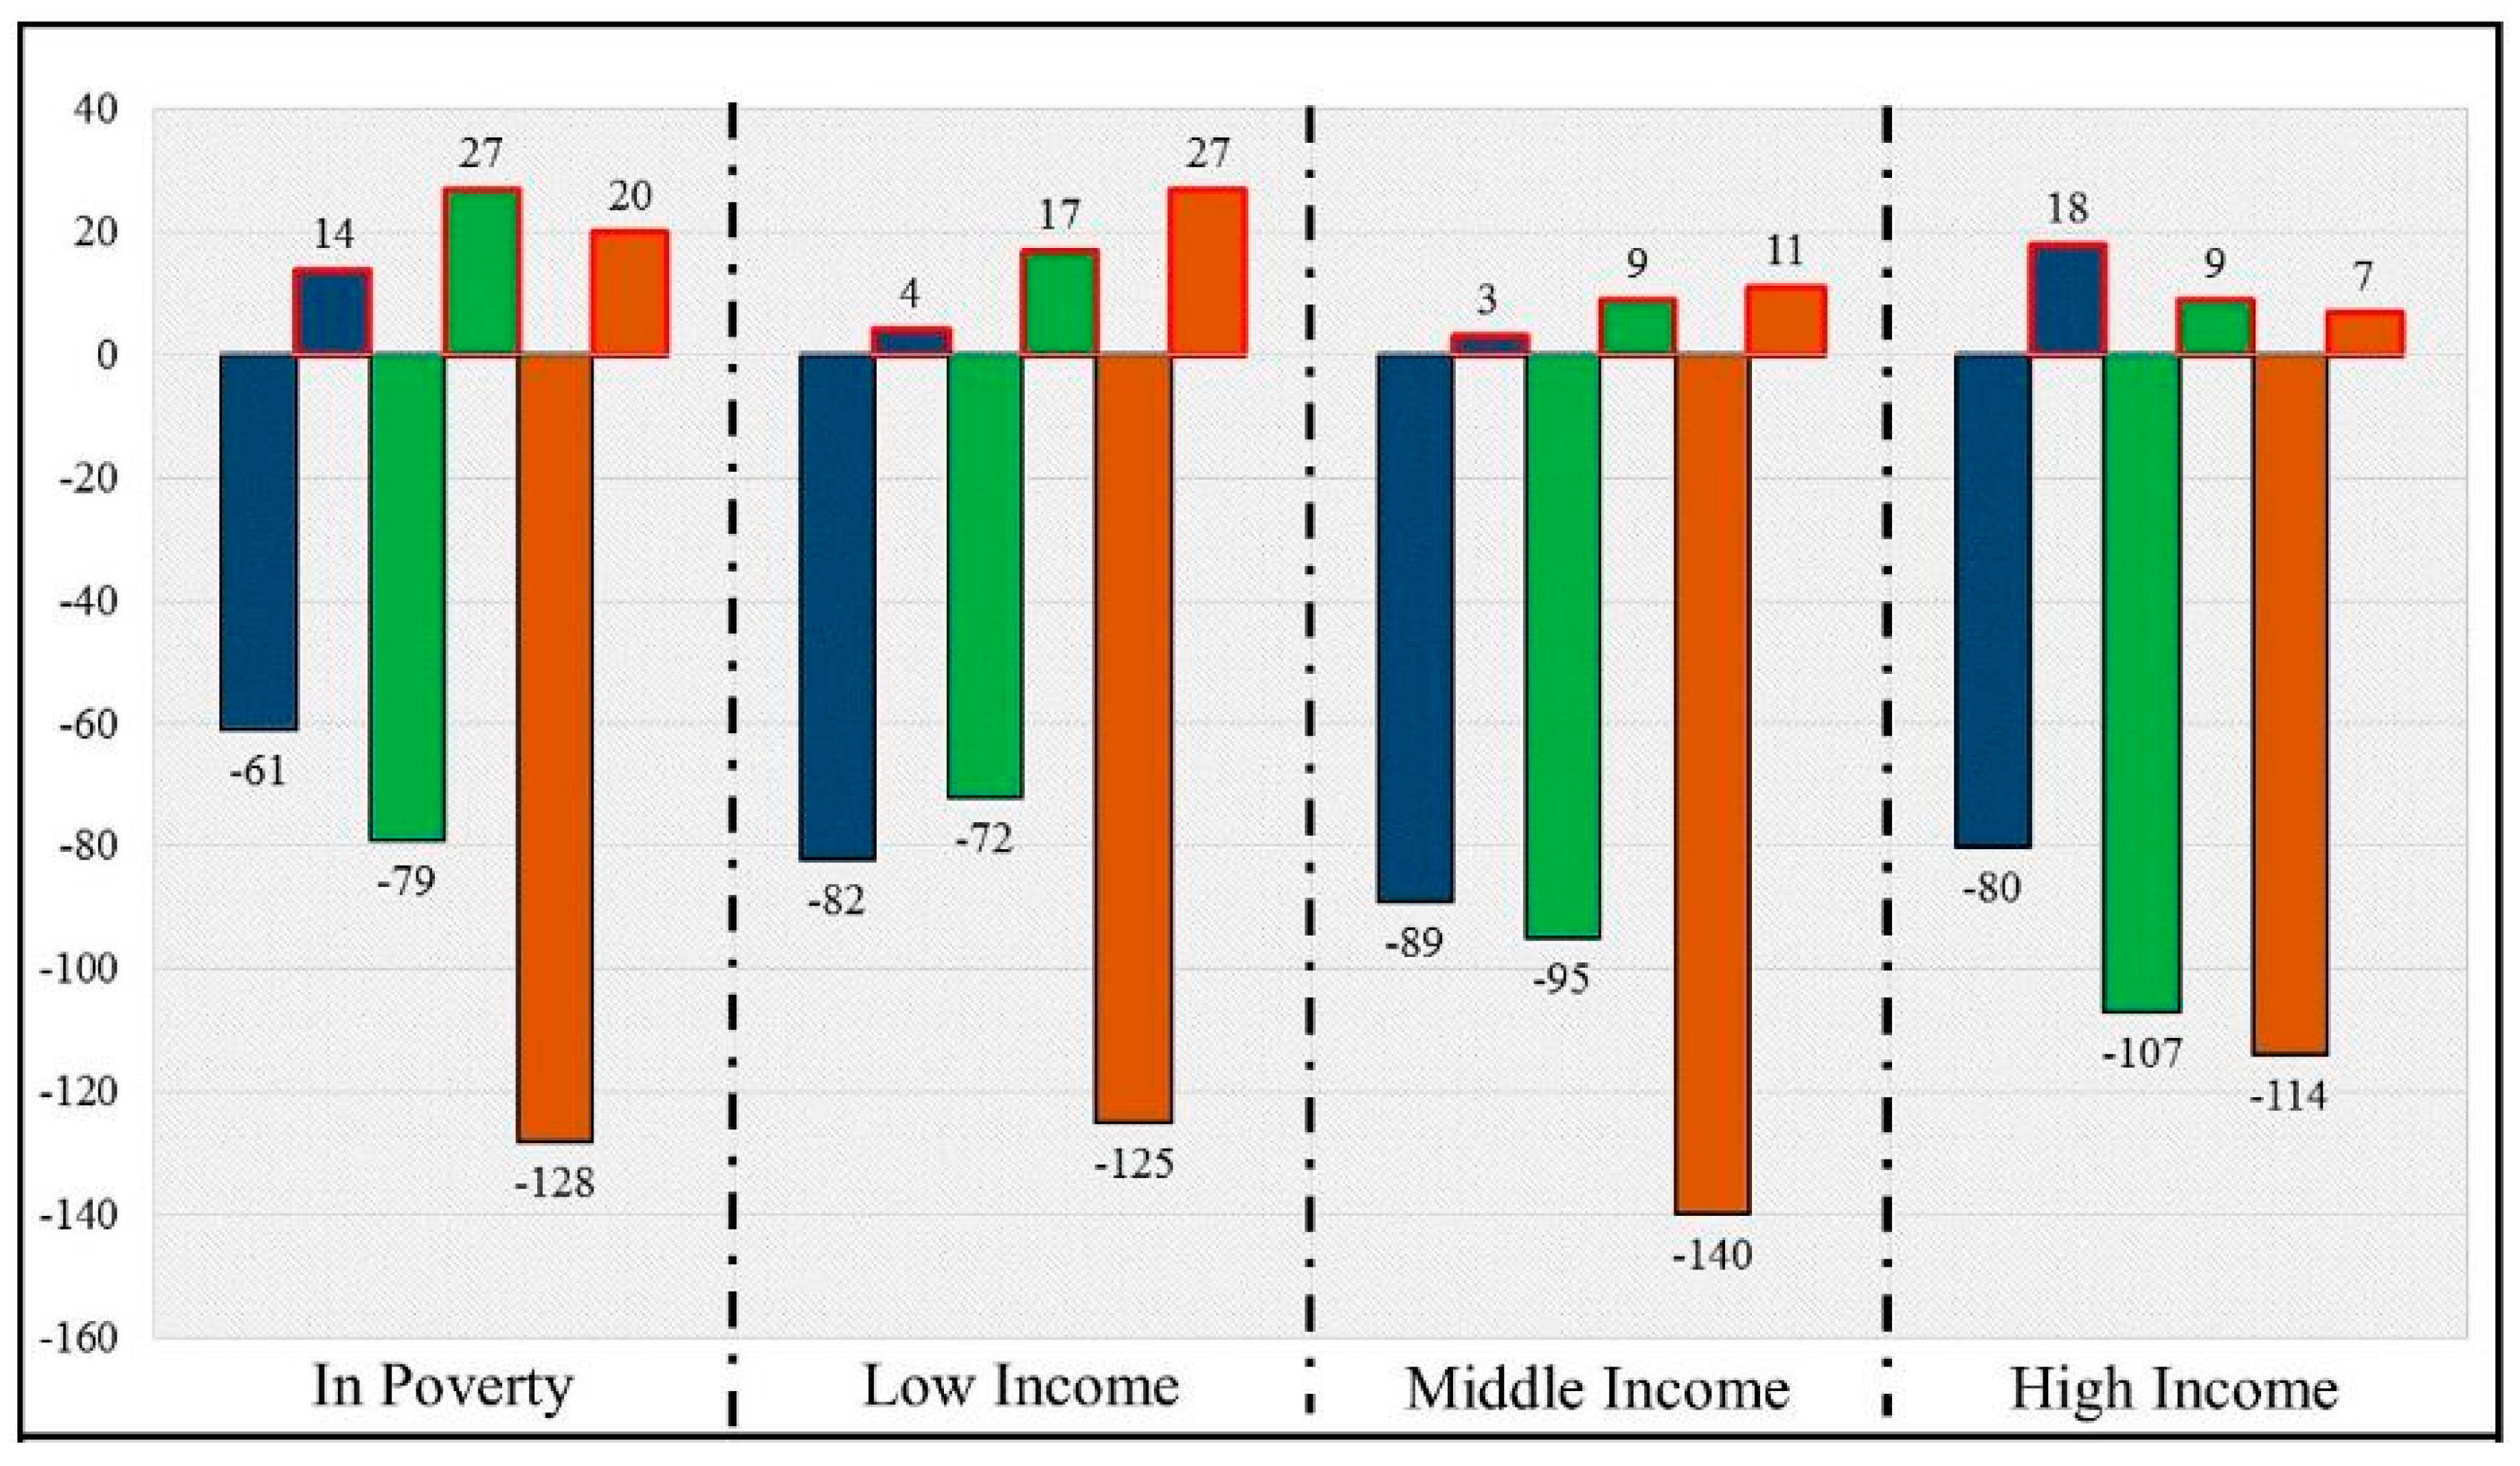
To provide a general overview of the effect of each scenario on the entire sample population, i.e., all income groups, and to compare them, all positive change of positive concepts and negative change of negative concepts are merged separately. The results are presented in Figure 11.
Figure 11.
Comparison of the joint impact of the three scenarios on all income groups. It should be highlighted that the negative number shows the decrease in negative impacts (concepts) and positive numbers shows the increase in negative impacts. Legend: Blue bar represents the scenario: public health; green bar represents the scenario: water and electricity system; orange bar represents the scenario: transit system.
The results of the scenario simulations show that all three scenarios have overall a positive impact on all income groups, as negative impacts are lowered by every scenario for each income group. The scenario “investment in the transit sector” shows the strongest positive effects for all income groups. Investments in the water and electricity system are the second most effective in reducing negative impacts for people living in poverty, middle and high income respondents, while for low income respondents the public health sector ranks second.
4. Discussion
The aim of this research was to assess the perception of NYC residents’ regarding impacts of heat waves and aspects of adaptation. By using citizen’s perception we aimed to concentrate on the local level and to develop relevant information for socially sensible adaptation options to heat waves as bottom-up process—and in contrast to top-down approaches in the governance hierarchy. Doing so this study also aimed to use and prioritize non-scientific local knowledge as the main driver in developing adaptation options for the local level. Using perception data and citizen’s cognitive maps with regard to the impacts of heat wave, residents’ understanding about heat waves become apparent, which is vitally important for individual and autonomous adaptation.
Moreover, using online interviews to collect residents’ perception data has proven to be a useful method and channel to reach in particular people of low incomes and people living in poverty—usually regarded as hard to reach. Using paid questionnaire surveys their views and perceptions can be elicited and theoretically be integrated and respected in the urban planning process. By that, people of lower income (could) become systematically involved as active stockholders in the urban governance and decision making processes. The developed tool is therefore useful, as considers the views and perception of vulnerable groups alongside other citizens, e.g., those belonging to higher income classes. Only if views of all income groups are respected adaptation measures can hypothetically be fully effective.
Our results show that residents living in poverty and of low income are more worried by heat wave impacts than higher income groups. They also perceive impacts to be larger in the future and a larger adaptation responsibility with themselves. The scenario analyses showed that investments in the transit sector show the highest positive impacts for all income groups, but for the lower income groups most. These results should be very useful for the decision makers in New York City, allowing aligning adaptation options with regard to future heat waves. According to the results of FCM analysis, focusing on the transit sector would have a potentially positive effect on concepts related to the health sector and water and electricity sectors as well and will lead to more effective and comprehensive answers to citizens needs when they face the negative impacts of heat waves.
There are also some limitations of the study. Compared to the population size of NYC (according to the American Community Survey projected to be at 8,405,837 in 2013) the sample size of 762 respondents is relatively small. However, for a social study it is quite comprehensive and particularly rich, with more than 60 variables to different subjects which can provide a useful overview of differences between various income groups in New York City.
The other limitation is in regards to gathering the FCM data through an online questionnaire. Eliciting networks via questionnaires is a complex task, increasing the risk of misunderstandings and mistakes, especially about the relation between concepts. According to Özesmi and Özesmi (2004) and Olazabal and Reckien (2015) face to face interview method should be favoured. However, using online questionnaires has also advantages, as it allows to reach more participant in a shorter timeframe and selected participants of particular characteristics or large diversity. Online FCM samples can therefore provide a more comprehensive sample, e.g., increasing the spatial scope of sampling from all New York City.
5. Conclusions
Our results show that lower income groups are more concerned about future impacts of heat wave than middle class and high income populations. They also see a larger adaptation responsibility with themselves. However, as regards sectors, residents of different income levels do not significantly disagree, apart from urban greenery and parks. Lower income households see a larger need for adaptation using urban greenery and parks, as compared to higher income respondents.
The FCM analysis shows that respondents are most concerned with health-related aspects, as health-related concepts have the highest share in the cognitive maps of all income groups’ cognitive maps. However, according to the results of the scenario simulation, investments in the transit sector shows the strongest positive effect for all income groups. Investment in the transit sector is a mediator and lowers the negative impacts on people’s health.
This research mainly concentrates on citizens’ perception and on local knowledge. Future study may combine these results with expert knowledge, especially climate change scientists and New York City decision makers, which could be a useful exercise increasing efficiency and validity of our results and ensuring that adaptation measures are fit for purpose.
Author Contributions
SM conducted the research and wrote most parts of the paper. DR conceptualized the study, gathered the data, guided the data analysis and supported the writing of the paper. JF contributed to the analysis and to writing.
Conflicts of Interest
The authors declare no conflict of interest.
Appendix A. Detailed Information about Concepts’ Fixed Value in Scenario Simulation
Table A1.
Selected concepts and their fixed values for scenario simulation in FCMAPPERS.
Appendix B. Perceived Extent of Climate Change Impacts in the Future
Figure A1.
Different income groups concerns about future impacts of heat waves based on different subjects.
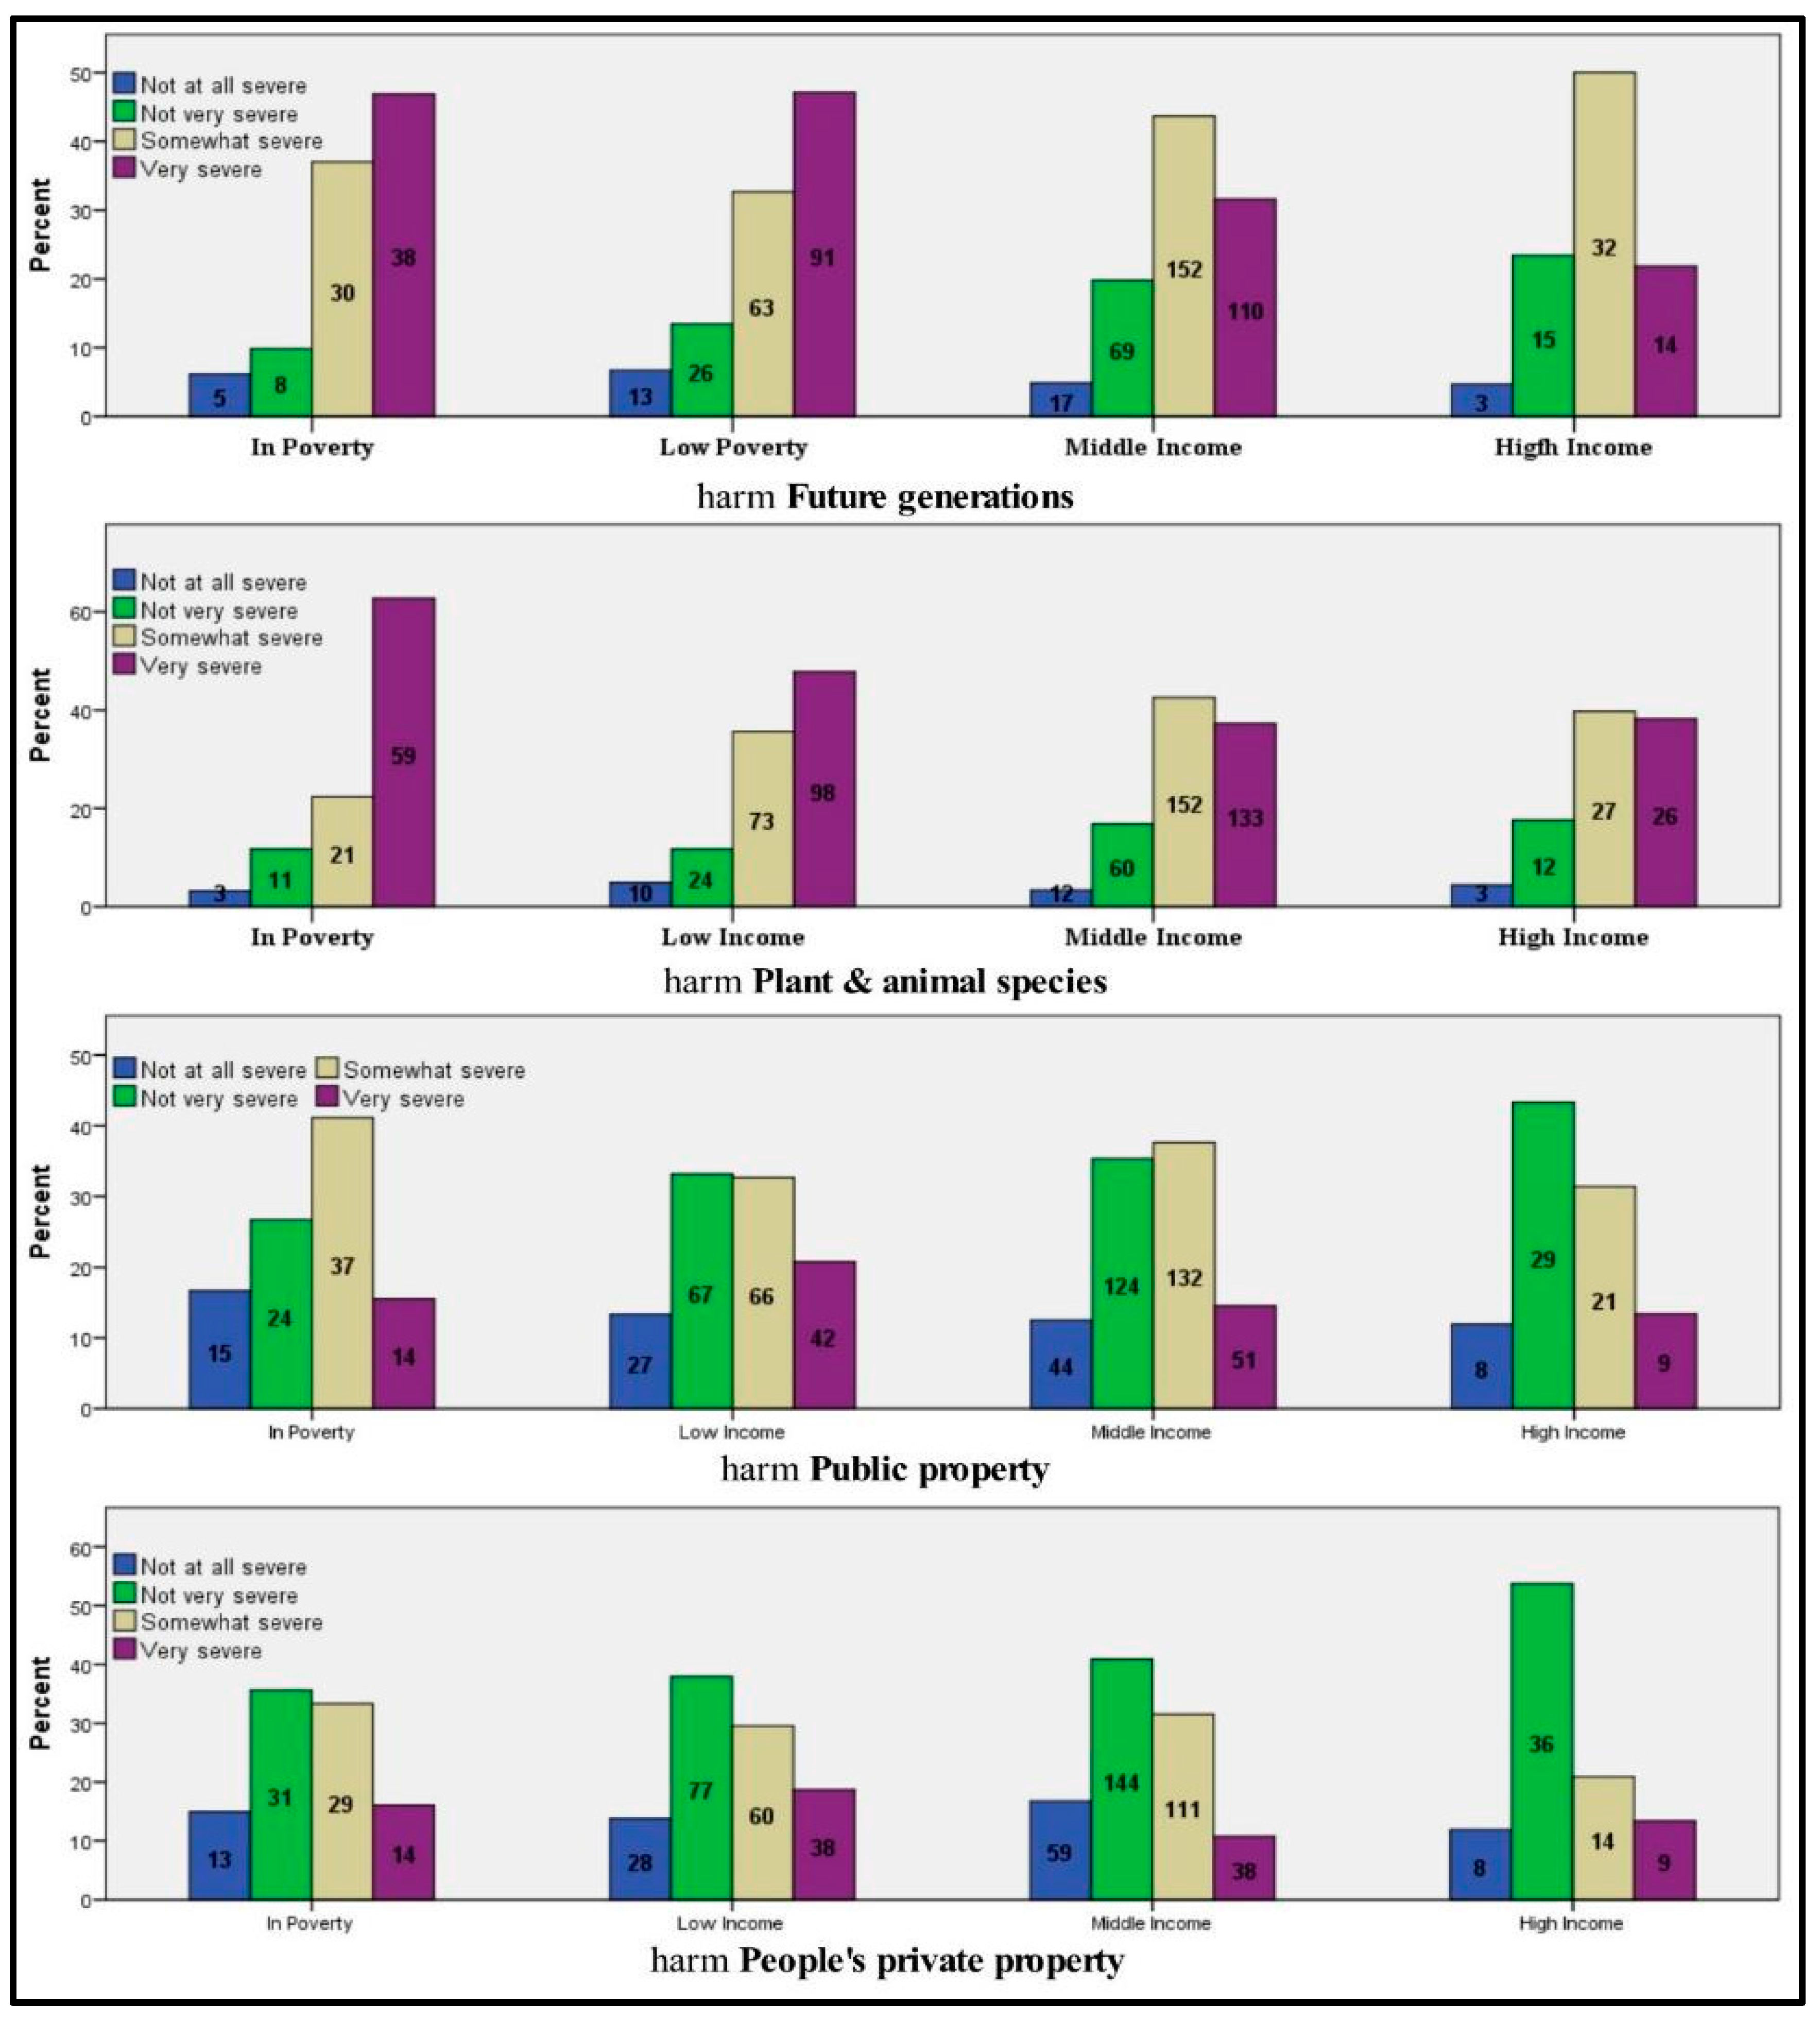
Figure A2.
Different income groups concerns about future impacts of heat waves based on different subjects. (the numbers inside the bars represent the number of responses in the data base).
Appendix C. Importance of Different Urban Sector in Future Heat Wave Adaptation
Figure A3.
Importance of different urban sectors in heat wave adaptation based on income groups’ perception (the numbers inside the bars represent the number of responses in the data base).
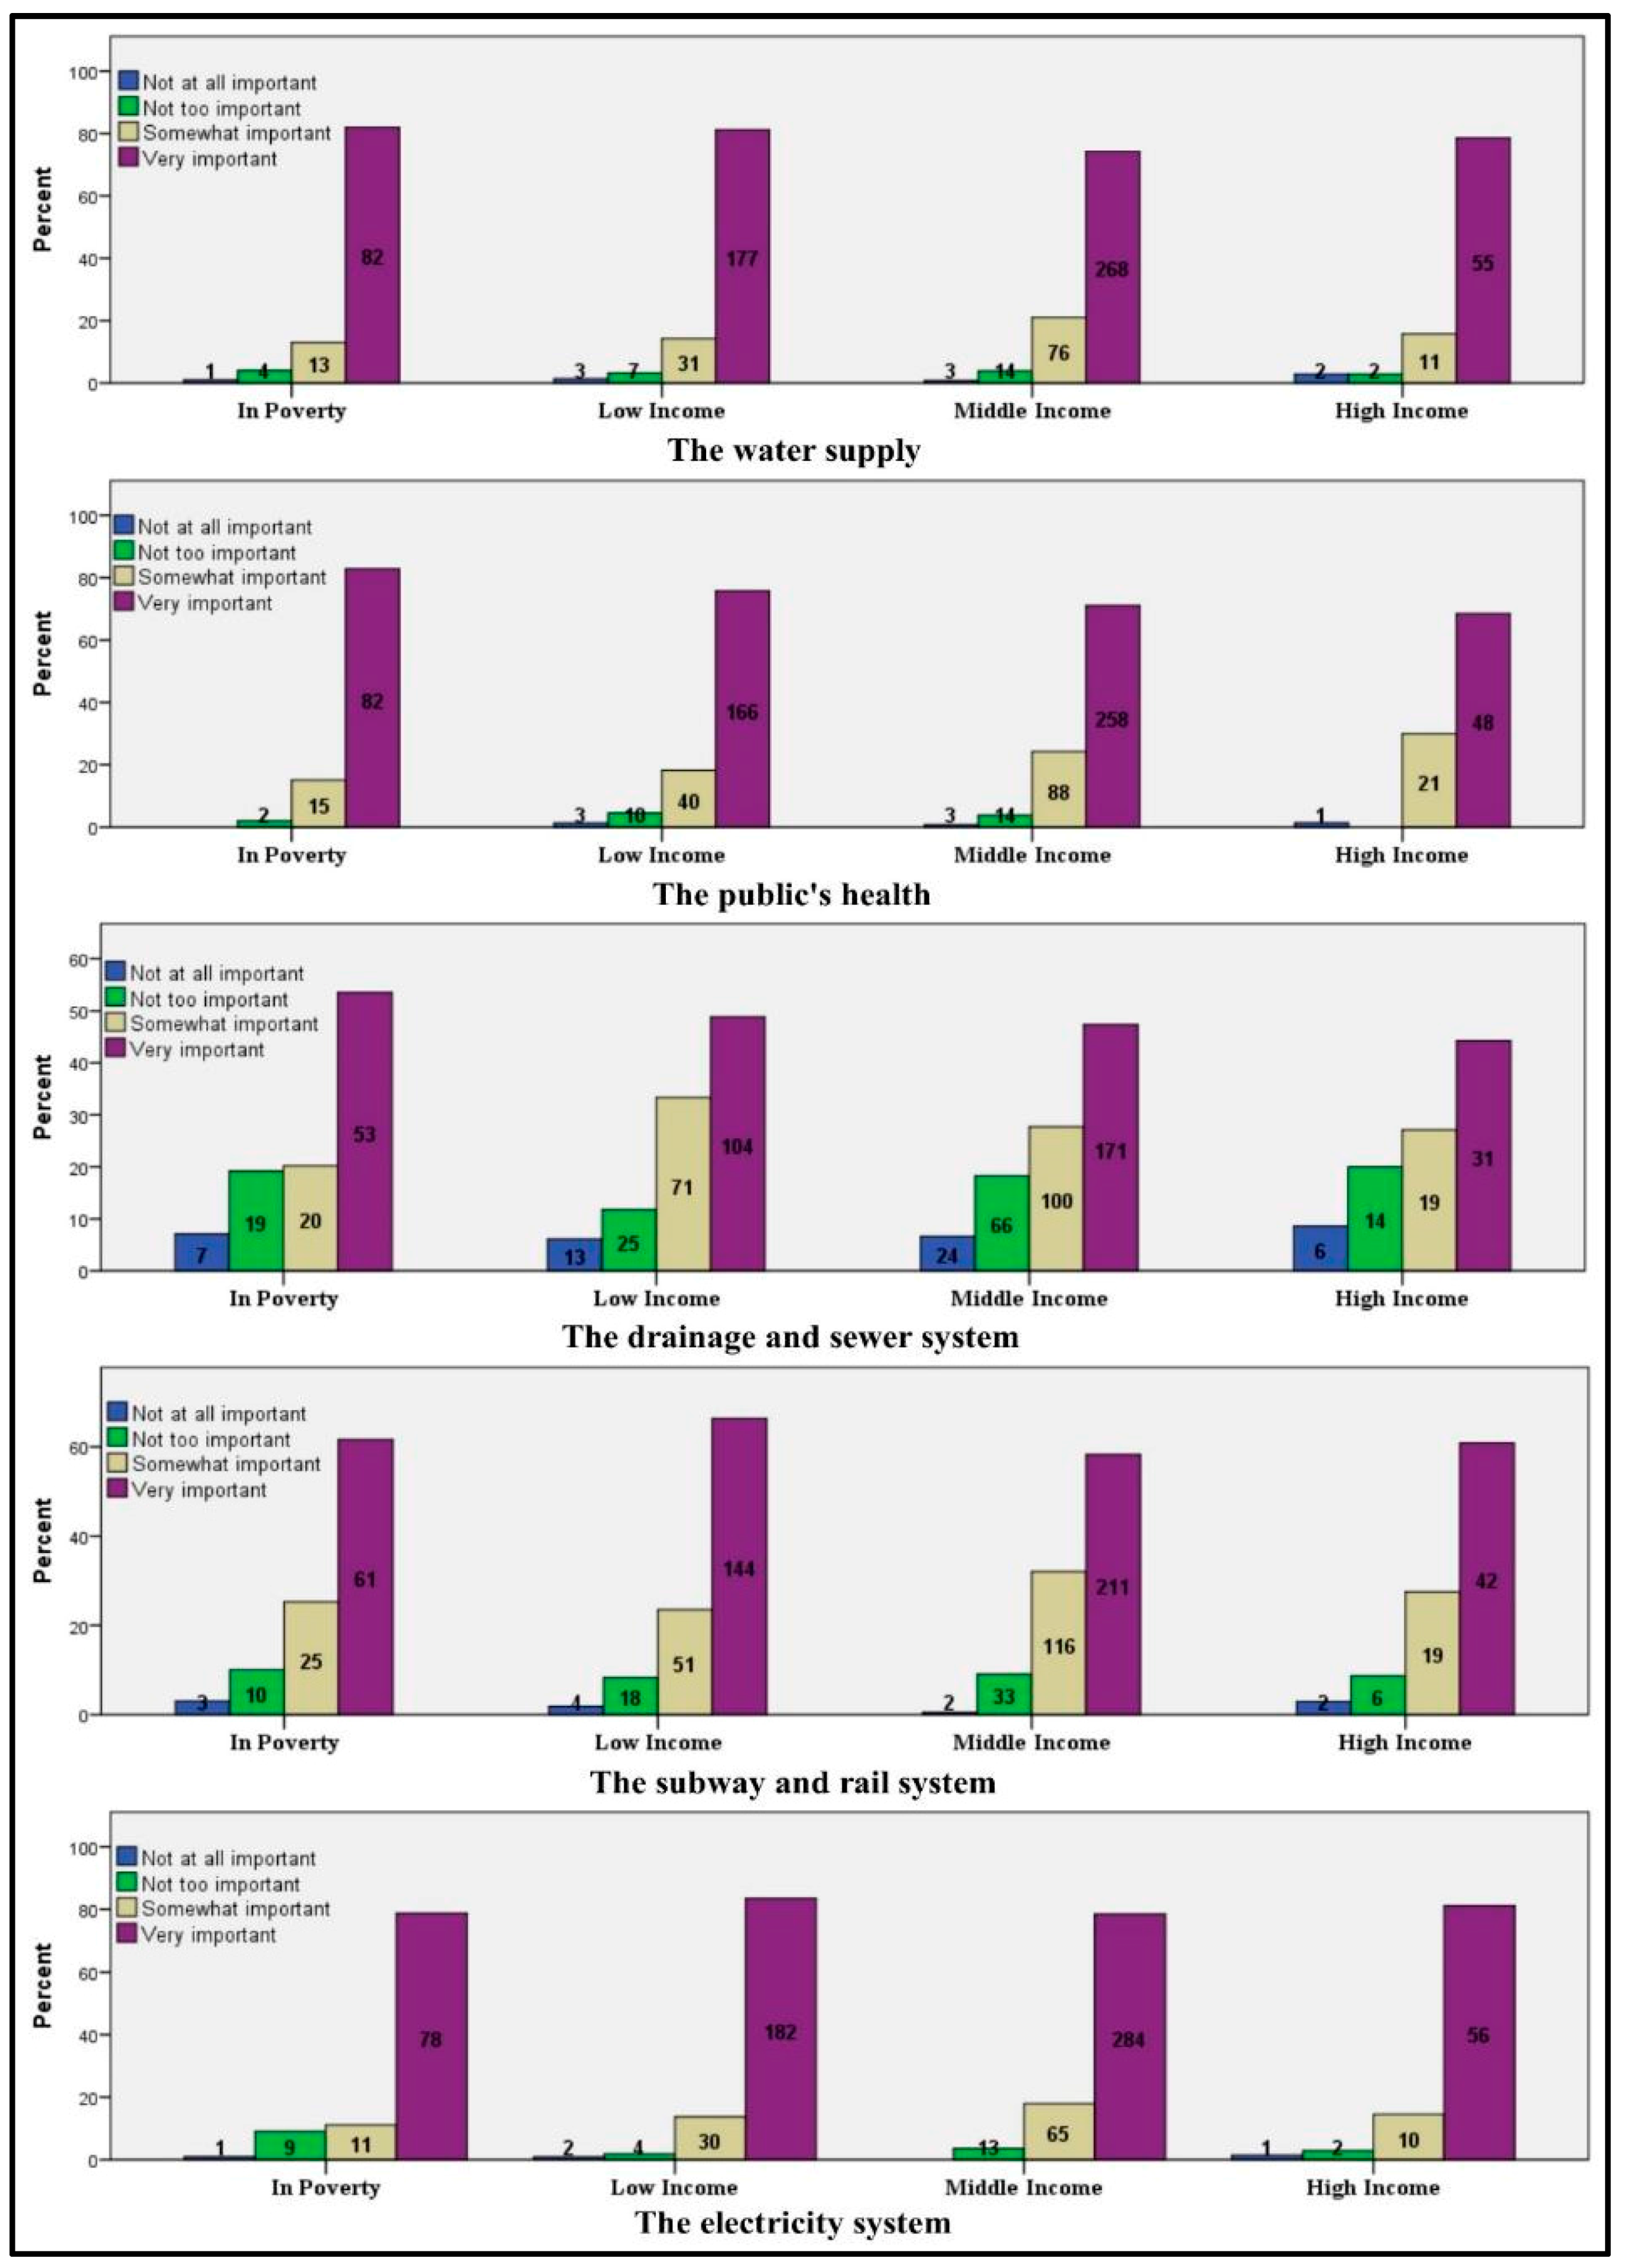
Figure A4.
Importance of different urban sectors in heat wave adaptation based on income groups’ perception (the numbers inside the bars represent the number of responses in the data base).
References
- Rosenzweig, C.; Solecki, W.D.; Hammer, S.A.; Mehrotra, S. Climate Change and Cities First Assessment Report of the Urban Climate Change Research Network(Executive Summary); Columbia University: New York, NY, USA, 2011; pp. 1–23. [Google Scholar]
- Klinenberg, E. Heat Wave: A Social Autopsy of Disaster in Chicago; University of Chicago Press: Chicago, IL, USA, 2003; p. 305. [Google Scholar]
- Satterthwaite, D.; Huq, S.; Pelling, M.; Reid, H.; Lankao, P.R. Adapting to Climate Change in Urban Areas: The Possibilities and Constraints in Low and Middle Income Nations; Human Settlments; IIED: London, UK, 2007; Volume 58, p. 124.
- Intergovernmental Panel on Climate Change (IPCC). Managing the Risks of Extreme Events and Disasters to Advance Climate Change Adaptation; Cambridge University Press: New York, NY, USA, 2012; p. 594. [Google Scholar]
- Goodess, C.M. How is the frequency, location and severity of extreme events likely to change up to 2060? Environ. Sci. Policy 2012, 27, S4–S14. [Google Scholar] [CrossRef] [Scilit]
- Rosenzweig, C.; Solecki, W.; Degaetano, A.; Grady, M.O.; Hassol, S.; Grabhorn, P.; Buonaiuto, F.; Hammer, S.A.; Kinney, P.L.; Wolfe, D.W.; et al. Responding to Climate Change in New York State: The Climaid Integrated Assessment for Effective Climate Change Adaptation in New York State; Final Report; Annals of the New York Academy of Sciences: New York, NY, USA, 2011; pp. 2–149. [Google Scholar]
- Wamsler, C.; Brink, E. Urban climate interfacing citizens’ and institutions’ practice and responsibilities for climate change adaptation. Urban Clim. 2014, 7, 64–91. [Google Scholar] [CrossRef] [Scilit]
- Williams, D.R.; Collins, C. Association of schools of public health racial residential segregation: A fundamental cause of racial disparities in health. Source: Public Health Rep. Health Dispar. 2001, 116, 404–416. [Google Scholar]
- Cutter, S.L.; Boruff, B.J.; Shirley, W.L. Social vulnerability to environmental hazards. Soc. Sci. Q. 2003, 84, 242–261. [Google Scholar] [CrossRef] [Scilit]
- Zuo, J.; Pullen, S.; Palmer, J.; Bennetts, H.; Chileshe, N.; Ma, T. Impacts of heat waves and corresponding measures: A review. J. Clean. Prod. 2015, 92, 1–12. [Google Scholar] [CrossRef] [Scilit]
- Evans, G.W.; Kantrowitz, E. Socioeconomic status and health: The potential role of environmental risk exposure. Annu. Rev. Public Health 2002, 23, 303–331. [Google Scholar] [CrossRef] [Scilit] [PubMed]
- Kinney, P.L.; Matte, T.; Knowlton, K.; Madrigano, J.; Petkova, E.; Weinberger, K.; Quinn, A.; Arend, M.; Pullen, J. New York City Panel on Climate Change 2015 Report Chapter 5: Public Health Impacts and Resiliency; Annals of the New York Academy of Sciences: New York, NY, USA, 2015; pp. 67–88. [Google Scholar]
- Reckien, D.; Creutzig, F.; Fernandez, B.; Lwasa, S.; Tovar-Restrepo, M.; Mcevoy, D.; Satterthwaite, D. Climate change, equity and the sustainable development goals: An urban perspective. Environ. Urban. 2017, 29, 159–182. [Google Scholar] [CrossRef] [Scilit]
- Reckien, D.; Lwasa, S.; Satterthwaite, D.; McEvoy, D.; Creutzig, F.; Montgomery, M.; Schensul, D.; Balk, D.; Khan, I. Equity, environmental justice, and urban climate change. In Climate Change and Cities: Second Assessment Report of the Urban Climate Change Research Network; Rosenzweig, C., Solecki, W., Romero-Lankao, P., Mehrotra, S., Dhakal, S., Ibrahim, S.A., Eds.; Cambridge University Press: Cambridge, UK, 2017. [Google Scholar]
- Rosenthal, J.K.; Kinney, P.L.; Metzger, K.B. Intra-urban vulnerability to heat-related mortality in new york city, 1997–2006. Health Place 2014, 30, 45–60. [Google Scholar] [CrossRef] [Scilit] [PubMed]
- Sampson, N.R.; Gronlund, C.J.; Buxton, M.A.; Catalano, L.; White-Newsome, J.L.; Conlon, K.C.; O’Neill, M.S.; McCormick, S.; Parker, E.A. Staying cool in a changing climate: Reaching vulnerable populations during heat events. Glob. Environ. Chang. 2013, 23, 475–484. [Google Scholar] [CrossRef] [Scilit]
- Intergovernmental Panel on Climate Change (IPCC). Summary for Policymakers; Climate Change 2014: Impacts, Adaptation and Vulnerability-Contributions of the Working Group II to the Fifth Assessment Report; Cambridge University Press: Cambridge, UK; New York, NY, USA, 2014; pp. 1–32. [Google Scholar]
- Füssel, H.M. Vulnerability: A generally applicable conceptual framework for climate change research. Glob. Environ. Chang. 2007, 17, 155–167. [Google Scholar] [CrossRef] [Scilit]
- Intergovernmental Panel on Climate Change (IPCC). Glossary. In Climate Change 2013: Impacts, Adaptation and Vulnerability. Contribution of Working Group II to the Fifth Assessment Report of the Intergovernmental Panel on Climate Change; Cambridge University Press: Cambridge, UK; New York, NY, USA, 2014; pp. 1757–1776. [Google Scholar]
- Tonn, B.; Eisenberg, J. The aging us population and residential energy demand. Energy Policy 2007, 35, 743–745. [Google Scholar] [CrossRef] [Scilit]
- Lemmen, D.S.; Warren, F.J. Climate Change Impacts and Adaptation: A Canadian Perspective; Natural Resources Canada: Ottawa, OTT, Canada, 2004; p. 174.
- Barnett, J.; O’Neill, S. Maladaptation. Glob. Environ. Chang. 2010, 20, 211–213. [Google Scholar] [CrossRef] [Scilit]
- Bolitho, A.; Miller, F. Heat as emergency, heat as chronic stress: Policy and institutional responses to vulnerability to extreme heat. Local Environ. 2016, 1–17. [Google Scholar] [CrossRef] [Scilit]
- Slovic, P. The Perception of Risk; Routledge: London, UK, 2000. [Google Scholar]
- The Organisation for Economic Co-operation and Development (OECD). Modernising Government: The Way Forward; OECD: Paris, France, 2005. [Google Scholar]
- Pollitt, C.; Hupe, P. Talking governance: The role of magic concepts. Public Manag. Rev. 2011, 13, 641–658. [Google Scholar] [CrossRef] [Scilit]
- Bernauer, T.; Schaffer, L.M. Climate change governance. In The Oxford Handbook of Governance; OUP: Oxford, UK, 2012; pp. 9–27. [Google Scholar]
- Anguelovski, I.; Carmin, J. Something borrowed, everything new: Innovation and institutionalization in urban climate governance. Curr. Opin. Environ. Sustain. 2011, 3, 169–175. [Google Scholar] [CrossRef] [Scilit]
- Chanza, N.; De wit, A. Enhancing climate governance through indigenous knowledge: Case in sustainability science. J. Sci. 2016, 112, 1–7. [Google Scholar] [CrossRef] [Scilit]
- Sippel, M.; Jenssen, T. What About local Climate Governance? A Review of Promise and Problems. 2009, pp. 1–51. Available online: https://ssrn.com/abstract=1514334 (accessed on 31 May 2017).
- Urwin, K.; Jordan, A. Does public policy support or undermine climate change adaptation? Exploring policy interplay across different scales of governance. Glob. Environ. Chang. 2008, 18, 180–191. [Google Scholar] [CrossRef] [Scilit]
- Olazabal, M.; Reckien, D. Chapter 7: Fuzzy cognitive mapping: Applications to urban environmental decision-making. In Handbook of Research Methods and Applications in Environmental Studies; Ruth, M., Ed.; Edward Elgar Publishing: Cheltenham, UK, 2015; pp. 148–176. [Google Scholar]
- Reckien, D. Weather extremes and street life in india-implications of fuzzy cognitive mapping as a new tool for semi-quantitative impact assessment and ranking of adaptation measures. Glob. Environ. Chang. 2014, 26, 1–13. [Google Scholar] [CrossRef] [Scilit]
- Reckien, D.; Wildenberg, M.; Bachhofer, M. Subjective realities of climate change: How mental maps of impacts deliver socially sensible adaptation options. Sustain. Sci. 2013, 8, 159–172. [Google Scholar] [CrossRef] [Scilit]
- Reckien, D.; Wildenberg, M.; Deb, K. Understanding potential climate change impacts and adaptation options in indian megacities. In Resilient Cities: Cities and Adaptation to Climate Change-Proceedings of the Global Forum 2010; Otto-Zimmermann, K., Ed.; Springer: Dordrecht, The Netherlands, 2011; pp. 15–34. [Google Scholar]
- Gray, S.R.J.; Gagnon, A.S.; Gray, S.A.; O’Dwyer, B.; O’Mahony, C.; Muir, D.; Devoy, R.J.N.; Falaleeva, M.; Gault, J. Are coastal managers detecting the problem? Assessing stakeholder perception of climate vulnerability using fuzzy cognitive mapping. Ocean Coast. Manag. 2014, 94, 74–89. [Google Scholar] [CrossRef] [Scilit]
- Moser, S.C.; Ekstrom, J.A. A framework to diagnose barriers to climate change adaptation. Proc. Natl. Acad. Sci. USA 2010, 107, 22026–22031. [Google Scholar] [CrossRef] [Scilit] [PubMed]
- Horton, R.M.; Gornitz, V.; Bader, D.A.; Ruane, A.C.; Goldberg, R.; Rosenzweig, C. Climate hazard assessment for stakeholder adaptation planning in new york city. J. Appl. Meteorol. Climatol. 2011, 50, 2247–2266. [Google Scholar] [CrossRef] [Scilit]
- Long, H. America’s 10 Most Unequal Cities. Available online: http://money.cnn.com/2014/12/14/news/economy/america-inequality-10-worst-cities/index.html (accessed on 14 December 2014).
- De Navas-Walt, C.; Proctor, B.D. Income and Poverty in the United States: 2013 Current Population Reports; Current Population Reports; U.S. Government Printing Office: Washington, DC, USA, 2014; pp. 60–249.
- Elkwell, C.K. The Distribution of Household Income and the Middle Class; Library of Congress, Congressional Research Service: Washington, DC, USA, 2014; Volume 7–5700, pp. 1–10.
- Kiersz, A.; Kane, L. What ‘middle class’ means in 50 major US cities. Available online: http://www.businessinsider.com/what-middle-class-means-in-50-major-us-cities-2015-4 (accessed on 2 April 2015).
- Carver, R.H.; Nash, J.G. Doing Data Analysis with Spss®; Version 18; Cengage Learning: Boston, MA, USA, 2011. [Google Scholar]
- Corder, G.W.; Foreman, D.I. Nonparametric Statistics for Non-Statisticians: A Step by Step Approach; Wiley: Hoboken, NJ, USA, 2009; Volume 264. [Google Scholar]
- Kok, K. The potential of fuzzy cognitive maps for semi-quantitative scenario development, with an example from brazil. Glob. Environ. Chang. 2009, 19, 122–133. [Google Scholar] [CrossRef] [Scilit]
- Jetter, A.; Schweinfort, W. Building scenarios with fuzzy cognitive maps: An exploratory study of solar energy. Futures 2011, 43, 52–66. [Google Scholar] [CrossRef] [Scilit]



© 2017 by the authors. Licensee MDPI, Basel, Switzerland. This article is an open access article distributed under the terms and conditions of the Creative Commons Attribution (CC BY) license (http://creativecommons.org/licenses/by/4.0/).