


Abstract
Efficient and accurate flood risk assessment is essential for cultural heritage conservation in the context of increasingly frequent extreme weather events. Conventional flood risk assessment methods primarily aim to approximate inundation patterns across the entire study area, and their analytical units are not necessarily aligned with object-oriented decision-making. To address this limitation, this study develops a site-oriented surrogate modeling approach. The approach integrates site-specific characteristics with multi-scale neighborhood features to characterize local environmental constraints and investigates how neighborhood scale influences predictive performance. To this end, five models are constructed and compared, i.e., M1_Site, M2_50m, M3_200m, M4_500m, and M5_Multi-Scale. Experiments were conducted on 714 cultural heritage sites in Shanghai. Overall, the M2_50m, M3_200m, and M5_Multi-Scale models demonstrate strong predictive performance, with Test F1, GroupKFold F1, and Test Accuracy all above 0.85. According to the results, the site-oriented surrogate modeling approach is feasible, and neighborhood features are important. Model performances also exhibited clear scale sensitivity. This approach provides a practical framework for rapid, site-specific flood risk assessment and offers new insights for decision-making in cultural heritage conservation. Future research could focus on validating this approach in other contexts and applying it to multi-scenario risk analyses to further support heritage conservation planning.
1. Introduction
Along with increasingly frequent extreme weather events around the world [1], flood disasters have emerged as a critical threat to cultural heritage conservation [2]. Cultural heritage sites, as immovable assets, cannot be relocated to safer areas to avoid disaster impacts. This spatial immobility makes improving flood risk assessment capabilities particularly important. To implement preventive conservation strategies and support risk-informed heritage conservation planning, there is an urgent need to develop a risk assessment approach capable of rapid updates for multiple scenarios and enabling dynamic and accurate decision-making [3].
Physics-based hydraulic models are widely used in flood risk assessment because they can simulate spatially distributed inundation characteristics, including flood extent and depth. The Hydrologic Engineering Center’s River Analysis System (HEC-RAS) [4] is a commonly used hydraulic modeling platform and has been applied to flood inundation assessment across different geographical settings and spatial scales, including islands, mountainous regions, and river basins [5,6,7,8]. These studies demonstrate the capability of HEC-RAS to simulate spatially explicit flood characteristics, such as inundation depth and extent. However, hydraulic simulations are often computationally intensive, and their computational burden can increase substantially in large-scale applications, limiting rapid multi-scenario analysis and flexible support for heritage conservation planning.
In recent years, machine learning methods have been increasingly applied to flood risk assessment research [9,10]. These methods demonstrate strong capability in capturing nonlinear relationships between hydraulic responses and environmental factors. By constructing surrogate models, computational efficiency can be significantly improved while maintaining acceptable predictive accuracy [11], thereby enabling multi-scenario flood risk evaluation [12]. For example, Haces-Garcia et al. [13] developed several surrogate models using HEC-RAS simulation results, achieving substantial improvements in computational efficiency compared to traditional physics-based modeling approaches. In addition, Xu et al. [14] developed surrogate models using outputs from a physics-based numerical model, enabling rapid output of flood information across temporal and spatial dimensions.
Among machine learning methods, tree-based models have demonstrated particular advantages on tabular data [15,16] and shown strong capabilities for enhancing flood risk assessment [17]. For example, Sasanapuri et al. [18] trained random forest surrogate models for flood simulations in India’s Godavari River Basin, achieving real-time prediction of maximum inundation depth and velocity. XGBoost [19] is also an efficient tree-based boosting algorithm widely used in tabular data modeling tasks. Its regularization mechanism and flexible parameter tuning can effectively control model complexity, maintaining high prediction accuracy while minimizing overfitting risks. These models serve as substitutes for the entire flood simulation process, offering a practical method for multi-scenario flood risk assessment.
Existing flood surrogate models commonly aim to reproduce inundation depth or extent over continuous spatial domains, with training samples often distributed across the study area to approximate regional flood fields. Such approaches are well suited for rapid large-scale prediction, but their analytical units are not necessarily aligned with object-oriented decision-making for cultural heritage sites. For example, Zahura et al. [20] investigated surrogate modeling of flood depths at street segments and found that predictive performance was better when the model was trained specifically on the most flood-prone streets. This result suggests that targeted training focused on predefined locations of interest can be advantageous when the modeling objective is location-specific. As sampling strategies can substantially affect model accuracy and reliability [21], training samples distributed across an entire spatial domain may not necessarily provide sufficient representation of the environmental characteristics associated with a predefined set of target sites.
Meanwhile, previous heritage flood risk studies have demonstrated that risk at individual heritage assets can depend on building-specific characteristics together with surrounding conditions. For example, D’Ayala et al. [22] developed a multilevel flood vulnerability framework for traditional heritage buildings by integrating building-specific, neighborhood, and catchment-scale parameters. These findings suggest that, when the assessment target is a predefined set of discrete heritage sites, explicitly organizing predictors around the sites may provide a more direct representation of the environmental characteristics relevant to site-level risk assessment.
Accordingly, this study proposes a surrogate modeling approach for flood risk assessment of discrete spatial objects. Each object is treated as an analytical unit, and its surrounding environmental characteristics are explicitly represented through multi-scale neighborhood features. Focusing on cultural heritage sites, we plan to develop machine learning surrogate models that integrate site-specific characteristics with environmental characteristics. This could enable fast assessment of flood risks under specific rainfall hazards for these sites.
Instead of calculating continuous inundation depths, we aim to develop a classification model that identifies risk levels. Existing studies have shown that flood risks in urban environments are commonly classified by inundation depth thresholds [23,24]. For cultural heritage, however, flood vulnerability is highly asset-specific. Previous studies have highlighted the influence of material degradation, asset typology, and water-sensitive heritage contents on flood damage, which complicates the generalization of a single depth-damage relationship [25]. Accordingly, the objective of the classification model in our study is not to estimate physical damage of individual sites, but to rapidly identify heritage sites requiring different levels of conservation attention at a city-wide scale. For planning-oriented screening, an inundation depth of 0.2 m was adopted as the boundary between low and elevated risk. Similar thresholds have been used in existing flood-depth classifications and flood-protection practice [26,27]. This value is used as an operational screening criterion rather than a physical damage threshold for cultural heritage. Drawing on these considerations, this study adopts the following risk classification categories:
- •
- No risk: inundation depth equals 0 m.
- •
- Low risk: inundation depth greater than 0 m and less than or equal to 0.2 m, representing shallow inundation requiring basic protective attention
- •
- Elevated risk: depths exceeding 0.2 m, representing inundation conditions requiring increased conservation attention
The thresholds in this study do not represent exact physical damage limits but rather relative, management-oriented risk levels for heritage conservation assessment. It is used for distinguishing shallow inundation from conditions requiring increased conservation attention. This classification aligns with a planning-oriented risk assessment where identifying sites requiring different levels of attention is considered more important than predicting precise inundation depths.
Methodologically, this study proposes a site-oriented surrogate modeling approach that integrates site-specific features with multi-scale neighborhood features. Flood simulations under 10-, 50-, 100-, and 200-year design rainfall scenarios were used to generate site-level risk labels for cultural heritage sites in Shanghai. Five XGBoost-based model configurations were constructed using site-specific features and neighborhood features at different spatial scales to evaluate the feasibility of the proposed approach and investigate the effects of neighborhood-scale feature organization.
2. Materials and Methods
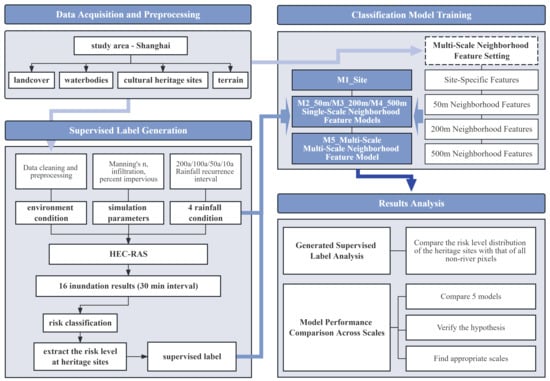
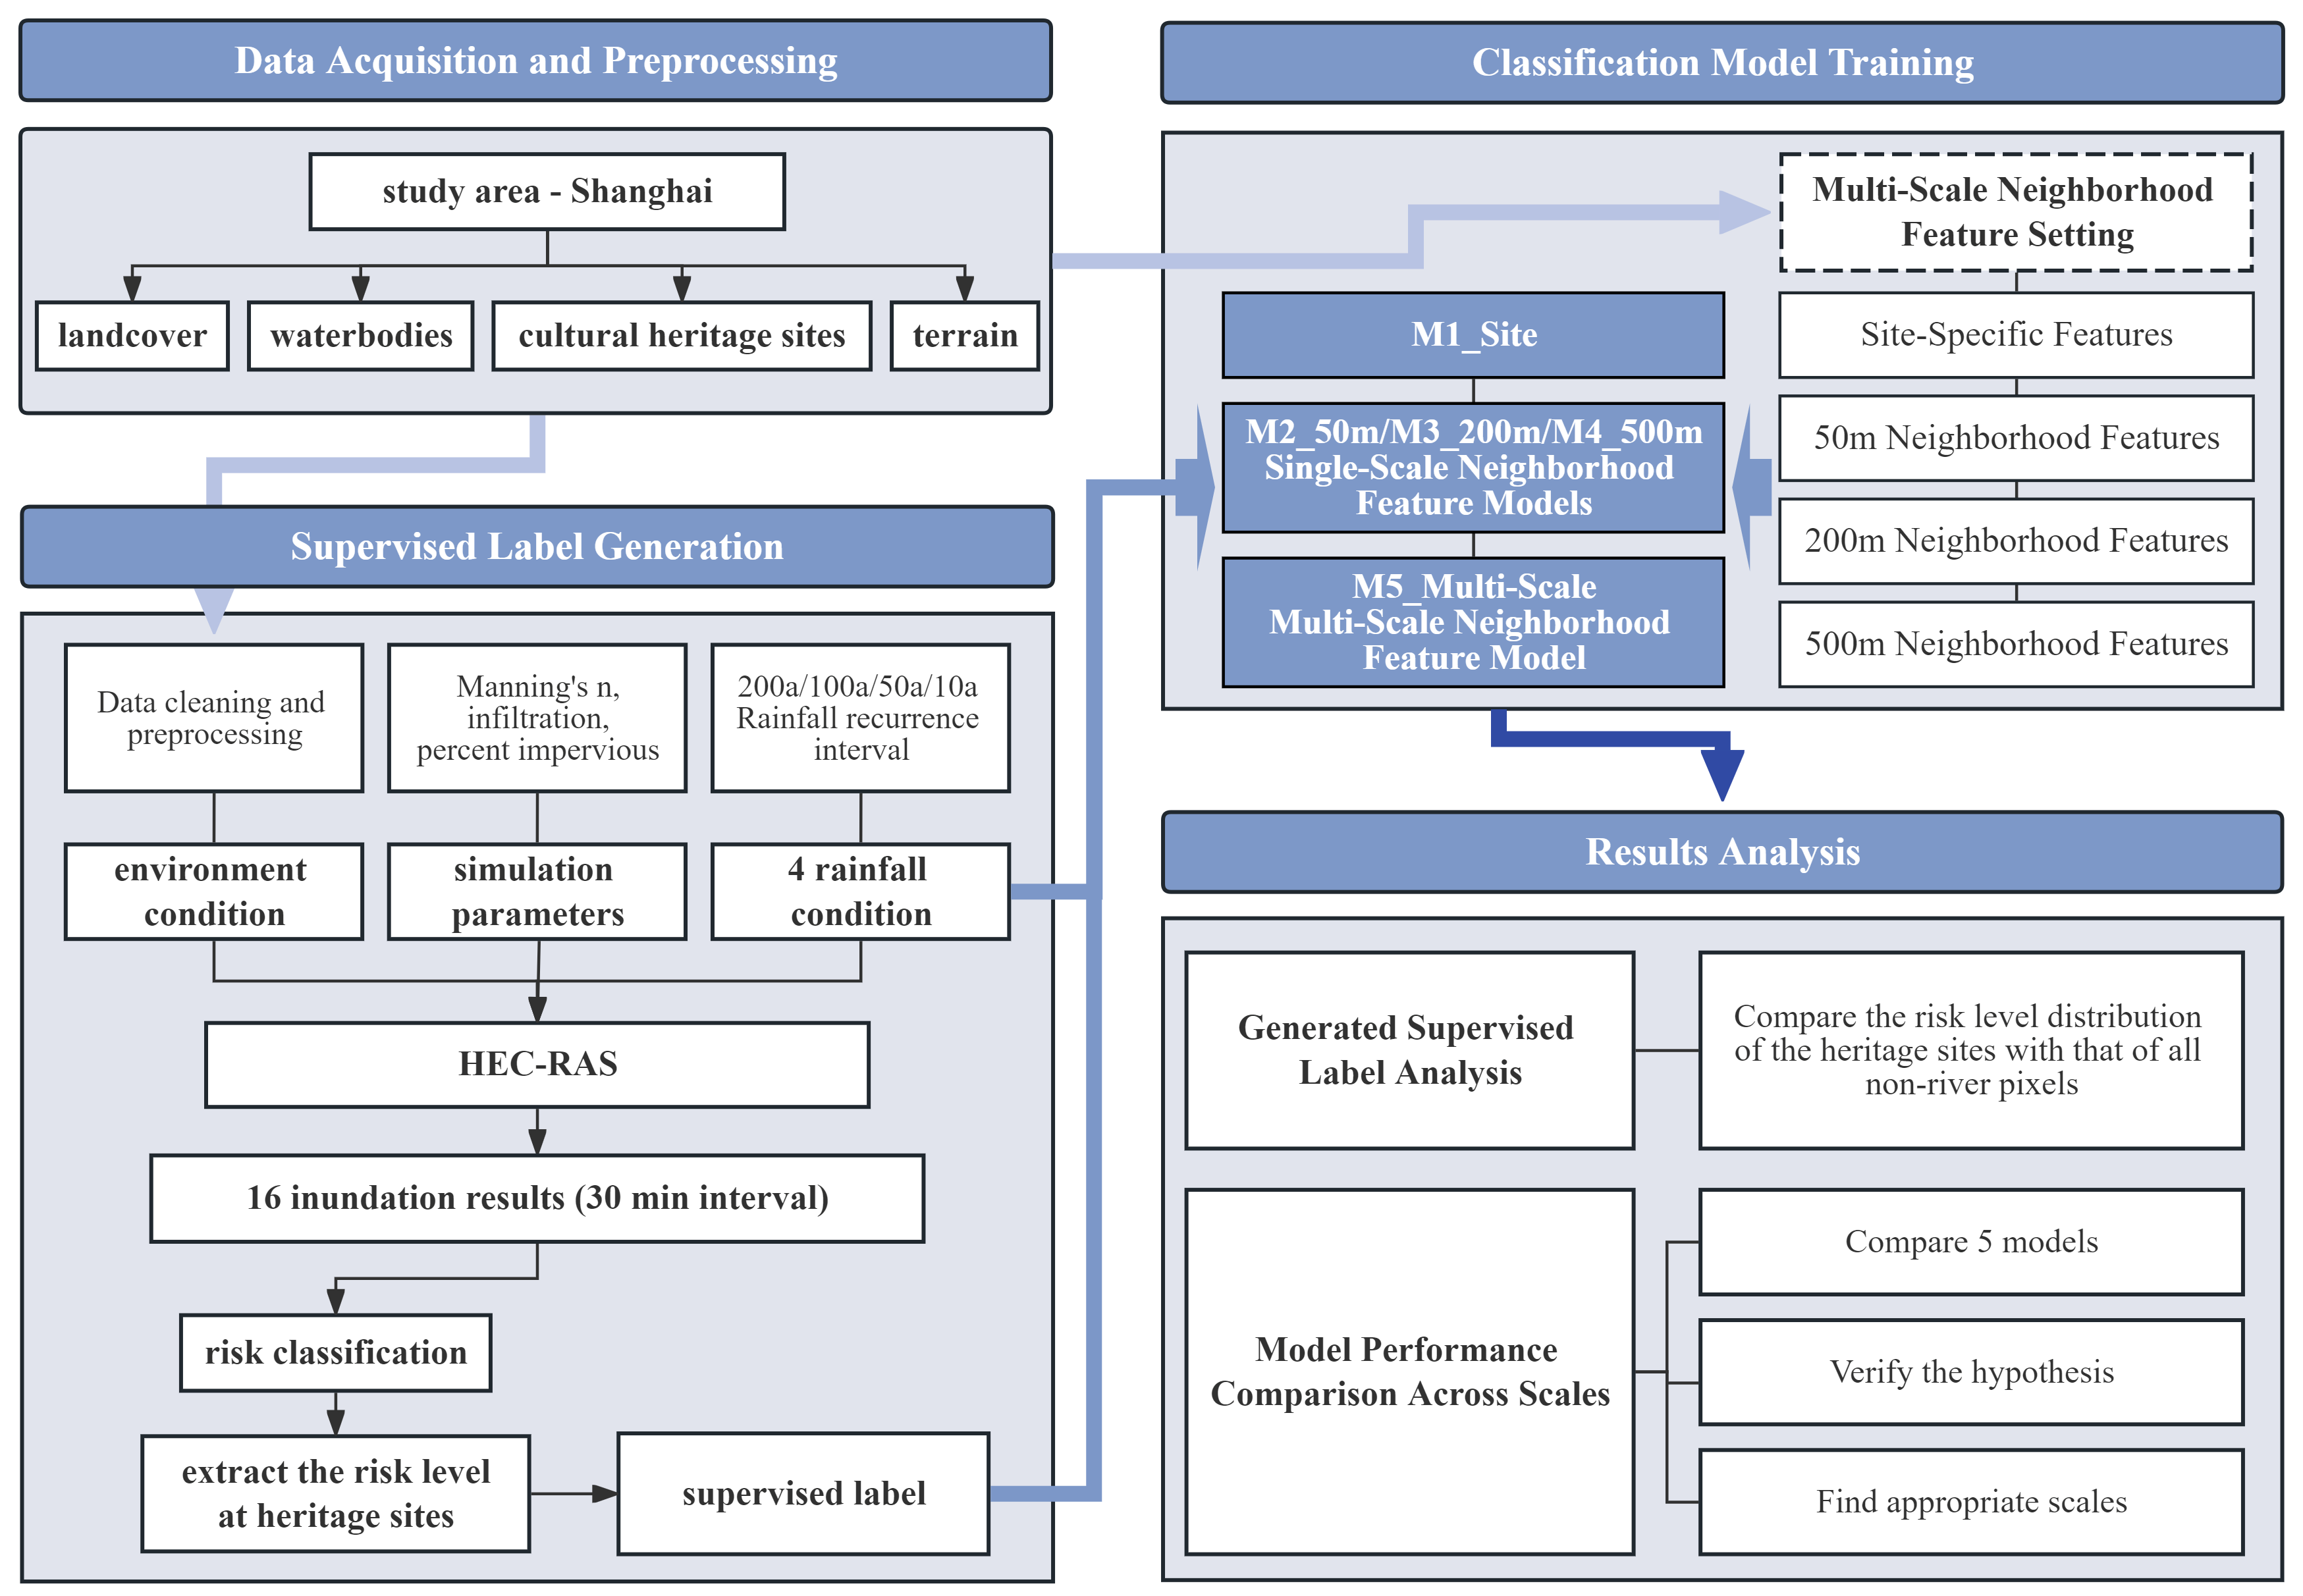
The technical workflow of this study consists of four main components. First, data acquisition and preprocessing are performed. Second, supervised labels are generated via simulating flood events and derived inundation depths under the rainfall conditions within the study area. These inundation depths are then classified into three risk tiers according to predefined thresholds, providing supervised labels for the surrogate model. Third, site-oriented surrogate models based on machine learning are trained with features within different neighborhood scales. Five models are trained using different combinations of site-specific and neighborhood features. Finally, we analyze the distribution patterns of supervised labels and model performance metrics to characterize the resulting patterns and evaluate neighborhood-scale effects. The technical workflow is illustrated in Figure 1.
Figure 1.
Technical workflow.
2.1. Data Preparation
2.1.1. Study Area and Data
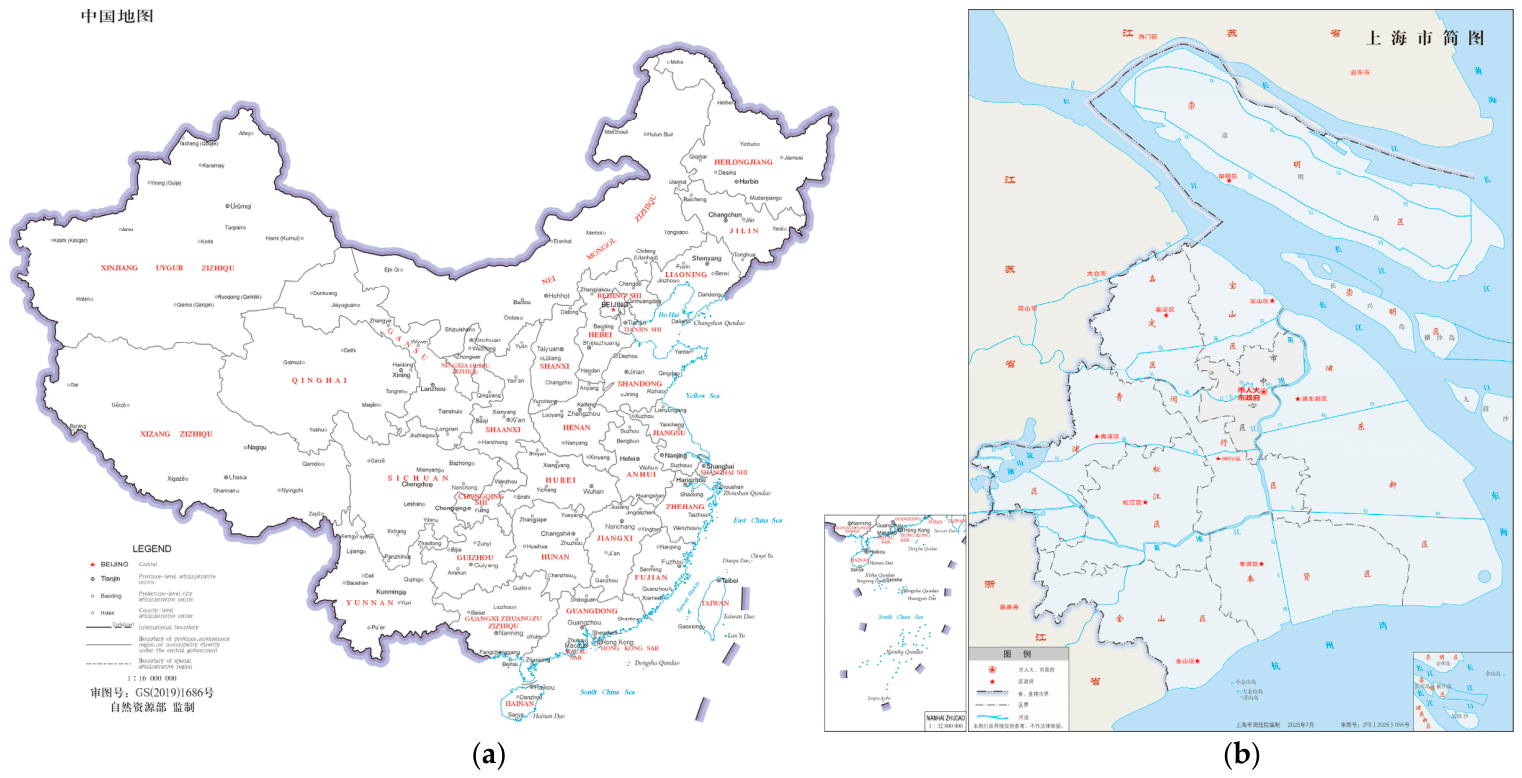
We selected Shanghai Municipality, located in eastern China at the Yangtze River estuary, as the study area (Figure 2). The municipality consists of the mainland area and several estuarine islands. As a typical low-lying plain with a dense river network, the study area is highly exposed to typhoons and the Meiyu (plum rain) season. Heavy rainfall during these periods may frequently trigger urban waterlogging, making it a representative case for flood disaster assessment. In addition, Shanghai has a large number of cultural heritage sites. Therefore, test results in the city could verify the feasibility of the model.
Figure 2.
Location of the study area. (a) Official standard map of China, with Shanghai Municipality located on the eastern coast; (b) official standard map of Shanghai Municipality around the Yangtze River estuary. The Chinese titles “中国地图” and “上海市简图” mean “Map of China” and “Simplified Map of Shanghai Municipality”, respectively. Other Chinese labels are retained from the original official maps and mainly denote administrative divisions, geographical features, and standard map annotations. Spaces used as thousands separators in the map scale values follow the formatting of the original official maps.
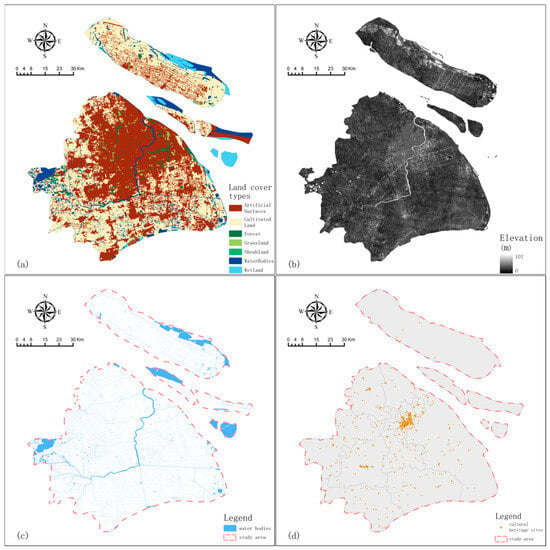
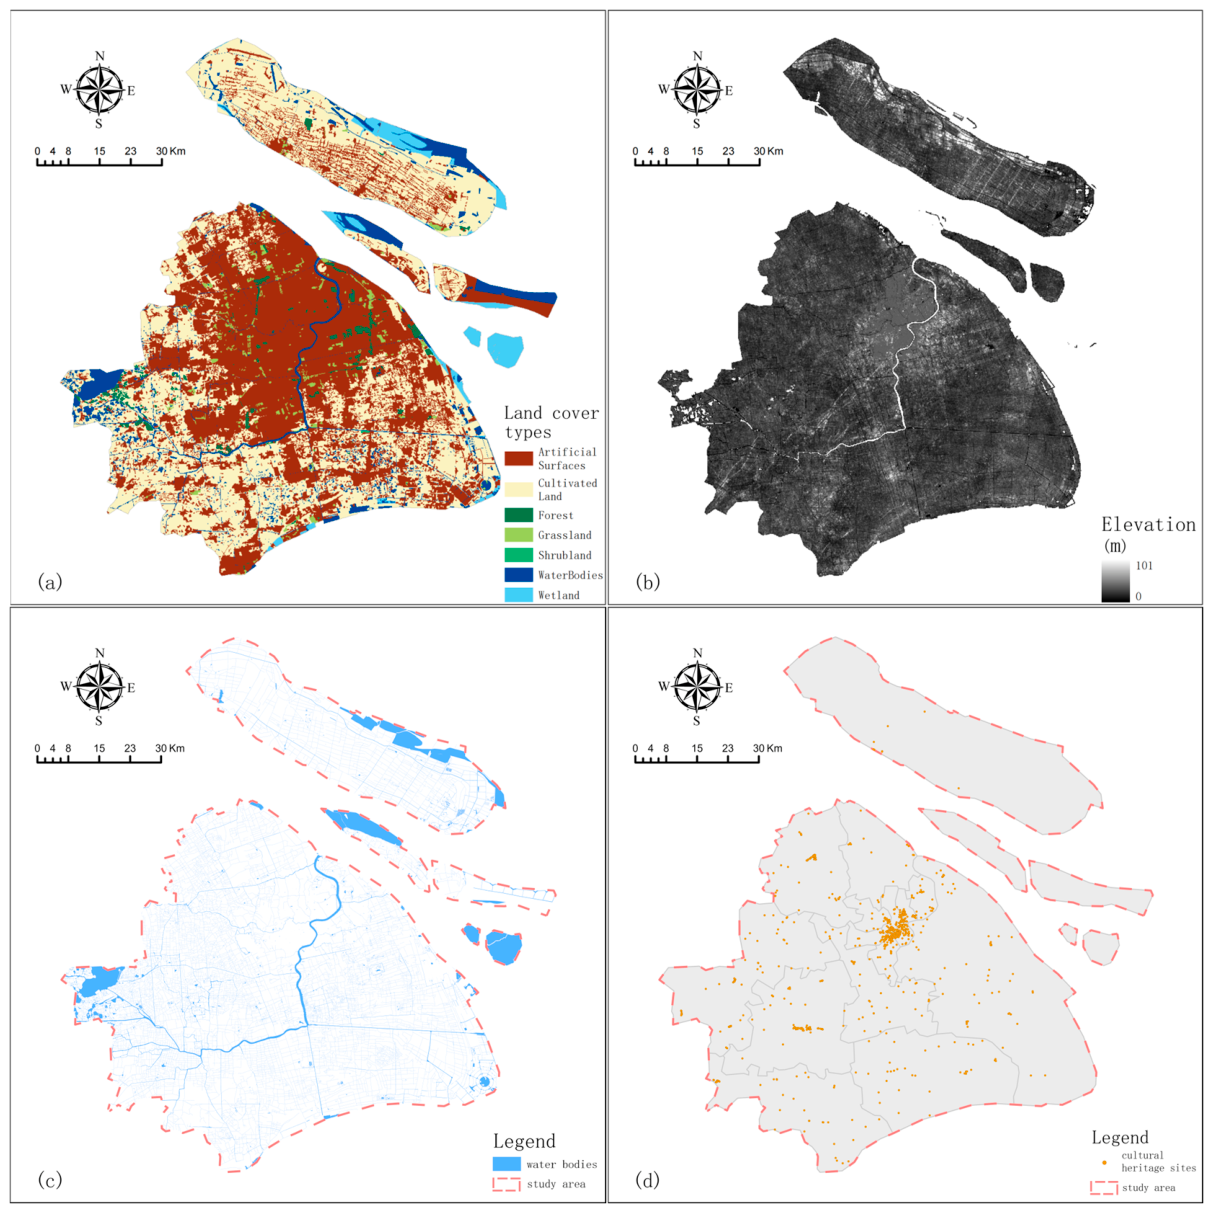
We adopted four primary datasets, including land cover data, topographic elevation, water body distribution, and rainfall intensity data. Their spatial distributions are shown in Figure 3. The spatially separated land areas shown in Figure 3 correspond to the mainland and estuarine islands within Shanghai Municipality rather than independently selected study regions. Land cover data were extracted from the 2020 Global Land Cover Dataset [28] (Figure 3a) via the National Platform for Common GeoSpatial Information Services. Topographic elevation data were obtained from the ASTER GDEM V3 Global Digital Elevation Model Dataset (Figure 3b) [29], with a spatial resolution of approximately 30 m. The DEM was resampled to a 10 m grid using the nearest-neighbor method. This operation provides a consistent 10 m grid for integrating additional water body information.
Figure 3.
(a) Land cover data; (b) topographic elevation data; water body areas are masked and shown in white in the elevation map; (c) water body data; (d) distribution of cultural heritage sites.
In this study, water bodies refer to mapped surface-water features used to represent the local hydrological environment, including the river network and larger surface-water areas. Water body vector data extracted from OpenStreetMap [30] (Figure 3c) were rasterized to the same 10 m grid and then overlaid with the resampled DEM. Elevation values of the grid cells corresponding to water bodies were lowered to explicitly represent the water system in the terrain used for subsequent flood simulation.
The cultural heritage site dataset was obtained from the Shanghai Public Data Open Platform [31], and we derived their location coordinates by geocoding. Sites with geocoding errors were manually corrected according to their actual locations (Figure 3d). In this study, cultural heritage sites refer to officially registered immovable cultural heritage protection units, including Shanghai’s district-level cultural heritage protection units, Shanghai municipal-level cultural heritage protection units, and National Key Cultural Heritage Protection Units. The dataset includes modern historic sites and representative buildings, ancient buildings, archeological sites, and ancient tombs. All 714 registered sites in the dataset were retained for analysis, without prior exclusion based on elevation or assumed flood exposure.
2.1.2. Supervised Label Generation
Since flood events at cultural heritage sites are infrequent and unpredictable, it is difficult to acquire multi-temporal, in situ inundation observations for the same site with consistent spatial accuracy and temporal resolution. This is also one of the key limitations in cultural heritage flood risk research. To address this, we use a continuous, physics-based flood simulation model to generate regional-scale inundation depth maps under multiple rainfall scenarios, which provide the training data for subsequent risk modeling.
We do not interpret these simulations as an accurate reconstruction of real flood events. Instead, we use them as a hydraulically constrained, physically consistent mechanism for generating flood risk. Specifically, the simulation outputs are used to derive site-level inundation descriptors for heritage locations, and inundation thresholds are then applied to assign discrete risk levels as the training labels and prediction targets.
From a heritage conservation planning perspective, the key objective of flood risk assessment is to identify the risk levels of cultural heritage sites under different scenarios and their spatial distribution patterns. To support planning decision-making, this study focuses on which heritage sites are exposed to higher risks and how these risks change across scenarios. Consequently, physically constrained simulation results can provide application-relevant training data for surrogate models, enabling rapid and iterative flood risk assessment for cultural heritage sites across multiple scenarios.
To enable the surrogate model to capture risk patterns under different rainfall conditions, we designed four conditions from light to heavy and conducted corresponding flood simulations. The simulations produced inundation extent and depth within the study area, which served as the basis for subsequent risk classification. Based on Shanghai’s Standard of Rainstorm Intensity Formula and Design Rainstorm Distribution (DB31/T 1043-2017) [32], rainfall intensity was calculated using the Shanghai-specific rainstorm intensity formula, while the temporal distribution of rainfall was generated using the Chicago design storm method specified in the standard. The rainstorm intensity formula is given as follows:
In Equation (1), P denotes the storm recurrence interval (years), t represents rainfall duration (minutes), and q is the storm intensity (L/(s·ha)). Equation (2) converts q into instantaneous rainfall intensity i, expressed in mm/min.
In this study, HEC-RAS was selected as the hydraulic simulation method because it supports two-dimensional hydraulic modeling and provides spatially explicit inundation-depth outputs [33], which are required for deriving site-level risk labels. Its free availability and widespread use also facilitate implementation and reproducibility [34,35]. The hydraulic simulations are used here to generate standardized scenario-specific inundation information. The resulting inundation depths were subsequently converted into site-level risk labels for surrogate-model training.
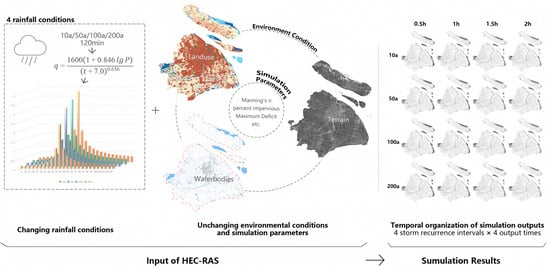
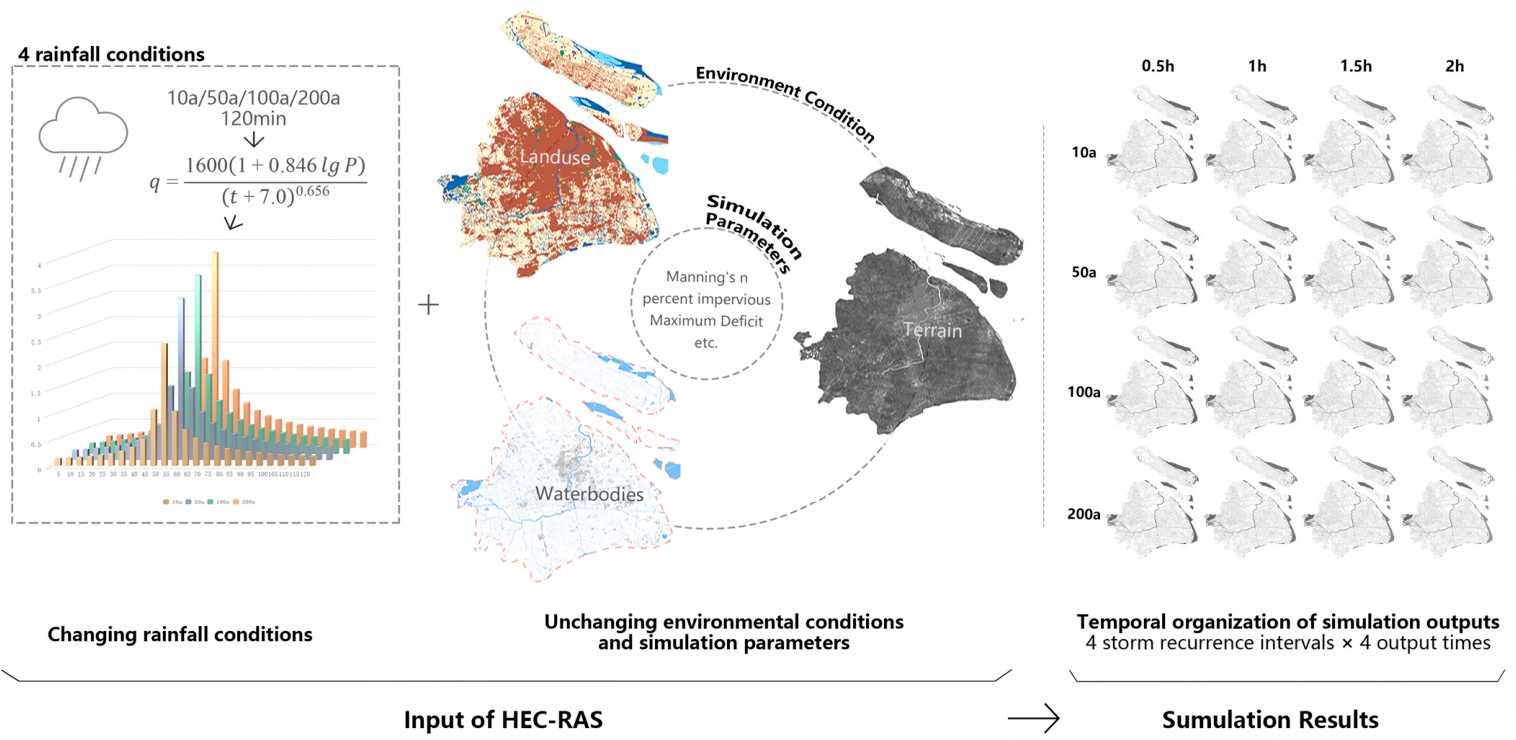
The workflow for flood simulation is illustrated in Figure 4. First, 2 h design hyetographs corresponding to 10-, 50-, 100-, and 200-year storm recurrence intervals were constructed as the precipitation inputs for the flood simulation. Next, topographic, hydrological, and land cover datasets were imported into the model. The Manning roughness coefficient (Manning’s n), infiltration parameters, and percent impervious were spatially assigned to different land cover types using commonly used empirical values to represent hydraulic conditions. Manning’s n is a key hydraulic parameter that characterizes flow resistance across different surface types [36]. The Manning’s n values used in this study are listed in Table 1.
Figure 4.
Schematic diagram of simulation workflow.
Table 1.
Manning’s n values assigned to different land cover types.
To approximately account for the effect of urban drainage, a simplified drainage-capacity term was adopted. The adopted drainage capacity was represented as an additional surface-water loss term in the HEC-RAS rainfall-runoff simulation. This treatment provides a simplified representation of runoff removal by the urban drainage system. Previous flood-modelling research in central Shanghai has represented the urban drainage system using an average drainage capacity corresponding to a 1-year storm recurrence interval, approximately 36 mm/h [37]. This drainage-capacity term was incorporated by adjusting the constant water loss rate at Artificial Surfaces to represent the additional runoff-removal effect associated with developed urban areas.
The flood simulations were performed sequentially for each rainfall scenario. The results have a temporal resolution of 30 min and cover the entire 120 min rainfall event for the 10-, 50-, 100-, and 200-year storm recurrence interval scenarios. Simulated flood depths were extracted at the locations of cultural heritage sites, with risk levels assigned based on inundation depth thresholds defined in Section 1. The resulting risk levels were then used as supervised labels for model training and prediction.
2.2. Machine-Learning Model
2.2.1. Multi-Scale Neighborhood Feature Setting
Risk levels were influenced by rainfall conditions and neighborhood features. To convert the rainfall conditions and three categories of neighborhood features used in HEC-RAS into feature vectors suitable for machine learning modeling, a parametric transformation table was constructed to establish a relationship between physical environmental characteristics and quantitative values. As shown in Table 2, four categories of physical features were parameterized: rainfall conditions directly affect flood generation; topographic features influence flow direction and velocity; hydrological features affect the drainage efficiency for accumulated water; and land cover features exhibit distinct runoff and infiltration patterns that affect flood disaster occurrence.
Table 2.
Parametric transformation table.
For rainfall conditions, the input data for the flood simulation model consists of a 2 h rainfall time series with a temporal resolution of 5 min. To align with the 30 min temporal resolution of the training data, we calculate three parameters to preserve the distinct rainfall features associated with different labels. They are (1) cumulative rainfall since the onset of rainfall up to the current time step; (2) maximum rainfall intensity up to the current time step; and (3) the elapsed rainfall duration.
The site-specific features in the present approach consist of rainfall conditions, elevation at the site, and distance to the nearest water body. The multi-scale neighborhood features refer to the environmental characteristics extracted within buffer zones of varying radii around each site, including topographic, hydrological, and land cover features.
It remains unclear whether multi-scale neighborhood features affect risk assessment and how their influence varies across different neighborhood scales. To investigate the scale effects within the designed surrogate models, three scales (small, medium, and large) were defined during feature extraction. A small-scale neighborhood was included because point-level attributes alone do not represent the immediate environmental context surrounding each site. Accordingly, the 50 m buffer was defined to capture highly localized environmental characteristics around the heritage site.
In contrast, the 500 m large-scale neighborhood represents broader environmental characteristics extending beyond single parcels and blocks, demonstrating potential for capturing watershed-level features. The 200 m medium-scale neighborhood was introduced to align with urban planning units, such as blocks and parcels. This scale potentially enables the identification of representative local spatial patterns while compensating for the limited spatial coverage at the 50 m scale. This three-scale framework enables a comprehensive comparison of the contribution of neighborhood features across different scales and facilitates analysis of how neighborhood features influence surrogate-model performance.
Moreover, the three types of neighborhood features are designed as follows: First, topographic features characterize local terrain conditions that influence surface runoff pathways and water accumulation. Elevation values obtained solely from raster sampling at cultural heritage sites are insufficient to capture their environmental characteristics. Therefore, multi-scale neighborhood sampling is conducted around heritage sites to collect elevation data within 50 m/200 m/500 m scales. Calculations of mean elevation, elevation difference, and standard deviation within these neighborhoods reflect the neighborhood’s overall elevation, elevation range (max–min), and degree of terrain undulation. Theoretically, the 50 m neighborhood most directly reflects the local topographic context surrounding the site, whereas data within the 200 m and 500 m neighborhoods may indicate major surface-flow pathways, potentially influencing flood risk predictions indirectly. Second, river network density is also extracted based on multi-scale neighborhoods surrounding each heritage site to quantify river network density. The distance from the site to the nearest water body is also calculated. Finally, surface features affect flooding mainly because different land cover compositions within a given area influence runoff accumulation and infiltration. Therefore, the area proportions of each land cover type were calculated at each spatial scale to represent land cover features.
2.2.2. Model Training
Machine learning methods demonstrate the ability to capture nonlinear relationships, supporting risk prediction for discrete objects by capturing spatial constraint variations across multiple scales. The objective of this study is not to compare machine learning algorithms but to evaluate the feasibility of site-oriented surrogate modeling under different neighborhood feature configurations. Thus, XGBoost was selected because it has consistently demonstrated strong performance on structured tabular datasets with limited sample sizes and heterogeneous variables in previous studies. Hyperparameters were tuned using randomized search with five-fold GroupKFold cross-validation. Thirty parameter combinations were sampled from the predefined search space, and macro-averaged F1 was used as the optimization criterion to account for class imbalance. Spatial groups defined using the 500 m distance threshold were used as the grouping variable to avoid overlap of spatially proximate sites between training and validation folds. To reduce spatial leakage between model training and independent evaluation, the spatial groups were first partitioned into training and test sets, with each group assigned exclusively to one subset. Hyperparameter tuning was conducted on the training set using five-fold GroupKFold cross-validation based on the same spatial grouping scheme. Class-balanced sample weights were applied during model fitting. The discrete search space and the final hyperparameters selected for each model are reported in Table 3.
Table 3.
The discrete search space and the final hyperparameters selected for each model.
2.2.3. Performance Evaluation Strategy
The classification models were evaluated using four commonly used performance indicators: Test F1, Macro-averaged Test F1, GroupKFold F1, and Test Accuracy. Test F1, calculated as the weighted F1-score, measures the overall classification performance on the independent test datasets. Macro-averaged Test F1 evaluates predictive performance across different risk levels and is particularly important for small-sample classes in this study. GroupKFold F1 is reported as the mean ± standard deviation of F1 scores obtained from GroupKFold cross-validation across spatially partitioned folds. The mean value indicates the overall predictive performance, and the standard deviation characterizes variability in model performance across spatial groups and is used here as an indicator of spatial generalization stability. Test Accuracy is included as a supplementary metric due to potential bias from class imbalance. This evaluation protocol provides a consistent way to assess model performance under different feature configurations.
Furthermore, by designing and comparing models utilizing different scales of neighborhood features, we verified whether the models could effectively capture environmental characteristics and analyzed the neighborhood scale effects in the surrogate model. The study included three types of models: (1) M1_Site, trained exclusively on site-specific features; (2) Models (M2_50m, M3_200m, and M4_500m), trained on both site-specific features and single-scale neighborhood features; and (3) M5_Multi-Scale, trained with site-specific features and neighborhood features of all the scales. We list the five models as follows:
- •
- M1_Site: Site-Specific Features only.
- •
- M2_50m: Site-Specific Features and 50m Neighborhood Features.
- •
- M3_200m: Site-Specific Features and 200m Neighborhood Features.
- •
- M4_500m: Site-Specific Features and 500m Neighborhood Features.
- •
- M5_Multi-Scale: Site-Specific Features and Multi-Scale Neighborhood Features.
3. Results
3.1. Supervised Label Analysis
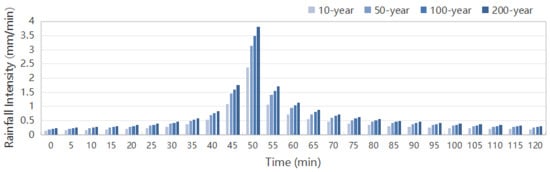
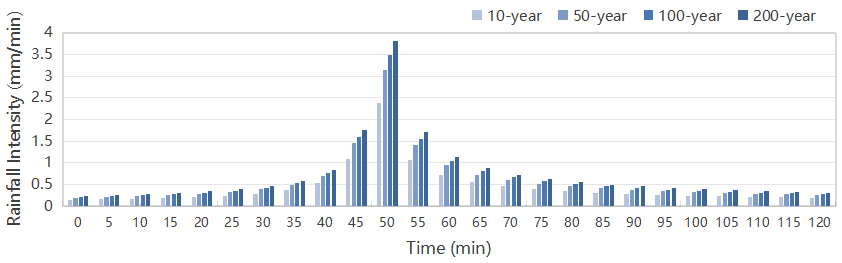
The risk level assessment of 714 cultural heritage sites in the study area was conducted based on the method described in Section 2.1.2. Rainfall process data under 10-year, 50-year, 100-year, and 200-year storm recurrence intervals are presented in Figure 5.
Figure 5.
Design rainfall hyetographs for the 10-, 50-, 100-, and 200-year storm recurrence intervals.
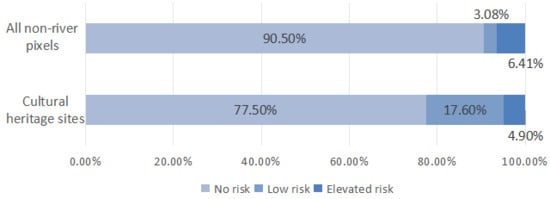
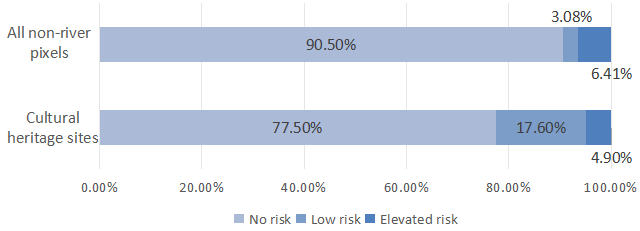
The flood risk assessment was conducted using HEC-RAS, with results calculated every 30 min. A total of 11,424 valid records were extracted based on the locations of cultural heritage sites. Statistical analysis (Figure 6) revealed that 2011 records were classified as low risk (17.6%), and 559 as elevated risk (4.9%). The risk ratio between no risk, low risk, and elevated risk levels was approximately 16:4:1, showing that the majority of records were at no risk, whereas elevated risk level accounted for a smaller yet non-negligible portion.
Figure 6.
Risk level distribution of non-river pixels in the study area and cultural heritage sites.
To examine whether the flood risk distribution at cultural heritage sites differs from the overall spatial pattern of the study area, the same depth-based risk classification was applied to all non-river raster pixels. Pixels corresponding to river channels were excluded because their persistent water depths would otherwise inflate the proportion of elevated-risk pixels.
Figure 6 shows that the risk level distribution at cultural heritage sites differs substantially from that of the study area as a whole. Among the heritage site records, 17.6% were classified as low risk and 4.9% as elevated risk, whereas the corresponding proportions for all non-river pixels were 3.08% and 6.41%. Heritage sites showed a considerably higher proportion of shallow inundation, but a lower proportion of elevated-risk inundation than the study area as a whole. This difference indicates that the flood risk distribution at heritage sites is not simply proportional to the overall regional distribution and supports evaluating these discrete sites as a distinct set of spatial objects.
3.2. Model Performance Comparison at All Neighborhood Scales
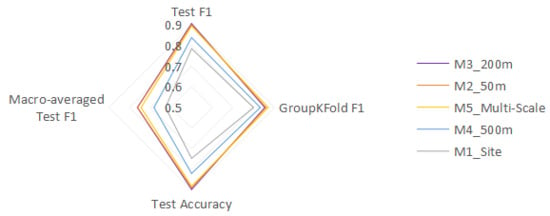
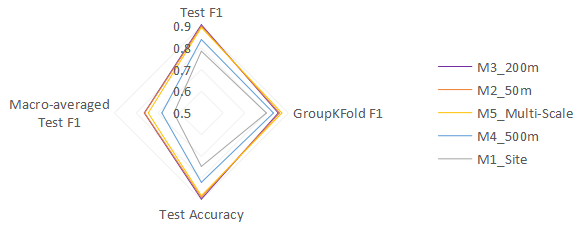
Model training results show performance variations among different models (see Table 4 & Figure 7). Overall, the M2_50m, M3_200m, and M5_Multi-Scale models achieve consistently high performance metrics. Their Test F1, GroupKFold F1, and Test Accuracy are all above 0.85. The Macro-averaged Test F1 is relatively low, but it is acceptable given the imbalanced sample distribution. These results indicate that the site-oriented surrogate modeling approach is feasible. The models can capture relationships between rainfall conditions, local environmental characteristics, and simulated flood risk levels, avoiding the need to perform full-domain flood simulations for point-level risk assessment.
Table 4.
Comparison of model performance.
Figure 7.
Radar chart of the performance of five models.
Incorporating neighborhood features enhances predictive capability. For instance, the M3_200m model achieves approximately 0.90 Test Accuracy, whereas the M1_Site model achieves 0.75, suggesting that neighborhood features drive the model’s discriminative ability. Comparative analysis of the models across different scales reveals that the proposed models are sensitive to the neighborhood scales.
The results of each model are presented in the following subsections. The site-level flood risk results for all 714 cultural heritage sites under the investigated design rainfall scenarios are provided in Supplementary Table S1.
3.2.1. Site-Specific Feature Model
The baseline model M1_Site was trained with only five features, i.e., total rainfall, peak (maximum) rainfall intensity, rainfall duration, elevation at the heritage site, and distance from the heritage site to the nearest water body. Compared to any model incorporating neighborhood features, it showed the lowest performance across all metrics: Test F1 (0.7843), Test Accuracy (0.7457), and Macro-averaged Test F1 (0.6264), indicating that M1_Site has relatively limited predictive capability.
These results indicate that the site-specific feature set alone provides lower predictive performance than configurations incorporating neighbourhood information. Introducing neighborhood features at the three scales improves all the performance metrics (see Table 4), which demonstrates the value of these features for flood risk prediction.
3.2.2. Single-Scale Neighborhood Feature Models
The three Single-Scale Neighborhood Feature Models contain between 16 and 18 features, as some land cover types are absent within the 200 m spatial range of heritage sites. However, this does not affect comparisons among the models, since each model characterizes the structural composition of land cover types within its neighborhood range. The M2_50m model and M3_200m model demonstrate strong predictive performance, whereas the M4_500m model involves the lowest metrics among them. Among the three Single-Scale Neighborhood Feature Models, predictive performance did not improve monotonically with increasing neighbourhood scale. Thus, an appropriate neighborhood scale is important for capturing localized flood risk patterns.
The test results suggest that 50 m and 200 m are suitable scales for assessing flood risk of heritage sites in the study area. We can conclude that the neighborhood scale of 50 m/200 m effectively captures the typical environmental characteristics influencing flood risk levels. Most heritage sites in Shanghai are located within urban built-up areas, where the 50 m neighborhood collects nearby environmental information, and the 200 m neighborhood aligns with parcel- and block-level spatial units, providing strong interpretative value for urban planning.
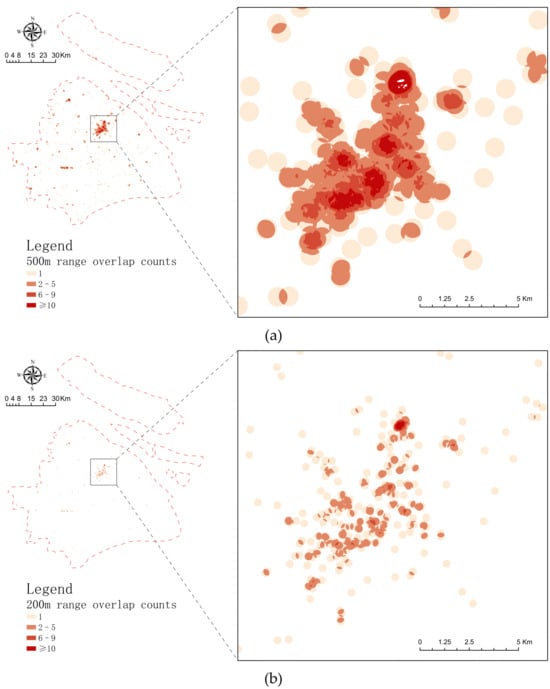
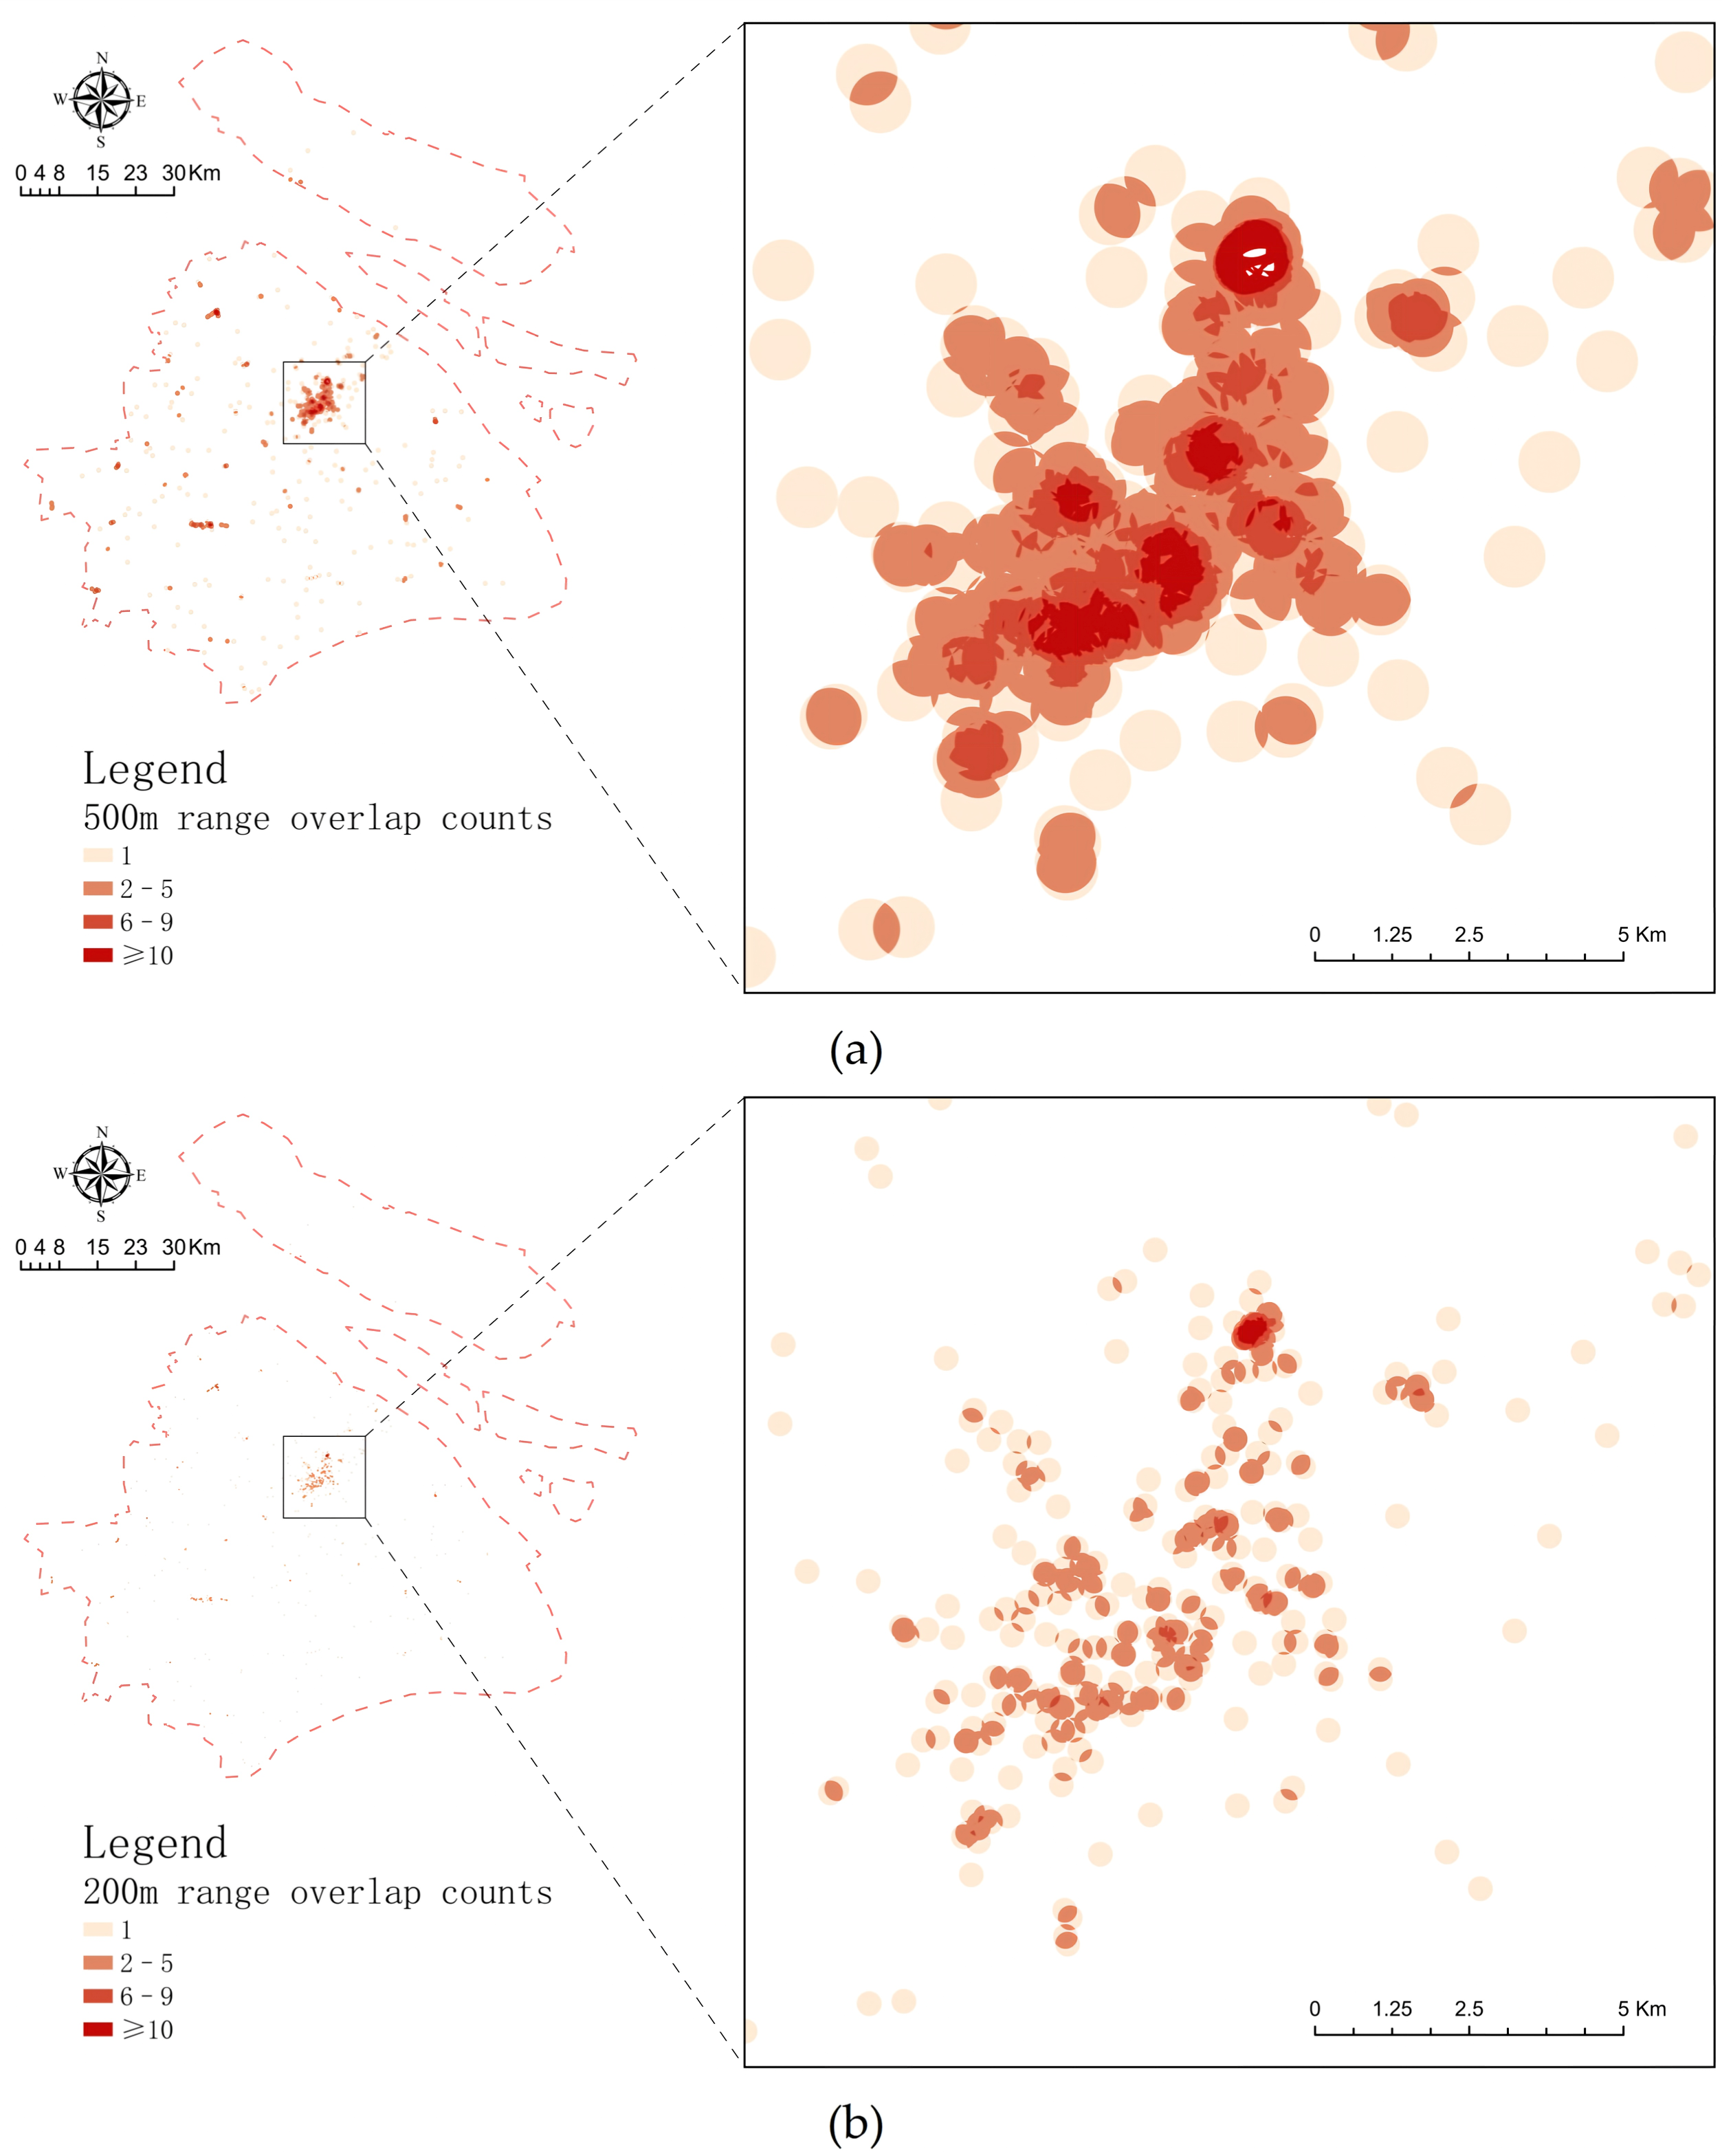
In contrast, the M4_500m model shows inferior performance. Its Macro-averaged Test F1 is lower than 0.7, indicating limited predictive ability for small-sample classes. Meanwhile, its Test F1, GroupKFold F1, and Test Accuracy values are all lower, by around 0.06, compared with the M2_50m and M3_200m models, along with larger GroupKFold standard deviations. The M4_500m model showed lower predictive performance and greater variability across spatial groups than the 50 m and 200 m single-scale models. This result indicates that, within the present dataset and modelling framework, using a 500 m neighbourhood alone was less effective for site-level flood risk assessment. Figure 8 further shows that 500 m neighbourhoods exhibit substantially greater spatial overlap among nearby heritage sites than 200 m neighbourhoods. These observations suggest that the 500 m configuration represents a broader and more spatially overlapping environmental context. The present analysis does not isolate the specific mechanism responsible for this performance difference. Possible factors include differences in the relevance, redundancy, and spatial overlap of environmental features across neighbourhood scales. Further analysis would be required to distinguish the effects of these factors.
Figure 8.
Spatial overlap of the heritage sites’ 200 m and 500 m ranges. (a) Overlap among 500 m ranges. Many overlapping areas relate to more than two sites; (b) overlap among 200 m ranges. Overlapping areas are significantly reduced.
3.2.3. Multi-Scale Neighborhood Feature Model
The M5_Multi-Scale model also shows strong predictive performance and performs particularly well in GroupKFold validation. Its GroupKFold mean F1 (0.8704) ranks the highest among all the models, indicating better overall predictive performance. The standard deviation is also relatively small, reflecting the model is consistent across spatial groups.
Compared with the M2_50m and M3_200m models, these models show similar metrics. However, the M5_Multi-Scale model employs 40 features during training, while the M2_50m and M3_200m models utilize only 16 features. Despite M5_Multi-Scale’s feature set being 2.5 times larger, its performance does not show substantial improvement, suggesting that the fusion of multi-scale information provides limited additional predictive benefit. Although M5 shows slightly better performance in GroupKFold validation, the substantially increased feature dimensions may incur higher computational costs.
3.2.4. Cross-Scale Consistency of Site–Period Risk Classifications
To further evaluate whether risk classifications for the same heritage sites were consistent across M2_50m, M3_200m, M4_500m, and M5_Multi-Scale, we conducted a site–period-level consistency analysis on the held-out test set. For each site and return period, the maximum predicted risk class across the four temporal samples was used as the site–period risk class. This aggregation resulted in 704 site–period units from 176 test sites and four return periods.
Across the four neighbourhood-scale models, 574 of the 704 site–period units received identical risk classifications, corresponding to an overall agreement of 81.53%. The remaining 130 site–period units showed scale-dependent inconsistencies. These results indicate that risk classifications were generally stable across neighbourhood scales for most site–period units, while a subset remained sensitive to the neighbourhood-scale definition. The M2_50m–M3_200m comparison was further examined because these two models achieved better performance among the single-scale neighbourhood models (Table 5).
Table 5.
Site–period-level transition matrix between M2_50m and M3_200m predictions.
For the M2_50m–M3_200m comparison, 622 of the 704 site–period units had identical classifications, corresponding to an agreement of 88.35%. The consistent cases included 470 no-risk, 116 low-risk, and 36 elevated-risk units. Among the 64 site–period units classified as elevated risk by M2_50m, 36 remained elevated under M3_200m, none shifted to low risk, and 28 shifted to no risk. This indicates that elevated-risk classifications were more sensitive to the change from 50 m to 200 m neighbourhood features.
4. Discussion
4.1. Environmental Constraints Influence the Distribution of Flood Risk Levels
In conventional flood risk studies, inundation field data across the entire study area are used as the primary dataset to perform global-scale modeling. In contrast, this research adopts site-oriented data for cultural heritage sites to better represent discrete spatial objects, and to extract spatial relationships between environmental characteristics and flood risk. Test results reveal substantial differences between the flood risk distribution of cultural heritage sites and that of non-river pixels in the study area (see Figure 6). Specifically, we found heritage sites exhibit a higher proportion of low-risk records compared to non-river pixels, whereas elevated-risk records are less frequent. It supports evaluating these discrete sites as a distinct set of spatial objects.
Except for cultural heritage sites, the proposed approach can be further extended to other types of spatially discrete objects. Different types of points of interest (POIs) may also be subject to specific environmental constraints. Therefore, future research could focus on developing POI-oriented surrogate models, which is an alternative approach different from the global prediction method. This approach would allow surrogate models to capture localized environmental constraints more effectively while substantially reducing computational costs.
4.2. Appropriate Neighborhood Scale Is Important for Site-Oriented Flood Risk Assessment
Comparative analysis among different neighborhood scales shows that model performance is sensitive to the spatial range considered. Test results confirm that multi-scale neighborhoods do not necessarily produce substantial performance improvements, and larger neighborhood scales do not necessarily lead to better performance. Within the study area, the 50 m and 200 m neighborhood scales are appropriate. However, these scales should not be regarded as universally applicable, as the appropriate neighborhood scale may vary with different areas and conditions.
The superior performance of the M2_50m and M3_200m models for the cultural heritage sites in Shanghai may be associated with several factors. First, most heritage sites are located in highly urbanized regions. The 50 m and 200 m spatial ranges align well within the scale of neighborhoods and parcels. Second, relatively flat terrain in Shanghai results in limited topographic variation, which makes elevations in broader spatial ranges less useful for prediction. Finally, the high density of heritage sites in some urban areas indicates that a larger neighborhood could generate substantial overlap between adjacent sites, which may be associated with the observed scale-dependent performance.
The appropriate scale may vary considerably with the specific area of cultural heritage sites. For example, many cultural heritage sites in Shanxi Province are located in non-urbanized areas. There is limited built-up land, sparse hydrological networks, and more pronounced mountainous terrain. Under such conditions, the neighborhood scale corresponding to urban blocks is no longer appropriate. Larger-scale neighborhood features may better capture local topographic variation, and thereby be more suitable for flood risk assessment. For instance, WANG et al. [38] employed a spatial resolution of 1 km in their flood risk assessment for immovable cultural heritage sites in Shanxi Province. In contrast, the present study found that the 50 m and 200 m neighborhood feature configurations generally achieved better predictive performance than the 500 m single-scale configuration. This difference further suggests that neighborhood scale should not be regarded as universally transferable across study areas.
The cross-scale consistency analysis provides a supplementary perspective on the effect of neighbourhood scale. In the held-out test set, 574 of the 704 site–period units received the same risk class across M2_50m, M3_200m, M4_500m, and M5_Multi-Scale, while 130 units showed different classifications across scales. This indicates that differences in neighbourhood-scale feature configurations are reflected not only in overall model performance but also in the consistency of predicted risk classes for some individual site–period units.
4.3. Benefits of Flood Risk Assessment on Discrete Spatial Objects for Planning Practice
Previous location-specific surrogate modelling studies have indicated that focusing model development on predefined locations of interest can improve the relevance of predictions for targeted applications. The present study extends this principle to cultural heritage flood risk assessment by treating individual heritage sites as explicit assessment units and organizing surrounding environmental predictors at multiple neighbourhood scales. This approach addresses the practical needs of urban planning and cultural heritage conservation, in which heritage sites serve as the fundamental units of decision-making. The developed site-oriented flood risk assessment model supports rapid site-level assessment using site-specific and neighbourhood environmental predictors. It provides an efficient predictive tool for multi-scenario flood risk assessment in heritage conservation planning.
According to test results, the surrogate model maintains stable predictive performance across spatial groups within the study area. By analyzing environmental characteristics, the model can be used to rapidly identify spatial patterns and potential trends in heritage sites’ flood risk, so it can support decision-making for urban planning. This enables urban planners to better understand the spatial distribution of flood risk in terms of environmental characteristics and to implement targeted mitigation strategies.
4.4. Limitations and Future Directions
Several limitations should be considered when interpreting the results of this study. First, the hydraulic simulations in this study were developed for predefined design rainfall scenarios and were not calibrated against specific historical flood events. The generated labels should be interpreted as scenario-specific flood risk indicators derived from physics-based hydraulic simulations rather than observations or validated reconstructions of actual flood events. This aligns with the objective of developing and evaluating a site-oriented surrogate modelling approach for identifying potentially high-risk heritage sites and supporting targeted risk management and heritage conservation planning. Future research could reconstruct representative historical flood events using observed rainfall inputs and validate the corresponding hydraulic simulations against observed inundation records or detailed event-based monitoring data, thereby improving the applicability of this approach for practical flood risk assessment.
Second, the applicability of the surrogate model is constrained by the range and form of the training data. The current model was trained using labels derived from 10-, 50-, 100-, and 200-year design storm scenarios. Predictions for unseen rainfall scenarios, such as a 300-year design storm, would therefore require extrapolation beyond the training domain. Moreover, because continuous inundation depths were converted into discrete risk classes for classification, the model is intended for site-level risk screening rather than precise inundation-depth prediction. The simplified drainage-capacity representation also does not capture spatial variations in sewer-network capacity, and the sensitivity of simulated inundation to the adopted drainage-capacity value was not explicitly evaluated. Accordingly, the present model should not be used to diagnose local deficiencies in the urban drainage network. Regarding model uncertainty, the variability reported from GroupKFold validation characterizes model-level performance across spatial partitions but does not estimate calibrated uncertainty for individual site predictions. Future work could incorporate probability calibration or ensemble-based uncertainty estimation to support confidence-aware risk screening.
Third, the current risk categories are primarily depth-based and should therefore be interpreted as relative flood-exposure levels rather than comprehensive estimates of heritage damage. Inundation duration is not explicitly incorporated into the labels, although prolonged shallow flooding may contribute to cumulative deterioration of water-sensitive heritage materials. Building-specific vulnerability characteristics, such as structural type, construction material, and conservation condition, are also not included in the present framework. Future extensions could integrate inundation depth and duration with heritage-specific vulnerability attributes to support more detailed damage-oriented assessments.
The site-oriented structure of the approach provides a basis for developing a scenario-based flood risk atlas or database in which risk information for individual heritage sites can be updated and compared across different scenarios. Future applications could incorporate higher-resolution terrain data and spatially explicit drainage characteristics to improve the representation of relevant conditions in the hydraulic simulations. Future studies should also evaluate the transferability of the proposed approach across cities with different hydrological, topographic, and urban conditions. These extensions could further strengthen the applicability of the approach to practical heritage flood-risk management.
5. Conclusions
As flood inundation patterns are closely related to the environmental characteristics of cultural heritage sites, the proposed surrogate model integrates site-specific characteristics with multi-scale neighborhood features to enable rapid prediction of flood risk levels. This study shifts flood risk assessment from conventional analyses based on rasterized continuous flood fields to a site-oriented modeling approach. Experimental results in the study area demonstrate the feasibility of the surrogate models without comprehensive approximation of the whole inundation depth field. According to the results, the M2_50m, M3_200m, and M5_Multi-Scale models achieve more than 0.88 Test Accuracy, and their Test F1 and GroupKFold F1 are all above 0.85, showing solid overall performance. These surrogate models capture the environmental constraints of discrete heritage sites, enabling more targeted assessment of flood risk levels. This approach is well-suited to rapid risk assessment demands in cultural heritage conservation. This approach may also be extended to other types of spatial objects.
In the study area, the comparison among models revealed that neighborhood features improve model performance. The 50 m and 200 m neighbourhood configurations performed better than the 500 m configuration, indicating that the selection of neighborhood scale is important for site-oriented flood-risk assessment.
For practical application in Shanghai, the proposed approach can be used as a first-stage screening tool to rapidly compare site-level flood risk under predefined design rainfall scenarios and to identify cultural heritage sites that warrant more detailed hydraulic analysis, field investigation, or heritage-specific vulnerability assessment. For application in other cities, the surrogate model should be retrained using locally appropriate hydraulic simulations and environmental data, with neighbourhood scales re-evaluated according to local topographic, hydrological, and urban conditions.
Supplementary Materials
The following supporting information can be downloaded at: https://www.mdpi.com/article/10.3390/ijgi15090424/s1, Table S1: Site-level assessment results for the 714 cultural heritage sites.
Author Contributions
Conceptualization, Liu Liu; methodology, Liu Liu, Xiang Chen; software, Xiang Chen; validation, Xiang Chen, Liu Liu; formal analysis, Liu Liu, Xiang Chen; investigation, Xiang Chen, Liu Liu; resources, Liu Liu, Yao Shen; data curation, Xiang Chen; writing—original draft preparation, Xiang Chen, Liu Liu; writing—review and editing, Liu Liu, Xiang Chen, Yao Shen; visualization, Xiang Chen; supervision, Liu Liu; project administration, Liu Liu, Yao Shen; funding acquisition, Liu Liu, Yao Shen. All authors have read and agreed to the published version of the manuscript.
Funding
This research was supported by National Key Research and Development Plan (Grant No. 2023YFC3803903), the National Natural Science Foundation of China (Grant Number: 42001335), and the National Natural Science Foundation of China (General Program) [grant number 52278074].
Data Availability Statement
The data that support the findings of this study are available on request from the corresponding author.
Conflicts of Interest
The authors declare no conflicts of interest.
References
- Seneviratne, S.I.; Zhang, X.; Adnan, M.; Badi, W.; Dereczynski, C.; Di Luca, A.; Ghosh, S.; Iskandar, I.; Kossin, J.; Lewis, S.; et al. 2021: Weather and Climate Extreme Events in a Changing Climate. In Climate Change 2021: The Physical Science Basis. Contribution of Working Group I to the Sixth Assessment Report of the Intergovernmental Panel on Climate Change; Masson-Delmotte, V., Zhai, P., Pirani, A., Connors, S.L., Péan, C., Berger, S., Caud, N., Chen, Y., Goldfarb, L., Gomis, M.I., et al., Eds.; Cambridge University Press: Cambridge, UK; New York, NY, USA; pp. 1513–1766. [CrossRef] [Scilit]
- Sesana, E.; Gagnon, A.S.; Ciantelli, C.; Cassar, J.; Hughes, J.J. Climate Change Impacts on Cultural Heritage: A Literature Review. WIREs Clim. Chang. 2021, 12, e710. [Google Scholar] [CrossRef] [Scilit]
- Zhai, G. Planning perspectives on urban resilience to stormwater hazards in the context of climate change: Key concepts, basic ideas and generic frameworks. Urban Plan. Forum 2024, 1, 29–37. [Google Scholar] [CrossRef]
- USACE Hydrologic Engineering Center. Introduction to HEC-RAS. Available online: https://www.hec.usace.army.mil/confluence/rasdocs/rasum/latest/introduction-to-hec-ras (accessed on 2 April 2026).
- Van Dau, Q.; Wang, X.; Aziz, F.; Ali Nawaz, R.; Pang, T.; Qasim Mahmood, M.; Fortin, M. Pluvial Flood Modeling for Coastal Areas under Future Climate Change—A Case Study for Prince Edward Island, Canada. J. Hydrol. 2024, 641, 131769. [Google Scholar] [CrossRef] [Scilit]
- Madhuri, R.; Sarath Raja, Y.S.L.; Srinivasa Raju, K.; Punith, B.S.; Manoj, K. Urban flood risk analysis of buildings using HEC-RAS 2D in climate change framework. H2Open J. 2021, 4, 262–275. [Google Scholar] [CrossRef] [Scilit]
- Li, Y.; Cheng, L.; Cheng, X.; Zhou, L.; Zhang, L.; Liu, P. Analysis of the flood inundation of towns based on HEC-RAS model. Eng. J. Wuhan Univ. 2023, 56, 1536–1545. [Google Scholar] [CrossRef]
- Tao, H.; Fang, Z.; Fan, N.; Shang, K. Optimization study of flash flood risk map based on HEC-RAS in Longnan mountain. J. Nat. Disasters 2024, 33, 34–47. [Google Scholar] [CrossRef]
- Camps-Valls, G.; Fernández-Torres, M.-Á.; Cohrs, K.-H.; Höhl, A.; Castelletti, A.; Pacal, A.; Robin, C.; Martinuzzi, F.; Papoutsis, I.; Prapas, I.; et al. Artificial Intelligence for Modeling and Understanding Extreme Weather and Climate Events. Nat. Commun. 2025, 16, 1919. [Google Scholar] [CrossRef] [Scilit] [PubMed]
- Xu, Q.; Shi, Y.; Zhao, J.; Zhu, X.X. FloodCastBench: A Large-Scale Dataset and Foundation Models for Flood Modeling and Forecasting. Sci. Data 2025, 12, 431. [Google Scholar] [CrossRef] [Scilit] [PubMed]
- Zhou, Q.; Teng, S.; Situ, Z.; Liao, X.; Feng, J.; Chen, G.; Zhang, J.; Lu, Z. A Deep-Learning-Technique-Based Data-Driven Model for Accurate and Rapid Flood Predictions in Temporal and Spatial Dimensions. Hydrol. Earth Syst. Sci. 2023, 27, 1791–1808. [Google Scholar] [CrossRef] [Scilit]
- Dang, T.Q.; Tran, B.H.; Le, Q.N.; Dang, T.D.; Tanim, A.H.; Pham, Q.B.; Bui, V.H.; Mai, S.T.; Thanh, P.N.; Anh, D.T. Application of Machine Learning-Based Surrogate Models for Urban Flood Depth Modeling in Ho Chi Minh City, Vietnam. Appl. Soft Comput. 2024, 150, 111031. [Google Scholar] [CrossRef] [Scilit]
- Haces-Garcia, F.; Ross, N.; Glennie, C.L.; Rifai, H.S.; Hoskere, V.; Ekhtari, N. Rapid 2D Hydrodynamic Flood Modeling Using Deep Learning Surrogates. J. Hydrol. 2025, 651, 132561. [Google Scholar] [CrossRef] [Scilit]
- Xu, L.; Gao, L. A Hybrid Surrogate Model for Real-Time Coastal Urban Flood Prediction: An Application to Macao. J. Hydrol. 2024, 642, 131863. [Google Scholar] [CrossRef] [Scilit]
- Grinsztajn, L.; Oyallon, E.; Varoquaux, G. Why Do Tree-Based Models Still Outperform Deep Learning on Typical Tabular Data? In Proceedings of the Advances in Neural Information Processing Systems 35; Neural Information Processing Systems Foundation, Inc. (NeurIPS): New Orleans, LA, USA, 2022; pp. 507–520. [Google Scholar]
- Lyu, H.-M.; Yin, Z.-Y. Flood Susceptibility Prediction Using Tree-Based Machine Learning Models in the GBA. Sustain. Cities Soc. 2023, 97, 104744. [Google Scholar] [CrossRef] [Scilit]
- Demissie, Z.; Rimal, P.; Seyoum, W.M.; Dutta, A.; Rimmington, G. Flood Susceptibility Mapping: Integrating Machine Learning and GIS for Enhanced Risk Assessment. Appl. Comput. Geosci. 2024, 23, 100183. [Google Scholar] [CrossRef] [Scilit]
- Sasanapuri, S.K.; Dhanya, C.T.; Gosain, A.K. A Surrogate Machine Learning Model Using Random Forests for Real-Time Flood Inundation Simulations. Environ. Model. Softw. 2025, 188, 106439. [Google Scholar] [CrossRef] [Scilit]
- Chen, T.; Guestrin, C. XGBoost: A Scalable Tree Boosting System. In Proceedings of the 22nd ACM SIGKDD International Conference on Knowledge Discovery and Data Mining, San Francisco, CA, USA, 13–17 August 2016; pp. 785–794. [Google Scholar] [CrossRef] [Scilit]
- Zahura, F.T.; Goodall, J.L.; Sadler, J.M.; Shen, Y.; Morsy, M.M.; Behl, M. Training Machine Learning Surrogate Models from a High-Fidelity Physics-Based Model: Application for Real-Time Street-Scale Flood Prediction in an Urban Coastal Community. Water Resour. Res. 2020, 56, e2019WR027038. [Google Scholar] [CrossRef] [Scilit]
- Hong, H.; Wang, D.; Zhu, A. A New Training Data Sampling Method for Machine Learning-Based Landslide Susceptibility Mapping. Acta Geogr. Sin. 2024, 79, 1718–1736. [Google Scholar] [CrossRef]
- D’Ayala, D.; Wang, K.; Yan, Y.; Smith, H.; Massam, A.; Filipova, V.; Pereira, J.J. Flood Vulnerability and Risk Assessment of Urban Traditional Buildings in a Heritage District of Kuala Lumpur, Malaysia. Nat. Hazards Earth Syst. Sci. 2020, 20, 2221–2241. [Google Scholar] [CrossRef] [Scilit]
- International Sava River Basin Commission. Elements of Simplified Methodology for Preparation of Flood Maps. Available online: https://www.savacommission.org/elements-of-simplified-methodology-for-preparation-of-flood-maps/1990 (accessed on 2 February 2026).
- Diaz, N.D.; Lee, Y.; Kothuis, B.L.M.; Pagán-Trinidad, I.; Jonkman, S.N.; Brody, S.D. Mapping the Flood Vulnerability of Residential Structures: Cases from the Netherlands, Puerto Rico, and the United States. Geosciences 2024, 14, 109. [Google Scholar] [CrossRef] [Scilit]
- De Lucia, C.; Arrighi, C. Development of Flood Vulnerability Functions for Cultural Heritage Buildings and Artworks for Damage Assessment in Art Cities. Nat. Hazards Earth Syst. Sci. 2026, 26, 2653–2672. [Google Scholar] [CrossRef] [Scilit]
- Kountouri, J.; Sigourou, S.; Pagana, V.; Tsouni, A.; Kontoes, C.; Hadjimitsis, D.; Panagiotou, C.F. A Holistic Framework for Flood Risk Assessment and Optimal Design of Mitigation Measures. Environ. Process. 2026, 13, 13. [Google Scholar] [CrossRef] [Scilit]
- Zheng, Y. Analysis of Optimizing the Resilience of High-Density Cities in Deal with Extreme Rainstorms. China Flood Drought Manag. 2022, 32, 60–64. [Google Scholar] [CrossRef]
- Ministry of Natural Resources of the People’s Republic of China. National Platform for Common GeoSpatial Information Services. Available online: https://cloudcenter.tianditu.gov.cn/dataSource (accessed on 4 September 2025).
- NASA; METI; AIST; Japan Spacesystems; U.S./Japan ASTER Science Team. ASTER Global Digital Elevation Model V003 [Dataset]. NASA Land Processes Distributed Active Archive Center, 2019. Available online: https://www.earthdata.nasa.gov/data/catalog/lpcloud-astgtm-003 (accessed on 4 September 2025). [CrossRef]
- Download OpenStreetMap for China. Available online: https://download.geofabrik.de/asia/china.html (accessed on 7 September 2025).
- Shanghai Public Data Open Platform. Available online: https://data.sh.gov.cn/view/data-resource/index.html (accessed on 17 January 2026).
- DB31/T 1043-2017; Standard of Rainstorm Intensity Formula and Design Rainstorm Distribution. Shanghai Municipal Bureau of Quality and Technical Supervision: Shanghai, China, 2017.
- Qian, Q.; Edwards, D.J.; Zhang, Y.; Haselbach, L. Improving Flood Inundation Mapping Accuracy Using HEC-RAS Modeling: A Case Study of the Neches River Tidal Floodplain in Texas. J. Hydrol. Eng. 2024, 29, 05024011. [Google Scholar] [CrossRef] [Scilit]
- Dasallas, L.; Kim, Y.; An, H. Case Study of HEC-RAS 1D–2D Coupling Simulation: 2002 Baeksan Flood Event in Korea. Water 2019, 11, 2048. [Google Scholar] [CrossRef] [Scilit]
- Ghimire, E.; Sharma, S. Flood Damage Assessment in HAZUS Using Various Resolution of Data and One-Dimensional and Two-Dimensional HEC-RAS Depth Grids. Nat. Hazards Rev. 2021, 22, 04020054. [Google Scholar] [CrossRef] [Scilit]
- Mazdeh, A.M.; Zevenbergen, L.W.; Kramer, C.M.; Liu, X. What Manning’s n? A Need for Clear Definitions in Computational Modeling. In Proceedings of the Federal Interagency Sedimentation and Hydrologic Modeling Conference (SEDHYD 2023), St. Louis, MO, USA, 8–12 May 2023. [Google Scholar]
- Huang, Q.; Dong, J.; Li, M.; Wang, J. Research on the Scenario Simulation Method of Rainstorm Waterlogging Hazard: A Case Study in the Central Urban Area of Shanghai. J. Geo-Inf. Sci. 2016, 18, 506–513. [Google Scholar] [CrossRef]
- Wang, Y.; Liang, L.; Sun, Y.; Gong, A.; Liu, Y.; Chen, Y. Research on flood disaster risk of immovable cultural relics in Shanxi Province. J. Nat. Disasters 2022, 31, 35–47. [Google Scholar] [CrossRef]

Disclaimer/Publisher’s Note: The statements, opinions and data contained in all publications are solely those of the individual author(s) and contributor(s) and not of MDPI and/or the editor(s). MDPI and/or the editor(s) disclaim responsibility for any injury to people or property resulting from any ideas, methods, instructions or products referred to in the content. |
© 2026 by the authors. Published by MDPI on behalf of the International Society for Photogrammetry and Remote Sensing. Licensee MDPI, Basel, Switzerland. This article is an open access article distributed under the terms and conditions of the Creative Commons Attribution (CC BY) license.