Site-Oriented Surrogate Modeling Approach for Flood Risk Assessment: A Case Study of Cultural Heritage Sites in Shanghai


Abstract
1. Introduction
- •
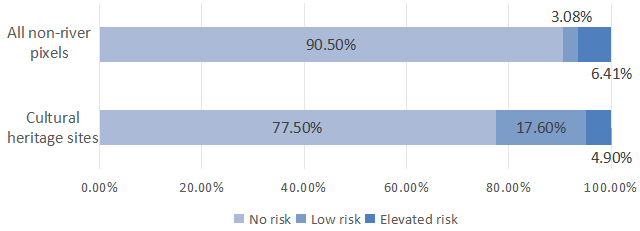
- No risk: inundation depth equals 0 m.
- •
- Low risk: inundation depth greater than 0 m and less than or equal to 0.2 m, representing shallow inundation requiring basic protective attention
- •
- Elevated risk: depths exceeding 0.2 m, representing inundation conditions requiring increased conservation attention
2. Materials and Methods
2.1. Data Preparation
2.1.1. Study Area and Data
2.1.2. Supervised Label Generation
2.2. Machine-Learning Model
2.2.1. Multi-Scale Neighborhood Feature Setting
2.2.2. Model Training
2.2.3. Performance Evaluation Strategy
- •
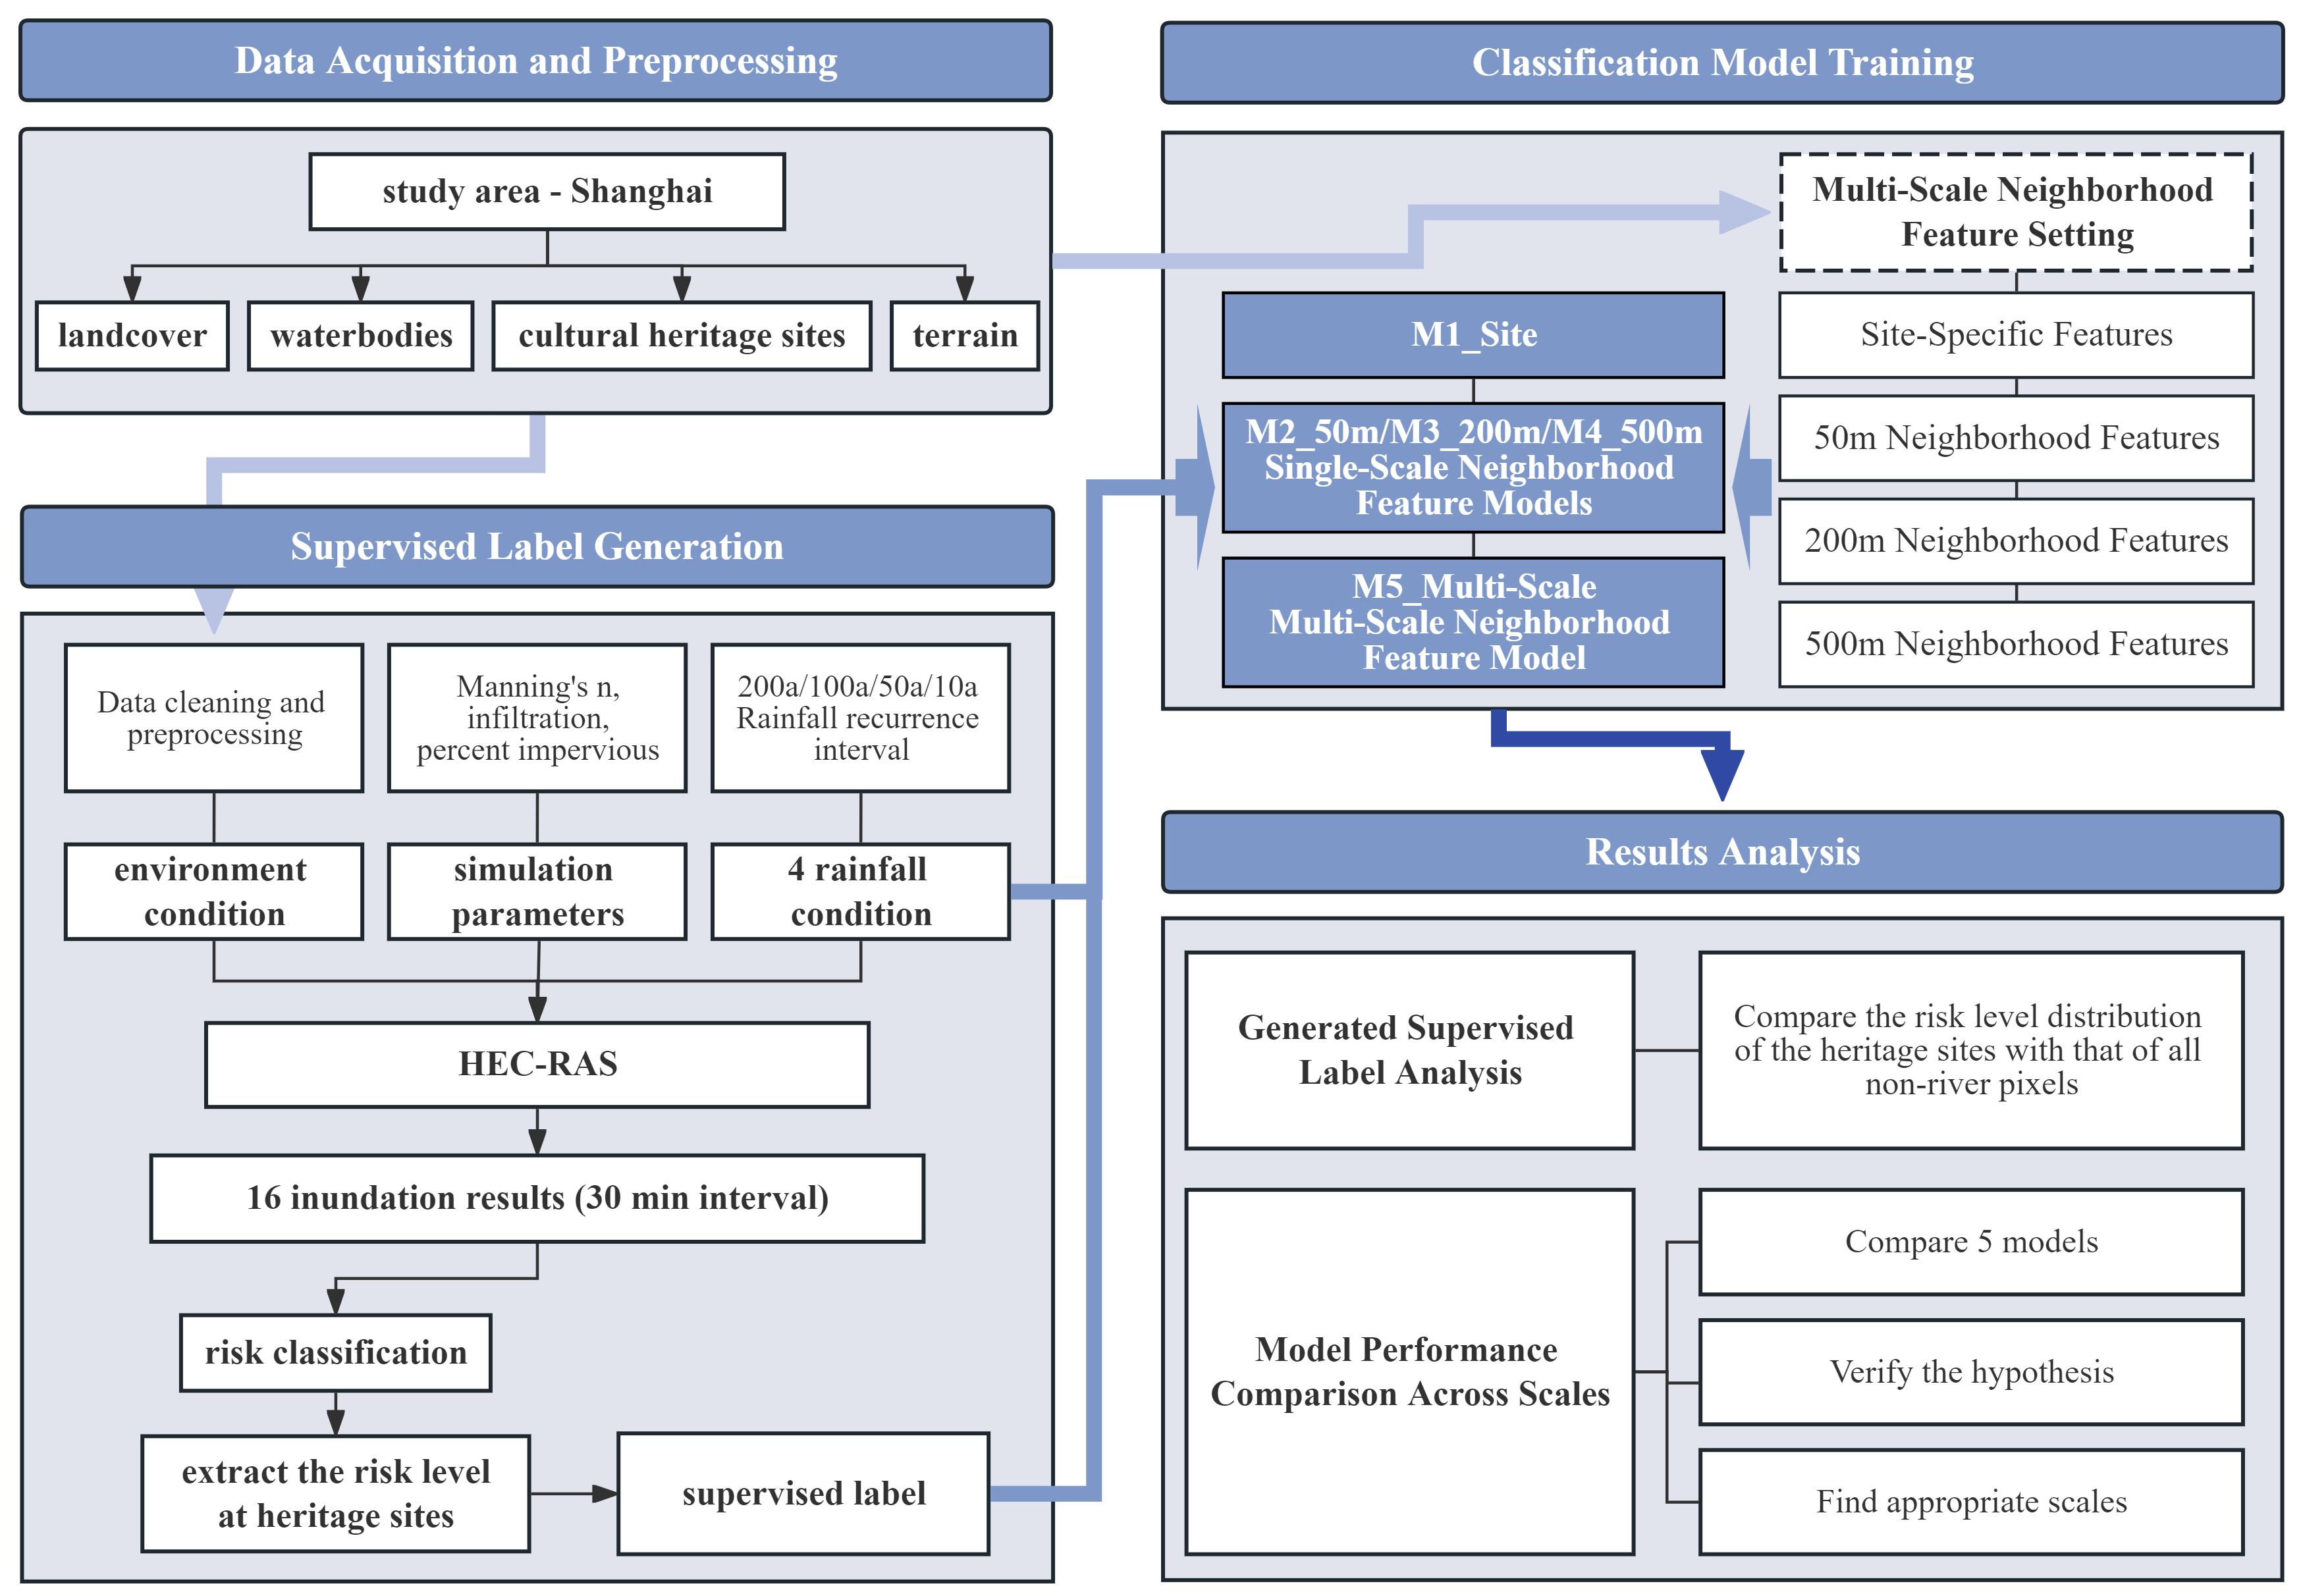
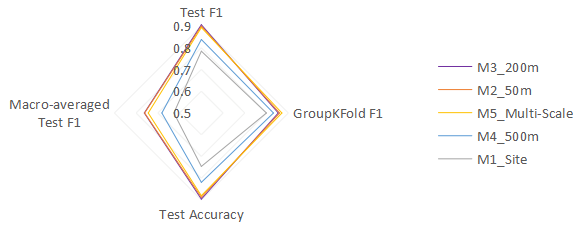
- M1_Site: Site-Specific Features only.
- •
- M2_50m: Site-Specific Features and 50m Neighborhood Features.
- •
- M3_200m: Site-Specific Features and 200m Neighborhood Features.
- •
- M4_500m: Site-Specific Features and 500m Neighborhood Features.
- •
- M5_Multi-Scale: Site-Specific Features and Multi-Scale Neighborhood Features.
3. Results
3.1. Supervised Label Analysis
3.2. Model Performance Comparison at All Neighborhood Scales
3.2.1. Site-Specific Feature Model
3.2.2. Single-Scale Neighborhood Feature Models
3.2.3. Multi-Scale Neighborhood Feature Model
3.2.4. Cross-Scale Consistency of Site–Period Risk Classifications
4. Discussion
4.1. Environmental Constraints Influence the Distribution of Flood Risk Levels
4.2. Appropriate Neighborhood Scale Is Important for Site-Oriented Flood Risk Assessment
4.3. Benefits of Flood Risk Assessment on Discrete Spatial Objects for Planning Practice
4.4. Limitations and Future Directions
5. Conclusions
Supplementary Materials
Author Contributions
Funding
Data Availability Statement
Conflicts of Interest
References
- Seneviratne, S.I.; Zhang, X.; Adnan, M.; Badi, W.; Dereczynski, C.; Di Luca, A.; Ghosh, S.; Iskandar, I.; Kossin, J.; Lewis, S.; et al. 2021: Weather and Climate Extreme Events in a Changing Climate. In Climate Change 2021: The Physical Science Basis. Contribution of Working Group I to the Sixth Assessment Report of the Intergovernmental Panel on Climate Change; Masson-Delmotte, V., Zhai, P., Pirani, A., Connors, S.L., Péan, C., Berger, S., Caud, N., Chen, Y., Goldfarb, L., Gomis, M.I., et al., Eds.; Cambridge University Press: Cambridge, UK; New York, NY, USA; pp. 1513–1766. [CrossRef] [Scilit]
- Sesana, E.; Gagnon, A.S.; Ciantelli, C.; Cassar, J.; Hughes, J.J. Climate Change Impacts on Cultural Heritage: A Literature Review. WIREs Clim. Chang. 2021, 12, e710. [Google Scholar] [CrossRef] [Scilit]
- Zhai, G. Planning perspectives on urban resilience to stormwater hazards in the context of climate change: Key concepts, basic ideas and generic frameworks. Urban Plan. Forum 2024, 1, 29–37. [Google Scholar] [CrossRef]
- USACE Hydrologic Engineering Center. Introduction to HEC-RAS. Available online: https://www.hec.usace.army.mil/confluence/rasdocs/rasum/latest/introduction-to-hec-ras (accessed on 2 April 2026).
- Van Dau, Q.; Wang, X.; Aziz, F.; Ali Nawaz, R.; Pang, T.; Qasim Mahmood, M.; Fortin, M. Pluvial Flood Modeling for Coastal Areas under Future Climate Change—A Case Study for Prince Edward Island, Canada. J. Hydrol. 2024, 641, 131769. [Google Scholar] [CrossRef] [Scilit]
- Madhuri, R.; Sarath Raja, Y.S.L.; Srinivasa Raju, K.; Punith, B.S.; Manoj, K. Urban flood risk analysis of buildings using HEC-RAS 2D in climate change framework. H2Open J. 2021, 4, 262–275. [Google Scholar] [CrossRef] [Scilit]
- Li, Y.; Cheng, L.; Cheng, X.; Zhou, L.; Zhang, L.; Liu, P. Analysis of the flood inundation of towns based on HEC-RAS model. Eng. J. Wuhan Univ. 2023, 56, 1536–1545. [Google Scholar] [CrossRef]
- Tao, H.; Fang, Z.; Fan, N.; Shang, K. Optimization study of flash flood risk map based on HEC-RAS in Longnan mountain. J. Nat. Disasters 2024, 33, 34–47. [Google Scholar] [CrossRef]
- Camps-Valls, G.; Fernández-Torres, M.-Á.; Cohrs, K.-H.; Höhl, A.; Castelletti, A.; Pacal, A.; Robin, C.; Martinuzzi, F.; Papoutsis, I.; Prapas, I.; et al. Artificial Intelligence for Modeling and Understanding Extreme Weather and Climate Events. Nat. Commun. 2025, 16, 1919. [Google Scholar] [CrossRef] [Scilit] [PubMed]
- Xu, Q.; Shi, Y.; Zhao, J.; Zhu, X.X. FloodCastBench: A Large-Scale Dataset and Foundation Models for Flood Modeling and Forecasting. Sci. Data 2025, 12, 431. [Google Scholar] [CrossRef] [Scilit] [PubMed]
- Zhou, Q.; Teng, S.; Situ, Z.; Liao, X.; Feng, J.; Chen, G.; Zhang, J.; Lu, Z. A Deep-Learning-Technique-Based Data-Driven Model for Accurate and Rapid Flood Predictions in Temporal and Spatial Dimensions. Hydrol. Earth Syst. Sci. 2023, 27, 1791–1808. [Google Scholar] [CrossRef] [Scilit]
- Dang, T.Q.; Tran, B.H.; Le, Q.N.; Dang, T.D.; Tanim, A.H.; Pham, Q.B.; Bui, V.H.; Mai, S.T.; Thanh, P.N.; Anh, D.T. Application of Machine Learning-Based Surrogate Models for Urban Flood Depth Modeling in Ho Chi Minh City, Vietnam. Appl. Soft Comput. 2024, 150, 111031. [Google Scholar] [CrossRef] [Scilit]
- Haces-Garcia, F.; Ross, N.; Glennie, C.L.; Rifai, H.S.; Hoskere, V.; Ekhtari, N. Rapid 2D Hydrodynamic Flood Modeling Using Deep Learning Surrogates. J. Hydrol. 2025, 651, 132561. [Google Scholar] [CrossRef] [Scilit]
- Xu, L.; Gao, L. A Hybrid Surrogate Model for Real-Time Coastal Urban Flood Prediction: An Application to Macao. J. Hydrol. 2024, 642, 131863. [Google Scholar] [CrossRef] [Scilit]
- Grinsztajn, L.; Oyallon, E.; Varoquaux, G. Why Do Tree-Based Models Still Outperform Deep Learning on Typical Tabular Data? In Proceedings of the Advances in Neural Information Processing Systems 35; Neural Information Processing Systems Foundation, Inc. (NeurIPS): New Orleans, LA, USA, 2022; pp. 507–520. [Google Scholar]
- Lyu, H.-M.; Yin, Z.-Y. Flood Susceptibility Prediction Using Tree-Based Machine Learning Models in the GBA. Sustain. Cities Soc. 2023, 97, 104744. [Google Scholar] [CrossRef] [Scilit]
- Demissie, Z.; Rimal, P.; Seyoum, W.M.; Dutta, A.; Rimmington, G. Flood Susceptibility Mapping: Integrating Machine Learning and GIS for Enhanced Risk Assessment. Appl. Comput. Geosci. 2024, 23, 100183. [Google Scholar] [CrossRef] [Scilit]
- Sasanapuri, S.K.; Dhanya, C.T.; Gosain, A.K. A Surrogate Machine Learning Model Using Random Forests for Real-Time Flood Inundation Simulations. Environ. Model. Softw. 2025, 188, 106439. [Google Scholar] [CrossRef] [Scilit]
- Chen, T.; Guestrin, C. XGBoost: A Scalable Tree Boosting System. In Proceedings of the 22nd ACM SIGKDD International Conference on Knowledge Discovery and Data Mining, San Francisco, CA, USA, 13–17 August 2016; pp. 785–794. [Google Scholar] [CrossRef] [Scilit]
- Zahura, F.T.; Goodall, J.L.; Sadler, J.M.; Shen, Y.; Morsy, M.M.; Behl, M. Training Machine Learning Surrogate Models from a High-Fidelity Physics-Based Model: Application for Real-Time Street-Scale Flood Prediction in an Urban Coastal Community. Water Resour. Res. 2020, 56, e2019WR027038. [Google Scholar] [CrossRef] [Scilit]
- Hong, H.; Wang, D.; Zhu, A. A New Training Data Sampling Method for Machine Learning-Based Landslide Susceptibility Mapping. Acta Geogr. Sin. 2024, 79, 1718–1736. [Google Scholar] [CrossRef]
- D’Ayala, D.; Wang, K.; Yan, Y.; Smith, H.; Massam, A.; Filipova, V.; Pereira, J.J. Flood Vulnerability and Risk Assessment of Urban Traditional Buildings in a Heritage District of Kuala Lumpur, Malaysia. Nat. Hazards Earth Syst. Sci. 2020, 20, 2221–2241. [Google Scholar] [CrossRef] [Scilit]
- International Sava River Basin Commission. Elements of Simplified Methodology for Preparation of Flood Maps. Available online: https://www.savacommission.org/elements-of-simplified-methodology-for-preparation-of-flood-maps/1990 (accessed on 2 February 2026).
- Diaz, N.D.; Lee, Y.; Kothuis, B.L.M.; Pagán-Trinidad, I.; Jonkman, S.N.; Brody, S.D. Mapping the Flood Vulnerability of Residential Structures: Cases from the Netherlands, Puerto Rico, and the United States. Geosciences 2024, 14, 109. [Google Scholar] [CrossRef] [Scilit]
- De Lucia, C.; Arrighi, C. Development of Flood Vulnerability Functions for Cultural Heritage Buildings and Artworks for Damage Assessment in Art Cities. Nat. Hazards Earth Syst. Sci. 2026, 26, 2653–2672. [Google Scholar] [CrossRef] [Scilit]
- Kountouri, J.; Sigourou, S.; Pagana, V.; Tsouni, A.; Kontoes, C.; Hadjimitsis, D.; Panagiotou, C.F. A Holistic Framework for Flood Risk Assessment and Optimal Design of Mitigation Measures. Environ. Process. 2026, 13, 13. [Google Scholar] [CrossRef] [Scilit]
- Zheng, Y. Analysis of Optimizing the Resilience of High-Density Cities in Deal with Extreme Rainstorms. China Flood Drought Manag. 2022, 32, 60–64. [Google Scholar] [CrossRef]
- Ministry of Natural Resources of the People’s Republic of China. National Platform for Common GeoSpatial Information Services. Available online: https://cloudcenter.tianditu.gov.cn/dataSource (accessed on 4 September 2025).
- NASA; METI; AIST; Japan Spacesystems; U.S./Japan ASTER Science Team. ASTER Global Digital Elevation Model V003 [Dataset]. NASA Land Processes Distributed Active Archive Center, 2019. Available online: https://www.earthdata.nasa.gov/data/catalog/lpcloud-astgtm-003 (accessed on 4 September 2025). [CrossRef]
- Download OpenStreetMap for China. Available online: https://download.geofabrik.de/asia/china.html (accessed on 7 September 2025).
- Shanghai Public Data Open Platform. Available online: https://data.sh.gov.cn/view/data-resource/index.html (accessed on 17 January 2026).
- DB31/T 1043-2017; Standard of Rainstorm Intensity Formula and Design Rainstorm Distribution. Shanghai Municipal Bureau of Quality and Technical Supervision: Shanghai, China, 2017.
- Qian, Q.; Edwards, D.J.; Zhang, Y.; Haselbach, L. Improving Flood Inundation Mapping Accuracy Using HEC-RAS Modeling: A Case Study of the Neches River Tidal Floodplain in Texas. J. Hydrol. Eng. 2024, 29, 05024011. [Google Scholar] [CrossRef] [Scilit]
- Dasallas, L.; Kim, Y.; An, H. Case Study of HEC-RAS 1D–2D Coupling Simulation: 2002 Baeksan Flood Event in Korea. Water 2019, 11, 2048. [Google Scholar] [CrossRef] [Scilit]
- Ghimire, E.; Sharma, S. Flood Damage Assessment in HAZUS Using Various Resolution of Data and One-Dimensional and Two-Dimensional HEC-RAS Depth Grids. Nat. Hazards Rev. 2021, 22, 04020054. [Google Scholar] [CrossRef] [Scilit]
- Mazdeh, A.M.; Zevenbergen, L.W.; Kramer, C.M.; Liu, X. What Manning’s n? A Need for Clear Definitions in Computational Modeling. In Proceedings of the Federal Interagency Sedimentation and Hydrologic Modeling Conference (SEDHYD 2023), St. Louis, MO, USA, 8–12 May 2023. [Google Scholar]
- Huang, Q.; Dong, J.; Li, M.; Wang, J. Research on the Scenario Simulation Method of Rainstorm Waterlogging Hazard: A Case Study in the Central Urban Area of Shanghai. J. Geo-Inf. Sci. 2016, 18, 506–513. [Google Scholar] [CrossRef]
- Wang, Y.; Liang, L.; Sun, Y.; Gong, A.; Liu, Y.; Chen, Y. Research on flood disaster risk of immovable cultural relics in Shanxi Province. J. Nat. Disasters 2022, 31, 35–47. [Google Scholar] [CrossRef]





| Land Cover Types | Manning’s n |
|---|---|
| Artificial Surfaces | 0.05 |
| Cultivated Land | 0.035 |
| Grassland | 0.035 |
| Forest | 0.1 |
| Waterbodies | 0.025 |
| Wetland | 0.1 |
| Shrubland | 0.04 |
| Category | Feature | Feature Code | Description |
|---|---|---|---|
| Rainfall conditions | Cumulative rainfall | R_total | Cumulative rainfall over the rainfall duration |
| Peak rainfall intensity | R_peak | Maximum rainfall intensity recorded over the rainfall duration | |
| Rainfall duration | R_duration | Elapsed time since the onset of rainfall | |
| Topographic features | Elevation at the heritage site | elevation_point | Point extraction: elevation value extracted directly at the location of the site |
| Mean elevation within the surrounding area | elevation_mean_50 m/200 m/500 m | Buffer statistics: mean elevation of all raster cells within the specified buffer radius | |
| Minimum elevation within the surrounding area | elevation_min_50 m/200 m/500 m | Buffer statistics: minimum elevation of all raster cells within the specified buffer radius | |
| Maximum elevation within the surrounding area | elevation_max_50 m/200 m/500 m | Buffer statistics: maximum elevation of all raster cells within the specified buffer radius | |
| Standard deviation of elevation within the surrounding area | elevation_std_50 m/200 m/500 m | Buffer statistics: standard deviation of elevation within the specified buffer radius | |
| Elevation range within the surrounding area | elevation_range_50 m/200 m/500 m | Buffer statistics: elevation range within the specified buffer radius | |
| Hydrological features | River network density within the surrounding area | river_density_50 m/200 m/500 m | Spatial analysis: River network density calculated within the specified buffer radius |
| Distance from the site to the nearest water body | dist_to_river | Spatial analysis: calculate the distance from the heritage site to the nearest water body | |
| Land cover features | The proportion of different land cover types within the surrounding area | landcover_type_ratio_50 m/200 m/500 m | Buffer statistics: area proportion of each landcover type (i.e., Artificial_Surfaces, Cultivated_Land, Grassland, Forest, Waterbodies, Wetland, and Shrubland) within the given buffer radius |
| Parameter | Search Space | M1_Site | M2_50m | M3_200m | M4_500m | M5_Multi-Scale |
|---|---|---|---|---|---|---|
| n_estimators | 100, 150, 200 | 100 | 100 | 150 | 200 | 100 |
| max_depth | 2, 3, 4, 5 | 2 | 4 | 3 | 2 | 3 |
| min_child_weight | 1, 3, 5 | 1 | 3 | 1 | 3 | 1 |
| learning_rate | 0.05, 0.1, 0.15 | 0.05 | 0.05 | 0.1 | 0.1 | 0.05 |
| subsample | 0.6, 0.7, 0.8 | 0.8 | 0.7 | 0.8 | 0.7 | 0.8 |
| colsample_bytree | 0.6, 0.7, 0.8 | 0.6 | 0.6 | 0.6 | 0.8 | 0.7 |
| gamma | 0, 0.05, 0.1 | 0.05 | 0 | 0 | 0.05 | 0.1 |
| reg_alpha | 0, 0.1, 0.5, 1 | 0 | 0.1 | 1 | 0 | 0 |
| reg_lambda | 1.0, 1.5, 2.0 | 1 | 1.5 | 1 | 1 | 1.5 |
| Model | Test F1 | GroupKFold F1 | Test Accuracy | Macro-Averaged Test F1 |
|---|---|---|---|---|
| M3_200m | 0.9059 | 0.8537 ± 0.0595 | 0.896 | 0.7623 |
| M2_50m | 0.8994 | 0.8598 ± 0.0857 | 0.8878 | 0.761 |
| M5_Multi-Scale | 0.8931 | 0.8704 ± 0.0691 | 0.8803 | 0.7443 |
| M4_500m | 0.8379 | 0.8316 ± 0.1146 | 0.8189 | 0.6816 |
| M1_Site | 0.7843 | 0.7992 ± 0.0811 | 0.7457 | 0.6264 |
| M3_200m | No Risk | Low Risk | Elevated Risk | |
|---|---|---|---|---|
| M2_50m | ||||
| No risk | 470 | 12 | 18 | |
| Low risk | 20 | 116 | 4 | |
| Elevated risk | 28 | 0 | 36 | |
Disclaimer/Publisher’s Note: The statements, opinions and data contained in all publications are solely those of the individual author(s) and contributor(s) and not of MDPI and/or the editor(s). MDPI and/or the editor(s) disclaim responsibility for any injury to people or property resulting from any ideas, methods, instructions or products referred to in the content. |
© 2026 by the authors. Published by MDPI on behalf of the International Society for Photogrammetry and Remote Sensing. Licensee MDPI, Basel, Switzerland. This article is an open access article distributed under the terms and conditions of the Creative Commons Attribution (CC BY) license.
Share and Cite
Chen, X.; Liu, L.; Shen, Y. Site-Oriented Surrogate Modeling Approach for Flood Risk Assessment: A Case Study of Cultural Heritage Sites in Shanghai. ISPRS Int. J. Geo-Inf. 2026, 15, 424. https://doi.org/10.3390/ijgi15090424
Chen X, Liu L, Shen Y. Site-Oriented Surrogate Modeling Approach for Flood Risk Assessment: A Case Study of Cultural Heritage Sites in Shanghai. ISPRS International Journal of Geo-Information. 2026; 15(9):424. https://doi.org/10.3390/ijgi15090424
Chicago/Turabian StyleChen, Xiang, Liu Liu, and Yao Shen. 2026. "Site-Oriented Surrogate Modeling Approach for Flood Risk Assessment: A Case Study of Cultural Heritage Sites in Shanghai" ISPRS International Journal of Geo-Information 15, no. 9: 424. https://doi.org/10.3390/ijgi15090424
APA StyleChen, X., Liu, L., & Shen, Y. (2026). Site-Oriented Surrogate Modeling Approach for Flood Risk Assessment: A Case Study of Cultural Heritage Sites in Shanghai. ISPRS International Journal of Geo-Information, 15(9), 424. https://doi.org/10.3390/ijgi15090424