


Abstract
Over 200 million of the world’s 273 million out-of-school children live in Central and Southern Asia or Sub-Saharan Africa, where distance to school is a persistent barrier, and walking remains the dominant travel mode. Tanzania presents a critical case: over 300,000 children dropped out before completing primary school in 2023, and only 8.5% complete upper-secondary education. We estimated walking travel time to the nearest primary and secondary school using a 100-metre resolution cost-surface that incorporated land cover, topography, and road networks. Travel time surfaces were linked to Demographic and Health Survey (DHS) data and analysed using multilevel Poisson regression for primary school-age children (aged 7–13) and single-level models for secondary school-age adolescents (aged 14–19). Among primary school-age children (n = 9213), poor geographic access (walking time > 45 min) was associated with a 27.9% higher prevalence of non-participation after socioeconomic adjustment, consistent across wealth quintiles and maternal education groups. Among secondary school-age adolescents (n = 2585), poor access was not significant. Household wealth and maternal education showed strong protective relationships at both levels. Each additional 10 min of walking travel time was associated with a 2.9% higher prevalence of non-participation, equivalent to approximately 18% per additional hour. Geographic access is an independent barrier to primary school-age participation irrespective of socioeconomic position, as there was approximately a 2.9% higher prevalence of non-participation in school for every additional 10 min of travel time, supporting geographically targeted infrastructure investment at primary level and demand-side interventions at secondary level.
1. Introduction
Educational access is at the forefront of global development priorities, recognised not only as a fundamental right but also as a cornerstone of economic and social advancement [1]. Education has a transformative power to alleviate poverty and increase human capital, with each additional year of schooling associated with an approximately 8–10% increase in lifetime earnings [2]. Sustainable Development Goal 4.1 aims to ensure complete, equitable, and quality primary and secondary education for all children by 2030. However, recent updated estimates from UNESCO suggest absolute out-of-school numbers have increased since 2015. In 2024, globally, 273 million school-aged children were out of school, including an estimated 79 million primary age children, 64 million lower secondary age, and 130 million upper secondary age. Over 200 million of all children not in school reside in either Central and Southern Asia or Sub-Saharan Africa [3]. Gender equality in school access is improving in some places, but not all and mainly for primary school [4], and inequality reductions have been slow in Sub-Saharan Africa [1].
There are many reasons why children do not enrol, maintain attendance or have poor school outcomes [5]. Socioeconomic barriers such as cultural norms, parental education, household poverty, child labour and early marriage are well-documented impediments to educational progression [6,7]. A recent review of 25 years of research on access to primary and secondary education highlights the intersecting economic, cultural, political, and structural barriers that prevent access for children. Amongst the most commonly identified barriers were household poverty, school fees and related expenses, opportunity costs—including domestic work, gender norms disadvantaging girls, exclusionary admission policies, and lack of school provision or distance to school [8]. This study expands the research on the distance to school as a barrier to participation by examining the relationship between geographic access to education (measured as travel time to the nearest school) and school participation in Tanzania using a harmonised open-source dataset on school locations.
While lack of school provision is often indicated as a barrier by parents when asked about their children’s access, less work has used geospatial analysis to understand the relationship between geographic accessibility of education facilities and school enrolment. Long travel distances to school have been associated with poor schooling outcomes and are especially problematic in Africa where walking to school is the most common mode of transport [9]. For example, rural areas often face barriers to educational facilities and the transportation required to access them, which has the result of lowering achievement levels [10]. Across Sub-Saharan Africa, Lewin [11] found that, on average, each additional kilometre of travel to school reduced attendance by two to three percentage points, with higher dropout risk at the secondary level. Whilst in Ghana, a one-minute increase in travel time to school reduced the ability to write English or French by 1.1 percentage points [12]. In Tanzania, proximity to school was important when deciding on which school to attend, but willingness to walk varied by region and was also influenced by national test scores, as, in some districts, parents were willing to walk further for a school that got 10 points higher on a national test [13]. Alegana et al. [14] found that not attending secondary school in Cambodia, the Dominican Republic and Tanzania was associated with distance to the nearest school. This is because long or unsafe journeys increase the time and risk costs borne by households and may divert children into labour or domestic responsibilities, thereby limiting human capital accumulation. Thus, reducing geographic access or travel time to schools improves efficiency, reduces costs and can subsequently yield substantial private and social returns [15].
The implications of geographic accessibility can be profound, as they impact enrolment as well as consistent attendance, thereby amplifying educational disparities in already disadvantaged contexts. Studies reveal that not only do spatial barriers like distance significantly reduce educational participation, but they also interact with other socio-economic factors to deepen capability deprivation [10,16,17,18]. These studies suggest not only a need to reduce physical distances but also to consider socio-economic interventions that can mitigate the multifarious barriers to education.
In this study, travel time to the nearest school was selected as the core geographic accessibility metric. This measure offers several advantages over traditional metrics such as Euclidean or network distance, as it more accurately reflects the lived experiences of individuals, especially in areas with sparse or inconsistent infrastructure [19]. Travel time captures the influence of land cover, slope and road conditions on human mobility [20]. It provides a continuous, behaviourally relevant representation of spatial accessibility, particularly suited to contexts characterised by rurality or terrain-driven constraints. The use of travel time is widely supported across disciplines, as a predictor of geographic access to food [19], biodiversity [19], transportation equity [20], education [9,21], and healthcare [22,23,24].
This article proceeds with a description of the education system and access rates in Tanzania before discussing the multiple data sources and methods used to explore the relationship between travel time and education non-attendance. The cost surface model and walking speeds used to calculate travel times are described. Findings are presented by age-level cohort (primary-age and secondary-age) with sensitivity analyses completed before concluding with implications for policy.
2. Materials and Methods
2.1. Study Area
Tanzania (the United Republic of Tanzania, including Zanzibar), located in East Africa, is a critical case for studying how spatial barriers compound child deprivation in education. In 2023, the population was approximately 68 million, with nearly half under 18 years of age and two-thirds living in rural areas [25]. Formal compulsory basic education in Tanzania has three levels: one year of pre-primary, six years of primary education (ages 6 to 13), and four years of ordinary-level secondary education (from age 13) [26]. From the age of 6, all children should be enrolled in school.
Fee-free basic education policies have led to increases in primary and secondary school enrolment [26]. Primary enrolment increased from 73.6% in 2014 to 82% in 2021, with urban areas slightly higher (87.4%) than rural areas (82%). Secondary enrolment increased from 24.7% in 2014 to 39% in 2021, with a larger urban–rural disparity than at primary level [27,28]. However, the challenge of expanding compulsory education [29] has often meant that enrolment gains outpace increases in teaching resources, leading to shortages of teachers, classrooms and materials; the primary teacher–pupil ratio has been reported at over 1:100, more than twice the recommended 1:45 [30]. In terms of learning outcomes, 70% of 10-year-olds in Tanzania were estimated to be in learning poverty in 2022, unable to read and understand a simple text [31].
2.2. Data
2.2.1. School Location Data
Point locations for schools in Tanzania were assembled from three complementary repositories: (1) OpenStreetMap (OSM); (2) the World Food Programme national registry of schools used in the school feeding programme [32]; and (3) the Ministry of Education (MoE) official government registry of schools. School data were retrieved from OSM using the Overpass API, with query logic designed to maximise completeness and relevance by capturing multilingual nomenclature (e.g., features tagged ‘amenity = school’ matched against name patterns in Swahili such as ‘Shule ya msingi’ and ‘Shule ya upili’, and English equivalents such as ‘Primary School’ and ‘Secondary School’). Only schools recorded as operational in OSM were retained.
Records from the three sources were harmonised using a multi-step reconciliation process combining fuzzy name matching, rule-based text parsing to detect fragmented records, and DBSCAN spatial clustering, followed by manual verification against high-resolution satellite imagery [33,34], with full details of parameters, cluster counts and verification criteria in Supplementary Text S1. The harmonisation process resulted in a final dataset of 17,678 primary and 5759 secondary schools, reduced from an initial 17,850 and 5926 records, respectively. The final total (23,776 schools) is comparable to the 23,843 reported by the Tanzanian National Bureau of Statistics [35]; a source-by-source comparison, including the larger JRC estimate [36], is provided in Supplementary Text S1. Discrepancies between official and harmonised counts arise in part because official statistics do not record private and religious schools [37].
Schools located beyond Tanzania’s national border were reviewed rather than automatically excluded. Preliminary analysis showed that excluding all extraterritorial schools introduced spatial anomalies in the wealth–access relationship for border communities (Supplementary Text S2). MoE-registered schools located within 5 km of the border were therefore retained and snapped to the nearest Tanzanian populated settlement following the spatial reassignment method of [38], and DHS clusters within a 5 km buffer of the Kenya–Tanzania border were permitted to access schools across the border, reflecting realistic service catchments for transboundary communities. Travel time surfaces were generated from this final, border-corrected school dataset.
2.2.2. Education Enrolment and Socioeconomic Data
We used the 2022 Tanzania Demographic and Health Survey (DHS) to provide nationally representative data on education participation, household characteristics and socioeconomic conditions [39]. Key variables included current school attendance, maternal education level (no education, primary, secondary or higher), household wealth index quintile, child age and sex, sex of the household head, and urban–rural classification of the community (Table 1).
Table 1.
DHS variables used in the analysis. PR = household member recode; IR = women’s (individual) recode; GE = geographic dataset.
DHS cluster locations were used as community locations from which travel time to the nearest school was extracted. To preserve respondent confidentiality, DHS applies a random spatial displacement to cluster coordinates of up to 2 km in urban areas, 5 km in rural areas, and up to 10 km for 1% of rural clusters [40]. This displacement introduces spatial uncertainty that may affect proximity-based analyses such as travel-time modelling. To improve geographic plausibility while respecting the original enumeration area boundaries, displaced clusters were repositioned following the method of [38]: clusters falling outside built-up areas in the GRID3 Settlement Extents v3.0 raster [41] were snapped to the nearest built-up cell or, where no built-up cell existed, to the nearest road junction or linear settlement feature from OSM [42], with all relocations constrained to remain within the original enumeration area (full stepwise procedure in Supplementary Text S3). In total, 100 clusters were relocated (82 rural, 18 urban), and were moved on average 682 m in rural and 408 m in urban areas, with maxima of 3900 m and 1683 m, respectively (Table S1 provides relocation statistics by district). Prior studies demonstrate that displaced DHS data remain valuable for national- and regional-level analyses [9,24,43,44,45].
2.3. Travel-Time to School Estimation
We generated national-scale travel-time rasters to the nearest primary and secondary schools by applying a least-cost path algorithm to a 100-metre grid of Tanzania, using the algorithm developed in [24] and adapted by [46] and the data is available to download from Jarso et al. [47]. A friction surface quantifying movement resistance was constructed from land cover, slope derived from a 30-metre digital elevation model, and roads. Travel times were computed as the minimum cumulative time (in minutes) from each raster cell to the nearest school, incorporating spatially varying walking speeds assigned to road classes (Table 2) and land cover types (Table 3). Where roads and land cover overlap, the fastest (least-friction) value was used, i.e., paths were prioritised over open land and roads over paths; this was appropriate in Tanzania, where pedestrians can walk alongside almost all road types.
Table 2.
Road types and walking speeds assigned to them for calculation of travel time.
Water bodies were handled under two alternative assumptions: a primary surface treating water as impassable, and an alternative surface in which cells left unreachable under the first assumption were assigned water-crossing travel [24]. The same procedure was applied for primary and secondary schools.
2.3.1. Road Data
A road dataset was derived from Humanitarian OpenStreetMap (HOTOSM), which merges crowd-sourced OSM roads with an AI-derived roads dataset to achieve near-complete coverage [32]; OSM road coverage alone was reported to be low in Tanzania [48]. Each segment was classified by its ‘highway’ tag and assigned a base walking speed (km/h) using values adapted from studies in sub-Saharan Africa [22,49,50]: engineered roads (trunk, primary) 5.0 km/h; intermediate roads (secondary, tertiary, residential) 4.0–4.5 km/h; and informal or unpaved routes (footways, tracks) 3.5 km/h, reflecting surface irregularities (Table 2).
2.3.2. Land Cover Data
To ensure temporal alignment with the 2022 DHS, the 2021 ESA WorldCover 10 m product [51,52] was used. Each land cover class was assigned a walking speed based on terrain characteristics and previous accessibility studies [24,53], with slower speeds for dense or obstructive terrain (tree cover, wetlands) and higher speeds for open or managed land (cropland, grassland) (Table 3). Snow and ice classes were excluded. The 10 m raster was resampled to 100 m using majority-rule nearest-neighbour aggregation to preserve categorical integrity and reduce computational demand. Land cover speeds were converted to a continuous walking-speed surface and inverted to produce the friction surface.
Table 3.
Land cover classes and base walking speeds. Source: ESA WorldCover 10 m 2021 Product User Guide, Version 1.0 [51] European Space Agency and VITO, N/A = not applicable in Tanzania as there were no land cover classes of this type or in the case of Water we treated that separately.
2.3.3. Slope
Slope was derived from the SRTM DEM using finite differences in the x and y directions (Equation (1)), expressed as percentage slope. Walking speed adjustments were modelled using the exponential decay function of [54] (Equation (2)), reflecting the non-linear reduction in walking speed with increasing steepness.
where dx and dy represent elevation changes in the x and y directions. The constant 111,120 converts angular degrees to linear metres (1° latitude ≈ 60 nautical miles of 1852 m) and is the standard scale factor used in terrain analysis of geographic-coordinate DEMs [55]. This approximation holds for near-equatorial latitudes; across Tanzania’s latitudinal range (~1–12° S) the maximum east–west distortion is under 2.2%.
where x denotes the percentage slope, with the function capturing the decline in walking speed as slope increases.
The slope-derived speed was combined with the base road and land-cover speeds to produce the final cell-level walking speed. To reflect round-trip travel, speeds were calculated for uphill and downhill directions of the same slope and averaged. Slopes exceeding 45 degrees (100% slope) were masked as impassable.
2.3.4. Child Walking Speeds
Walking remains the dominant mode of school access across low-income settings in sub-Saharan Africa [21,56,57,58], and in Tanzania most households lack motorised transport, with access to services commonly measured in walking time [59]. This study therefore modelled walking access only. For primary school-age access, speeds were adjusted downwards to account for the reduced mobility of young children: Bouterse and Wall-Scheffler [60] reported mean walking speeds in urban Central Uganda of 1.00 m/s for unaccompanied adults, 0.773 m/s for adults carrying small children, and 0.785 m/s for adults accompanied by children. Based on these values, a 22% reduction was applied to the walking speeds of Pozzi and Robinson [49], as adopted in [24], across all road and land cover classes for the primary school-age surface only; secondary school-age adolescents travelling were assumed to walk at unadjusted speeds.
2.3.5. Defining Poor Access
Geographic access was operationalised using the Tanzania Ministry of Education’s School Construction and Maintenance Strategy (SCMS) guidelines, which recommend maximum walking distances of 3 km for primary and 5 km for secondary students—roughly equivalent to 45 and 60 min of walking at typical speeds of 4 km/h and 5 km/h, respectively. Geographic access was classified as good if travel time was within these thresholds (≤45 min primary; ≤60 min secondary) and poor if it exceeded them. These cut-offs reflect national policy and are supported by evidence that older adolescents tolerate longer commutes before dropout risk increases [61]. Because primary school-age travel times were computed using child-adjusted walking speeds, the 45 min threshold corresponds to a shorter physical distance than the 3 km SCMS standard; the threshold therefore represents the time cost as experienced by young children rather than a strict distance equivalence.
2.4. Statistical Analysis
2.4.1. Outcome, Exposure and Covariates
All statistical analyses were run in R and R Studio Golden Wattle release 2026.05.0 (build number 218) [62]. The dependent variable, school non-participation, equalled 1 if a child had not attended school in the school year of the survey (HV121 = 0) and 0 otherwise. The 2022 Tanzania DHS did not permit separation of children who never enrolled from those who dropped out, as the relevant prior-attendance variables (HV125–HV129) were missing for all observations (Supplementary Text S4); HV121 therefore provides a conservative and consistent measure of educational deprivation across the full sample. The key exposure was poor geographic access, defined in Section 2.3.5. Covariates were the child’s sex, place of residence (urban/rural), maternal education, household wealth quintile and sex of the household head (Table 1), given their established importance in education and poverty research [63,64,65]. Children without a matched maternal record were excluded to retain maternal education as a covariate. Analyses were conducted separately for primary school-age children (aged 7–13) and secondary school-age adolescents (aged 14–19); children aged under 7 were excluded from the primary analysis to avoid misclassifying children who were aged 5 at the start of the academic year.
2.4.2. Model Selection and Specification
The DHS has a hierarchical structure, with children (level 1) nested within DHS primary sampling units, hereafter clusters (level 2). Because geographic access operates at the community level, a single-level regression ignoring within-cluster correlation could produce biased standard errors and overestimated effects. To assess the degree of community-level clustering prior to model fitting, a null (intercept-only) multilevel model was estimated for each of primary and secondary schools, and the intra-class correlation coefficient (ICC) was derived using the latent variable method, in which individual-level variance is fixed at π2/3 ≈ 3.29 on the log scale [66]: ICC = τ2/(τ2 + π2/3), where τ2 is the cluster-level random intercept variance. A multilevel specification was adopted where the null-model ICC exceeded the 5–10% range conventionally used to justify multilevel modelling; otherwise, a single-level model with cluster-robust standard errors was used. The ICC was also computed from the fully adjusted model, with the proportional reduction quantifying the share of community-level variance explained by the covariates.
Non-participation was common (prevalence > 10%), which meant that odds ratios from logistic regression models would overestimate relative risks [67,68]. We therefore used Poisson regression with a log link applied to the binary outcome, which directly yields prevalence ratios (PRs) interpretable as risk ratios.
For the primary school-age cohort, the model was a two-level random-intercept Poisson regression:
where μij is the expected probability of non-attendance for child i in cluster j, β1–β10 are fixed-effect coefficients, and uj ~ N(0, τ2) is the cluster-level random intercept. Exponentiated coefficients yield PRs with 95% confidence intervals from Wald standard errors. Models were estimated by maximum likelihood with the Laplace approximation using glmer in the lme4 package in R [68,69], with the bobyqa optimiser for convergence stability. For the secondary school-age cohort, a single-level modified Poisson regression [67] was used, with cluster-robust sandwich standard errors (HC1 estimator, clustered at the DHS primary sampling unit) estimated via vcovCL in the sandwich package [70].
log(μij) = β0 + β1PoorAccessij + β2Genderij + β3Residenceij + β4MaternalEduij + β5–9Wealthij + β10HeadSexij + uj
2.4.3. Interaction Models
To assess whether the association between poor geographic access and non-participation varied by household socioeconomic position, two pre-specified interaction models were estimated for the primary cohort: poor access × wealth quintile, and poor access × maternal education. Each was compared with the main-effects model using likelihood ratio tests (significance threshold p < 0.05) and the Akaike Information Criterion. Where an interaction model did not significantly improve fit, the more parsimonious main-effects model was retained.
2.4.4. Sensitivity Analysis
Two sensitivity analyses assessed the robustness of the primary cohort findings to alternative specifications, using identical covariates throughout. First, a single-level modified Poisson regression with cluster-robust standard errors (HC1, clustered at the primary sampling unit) was estimated; a substantial divergence from the multilevel estimates would indicate a meaningful role of community-level clustering. Second, a survey-weighted quasi-Poisson regression was estimated using svyglm in the survey package [71], specifying the DHS design through stratification (hv022), clustering at the primary sampling unit (hv001), and individual sampling weights (hv005/1,000,000) per standard DHS guidance; the quasi-Poisson dispersion parameter accommodates residual variance not captured by the Poisson assumption. Prevalence ratios from both models were compared directly against the primary multilevel model.
3. Results
3.1. Descriptive Statistics
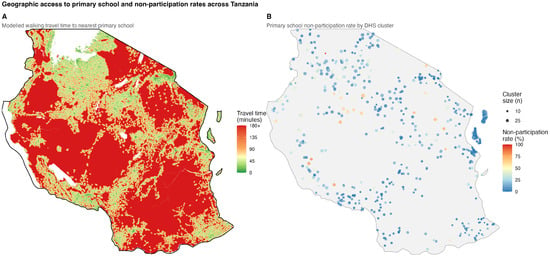
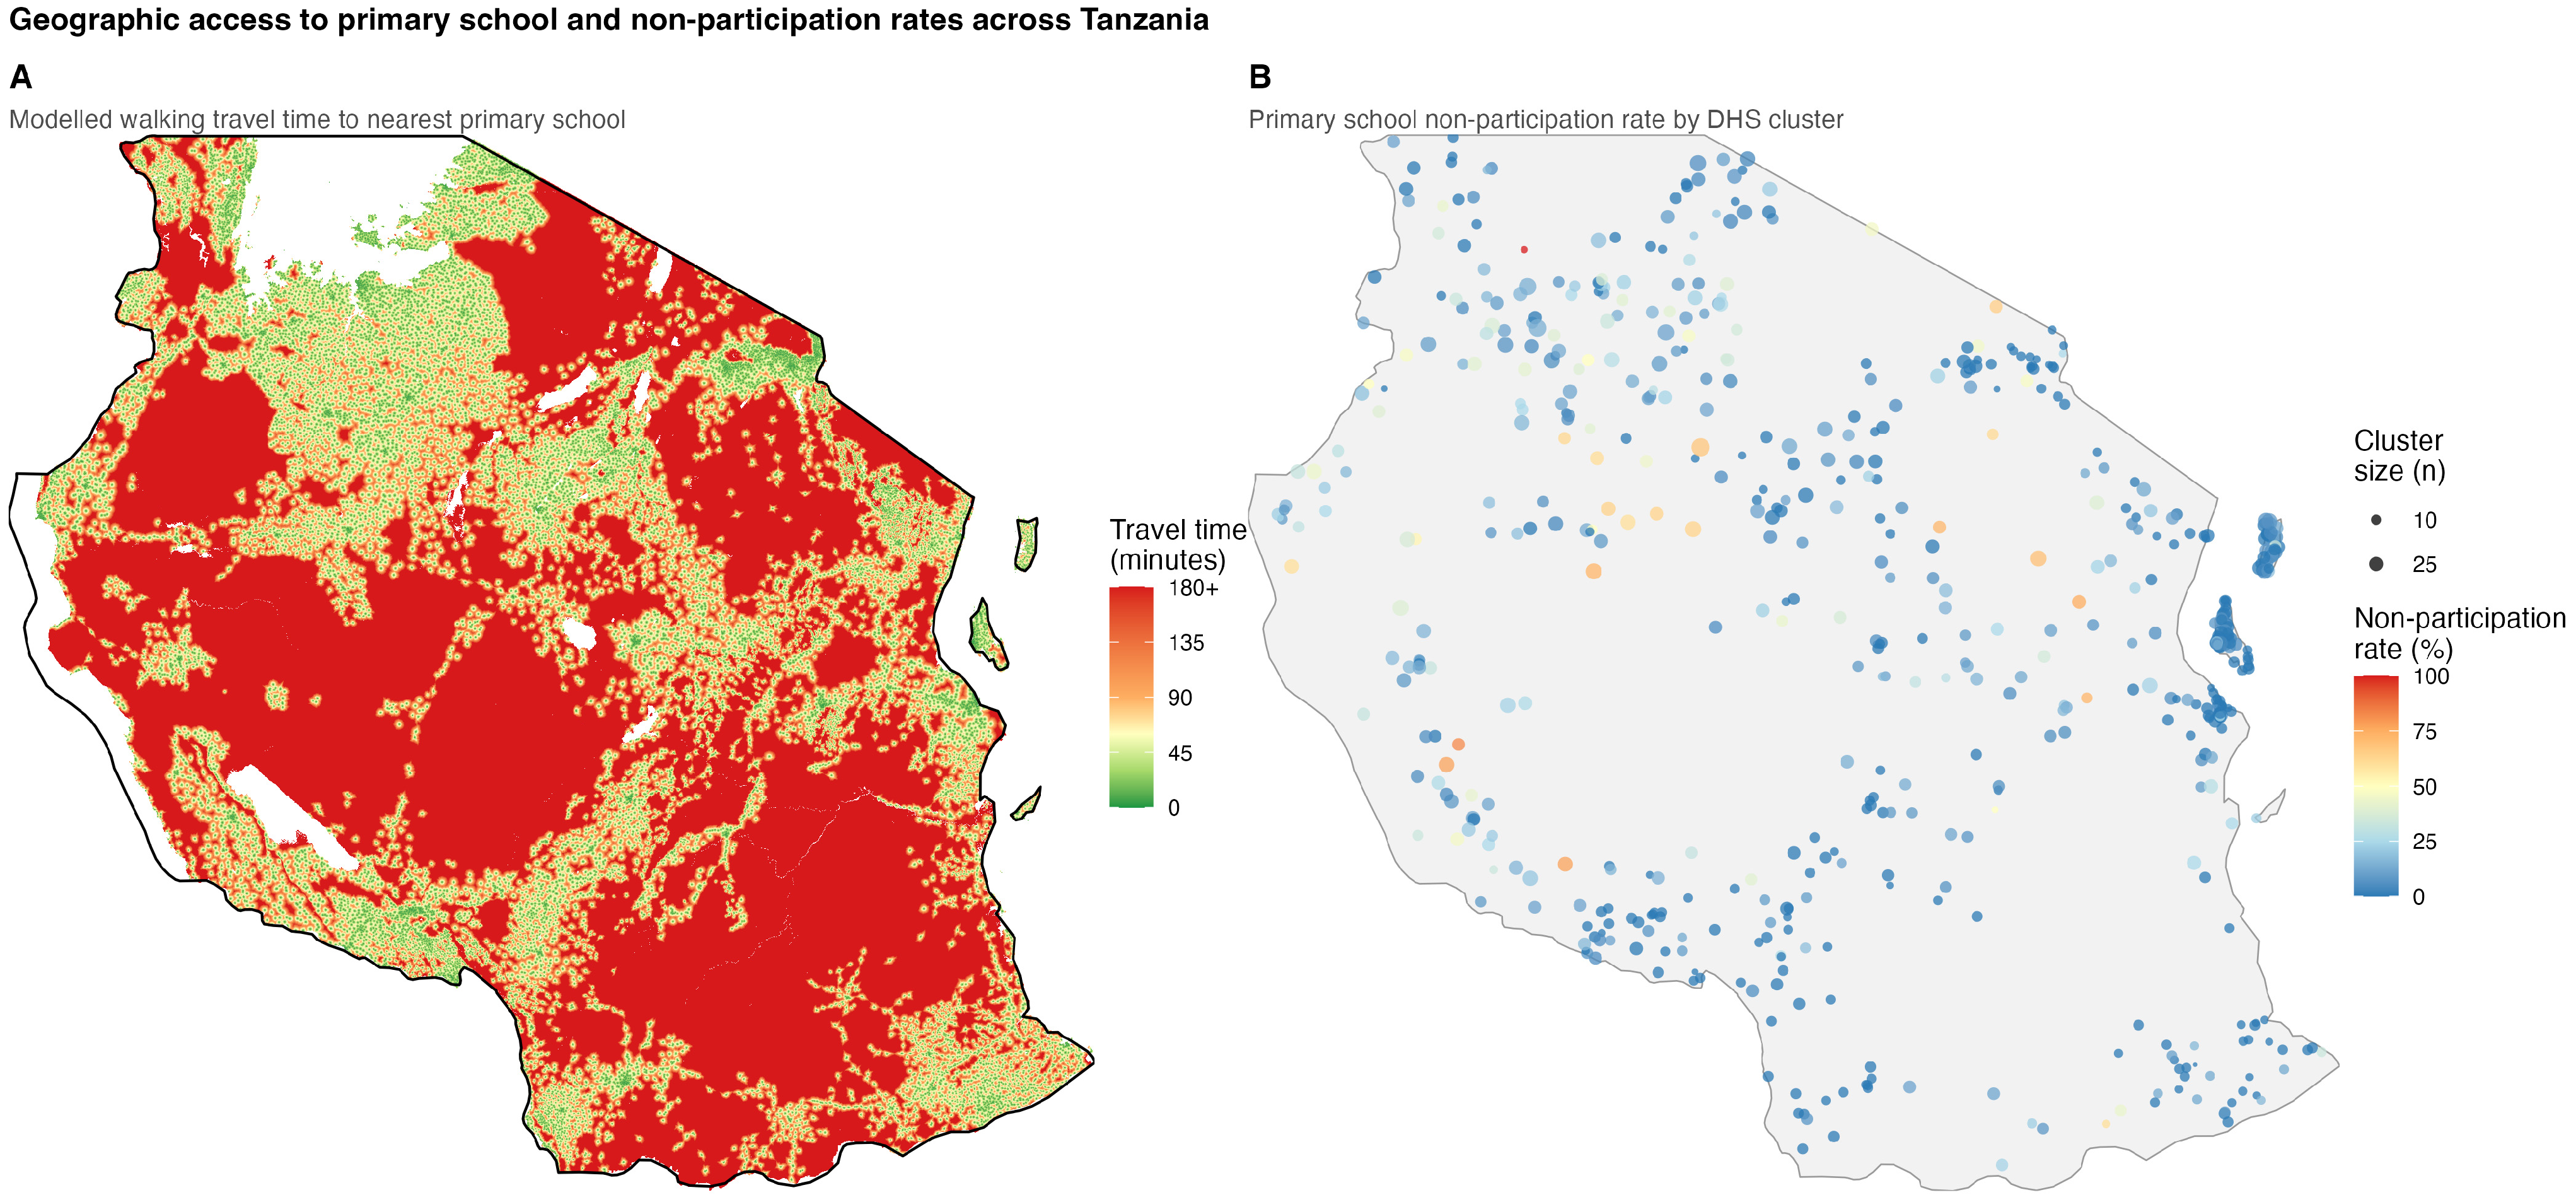
The primary school-age sample comprised 9213 children aged 7–13 across 623 DHS clusters. We only considered children 7 and over in the primary school-age attendance analysis to ensure there were no children included who were 5 when the academic year had started but were 6 by the time the survey was conducted and would therefore be erroneously included as having never attended school. Overall, 13.4% of children had not attended school in the survey school year. The gender split was even, as 50.5% of the sample were girls and 73.0% resided in rural areas. Mean walking travel time to the nearest primary school was 48.3 min (median 33.5 min), and 37.8% of children faced poor geographic access (>45 min) (Figure 1). Unadjusted non-participation was more than twice as high among children with poor access (19.9%) as among those with good access (9.4%).
Figure 1.
Modelled walking travel time to the nearest primary school (A) and the primary school-age non-participation rate for each of the 623 DHS clusters from the 2022 Tanzania DHS (B). Source: DHS Tanzania 2022, Travel time modelled using CPAS [24]. Non-participation = child aged 7–13 who has never attended school.
The secondary school-age sample comprised 2585 adolescents aged 14–19 across 560 clusters. Non-participation (34.7%) was substantially higher than at the primary level, as was exposure to poor geographic access, as 59.9% of adolescents lived more than a 60 min walk from the nearest school. The sample had 44.8% female; 71.3% rural; a mean travel time of 142.1 min and a median of 80.6 min. Secondary school-age adolescents therefore faced both lower geographic access and higher non-participation than primary school-age children.
3.2. Community-Level Clustering and Model Specifications
For the primary school-age cohort, the intra-class correlation coefficient from the null multilevel model was 26.9%, indicating that over a quarter of the total variance in non-participation was attributable to the community in which a child lived; a multilevel specification was therefore adopted. In the fully adjusted model, the ICC fell to 14.6%, indicating that the measured child and household characteristics explained 45.7% of community-level variance; the remainder reflects unmeasured community factors such as school quality, teacher availability and local attitudes towards education. For the secondary cohort, the null-model ICC was 1.5%, well below the conventional 5–10% range justifying multilevel modelling. Therefore, a single-level modified Poisson regression with cluster-robust standard errors was used, with the multilevel model retained as a sensitivity analysis. The eighteen-fold difference in ICC between primary and secondary cohorts indicates that place-based, community-level influences on school participation operate almost entirely during the primary school years (Figure S4).
3.3. Primary School-Age Analysis
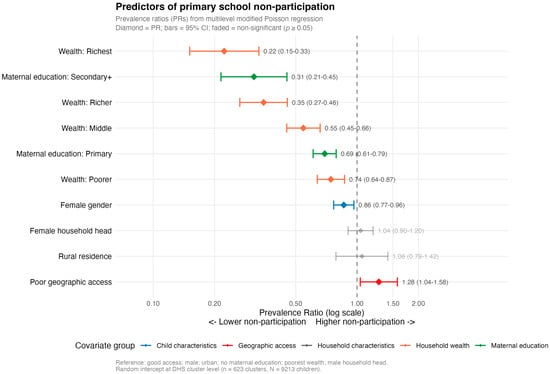
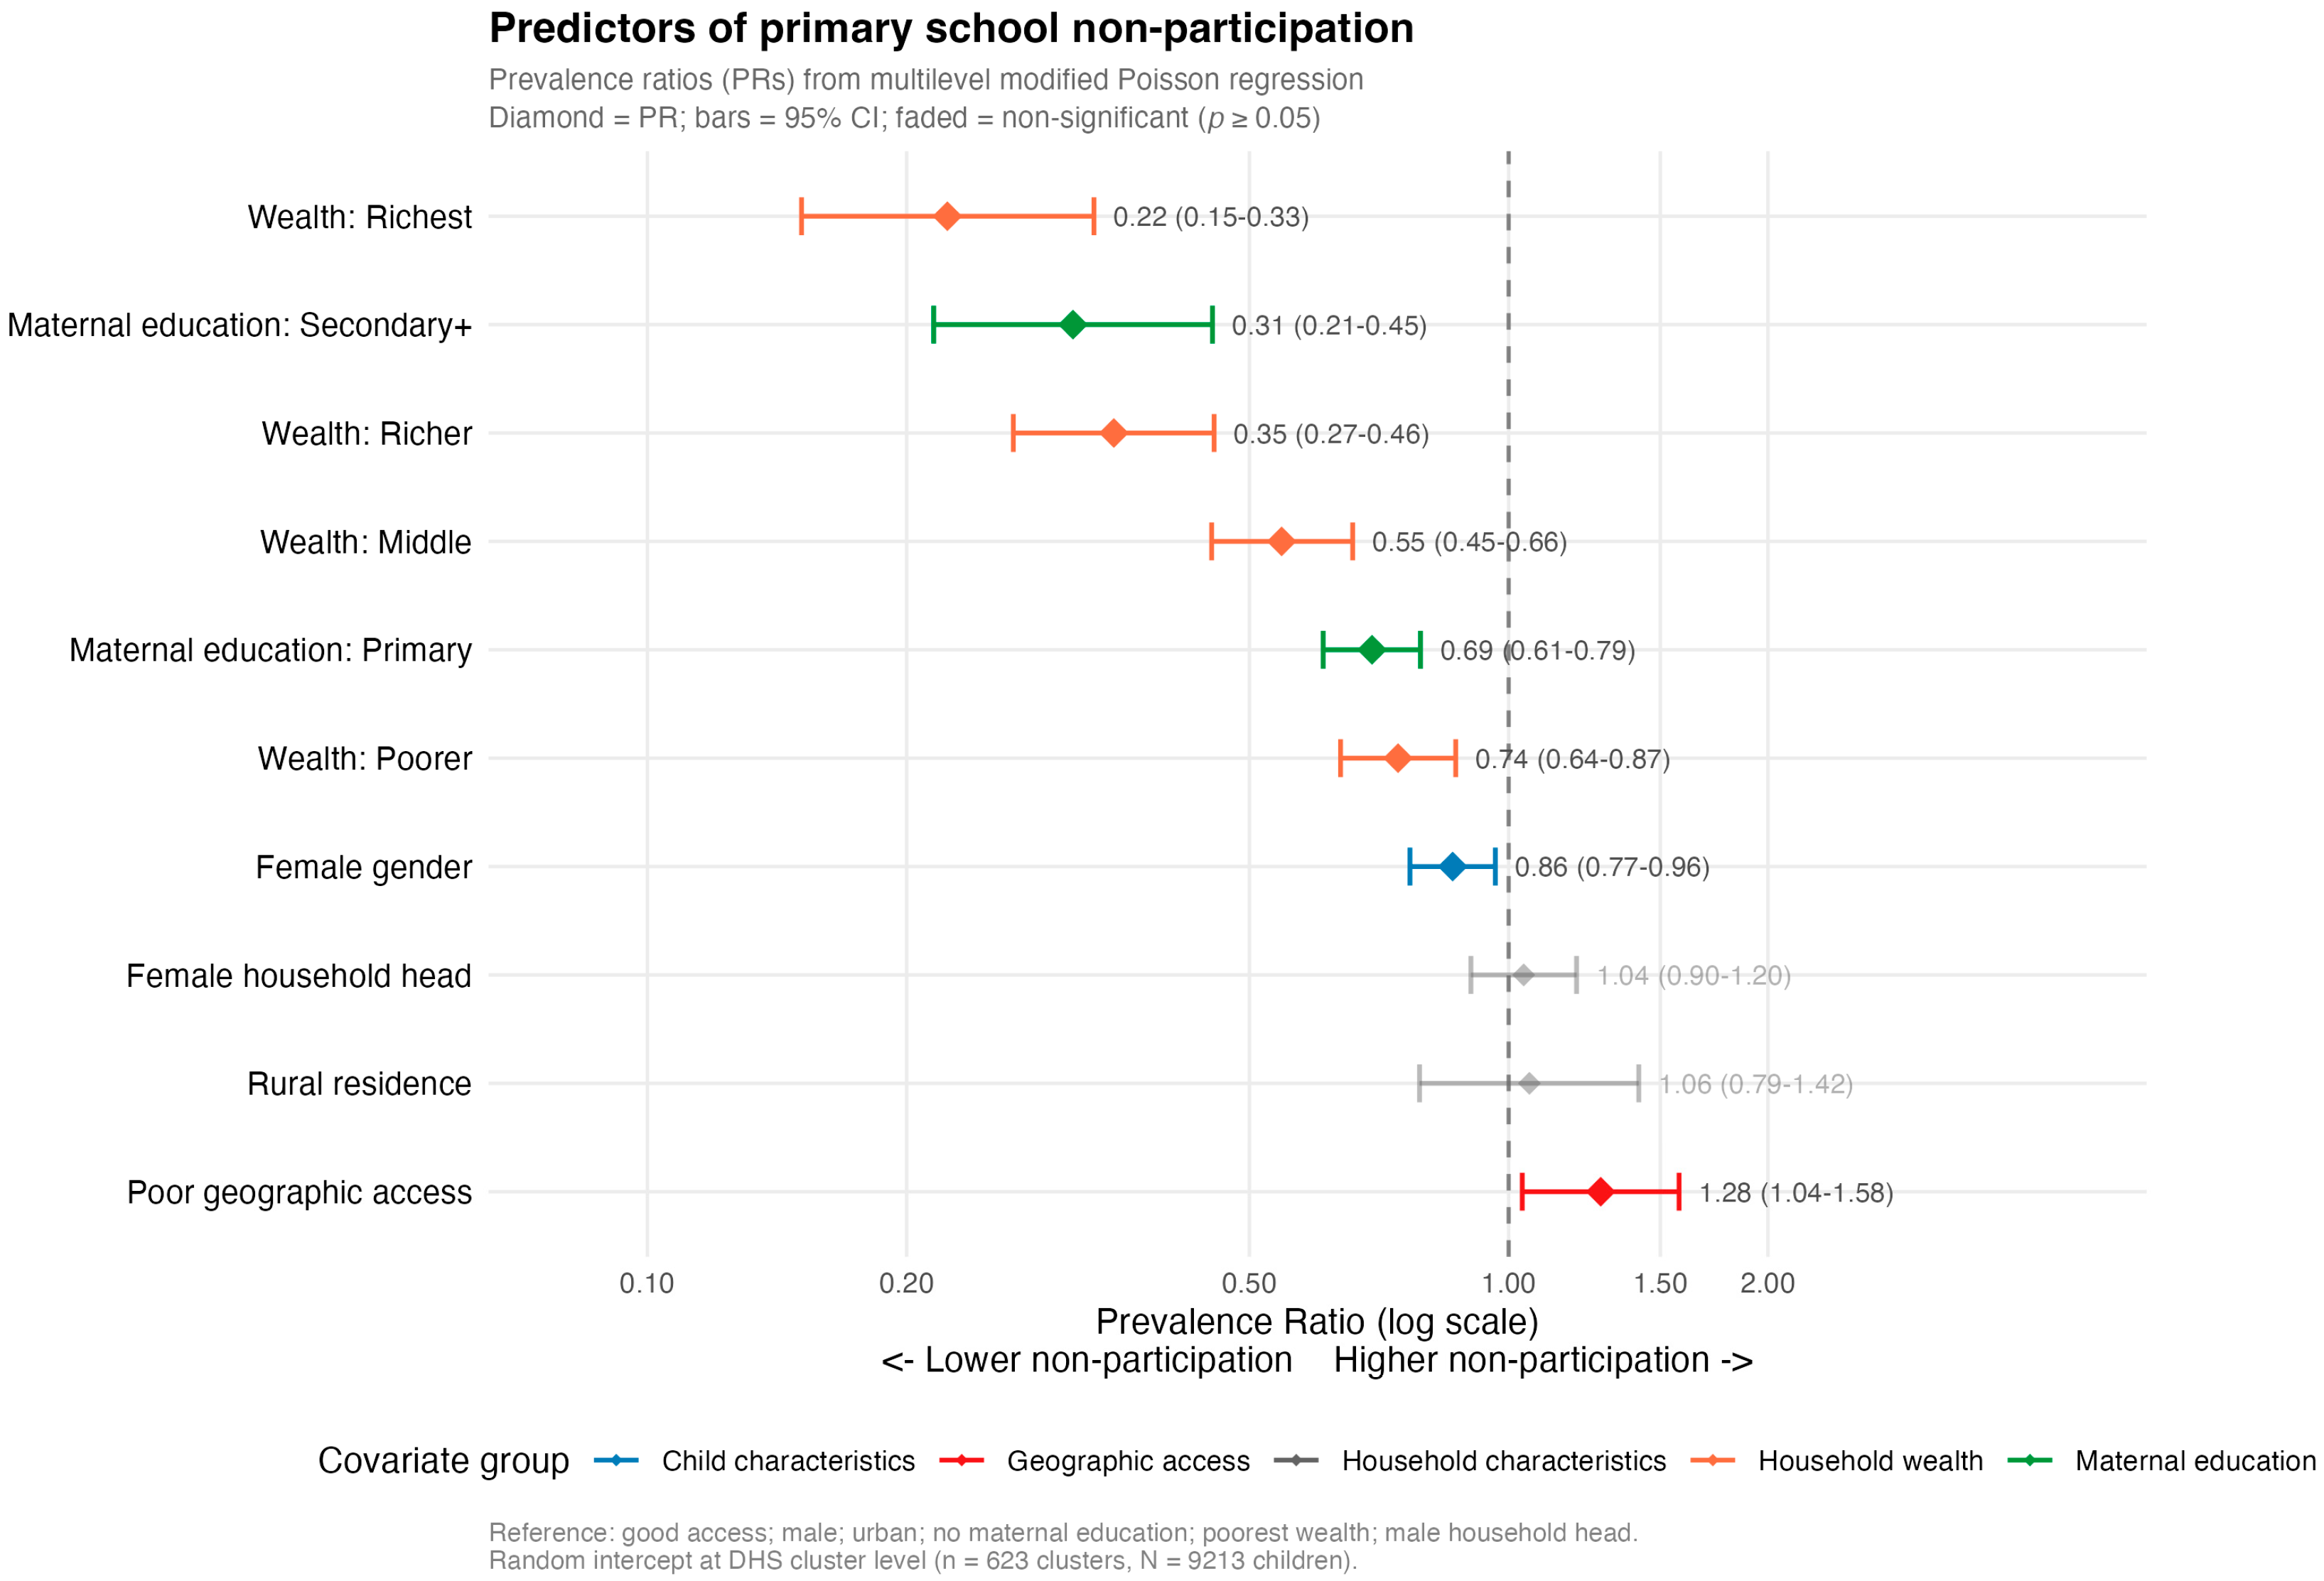
In the adjusted multilevel model, poor geographic access was associated with a 27.9% higher prevalence of non-participation (PR = 1.279, 95% CI: 1.037–1.577, p = 0.021) (Table 4; Figure 2). The household wealth appeared to have a protective response for school participation, as prevalence ratios were stronger for wealthier households compared to the poorest households. Prevalence ratios were 0.744 (0.638–0.868) for the poorer, 0.545 (0.452–0.659) for the middle, 0.348 (0.266–0.455) for the richer and 0.223 (0.151–0.330) for the richest quintile (Figure 2). Higher levels of maternal education also had a protective impact on participation in school, with PRs of 0.694 (0.609–0.790) for primary and 0.312 (0.215–0.453) for secondary or higher education relative to no education, indicating that non-participation for the primary school-age cohort was less likely with higher levels of maternal education. Girls had lower non-participation than boys (PR = 0.861, 95% CI: 0.768–0.965, p = 0.010). Neither rural residence (PR = 1.057, p = 0.712) nor female household headship (PR = 1.041, p = 0.577) was associated with non-participation after adjustment.
Table 4.
The prevalence ratios of predictors of primary school-age non-participation in Tanzania. The poorest group was specified as the reference category, and coefficients for the remaining four groups are interpreted relative to this group.
Figure 2.
Predictors of primary school-age nonparticipation forest plot. Orange represents household wealth, green represents maternal education, blue represents child characteristics, and red represents geographic access. The greyed-out lines are non-significant predictors. The poorest group was specified as the reference category, and coefficients for the remaining four groups are interpreted relative to this group. Dashed vertical line shows no effect.
Interaction terms between poor access and household wealth (χ2 = 1.33, df = 4, p = 0.856) and between poor access and maternal education (χ2 = 1.01, df = 2, p = 0.604) did not significantly improve model fit (Table S4), indicating that the association between geographic access and non-participation was consistent across socioeconomic strata.
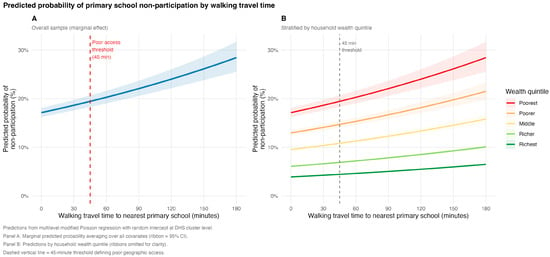
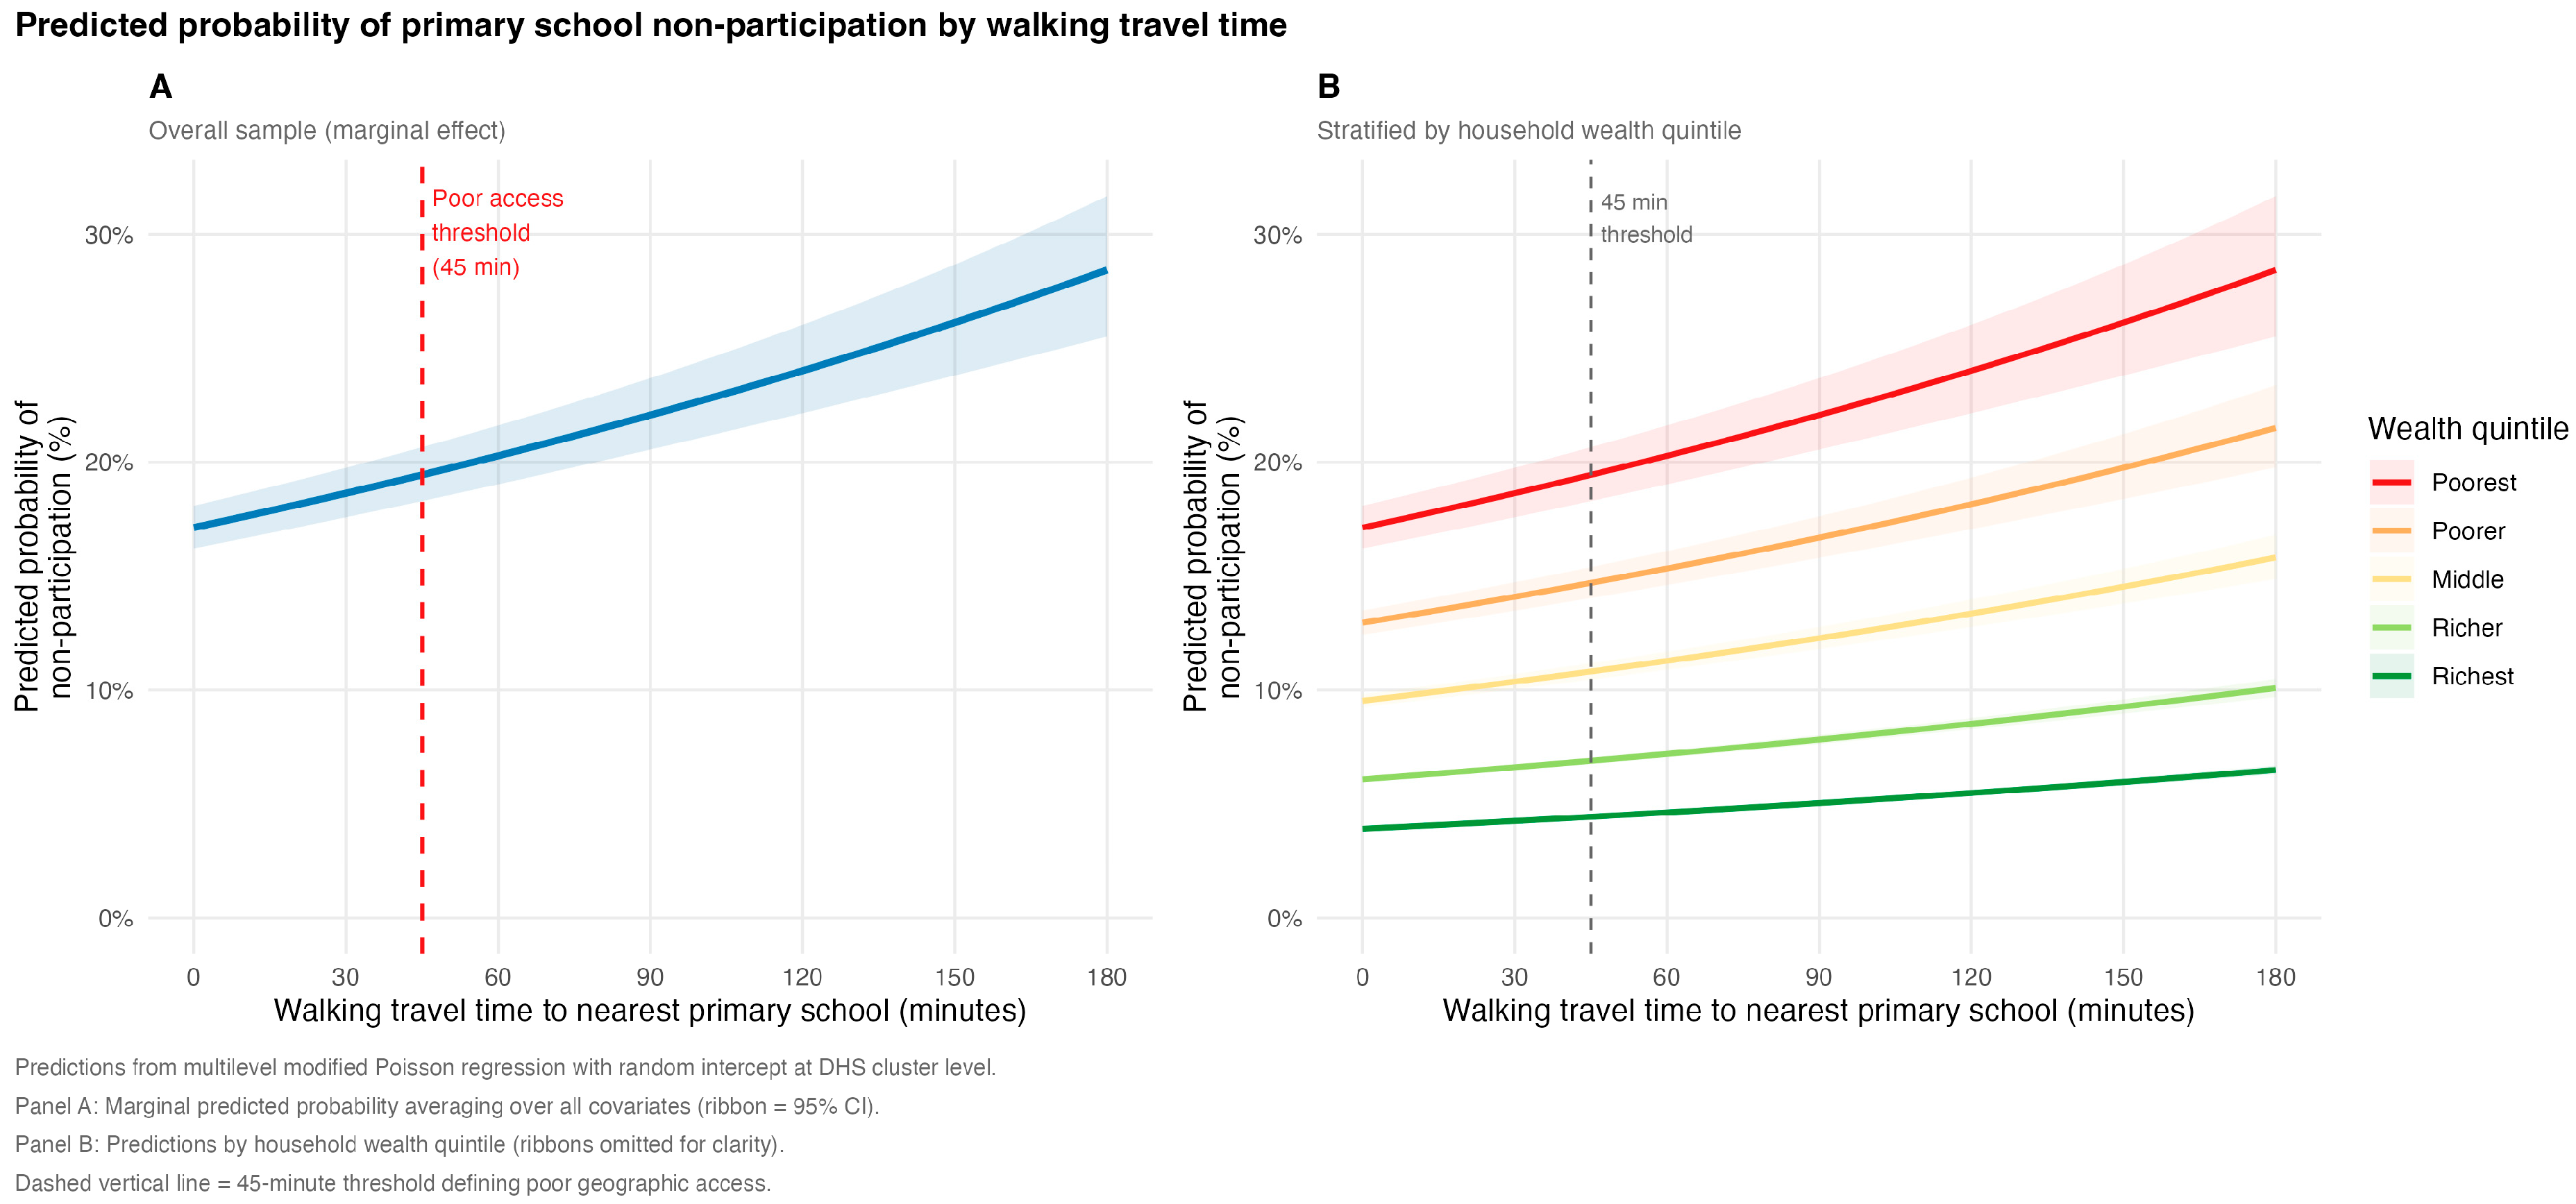
Modelled continuously, each additional 10 min of walking travel time was associated with a 2.9% higher prevalence of non-participation (PR = 1.029, 95% CI: 1.013–1.045, p < 0.001), equivalent to approximately 18% per additional hour, with a monotonic gradient across the observed range of travel times (Figure 3). Estimates were robust to alternative model specifications: the association between poor access and non-participation persisted in a single-level model with cluster-robust standard errors (PR = 1.349, 95% CI: 1.107–1.645) and in a survey-weighted quasi-Poisson model accounting for the DHS sampling design (PR = 1.263, 95% CI: 1.020–1.563) (Table S2).
Figure 3.
Predicted probability of primary school-age non-participation by continuous walking time considering all children (A) and stratified by household wealth (B). Shows that the probability of non-participation is higher in all groups when travel times are larger. The increase in probability is also affected by household wealth, as demonstrated in (B), where the increase in non-participation is larger when considering longer travel times in poorer households compared to wealthier households.
3.4. Secondary School-Age Analysis
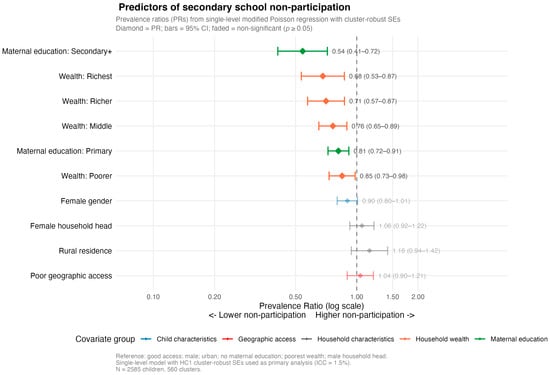
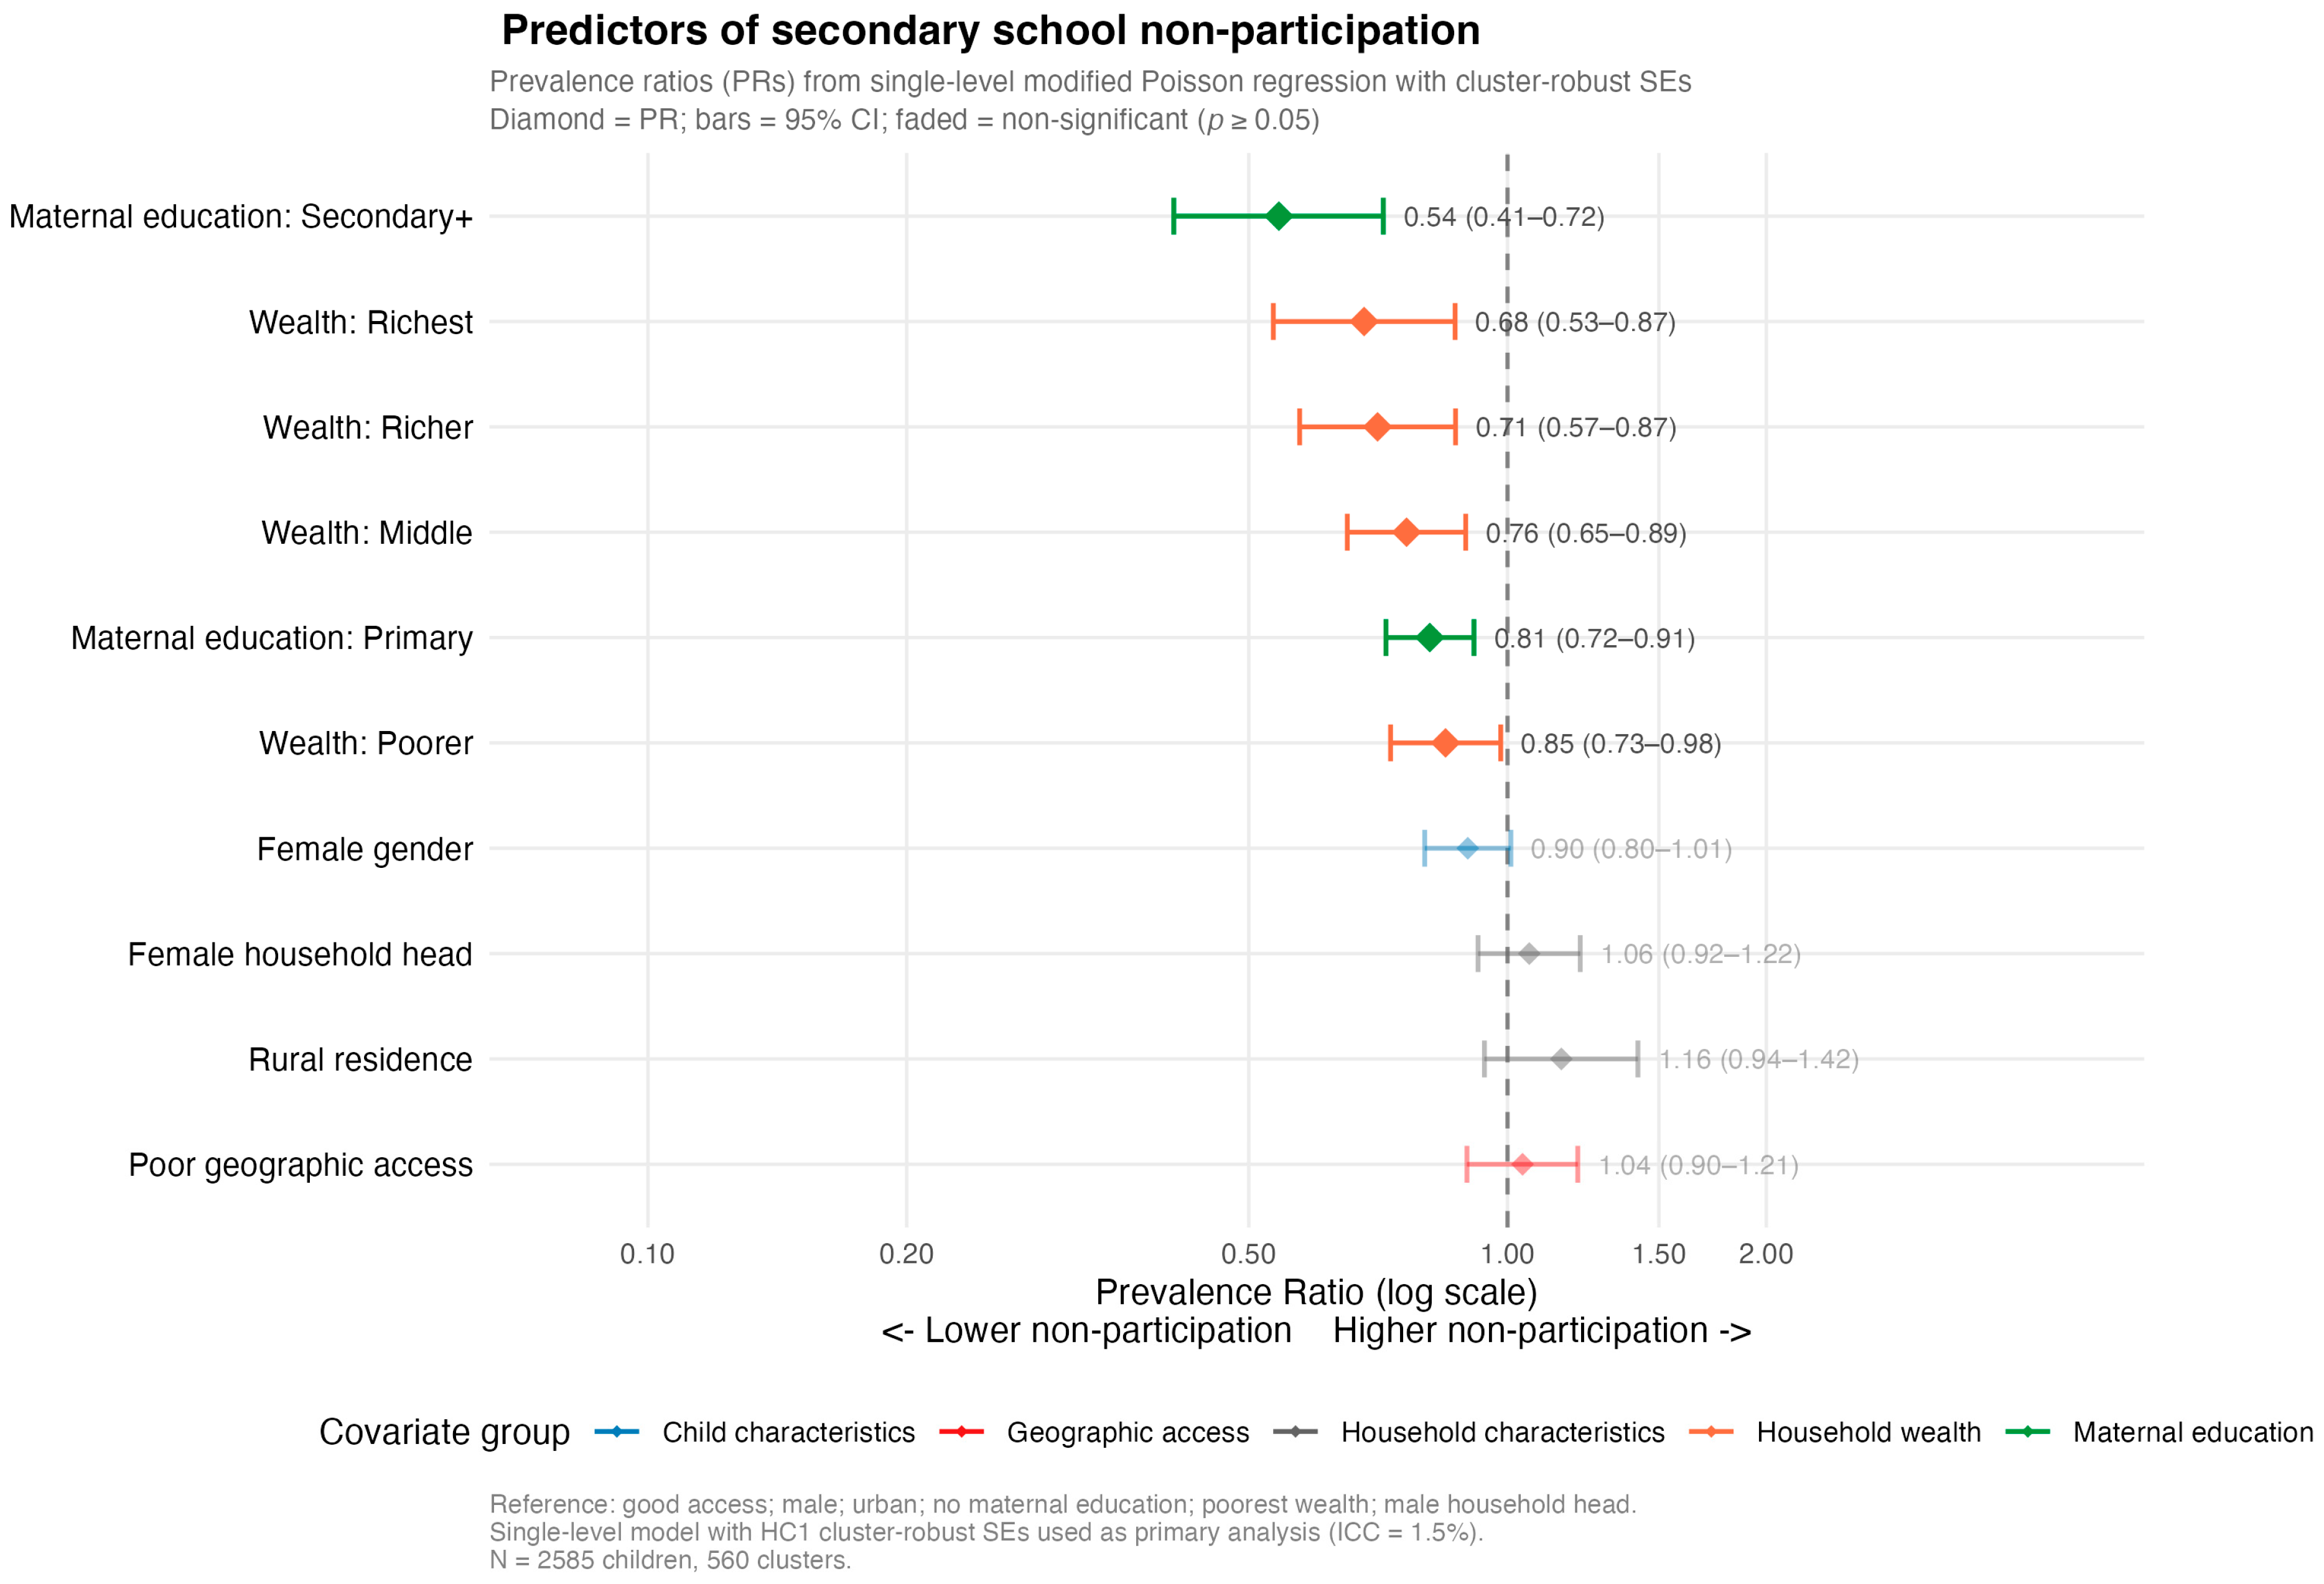
Among adolescents aged 14–19, poor geographic access was not associated with non-participation after adjustment (PR = 1.041, 95% CI: 0.897–1.207, p = 0.600) (Table 5, Figure 4). Household wealth and maternal education remained significant predictors, though with smaller levels than at primary. PRs for the poorer to richest wealth quintiles were 0.847 (0.731–0.982), 0.763 (0.651–0.894), 0.706 (0.573–0.870) and 0.681 (0.534–0.869) respectively, and for primary and secondary-or-higher maternal education 0.812 (0.722–0.914) and 0.542 (0.409–0.717), respectively. The lower non-participation observed among girls of primary school-age was weaker and non-significant amongst the older cohort (PR = 0.899, 95% CI: 0.801–1.009, p = 0.070). Neither interaction model significantly improved model fit (poor access × wealth: χ2 = 1.85, df = 4, p = 0.763; poor access × maternal education: χ2 = 4.78, df = 2, p = 0.092; Table S4), and therefore the main-effects model was retained.
Table 5.
The prevalence ratios of predictors of secondary school-age non-participation in Tanzania. The poorest group was specified as the reference category, and coefficients for the remaining four groups are interpreted relative to this group.
Figure 4.
Predictors of secondary school-age non-participation forest plot. Orange represents household wealth, green represents maternal education, blue represents child characteristics, and red represents geographic access. The greyed-out lines are non-significant predictors.
Modelled continuously, travel time showed no association with secondary school-age non-participation (PR = 1.002 per 10 min, 95% CI: 0.998–1.006, p = 0.350), indicating that the null finding was not an artefact of the 60 min threshold (Figure S3). Results were unchanged in the multilevel (PR = 1.041, 95% CI: 0.888–1.219) and survey-weighted (PR = 1.050, 95% CI: 0.883–1.249) sensitivity specifications (Table S3).
4. Discussion
This study examined the association between walking travel time to the nearest school facility and primary and secondary school-age non-participation in Tanzania, using high-resolution travel time estimates linked to nationally representative DHS household survey data. The multilevel modified Poisson regression results indicate that geographic access was a significant predictor of primary school-age non-participation, as children with poor access (over 45 min walk from nearest school) had a 27.9% higher prevalence of non-participation compared to those living within 45 min of the nearest school. A divergence in intra-class correlation coefficients between the primary and secondary school-age analyses (26.9% vs. 1.5%) revealed that community-level geographic factors operate primarily during primary school years, with secondary-age non-participation driven by individual and household characteristics. The effect of poor access on primary school-age non-participation was consistent across wealth quintiles and maternal education groups, confirming that geographic access is a universal barrier rather than one concentrated among the most disadvantaged households.
The framework used to calculate travel time [24] provided several advantages over previous travel time models used in similar research. The 100-metre spatial resolution preserves road sinuosity more accurately than 1 km resolution approaches such as Weiss et al. (2020) [23], which are known to underestimate travel times by overrepresenting road coverage in coarser grid cells [24]. The incorporation of AI-derived road data from the MapWith.AI project supplements OpenStreetMap’s incomplete road coverage in rural Tanzania, and the application of child-adjusted walking speeds—reduced by 22% to account for the presence of accompanying children [60] produces travel time estimates that are more valid for the study population than those derived from adult walking speeds. The 26.9% null model ICC was high and underscores the geographic concentration of educational disadvantage in Tanzania. Even after adjustment for individual and household-level covariates (including wealth, maternal education, and access), 14.6% of variance remained at the community level, implying that unmeasured community factors such as local school quality, teacher attendance, school infrastructure, and community norms [72,73] around education continue to generate geographic inequalities in attendance and participation beyond those captured by physical access alone. The 45.7% of community-level variance explained by the included covariates suggests that the combination of geographic access, wealth, and maternal education captured a substantial share of the place-based drivers of primary school-age non-attendance.
4.1. Secondary School-Age Non-Participation
The absence of a significant geographic access effect amongst the secondary school-age cohort, combined with the very low ICC (1.5%), indicates different determinants for older children compared to primary school-age non-participation. Where primary non-participation appeared to be substantially shaped by geographic and community-level factors, secondary non-participation appeared to be more associated with individual and household socioeconomic circumstances. This difference in our models could be considered indicative of the broader literature on educational transitions in sub-Saharan Africa. The primary-to-secondary transition could be a critical juncture at which point economic barriers, including school fees, uniform and material costs, and the opportunity cost of continued schooling, become important factors in determining participation and attendance [74].
The shallower wealth gradient for secondary school-age children (richest vs. poorest PR = 0.681 compared to 0.223 at primary) suggests that while wealth remains a significant predictor of secondary non-participation, the smaller magnitude may indicate that secondary non-participation affects a broader cross-section of Tanzanian households than primary non-participation. Structural barriers beyond household poverty, including the geographic concentration of secondary schools in urban areas, early marriage among adolescent girls, child labour, and the perceived returns to secondary education relative to its costs, may create more pressures on secondary school attendance across wealth groups [8]. This interpretation is supported by the finding that rural residence, non-significant at both levels, loses any independent explanatory value once wealth and access are controlled for, suggesting that the rural penalty in secondary participation is primarily a socioeconomic rather than a geographic phenomenon.
The singular fit of the secondary school-age multilevel model, in which the cluster-level random intercept variance converges to near-zero after covariate adjustment, validated the decision to use a single-level model as the primary specification for the secondary cohort. This result confirms that once household-level characteristics are accounted for, children within the same community are no more similar in their school attendance outcomes than children from different communities.
4.2. Socioeconomic Predictors
Household wealth was the strongest predictor of primary school-age non-participation in the adjusted model, with a clear gradient across all five wealth quintiles and the richest children having a 77.7% lower prevalence of non-participation than the poorest (PR = 0.223). This finding replicates well-established evidence from DHS-based studies across sub-Saharan Africa [75,76] and underscores the extent to which educational deprivation in Tanzania is concentrated in the poorest households. The gradient is also present at secondary level (31.9% lower prevalence for the wealthiest group, PR = 0.681) and is consistent with the view that primary school-age non-participation is more strongly determined by acute material deprivation (the direct costs and opportunity costs of sending a young child to school), while secondary non-participation is shaped by a broader range of structural and social factors that operate more uniformly across wealth groups.
Maternal education was a key protective factor for participation, as even in areas with limited physical access, children whose mothers had completed primary or secondary education were significantly less likely to be deprived of school participation. This aligns with past studies that point to the importance of mothers’ education for the child’s educational access and completion [77,78]. The protective effect of maternal education, whereby children of mothers with secondary or higher education had a 68.8% lower prevalence of primary non-participation (PR = 0.312) and a 45.8% lower prevalence of secondary non-participation (PR = 0.542), highlights the intergenerational transmission of educational advantage in Tanzania. The persistence of this effect after adjustment for household wealth suggests that maternal education confers benefits beyond income, including greater awareness of the returns to schooling, stronger advocacy for children’s education within the household, and more effective navigation of school enrolment processes that are not fully captured by the DHS wealth index. These findings strengthen the case for investment in girls’ education as a long-term strategy for breaking intergenerational cycles of educational deprivation.
Maternal education did not modify the effect of geographic access on primary school-age non-participation, as the interaction term was non-significant (p = 0.604). This means that even among children of highly educated mothers, poor geographic access remained a barrier to primary school-age attendance. This finding reinforces the interpretation that geographic infrastructure appears to be an important constraint that can be difficult to overcome through household-level human capital alone, further supporting the case for supply-side interventions.
4.3. Gender and School Attendance
The finding that girls had significantly lower prevalence of primary school-age non-participation than boys (PR = 0.861, p = 0.010), with a similar pattern at secondary level (PR = 0.899, p = 0.070), is counterintuitive in the context of the broader sub-Saharan African literature, which has historically seen greater female educational disadvantage [79,80]. Several explanations should be explored further. First, Tanzania has made substantial investments in gender parity in education over the past two decades, including the abolition of primary school fees, re-enrolment policies for pregnant girls, and school feeding programmes that benefit girls in rural areas. Second, there may be selection effects at work: boys who have dropped out of school to enter agricultural or informal labour markets may be more likely to remain in the household and be captured in the DHS roster, whereas girls who have dropped out may be more likely to have married and left the parental household, making them less likely to be included in the analytic sample.
4.4. Limitations
The travel time surfaces in this study were static and did not account for seasonal disruptions such as flooding, drought, or extreme heat, which can significantly affect school access. Future work could improve temporal realism by incorporating dynamic environmental layers (e.g., rainfall or flood forecasts from Digital Earth Africa) and triangulating survey data with more frequently updated administrative sources (school attendance records). This would enable more responsive modelling of accessibility barriers and support timely education planning, particularly in areas vulnerable to climate-related disruptions. Realism could also be increased through considering different transportation options for secondary children. The binary poor access variable imposes a threshold that may not fully capture the continuous relationship between travel time and non-participation. The continuous travel time models presented alongside the main analysis suggest a linear association, though non-linear relationships cannot be excluded. The exclusion of children without a matched maternal record introduces potential selection bias if children whose mothers are absent from the household differ systematically from those whose mothers are present in ways related to both access and attendance. The inclusion of a further category in the response detailing those children who had attended at some point in the year but had since stopped attending would have provided further information, but this was not available from the DHS in Tanzania.
5. Conclusions
Educational deprivation carries economic and social costs throughout life as each additional year of schooling increases lifetime earnings by up to 10%. There are many complex reasons why children do not enrol in school, continue to attend or fail to complete school, and access to good-quality school education is a focus of SDG 4.1. This study demonstrates that geographic access to school is a significant and robust predictor of primary school-age non-participation in Tanzania, with children living more than 45 min from the nearest school having a 27.9% higher prevalence of non-participation after full socioeconomic adjustment. This effect indicates a strong association between travel time and wealth quintiles and maternal education groups. At secondary level, geographic access does not independently predict non-participation, with attendance instead associated with household wealth and maternal education. The divergence in community-level clustering between the two cohorts potentially indicates a fundamental transition in the drivers of educational disadvantage between primary and secondary school-age in Tanzania from geographic and community-level barriers to household-level socioeconomic constraints. These findings provide an evidence base for geographically targeted school infrastructure investment at the primary level and socioeconomically targeted demand-side interventions at the secondary level in Tanzania.
Supplementary Materials
The following supporting information can be downloaded at: https://www.mdpi.com/article/10.3390/ijgi15090384/s1, Text S1. School location data harmonisation and validation; Text S2. Investigation of border-related anomalies; Text S3. DHS cluster relocation procedure; Text S4. Outcome variable availability in the 2022 Tanzania DHS; Text S5. Sensitivity analyses and model diagnostics; Figure S1. examples of fragmented school records within a single campus (a) “Shule ya Msingi Muranda A” and “B” (b) “Shule ya Msingi Nyakato A/B/C” represents split records of a single institution. Full Overpass QL Query for School Data Extraction DBSCAN Clustering Algorithm Implementation; Figure S2. Illustration of the DHS cluster relocation strategy used to correct spatial displacement of the original DHS cluster points overlaid on GRID3 settlement extents which are purple areas in the images (a). Those clusters that were not overlaying a GRID3 settlement were snapped to the nearest settlement pixel (b). If no settlement pixel was nearby then clusters were snapped to the nearest road intersection (c) which replicates how the DHS field teams often define the location for the GPS collection; Figure S3 predicted probability of secondary school non-participation by walking travel time; Figure S4 intraclass correlation coefficients by school cohort. Supplementary Code: R Analysis Script;Table S1. Statistics on the relocations of DHS cluster points by district; Table S2. Primary cohort (aged 7–13): comparison of prevalence ratios across model specifications; Table S3. Secondary cohort (aged 14–19): comparison of prevalence ratios across model specifications; Table S4. Likelihood ratio tests for pre-specified interactions with poor geographic access; Table S5. Exploratory analysis: prevalence ratio for poor geographic access within maternal education strata, secondary cohort.
Author Contributions
Conceptualization, Farhiya Jarso and Gary R. Watmough; Methodology, Farhiya Jarso, William C. Smith and Gary R. Watmough; Validation, Farhiya Jarso, William C. Smith and Gary R. Watmough; Formal analysis, Farhiya Jarso and Gary R. Watmough; Investigation, Farhiya Jarso, William C. Smith and Gary R. Watmough; Resources, Gary R. Watmough; Data curation, Farhiya Jarso; Writing—original draft, Farhiya Jarso and Gary R. Watmough; Writing—review & editing, William C. Smith and Gary R. Watmough; Visualization, Gary R. Watmough; Supervision, Gary R. Watmough; Project administration, Gary R. Watmough. All authors have read and agreed to the published version of the manuscript.
Funding
Farhiya Jarso was supported by a Commonwealth Scholarship for MSc studies at the University of Edinburgh, funded by the UK Foreign, Commonwealth and Development Office (FCDO) and administered by the Commonwealth Scholarship Commission in the UK.
Data Availability Statement
The travel time estimations are provided for both primary and secondary schools as GeoTiff files. The datasets used for creating these travel time surfaces are available in open repositories and cannot be shared by the authors due to data use agreements. However, we share in the Supplementary Information the r code we used for each section of the analysis so that others can replicate our work. The datasets include Administrative Boundaries, the SRTM DEM, Tanzania Standard DHS for 2022, ESA WorldCover LandCover Data, HOTOSM Roads from Humanitarian Data Exchange, and WorldPop school-age population rasters km: https://hub.worldpop.org/geodata/summary?id=50633 (accessed on 3 April 2026).
Conflicts of Interest
The authors declare no conflicts of interest.
Abbreviations
The following abbreviations are used in this manuscript:
| CPAS | Child Poverty Access to Services |
| DEM | Digital Elevation Model |
| ESA | European Space Agency |
| SDG | Sustainable Development Goals |
| WASH | water, sanitation and hygiene |
| DHS | Demographic Health Survey |
| DBSCAN | Density-Based Spatial Clustering of Applications with Noise |
| OSM | Open Street Map |
| HOTOSM | Humanitarian Open Street Map |
| MoE | Ministry of Education |
| SCMS | School Construction and Maintenance Strategy |
| OR | Odds Ratio |
| CI | Confidence Interval |
| EAC | East African Community |
References
- Friedman, J.; York, H.; Graetz, N.; Woyczynski, L.; Whisnant, J.; Hay, S.I.; Gakidou, E. Measuring and forecasting progress towards the education-related SDG targets. Nature 2020, 580, 636–639. [Google Scholar] [CrossRef] [Scilit]
- Psacharopoulos, G.; Patrinos, H.A. Returns to investment in education: A decennial review of the global literature. Educ. Econ. 2018, 26, 445–458. [Google Scholar] [CrossRef] [Scilit]
- UNESCO. Out-of-School-Rate. 2026. Available online: https://www.unesco.org/en/education/view/outofschool (accessed on 1 June 2026).
- Graetz, N.; Friedman, J.; Osgood-Zimmerman, A.; Burstein, R.; Biehl, M.H.; Shields, C.; Mosser, J.F.; Casey, D.C.; Deshpande, A.; Earl, L.; et al. Mapping local variation in educational attainment across Africa. Nature 2018, 555, 48–53. [Google Scholar] [CrossRef] [Scilit]
- Glewwe, P.W.; Hanushek, E.A.; Humpage, S.D.; Ravina, R. School Resources and Educational Outcomes in Developing Countries: A Review of the Literature from 1990 to 2010; NBER working paper 17554; National Bureau of Economic Research: Cambridge, MA, USA, 2011. [Google Scholar]
- Bashir, S.; Lockheed, M.; Ninan, E.; Tan, J.-P. Facing Forward: Schooling for Learning in Africa; World Bank: Washington, DC, USA, 2018. [Google Scholar] [CrossRef] [Scilit]
- Evans, D.K.; Acosta, A.M. Education in Africa: What are we learning? J. Afr. Econ. 2020, 30, 13–54. [Google Scholar] [CrossRef] [Scilit]
- Smith, W.C.; Gallagher, M.; Reynolds, A.; Aktas, F.; Shephard, D.; Matsui, R.; Austin, S.; Goldstein, E.; Riano, J.S.; Zhang, L.; et al. Access and Completion in Primary and Secondary Education: A Global Systematic Review. Document Prepared for the 2026 Global Education Monitoring Report: Access and Equity: Countdown to 2030. UNESCO. 2026. Available online: https://unesdoc.unesco.org/ark:/48223/pf0000397619 (accessed on 10 August 2026).
- Macharia, P.M.; Moturi, A.K.; Mumo, E.; Giorgi, E.; Okiro, E.A.; Snow, R.W.; Ray, N. Modelling geographic access and school catchment areas across public primary schools to support subnational planning in Kenya. Child. Geogr. 2022, 21, 832–848. [Google Scholar] [CrossRef] [Scilit]
- Guijarro-Garvi, M.; Miranda-Escolar, B.; Cedeño-Menéndez, Y.T.; Moyano-Pesquera, P.B. Does geographical location impact educational disparities among Ecuadorians? A novel two-stage inequality decomposition method. Humanit. Soc. Sci. Commun. 2024, 11, 1539. [Google Scholar] [CrossRef] [Scilit]
- Lewin, K.M. Access to education in sub-Saharan Africa: Patterns, problems and possibilities. Comp. Educ. 2009, 45, 151–174. [Google Scholar] [CrossRef] [Scilit]
- Afoakwah, C.; Koomson, I. How does school travel time impact children’s learning outcomes in a developing country? Rev. Econ. Househ. 2021, 19, 1077–1097. [Google Scholar] [CrossRef] [Scilit]
- Solomon, S.; Zeitlin, A. What do Tanzanian Parents want from primary schools? And what can be done about it? RISE Insight 2019. [Google Scholar] [CrossRef] [Scilit]
- Alegana, V.A.; Pezzulo, C.; Tatem, A.J.; Omar, B.; Christensen, A. Mapping out-of-school adolescents and youths in low- and middle-income countries. Humanit. Soc. Sci. Commun. 2021, 8, 213. [Google Scholar] [CrossRef] [Scilit]
- Zeragaber, T.Y.; Teame, G.T.; Tsighe, Z. Assessing the effect of home-to-school distance on student dropout rate in Adi-Keyih sub-zone, Eritrea. Int. J. Educ. Res. Open 2024, 7, 100340. [Google Scholar] [CrossRef] [Scilit]
- Delprato, M.; Shephard, D. Climate Change and Its Impact on Education Completion Rates Across Four Sub-Saharan African Countries: A Non-Parametric Approach at the Community Level. Int. J. Educ. Dev. 2024, 110, 103129. [Google Scholar] [CrossRef] [Scilit]
- Niedzielski, M.A.; Boschmann, E.E. Travel Time and Distance as Relative Accessibility in the Journey to Work. Ann. Assoc. Am. Geogr. 2014, 104, 1156–1182. [Google Scholar] [CrossRef] [Scilit]
- Torres, J.R.V.; McArthur, D.P. Public Transport Accessibility Indicators to Urban and Regional Services in Great Britain. Sci. Data 2024, 11, 53. [Google Scholar] [CrossRef] [Scilit]
- Joppa, L.N.; Pfaff, A. High and Far: Biases in the Location of Protected Areas. PLoS ONE 2009, 4, e8273. [Google Scholar] [CrossRef] [Scilit]
- Lucas, K.; van Wee, B.; Maat, K. A method to evaluate equitable accessibility: Combining ethical theories and accessibility-based approaches. Transportation 2016, 43, 473–490. [Google Scholar] [CrossRef] [Scilit]
- Siiba, A. Active Travel to School: Understanding the Ghanaian Context of the Underlying Driving Factors and the Implications for Transport Planning. J. Transp. Health 2020, 18, 100869. [Google Scholar] [CrossRef] [Scilit]
- Noor, A.M.; A Amin, A.; Gething, P.W.; Atkinson, P.M.; I Hay, S.; Snow, R.W. Modelling Distances Travelled to Government Health Services in Kenya. Trop. Med. Int. Health 2006, 11, 188–196. [Google Scholar] [CrossRef] [Scilit]
- Weiss, D.J.; Nelson, A.; Vargas-Ruiz, C.A.; Gligorić, K.; Bavadekar, S.; Gabrilovich, E.; Bertozzi-Villa, A.; Rozier, J.; Gibson, H.S.; Shekel, T.; et al. Global maps of travel time to healthcare facilities. Nat. Med. 2020, 26, 1835–1838. [Google Scholar] [CrossRef] [Scilit]
- Watmough, G.R.; Hagdorn, M.; Brumhead, J.; Seth, S.; Delamónica, E.; Haddon, C.; Smith, W.C. Using open-source Data to Construct 20 Metre Resolution Maps of Children’s Travel Time to the Nearest Health Facility. Sci. Data 2022, 9, 217. [Google Scholar] [CrossRef] [Scilit]
- World Bank. Population Growth Tanzania. 2023. Available online: https://data.worldbank.org/indicator/SP.POP.GROW?locations=TZ (accessed on 15 May 2026).
- Komba, A.; Shukia, R. An Analysis of the Basic Education Curriculum in Tanzania: The Integration, Scope, and Sequence of 21st Century Skills. RISE Working Paper Series. 23/129. 2023. Available online: https://riseprogramme.org/publications/analysis-basic-education-curriculum-tanzania-integration-scope-and-sequence-21st.html (accessed on 18 January 2026).
- Amani, J. Access to and participation in basic education in Tanzania: A decade of key achievements and challenges. SN Soc. Sci. 2021, 1, 239. [Google Scholar] [CrossRef] [Scilit]
- World Bank. National Panel Survey-Tanzania: Data on Living Standards (2008/09 to 2020/21). 2026. Available online: https://www.worldbank.org/en/programs/lsms/brief/national-panel-survey-data-on-the-living-standards-of-tanzania (accessed on 18 May 2025).
- Kavenuke, P.S.; Kayombo, J.J.; Kinyota, M. The Massification of Compulsory Basic Education in Tanzania: Balancing Access and Quality. In Education Policies and Practices in the Global South, Volume One: Basic Education; Springer Nature Singapore Series on Exploring Education Policy in a Globalized World: Concepts, Contexts, and Practices; Ashraf, M.A., Tsegay, S.M., Eds.; Springer Nature: Singapore, 2026; ISBN 9789819532674. [Google Scholar]
- Lucumay, L.S.; Matete, R.E. Challenges facing the implementation of fee-free education in primary schools in Tanzania. Heliyon 2024, 10, e24172. [Google Scholar] [CrossRef] [Scilit]
- World Bank. The State of Global Learning Poverty: 2022 Update. 2022. Available online: https://thedocs.worldbank.org/en/doc/e52f55322528903b27f1b7e61238e416-0200022022/original/Learning-poverty-report-2022-06-21-final-V7-0-conferenceEdition.pdf (accessed on 18 May 2025).
- HOTOSM. Humanitarian Open Street Map Team (HOT) Open Street Map Tanzania Roads. 2025. Available online: https://data.humdata.org/dataset/hotosm_tza_roads (accessed on 15 May 2025).
- Esri. ArcGIS Pro, Version 3.6; ESRI Inc.: Redlands, CA, USA, 2025. Available online: https://www.esri.com/en-us/arcgis/products/arcgis-pro/features (accessed on 10 May 2026).
- Uduku, O. Learning Spaces in Africa: Critical Histories to 21st Century Challenges and Change, 1st ed.; Routledge: London, UK, 2018. [Google Scholar] [CrossRef] [Scilit]
- NBS. 2021 Tanzania in Figures, National Bureau of Statistics, Ministry of Finance and Planning, Dodoma, June 2022. 2021. Available online: https://www.nbs.go.tz/nbs/takwimu/references/2021_Tanzania_in_Figure_English.pdf (accessed on 7 June 2025).
- Weiss, D.; Fahl, F.; Kakoulaki, G.; Moner, M. The School Electricity Access Database for Africa, JRC. 2026. Available online: http://data.europa.eu/89h/c8eeea35-7233-48e3-81f3-ab6f7ea8d3bc (accessed on 5 May 2025).
- Smith, W.C. Out of school children and child protection: Understanding and improving the quality of data on out of school children. Child Prot. Pr. 2025, 4, 100103. [Google Scholar] [CrossRef] [Scilit]
- Grace, K.; Nagle, N.N.; Burgert-Brucker, C.R.; Rutzick, S.; Van Riper, D.C.; Dontamsetti, T.; Croft, T. Integrating environmental context into DHS analysis while protecting participant confidentiality: A new remote sensing method. Popul. Dev. Rev. 2019, 45, 197–218. [Google Scholar] [CrossRef] [Scilit]
- Ministry of Health (MoH) [Tanzania Mainland]; Ministry of Health (MoH) [Zanzibar]; National Bureau of Statistics (NBS); Office of the Chief Government Statistician (OCGS); ICF. Tanzania Demographic and Health Survey and Malaria Indicator Survey 2022 Final Report; MoH: Dodoma, Tanzania; NBS: Dodoma, Tanzania; OCGS: Rockville, MD, USA; ICF: Rockville, MD, USA, 2022. [Google Scholar]
- Burgert, C.R.; Colston, J.; Roy, T.; Zachary, B. Geographic Displacement Procedure and Georeferenced Data Release Policy for the Demographic and Health Surveys, DHS Spatial Analysis Reports, No. 7; ICF International: Calverton, MD, USA, 2013; Available online: https://dhsprogram.com/publications/publication-SAR7-Spatial-Analysis-Reports.cfm (accessed on 22 July 2026).
- Center for International Earth Science Information Network (CIESIN), Columbia University. GRID3 TZA-Settlement Extents, v3.0; GRID3: New York, NY, USA, 2024. [CrossRef]
- Henderson, J.V.; Squires, T.; Storeygard, A.; Weil, D. The Global Distribution of Economic Activity: Nature, History, and the Role of Trade1. Q. J. Econ. 2018, 133, 357–406. [Google Scholar] [CrossRef] [Scilit]
- Utazi, C.E.; Thorley, J.; Alegana, V.A.; Ferrari, M.J.; Takahashi, S.; Metcalf, C.J.E.; Lessler, J.; Tatem, A.J. High Resolution age-structured Mapping of Childhood Vaccination Coverage in Low and Middle Income Countries. Vaccine 2018, 36, 1583–1591. [Google Scholar] [CrossRef] [Scilit]
- Leone, S.; Mackintosh, A.; Ramirez, A.; Atherton, P.; Collis, V.; Mason-Sesay, M.; Bart-Williams, C. Education Workforce Spatial Analysis in Sierra Leone. 2020. Available online: https://educationcommission.org/wp-content/uploads/2020/12/2-EW-Spatial-Analysis-Paper.pdf (accessed on 27 June 2025).
- Ouma, P.; Macharia, P.M.; Okiro, E.; Alegana, V. Methods of Measuring Spatial Accessibility to Health Care in Uganda. In Practicing Health Geography; Springer: Berlin/Heidelberg, Germany, 2021; pp. 77–90. [Google Scholar] [CrossRef] [Scilit]
- Mohan, K. ChildPovetyAccesstoServicesV2, GitHub-Data-Science-Unit/ChildPovetyAccesstoServicesV2: Datasets for CPASv2 Project. 2025. Available online: https://github.com/Data-Science-Unit/ChildPovetyAccesstoServicesV2 (accessed on 15 May 2025).
- Jarso, F.; Watmough, G. Walking Travel Time to Nearest Primary and Secondary School in Tanzania; University of Edinburgh, School of GeoSciences: Edinburgh, Scotland, 2026. [Google Scholar] [CrossRef]
- Barrington-Leigh, C.; Millard-Ball, A. The world’s user-generated road map is more than 80% complete. PLoS ONE 2017, 12, e0180698. [Google Scholar] [CrossRef] [Scilit]
- Pozzi, F.; Robinson, T. IGAD Livestock Policy Initiative Accessibility Mapping in the Horn of Africa: Applications for Livestock Policy. 2008. Available online: https://hdl.handle.net/10568/24984 (accessed on 15 May 2025).
- I Blanford, J.; Kumar, S.; Luo, W.; MacEachren, A.M. It’s a long, Long walk: Accessibility to hospitals, Maternity and Integrated Health Centers in Niger. Int. J. Health Geogr. 2012, 11, 24. [Google Scholar] [CrossRef] [Scilit]
- ESA WorldCover Project Processed by ESA WorldCover Consortium. 2021. Available online: https://esa-worldcover.org/en/data-access (accessed on 22 July 2026).
- Zanaga, D.; Van De Kerchove, R.; Daems, D.; De Keersmaecker, W.; Brockmann, C.; Kirches, G.; Wevers, J.; Cartus, O.; Santoro, M.; Fritz, S.; et al. ESA WorldCover 10 m 2021 v200. 2022. Available online: https://pure.iiasa.ac.at/id/eprint/18478/ (accessed on 1 May 2025).
- Weiss, D.J.; Nelson, A.; Gibson, H.S.; Temperley, W.; Peedell, S.; Lieber, A.; Hancher, M.; Poyart, E.; Belchior, S.; Fullman, N.; et al. A global map of travel time to cities to assess inequalities in accessibility in 2015. Nature 2018, 553, 333–336. [Google Scholar] [CrossRef] [Scilit]
- Irmischer, I.J.; Clarke, K.C. Measuring and modeling the speed of human navigation. Cartogr. Geogr. Inf. Sci. 2018, 45, 177–186. [Google Scholar] [CrossRef] [Scilit]
- GDAL/OGR Contributors. Gdaldem—GDAL Documentation. Open Source Geospatial Foundation. 2026. Available online: https://gdal.org/en/stable/programs/gdaldem.html (accessed on 13 July 2026).
- Salon, D.; Gulyani, S. Commuting in Urban Kenya. 2019. Available online: https://trid.trb.org/View/1572403 (accessed on 27 June 2025).
- Oneya, L.; Onyango, D. Perception of school stakeholders on the effect of school-home distance on students’ academic performance among community secondary schools in Rorya District, Tanzania. East Afr. J. Educ. Soc. Sci. 2021, 2, 76–81. [Google Scholar] [CrossRef] [Scilit]
- Porter, G.; Hampshire, K.; Abane, A.; Tanle, A.; Munthali, A.; Robson, E.; Mashiri, M.; Maponya, G. Young People’s Transport and Mobility in Sub-Saharan Africa: The Gendered Journey to School. Doc. Anal. Geogr. 2025, 57, 61–79. Available online: https://www.raco.cat/index.php/DocumentsAnalisi/article/view/241960 (accessed on 24 May 2025).
- Tanzania Demographic and Health Survey (TDHS) (2015–16). Tanzania Demographic and Health Survey 2015–16; National Bureau of Statistics and ICF: Dar es Salaam, Tanzania, 2016. [Google Scholar]
- Bouterse, L.; Wall-Scheffler, C. Children are not like other loads: A cross-cultural perspective on the influence of burdens and companionship on human walking. PeerJ 2018, 6, e5547. [Google Scholar] [CrossRef] [Scilit]
- Phiri, K.; Ndlovu, S.; Dube, T.; Nyathi, D.; Ncube, C.; Tshuma, N. Access to formal education for the San community in Tsholotsho, Zimbabwe: Challenges and prospects. Heliyon 2020, 6, e04470. [Google Scholar] [CrossRef] [Scilit]
- R Core Team. R: A Language and Environment for Statistical Computing; R Foundation for Statistical Computing: Vienna, Austria, 2025; Available online: https://www.R-project.org/ (accessed on 25 May 2026).
- Cook, R.; Rutt, S.; Sims, D. Deprivation in Education; National Foundation for Educational Research (NFER): Berkshire, UK, 2014. [Google Scholar]
- Bhattarai, N.; Bernasek, A.; Pena, A.A. Factors Affecting School Attendance and Implications for Student Achievement by Gender in Nepal. Rev. Politi. Econ. 2020, 32, 259–282. [Google Scholar] [CrossRef] [Scilit]
- Saha, S.R.; Saha, S. Factors Affecting School Enrolment and Attendance for Children with Disabilities in Bangladesh: Evidence from a cross-sectional Survey. PLoS ONE 2024, 19, e0309402. [Google Scholar] [CrossRef] [Scilit]
- Nakagawa, S.; Schielzeth, H. Repeatability for Gaussian and non-Gaussian data: A practical guide for biologists. Biol. Rev. 2010, 85, 935–956. [Google Scholar] [CrossRef] [Scilit]
- Zou, G. A modified Poisson regression approach to prospective studies with binary data. Am. J. Epidemiol. 2004, 159, 702–706. [Google Scholar] [CrossRef] [Scilit]
- Tamhane, A.R.; Westfall, A.O.; Burkholder, G.A.; Cutter, G.R. Prevalence odds ratio versus prevalence ratio: Choice comes with consequences. Stat. Med. 2017, 35, 5730–5735. [Google Scholar] [CrossRef] [Scilit]
- Bates, D.; Mächler, M.; Bolker, B.; Walker, S. Fitting linear mixed-effects models using lme4. J. Stat. Softw. 2015, 67, 1–48. [Google Scholar] [CrossRef] [Scilit]
- Zeileis, A.; Köll, S.; Graham, N. Various versatile variances: An object-oriented implementation of clustered covariances in R. J. Stat. Softw. 2020, 95, 1–36. [Google Scholar] [CrossRef] [Scilit]
- Lumley, T. Analysis of complex survey samples. J. Stat. Softw. 2004, 9, 1–19. Available online: https://www.jstatsoft.org/article/view/v009i08 (accessed on 23 July 2026). [CrossRef] [Scilit]
- Schipper, Y.; Rodriguez-Segura, D. Teacher Incentives and Attendance: Evidence from Tanzania. RISE Working Paper 22/121. 2022. Available online: https://riseprogramme.org/sites/default/files/2022-12/Teacher_Incentives_and_Attendance_Tanzania_0.pdf (accessed on 25 May 2026).
- Wodon, Q.; Male, C.; Onagoruwa, A. Educating Girls and Ending Child Marriage in Africa: Investment Case and the Role of Teachers and School Leaders. UNESCO IICBA Study 2024-2. 2024. Available online: https://unesdoc.unesco.org/ark:/48223/pf0000390382 (accessed on 25 May 2026).
- Omoeva, C.; Chaluda, A.; Moussa, W.; Hatch, R.; Smith, W.C. Financing Education Equity: A Study of Three Country Case Studies. Research Report Commissioned by the International Commission on Financing Global Education Opportunity. 2016. Available online: http://report.educationcommission.org/download/995/ (accessed on 25 May 2026).
- Lewin, K.M.; Sabates, R. Who gets what? Is improved access to basic education pro-poor in Sub-Saharan Africa? Int. J. Educ. Dev. 2012, 32, 517–528. [Google Scholar] [CrossRef] [Scilit]
- Mutisya, M.; Muchira, J.M.; Abuya, B.A. Understanding wealth inequalities in education access in urbanizing Sub-Saharan Africa. Front. Educ. 2021, 6, 649730. [Google Scholar] [CrossRef] [Scilit]
- Das, P.; Tiwari, A. The impact of mother’s education on children’s educational outcome: A household level analysis. In Inclusive Developments Through Socio-Economic Indicators; Das, R.C., Ed.; Emerald Publishing Limited: Leeds, UK, 2023; pp. 307–318. [Google Scholar] [CrossRef] [Scilit]
- Okabe, M. Mothers to daughters? Gendered continuity in educational demand beyond primary education: Findings from Bukidnon, Northern Mindanao. In Economics of the Reversal in Gender Disparities in Education and Development; Springer: Berlin/Heidelberg, Germany, 2025; pp. 87–112. [Google Scholar] [CrossRef] [Scilit]
- Dube, T. Gender disparities in educational enrolment and attainment in Sub-Saharan Africa. J. Educ. Soc. Res. 2015, 5, 279. [Google Scholar] [CrossRef] [Scilit]
- Shabaya, J.; Konadu-Agyemang, K. Unequal access, unequal participation: Some spatial and socio-economic dimensions of the gender gap in education in Africa with special reference to Ghana, Zimbabwe and Kenya. Comp. J. Comp. Int. Educ. 2004, 34, 395–424. [Google Scholar] [CrossRef] [Scilit]

Disclaimer/Publisher’s Note: The statements, opinions and data contained in all publications are solely those of the individual author(s) and contributor(s) and not of MDPI and/or the editor(s). MDPI and/or the editor(s) disclaim responsibility for any injury to people or property resulting from any ideas, methods, instructions or products referred to in the content. |
© 2026 by the authors. Published by MDPI on behalf of the International Society for Photogrammetry and Remote Sensing. Licensee MDPI, Basel, Switzerland. This article is an open access article distributed under the terms and conditions of the Creative Commons Attribution (CC BY) license.