


Abstract
As tourism shifts from sightseeing to experience-oriented consumption, understanding how tourist perception differs across heterogeneous destination types and spatial scales remains challenging. Using 23,439 Volunteered Geographic Information (VGI) reviews archived for six destinations in Shangrao, China, this study compares mountain-type and rural comprehensive destination products. These are operational dominant-function categories rather than mutually exclusive geomorphological classes. The archive supports fine-grained sentiment, topic, and semantic-network analyses; annual temporal comparisons use the full 23,439-review corpus covering 2019–2025, whereas a separate subset of reviews posted from 1 August 2022 with official IP labels, aggregated into 2022–2024 province–year observations, supports Pooled Ordinary Least Squares (Pooled OLS) estimation. A hybrid lexicon–XLM-RoBERTa workflow, BERTopic, semantic co-occurrence analysis, and Pooled OLS are integrated in a cross-scale framework. Static results reveal shared strengths and weaknesses—high scenery and overall-experience evaluations but low price evaluations—alongside type-specific structures: mountain reviews concentrate on natural scenery, climbing effort, and accessibility, whereas rural reviews span village landscapes, cultural activities, accommodation, and nighttime experiences. Temporally, mountain demand retains a stable scenic core while accessibility concerns become more salient; rural demand shifts from traditional agricultural landscapes toward nighttime performances and other experience-oriented products. Cross-scale regressions identify destination- and dimension-specific correlates rather than causal drivers: urbanization is positively associated with several rural evaluations, while ecological contrast, climatic difference, and competing scenic resources are associated with more critical assessments in selected dimensions. The findings show that perception differences arise from the interaction of destination product structures and origin-region contexts, supporting differentiated accessibility management for mountain destinations and balanced product innovation, service improvement, and commercialization control for rural destinations.
1. Introduction
With the development of the experience economy and digital tourism, the competitiveness of tourism destinations has increasingly shifted from resource-based attraction to experience-oriented value creation [1,2]. Tourists’ fine-grained perceptions not only reflect the quality of destination services but also provide important evidence for understanding regional tourism upgrading [3]. At the same time, online travel agencies (OTAs) have accumulated large volumes of user-generated content (UGC), which provides timely, low-cost, and multi-dimensional information on tourists’ experiences [4,5]. As a form of Volunteered Geographic Information (VGI), online reviews are often associated with specific destinations, timestamps, and, in some cases, origin-region information [6]. These characteristics make them valuable for examining how tourists perceive different places over time and across space [7].
However, many existing studies still treat tourism destinations as homogeneous spatial units [8,9]. This simplification is problematic for composite destinations, where multiple types of tourism spaces often coexist within the same municipal boundary [10]. For example, mountain-type scenic areas and rural leisure destinations may differ substantially in resource endowment, landscape morphology, service facilities, accessibility, development intensity, and visitor experience [11,12]. As a result, tourists’ evaluations, demand structures, and perceived deficiencies may vary considerably across destination types [13]. If a destination is analyzed only as a single aggregate unit, the internal differentiation of tourist perception and its associated contextual factors may be obscured [14]. From a geo-information perspective, this raises an important question: how can unstructured review data be transformed into spatially explicit indicators that capture perception differences among heterogeneous spatial units within a composite destination?
Recent advances in spatial text mining and sentiment analysis have provided new opportunities for extracting tourist perceptions from unstructured online reviews [15]. Compared with traditional lexicon-based sentiment methods, pre-trained language models based on Transformer architectures, such as XLM-RoBERTa, have stronger capabilities in capturing contextual semantics, including negation, metaphor, inversion, and implicit expressions [16]. Meanwhile, BERTopic combines semantic embeddings with clustering techniques in the embedding space, allowing coherent latent topics to be extracted from short and fragmented online reviews [17]. These methods have been increasingly applied to multilingual text classification, review analysis, and topic mining, demonstrating their potential for processing large-scale UGC [18,19]. More specifically, XLM-RoBERTa has been applied to structured and aspect-focused sentiment analysis [20,21], BERTopic has been used to extract latent themes from hospitality reviews and urban tourism imagery [22,23], and pooled OLS has been used in tourism-demand panel studies, with prior work also emphasizing cross-sectional heterogeneity and the need for appropriate clustered inference [24,25,26]. Nevertheless, from the perspective of tourism geography and geographic information science, three gaps remain. First, most existing studies focus either on a single scenic area or on an entire destination as a whole [4,27]. Less attention has been paid to comparative modeling of heterogeneous tourism spaces within the same city, which limits the ability to reveal structural differences in perception within composite destinations [28]. Second, many studies remain at the level of sentiment classification or topic summarization [3,29]. They rarely transform micro-level textual perceptions into spatially explicit analytical variables that can be used to examine temporal evolution, type-specific differences, and topic-salience and topic-level sentiment patterns [30]. Third, tourist perception may vary not only with the on-site destination experience but also with the socioeconomic, ecological, climatic, and tourism-resource contexts of tourists’ origin regions [31,32]. However, relatively few studies have linked micro-level review mining with macro-level geographic contexts through a cross-scale analytical framework. This limits the interpretation of how spatial background factors are related to heterogeneous tourist perceptions.
To address these gaps, this study takes Shangrao, China, as a representative composite tourism destination that integrates mountain sightseeing and rural leisure resources. Six destinations are examined. The mountain-type group comprises Sanqingshan, Guifeng, and Lingshan, whereas the rural comprehensive group comprises Wuyuan, Wangxiangu, and Gexiancun. These labels are assigned at the independently marketed destination-product and review-unit level according to dominant attraction, principal visitor activities, and dominant reviewed experience. They are not mutually exclusive geomorphological classes and do not deny the physical overlap between mountainous terrain and rural settlements. Based on an archive of 23,439 OTA reviews covering 2019–2025, this study develops a comparative framework for analyzing tourist perception across heterogeneous destination types. The archived review dataset is used for fine-grained sentiment analysis, topic clustering, topic-salience and topic-level sentiment analysis, and temporal evolution analysis. In addition, reviews posted from 1 August 2022 with official IP location information are used to construct a province-year dataset for macro-level regression analysis. Methodologically, this study integrates XLM-RoBERTa, BERTopic, and Pooled Ordinary Least Squares (Pooled OLS) regression to build a cross-scale analytical framework linking fine-grained sentiment, micro-level topics, and macro-level geographic correlates. Specifically, this study addresses the following three research questions: (1) Do different types of tourism spaces within a composite destination exhibit significant differences in multi-dimensional tourist perception, and how do their strengths, weaknesses, and satisfaction mechanisms differ? (2) How do tourists’ core perception topics evolve from 2019 to 2025 across mountain-type and rural comprehensive destinations, and does rural tourism show significant topic restructuring and shifts in dominant concerns? and (3) Are origin-region macro-contextual factors associated with tourist perception in dimension-specific and type-specific ways, and how are these factors related to tourist evaluations across scales?
This study makes three main contributions. First, in terms of research object and spatial analytical perspective, it moves beyond the common practice of treating a destination as a homogeneous unit. By comparing mountain-type and rural comprehensive destinations within the same municipal area, this study shifts the analytical unit from the “whole destination” to “heterogeneous spatial units within a destination”. This design helps reveal how perception structures, topic-salience and topic-level sentiment patterns, and demand evolution differ across tourism spaces with distinct resource bases and development models. Second, in terms of analytical design rather than algorithmic innovation, this study establishes an application-oriented cross-scale workflow. The substantive contribution lies in four operational elements: (i) linking each review identifier to its dimension-level sentiment outputs and topic labels; (ii) comparing heterogeneous tourism spaces within one municipality and aggregating the IP-labeled subsample into province–year observations; (iii) constructing spatially comparable indicators, including six-dimension sentiment scores, topic-mention measures, frequency-weighted topic sentiment, and topic-salience and topic-level sentiment indicators; and (iv) using Pooled OLS as a transparent estimation strategy for average conditional associations while retaining time-invariant travel-time differences and applying provincial cluster-robust standard errors. XLM-RoBERTa, BERTopic, and Pooled OLS are established tools; the contribution is their reproducible data linkage, operationalization, and empirical application to a cross-scale tourism–geography problem, rather than a new algorithm or estimator. Third, in terms of empirical findings and theoretical implications, this study reveals both static and dynamic heterogeneity in tourist perception within a composite destination. Mountain-type destinations are characterized by strong core landscape advantages but evident accessibility constraints, whereas rural comprehensive destinations show a topic transition from agricultural landscapes to innovative experience-oriented activities, particularly nighttime performances. Moreover, origin-region macro contexts are not uniformly associated with tourist perception. Instead, these associations vary by perception dimension and destination type. These findings provide new empirical evidence for understanding the formation of tourist perception differences within composite destinations and demonstrate the potential of VGI-based online reviews for spatial perception analysis in tourism geography and geographic information research.
2. Data and Methods
2.1. Study Area
Shangrao is located at the junction of Jiangxi, Zhejiang, Fujian, and Anhui provinces in eastern China, serving as a geographic hub between the Yangtze River Delta urban agglomeration and the Coastal Economic Zone of the Taiwan Strait. This strategic location has shaped a complex topography and ecological environment, as well as a cultural landscape influenced by both Huizhou and Gan traditions [33]. The interplay between diverse landforms and regional cultures has produced a highly heterogeneous tourism spatial structure, making Shangrao a representative case for examining perceptual differences among heterogeneous tourism spaces at the municipal scale (Figure 1).
Figure 1.
Study area and locations of mountain-type and rural comprehensive destinations.
In this study, “mountain-type” and “rural comprehensive” are operational destination-product classifications rather than mutually exclusive geomorphological, land-use, or administrative classes. Mountain and rural spaces may overlap physically, particularly in mountainous villages. Classification was conducted at the independently marketed attraction and destination-specific review-page level using a dominant-function rule based jointly on three criteria: (1) the officially promoted or otherwise core attraction organizing the tourism product; (2) the principal visitor activities and itinerary structure; and (3) the dominant experiential content represented in the destination-specific review corpus. A site was assigned to the mountain-type group when geological or high-elevation scenery and activities such as climbing, trail use, cableway use, and terrain-related effort organized a typical visit. A site was assigned to the rural comprehensive group when village settlement, vernacular culture, agricultural landscapes, accommodation, performances, nighttime leisure, and integrated rural experiences organized the tourism product. The resulting labels are mutually exclusive only for the six analytical review units; they do not imply spatial exclusivity or that the selected destinations are physically “pure” examples.
Under this rule, Sanqingshan, Guifeng, and Lingshan were classified as mountain type, whereas Wuyuan, Wangxiangu, and Gexiancun were classified as rural comprehensive [34]. Wangxiangu is physically located in a deep mountain canyon, but its independently marketed and reviewed tourism product is organized around a village-style built environment, vernacular and folk-cultural experiences, accommodation, performances, night scenery, and hospitality; the canyon is an important environmental setting but is not by itself the dominant-function classification criterion. Conversely, a foothill village serving mainly as an entrance, transport node, accommodation base, or service area for a mountain attraction was not treated as an independent rural case unless it constituted a separately marketed attraction with a separable review corpus. Mixed destinations were therefore not automatically excluded: they were retained and assigned by dominant function when an independent attraction and review unit existed. Other composite sites outside the six focal units were beyond the sampling scope rather than excluded merely because their landscapes combined mountain and rural attributes. This rule provides a reproducible analytical boundary while acknowledging real-world spatial nesting.
2.2. Data Sources
The review data were collected from Ctrip, one of the major online travel agencies in China. Compared with traditional long-form travel blogs, OTA reviews are usually more concise and tend to focus directly on key experiential attributes such as price, accessibility, service, and facilities, making them particularly suitable for fine-grained aspect-based sentiment analysis (ABSA) [35]. Moreover, to reduce noise from promotional or commercialized content commonly found on social media platforms, data from Weibo, Xiaohongshu, and similar platforms were not included in this study [36].
Historical Ctrip reviews were collected on 20 December 2025 from the visitor-review sections of the destination sightseeing pages for Sanqingshan, Wuyuan, Wangxiangu, Lingshan, Gexiancun, and Guifeng. Each destination-specific page was treated as an independent destination and review-collection unit. A crawler implemented in Python 3.12.5 using Selenium 4.39.0 traversed all available paginated pages in seven export batches. The extracted fields were destination, review date, rating score, the official IP-location label when displayed, and the original Chinese-language review text. The batches yielded 25,572 candidate records covering reviews posted from 2016 to 2025. Row-level extraction exceptions were skipped, but their number was not logged.
Text normalization removed URLs/HTML fragments and zero-width characters, collapsed repeated punctuation and spaces, and removed emojis. Within each export batch, exact duplicates were identified by normalized review text. A first meaningful-text screen excluded texts with fewer than four Chinese characters, Chinese density below 20% for texts longer than 10 characters, or default/promotional phrases. After the seven batches were merged, a secondary rule-based screen removed texts shorter than 10 Chinese characters, repetitive or low-diversity strings, and residual cross-batch duplicates identified by destination, date, IP label, and normalized text. No automated fake-review classifier was used. Records posted before 1 January 2019 were then excluded, producing the final 23,439-review corpus for 2019–2025; Scheme 1 reports all staged counts and decision rules. The full corpus was used for sentiment, BERTopic, semantic-network, and temporal analyses, whereas the macro-level regression used only reviews posted from 1 August 2022 with official IP labels, aggregated into 2022–2024 province–year observations. Table 1 reports the full annual distribution and aspect-level sentiment frequencies.
Scheme 1.
Ctrip review collection, text normalization, staged filtering, and analytical-sample construction workflow. Arrows indicate sequential filtering and aggregation, and colors distinguish workflow stages. * The Chinese-density criterion was applied only to texts longer than 10 Chinese characters.
Table 1.
Data collection of tourist destinations.
Destination-level review availability is uneven. Wuyuan contributes 10,569 archived reviews, whereas Lingshan contributes 1360; Wangxiangu also rises from 16 reviews in 2019 to 1266 in 2025. All valid observations were retained because unequal review volume is part of the observed VGI record, but raw counts were not interpreted as directly comparable demand intensity. For temporal topic analysis, theme mention frequencies were normalized within destination-year observations and interpreted as relative thematic salience; review-count-weighted moving averages were used only to smooth the plotted trajectories. The imbalance therefore affects precision and the representation of pooled type-level patterns, especially for early Wangxiangu observations, and is retained as a limitation of the observational design.
2.3. Methods
2.3.1. Fine-Grained Sentiment Analysis and Topic Clustering
Online travel reviews, serving as a prominent source of Volunteered Geographic Information (VGI) and user-generated content (UGC), often contain non-standard expressions such as inversion, metaphor, and implicit evaluation. Under such conditions, traditional lexicon-based sentiment methods are prone to bias in polarity identification and semantic interpretation [35]. To more accurately extract tourists’ evaluations of different experiential contents, this study combines fine-grained sentiment analysis with topic clustering to structurally process review texts and construct a “fine-grained sentiment–micro-topic” analytical framework.
Six perception dimensions were fixed before the comparative analysis: scenery, service, price, transportation, facilities, and overall experience. The taxonomy was derived from recurrent dimensions in tourism-review research [37,38] and checked against the substantive coverage of the six-destination corpus. Operationally, scenery denotes evaluations of natural, rural, and cultural visual attractions; service covers interactions with staff, guides, reception, and destination management; price covers tickets, fees, expenditure, value for money, and perceived overcharging; transportation covers external and internal access, roads, parking, public transport, shuttle services, cableways, route convenience, and waiting associated with movement; facilities covers accommodation, food and beverage provision, toilets, signage, rest areas, walking infrastructure, and other supporting amenities; and overall experience captures integrative trip-level reactions, including enjoyment, recommendation, crowding, physical effort, and general satisfaction or disappointment. A review could receive more than one dimension label when it explicitly addressed multiple aspects. Boundary cases were assigned according to the evaluated object: for example, cableway accessibility or waiting was coded as transportation, whereas cableway cost was coded as price; accommodation quality was coded as facilities, whereas accommodation cost or value was coded as price. The same definitions were applied across all destinations and years. No independent expert panel or separate field pilot was conducted. The corpus check was used to assess operational coverage, not as a substitute for expert or field validation; accordingly, these dimensions should be interpreted as literature-informed categories of OTA review discourse rather than exhaustive, field-validated psychometric constructs.
Rather than using XLM-RoBERTa as an end-to-end aspect extractor, this study adopted a hybrid lexicon-transformer workflow. The literature-informed lexicon described above was used to identify the predefined perception dimensions and their aspect-related textual contexts. Sentiment polarity was then estimated with the publicly available ‘cardiffnlp/twitter-xlm-roberta-base-sentiment’ checkpoint, a three-class multilingual sentiment classifier built on the XLM-RoBERTa-base architecture [16,39]. The checkpoint had already been trained for multilingual sentiment classification by its developers; no additional fine-tuning or parameter updating was performed using the tourism-review corpus in this study. Accordingly, 0% of the study corpus was used for model training. The study therefore has no study-specific training split: the external checkpoint supplies the pretrained classifier, while the manually annotated sample functions as an external applicability-validation set.
For each identified aspect context, the model produced logits for negative, neutral, and positive sentiment. These logits were converted into class probabilities using the Softmax function:
where denotes negative, neutral, or positive sentiment, and the three probabilities sum to 1. The final discrete polarity was the class with the highest probability. To retain prediction uncertainty and construct a continuous 0–1 sentiment-valence index, the class probabilities were combined using ordinal weights of 0, 0.5, and 1:
Thus, values closer to 1 indicate more positive sentiment, values around 0.5 indicate relatively neutral sentiment, and values closer to 0 indicate more negative sentiment.
Model applicability was evaluated using a manually annotated random sample of 500 reviews, representing 2.13% of the complete corpus. After deduplication and normalized-text matching, 481 unique reviews could be matched unambiguously to the prediction file, yielding 2886 possible review-dimension pairs. Across these pairs, lexicon-guided aspect identification achieved precision = 0.562, recall = 0.854, and F1 = 0.678. For the 971 aspect-review pairs on which both the human annotation and the analytical workflow identified the corresponding dimension, conditional sentiment-polarity accuracy was 73.94%, macro-F1 was 0.540, and weighted-F1 was 0.800. Class-specific precision/F1 values were 0.951/0.870 for positive, 0.784/0.613 for negative, and 0.079/0.138 for neutral sentiment. The macro and class-specific results are reported alongside the weighted metric because the evaluation sample was imbalanced toward positive sentiment. The weaker neutral-class result is treated as a limitation rather than being obscured by the weighted average. Detailed class- and dimension-specific results are reported in Table 2.
Table 2.
Validation performance of the hybrid lexicon-XLM-RoBERTa workflow.
Given that online reviews are typically short, fragmented, and semantically diverse, BERTopic 0.17.4 sequentially integrates semantic embeddings, UMAP (umap-learn 0.5.9.post2) dimensionality reduction, HDBSCAN 0.8.41 clustering, and c-TF-IDF keyword extraction and is therefore more suitable than conventional LDA models for the data characteristics of this study.
BERTopic was fitted separately to the mountain-type corpus (n = 7635) and the rural-comprehensive corpus (n = 15,804). The retained HDBSCAN output contained 46 and 51 non-outlier micro-topics, respectively; the HDBSCAN label −1 was treated as an outlier class and was not included in these topic counts. Semantic coherence was evaluated retrospectively using the C_v measure implemented in Gensim 4.4.0. Reviews were segmented using Jieba 0.42.1, and the four highest-ranked c-TF-IDF terms recorded consistently for each micro-topic were evaluated against the corresponding destination-type corpus using a 110-token Boolean sliding window. The resulting C_v scores were 0.612 for mountain-type destinations and 0.603 for rural comprehensive destinations, indicating comparable semantic consistency between the two retained topic solutions. Because automatic topic reduction was used, this coherence analysis is a retrospective quality check of the retained solution rather than evidence that 46 or 51 is a uniquely optimal topic count.
Based on the unique review identifier, the dimension-level sentiment scores generated by the hybrid lexicon-XLM-RoBERTa workflow were matched one-by-one with the topic labels generated by BERTopic, thereby forming a linked “sentiment dimension-review topic” dataset. This integrated result enables sentiment tendencies in different perception dimensions to be associated with specific experiential topics. It provides the empirical basis for comparing strengths and weaknesses between mountain-type and rural comprehensive destinations, examining topic evolution over time, and constructing province-year aggregated indicators of dimension-level sentiment scores for the subsequent regression analysis of macro-level origin-region correlates.
To formally compare destination types, the six dimension-level sentiment scores were first averaged within each destination–year cell for 2019–2025, yielding 21 mountain-type and 21 rural-comprehensive observations. Two-sided Mann–Whitney U tests were then applied to the destination–year scores, with Holm correction across the six dimensions. Rank-biserial correlations were reported as effect sizes. This equal-cell comparison reduces the influence of unequal review volumes across destinations, but the repeated years remain nested within six destinations; the resulting tests are therefore interpreted as exploratory evidence of type-level differences.
2.3.2. Semantic Co-Occurrence Network Construction and Metrics
To characterize how experiential terms were connected within each destination type, an undirected semantic co-occurrence network was constructed from the Chinese review corpus. After word segmentation and removal of low-information tokens, each selected high-frequency term was represented as a node. Two terms and were connected when they occurred in the same review, and the edge weight was defined as their co-occurrence count:
the node weight was the number of reviews containing term i. The nodes were assigned to the substantive perception categories used in the semantic network figures. For legibility, the visualization retained edges at or above the 70th percentile of the observed edge-weight distribution; this threshold affects display density but not the underlying co-occurrence counts. The network is descriptive and is used to identify central terms and connected experiential clusters, rather than to make causal or inferential claims.
To quantify these visual contrasts, structural statistics were calculated from the complete node and edge tables underlying the semantic co-occurrence network visualization presented in Section 3.2.1, before the display-only edge threshold was applied. The reported measures were node and edge counts, density, average degree, Freeman degree centralization, average local clustering coefficient, weighted modularity Q and its community count, the share of total weighted node strength held by the top 10% of nodes (using ), and the number of connected components. Because one aggregate network was constructed for each destination type, these metrics are interpreted descriptively rather than as inferential tests.
2.3.3. Calculation of Topic Salience and Topic-Level Sentiment
Topic salience and topic-level sentiment were calculated as two complementary but non-equivalent indicators. First, the non-outlier BERTopic micro-topics were consolidated into substantively interpretable macro-topics using ranked c-TF-IDF terms and predefined topic labels; these groupings were analytical mappings, not additional model-generated clusters. For macro-topic , relative topic salience was calculated as its within-destination-type share of topic mentions:
where is the number of review-topic mentions. Topic-level sentiment was calculated as the frequency-weighted mean of the continuous 0–1 sentiment scores among reviews mentioning macro-topic :
The two indicators were displayed on a common 0–1 scale in the comparative display presented in Section 3.2.2 for visual comparison only; they were not treated as measurements of the same construct, and no difference between them was interpreted as an expectation–experience or supply–demand gap. Topic salience reflects relative attention in post-visit review discourse, not directly observed pre-trip expectations.
2.3.4. Cross-Scale Correlates and Pooled OLS Regression
Following the fine-grained sentiment identification of the review texts, this study further examines how macro-level origin-region contexts are associated with tourists’ multidimensional perception evaluations. To identify the direction and statistical significance of their associations across perception dimensions, a cross-scale regression model was constructed, using provinces as the basic spatial units. Because official IP location information was not widely displayed on OTA platforms until August 2022, the spatial origins of earlier reviews could not be reliably identified. Accordingly, the regression analysis was conducted only on the subset of valid reviews posted from 1 August 2022 that contained official IP location labels. These reviews were then aggregated at the province–year level to calculate the mean sentiment scores for each province across different years and perception dimensions. The aggregated scores were subsequently matched with corresponding macro-statistical indicators to form a province–year dataset for regression analysis. Considering data availability and consistency in statistical definitions, the final estimation used observations from 2022, 2023, and 2024.
Guided by the push–pull theory and gravity-model framework commonly used in tourism geography, and informed by relevant literature, the explanatory variables were selected from four dimensions: socioeconomic development, transport spatial friction, natural environmental contrast, and tourism resource endowment [40]. These variables and their sources are summarized in Table 3. Specifically, in terms of socioeconomic development, per capita regional GDP (X1), urbanization rate (X4), and the share of the tertiary sector in GDP (X5) were used to reflect the income level, lifestyle, and service-sector development of origin regions. For transport spatial friction, the shortest door-to-door public transport travel time from the origin region to Shangrao (X2) was used to capture travel-time costs. Compared with Euclidean distance, this indicator better reflects actual travel conditions experienced by tourists [41]. For natural environmental contrast, annual mean temperature difference (X3) and vegetation-ecological difference (X7) were introduced to characterize climatic and ecological baseline differences between origin regions and the destination [42]. The vegetation-ecological difference was derived from population-weighted NDVI. Finally, for tourism resource endowment, the total number of high-grade scenic spots in the origin region (X6) was used to measure the abundance of substitutable tourism resources and to control for potential spatial substitution effects.
Table 3.
Macro-level contextual variables used in the Pooled OLS analysis.
Because the model includes spatial variables such as shortest travel time and temperature difference that vary across provinces but are time-invariant within a province over the three-year window, a province fixed-effects (FE) model would absorb these variables and could not identify their coefficients. Pooled OLS has been used in tourism-demand panel studies to estimate average relationships across origin–destination units [24], while previous evidence also shows that unmodeled cross-sectional heterogeneity can weaken pooled specifications [25]. Therefore, this study employed Pooled Ordinary Least Squares (Pooled OLS) for parameter estimation and calculated cluster-robust standard errors at the provincial level, following established guidance for within-group dependence and heteroskedasticity [26]. Random-effects (RE) models were also estimated as an alternative specification. Conventional Hausman comparisons used the five time-varying regressors common to the FE and RE models, because travel time and temperature difference were omitted from the FE equations. Breusch–Pagan LM tests were used to assess whether a random intercept was required, and pooled models with year indicators were examined as an additional temporal diagnostic. Given the short province–year panel, all specifications are interpreted as average conditional associations rather than causal effects. The model is specified as follows:
where denotes the mean sentiment score of origin region in year t for the th perception dimension of the destination (e.g., scenery or service); is the intercept term; to are the parameters to be estimated, reflecting the conditional associations between the macro-level variables and tourist perception; to represent the explanatory variables, with denoting the time-invariant travel-time variable; and is the error term.
To characterize natural environmental differences, this study did not directly use the simple provincial mean NDVI. Because provinces exhibit substantial internal spatial heterogeneity, a simple regional average may be affected by sparsely populated areas or large water bodies and may therefore fail to reflect the ecological environment actually experienced by residents [49]. To address this issue, WorldPop population density raster data [50] were spatially overlaid with NDVI imagery for the corresponding year, and a population-weighted NDVI was calculated using raster population as the weight:
where denotes the population-weighted vegetation index of a given origin province; n is the total number of valid raster cells within the administrative boundary; NDVIi is the vegetation index value of the i-th raster cell; and Pi is the resident population in the i-th raster cell. After calculating the population-weighted NDVI for each origin region, this study computed its absolute difference from the destination value at the same scale to construct the final vegetation-ecological difference variable (X7), which was then incorporated into the regression model.
3. Results
3.1. Differences in Multidimensional Tourist Perception Between Mountain-Type and Rural Comprehensive Destinations
Using the sentiment scores across the six extracted dimensions—scenery, service, price, transportation, facilities, and experience—the distributional characteristics of tourist perceptions were compared between mountain-type and rural comprehensive destinations based on the full Volunteered Geographic Information (VGI) corpus (Figure 2). Formal destination–year comparisons are reported in Table 4. In addition, provincial spatial patterns were mapped using province–year aggregated indicators derived from the official IP sub-sample (2022–2024) and weighted across temporal cross-sections (Figure 3).
Figure 2.
Kernel density of sentiment scores by destination type. Dashed horizontal lines indicate the first and third quartiles, and solid horizontal lines indicate the median.
Table 4.
Destination–year comparison of multidimensional perception scores.
Figure 3.
Province-level spatial patterns of tourist perceptions by destination type, derived from the 2022–2024 IP-labeled subsample. The maps show weighted descriptive means; spatial contrasts are interpreted jointly with the regression results and are not treated as causal regional effects. The inset at the lower right of each panel provides a complete display of Hainan and the South China Sea islands, including the South China Sea discontinuous line.
Overall, scenery and experience received high evaluations in both destination types. The mean sentiment scores for scenery were 0.87 for mountain-type destinations and 0.85 for rural comprehensive destinations, while the mean scores for experience were both around 0.81. The kernel density curves for scenery and experience were concentrated in the 0.9–1.0 interval, with limited extension into lower-score ranges (Figure 2).
Price received the lowest evaluations in both destination types. The mean price perception scores were 0.59 for mountain-type destinations and 0.58 for rural comprehensive destinations. The price distributions were relatively dispersed, with a substantial proportion of observations in the 0.0–0.6 interval (Figure 2).
For service, transportation, and facilities, mountain-type destination–year means were 0.745, 0.633, and 0.780, compared with 0.699, 0.544, and 0.735 for rural comprehensive destinations. After Holm correction, the destination–year differences were significant for scenery (p = 0.008), transportation (p = 0.007), and facilities (p = 0.008), but not for service (p = 0.117). Transportation also showed a positive difference in all seven years, making it the most temporally consistent mountain-type advantage. The effect sizes are reported in Table 4.
At the provincial scale, the mountain-type maps show relatively higher scores in a number of western origin provinces across several dimensions, while values elsewhere are more heterogeneous. Price and transportation display more pronounced cross-province dispersion than scenery and overall experience. Because the maps are weighted province-level summaries, this west–east contrast is treated as a descriptive pattern rather than as a statistical test of a regional effect.
For rural comprehensive destinations, high-value origin provinces are more fragmented across northeastern, southwestern, and eastern coastal China rather than forming a continuous east–west or north–south belt. Scenery and price vary visibly across origins, whereas service and facilities do not exhibit a stable geographical gradient. The contrast between the two map sets therefore indicates type-specific spatial heterogeneity rather than a single national directional pattern.
Figure 3 alone cannot identify the mechanisms producing these distributions. Accordingly, the maps are interpreted together with the origin-region variables—urbanization, NDVI-based ecological contrast, GDP, climatic difference, travel time, and high-level scenic-resource endowment—and the conditional regression associations in Section 3.4. Their push–pull and perception-comparison mechanisms are discussed separately for the two destination types in Section 5.1.
Overall, both destination types share a perception structure characterized by high scenery and experience scores and low price scores. The destination–year tests indicate that the strongest statistically supported mountain-type differences are in scenery, transportation, and facilities. Service is descriptively higher for mountain-type destinations but does not remain significant after correction for the six simultaneous comparisons. These results support a differentiated but exploratory interpretation of destination-type differences.
3.2. Thematic Structure of Tourists’ Micro-Level Perceptions and Topic-Level Sentiment
The BERTopic outputs distinguish model-generated micro-topics from the broader categories used for comparative interpretation. The 46 mountain and 51 rural-comprehensive micro-topics are the non-outlier clusters directly retained from the models and evaluated by C_v. For topic-salience and temporal analyses, semantically related, substantively interpretable micro-topics were consolidated into six mountain and seven rural-comprehensive macro-topic categories. These macro-categories are analytical groupings rather than additional model-generated BERTopic clusters.
3.2.1. Overall Characteristics of the Semantic Networks of Tourist Perception
To identify the dominant perceptual features in tourist reviews, this study constructed high-frequency word co-occurrence networks based on the review texts. Figure 4 visualizes the two networks, while Table 5 reports structural metrics calculated from their complete underlying node and edge tables. The construction and quantification procedures are described in Section 2.3.2.
Figure 4.
Semantic co-occurrence networks of online reviews by destination type: (a) mountain-type destinations; (b) rural comprehensive destinations. Node size reflects term frequency, colors distinguish substantive perception categories, and edge width reflects co-occurrence weight.
Table 5.
Topological metrics of semantic co-occurrence networks by destination type.
Quantitative network statistics reveal distinct structural characteristics between the two destination types (Table 5). The mountain-type network exhibited substantially higher degree centralization than the rural comprehensive network (0.466 versus 0.145), indicating that its topology was more strongly organized around a set of highly connected terms. It also showed higher weighted modularity (0.342 versus 0.207) and more detected communities (five versus three), indicating clearer differentiation among landscape, physical-exertion, affective-evaluation, and price-related semantic clusters.
By contrast, the rural comprehensive network had higher density (0.860 versus 0.556), average degree (46.436 versus 22.810), and average clustering coefficient (0.927 versus 0.744). It should therefore not be interpreted as structurally sparse or simply ‘more dispersed.’ Rather, its semantic structure was more densely interconnected and less dependent on a small number of topologically dominant nodes, integrating landscape, cultural, transportation, accommodation, nighttime-activity, and consumption-related themes.
At the term level, the mountain network was organized around scenery, climbing and physical effort, price, and queueing, whereas the rural network connected Huangling, rapeseed flowers, shaiqiu (sun-drying autumn crops), architecture, terraced fields, transport, accommodation, nighttime activities, and consumption. The rural network nevertheless had the larger top-10% weighted-strength share (31.4% versus 21.3%), showing that dense, distributed topology can coexist with strong weighted concentration around a limited set of high-frequency themes. Both networks formed a single connected component.
3.2.2. Topic Salience and Topic-Level Sentiment
To compare the relative salience of core themes with their associated sentiment, the study reports two indicators derived from the macro-topic data. Relative topic salience is the normalized frequency of topic mentions within each destination type, whereas topic-level sentiment is the corresponding frequency-weighted mean of the continuous sentiment score. The two indicators are presented side by side in Figure 5 on a common 0–1 display scale; they are not interpreted as equivalent measurements of expectation and experience, and their difference is not treated as a supply–demand gap. The operational definitions are provided in Section 2.3.3.
Figure 5.
Topic salience and topic-level sentiment for core perception themes in (a) mountain-type and (b) rural comprehensive destinations. Red and blue points represent normalized topic salience and frequency-weighted topic sentiment, respectively, on a common 0–1 display scale; the two indicators are not assumed to measure the same construct. Light-blue connecting lines show the within-theme separation between the two indicators and do not represent time or a fitted trend.
For mountain-type destinations, natural scenery has a topic-salience value of about 0.29 and a topic-level sentiment score close to 0.92. Geological heritage, alpine climatic features, and catering services have salience values of approximately 0.16, 0.06, and 0.03, with sentiment scores of about 0.88, 0.79, and 0.90, respectively. Tour accessibility has the highest relative salience value (1.00) and a topic-level sentiment score of about 0.72. Extreme climate has a topic-level sentiment score of about 0.63.
Rural comprehensive destinations show a broader distribution of topic salience. Agricultural landscapes have the highest relative salience value (1.00) and a topic-level sentiment score of about 0.80. Nighttime performances, historic architecture, and non-standard accommodation have low salience values, approximately 0, 0.03, and 0.06, but high topic-level sentiment scores of about 0.91, 0.93, and 0.93. Over-commercialization, tourist congestion, and last-mile transportation have comparatively modest topic-level sentiment scores, mostly between 0.48 and 0.52.
Taken together, mountain-type destinations show a concentrated topic structure with high sentiment around scenery and lower sentiment around accessibility-related terms. Rural comprehensive destinations show greater separation between highly salient traditional landscape topics and less salient but positively evaluated nighttime, architectural, and accommodation topics. These are descriptive differences between relative topic salience and topic-level sentiment, not evidence of a measured expectation–experience gap.
3.3. Temporal Evolution of Tourist Perception Themes
Tourist perception of destinations is not static, but evolves over time in response to changes in market conditions, tourism supply, and external shocks. To examine the temporal dynamics of tourist concerns across the two destination types, this study uses the full 23,439-review corpus covering 2019–2025. Core-theme mention frequency is calculated as the within-destination-year share of reviews mentioning the theme, and destination-type trajectories summarize these normalized rates rather than raw review counts. Review-count-weighted four-quarter moving averages are used only for visualization. The study period covers the pre-pandemic stage, the period of pandemic disruption, and the subsequent normalization of tourism recovery, thereby providing a relatively complete picture of how tourist demand and perceptual focus changed under shifting macro-environmental conditions.
3.3.1. Temporal Evolution of Perception Themes in Mountain-Type Destinations
The temporal evolution of perception themes in mountain-type destinations is shown in Figure 6. Core scenic themes remain relatively stable, accessibility becomes more salient in the later period, and secondary themes fluctuate within lower ranges.
Figure 6.
Temporal evolution of core perception themes in mountain-type destinations, 2019–2025. Gray lines and open circles show quarterly observations; the blue curves show four-quarter review-count-weighted moving averages. Y-axis ranges vary across panels.
Core natural scenery remains the most stable and dominant theme. From 2019 to 2025, its mention frequency generally remains between 0.60 and 0.70, with a temporary decline to about 0.52 in 2022 and a subsequent recovery.
Tour accessibility becomes more salient in the later period. Its mention frequency fluctuates mainly between 0.20 and 0.40 from 2019 to 2022, rises to about 0.48 at the end of 2023, and remains between 0.36 and 0.47 during 2024–2025.
Secondary themes and risk-related topics remain at lower levels. Alpine climate, geological heritage, and catering services generally range between 0.05 and 0.15, while extreme climate is mentioned in fewer than 10% of observations in most quarters.
The mountain-type temporal pattern is therefore characterized by a stable scenic core and a later increase in the salience of accessibility-related topics.
3.3.2. Temporal Evolution of Perception Themes in Rural Comprehensive Destinations
The temporal evolution of perception themes in rural comprehensive destinations is presented in Figure 7. The series show a decline in agricultural-landscape salience and a rise in nighttime-performance salience, alongside fluctuations in supporting themes.
Figure 7.
Temporal evolution of core perception themes in rural comprehensive destinations, 2019–2025. Gray lines and open circles show quarterly observations; the blue curves show four-quarter review-count-weighted moving averages. Y-axis ranges vary across panels.
Agricultural landscapes show the clearest decline in salience. Their mention frequency is generally between 0.30 and 0.55 from 2019 to 2022, then falls to about 0.14 by the end of 2025.
Nighttime performances increase after 2023, overtake agricultural landscapes in 2024, and reach approximately 0.41 by the end of 2025. Their mention frequency remains below 0.10 during 2019–2022.
Over-commercialization and last-mile transportation remain recurring themes. Last-mile transportation reaches a stage peak of about 0.36 at the end of 2023, while over-commercialization fluctuates mainly between 0.14 and 0.22.
Historic architecture remains between approximately 0.08 and 0.19. Non-standard accommodation remains around 0.11–0.15 after 2024, while tourist congestion varies mostly between 0.07 and 0.13.
Rural comprehensive destinations show more pronounced stage-based change than mountain-type destinations: agricultural-landscape salience declines while nighttime-performance salience rises, whereas mountain-type salience remains centered on natural scenery with growing attention to accessibility.
3.4. Macro-Level Correlates of Tourist Perception Evaluations
The previous sections have revealed differences in tourist perception structures between mountain-type and rural comprehensive destinations in terms of sentiment distribution, topic salience, and thematic evolution. To examine macro-level associations across perception dimensions, province–year aggregated datasets were constructed for 2022–2024 from the review subsample with official IP information. Separate pooled OLS regressions were estimated for the two destination types, with results reported in Table 6a,b.
Table 6.
(a) Pooled OLS estimates for scenery, service, and price perceptions; (b) pooled OLS estimates for transportation, facilities, and experience perceptions.
Before regression estimation, VIF values ranged from 1.74 to 5.77, with a mean of 2.99. Adjusted R2 values were higher for rural comprehensive price, facilities, and scenery models (0.591, 0.367, and 0.310) and for mountain-type transportation and scenery models (0.320 and 0.222). RE and FE models were compared for all 12 destination-type–dimension combinations. Hausman p-values ranged from 0.137 to 0.798, while Breusch–Pagan LM p-values ranged from 0.213 to 1.000 and random-intercept variance shares ranged from 0 to 0.183. Across 84 coefficient comparisons, 82 signs and all 84 10% significance classifications were unchanged between pooled OLS and RE. These diagnostics support retaining pooled OLS as the primary specification; the limitations of the short panel and possible omitted-variable bias are discussed in Section 5.
For rural comprehensive destinations, urbanization rate was positively associated with service (0.003, p < 0.1), price (0.004, p < 0.01), facilities (0.003, p < 0.05), and experience (0.002, p < 0.1).
For rural comprehensive destinations, vegetation contrast was negatively associated with scenery (−0.264, p < 0.01) and price (−0.309, p < 0.05). Per capita GDP was negatively associated with price (−0.006, p < 0.05) and facilities (−0.007, p < 0.05) (Table 6a).
For mountain-type destinations, annual temperature difference was negatively associated with scenery (−0.006, p < 0.05) and experience (−0.004, p < 0.1).
The number of high-level scenic sites in the origin region was negatively associated with mountain-type price perceptions (−0.010, p < 0.05). Per capita GDP was weakly negatively associated with scenery (−0.005, p < 0.1) and experience (−0.004, p < 0.1) (Table 6a).
Minimum public-transit travel time was not statistically significant in most models. A weak positive association was observed for rural-comprehensive price perceptions (0.008, p < 0.1) (Table 6a).
Overall, rural-comprehensive evaluations showed associations with urbanization, vegetation contrast, and GDP in selected dimensions, whereas mountain-type evaluations showed associations with temperature difference, origin-region scenic resources, and GDP. The coefficients represent conditional associations rather than causal effects.
4. Conclusions
Focusing on mountain-type and rural comprehensive destinations in Shangrao, this study used the archived corpus of 23,439 OTA reviews, with the full 23,439-review corpus covering 2019–2025 used for annual temporal comparisons for sentiment, thematic, and temporal analyses, and a separate subset of reviews posted from 1 August 2022 with official IP labels aggregated into 2022–2024 province–year observations for pooled ordinary least squares regression. By integrating lexicon-guided XLM-RoBERTa sentiment analysis, BERTopic-based thematic clustering, and Pooled OLS, it examined the spatiotemporal differentiation, thematic evolution, and macro-level correlates of tourist perceptions. The main conclusions are as follows.
- (1)
- Tourist perception varies in relation to both destination-side attributes and the macro-contexts of tourists’ origin regions, and these associations differ across destination types and perception dimensions. Rural comprehensive destinations are more sensitive to origin-region differences in urbanization, ecological background, and consumption conditions, whereas mountain-type destinations are more strongly associated with climate difference and tourism resource substitution. This finding indicates that tourist evaluations should be understood as relational and context-dependent rather than as simple reflections of on-site service quality.
- (2)
- Rural comprehensive destinations show a clear thematic restructuring over time, with tourist attention shifting from traditional agricultural landscapes toward emerging experiential products, especially nighttime performances. By contrast, mountain-type destinations maintain a relatively stable demand structure centered on natural scenery, although accessibility-related concerns become more salient in the later period. This suggests that the two destination types differ not only in current perception structure but also in the dynamics of demand evolution.
- (3)
- The two destination types exhibit distinct satisfaction mechanisms and optimization priorities. In both types, scenery is a major source of positive evaluation, while price remains a common weakness. However, mountain-type destinations are constrained mainly by accessibility and physical travel burden, whereas rural comprehensive destinations increasingly rely on innovative experiential products to compensate for the weakening attraction of traditional landscape resources. These differences imply that heterogeneous tourism spaces within the same municipal region cannot be effectively interpreted or managed through a single development logic.
Overall, this study shows that tourist perception in heterogeneous destinations is associated with both internal destination attributes and external origin-region contexts. It also highlights the value of integrating VGI-based text mining with cross-scale spatial analysis for understanding differentiated tourist experiences within a composite tourism city.
5. Discussion
5.1. Interpretation of Spatial Differentiation and Regression Mechanisms
This study contributes to the tourism geography literature by showing that tourist perception within a single municipal tourism system is far from homogeneous. Rather than treating Shangrao as a unified destination [8,9], this study demonstrates that mountain-type and rural comprehensive destinations differ substantially in perception structure, demand evolution, and cross-scale patterns of association. This finding reinforces the importance of moving from aggregate destination-level analysis to the examination of heterogeneous tourism spaces within the same territorial system.
A key implication of the findings is that destination heterogeneity is not only expressed in static differences in tourist evaluation, but also in distinct patterns of perception formation. In mountain-type destinations, tourist perception remains strongly anchored in natural scenery, but overall evaluation is increasingly associated with accessibility, physical effort, and travel comfort. In rural comprehensive destinations, by contrast, perception is more closely linked to the interaction between traditional rural imagery and newly created experiential products. This suggests that satisfaction in different destination types is associated with different combinations of core attraction, supporting services, and experiential innovation. This pattern also echoes the broader transition in rural tourism from gaze-oriented sightseeing toward immersive and experience-oriented consumption [51].
Figure 3 is best read as a spatial expression of an origin–destination relationship rather than as a direct map of destination quality. Under a push–pull interpretation, the pull of mountain scenery or rural cultural experiences is filtered through origin-side push conditions and reference frames, including urban density, daily ecological exposure, climatic background, income, and locally available substitute attractions. For mountain-type destinations, the relatively high scores in several western origin provinces may indicate strong perceived attraction or contrast for some markets, but the regression results show that climatic difference, origin scenic-resource endowment, and GDP—not a simple west–east dummy—are the more relevant conditional correlates. For rural comprehensive destinations, the fragmented high-value areas across northeastern, southwestern, and coastal origins, together with the absence of a stable gradient for service and facilities, are more consistent with varying urbanization and ecological comparison contexts than with geographical direction alone. The map and regression evidence therefore support a relational interpretation, not a deterministic east–west or north–south explanation.
For rural comprehensive destinations, urbanization is positively associated with service, price, facilities, and overall experience. A plausible transmission chain is: denser and more artificial everyday urban environments strengthen escape and novelty motives; village settings, cultural activities, accommodation, and nighttime products then provide a stronger experiential contrast; and this contrast is reflected in more positive evaluations across several dimensions. An alternative explanation is market self-selection: urban residents who choose rural leisure may already prefer integrated rural products. Moreover, urban visitors may also hold higher service expectations, so the observed positive association should not be interpreted as an automatic effect of urbanization.
The negative rural coefficients for vegetation–ecological difference in scenery and price require particular care. The model uses the absolute origin–destination difference in population-weighted NDVI, not the signed NDVI level of the origin. The coefficient therefore indicates that a larger ecological mismatch is associated with more critical scenery and value evaluations; it does not by itself show that visitors necessarily come from greener regions. One possible chain is that a larger ecological mismatch produces a weaker fit with the visitor’s anticipated pastoral image or comparison frame, reducing perceived scenery quality and value. A second mechanism—abundant daily green exposure in greener origins reducing the novelty of rural landscapes and raising evaluation standards—is theoretically plausible, but separating it would require signed origin NDVI or directional contrast in a future specification. The negative rural GDP associations with price and facilities are compatible with a comparison-standard mechanism: visitors from wealthier origins may have more tourism alternatives and higher service/value benchmarks, making them more critical of pricing and supporting facilities. Alternatively, they may select higher-priced product bundles or peak-period trips, which cannot be observed in the province–year data.
For mountain-type destinations, larger annual temperature differences are negatively associated with scenery and overall experience. A plausible chain is: greater climatic mismatch increases physiological adaptation costs and the likelihood of discomfort or unsuitable clothing and timing; mountain weather may also reduce visibility or trail usability; these conditions then lower landscape and trip-level evaluations. Seasonal travel composition and unobserved weather at the visit date remain alternative explanations. The negative association between origin-region high-level scenic-resource endowment and mountain price perception is consistent with tourism-resource substitution and reference pricing: residents with more comparable scenic areas nearby face lower scarcity, possess more comparison experience, and may judge tickets, cableways, and supporting consumption more strictly. The weak negative GDP associations with mountain scenery and experience may similarly reflect higher quality benchmarks and wider substitute choice, although visitor composition and trip timing may also contribute.
Minimum public-transit travel time is insignificant in most models. Its weak positive association with rural price perception may reflect the self-selection of highly committed rural tourists, longer-stay product bundles, or post-purchase rationalization rather than a benefit of travel friction. Because this result is weak and not repeated across dimensions, it is not used to recommend longer travel or reduced accessibility. Taken together, these mechanisms are theoretically informed interpretations of conditional associations, not identified causal pathways; individual expectations, actual routes, visit seasons, and site-level operational shocks remain unobserved.
Another important implication concerns temporal change. The findings indicate that destination competitiveness should not be judged solely on the basis of current satisfaction levels. For mountain-type destinations, the main challenge lies in improving service comfort around an otherwise stable scenic core. For rural comprehensive destinations, however, long-term competitiveness depends more heavily on the ability to sustain product innovation and continually renew experiential content. This difference suggests that demand evolution is itself type-specific and should be incorporated into destination management and planning.
Methodologically, this study demonstrates the empirical value of combining established sentiment analysis, topic modeling, and regression tools within a transparent cross-scale workflow. Its contribution is not a new NLP algorithm or econometric estimator. Rather, it lies in the reproducible linkage of review-level sentiment and topic outputs, the comparison of heterogeneous tourism spaces within one municipal system, the construction of spatially comparable indicators, and the aggregation of IP-labeled reviews into province–year observations for contextual analysis. This design links micro-level textual perception, meso-level topic evolution, and macro-level geographic factors in a way that is useful for composite destinations, where internal tourism spaces may differ substantially in resource base, development model, and visitor experience.
5.2. Layered and Type-Specific Governance Strategies
The practical implications are organized at three implementation levels—municipal coordination, destination operations, and origin-market targeting—so that the two destination types are not managed through a homogeneous policy package. Each recommendation is matched to the empirical weaknesses identified in the sentiment, topic, temporal, and regression analyses.
At the municipal coordination level, Shangrao’s cultural and tourism authorities should manage the six sites as a differentiated portfolio. City-wide functions should include integrated transport and transfer information, coordinated peak-period reservations, cross-site emergency and rescue protocols, common review-monitoring indicators, and differentiated investment standards. Mountain access investment should be linked to ecological carrying capacity and safety, while rural product funding should be linked to resident benefits, cultural authenticity, waste and noise control, and basic-service performance. A municipal dashboard should track accessibility and queueing for mountain sites, and commercialization, nighttime-product renewal, last-mile transport, accommodation, and resident outcomes for rural sites.
At the mountain-destination operational level, the stable scenic core should be protected while the increasing salience of accessibility and physical burden is addressed. Operators should use time-slot reservations, real-time queue information, dynamic cableway dispatch, and—only where environmental and safety assessment supports it—targeted cableway or shuttle-capacity expansion at verified bottlenecks. Climbing routes should be graded by difficulty, connected through one-way or peak-separating circuits where feasible, and supplemented with rest nodes, water points, toilets, weather alerts, and alternative routes for elderly or mobility-limited visitors. Transparent ticket and cableway bundles can also reduce the price-comparison pressure observed among visitors from origin regions rich in substitute scenic resources.
At the rural-comprehensive operational level, product renewal should be combined with limits on excessive commercialization. Village collectives and residents should participate in defining commercial-use zones, vendor mix, architectural guidelines, performance content, and benefit-sharing rules. Night-tour products should be iterated through seasonal storylines, rotating performances, small-scale participatory activities, and cultural interpretation rather than relying on repetitive visual spectacle. Carrying-capacity, noise, lighting, waste, and energy thresholds should be monitored concurrently. Last-mile shuttles, parking-to-village transfers, accommodation standards, toilets, signage, and transparent package pricing should be strengthened because transportation, facilities, price, and over-commercialization remain recurring concerns.
At the origin-market targeting level, marketing and pre-trip information should respond to the observed contextual differences without treating province-level correlations as deterministic individual profiles. Highly urbanized markets can be offered low-density rural stays, participatory cultural activities, and nighttime itineraries; affluent or scenic-resource-rich markets require clearer evidence of uniqueness, service quality, and value rather than generic scenery claims. For mountain visitors from climatically different regions, weather, clothing, altitude, trail difficulty, and contingency information should be provided before departure. Campaign performance should be evaluated by origin segment and perception dimension, allowing the city and operators to update products and messages rather than assuming a uniform national market.
These implications can be operationalized within a community-based and sustainable tourism governance framework [52,53]. Participatory monitoring should involve residents, village collectives, tourism businesses, and public agencies, while review-derived perception signals should be assessed together with ecological pressure, service capacity, resident benefits, and distributional effects, consistent with the UNWTO indicator logic [54]. For mountain-type destinations, accessibility and visitor-flow measures should be linked to ecological thresholds, landscape protection, and community benefit allocation. For rural comprehensive destinations, residents should participate in product co-design, with safeguards for cultural authenticity, local ownership, fair benefit sharing, and waste and energy management. At the municipal scale, an adaptive dashboard combining perception, economic, social, and environmental indicators would support periodic stakeholder review and make the recommendations transferable to other community-based tourism regions, consistent with the OECD emphasis on integrated and place-sensitive policy [55].
5.3. Limitations
Several limitations should be acknowledged. First, due to the geographic granularity and anonymity constraints of OTA reviews—a common methodological challenge in current VGI-based tourism research [56]—origin-related characteristics were identified only at the provincial scale, which limits the ability to capture intra-provincial variation and individual-level heterogeneity. Second, the macro-level analysis relies on the review subsample with official IP-location information available from 1 August 2022, resulting in a relatively short province–year observation window for regression analysis. Third, mean sentiment scores are effective for capturing general evaluation tendencies, but less sensitive to extreme emotions, polarization, and short-term holiday effects. Fourth, pooled OLS, RE, Hausman, and year-effect diagnostics cannot remove bias from unobserved travel circumstances, destination operations, or visitor self-selection; the short three-year panel also limits the power of specification tests. Fifth, the six perception dimensions were operationalized from prior literature and corpus coverage rather than validated through an independent expert panel or a separate field pilot. They therefore represent categories of expressed OTA-review discourse and should not be treated as exhaustive psychometric constructs of tourist perception. Future research should combine expert assessment, independent intercoder testing, visitor surveys, field observation, LBS trajectory data, and multi-source data fusion to evaluate convergent validity and trace tourist perception at finer spatiotemporal scales. Sixth, destination-level review volume is uneven, and the particularly small early Wangxiangu counts reduce the precision of some year-specific topic rates; the normalized indicators limit but do not eliminate this concern. Seventh, the validation results indicate weaker discrimination of neutral sentiment and only moderate precision for lexicon-guided aspect identification; consequently, the derived scores are most appropriate for aggregate comparative analysis and should not be interpreted as error-free classifications of individual reviews. Eighth, the dominant-function destination-product typology is purpose- and scale-dependent. It supports a reproducible comparison among the six independent review units, but a hybrid site could be classified differently at another spatial scale or for another research purpose; the categories should not be read as a universal geomorphological division between mountain and rural space.
Author Contributions
Conceptualization, Zongrong Liu and Yu Xia; methodology, Zongrong Liu and Yu Xia; validation, Zongrong Liu; formal analysis, Zongrong Liu; investigation, Zongrong Liu; resources, Zongrong Liu; data curation, Zongrong Liu; writing—original draft preparation, Zongrong Liu; writing—review and editing, Yu Xia; visualization, Zongrong Liu; supervision, Yu Xia; project administration, Yu Xia; funding acquisition, Yu Xia. All authors have read and agreed to the published version of the manuscript.
Funding
The Project is supported by the Natural Science Foundation of Jiangxi, China (No. 20224BAB202039).
Data Availability Statement
The online travel reviews used in this study were collected via web crawling from the Ctrip online travel agency (OTA) platform, and the related destination and origin-region variables were obtained from publicly accessible official online sources. All data sources are open to the public, and only publicly displayed information was accessed. No personal, private, or restricted information was involved in the research.
Conflicts of Interest
The authors declare no conflicts of interest.
References
- Godovykh, M.; Tasci, A.D. Customer experience in tourism: A review of definitions, components, and measurements. Tour. Manag. Perspect. 2020, 35, 100694. [Google Scholar] [CrossRef] [Scilit]
- Buhalis, D.; Sinarta, Y. Real-time co-creation and nowness service: Lessons from tourism and hospitality. J. Travel Tour. Mark. 2019, 36, 563–582. [Google Scholar] [CrossRef] [Scilit]
- Bi, J.-W.; Liu, Y.; Fan, Z.-P.; Zhang, J. Wisdom of crowds: Conducting importance-performance analysis (IPA) through online reviews. Tour. Manag. 2019, 70, 460–478. [Google Scholar] [CrossRef] [Scilit]
- Wang, J.; Li, Y.; Wu, B.; Wang, Y. Tourism destination image based on tourism user generated content on internet. Tour. Rev. 2021, 76, 125–137. [Google Scholar] [CrossRef] [Scilit]
- Sujatmiko, S.; Ar, D.P.; Hamdat, A.; Salam, K.N. User-generated content (UGC) and its impact on tourism marketing: A systematic literature review. Gold. Ratio Mapp. Idea Lit. Format 2025, 5, 97–105. [Google Scholar] [CrossRef] [Scilit]
- Wang, J.; Chow, Y.S.; Biljecki, F. Insights in a city through the eyes of Airbnb reviews: Sensing urban characteristics from homestay guest experiences. Cities 2023, 140, 104399. [Google Scholar] [CrossRef] [Scilit]
- Zhao, Q.; Li, H.; Wang, B.; Xu, P.; Jin, P. Unveiling dynamic determinants of tourism competitiveness: Analysis integrating multimodal data and spatiotemporal machine learning. J. Travel Res. 2025, 65, 1871–1894. [Google Scholar] [CrossRef] [Scilit]
- Shi, S.; Li, M.; Li, Z.; Xi, J. Spatial heterogeneity and influencing factors of high-grade tourist attractions in the Tibetan plateau. Int. J. Environ. Res. Public Health 2023, 20, 4650. [Google Scholar] [CrossRef] [Scilit] [PubMed]
- Almeida, A.; Golpe, A.; Justo, R. Regional tourist heterogeneity in Spain: A dynamic spatial analysis. J. Destin. Mark. Manag. 2021, 21, 100643. [Google Scholar] [CrossRef] [Scilit]
- Saarinen, J. Enclavic tourism spaces: Territorialization and bordering in tourism destination development and planning. In Tourism Planning and Development; Routledge: London, UK, 2019; pp. 119–131. [Google Scholar]
- Kala, D.; Bagri, S.C. Global Opportunities and Challenges for Rural and Mountain Tourism; IGI Global: Hershey, PA, USA, 2020. [Google Scholar]
- Dobre, C.; Linca, A.-C.; Toma, E.; Iorga, A. Sustainable development of rural mountain tourism: Insights from consumer behavior and profiles. Sustainability 2024, 16, 9449. [Google Scholar] [CrossRef] [Scilit]
- Wang, B.; Zhao, Q.; Zhang, Z.; Xu, P.; Tian, X.; Jin, P. Understanding the heterogeneity and dynamics of factors influencing tourist sentiment with online reviews. J. Theor. Appl. Electron. Commer. Res. 2025, 20, 22. [Google Scholar] [CrossRef] [Scilit]
- Paliska, D.; Brezovec, A.; Sedmak, G. Image-based analysis of tourist destination perceptions: A deep learning and spatial–temporal study in Slovenia. Tour. Hosp. 2026, 7, 52. [Google Scholar] [CrossRef] [Scilit]
- Taecharungroj, V.; Mathayomchan, B. Analysing TripAdvisor reviews of tourist attractions in Phuket, Thailand. Tour. Manag. 2019, 75, 550–568. [Google Scholar] [CrossRef] [Scilit]
- Conneau, A.; Khandelwal, K.; Goyal, N.; Chaudhary, V.; Wenzek, G.; Guzmán, F.; Grave, E.; Ott, M.; Zettlemoyer, L.; Stoyanov, V. Unsupervised cross-lingual representation learning at scale. In Proceedings of the 58th Annual Meeting of the Association for Computational Linguistics, Online, 5–10 July 2020; pp. 8440–8451. [Google Scholar]
- Grootendorst, M. BERTopic: Neural topic modeling with a class-based TF-IDF procedure. arXiv 2022, arXiv:2203.05794. [Google Scholar]
- Egger, R.; Yu, J. A topic modeling comparison between LDA, NMF, Top2Vec, and BERTopic to demystify Twitter posts. Front. Sociol. 2022, 7, 886498. [Google Scholar] [CrossRef] [Scilit] [PubMed]
- Sánchez-Franco, M.J.; Rey-Tienda, S. The role of user-generated content in tourism decision-making: An exemplary study of Andalusia, Spain. Manag. Decis. 2024, 62, 2292–2328. [Google Scholar] [CrossRef] [Scilit]
- Masaling, N.A.P.; Suhartono, D. Utilizing RoBERTa and XLM-RoBERTa pre-trained model for structured sentiment analysis. Int. J. Inform. Commun. Technol. 2024, 13, 410–421. [Google Scholar] [CrossRef] [Scilit]
- Rahman, A.; Khan, M.A.; Bishnu, K.K.; Rozario, U.; Ishraq, A.; Mridha, M.F.; Aung, Z. Multilingual sentiment analysis in restaurant reviews using aspect focused learning. Sci. Rep. 2025, 15, 28371. [Google Scholar] [CrossRef] [Scilit] [PubMed]
- Rey-Moreno, M.; Sánchez-Franco, M.J.; Rey-Tienda, M. Examining transaction-specific satisfaction and trust in Airbnb and hotels. An application of BERTopic and zero-shot text classification. Tour. Manag. Stud. 2023, 19, 21–37. [Google Scholar] [CrossRef] [Scilit]
- Hu, T.; Chen, H. Identifying Coastal Cities from the Perspective of “Identity-Structure-Meaning”: A Study of Urban Tourism Imagery in Sanya, China. Sustainability 2023, 15, 15365. [Google Scholar] [CrossRef] [Scilit]
- Tavares, J.M.; Leitão, N.C. The determinants of international tourism demand for Brazil. Tour. Econ. 2017, 23, 834–845. [Google Scholar] [CrossRef] [Scilit]
- Wen, L.; Liu, C.; Song, H. Pooling in tourism demand forecasting. J. Travel Res. 2019, 58, 1161–1174. [Google Scholar] [CrossRef] [Scilit]
- Cameron, A.C.; Miller, D.L. A practitioner’s guide to cluster-robust inference. J. Hum. Resour. 2015, 50, 317–372. [Google Scholar] [CrossRef] [Scilit]
- Chemin, M.; da Silva, C.P.; de Vikou, S.V.P. User-generated content (UGC) in tourist attractions and destinations: Systematic literature review and perspectives for management. PASOS. Rev. Tur. Patrim. Cult. 2025, 23, 539–562. [Google Scholar] [CrossRef] [Scilit]
- Salas-Olmedo, M.H.; Moya-Gómez, B.; García-Palomares, J.C.; Gutiérrez, J. Tourists’ digital footprint in cities: Comparing Big Data sources. Tour. Manag. 2018, 66, 13–25. [Google Scholar] [CrossRef] [Scilit]
- Alaei, A.R.; Becken, S.; Stantic, B. Sentiment analysis in tourism: Capitalizing on big data. J. Travel Res. 2019, 58, 175–191. [Google Scholar] [CrossRef] [Scilit]
- Padilla, J.J.; Kavak, H.; Lynch, C.J.; Gore, R.J.; Diallo, S.Y. Temporal and spatiotemporal investigation of tourist attraction visit sentiment on Twitter. PLoS ONE 2018, 13, e0198857. [Google Scholar] [CrossRef] [Scilit] [PubMed]
- McKercher, B.; Chan, A.; Lam, C. The impact of distance on international tourist movements. J. Travel Res. 2008, 47, 208–224. [Google Scholar] [CrossRef] [Scilit]
- Liu, Y.; Teichert, T.; Rossi, M.; Li, H.; Hu, F. Big data for big insights: Investigating language-specific drivers of hotel satisfaction with 412,784 user-generated reviews. Tour. Manag. 2017, 59, 554–563. [Google Scholar] [CrossRef] [Scilit]
- Wu, Y.; Yang, Y.; Miao, M.; Wu, Y.; Zhu, H. Study on spatial distribution and heritage corridor network of traditional settlements in ancient Huizhou. Buildings 2025, 15, 1641. [Google Scholar] [CrossRef] [Scilit]
- Su, L.; Lian, Q.; Huang, Y. How do tourists’ attribution of destination social responsibility motives impact trust and intention to visit? The moderating role of destination reputation. Tour. Manag. 2020, 77, 103970. [Google Scholar] [CrossRef] [Scilit]
- Kirilenko, A.P.; Stepchenkova, S.O.; Kim, H.; Li, X. Automated sentiment analysis in tourism: Comparison of approaches. J. Travel Res. 2018, 57, 1012–1025. [Google Scholar] [CrossRef] [Scilit]
- Xiang, Z.; Du, Q.; Ma, Y.; Fan, W. A comparative analysis of major online review platforms: Implications for social media analytics in hospitality and tourism. Tour. Manag. 2017, 58, 51–65. [Google Scholar] [CrossRef] [Scilit]
- Xiang, Z.; Schwartz, Z.; Gerdes, J.H., Jr.; Uysal, M. What can big data and text analytics tell us about hotel guest experience and satisfaction? Int. J. Hosp. Manag. 2015, 44, 120–130. [Google Scholar] [CrossRef] [Scilit]
- Huang, S.; Lu, X.; Lu, J.; Zhang, J. Mining the tourism destination image and analyzing influence mechanisms. ISPRS Int. J. Geo-Inf. 2026, 15, 74. [Google Scholar] [CrossRef] [Scilit]
- Barbieri, F.; Espinosa Anke, L.; Camacho-Collados, J. XLM-T: Multilingual Language Models in Twitter for Sentiment Analysis and Beyond. In Proceedings of the Language Resources and Evaluation Conference, Marseille, France, 20–25 June 2022; pp. 258–266. [Google Scholar]
- Wang, D.; Qian, H. Scenic area attractiveness in Dali City and its influencing factors evaluated using multi-source spatiotemporal data. PLoS ONE 2025, 20, e0323310. [Google Scholar] [CrossRef]
- Wu, M.; Jiang, C.; Zhang, Y.; Cao, J.; Cheng, Y.; Liu, Y. Culture vs. distance: Comparing the effects of geographic segmentation variables on tourists’ destination images based on social media data. Comput. Urban Sci. 2021, 1, 14. [Google Scholar] [CrossRef] [Scilit]
- Yuan, J.; Gao, H.; Shen, Y.; Ma, G. Spatial differentiation of ecotourist perceptions based on the random forest model: The case of the Gansu section of the Yellow River basin. Land 2024, 13, 560. [Google Scholar] [CrossRef] [Scilit]
- Yang, Y.; Wong, K.K.F. Spatial distribution of tourist flows to China’s cities. Tour. Geogr. 2013, 15, 338–363. [Google Scholar] [CrossRef] [Scilit]
- Wang, D.; Niu, Y.; Qian, J. Evolution and optimization of China’s urban tourism spatial structure: A high speed rail perspective. Tour. Manag. 2018, 64, 218–232. [Google Scholar] [CrossRef] [Scilit]
- Gössling, S.; Scott, D.; Hall, C.M.; Ceron, J.-P.; Dubois, G. Consumer behaviour and demand response of tourists to climate change. Ann. Tour. Res. 2012, 39, 36–58. [Google Scholar] [CrossRef] [Scilit]
- Zhang, H.; Gu, C.-L.; Gu, L.; Zhang, Y. The evaluation of tourism destination competitiveness by TOPSIS & information entropy–A case in the Yangtze River Delta of China. Tour. Manag. 2011, 32, 443–451. [Google Scholar] [CrossRef] [Scilit]
- Gorelick, N.; Hancher, M.; Dixon, M.; Ilyushchenko, S.; Thau, D.; Moore, R. Google Earth Engine: Planetary-scale geospatial analysis for everyone. Remote Sens. Environ. 2017, 202, 18–27. [Google Scholar] [CrossRef] [Scilit]
- Rittenhouse, C.D.; Pidgeon, A.M.; Albright, T.P.; Culbert, P.D.; Clayton, M.K.; Flather, C.H.; Masek, J.G.; Radeloff, V.C. Land-cover change and avian diversity in the conterminous United States. Conserv. Biol. 2012, 26, 821–829. [Google Scholar] [CrossRef] [Scilit] [PubMed]
- Schinasi, L.; Bakhtsiyarava, M.; Sanchez, B. Greenness and excess deaths from heat in 323 Latin American cities: Do associations vary according to climate zone or green space configuration? Environ. Int. 2023, 180, 108230. [Google Scholar] [CrossRef] [Scilit] [PubMed]
- Tatem, A.J. WorldPop, open data for spatial demography. Sci. Data 2017, 4, 170004. [Google Scholar] [CrossRef] [Scilit] [PubMed]
- Kastenholz, E.; Carneiro, M.J.; Marques, C.P.; Loureiro, S.M.C. The dimensions of rural tourism experience: Impacts on arousal, memory, and satisfaction. J. Travel Tour. Mark. 2018, 35, 189–201. [Google Scholar] [CrossRef] [Scilit]
- Okazaki, E. A Community-Based Tourism Model: Its Conception and Use. J. Sustain. Tour. 2008, 16, 511–529. [Google Scholar] [CrossRef]
- Burgos, A.; Mertens, F. Participatory management of community-based tourism: A network perspective. Community Dev. 2017, 48, 546–565. [Google Scholar] [CrossRef] [Scilit]
- World Tourism Organization (UNWTO). Indicators of Sustainable Development for Tourism Destinations: A Guidebook; UNWTO: Madrid, Spain, 2004. [Google Scholar] [CrossRef] [Scilit]
- OECD. OECD Tourism Trends and Policies 2024; OECD Publishing: Paris, France, 2024. [Google Scholar] [CrossRef] [Scilit]
- Li, J.; Xu, L.; Tang, L.; Wang, S.; Li, L. Big data in tourism research: A literature review. Tour. Manag. 2018, 68, 301–323. [Google Scholar] [CrossRef] [Scilit]
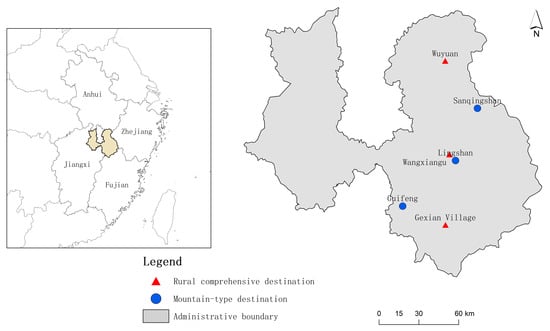
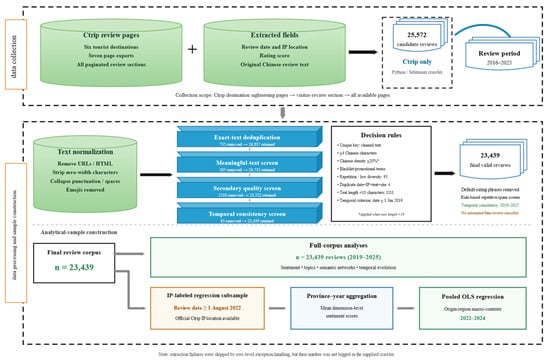
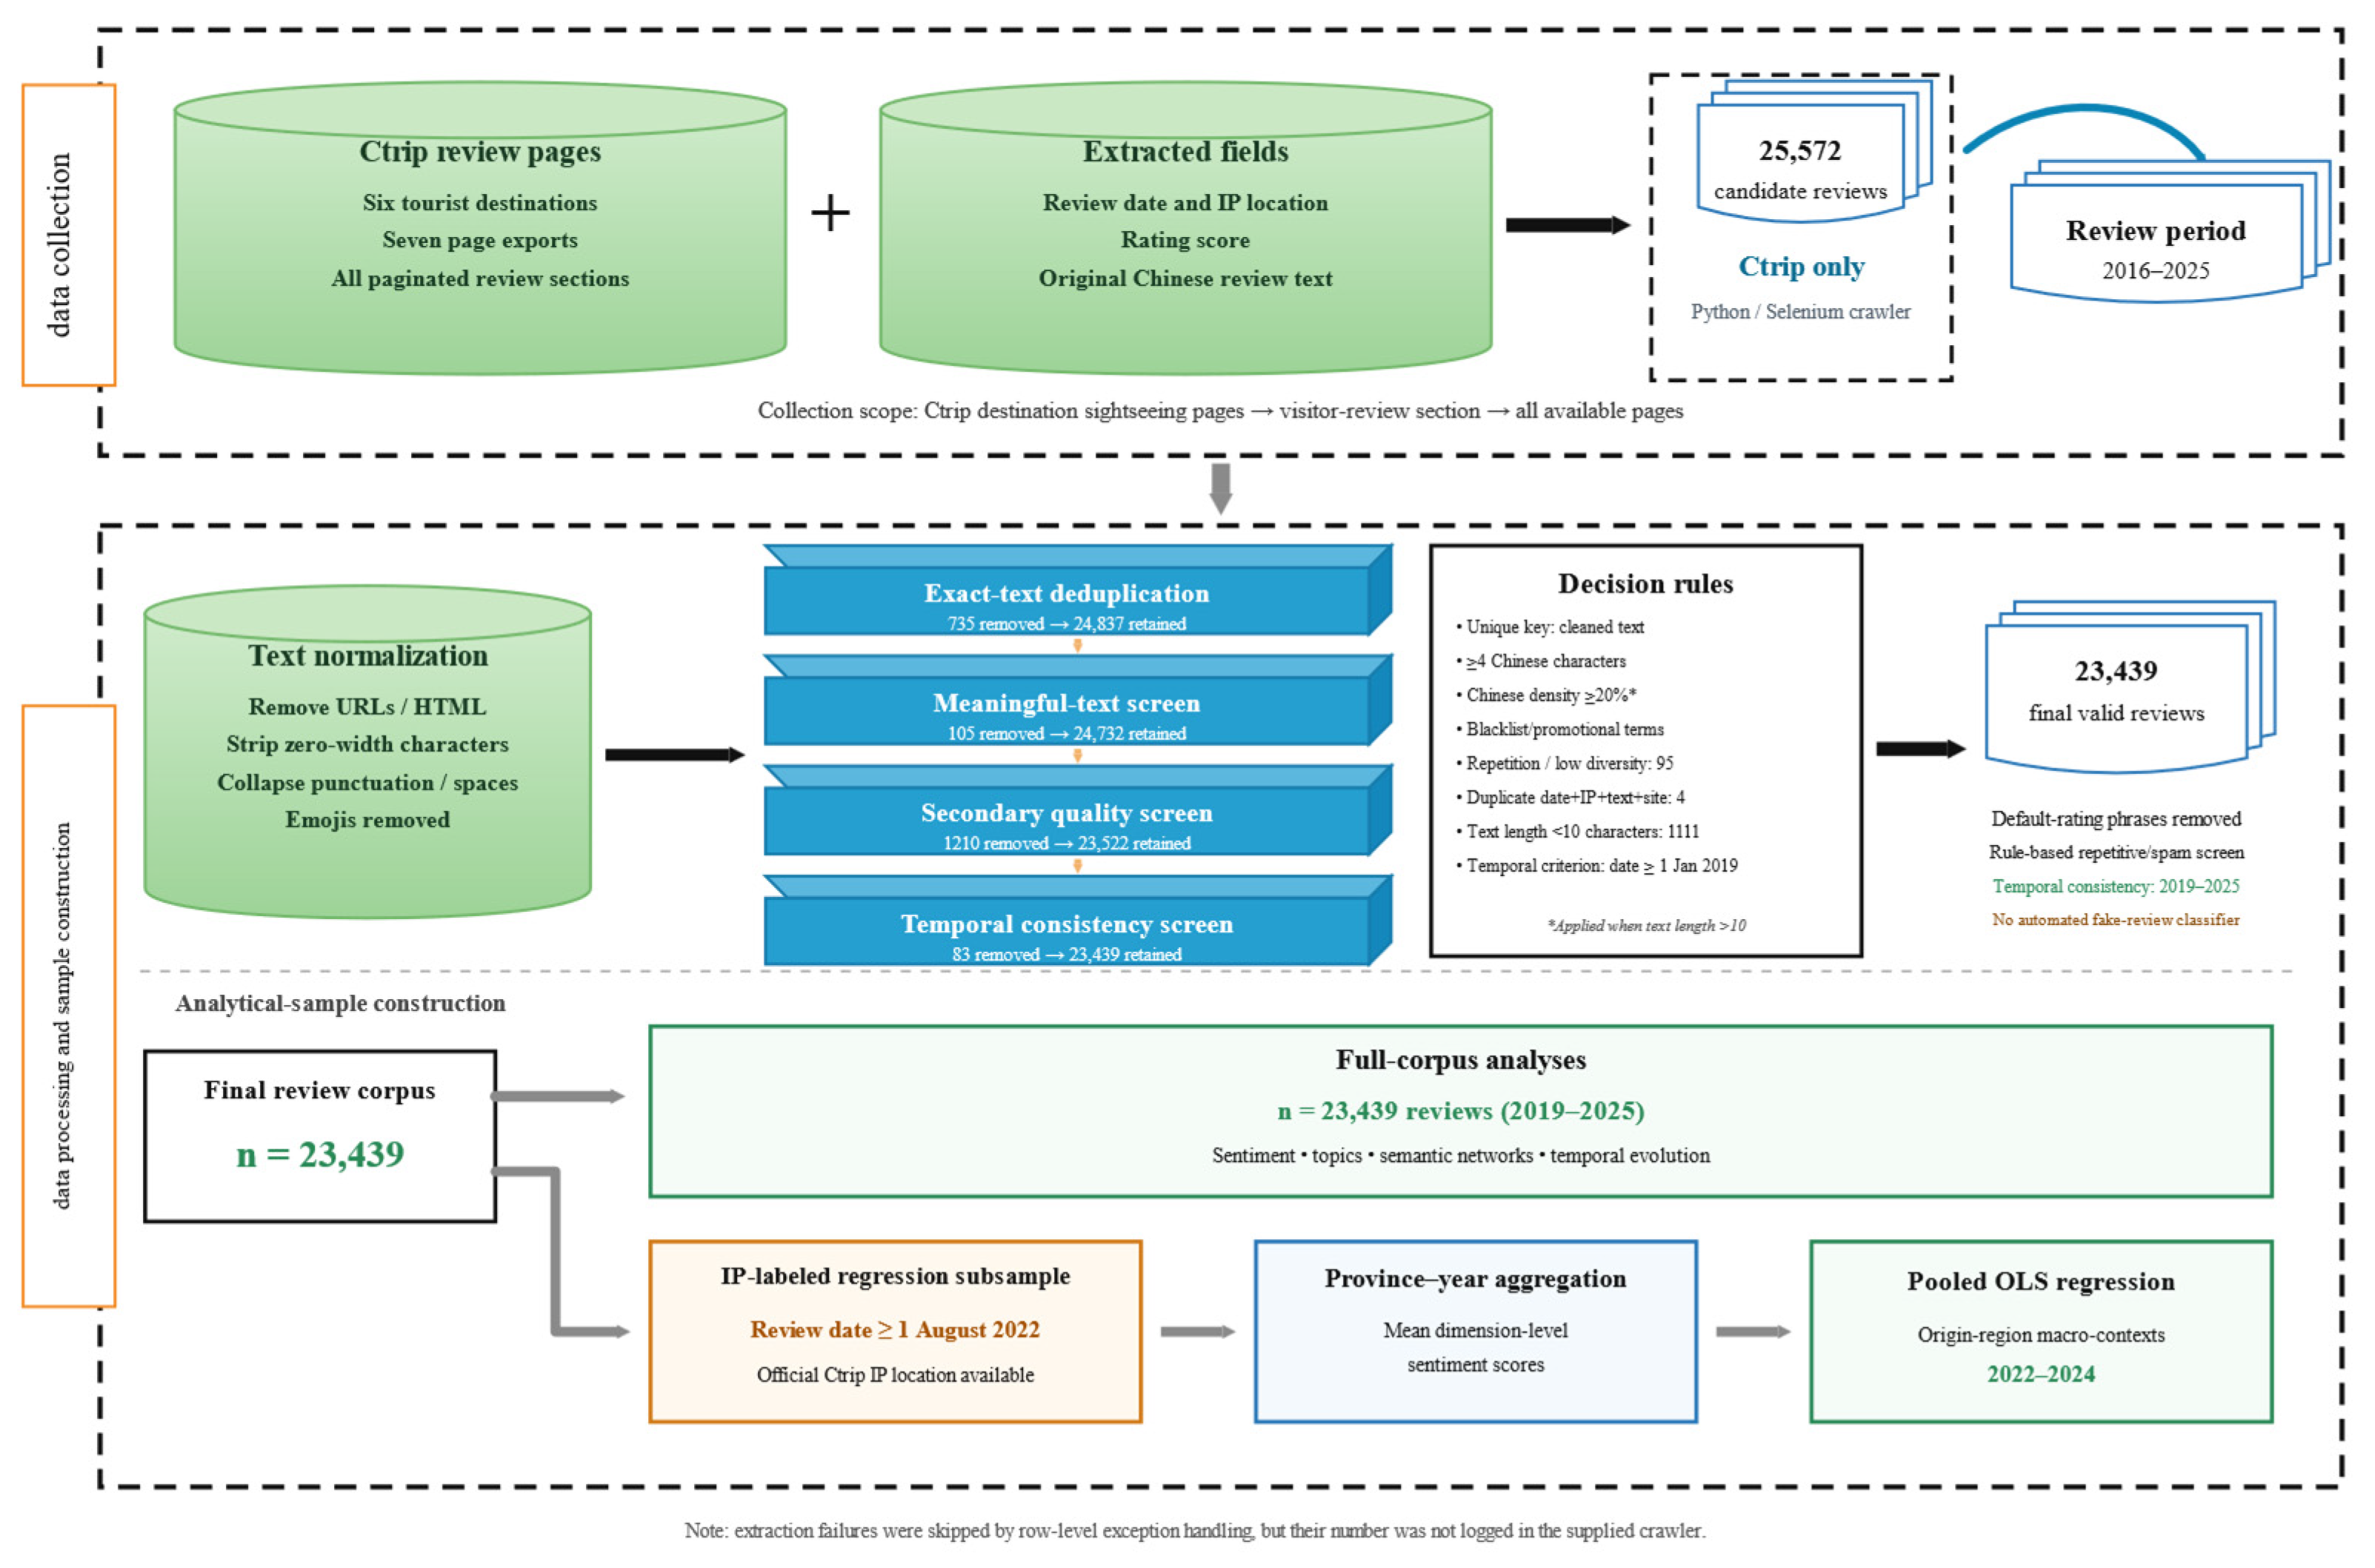
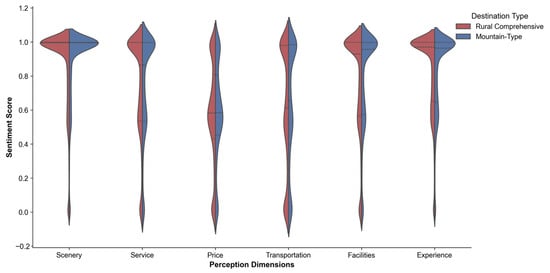
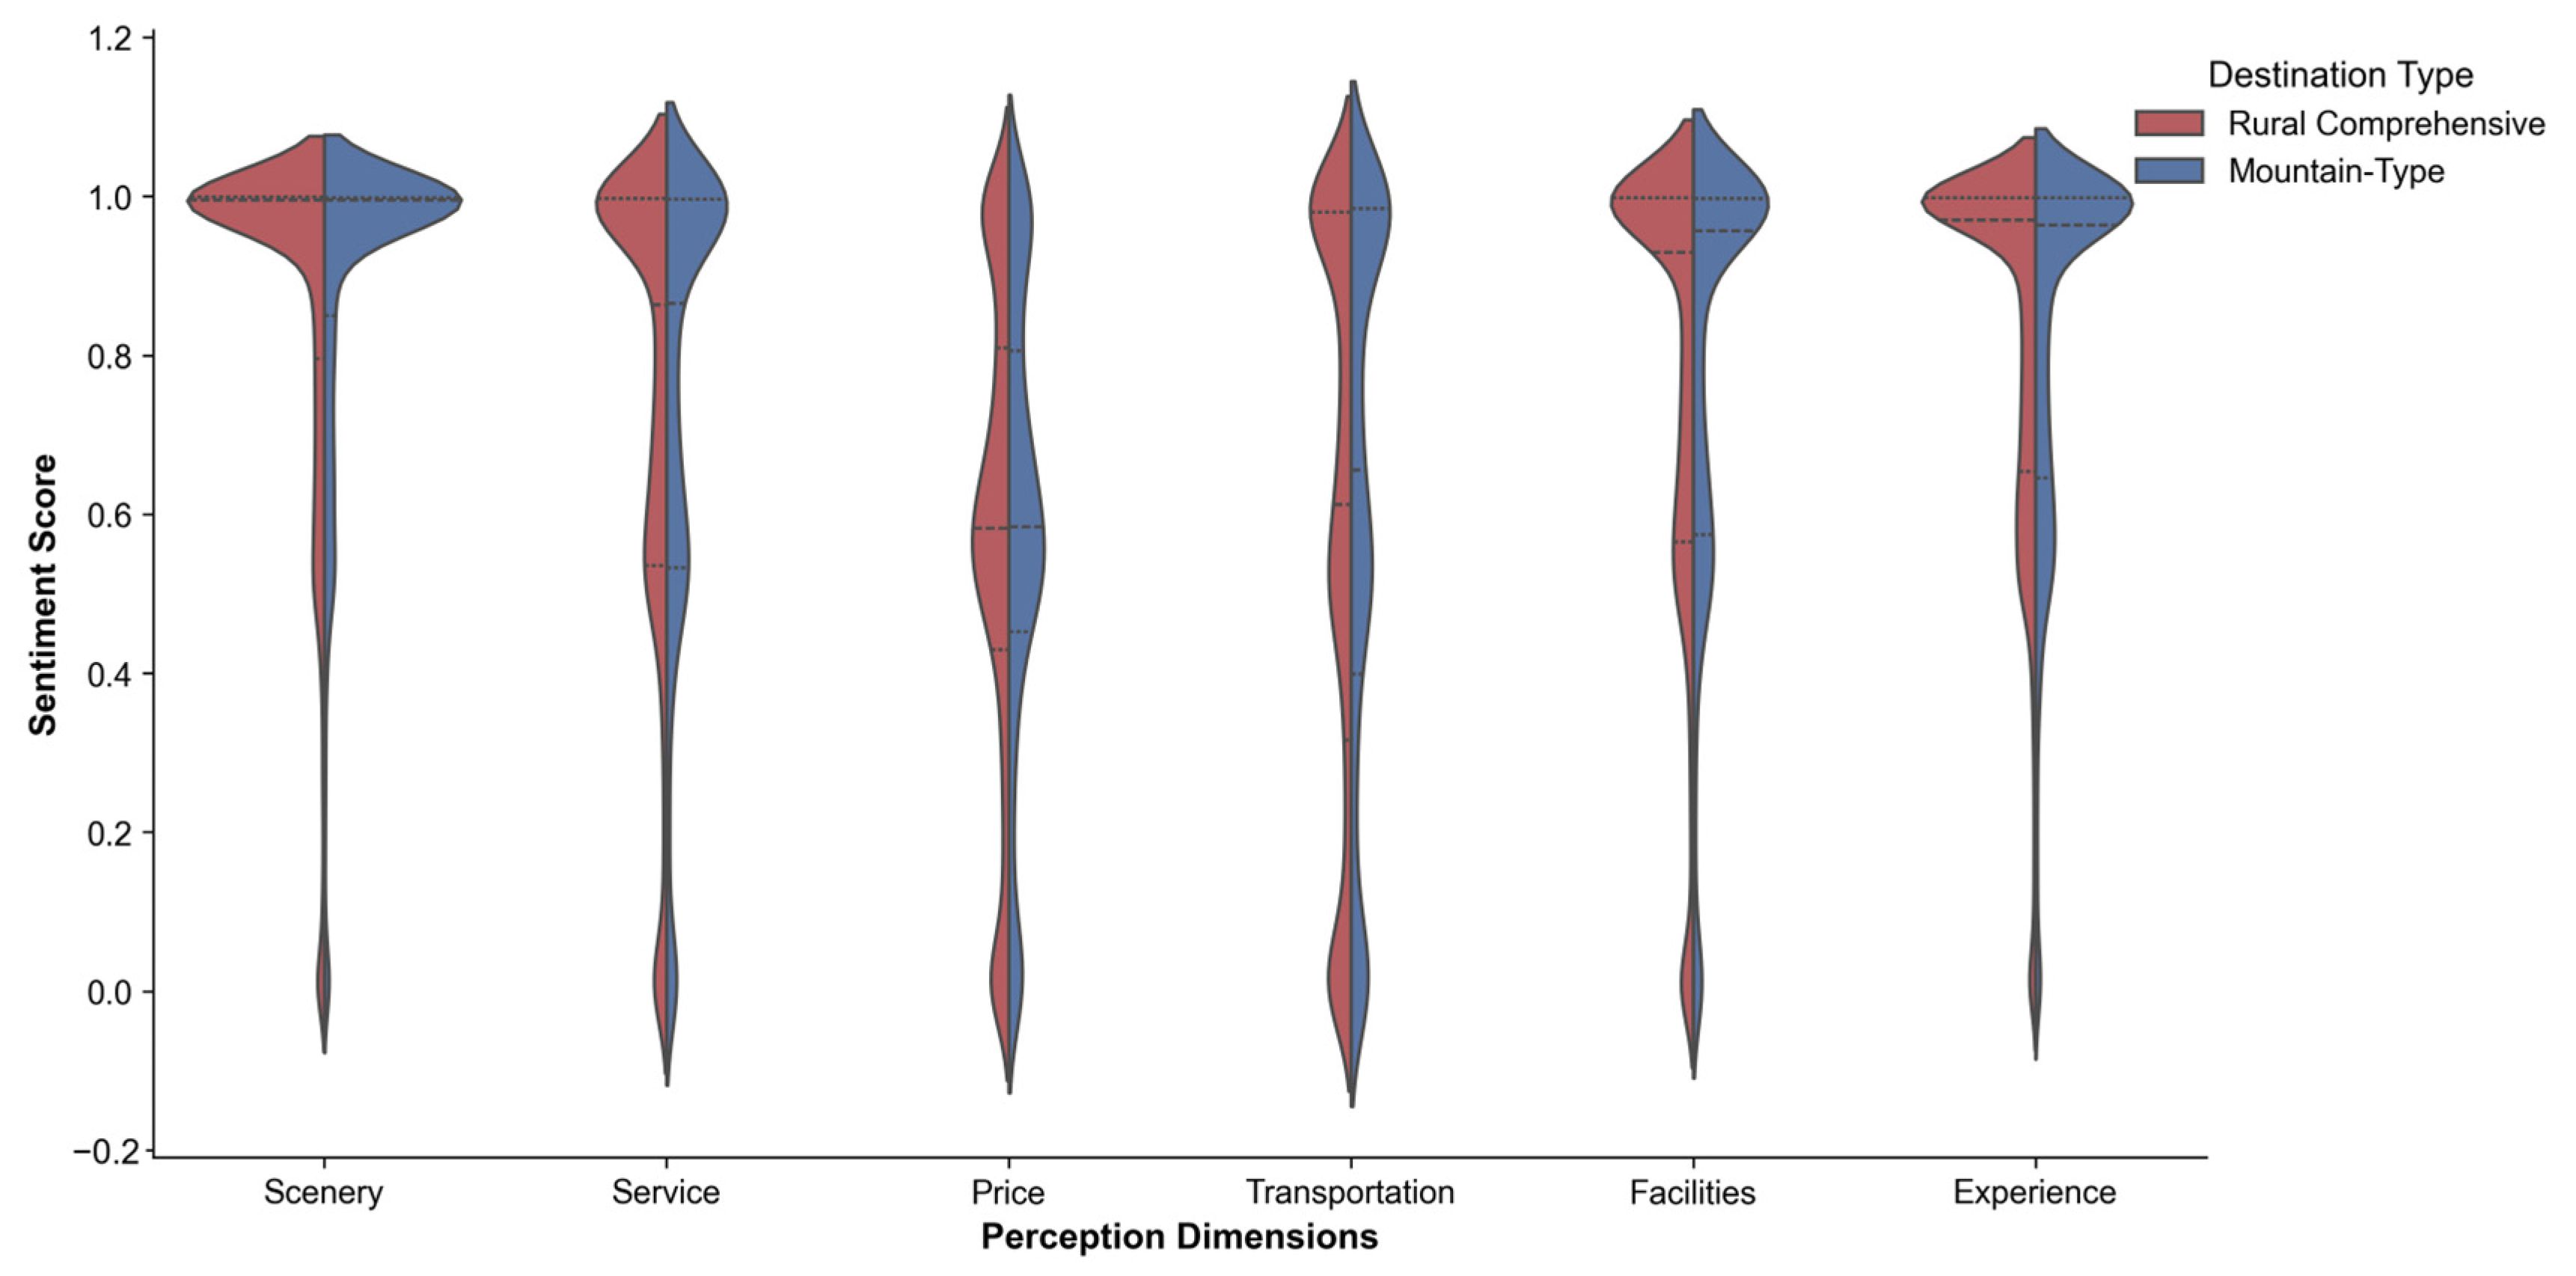
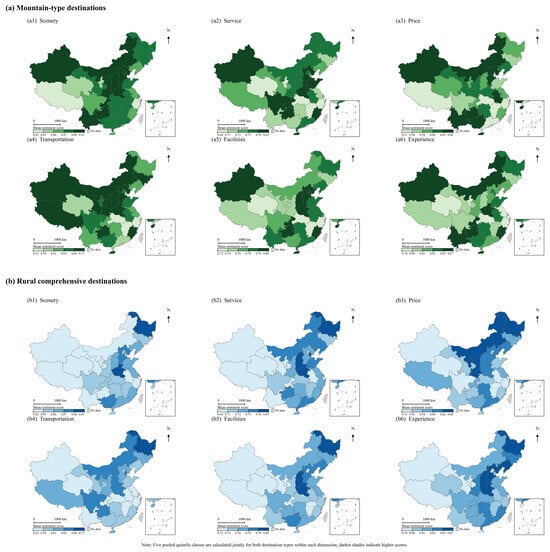
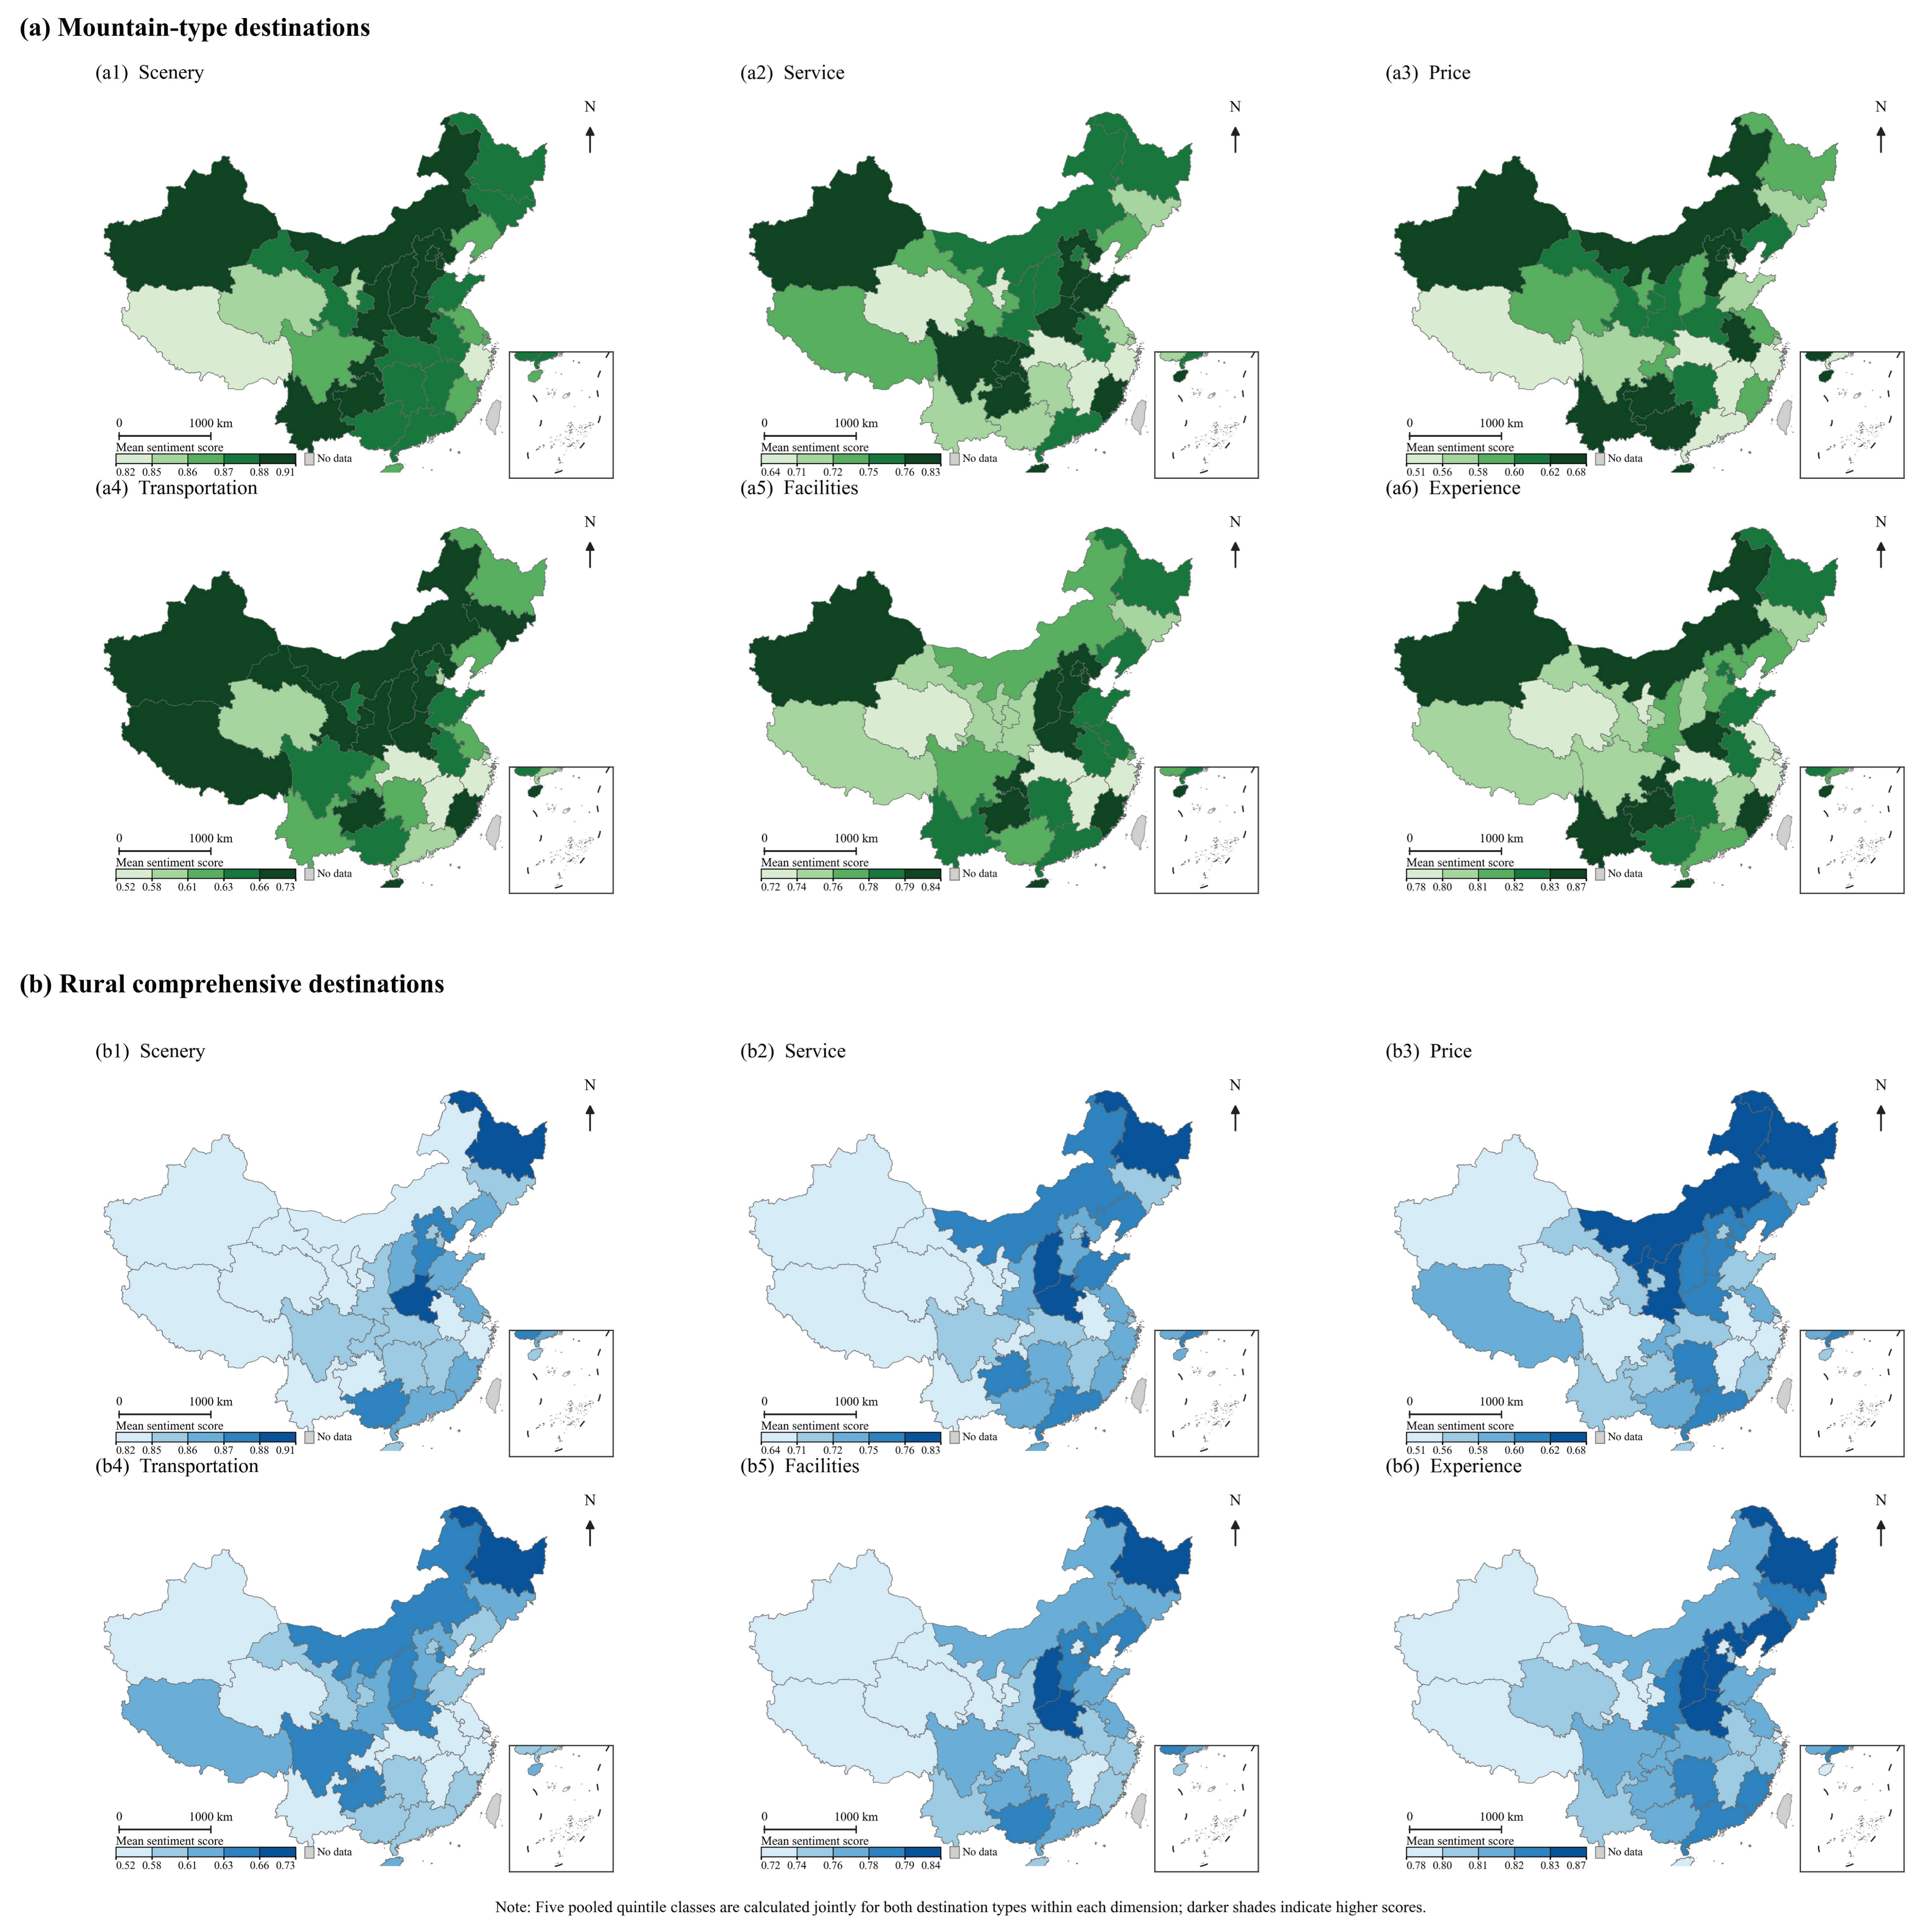
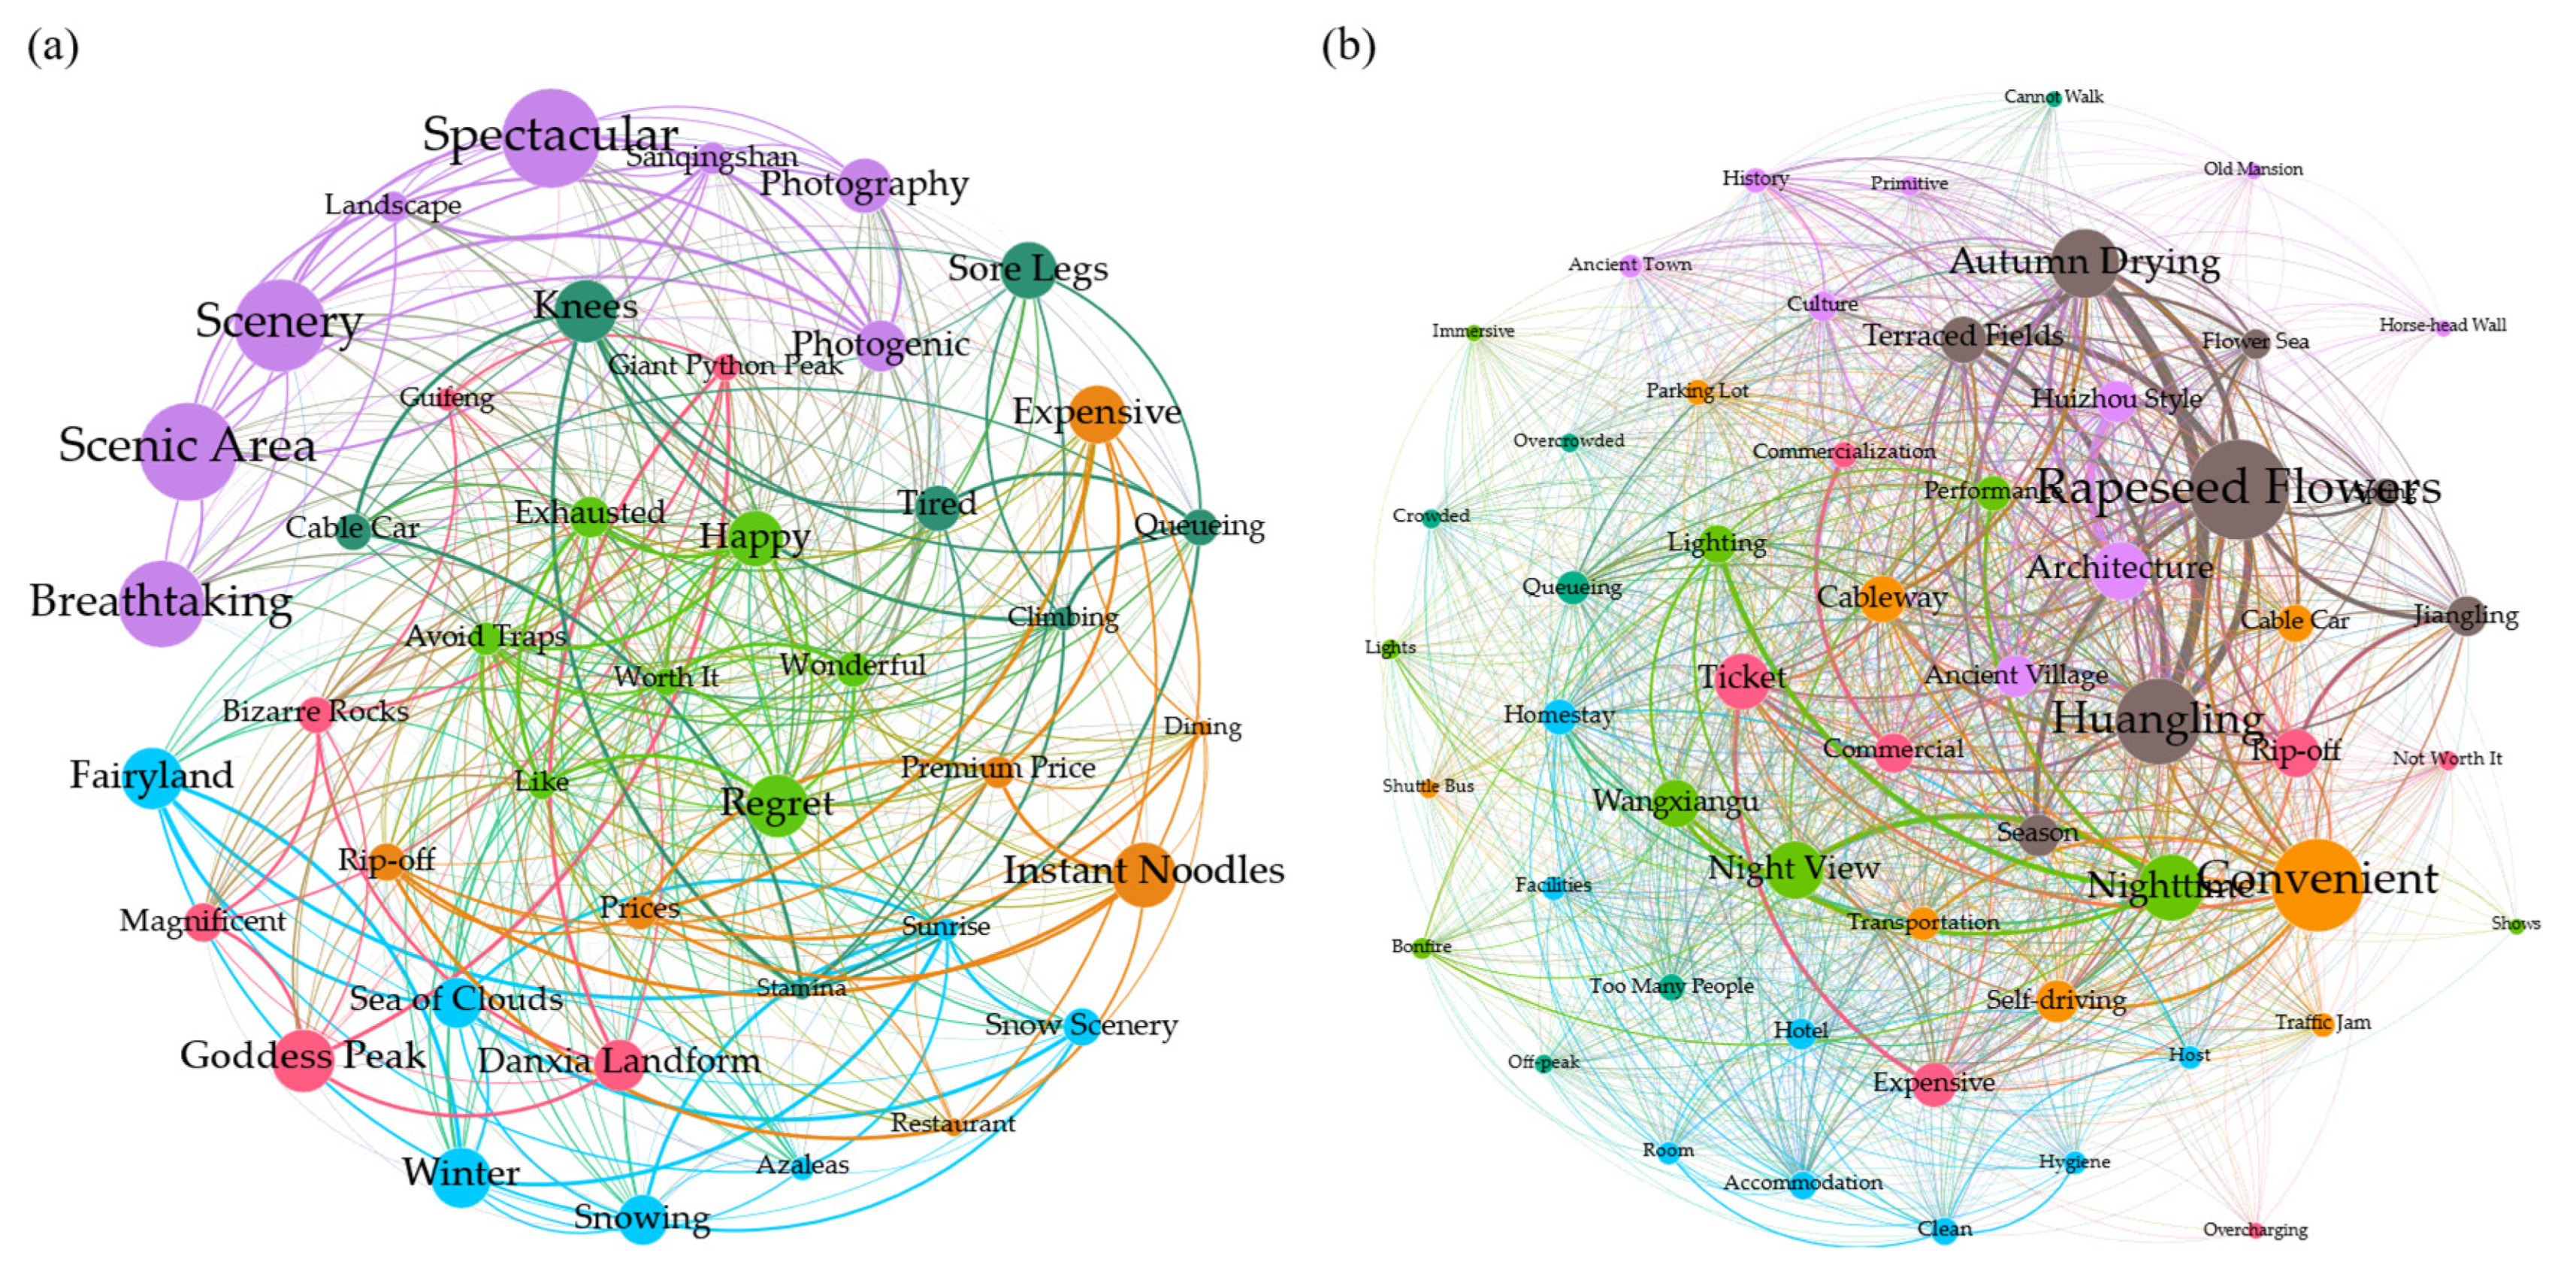
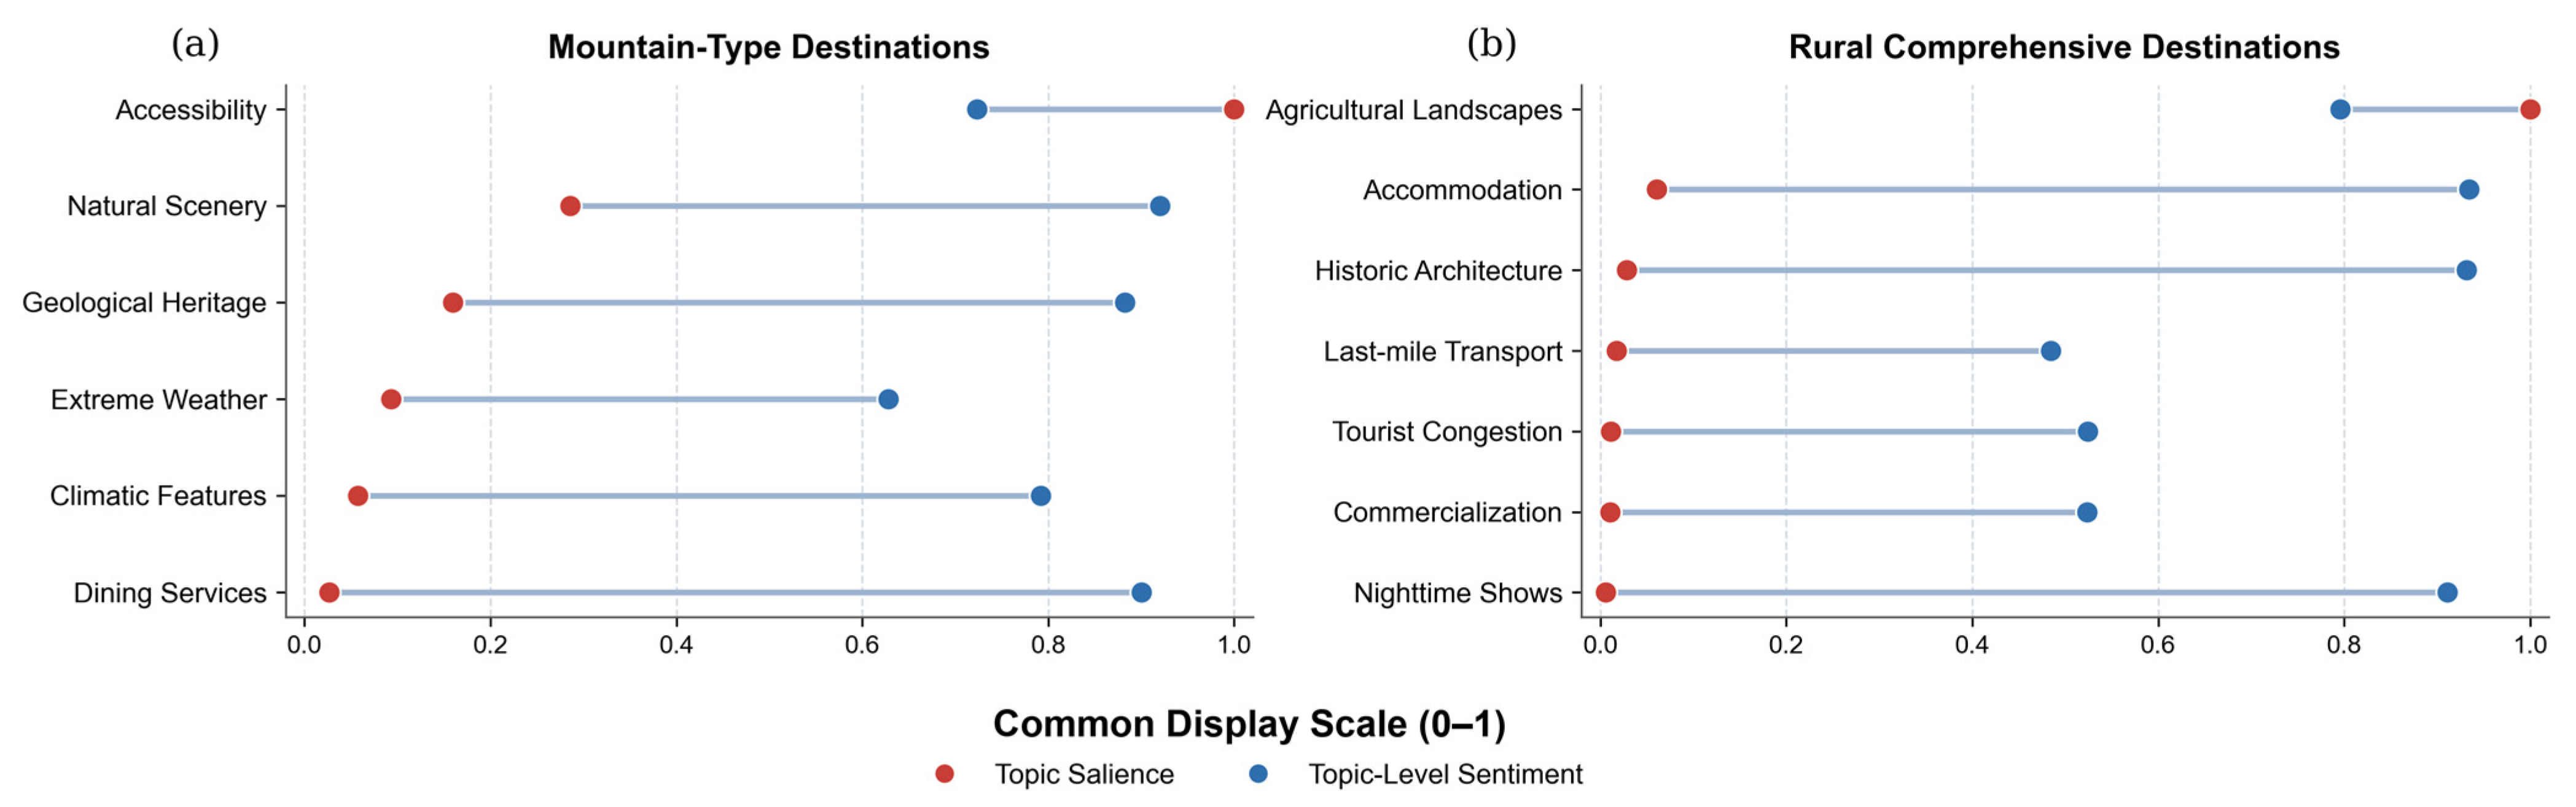
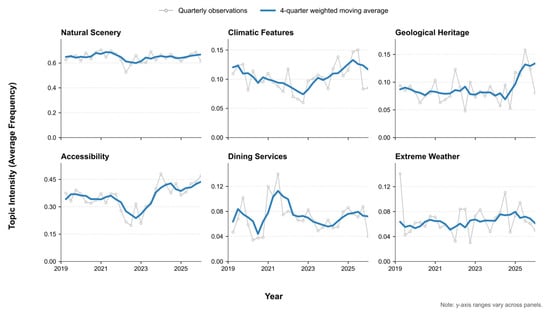
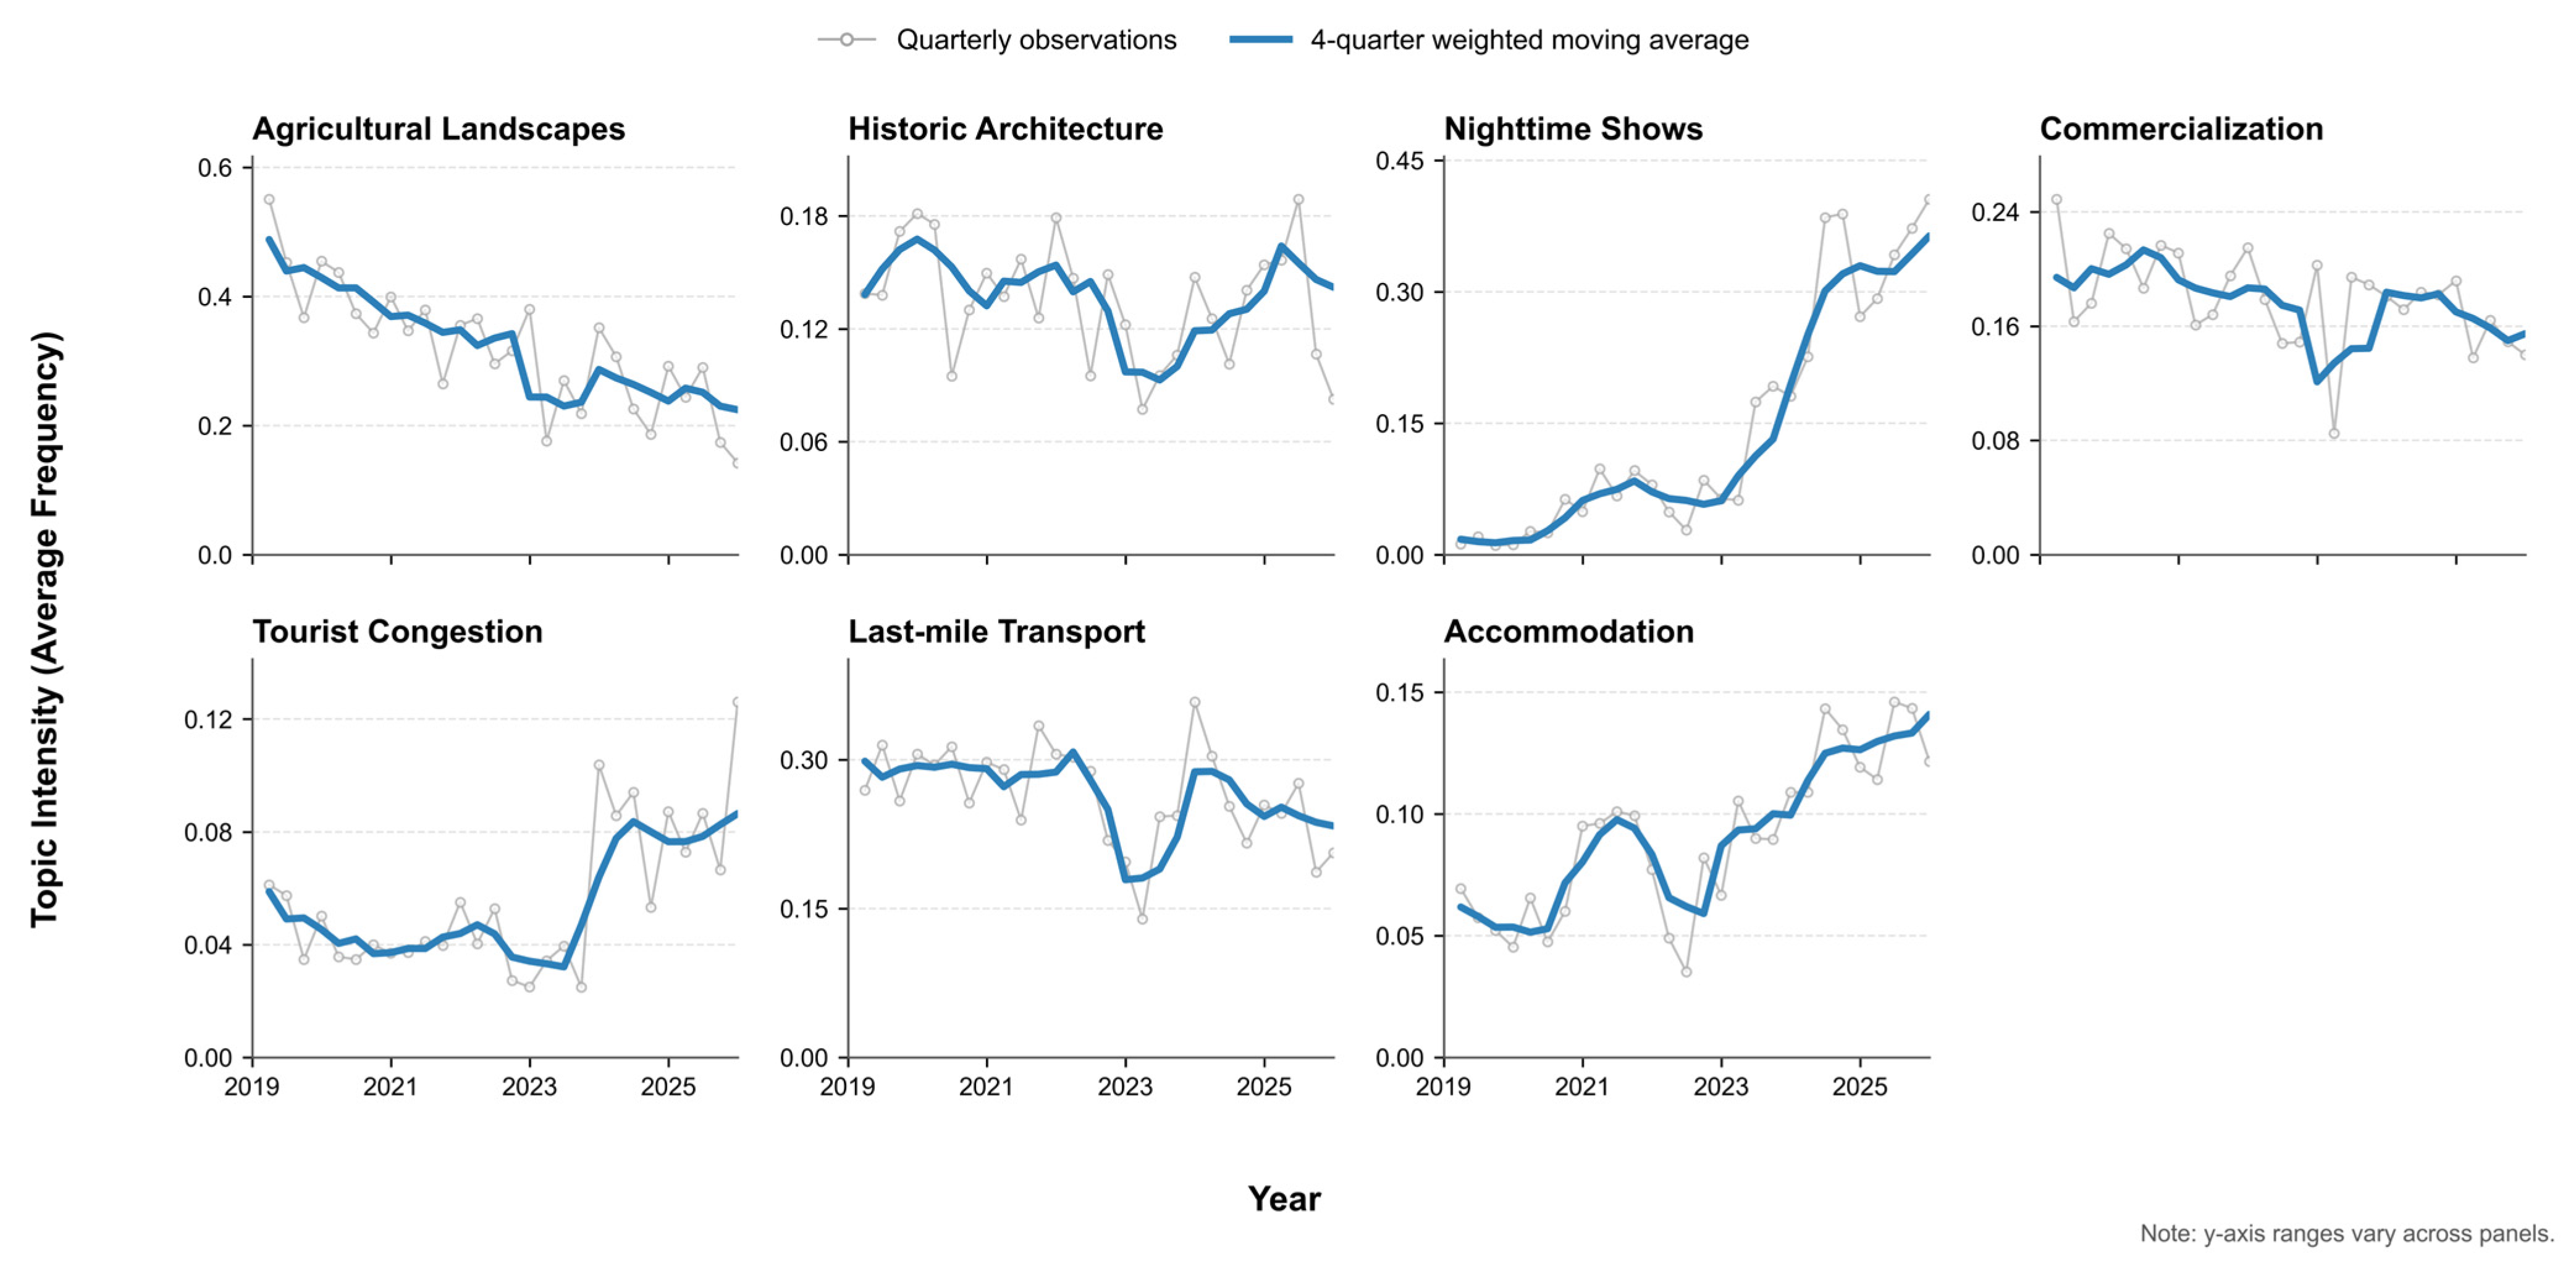

Disclaimer/Publisher’s Note: The statements, opinions and data contained in all publications are solely those of the individual author(s) and contributor(s) and not of MDPI and/or the editor(s). MDPI and/or the editor(s) disclaim responsibility for any injury to people or property resulting from any ideas, methods, instructions or products referred to in the content. |
© 2026 by the authors. Published by MDPI on behalf of the International Society for Photogrammetry and Remote Sensing. Licensee MDPI, Basel, Switzerland. This article is an open access article distributed under the terms and conditions of the Creative Commons Attribution (CC BY) license.