


Abstract
Urban expansion is known to drive biodiversity loss in China, but the future impacts of rural built-up land change remain a critical blind spot. Unlike concentrated urban growth, rural development is dispersed and closely tied to livelihood transitions, yet no studies have systematically projected its biodiversity consequences under alternative socioeconomic pathways. To understand the magnitude and distribution of such impacts, we explore spatially explicit projections of China’s urban-rural settlement dynamics from 2020 to 2070, and assess the impacts on biodiversity. By 2070, urban areas are projected to expand to 1.29–1.74 times their 2020 levels, with the most significant growth occurring in eastern China. Rural built-up land increases under scenarios SSP1, SSP2, SSP3, and SSP4, except for SSP5, with rural shrinkage mainly occurring in eastern and southwestern China. Habitat loss caused by the expansion of rural built-up areas is expected to surpass that caused by urban expansion. Furthermore, habitat loss resulting from cropland displacement will exceed the loss from built-up area expansion. Birds and reptiles are identified as the most vulnerable groups to the expansion of rural-urban built-up areas. The findings contribute to more coordinated biodiversity conservation efforts and provide scientific support for achieving sustainable development goals.
1. Introduction
In recent decades, most countries worldwide have experienced rapid urbanization [1], and the global urban population is expected to increase by 2.5 billion by 2050 [2]. To accommodate this growth [3,4], urban expansion in most regions has outpaced urban population growth [5]. Urban expansion causes substantial losses in ecosystem services and is widely recognized as a key driver of natural habitat loss [6,7,8,9,10,11], operating through farmland displacement, environmental pollution, and biological invasions [12]. In certain regions, urban expansion has resulted in the loss of more than 80% of natural habitats [13].
China is among the world’s most biodiverse countries, with the mountains of Southwest China identified as one of the 34 global biodiversity hotspots [14,15]. Currently, approximately 22% of vertebrates and 11% of higher plants in China are threatened [16,17,18]. Over the past decades, China has undergone unprecedented rapid urbanization [11]. From 2000 to 2015, the urbanization rate increased from 36% to 56%, while the rural population declined from 80.61% in 1980 to 39.40% in 2019 [19]. In contrast to this rural population decline, rural built-up land expanded by 500,000 hectares in 2015 [20].
Globally, the biodiversity impacts of land-use change have been extensively quantified, but research has maintained a persistent urban bias. Future urban expansion is projected to result in 11–33 million hectares of natural habitat loss by 2100, with local species richness declining by 34% per 1 km2 grid cell globally [21]. Within WWF’s Global 200 priority conservation areas, urban expansion is projected to be 37–44% higher than the global average. Complementing these findings, 4.6 million km2 of global wilderness is projected to be susceptible to cropland and urban expansion by 2100, with over 23% of terrestrial protected areas expected to experience some degree of wilderness loss [22]. These projections demonstrate that urban expansion alone does not fully capture the biodiversity threat from built-up land change, particularly when cropland displacement mechanisms are considered.
Recent evidence further underscores this point by revealing the magnitude of rural settlement impacts. At the global scale, it has been found that rural settlement expansion encroached upon 2.3 times more natural and semi-natural land than urban settlements between 2000 and 2020, expanded 3.7 times faster within Key Biodiversity Areas, and was associated with 3.5 times greater biodiversity decline as measured by the Mean Species Abundance index [23]. Total biodiversity loss linked to rural settlement dynamics was 1.01 to 1.36 times greater than that attributable to urban dynamics over the same period. In China specifically, urban and rural built-up area expansion has been demonstrated to result in habitat losses of 0.57% and 1.21% for endangered species, respectively, between 1990 and 2020, with the most affected species concentrated in south-central China’s biodiversity hotspot [24].
The indirect biodiversity impacts mediated through cropland displacement constitute another critical dimension of this issue. Biodiversity losses due to cropland displacement resulting from urban expansion in China from 1980 to 2020 have been quantified, showing that indirect losses were approximately two to three times higher than direct losses, with displaced cropland exhibiting higher biodiversity costs but lower agricultural productivity [25]. It has similarly been demonstrated that habitat quality loss from compensated cropland was 4.02 times that from occupied cropland during 2000–2015, with the most severe impacts occurring in ecologically vulnerable regions [26]. These findings reveal that farmland protection policies, while essential for food security, can inadvertently shift biodiversity pressures to ecologically sensitive areas. In Southeast Asia, cropland expansion has been found to cause nearly 16 times more natural habitat loss than urban expansion between 2000 and 2020, with the indirect impact of urban expansion approximately 14 times greater than its direct impact [27].
Existing studies have extensively quantified the biodiversity impacts of future urban expansion, from global ecoregions [28] to protected areas [9,29] and fine-resolution natural habitats [21,30]. However, these studies share a critical blind spot: they systematically ignore rural built-up expansion. This omission is problematic because rural development in China is not only proliferating rapidly [20] but has also been shown to outpace urban expansion as a threat to biodiversity [24]. Furthermore, urban-rural disparities in the ecological impact of built-up land expansion in China have been assessed, revealing that rural settlement expansion exerted a substantially greater negative impact on habitat quality compared to urban growth, a difference attributed primarily to the absence of unified spatial planning in rural development [31]. Consequently, it remains unknown where, to what extent, and under what drivers rural built-up areas will expand in the future—and how this expansion will affect China’s biodiversity. This knowledge gap precludes evidence-based land-use planning that balances rural development needs with biodiversity conservation.
Here, we address this gap by projecting urban and rural built-up land in China under five Shared Socioeconomic Pathway (SSP) scenarios. Across these scenarios, we account for factors including proximity to urban areas, per capita GDP, population, and local natural and socioeconomic characteristics. We estimate habitat losses for 617 terrestrial vertebrate species caused by urban and rural built-up land expansion from 2020 to 2070. We also estimate the indirect habitat losses caused by cropland displacement driven by rural land expansion, to better capture the full impact of rural land expansion across different regions. Our findings provide critical insights into the biodiversity consequences of future rural built-up land expansion and offer scientific support for more coordinated conservation and land-use planning efforts.
2. Material
2.1. Data Sources
Our analysis of historical urban and rural built-up land is constrained to the period 2009–2020. This timeframe is determined by data availability: China did not implement comprehensive, province-level surveys of built-up areas prior to 2009. The data are derived from the Second (2009–2016) and Third (2019–2022) National Land Surveys [32]. While a longer time series would be valuable, this 11-year window captures a critical and recent period of rapid rural land expansion in China. Moreover, the use of consistent, survey-based data ensures reliability for calibrating our model. In these surveys, land use and land-cover are classified into eight primary categories: cultivated land, orchards, forests, grassland, urban and rural residential areas, industrial and mining land, transportation land, water bodies and water conservancy facilities, and others. We extract the boundaries of urban and rural built-up areas, as well as other land cover types using the China’s multi-period land-use land-cover remote sensing monitoring data set (CNLUCC) which includes six classes: cropland, forest, grassland, water bodies, built-up land, and unused land, with a spatial resolution of 30 m [33].
We capture data on urban and rural populations and Gross Domestic Product (GDP) from the China City Statistical Yearbook [34] and aggregate them at the provincial level. Data on the number of migrant workers working outside their hometowns are obtained from the China Business Management Statistical Yearbook, China Rural Cooperative Economic Statistical Yearbook, and China Rural Policy and Reform Statistical Yearbook [35,36,37]. Based on the number of migrant workers working outside their hometowns from 2009 to 2020, we use the ARIMA model [38] to forecast the nationwide number of migrant workers from 2020 to 2070 (Table 1). The vacancy rates of homesteads in rural areas are sourced from the Rural Green Book: Analysis and Forecast of China’s Rural Economic Situation (2018–2019) [39]. Additionally, we obtain forecast data for urban and rural populations, GDP, and urbanization rates from the SSP Database (https://tntcat.iiasa.ac.at/sspdb accessed on 10 January 2025) for the period 2020–2070 [40].
Table 1.
Projection of National Migrant Workers Population from 2020 to 2070.
To assess the indirect impacts of urban and rural built-up land expansion, we collect the spatial distribution of sandy and clay soils from the Chinese Soil Texture Spatial Distribution Dataset [41]. Annual average temperature and precipitation data with a 1 km × 1 km spatial resolution, are obtained from the Chinese Meteorological Element Annual Spatial Interpolation Dataset [42] from 2000 to 2020. The 2015 Net Primary Productivity (NPP) data are sourced from the MODIS NPP dataset (MOD17A3), released by the United States Geological Survey (https://www.usgs.gov/ accessed on 10 January 2025) [43].
2.2. Shared Socioeconomic Pathways (SSP) Scenarios
The evolution of built-up areas constitutes a dynamic process driven by both physical and anthropogenic factors, and its underlying mechanisms and trajectories are characterized by considerable complexity [44]. Accordingly, the simulation of urban and rural built-up areas development necessitates the adoption of scenario-based frameworks capable of capturing plausible future socioeconomic and environmental conditions. The Shared Socioeconomic Pathways (SSPs) delineate how global society, demographics, and the economy may unfold over the course of the coming century, incorporating a range of policy assumptions and socioeconomic narratives, such as those pertaining to energy demand and supply as well as technological change [45,46]. The SSP framework facilitates the execution of consistent and comparable multi-scenario urban simulations [45,47,48]. This framework articulates five distinct prospective trajectories for global development (Table 2): SSP1 depicts a sustainability-oriented world, predicated upon a comparatively optimistic pathway of human progress characterized by rapid economic growth, well-functioning institutions, and a harmonious coexistence between humanity and nature. SSP2 represents a “middle-of-the-road” world, in which prevailing trends largely adhere to historical patterns of development. SSP3 describes a fragmented world marked by a “resurgence of nationalism,” which presupposes rapid population growth and an exacerbation of inequality. SSP4 portrays a world of deepening inequalities, wherein disparities and social stratification intensify both within and across national boundaries. SSP5 envisions a world predicated upon high fossil-fuel consumption, in which both economic output and energy use undergo rapid and unconstrained expansion.
Table 2.
Key assumptions of Shared Socioeconomic Pathways (SSPs) used in this study.
3. Methods
3.1. Urban and Rural Built-Up Area Prediction
Since 1950, China has implemented a homestead policy that allows individuals with agricultural household registration to obtain the right to use homestead land free of charge [49]. As a result of this policy, some farmers with agricultural household registration choose to work in cities but return to build houses in rural areas. Thus, the predictions in this study are based on three assumptions: (1) The rural built-up land consists of land used by permanent rural residents and non-permanent rural residents. Non-permanent rural residents refer to migrant workers who live in cities but return to build houses in rural areas. (2) The land used by non-permanent rural residents remains idle throughout the year.
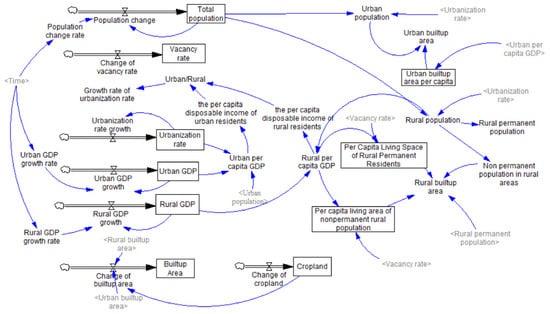
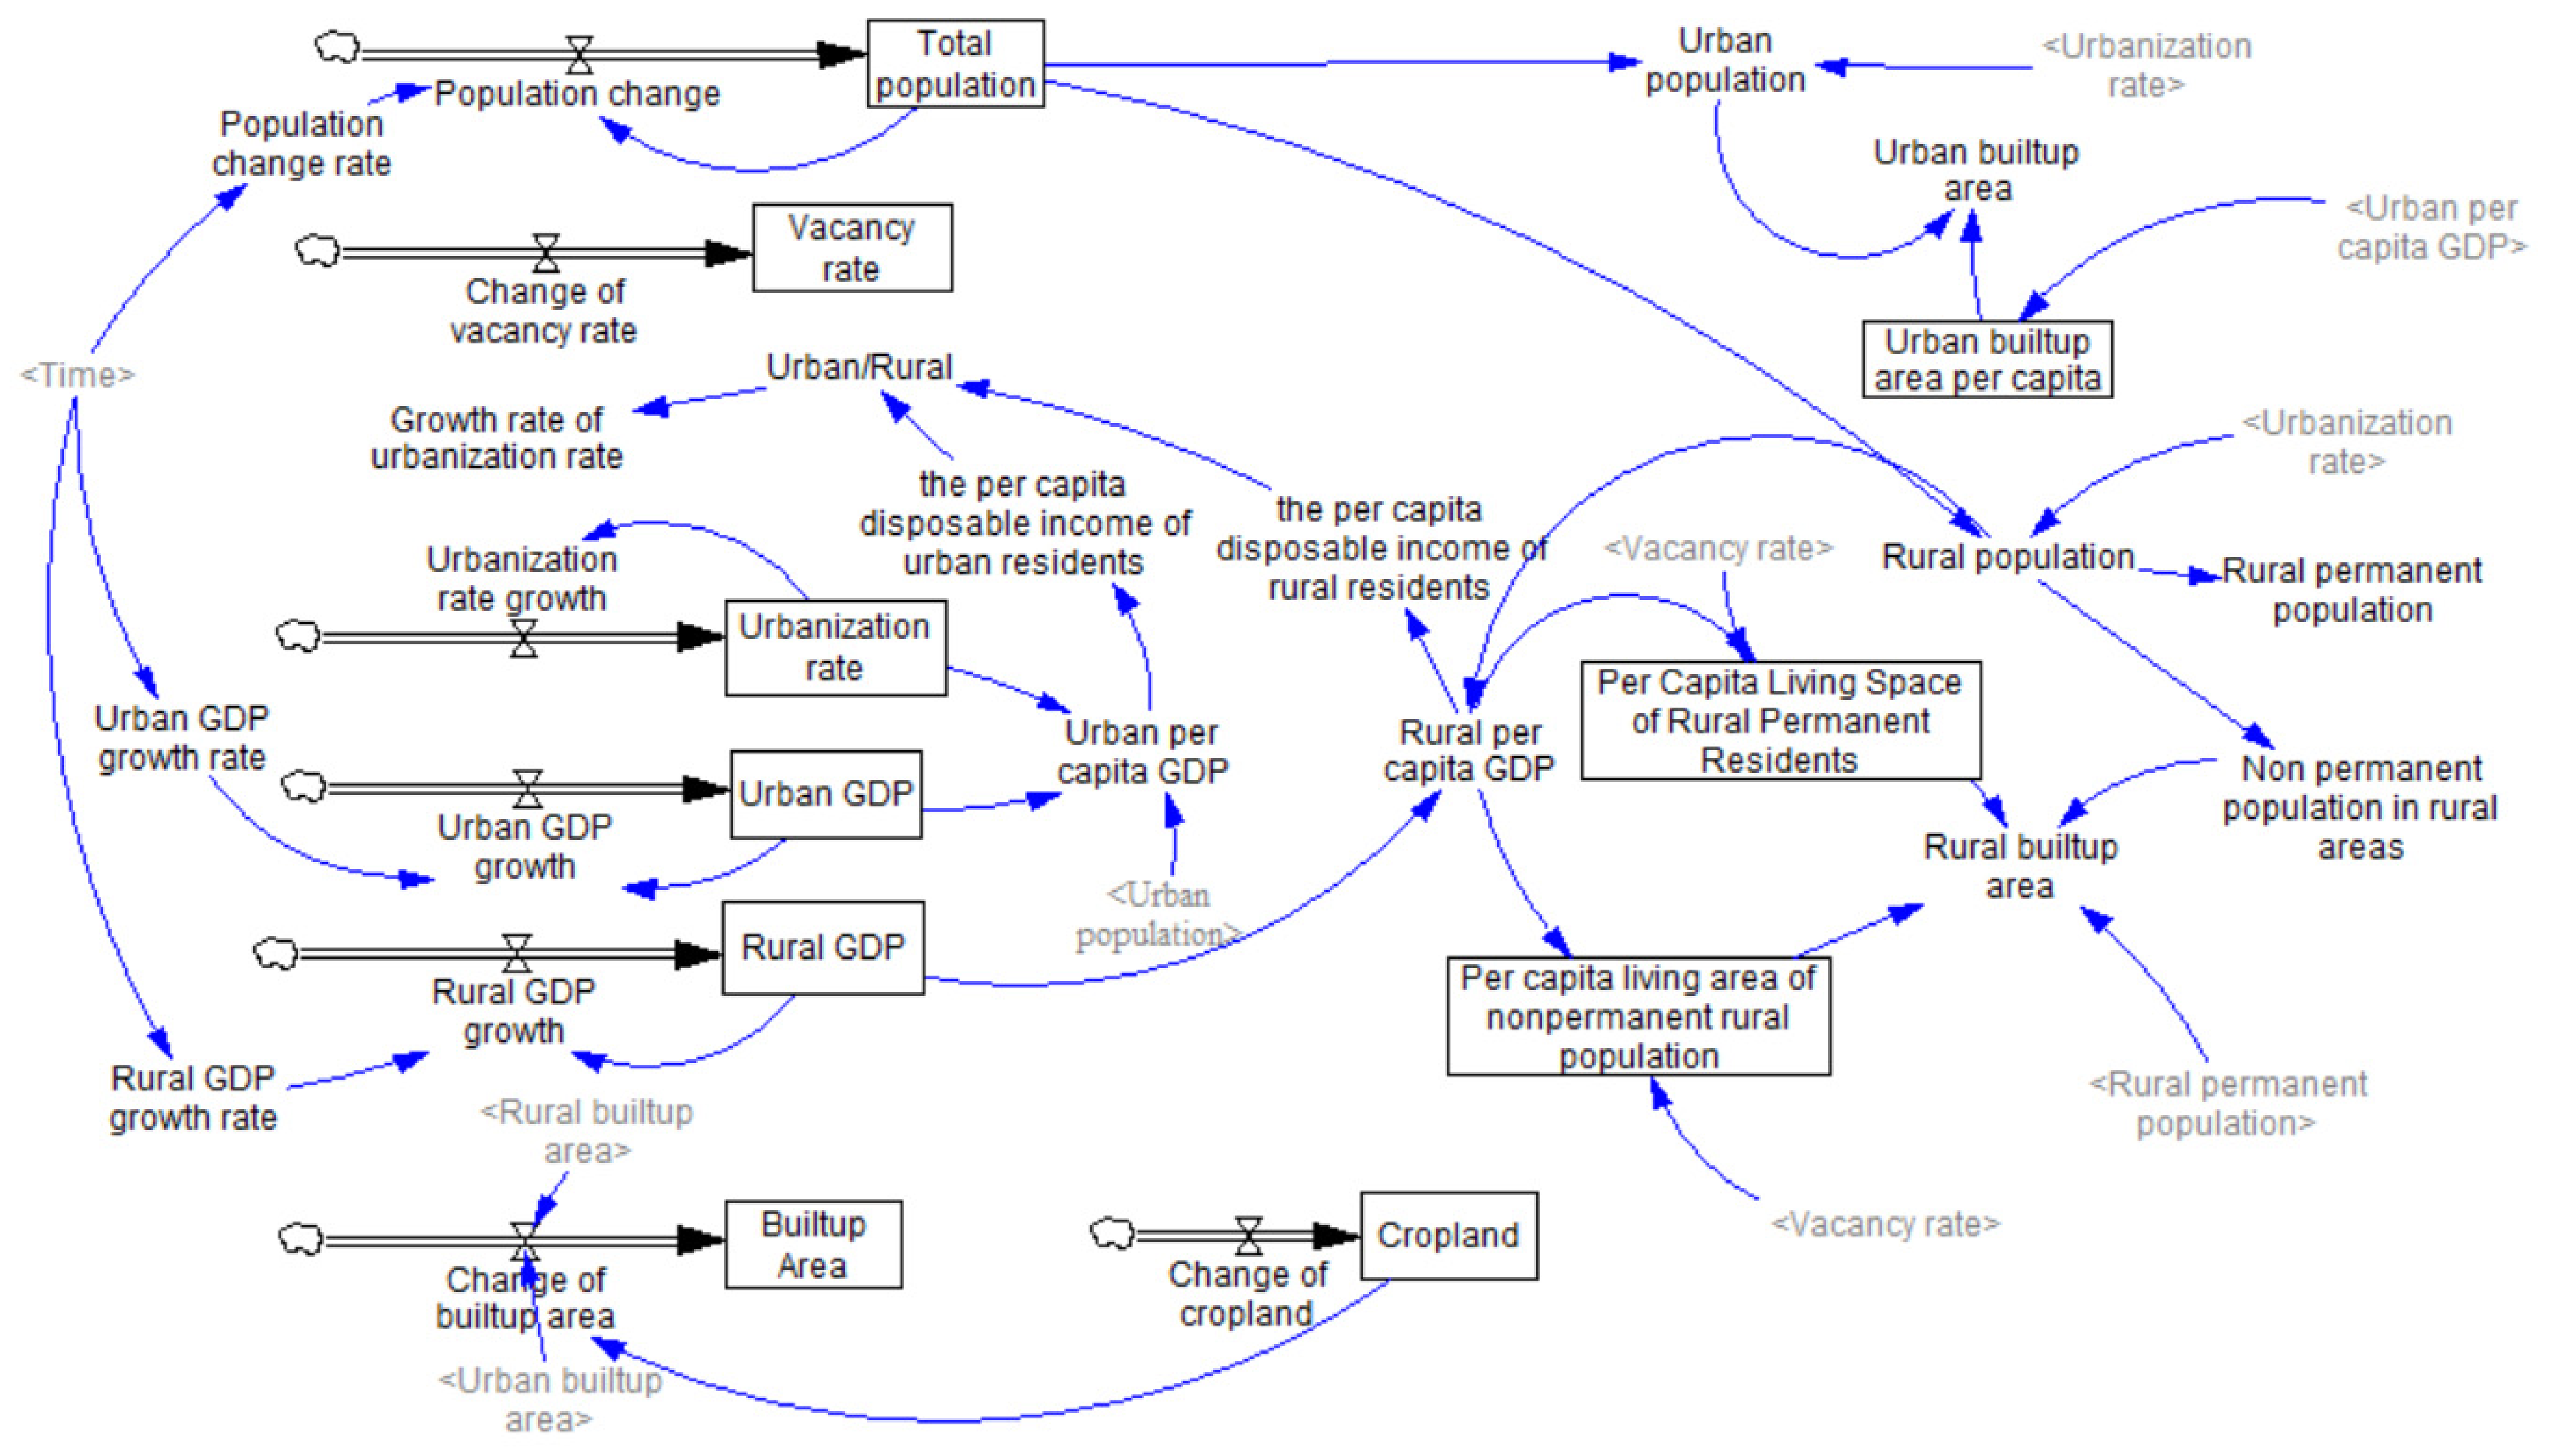
Land-use systems are complex, influenced by various factors such as human activities. The system dynamics (SD) model is often applied to explore intricate urban expansion behaviors [50]. To account for human activities and ecological effects, we use an SD model (Figure 1) to predict per capita land demand for urban and rural built-up areas under different scenarios. The simulation of per capita built-up area values is conducted for each region and urban-rural area. The average per capita built-up area for each region is then used as the national per capita built-up area value, and the predicted population for each year is multiplied to obtain the total urban and rural built-up area for that year. The developed SD model comprises three main components: population, economy, and land use. An increase in population results in greater demand for built-up land. Simultaneously, GDP growth also promotes the expansion of urban and rural land use to some extent [4,5].
Figure 1.
Causal Diagram of urban and rural built-up land prediction based on System Dynamics.
3.2. Projections of Urban and Rural Built-Up Areas
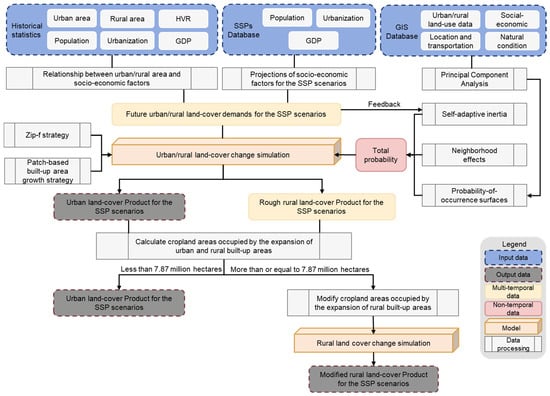
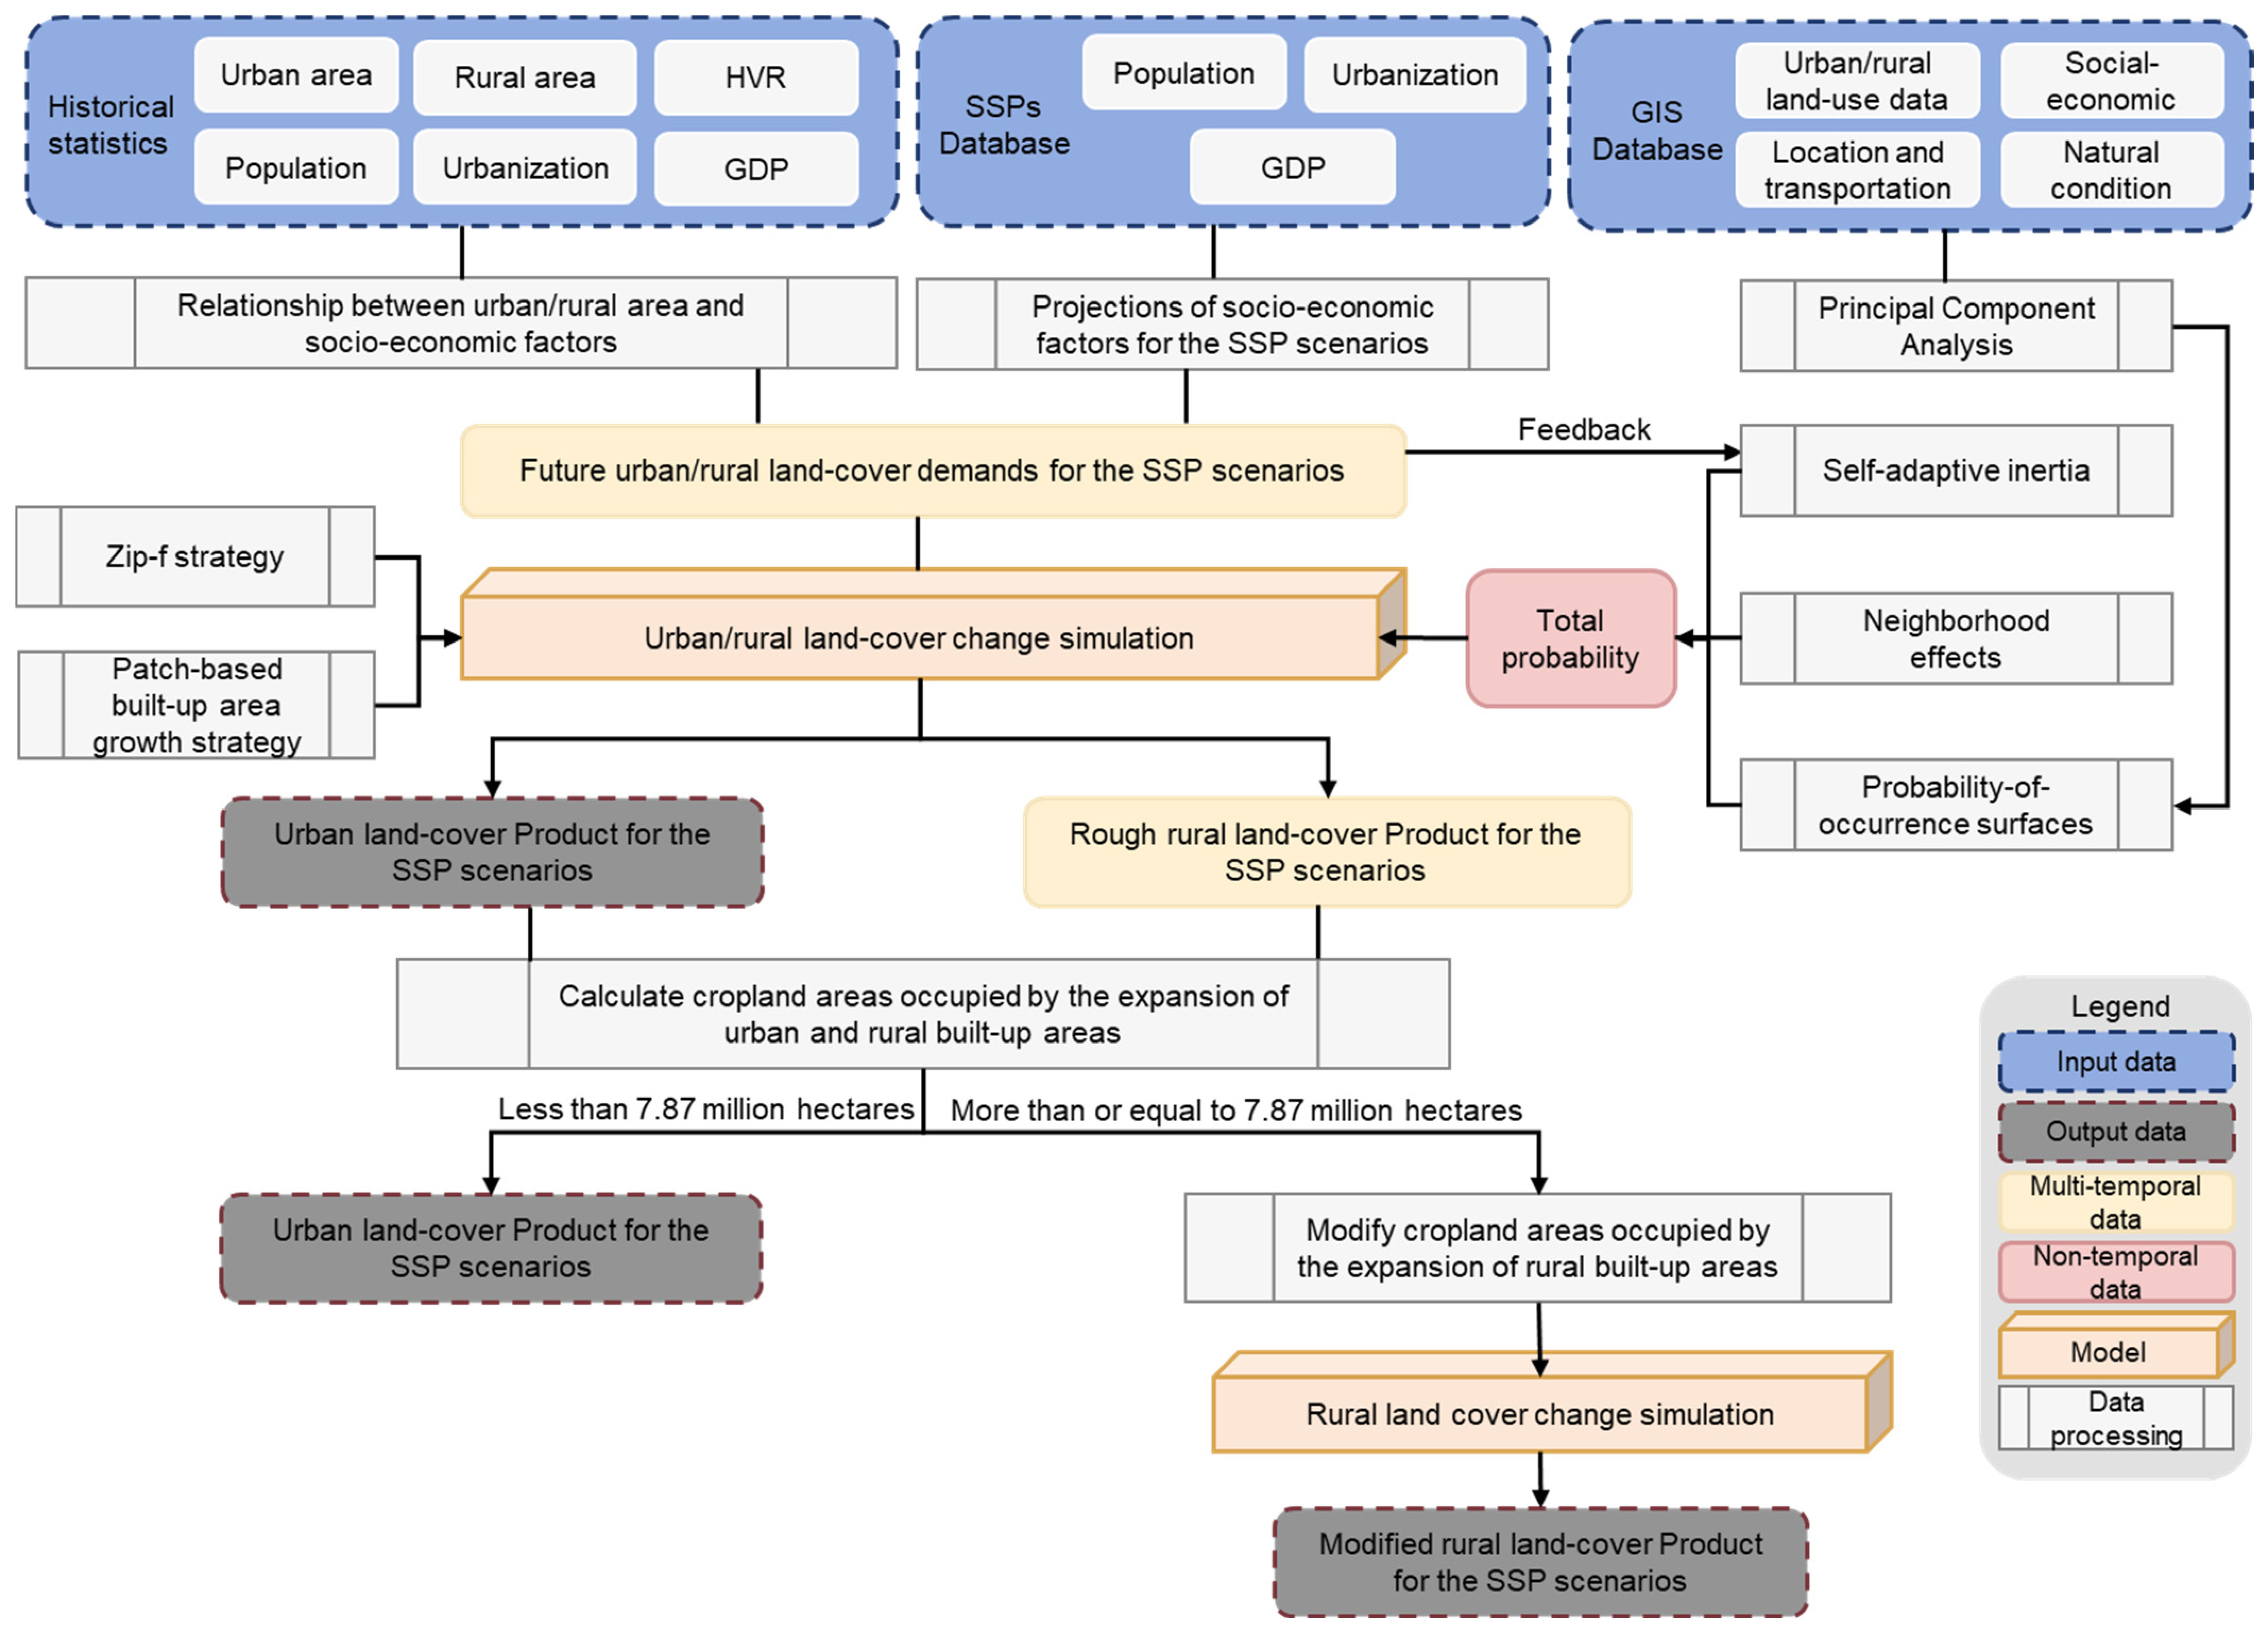
We improve the URBANMOD-ZIPF model [4] to simulate the spatial variations in urban and rural built-up land from 2020 to 2070 (Figure 2). This model employs principal component analysis and a set of spatial driving factors, including population density, per capita GDP, population mobility intensity, distance from cities, and slope, to estimate the development potential matrix for urban and rural built-up areas. The spatial simulation of future urban and rural built-up area development is based on cellular automata and is constrained by the estimated development potential. Zipf’s law states that the size of an entity is inversely proportional to its rank (e.g., the largest city is roughly twice as large as the second largest). Additionally, we incorporate this law into the model to preserve the scaling characteristics of actual urban and rural systems [51,52].
Figure 2.
Methodological workflow of the coupled SD-URBANMOD modeling framework. Arrows indicate the direction of data flow and simulation processes; colors representing different data categories (e.g., Input data, Output data, Models, etc.) are defined in the legend at the bottom right.
Since 2006, China has implemented the “Arable Land Minimum” policy, which mandates that the total area of arable land must exceed 120 million hectares. If the expansion of urban and rural built-up areas exceeds the “Arable Land Minimum”, the development of urban and rural built-up areas will be constrained.
The improved URBANMOD-ZIPF model assumes that the probability of a non-built-up grid cell transforming into a built-up grid cell is the product of the built-up area development potential, the neighborhood effect, and the development constraint. We calculate the urban and rural built-up area development suitability matrix using the historical data and extract features from the selected spatial driving factors through principal component analysis to estimate the built-up area development potential. The primary driving factors influencing changes in built-up areas include population density, per capita GDP, proportion of population loss, terrain slope, and the distance to the city.
Specifically, built-up areas with higher population density, greater per capita GDP, a smaller proportion of outflowing population are more likely to expand; otherwise, they are more likely to shrink or even disappear [3,4]. Data on population density and per capita GDP are sourced from the China County Statistical Yearbook. We use data from the seventh national census to estimate the migrant workers in these districts and counties. These are individuals whose registered permanent residences are recorded in other provinces. The proportion of outflowing population is then calculated as the ratio of the migrant population to the total local permanent population, as provided by the China County Statistical Yearbook. To remove dimensional influences when calculating the suitability matrix, we first normalize the driving factors to scale each to a 0–1 range, followed by feature extraction via principal component analysis. For the expansion matrix, we take the reciprocal of the three driving factors—proportion of outflowing population, slope, and distance to the urban built-up area—before standardizing. When calculating the shrinkage matrix, we take the reciprocal of population density and per capita GDP before standardizing.
We define a 3 km × 3 km neighborhood to calculate the neighborhood effect on built-up area development, meaning that new built-up areas are more likely to emerge near the established built-up areas. To preserve the scaling characteristics of the actual built-up areas, we adjust the conversion probability using a patch-based built-up area growth strategy. In the built-up area system, scale is reflected in the fact that the number of small built-up areas is significantly larger than the number of large built-up areas [52]. To account for this effect, we specify that if a non-built-up grid cell is located near a large patch, its conversion probability increases. The larger the neighboring patch of the non-built-up grid cell, the greater the increase in the conversion probability.
We simulate the process of built-up land expansion using a roulette selection mechanism. First, we randomly select a non-built-up grid cell and compare its adjusted conversion probability with a random value between 0 and 1. If the conversion probability of the non-built-up grid cell exceeds the random value, the grid cell is converted into a built-up grid cell; otherwise, it remains unchanged. We repeat these steps until the simulated expansion of the built-up area meets the required increase in built-up land areas. Similarly, the process of land contraction from built-up areas to non-built-up areas follows the same approach.
3.3. Impact of Urban and Rural Built-Up Land Expansion on Biodiversity
We collect habitat and biodiversity data from the IUCN Red List of Threatened Species [53]. The IUCN Red List includes amphibians, birds, mammals, and reptiles. Species are categorized into nine groups based on the criteria such as the rate of population decline, total species count, geographic distribution, and population fragmentation. We extract data on 617 species, including 190 NT, 210 VU, 151EN, and 66 CR species. These species include 206 amphibians, 203 birds, 130 mammals, and 78 reptiles.
3.3.1. Direct Impacts of Urban and Rural Built-Up Area Expansion on Biodiversity
We define the loss caused by the expansion of built-up areas encroaching on habitats as direct loss [6]. The baseline for measuring habitat loss is the spatial distribution and ranges of habitats in 2020. We perform an overlay analysis by combining the simulation results of urban and rural built-up areas with the extracted species distribution ranges. Since the habitat ranges defined by the IUCN Red List include the areas that may not be suitable for species habitation, such as human settlement areas, we first remove unsuitable areas from the activity range maps based on species habitat land-cover types and elevation, then calculate the Area of Habitat (AOH) for 2020 [54]. The spatial resolution of the suitable habitat map is 0.25°. By overlaying the AOH map with the urban and rural built-up area in different SSP scenarios, we investigate the direct impact of urban expansion on species of varying threat levels across scenarios. We assess biodiversity loss by examining the number of species affected by the expansion of urban and rural built-up areas, as well as the area and proportion of habitat loss.
3.3.2. Indirect Impact of Built-Up Area Expansion on Biodiversity
To ensure national food security, China has implemented a series of farmland protection policies, which mandate that when non-agricultural construction projects occupy arable land, new farmland must be reclaimed, or existing inefficient land must be improved to compensate for the occupied land, ensuring that the total farmland area does not decrease [13]. We take the habitat loss caused by cropland replacement as indirect loss [6], and utilize remote sensing data to calculate the loss of crop yield, using Net Primary Productivity (NPP) as a proxy for crop yield in the region [55]. The quantification of indirect natural habitat loss includes three steps: (1) calculating the total production loss caused by new built-up areas occupying farmland, (2) quantifying the farmland area required to compensate for production loss, and (3) simulating the spatial process of farmland displacement. Equations (1) and (2) present the indirect effects of rural and urban built-up area expansion on natural habitats.
where and represent the indirect losses to natural habitats due to the expansion of rural and urban built-up areas, respectively. A represents the actual area of each pixel, with a spatial resolution of 1 km. and represent the total NPP loss caused by the conversion of farmland into rural and urban built-up areas from 2020 to 2070, respectively. refers to the NPP loss caused by the conversion of farmland to built-up areas in a single pixel. In this study, it is assumed that the NPP loss per pixel remains unchanged over time. The calculation of is provided in Equation (3):
where represents the number of cropland pixels occupied by the expansion of rural and urban built-up areas from 2000 to 2020. denotes the land-use type of the i-th pixel in 2020 (if = 1, the i-th pixel is cropland in 2020, otherwise it is non-cropland). represents the NPP of the i-th pixel in 2020.
The total NPP loss from 2020 to 2070 caused by the conversion of cropland to rural and urban built-up areas, and , are shown in Equations (4) and (5), respectively:
where and denote the land-cover types of the i-th pixel in 2070 and 2020, respectively. = 1 means the rural built-up area is 1, otherwise it is non-rural built-up area. means the urban built-up area is 1, otherwise it is non-urban built-up area. = 1 means the i-th pixel is cropland in 2020; otherwise, it is non-cropland. The area of cropland that needs to be replaced due to urban and rural built-up land expansion under different SSPs is shown in Table 3.
Table 3.
Cropland area requiring displacement due to urban and rural expansion under different SSP scenarios.
We select 16 driving factors including land-cover type, protected areas, elevation, slope, annual average temperature, annual precipitation, soil quality, and drought index, to construct a suitability matrix for simulating cropland displacement. The classification standards and thresholds for these factors (Table 4) were defined based on established references [55,56,57,58,59,60]. We then apply the same method used in the simulation of urban and rural built-up area expansion to simulate cropland displacement [61,62,63].
Table 4.
Land Standards for crop production and land suitable for crop production (“√” indicates compliance with standards, “X” indicates non-compliance, and the rest are conditions that meet the standards).
4. Results
4.1. Urban and Rural Land Changes Under Different SSPs
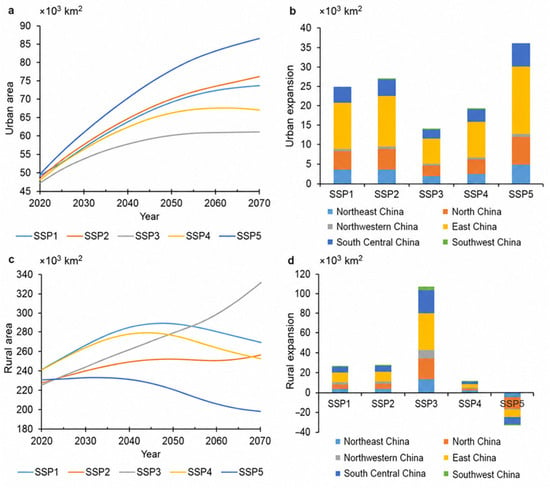
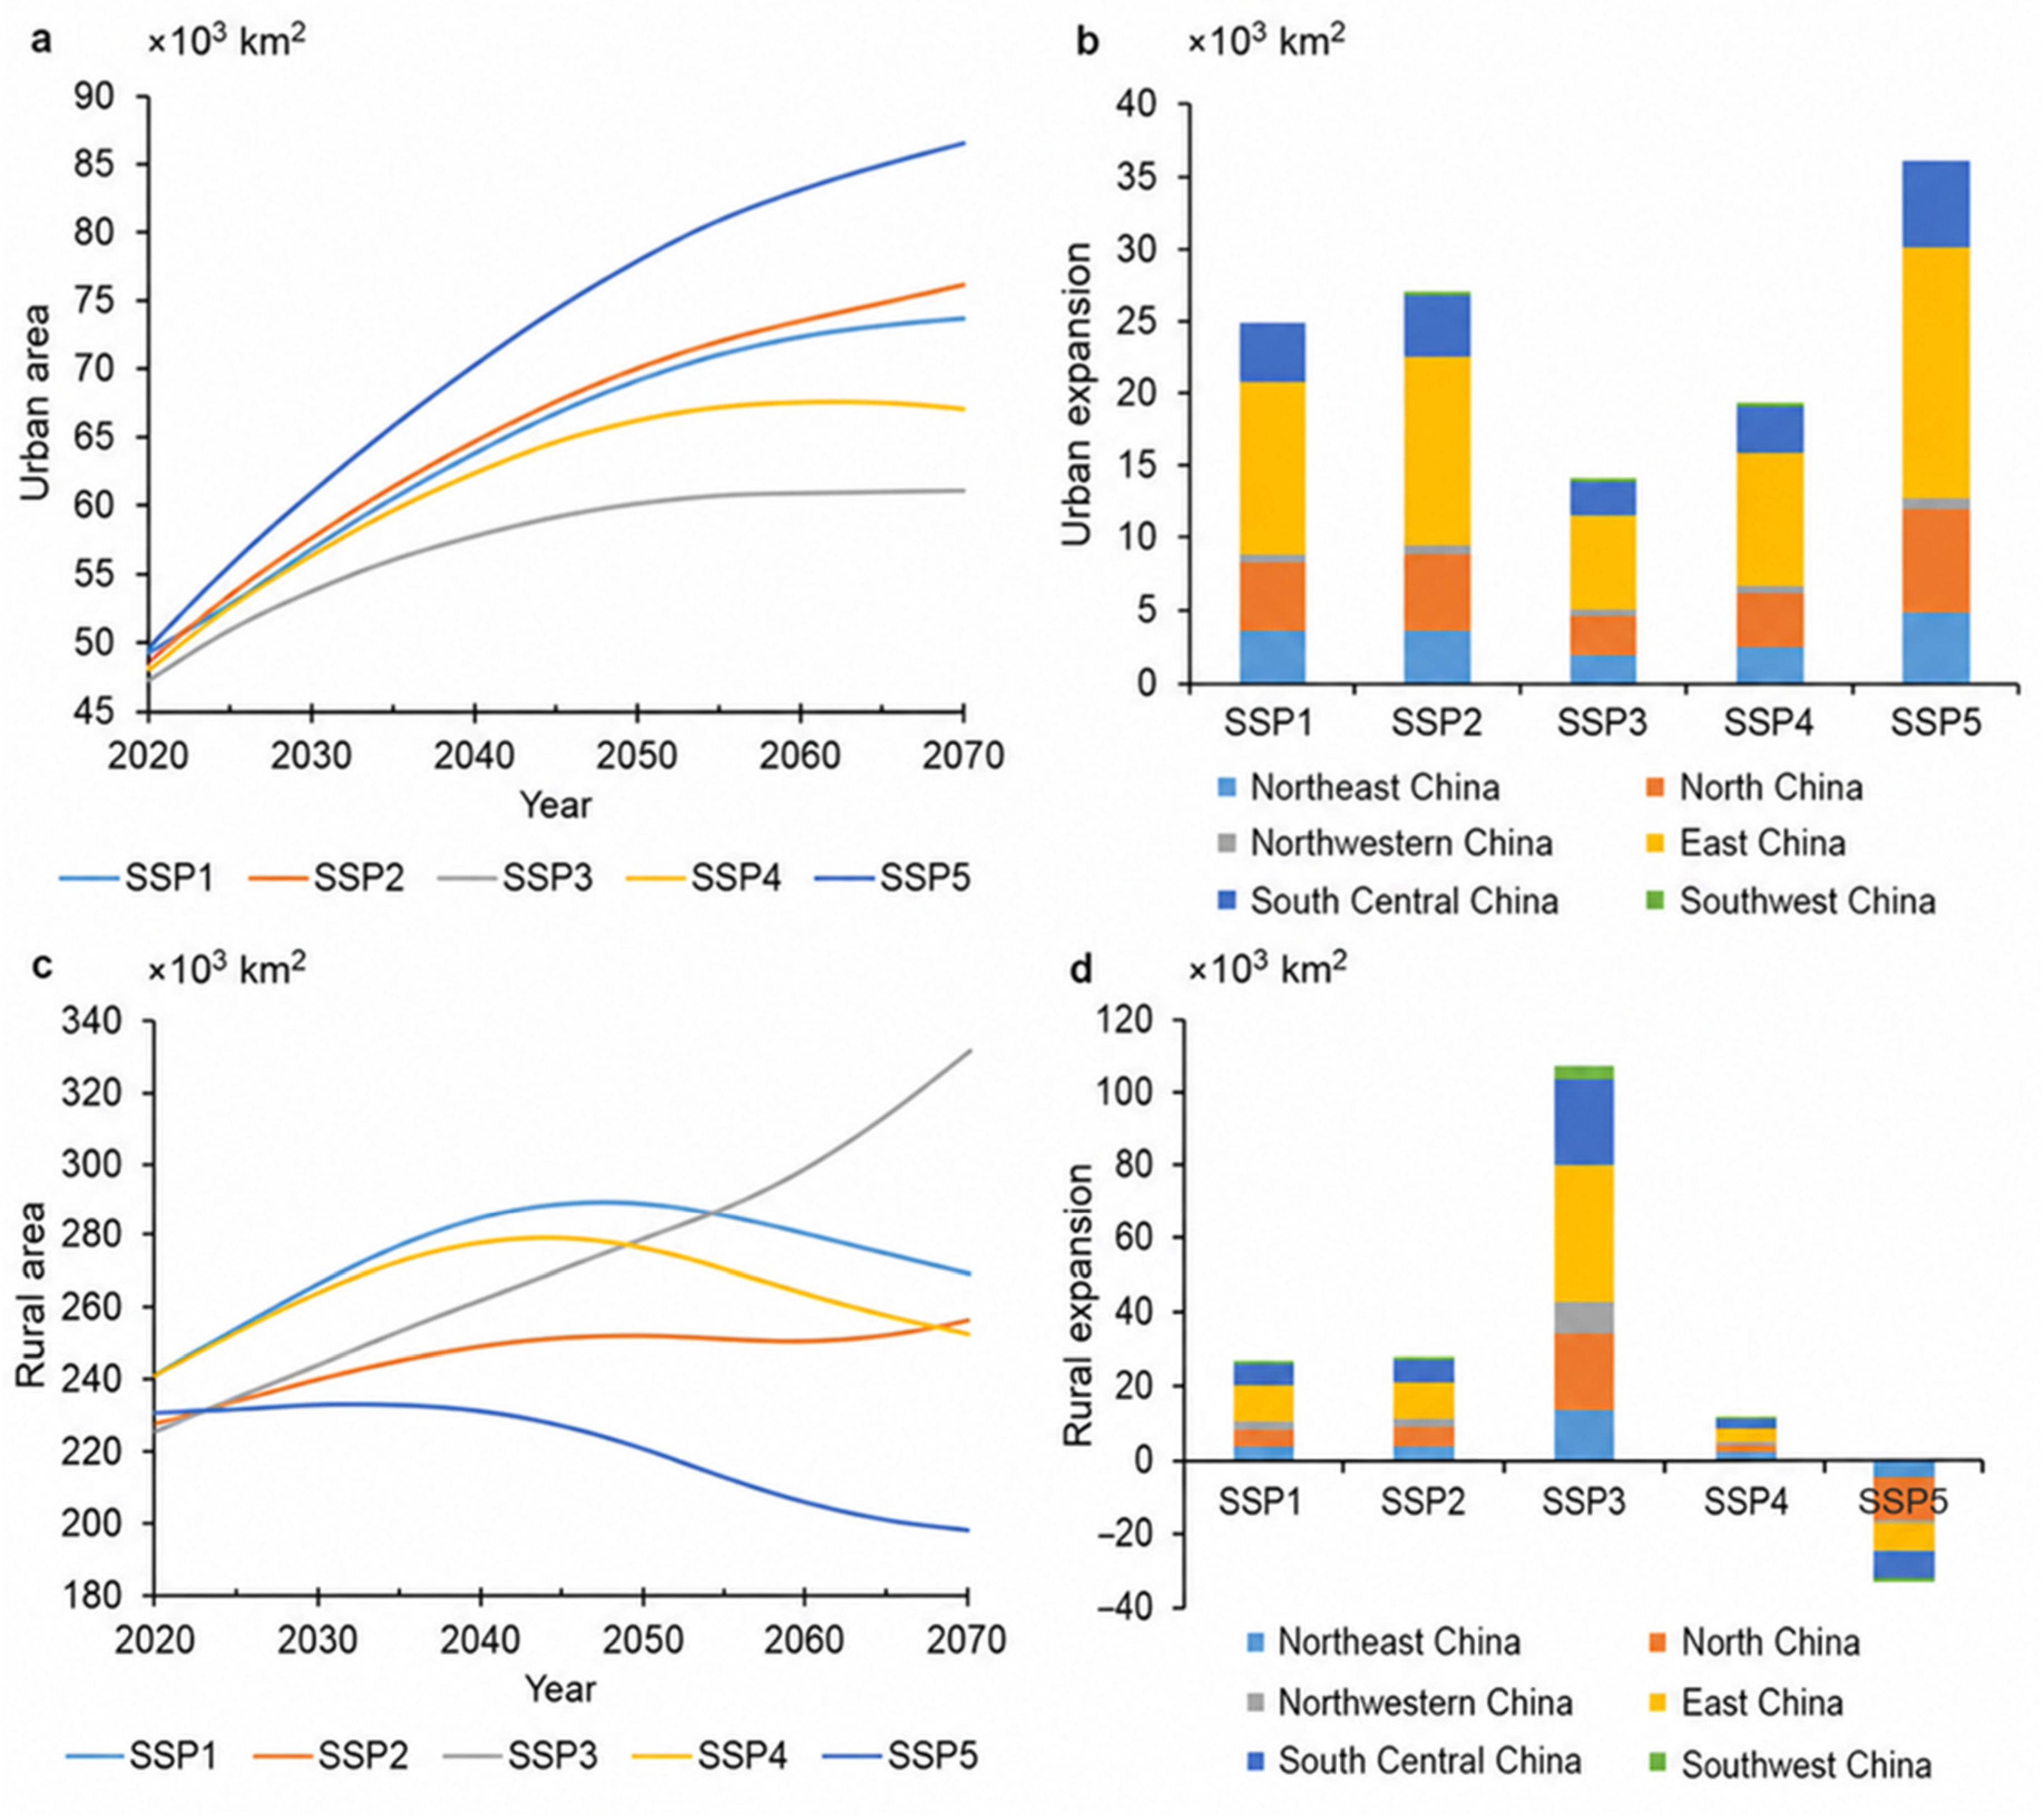
We projected the future land structures of rural land development using the 30 m resolution China’s multi-period land-use land-cover remote sensing monitoring data set (CNLUCC) from 1990 to 2020 [33]. Under the five SSP scenarios, urban areas continue to expand by about 13,900–36,700 km2 from 2020 to 2070, while the growth rate gradually becomes slow (Figure 3a). In the most urbanized SSP5 scenario, urban areas are projected to increase to 1.74 times of their 2020 level by 2070 (Table 5). Urban growth in eastern China is the most substantial (Figure 3b).
Figure 3.
Spatiotemporal trends in urban and rural built-up areas under different SSPs. (a) Urban built-up area changes under SSP1–5. (b) Urban expansion area. (c) Rural built-up area changes. (d) Rural built-up land areas expanded under SSP1–5.
Table 5.
Simulated urban and rural growth between 2020 and 2070 in each SSP.
In the SSP3 scenario, rural built-up areas steadily increase from 2020 to 2070. In the SSP1, SSP2, SSP4, and SSP5 scenarios, they initially grow and then decline. In the SSP4 and SSP5 scenarios, rural land areas reach the peaks in 2030 and 2045, respectively, and reach the peak in 2050 under the SSP1 and SSP2 scenarios (Figure 3c). In the lowest urbanization scenario, i.e., SSP3, rural built-up land areas have the largest expansion, covering 106,100 km2 (Table 5). Conversely, under the most urbanized SSP5 scenario, rural built-up land areas shrink the most from 2020 to 2070, reduced by 32,900 km2. The decreased rural areas primarily concentrated in the East and Southwest China (Figure 3d).
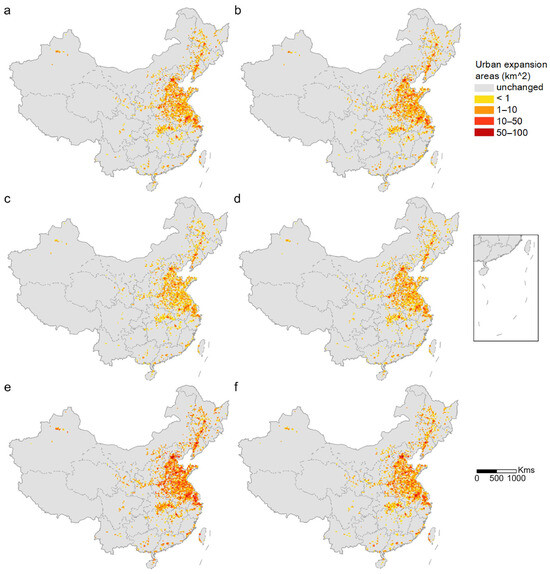
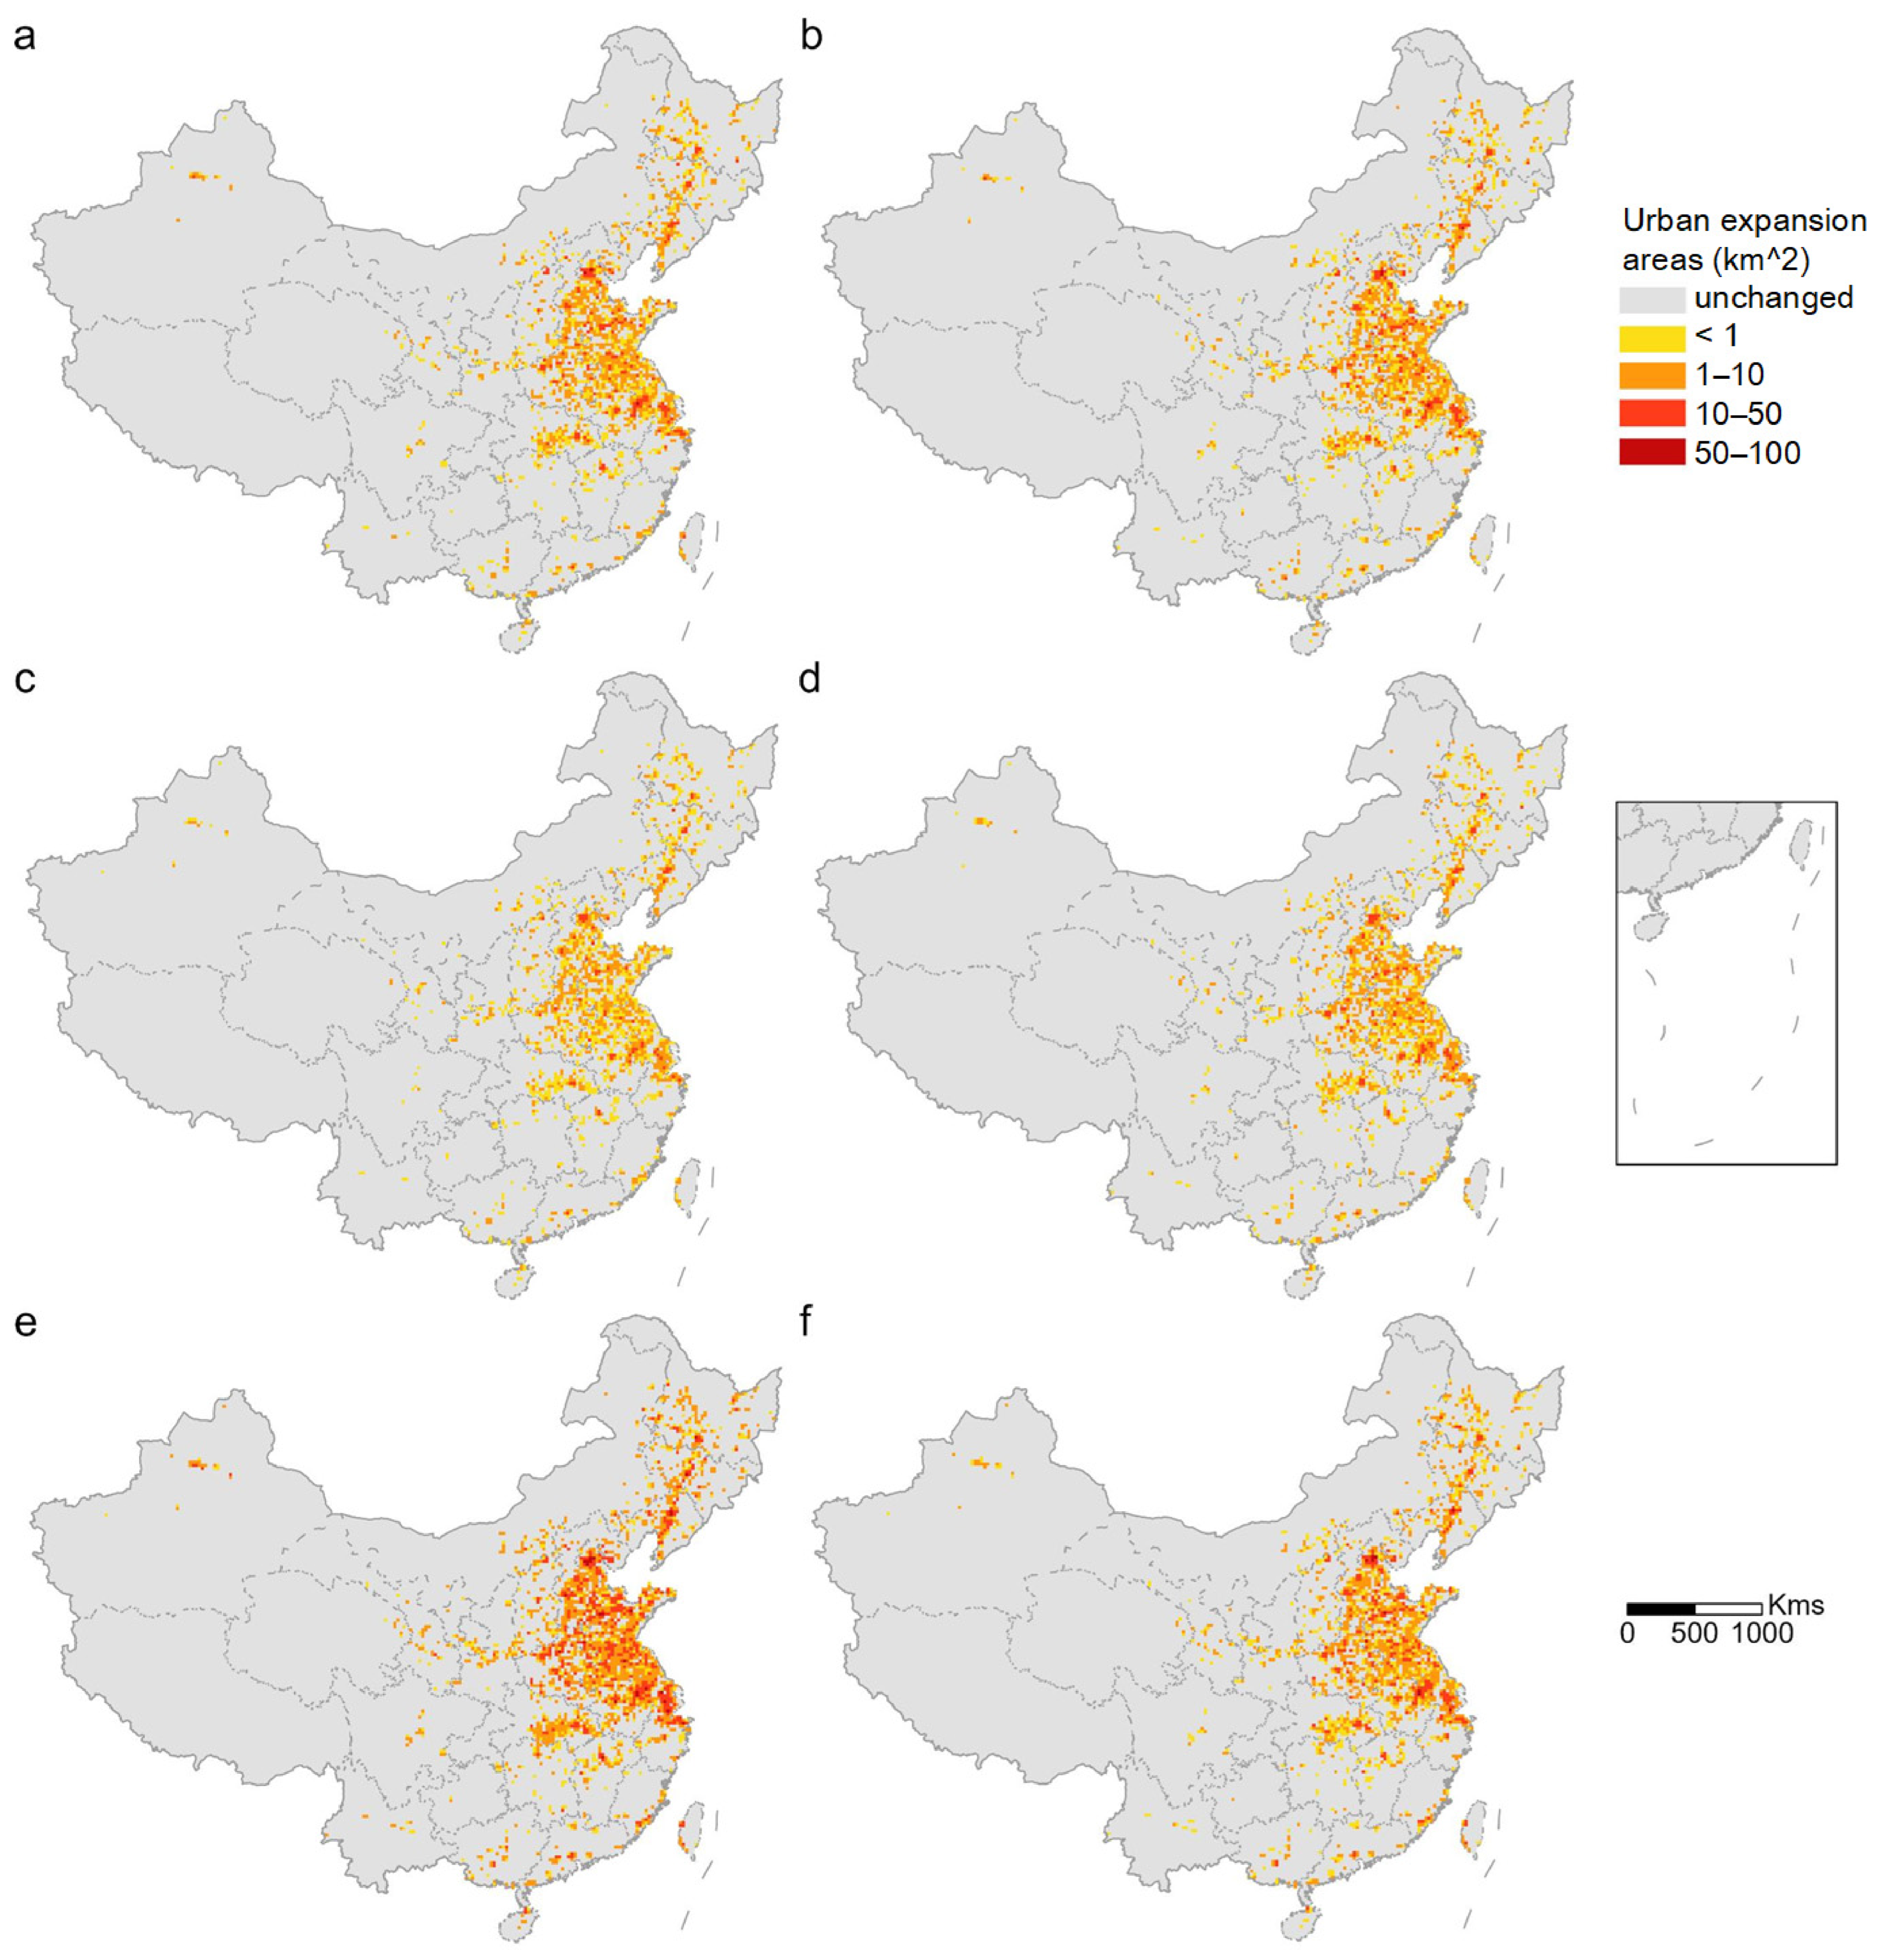
To capture the spatial heterogeneity of urban and rural built-up land area changes, we analyze the land expansion within 20 km × 20 km grid cells. In different SSPs, urban and rural land developments exhibit widespread spatial differences. Under SSPs 1–5, urban expansion clusters around the Beijing-Tianjin-Hebei region, the Yangtze River Delta, the Shandong Peninsula, the Central Plains, and the Liaoning Central-South regions (Figure 4).
Figure 4.
Changes in urban built-up areas under SSPs: (a–e) urban built-up area changes under SSP1–5; (f) average changes in SSP1–5.
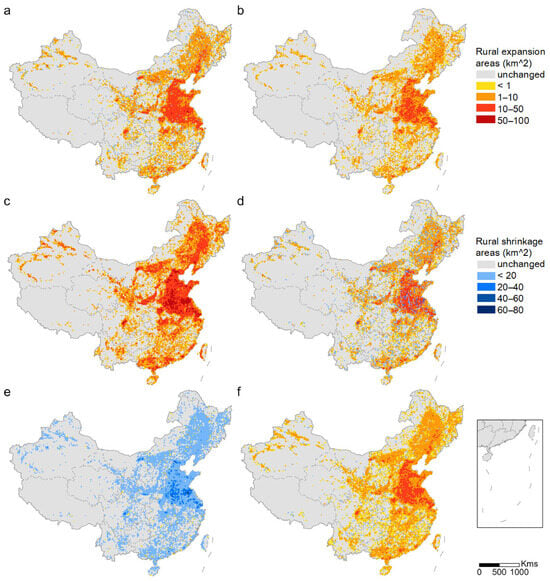
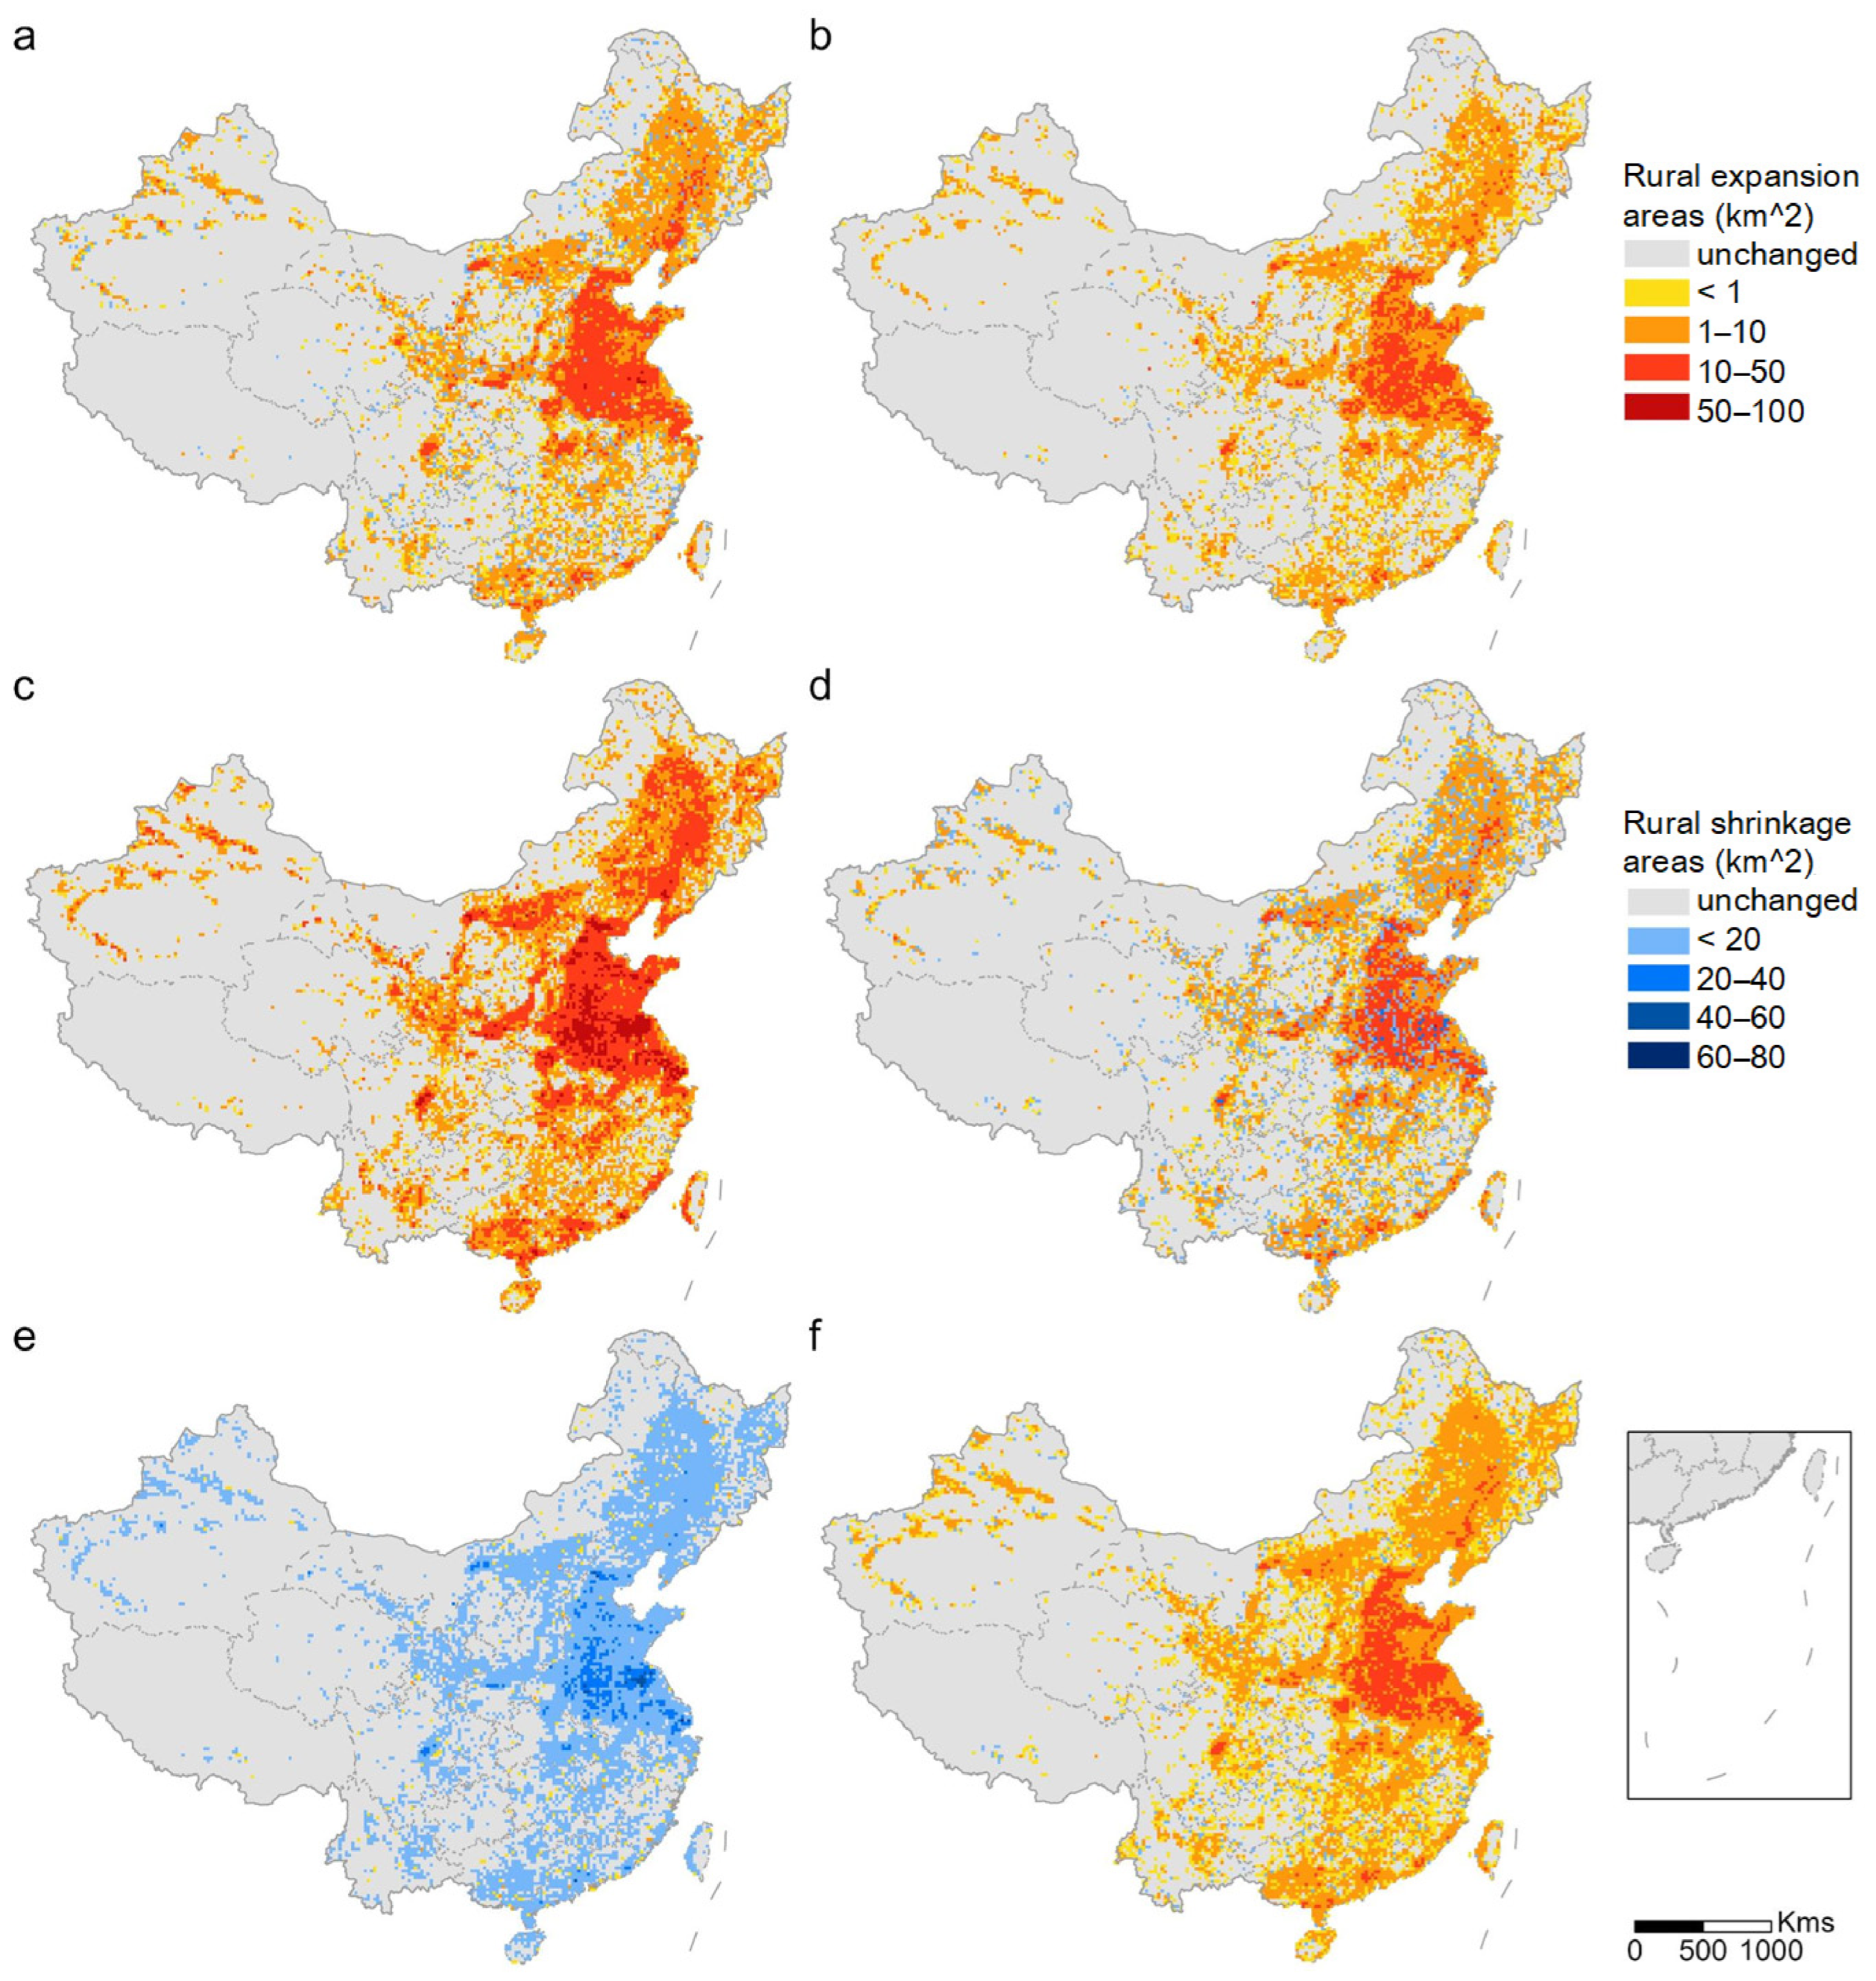
In the SSPs 1–4 scenarios, rural built-up land areas expand primarily in the North China Plain and the middle and lower Yangtze River Plain, while in the SSP 5 scenario, the areas largely decrease (Figure 5).
Figure 5.
Changes in rural built-up areas under SSPs: (a–e) rural built-up area changes under SSP1–5; (f) average changes in SSPs1–5.
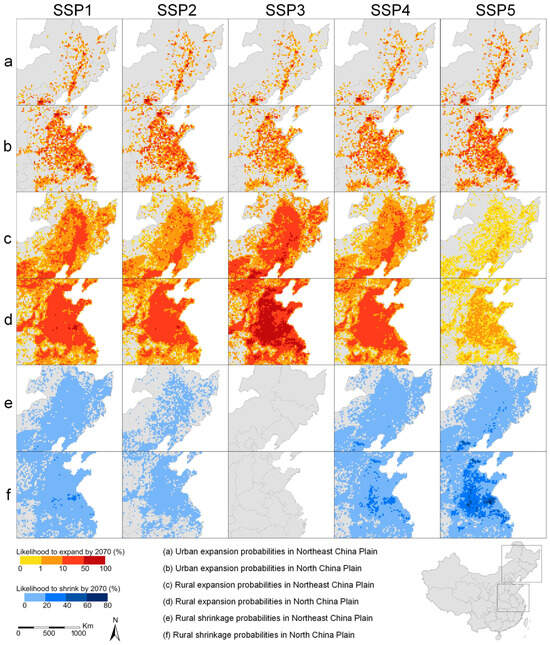
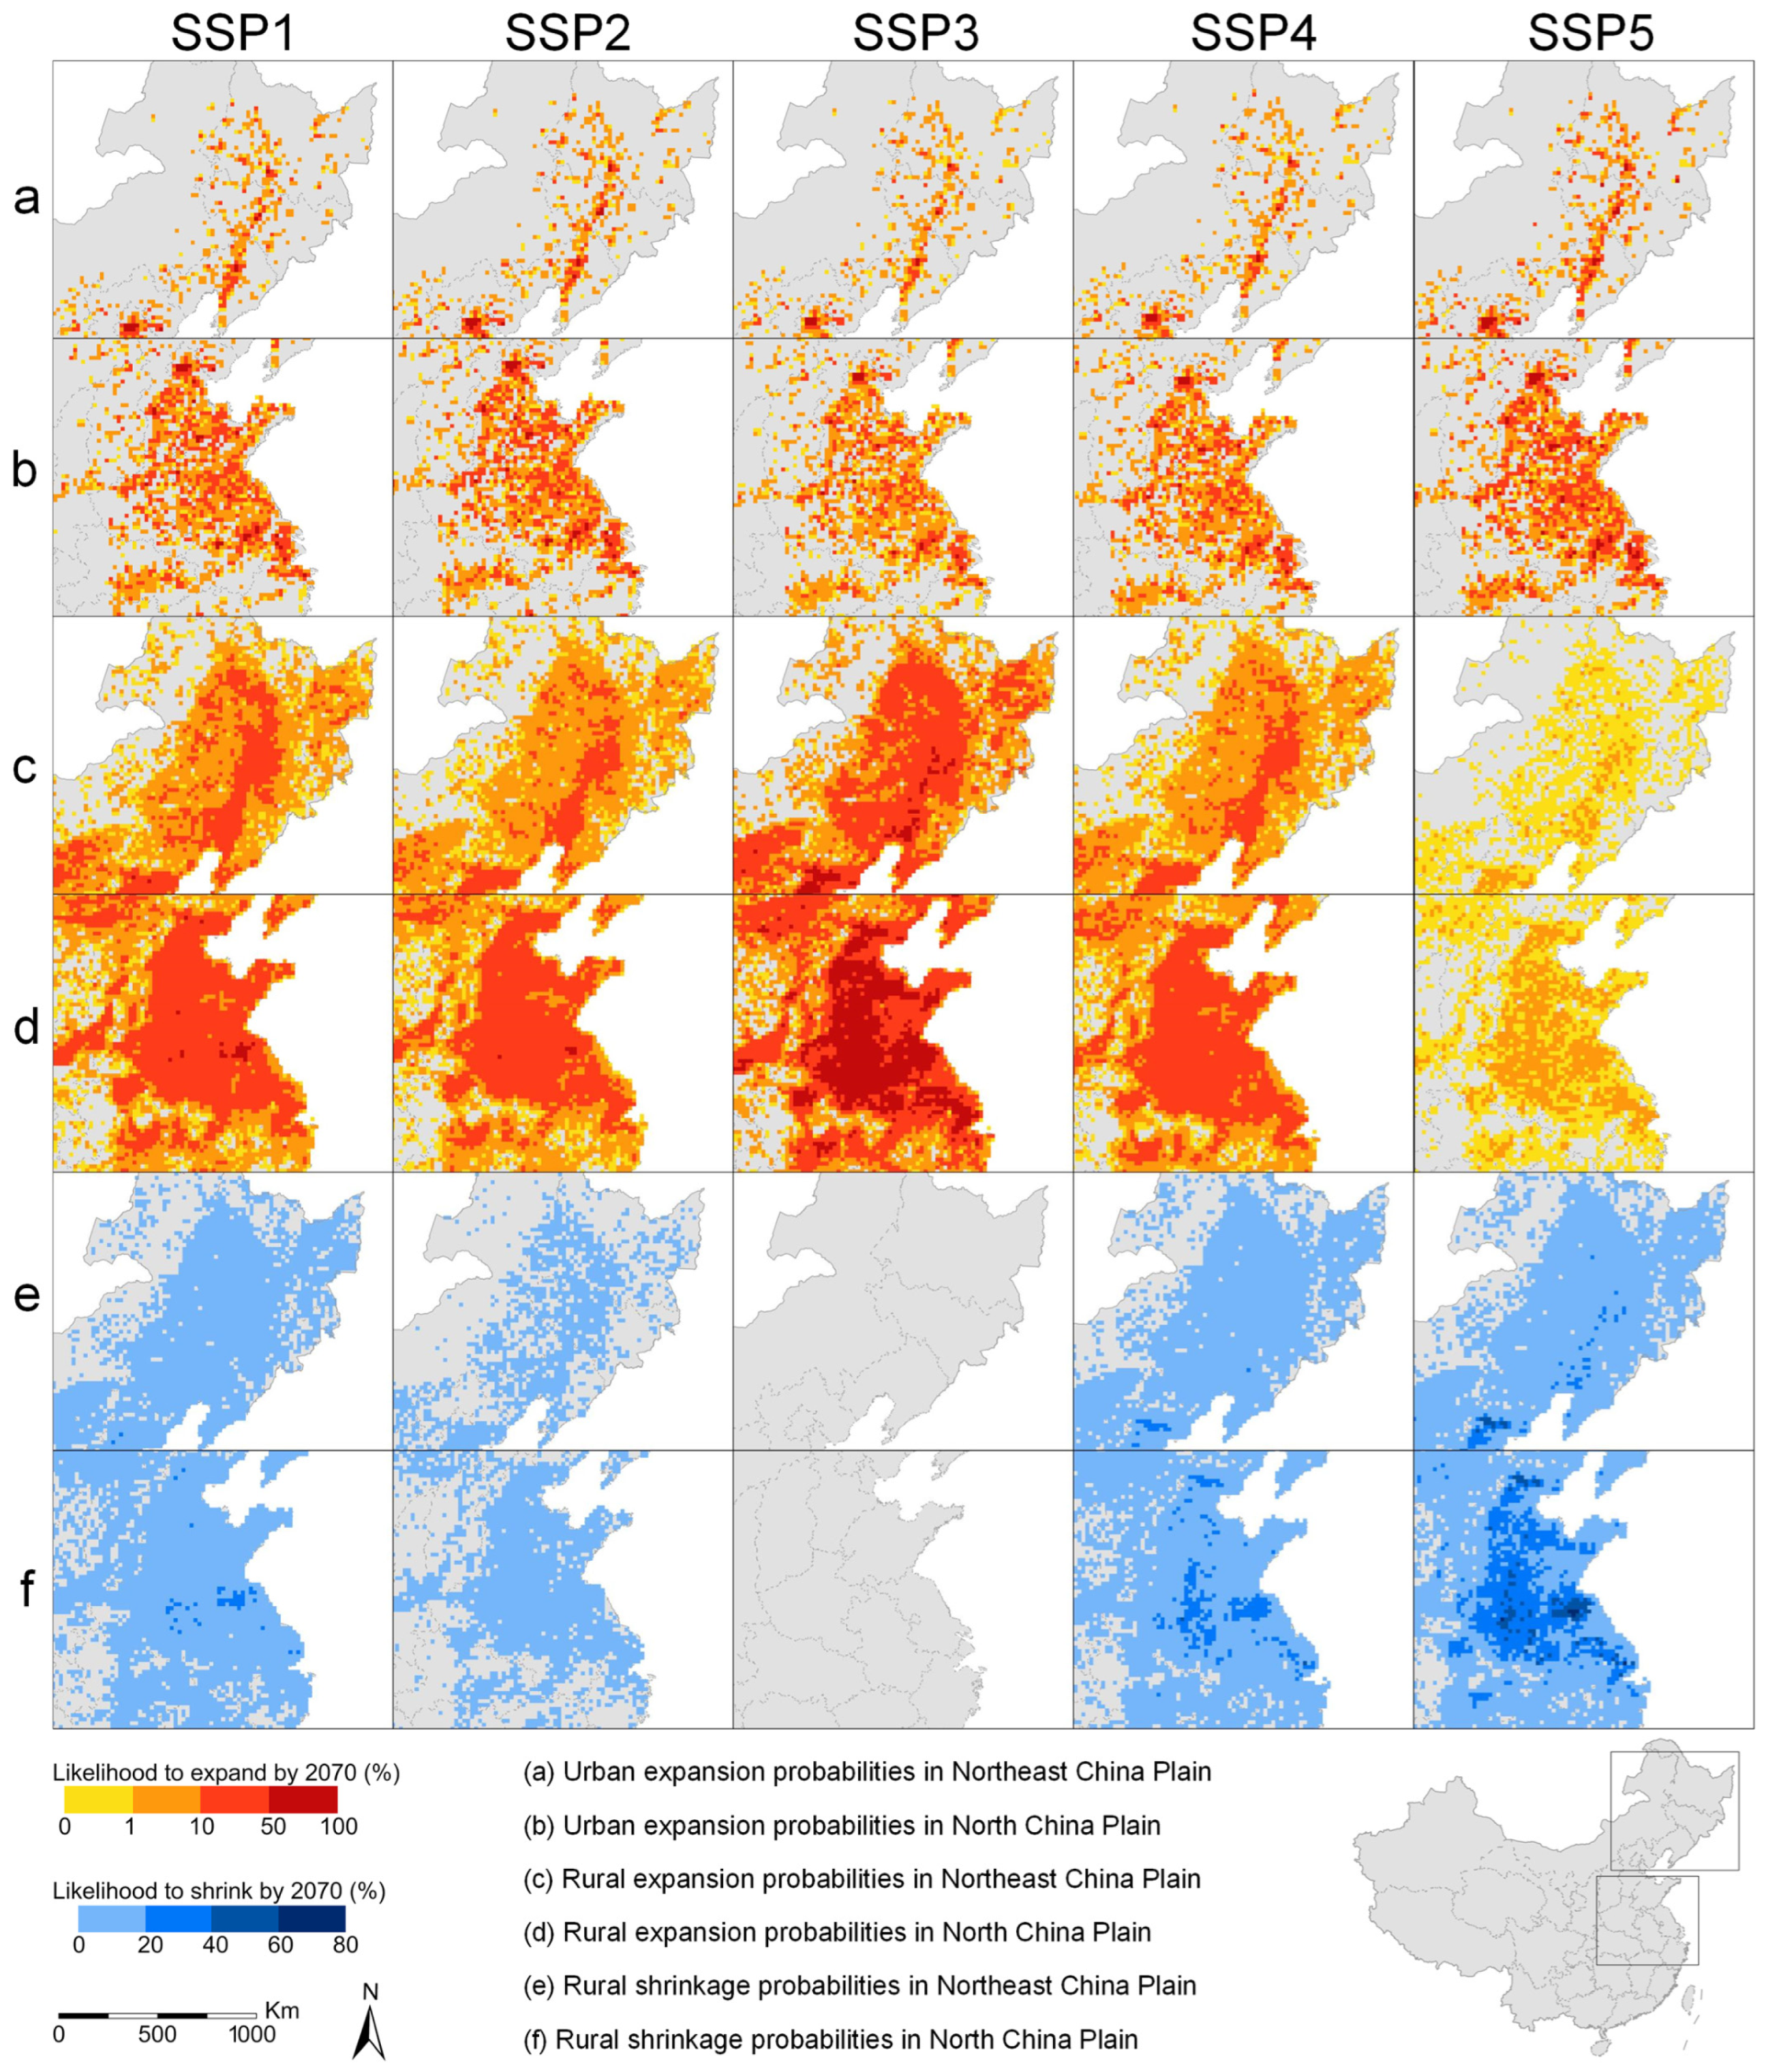
We evaluate the results from two perspectives. First, we conduct 10 simulations per SSP to estimate the spatial probability of built-up areas and assess the uncertainty. As shown in Figure 6, each built-up area simulation reveals similar spatial probability distributions for urban and rural areas. Urban expansion is concentrated around economically developed regions such as Beijing-Tianjin-Hebei and the Yangtze River Delta, while rural expansion primarily occurs in the Northeast and North China Plains. In the SSP 3 scenario, where rural areas continuously grow, but rural areas in the North China also decline under other scenarios, indicating that our results are robust.
Figure 6.
Regional simulation results for 2020–2070. We estimated the probability of urban and rural built-up area changes in each grid by combining 10 simulation outcomes.
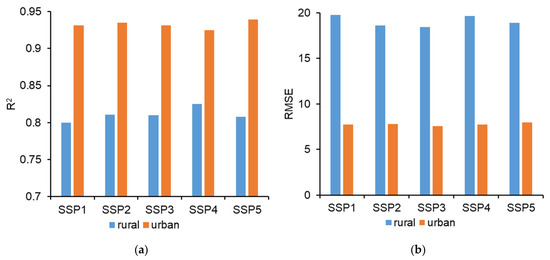
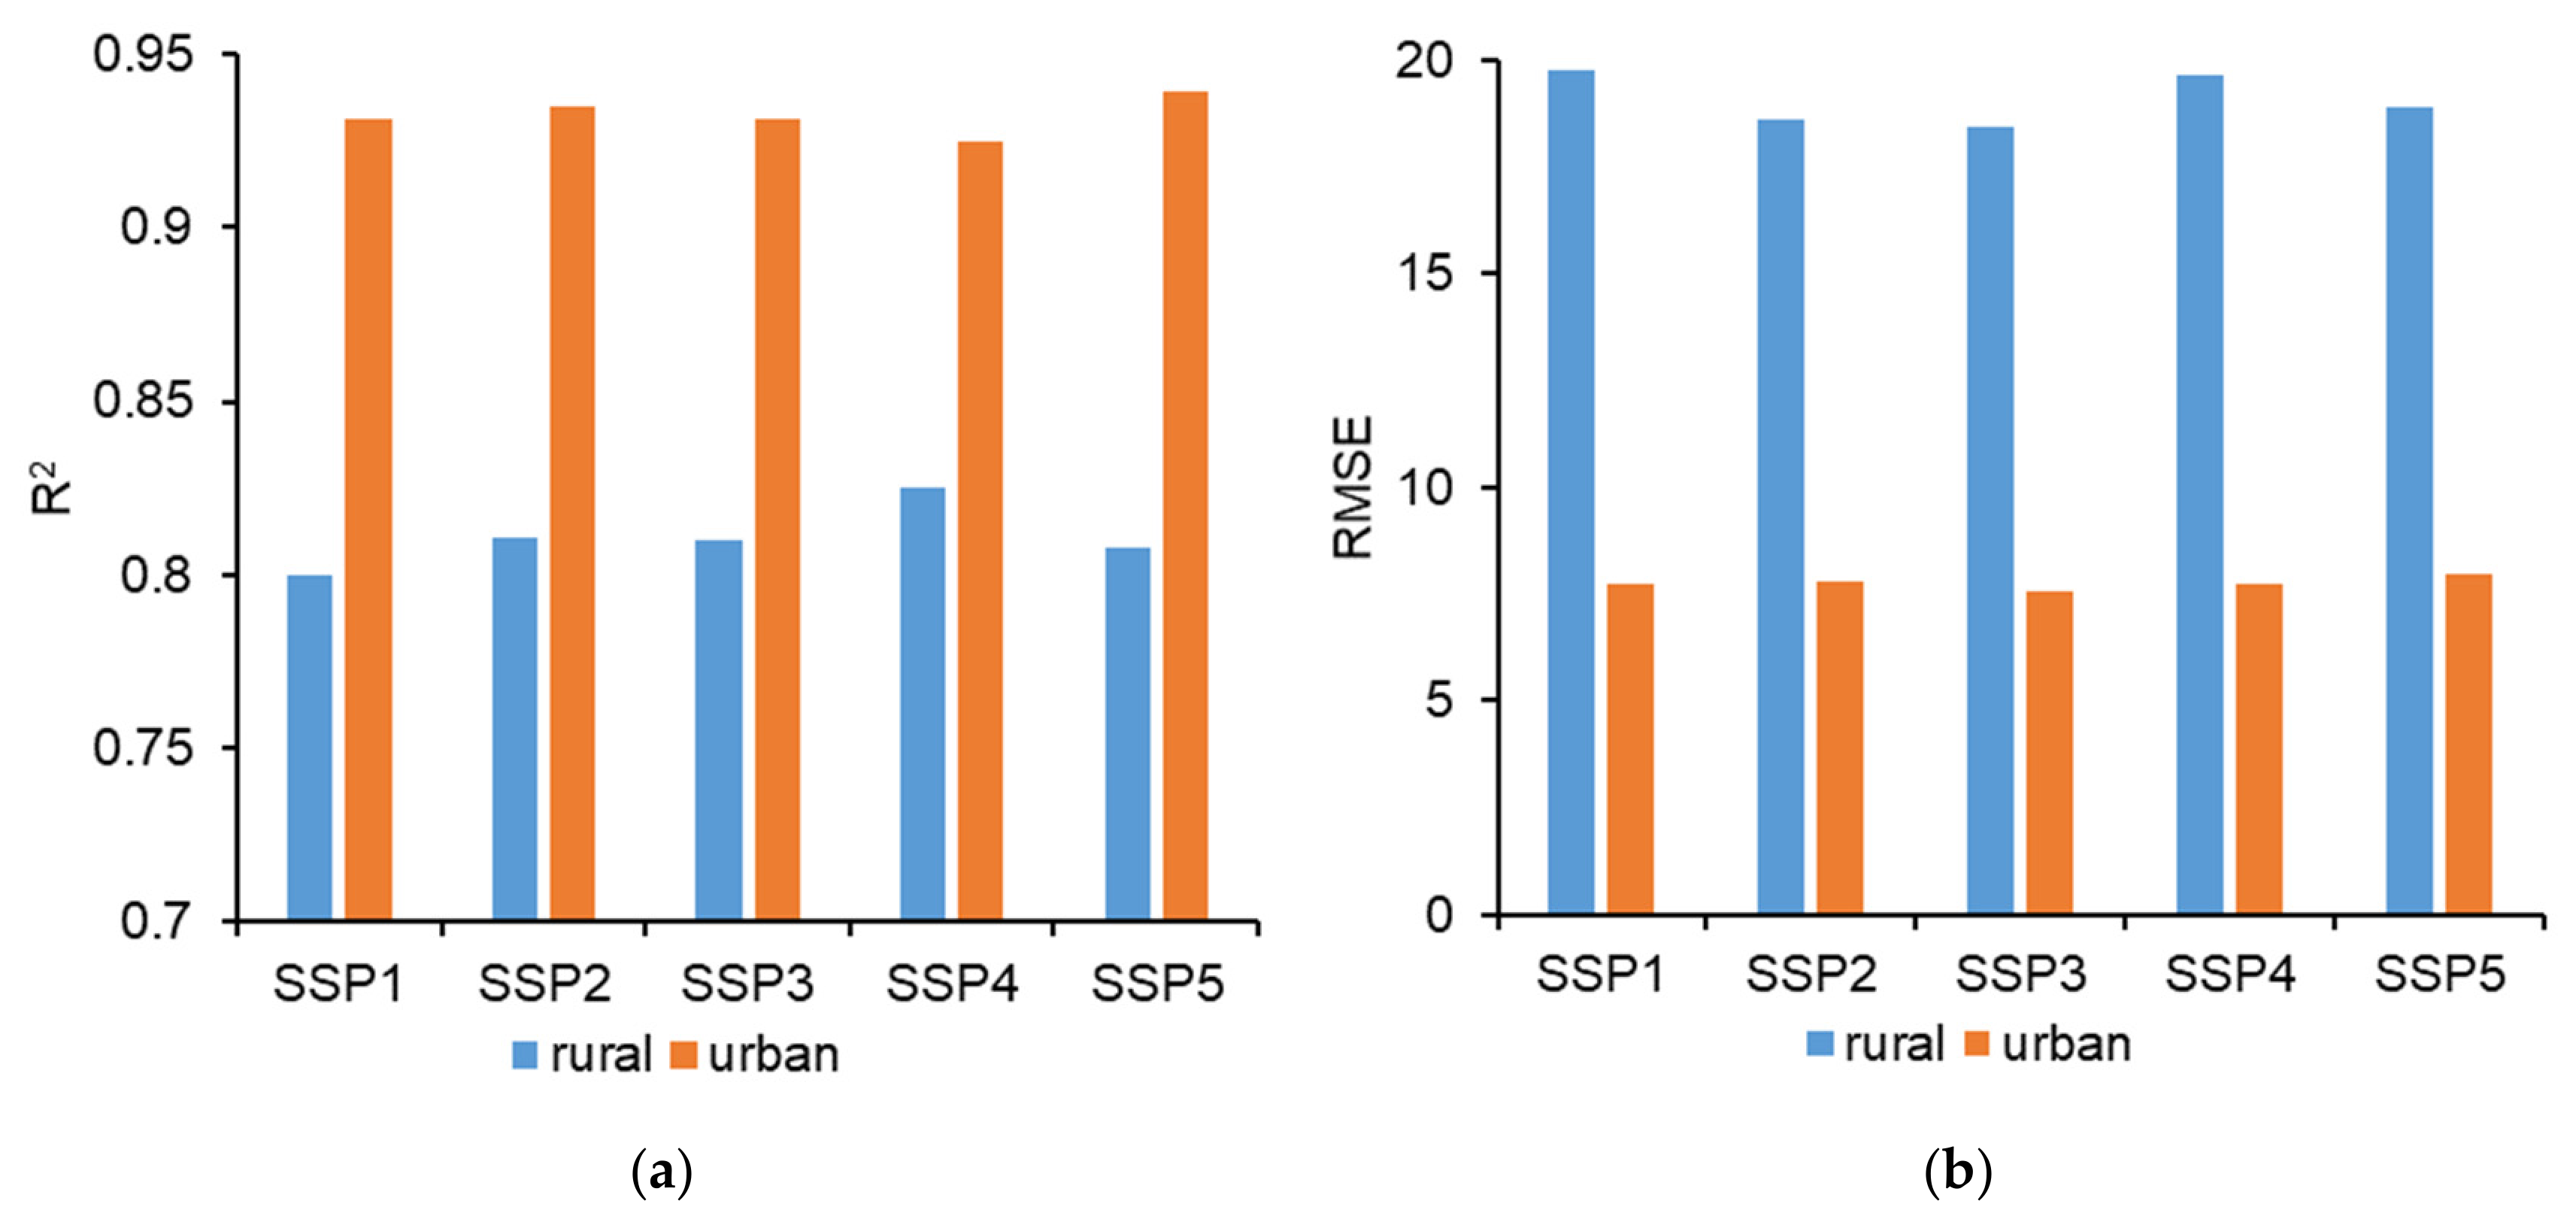
Using the urban and rural land data during 2009–2019 as the training dataset, we simulate the distribution of urban and rural built-up areas in 2020 under different SSPs, and compare the results with the CNLUCC dataset. The R2 values for rural land change simulations range from 0.80 to 0.83, and the RMSE values range from 18.40 to 19.77 km2, while urban simulations show the R2 values range from 0.93 to 0.94 and the RMSE values from 7.56 to 7.98 (Figure 7). These results demonstrate the reliability of the simulation outcomes.
Figure 7.
Assessment of urban and rural built-up area predictions. (a) R2 evaluation results; (b) RMSE evaluation results.
4.2. Future Land-Use Structures for Urban and Rural Development
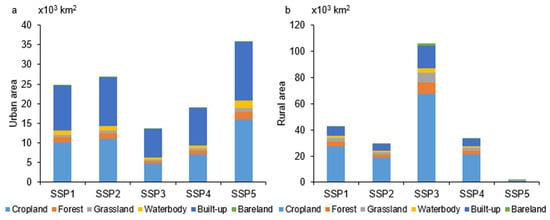
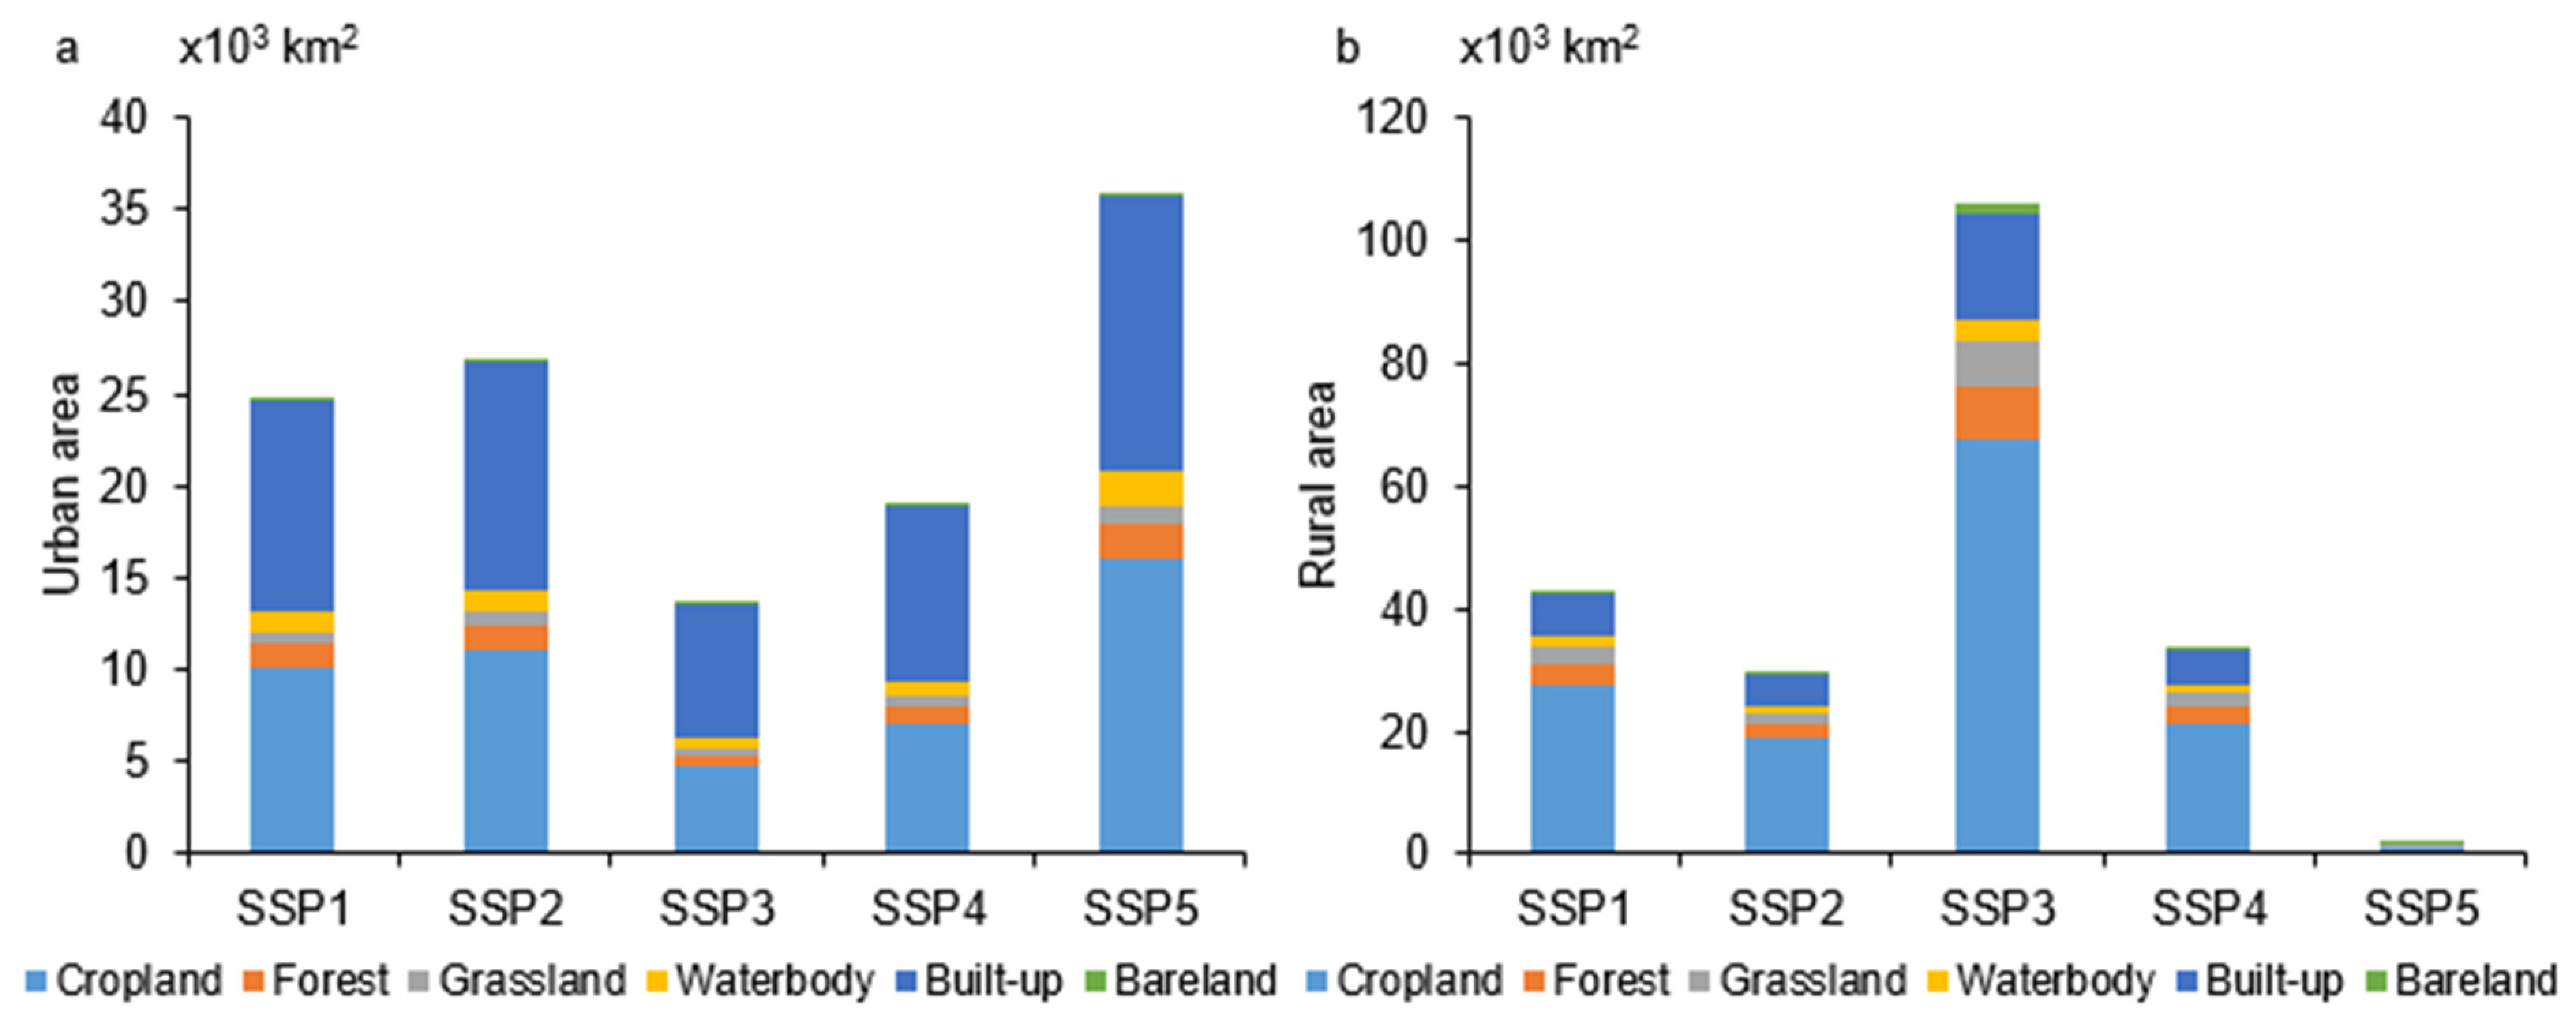
We overlay the projected urban and rural built-up areas with the 2020 China’s CNLUCC to analyze the land structure of future urban and rural developments. As shown in Figure 8a, by 2070, urban expansion is expected to primarily occupy croplands and built-up areas (including rural areas, factories, mines, and other construction land). From 2020 to 2070, between 4794 and 16,066 km2 of cropland is projected to be converted into urban land, representing 34.95–44.71% of the total urban expansion (Figure 8a). Expanded rural land primarily occupied cropland, with 1161 to 67,862 km2 of new rural land derived from cropland, accounting for 60.85–64.01% of the total rural expansion. By 2070, rural expansion will occupy 327–15,756 km2 of forests and grasslands, comprising 14.86–17.14% of new rural land (Figure 8b). The cropland replacement in built-up areas cannot be overlooked (Table 3).
Figure 8.
The encroachment of different land-cover types by urban and rural built-up land under SSPs1–5 (2020–2070). (a) Urban; (b) rural built-up land.
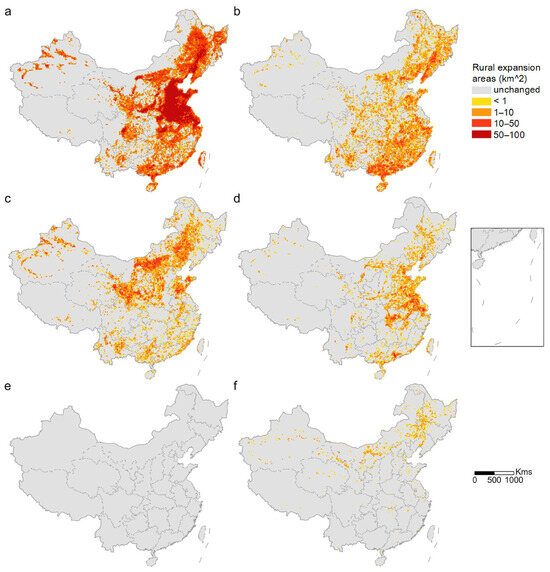
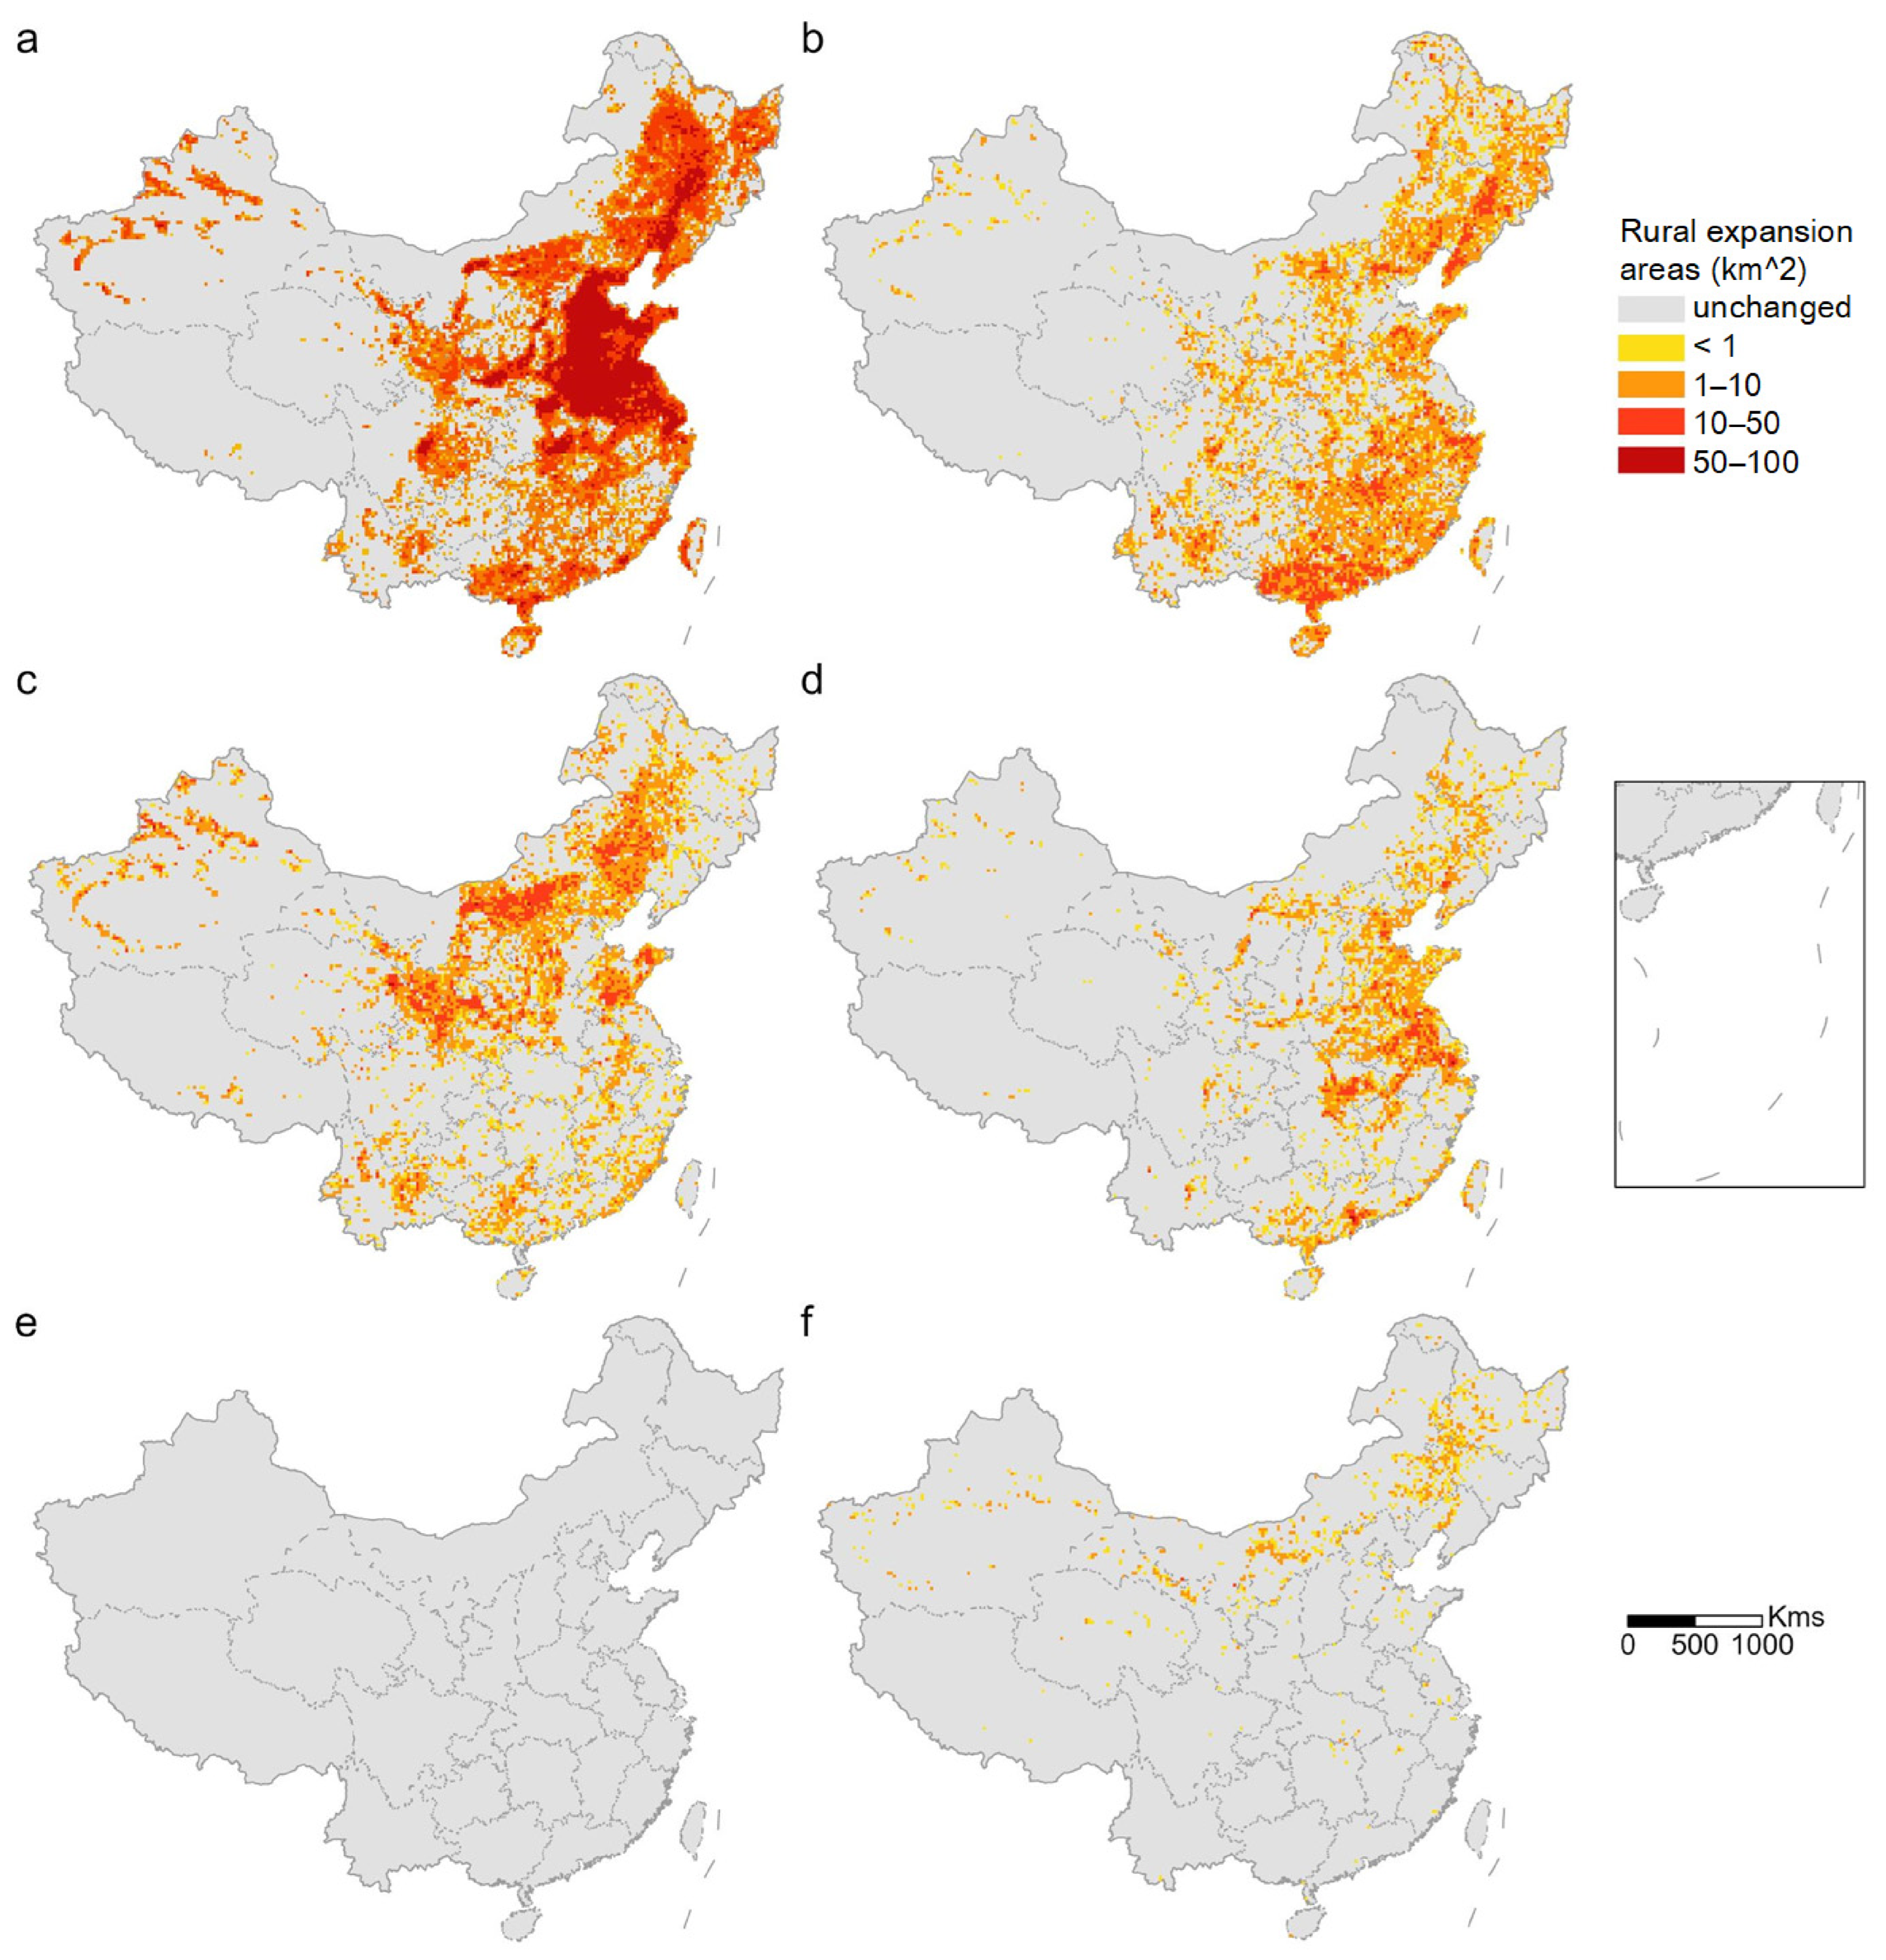
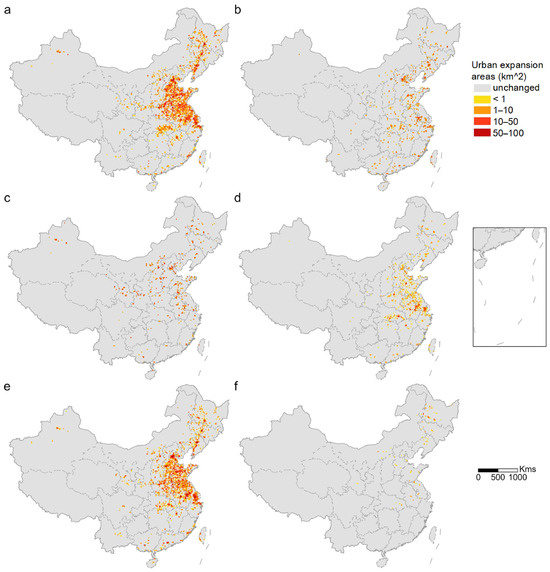
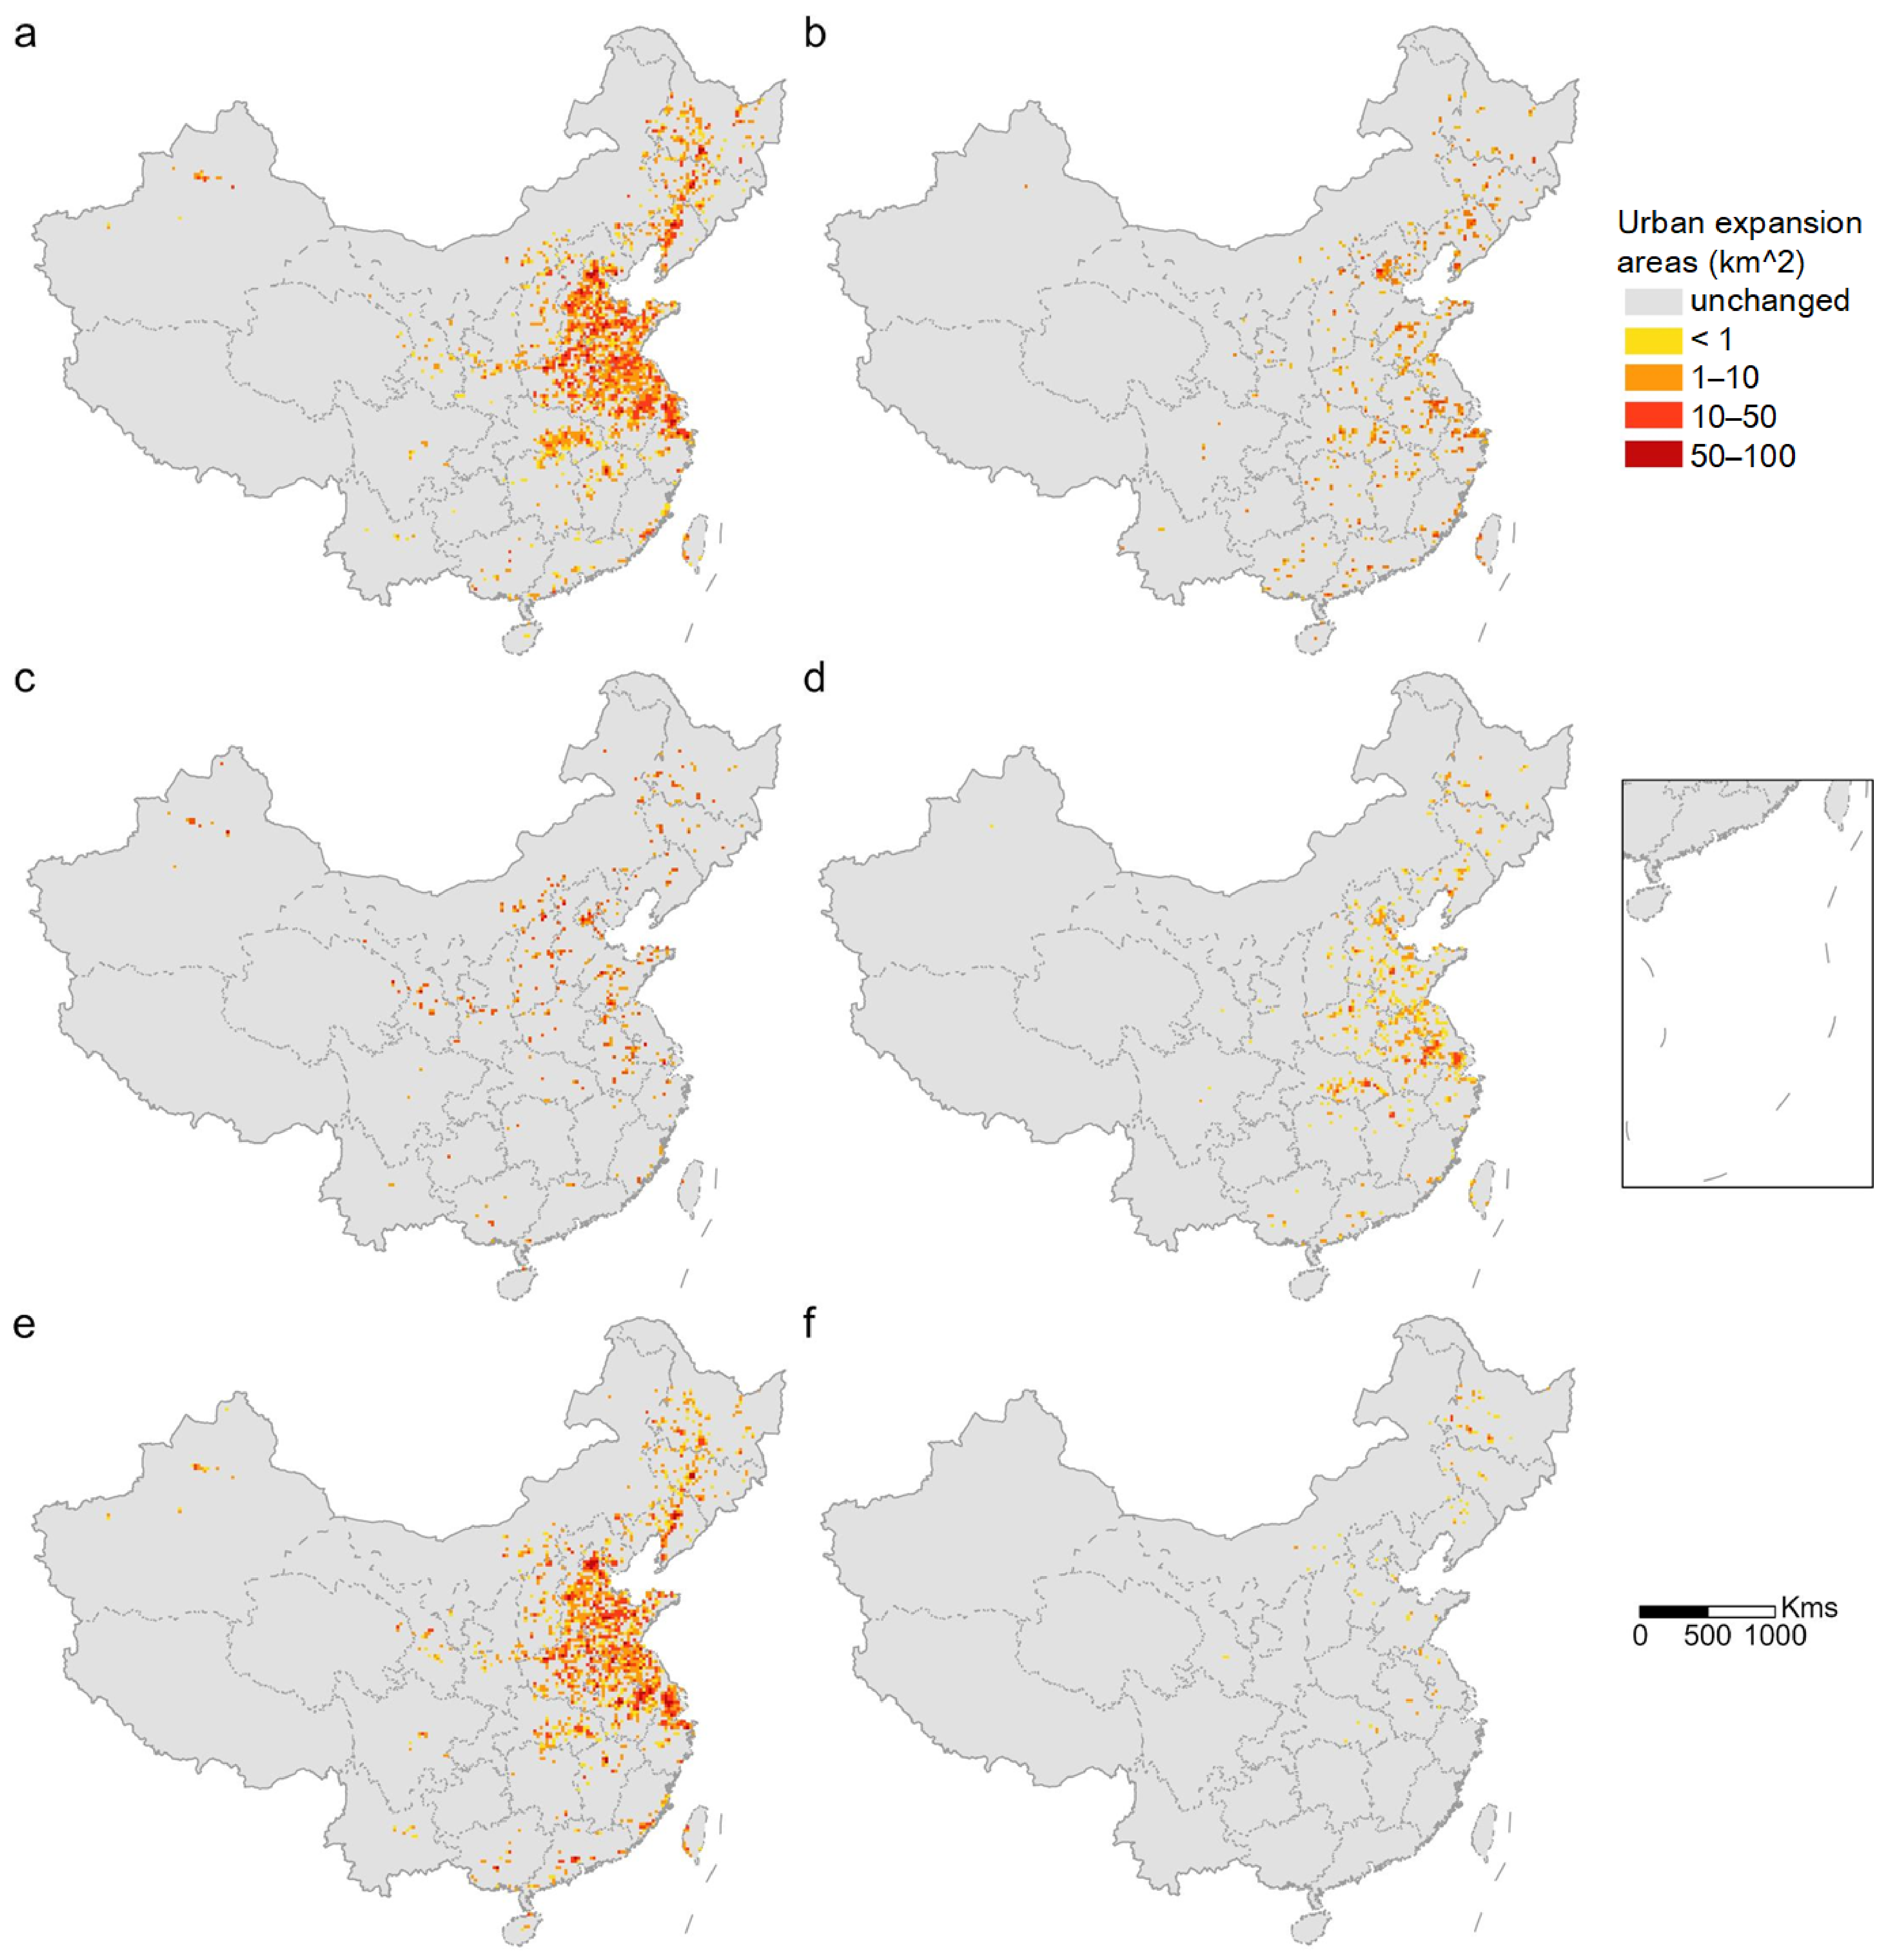
Rural built-up areas predominantly occupy cropland in the North China Plain and Northeast Plain (Figure 9a). Forest loss due to rural land expansion is expected to occur mainly in the Northeast Plain and southeastern coastal regions of China (Figure 9b). As a result of rural land expansion, the grassland area in eastern Inner Mongolia is projected to decrease sharply (Figure 9c). Approximately 3.34–3.39% of water bodies are occupied by expanding rural land, with the majority of water losses occurring in the Yangtze River Delta region (Figure 9d). Encroachment on bare land will mainly take place in the Northeast Plain, Inner Mongolia, and northern Xinjiang (Figure 9f). Since urban expansion is concentrated around economically developed regions, the cropland occupied by urban expansion is also concentrated near these urban agglomerations (Figure 10).
Figure 9.
Distribution of land-use types impacted by rural built-up land in the SSP3 scenario between 2020 and 2070: (a) cropland, (b) forest, (c) grassland, (d) water body, (e) other built-up areas, (f) bare land.
Figure 10.
Distribution of land-use types impacted by urban built-up land in the SSP5 scenario between 2020 and 2070: (a) cropland, (b) forest, (c) grassland, (d) water body, (e) other built-up areas, (f) bare land.
4.3. Impacts of Urban and Rural Built-Up Area Expansion on Biodiversity
The International Union for Conservation of Nature (IUCN) evaluated the extinction risks of more than 166,000 animal species in its Red List of Threatened Species, which assessed the extinction risk for amphibians, birds, mammals and reptiles globally [53]. We perform a spatial overlay analysis between the simulated urban and rural built-up areas and the species listed in the IUCN Red List of Threatened Species. The species selected for analysis include 190 “Near Threatened” (NT), 210 “Vulnerable” (VU), 151 “Endangered” (EN), and 66 “Critically Endangered” (CR) species. We define biodiversity loss caused by urban and rural expansion as direct loss, and biodiversity loss caused by cropland displacement as indirect loss (Methods). We evaluate biodiversity loss caused by urban and rural expansion from the aspects: the number of the affected species, and the area and proportion of habitat loss.
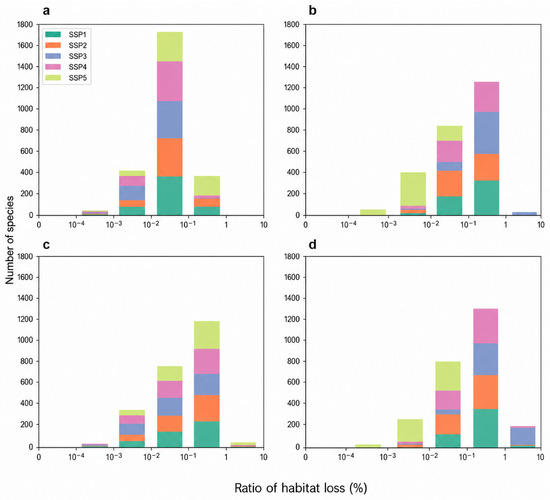
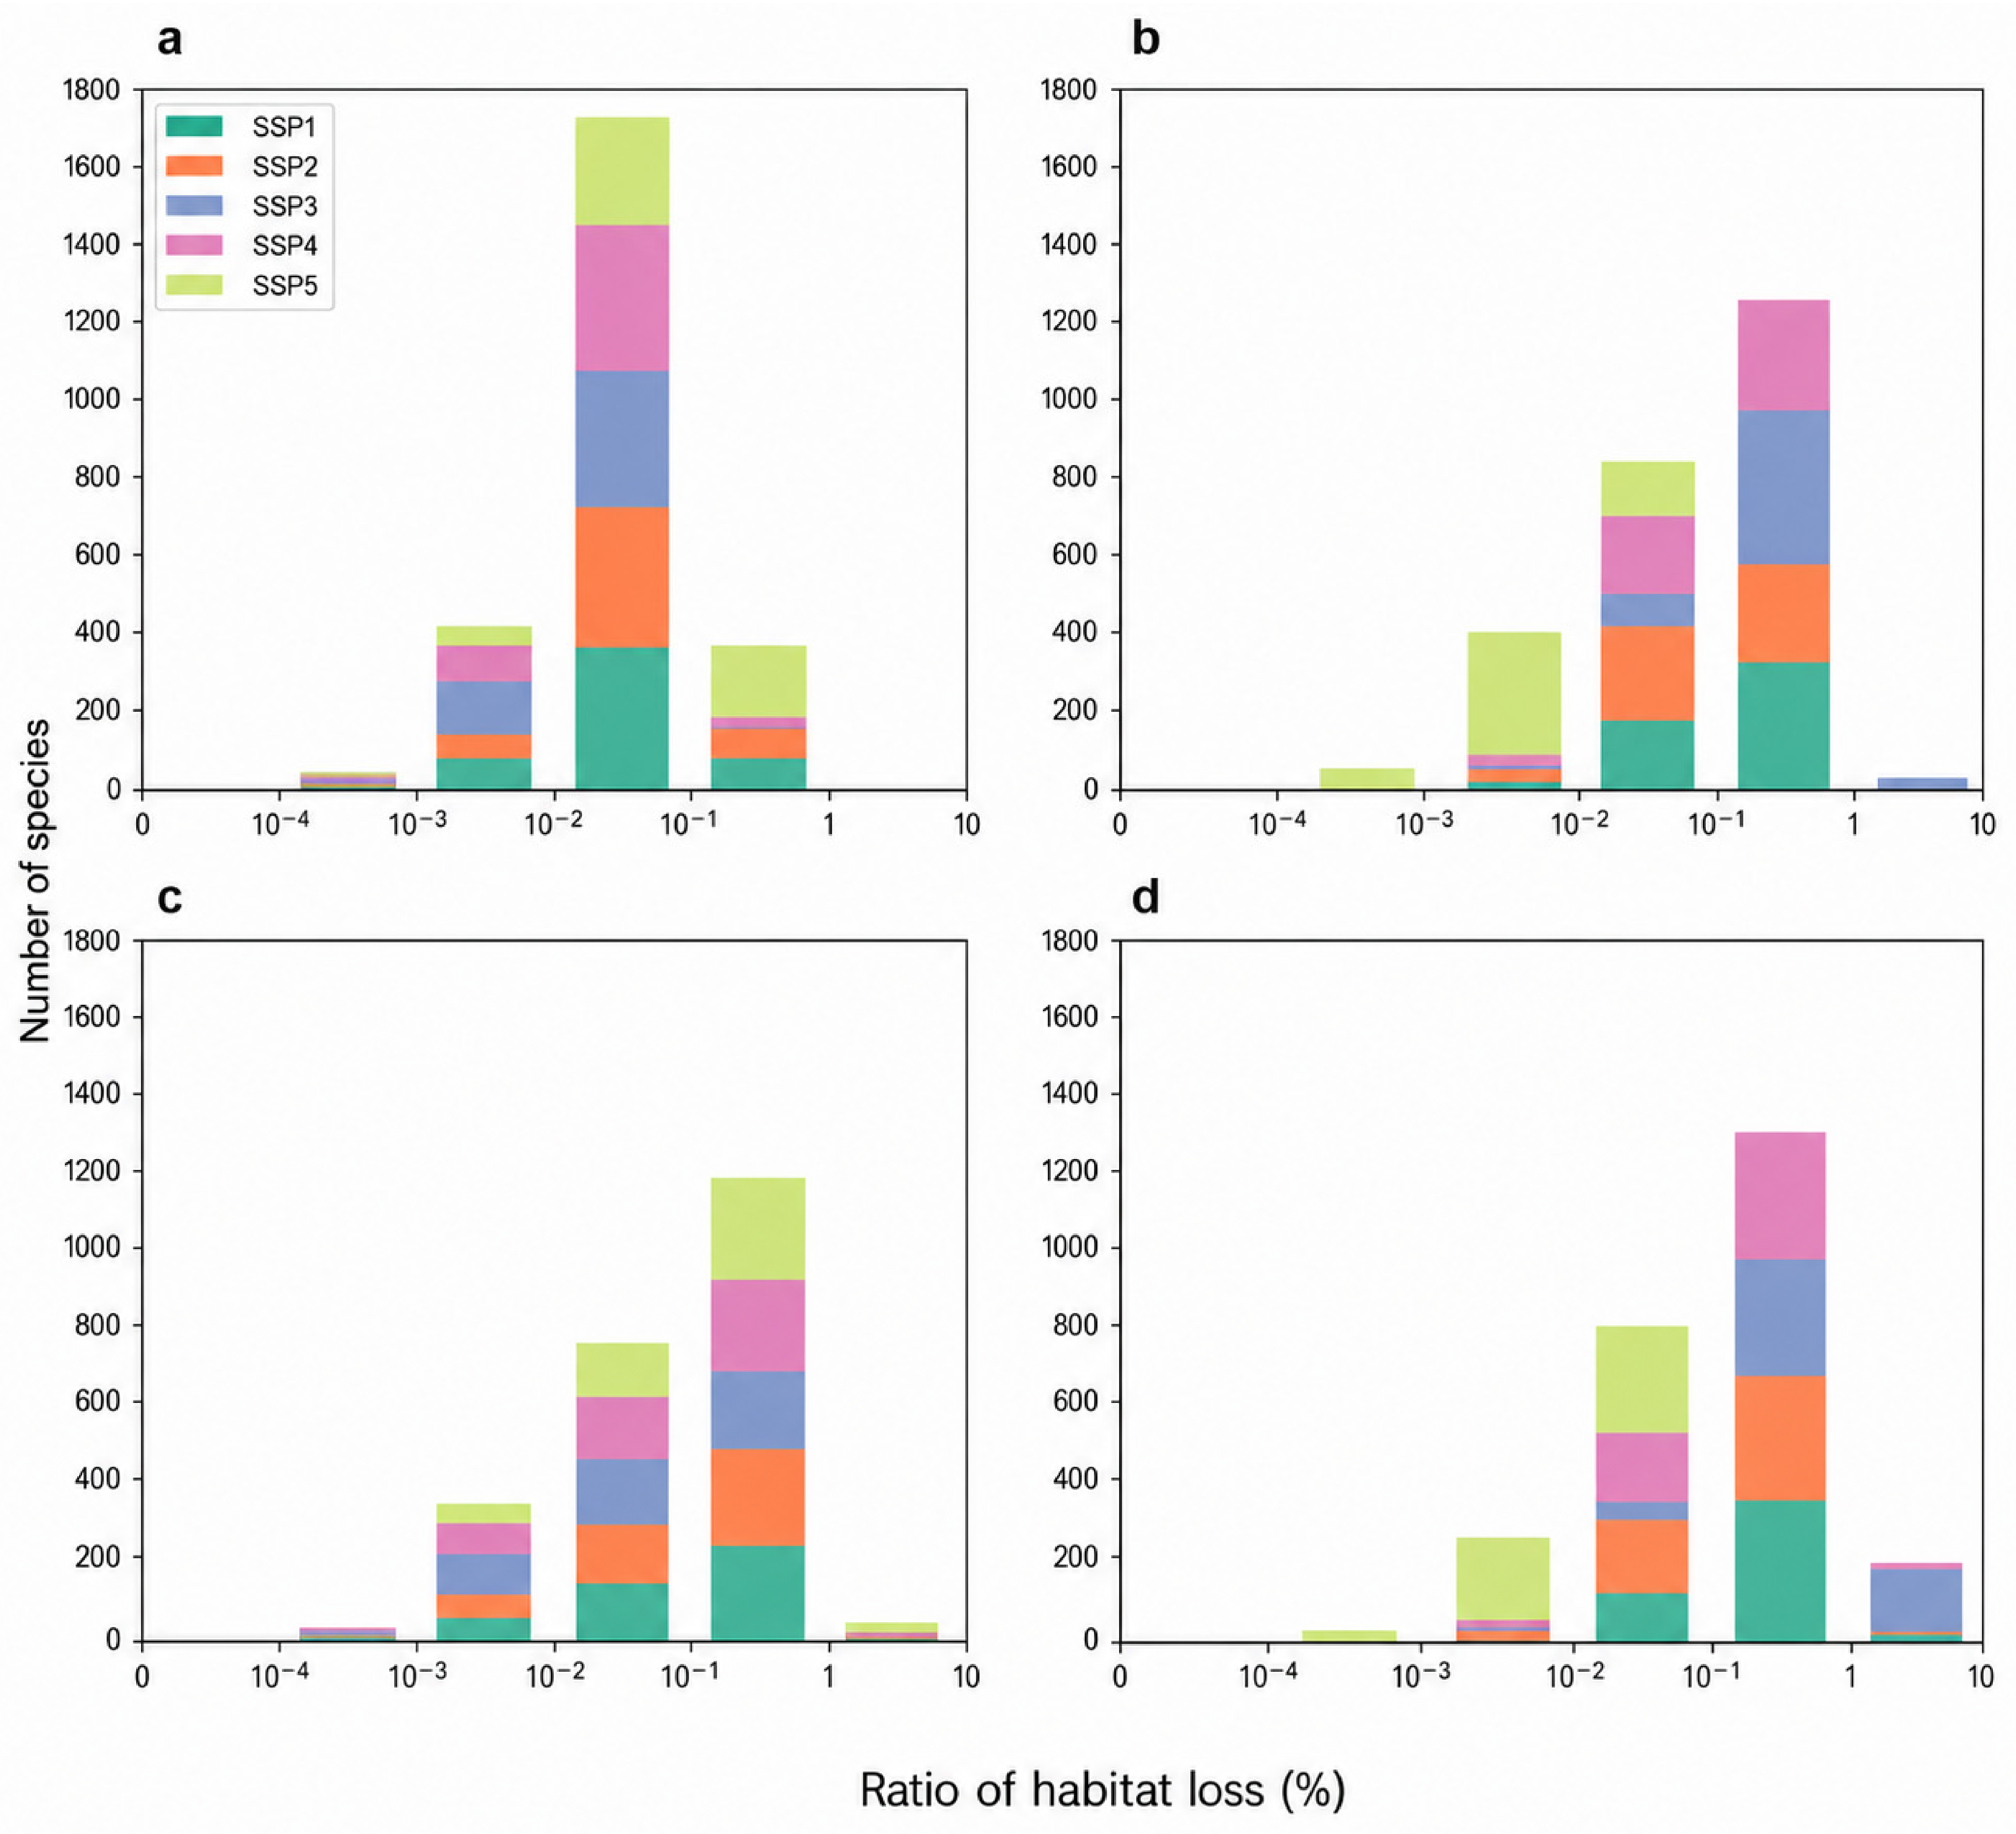
From 2020 to 2070, under different SSP scenarios, the number of species directly affected by rural built-up area expansion (488–524 species, Figure 11) is greater than the number of species directly affected by urban expansion (501–513 species, Figure 11). As shown in Figure 11, the number of species indirectly affected by rural built-up area expansion (495–524 species, Figure 11) is greater than the number of species indirectly affected by urban expansion (468–474 species, Figure 11). In the SSP3 scenario, the highest number of species (27 species, Figure 11) lose more than 1% of their habitats due to direct rural built-up area expansion, representing 5.16% of the affected species in this scenario. Under the SSP3 scenario, the highest number of species (161 species) experiences an indirect loss of more than 1% of their habitat due to rural built-up land expansion, accounting for 30.73% of the affected species in this scenario (Figure 11). Among them, NT species (70 species) represent the largest group of species with more than 1.0% habitat loss, followed by VU species (67 species). In terms of species categories, amphibians (66 species) account for the largest number of species with more than 1.0% habitat loss, followed by birds (61 species).
Figure 11.
The number of species directly and indirectly affected by urban and rural expansion under SSP1–5 scenario from 2020 to 2070. (a) Number of threatened species directly affected by urban built-up area expansion; (b) Number of threatened species directly affected by rural built-up area expansion; (c) Number of threatened species indirectly affected by urban built-up area expansion; (d) Number of threatened species in-directly affected by rural built-up area expansion.
Under different SSP scenarios, no species directly lost more than 1% of their habitat due to urban built-up area expansion. However, 1–20 species indirectly lost more than 1% of their habitat due to urban expansion (Figure 11). In the SSP5 scenario, the highest number of species (20 species, Figure 11) experience an indirect loss of more than 1% of their habitat due to urban expansion. In terms of species threat levels, they include 7 NT species (4.61% of the affected NT species in SSP5), 5 VU species (3.03% of the affected VU species in SSP5), 6 EN species (5.22% of the affected EN species in SSP5), and 2 CR species (6.06% of the affected CR species in SSP5). In terms of species categories, they include 3 birds (1.80% of the affected bird species in SSP5), 4 mammals (3.70% of the affected mammal species in SSP5), 9 amphibians (6.72% of the affected amphibian species in SSP5), and 4 reptiles (7.14% of the affected reptile species in SSP5).
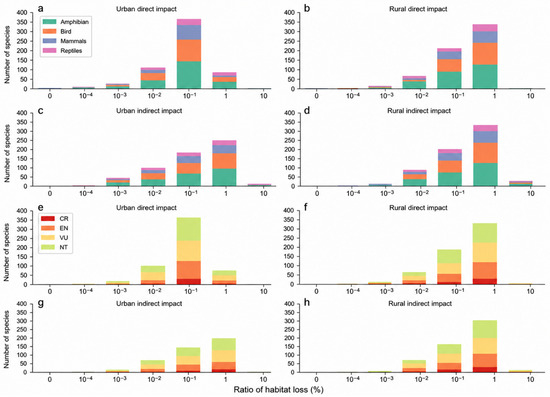
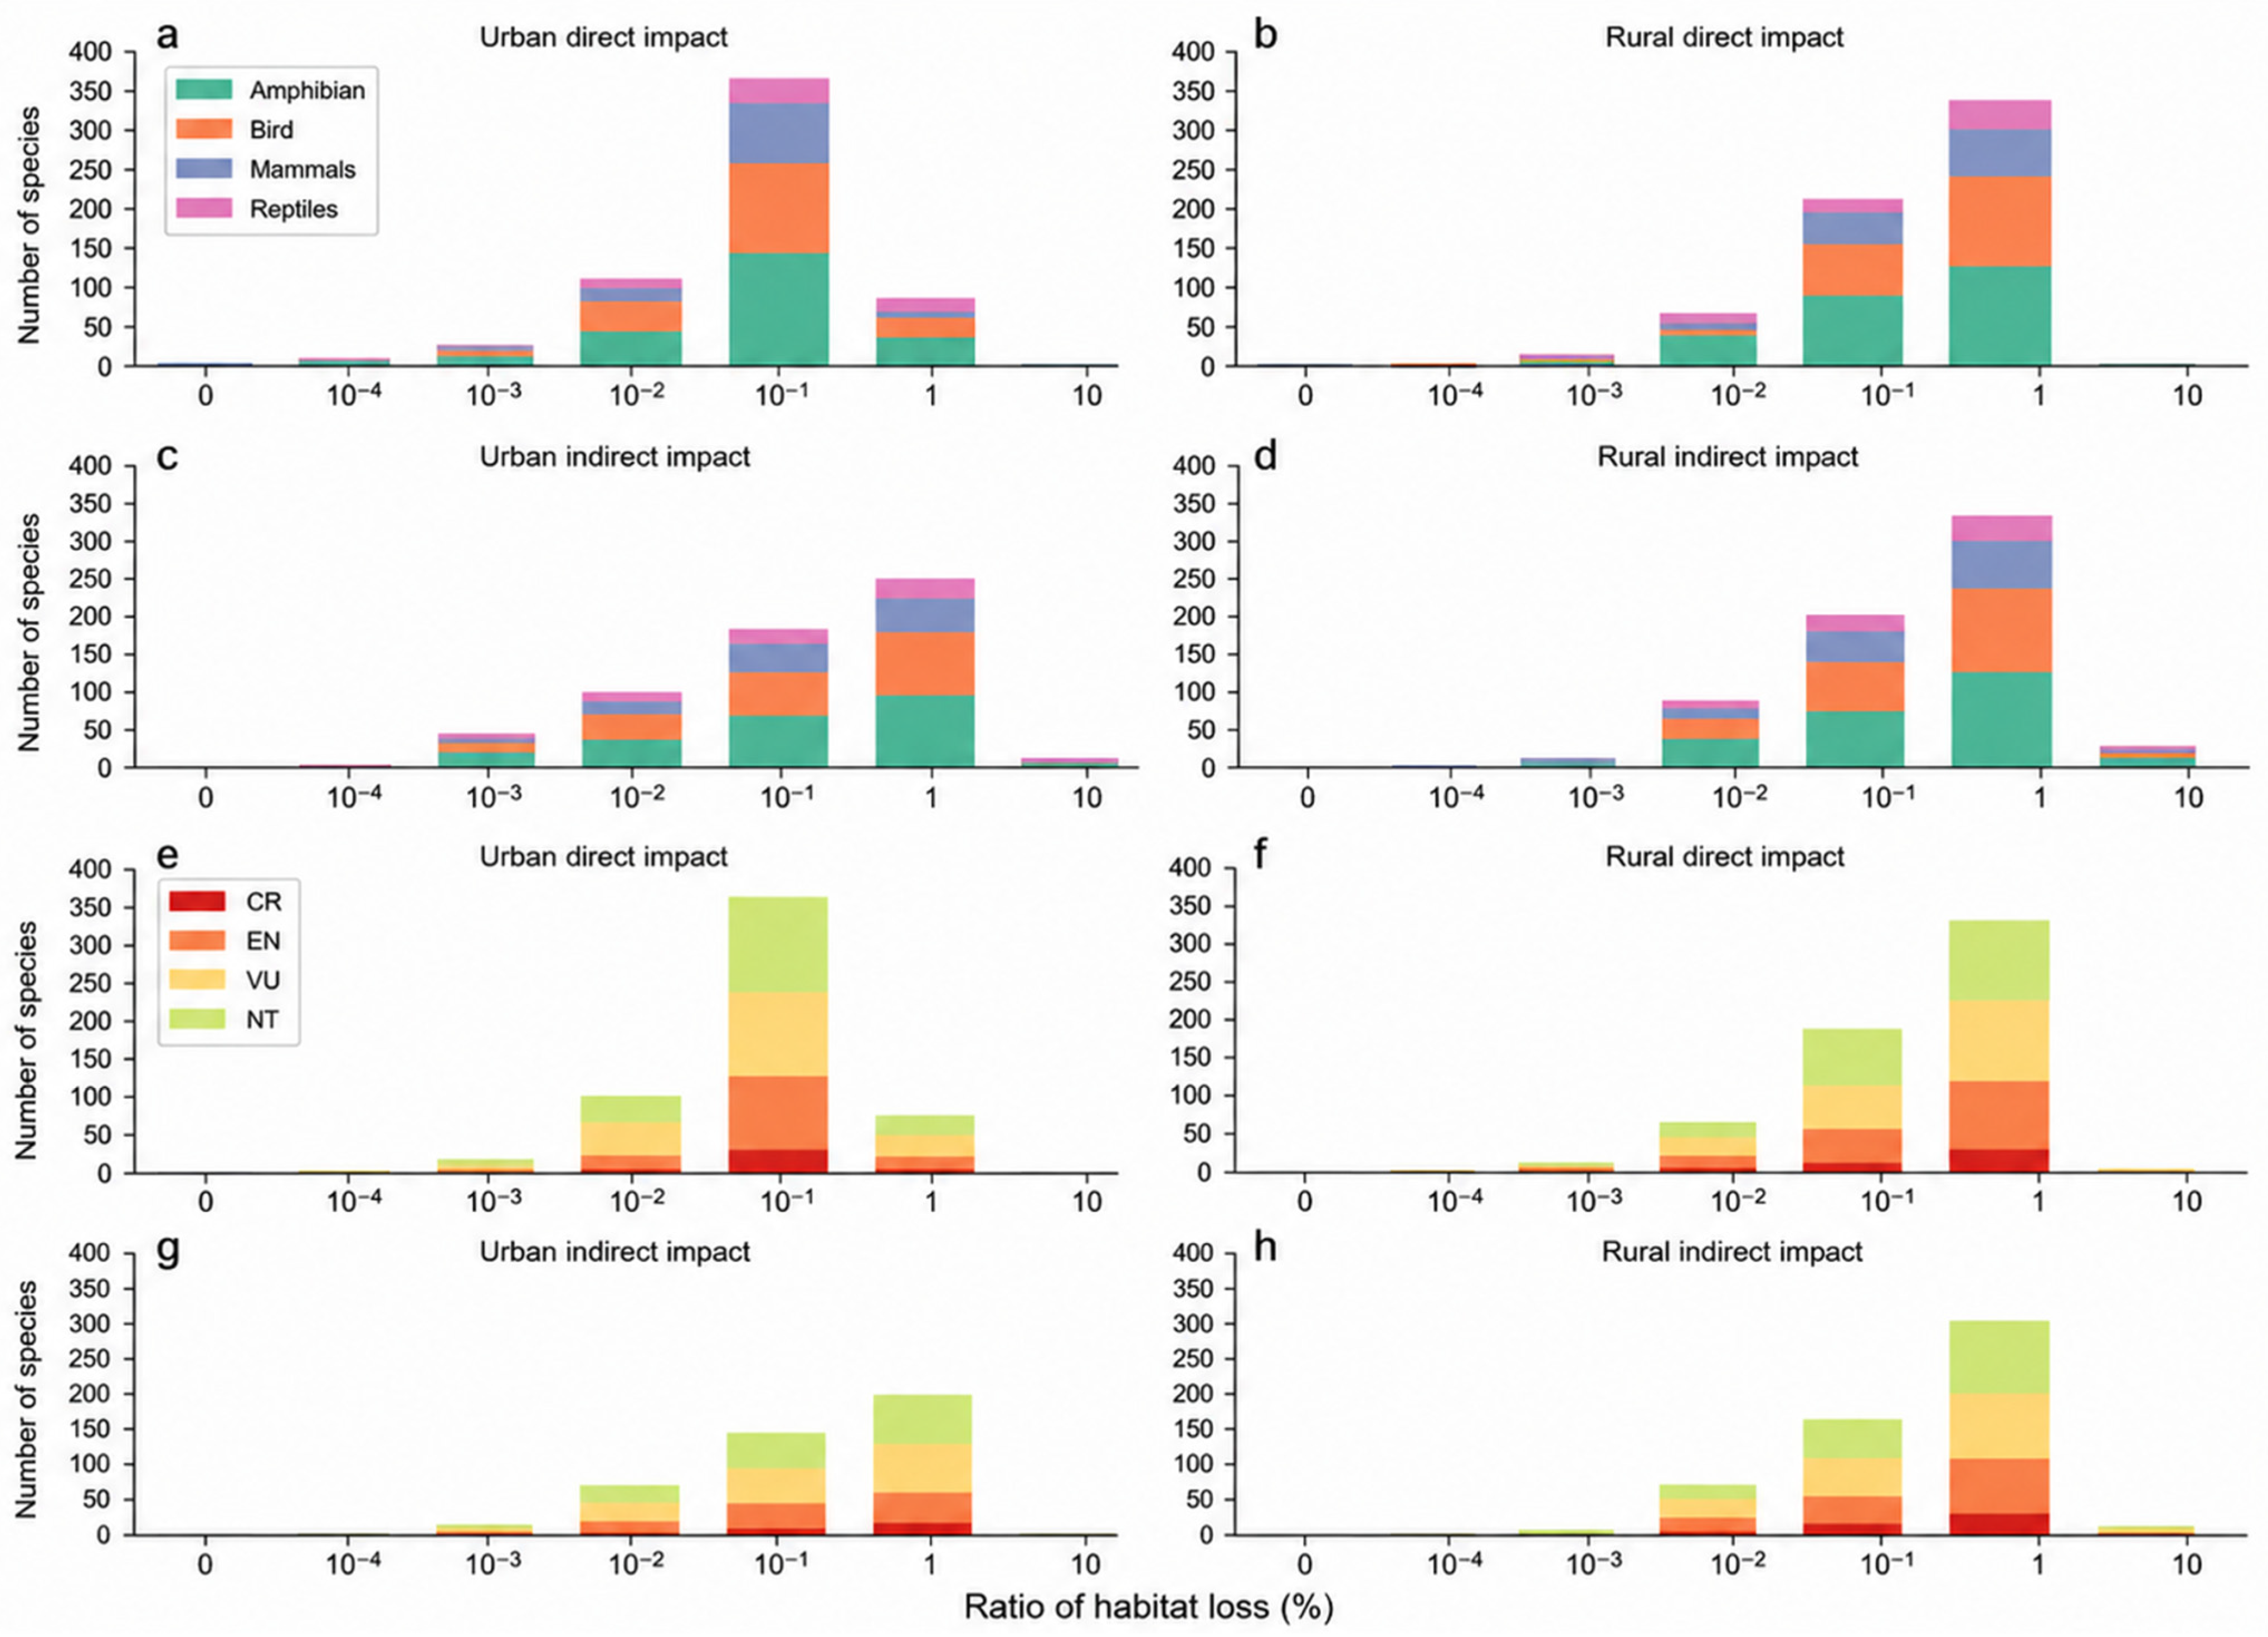
From 2020 to 2070, most of endangered species (80.92–93.90%) are expected to lose habitat between 0.01% and 1% due to built-up area expansion, while 3.05–18.23% of endangered species lose less than 0.01% of their habitats. Amphibians (16 species) represent the greatest number of species with more than 1.0% habitat loss, followed by birds (6 species). Among threatened species, birds are the most affected by built-up area expansion, with 169–177 species impacted, followed by reptiles (136–164 species) (Figure 12).
Figure 12.
The average number of species directly and indirectly affected by urban and rural expansion under different scenarios from 2020 to 2070. (a) Number of species of different taxonomic groups directly affected by urban expansion; (b) Number of species of different taxonomic groups directly affected by rural expansion; (c) Number of species of different taxonomic groups indirectly affected by urban expansion; (d) Number of species of different taxonomic groups indirectly affected by rural expansion; (e) Number of species of different threat levels directly affected by urban expansion; (f) Number of species of different threat levels directly affected by rural expansion; (g) Number of species of different threat levels indirectly affected by urban expansion; (h) Number of species of different threat levels indirectly affected by rural expansion.
The NT species are the most affected by built-up areas expansion, followed by VU, EN, and CR species (Figure 12). VU species account for the largest number of species with more than 1.0% habitat losses (14 species), followed by EN (8 species) and NT (7 species).
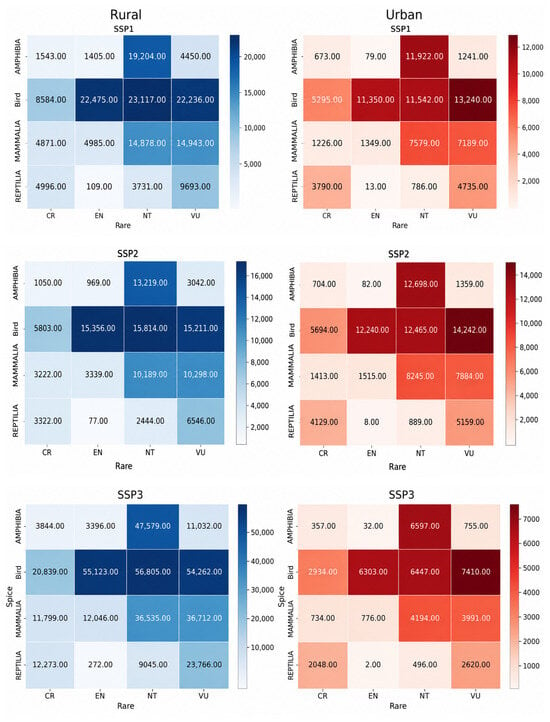
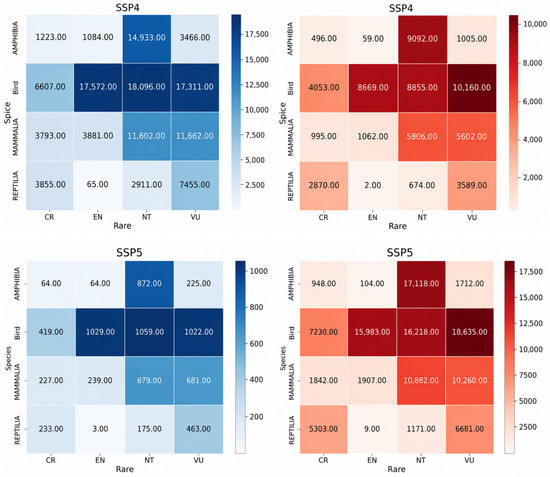
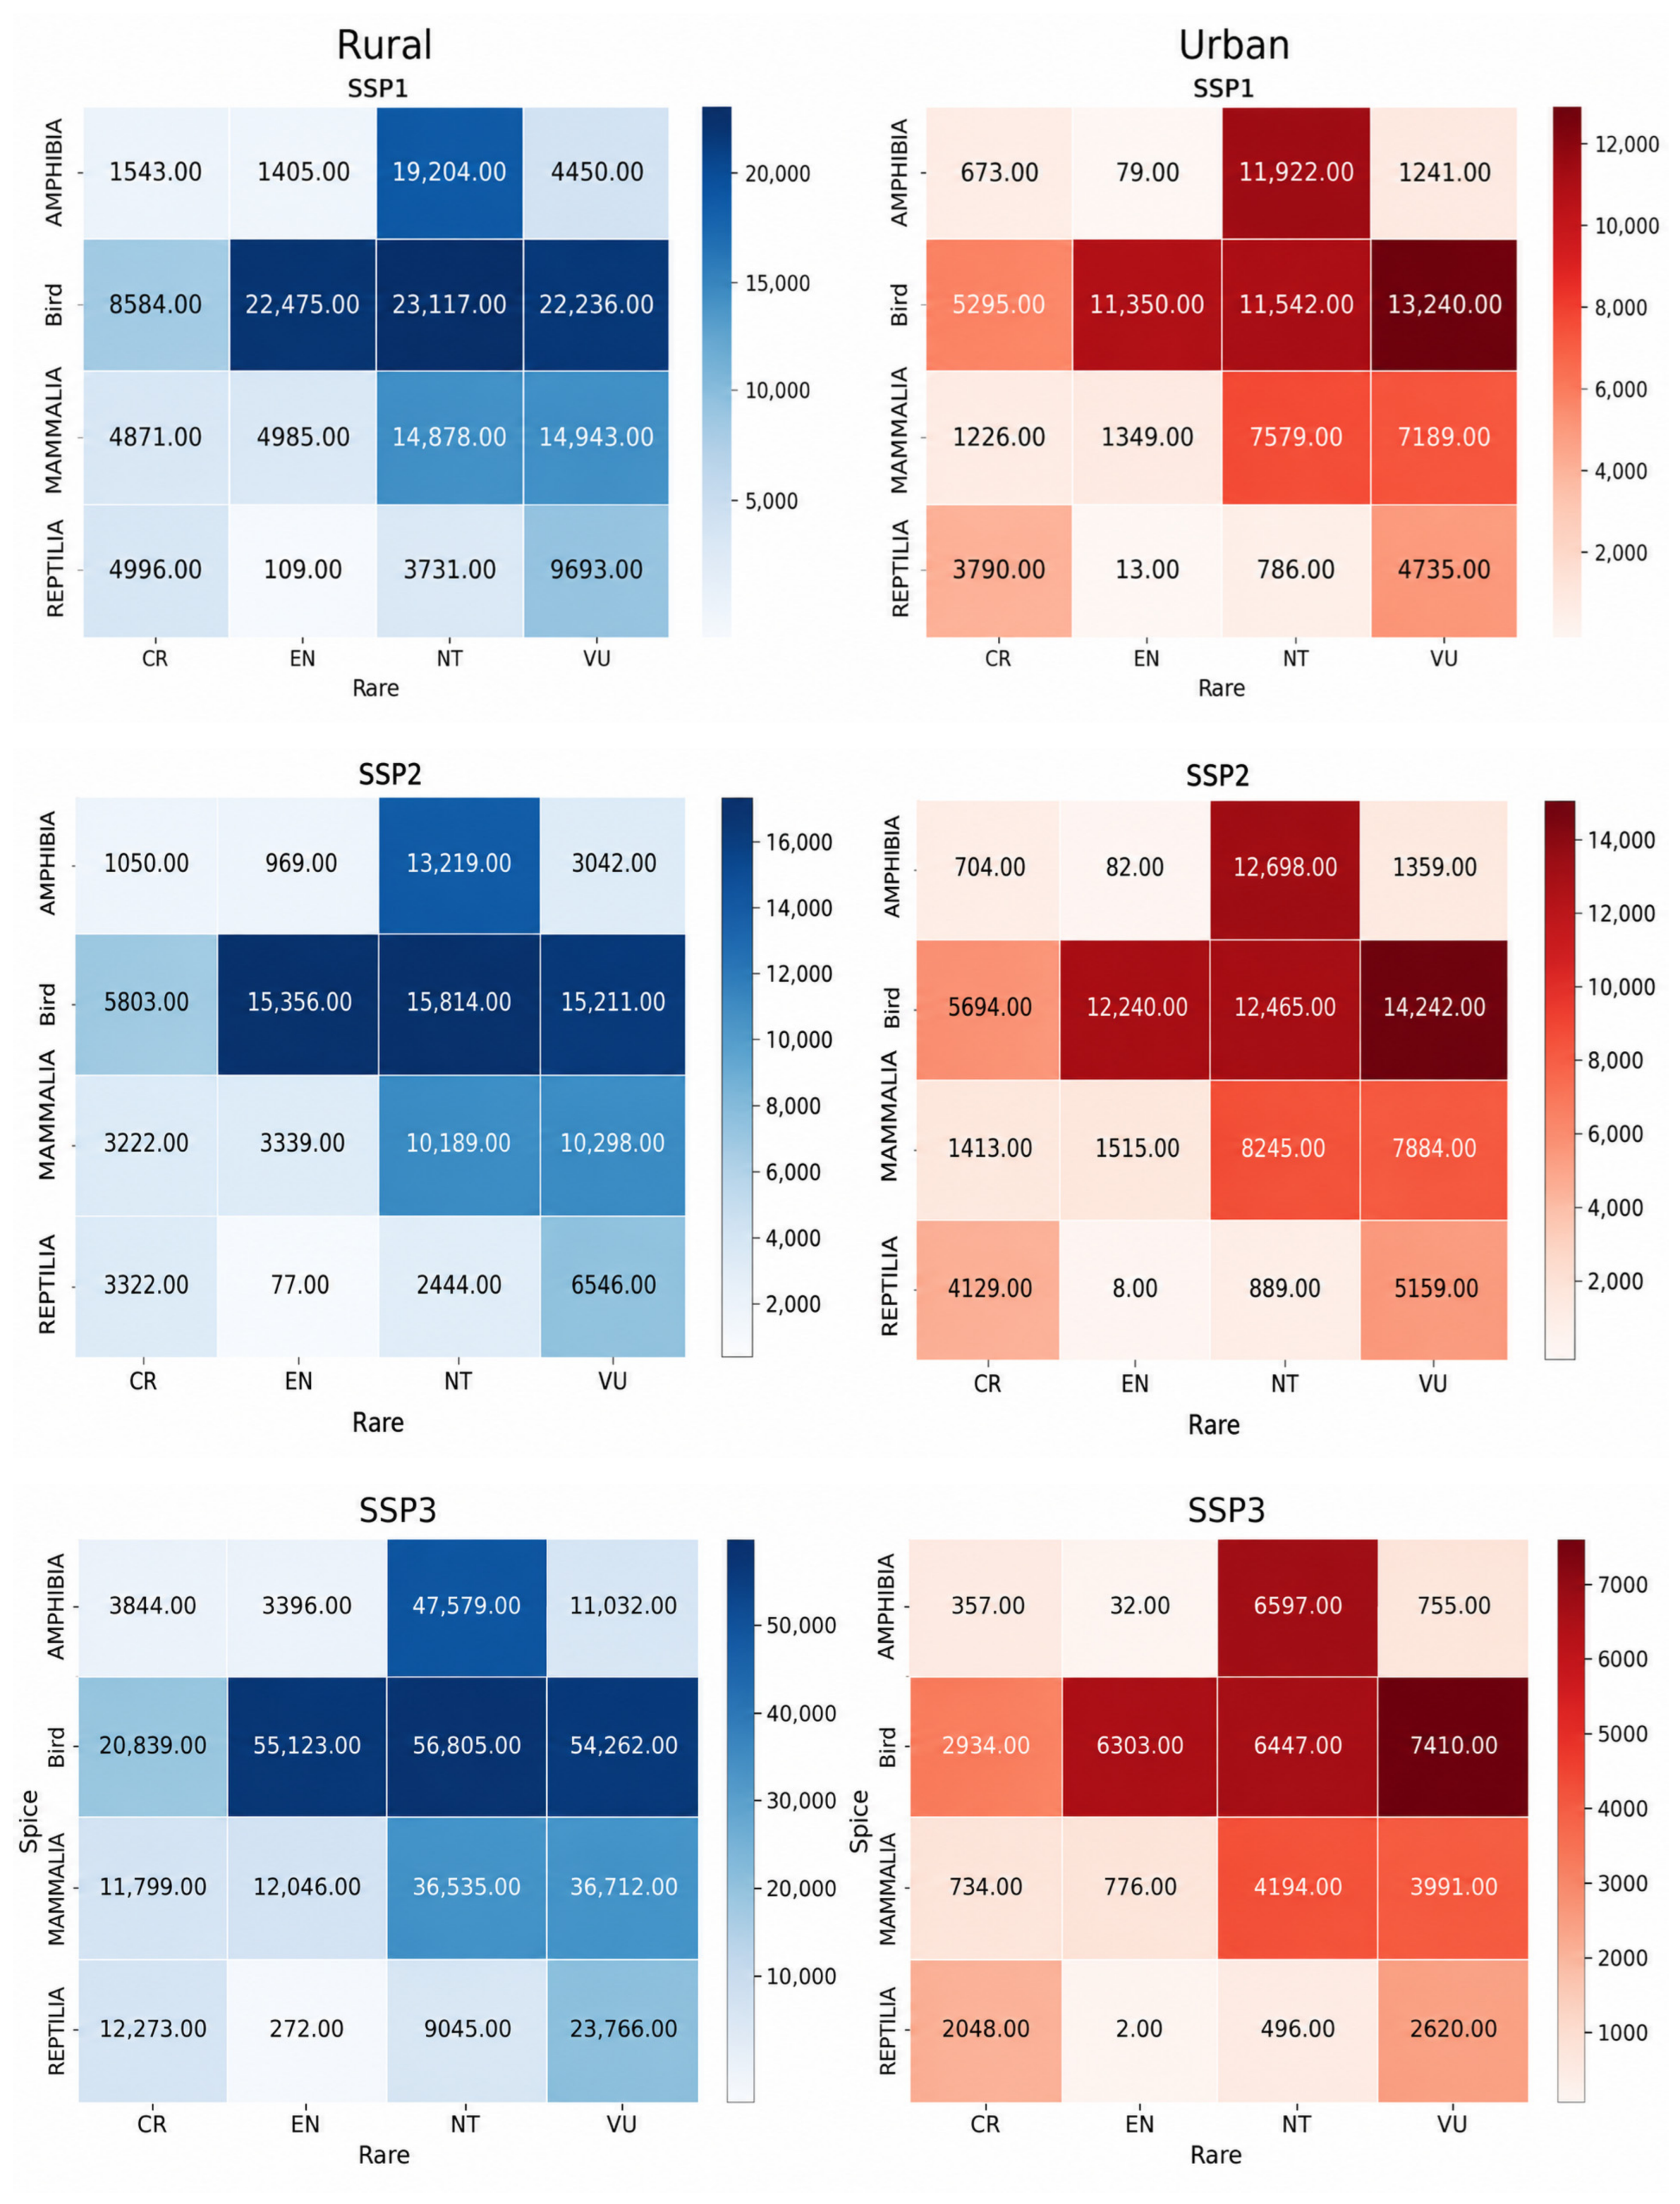
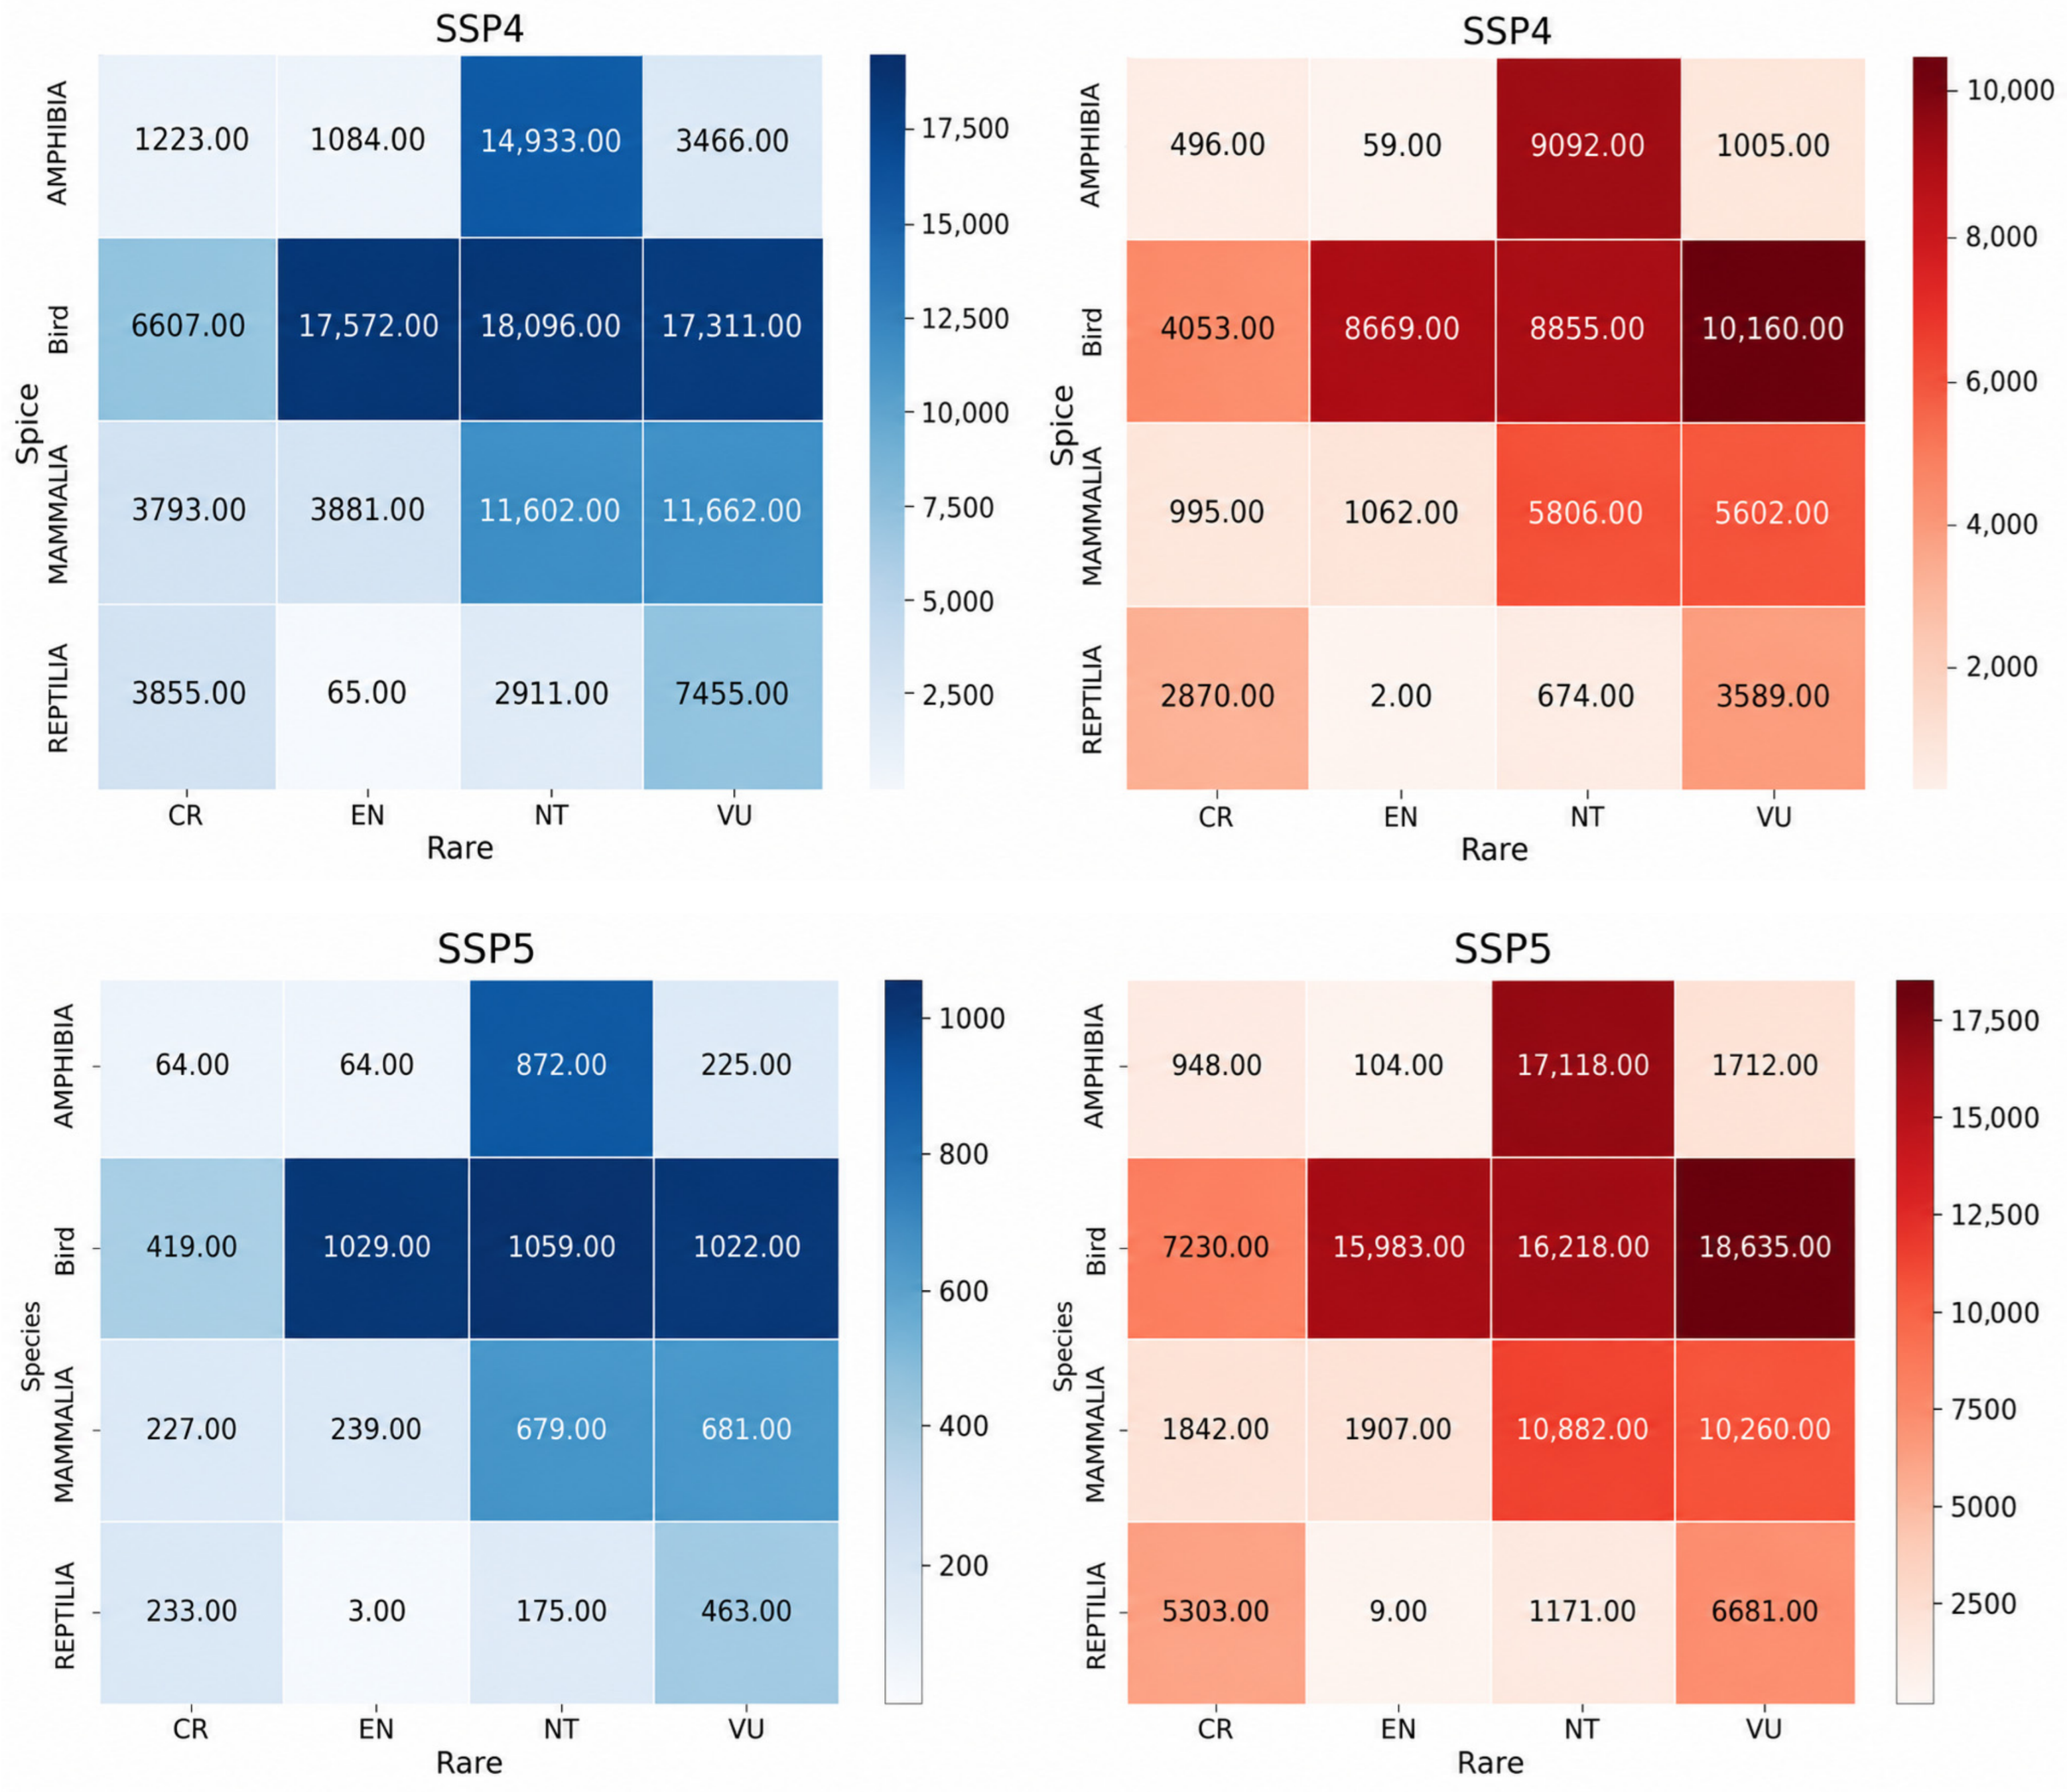
To identify the species most susceptible to the impacts of urban and rural built-up area expansion, we further compare the effects on species of different threat levels and types under five different SSP scenarios. As shown in Figure 13, in the SSP3 scenario, the total habitat area lost by species due to rural built-up area expansion is greater than those in other scenarios. NT bird species lose the largest habitat area (56,805 km2), followed by EN bird species (55,123 km2). In the SSP5 scenario, the total habitat area loss by species due to urban built-up area expansion is the largest compared to other scenarios. VU bird species lose the largest habitat area (18,635 km2), followed by NT amphibian species (17,118 km2).
Figure 13.
The area of habitat directly affected by urban and rural built-up area expansion for endangered species under different SSP scenarios from 2020 to 2070 (km2).
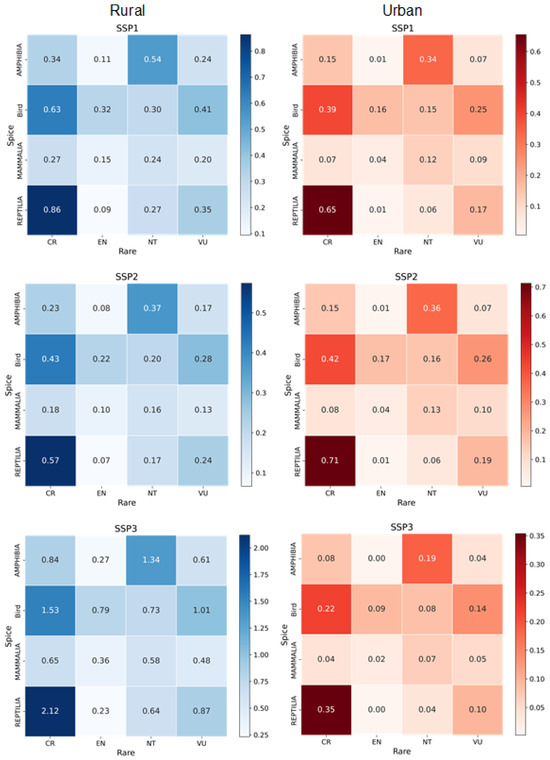
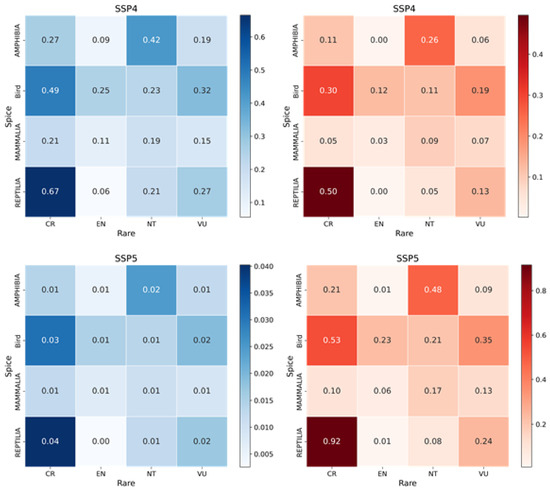
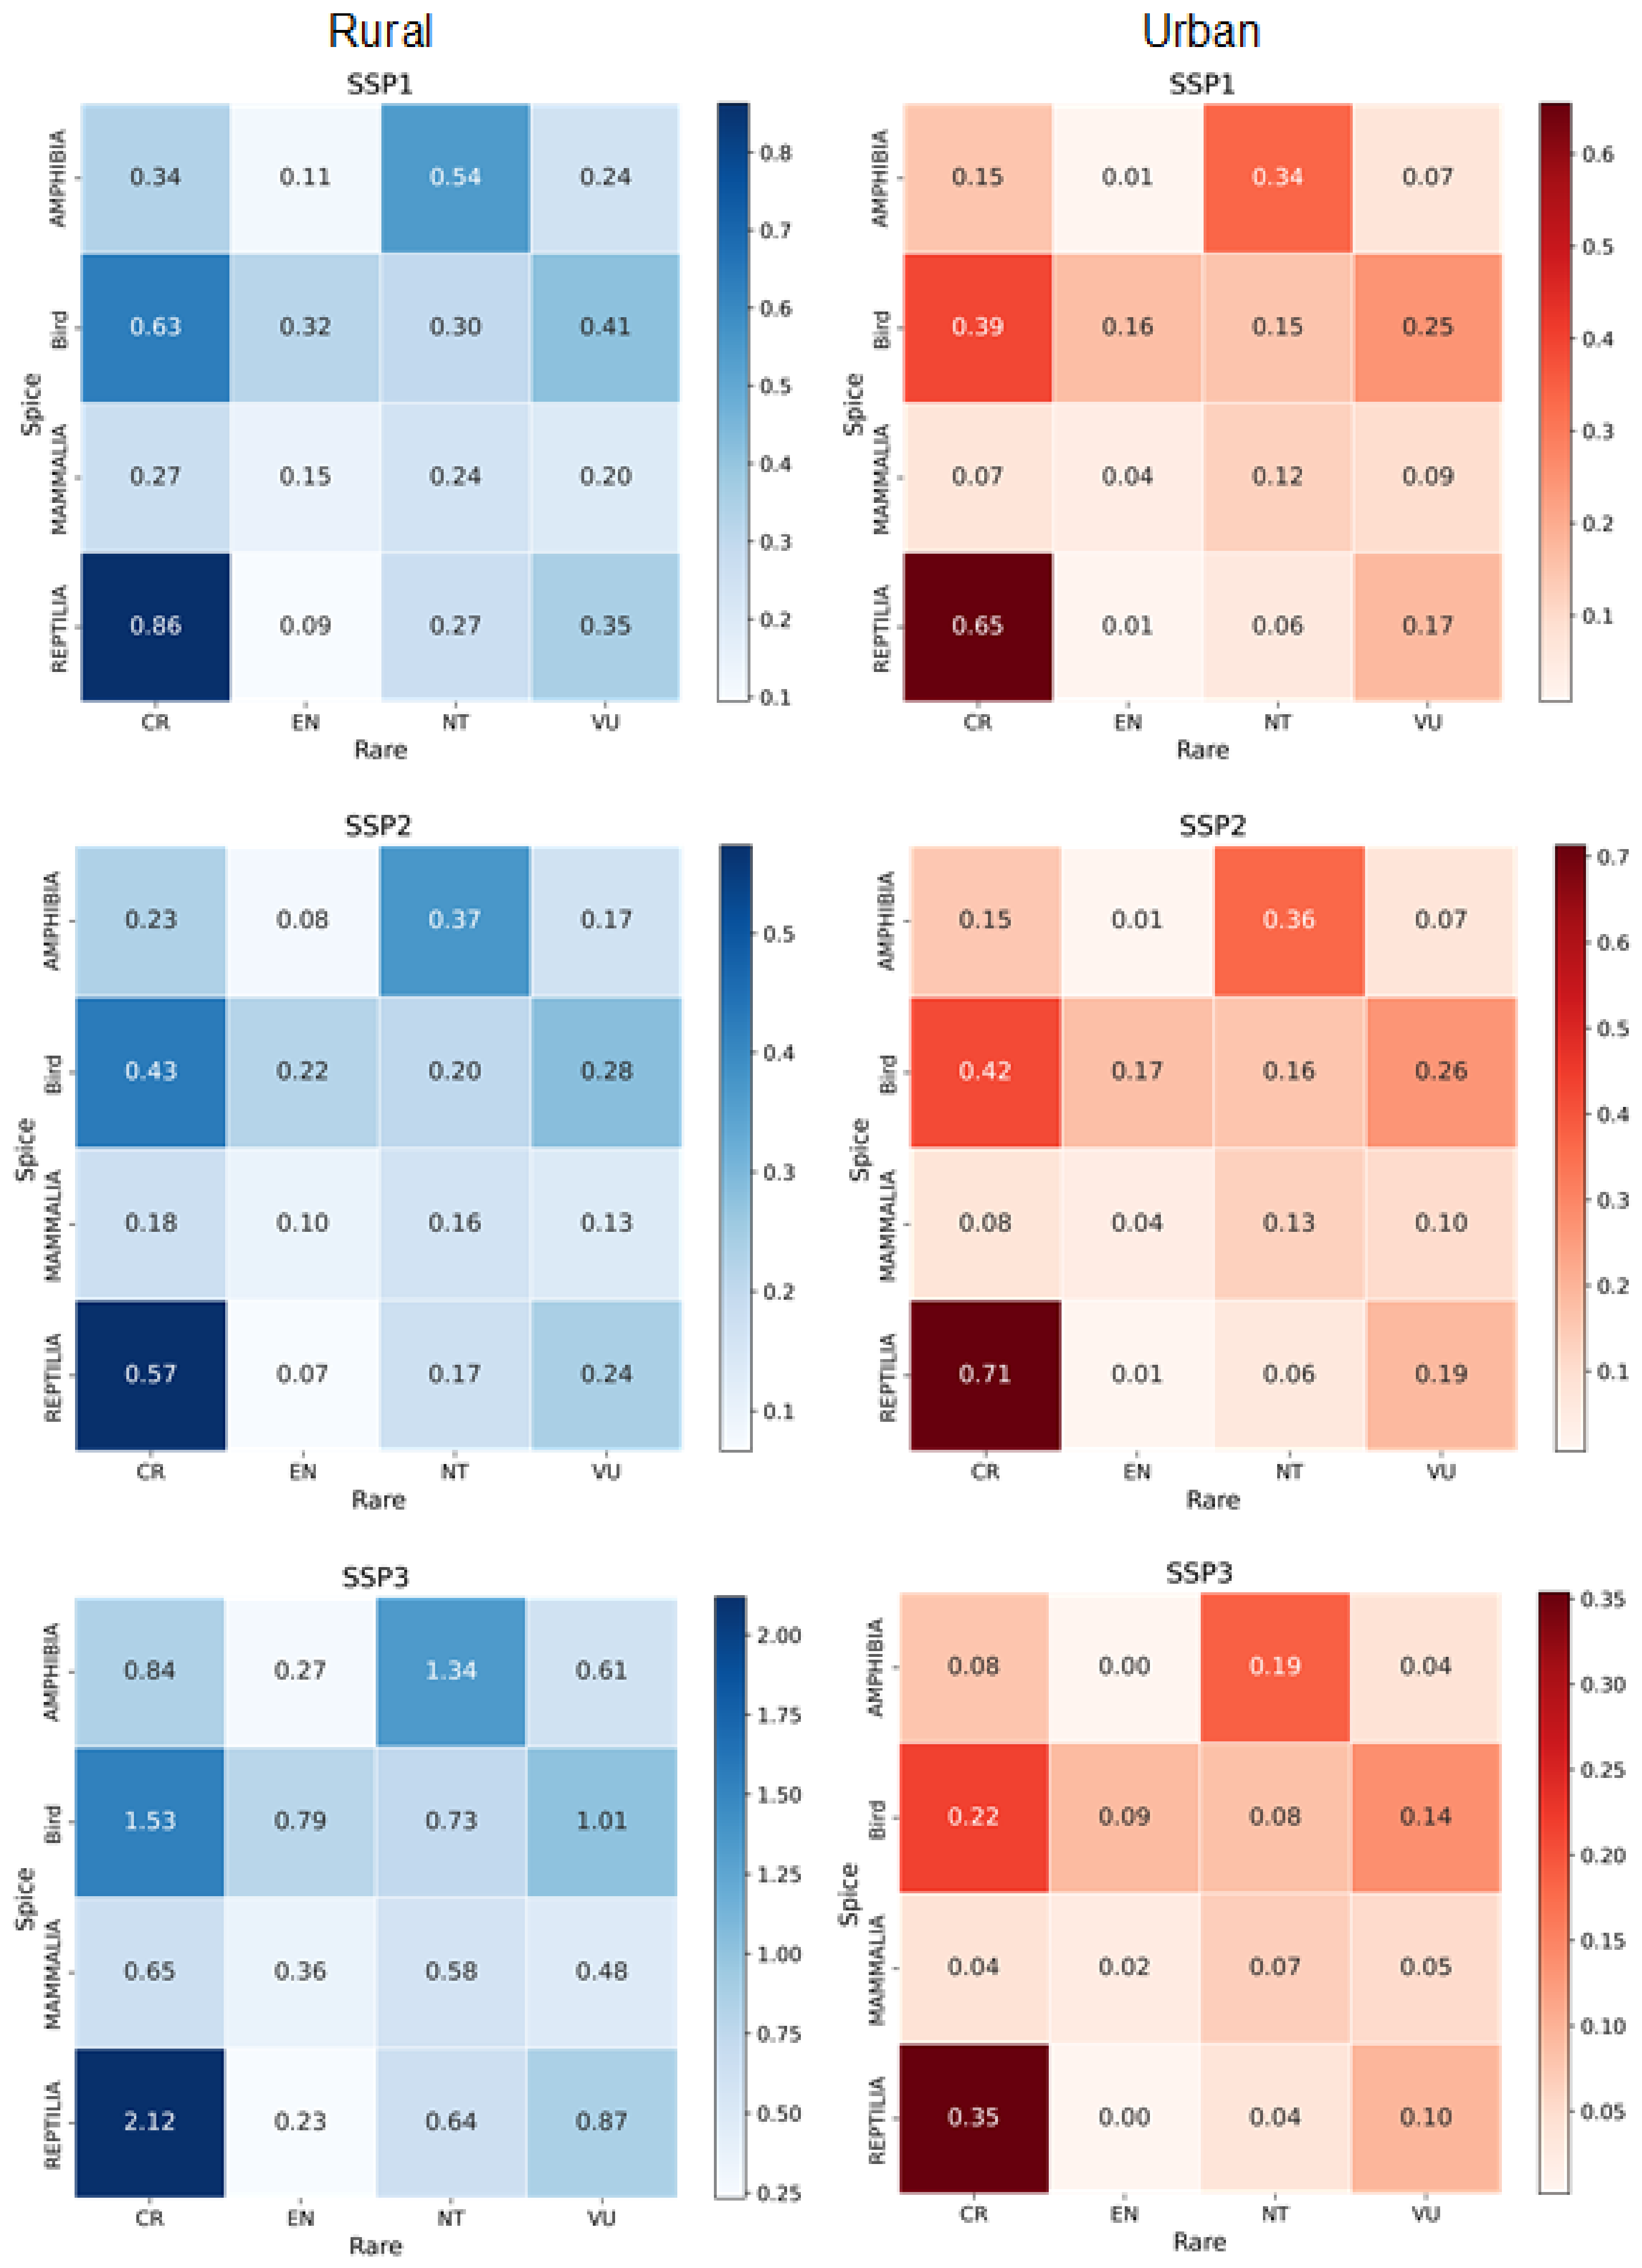
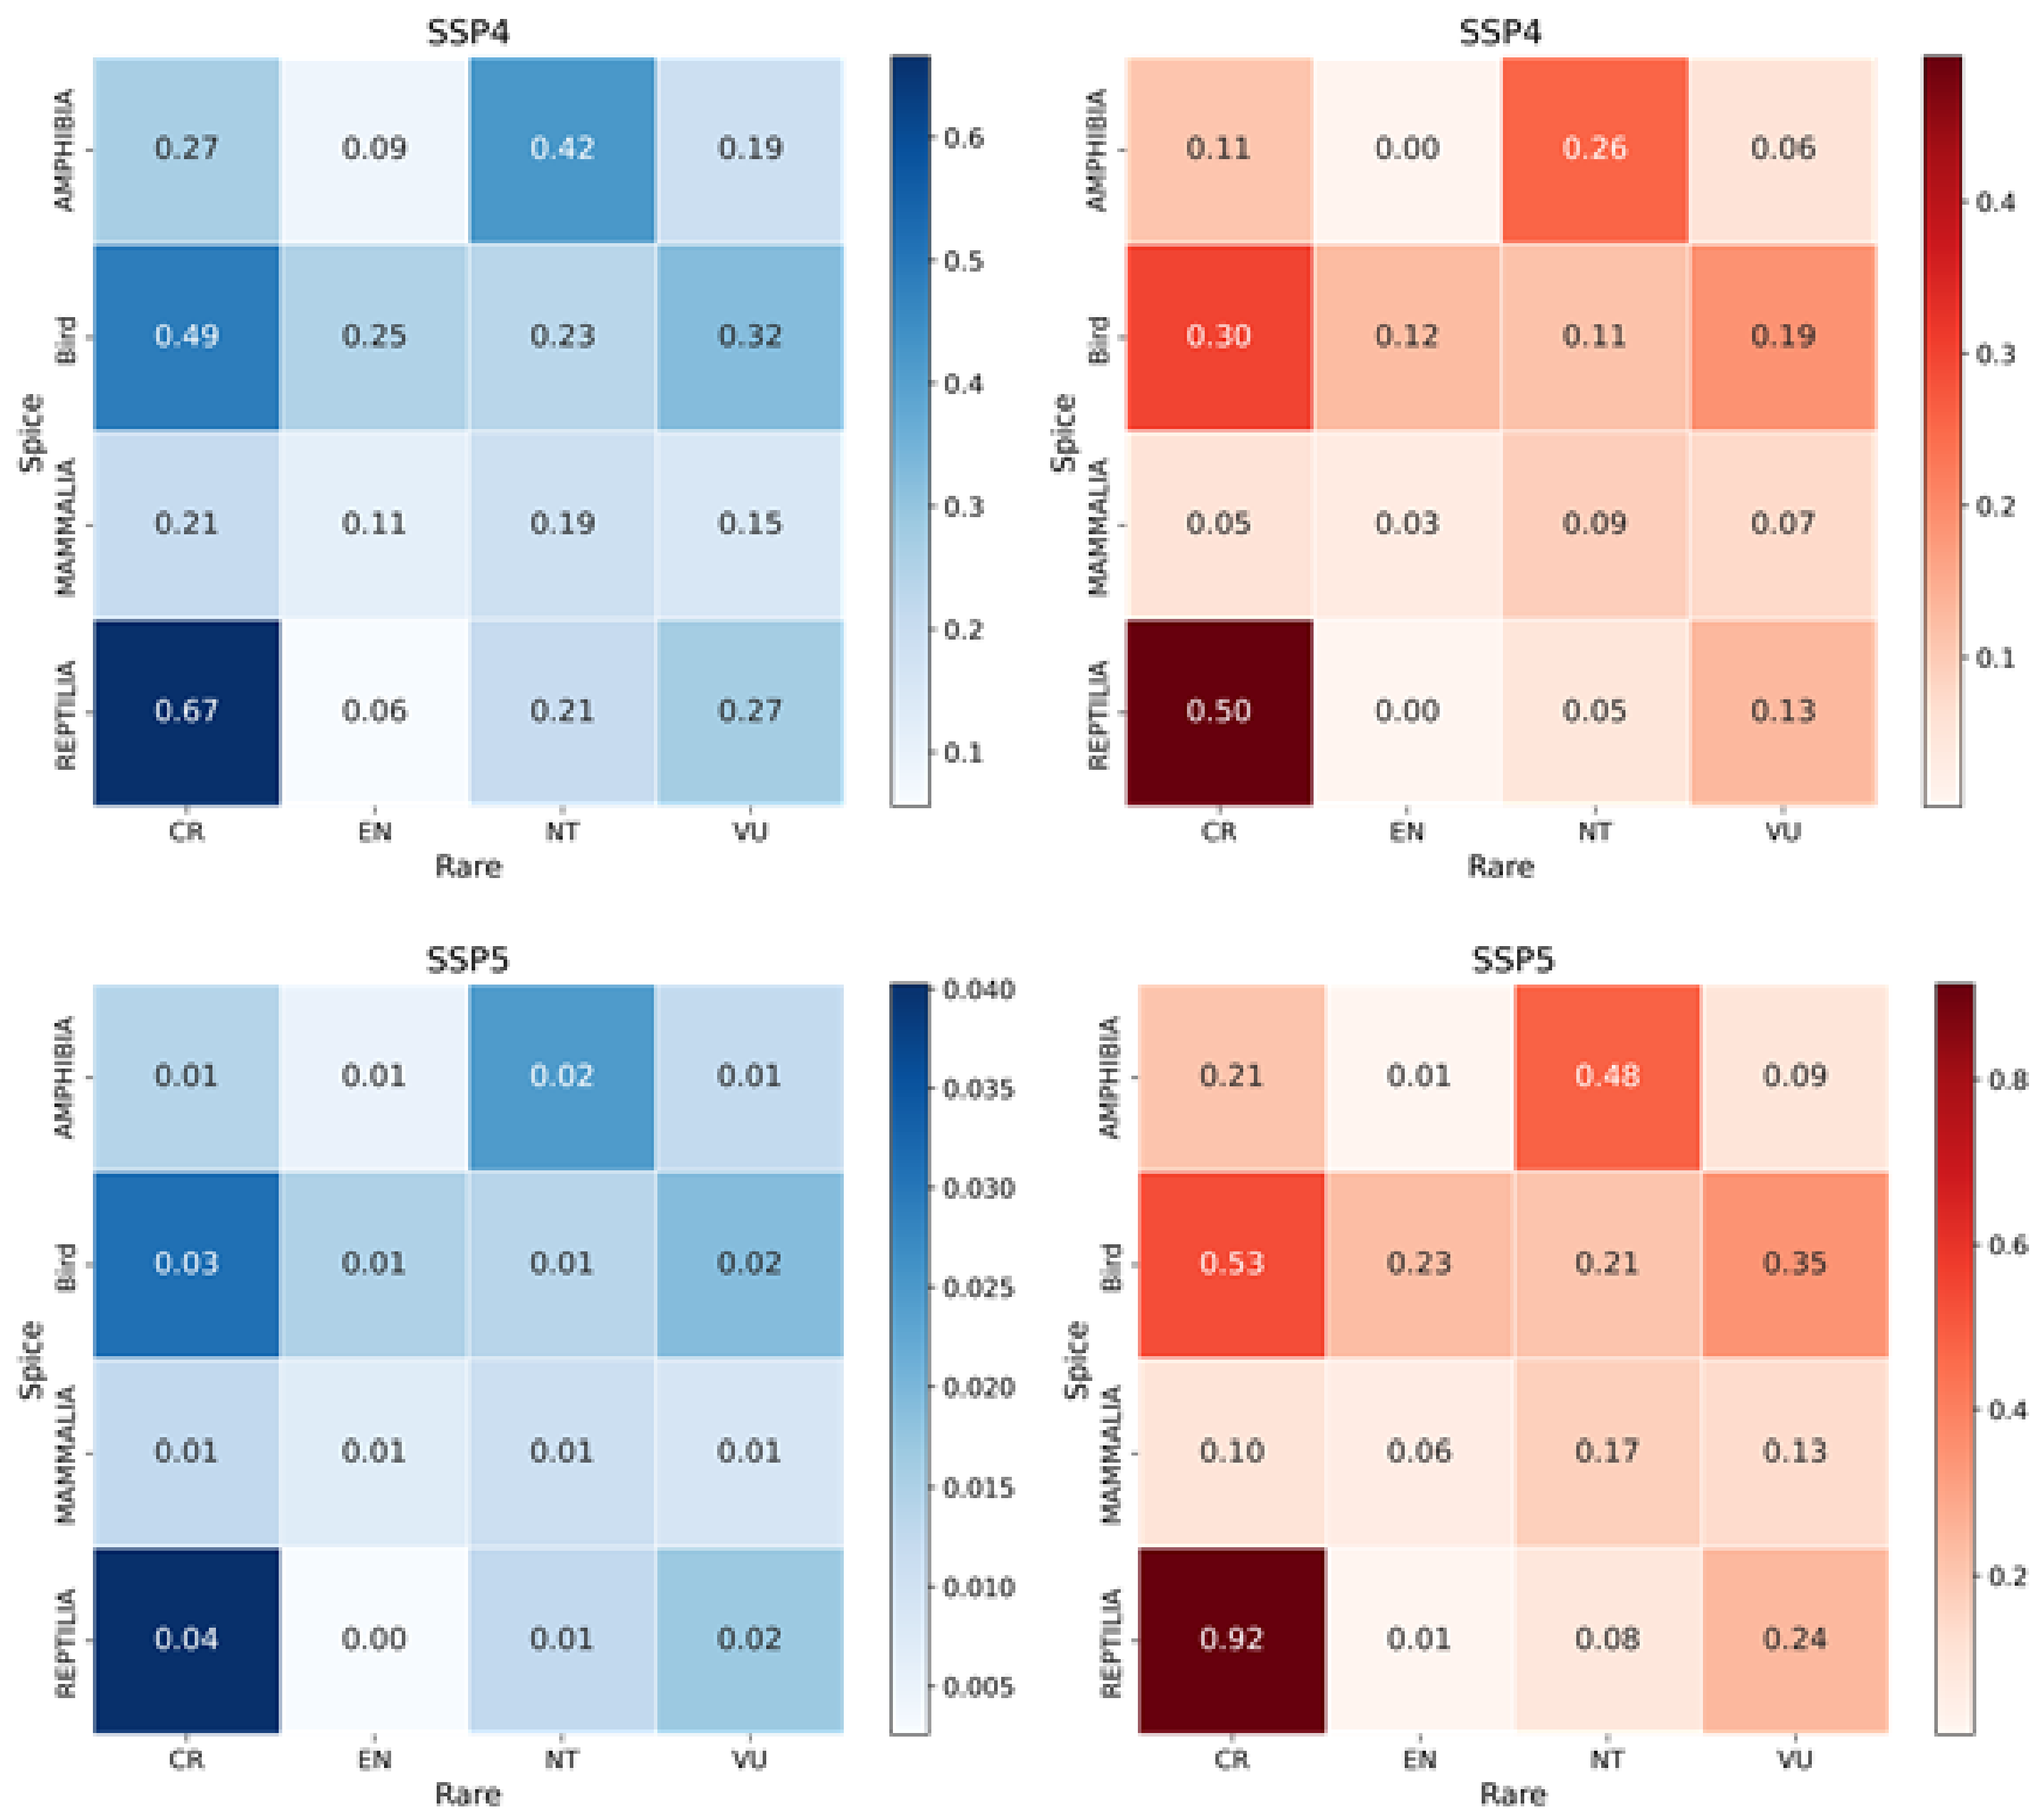
As shown in Figure 14, in the SSP3 scenario, species lose the highest proportion of their habitats due to rural built-up area expansion, with CR reptiles losing the greatest proportion (0.92%), followed by CR birds (0.53%). In the SSP5 scenario, species lose the largest proportion of their habitats due to urban built-up area expansion compared to other scenarios. Among them, CR reptiles and CR birds experience the highest habitat loss proportions (Figure 14).
Figure 14.
The ratio of habitat directly affected by urban and rural built-up land expansion for endangered species under different SSP scenarios from 2020 to 2070 (%).
5. Discussion
Under all five SSP scenarios, urban areas in China continue to expand through 2070, while rural built-up land increases under SSP1–SSP4 but contracts under SSP5. Three core findings emerge from our analysis: rural built-up expansion is projected to surpass urban expansion in total habitat loss; cropland displacement causes greater biodiversity loss than direct built-up encroachment; and birds and reptiles are the most vulnerable taxonomic groups.
Our first core finding—that rural built-up expansion poses a greater threat to biodiversity than urban expansion—directly challenges the urban-centric framing that has dominated land-use projection research. While numerous studies have quantified biodiversity impacts of future urban growth [21,28,29,30], rural built-up areas have been systematically overlooked. Under SSP3, rural built-up land expands by 106,100 km2—more than seven times the urban expansion in that scenario—and directly affects up to 524 species, exceeding the 501–513 species affected by urban expansion (Figure 11). This finding aligns with emerging global evidence. It has been demonstrated that rural development in China caused 1.21% habitat loss for endangered species from 1990 to 2020, compared to 0.57% for urban expansion [24]. At the global scale, rural settlement expansion has been found to cause 3.5 times greater biodiversity loss than urban expansion between 2000 and 2020 [23]. The convergence of historical evidence and our future projections confirms that rural built-up expansion is not a transient phenomenon but a persistent and underappreciated driver of biodiversity loss. The mechanism is fundamentally spatial: urban expansion concentrates around metropolitan agglomerations and primarily converts peri-urban cropland, whereas rural expansion disperses across the North China Plain, Northeast Plain, and ecologically sensitive areas in southwestern China, where it directly encroaches on forests, grasslands, and wetlands (Figure 5 and Figure 9). This dispersed pattern increases the probability of intersecting with biodiversity-rich areas—consistent with the observation that rural settlements are less constrained by zoning than urban developments [23].
Our second core finding—that indirect habitat loss from cropland displacement exceeds direct loss from built-up expansion—reveals a cascade effect that amplifies rural development’s ecological footprint. Under SSP3, rural expansion displaces 53,139 km2 of cropland (Table 3), with new cropland predominantly reclaimed from natural habitats of lower productivity but higher biodiversity value. Across all scenarios, the number of species indirectly affected by rural expansion (495–524) exceeds those directly affected (488–524; Figure 11). This pattern is corroborated by previous research showing that indirect biodiversity losses from cropland displacement in China were two to three times higher than direct losses from 1980 to 2020 [25]. It has been further demonstrated that habitat quality loss from compensated cropland was 4.02 times that from occupied cropland during 2000–2015 [26]. This mechanism operates with greater force for rural than urban expansion because 60.85–64.01% of rural expansion occurs on cropland, compared to 34.95–44.71% for urban expansion (Figure 8). Critically, this dynamic extends beyond China: in Southeast Asia, cropland expansion has been found to cause nearly 16 times more natural habitat loss than urban expansion, with indirect displacement impacts approximately 14 times greater than direct urban impacts [27]. This cross-regional consistency reveals a structural tension in land governance: farmland protection policies, while essential for food security, can inadvertently drive biodiversity loss when compensation occurs in ecologically sensitive areas.
Our third core finding identifies birds and reptiles as the groups most vulnerable to built-up expansion. Critically Endangered reptiles experience the highest proportional habitat loss—up to 0.92% under SSP3—while birds face compounded pressures from direct habitat loss and indirect agricultural displacement affecting breeding and migratory sites [64,65]. Vulnerable and Near Threatened species experience the largest absolute habitat area loss, whereas CR species suffer the highest proportional loss (Figure 13 and Figure 14). This divergence between absolute and proportional impact underscores a dual conservation imperative: protecting the larger habitats of VU and NT species to prevent escalation toward endangerment, while urgently safeguarding the residual habitats of CR species. Globally, it has been projected that under SSP3-like conditions, biodiversity indicators in tropical and temperate biomes—precisely the regions where China’s rural expansion pressure concentrates—show the most pronounced declines, corroborating our finding that SSP3 yields the highest species impacts [66].
These findings carry three actionable policy implications. First, rural built-up expansion must be integrated into environmental impact assessment and spatial planning. In China and many developing countries, land conversion regulations target urban and industrial projects, while dispersed rural construction proceeds with minimal ecological oversight [23]. Establishing “rural growth boundaries” that direct construction away from biodiversity-rich areas is an actionable priority. Second, cropland compensation policies require reform to eliminate the incentive to convert natural habitats. Alternatives include improving productivity on existing farmland, remediating degraded land for agriculture, and mandating biodiversity impact assessments for compensation projects. Such reforms align with the post-2020 Global Biodiversity Framework, particularly given projections that 4.6 million km2 of wilderness is susceptible to cropland and urban expansion by 2100 [22]. Third, institutional reform of rural land tenure can yield substantial conservation co-benefits. SSP5—which assumes Hukou reform decoupling urban migration from rural homestead entitlement, combined with rural land consolidation—produces a net reduction of 32,900 km2 in rural built-up land and the lowest species impacts across all scenarios. This serves as an upper-bound benchmark for biodiversity gains achievable through institutional change.
The mechanisms underlying our findings are generalizable beyond China. Rural built-up expansion occurring alongside rural depopulation has been documented in India, Indonesia, Vietnam, and Nigeria, driven by similar factors: retention of rural land rights by urban migrants, remittance-financed construction, and weak rural planning [23]. The cropland displacement mechanism operates wherever farmland protection policies are spatially decoupled from biodiversity considerations. This pattern has been confirmed in Southeast Asia, where cropland and settlement expansion together dominate natural habitat loss [27]. Our methodological framework—coupling system dynamics with cellular automata simulation—is transferable to any country with spatially explicit data on built-up areas, population, and land cover. We encourage replication studies across the Global South to test the generality of rural-driven biodiversity impacts and to inform context-specific policies balancing rural development with conservation.
6. Conclusions
Summary of findings: This study projected future urban and rural built-up expansion across China from 2020 to 2070 under five Shared Socioeconomic Pathways (SSPs) and quantified its direct and indirect impacts on terrestrial vertebrate biodiversity. Three main findings emerge. First, urban areas are projected to expand to 1.29–1.74 times their 2020 levels by 2070, with the most significant growth in eastern China. Rural built-up land increases under all scenarios except SSP5, with rural shrinkage concentrated in eastern and southwestern China. Second, habitat loss caused by rural built-up expansion is expected to surpass that caused by urban expansion. Moreover, habitat loss resulting from cropland displacement—driven by farmland protection policies—will exceed the direct loss from built-up area expansion. Third, birds and reptiles are identified as the most vulnerable groups to urban and rural built-up expansion, with Critically Endangered reptiles experiencing the highest proportional habitat loss (up to 0.92% under SSP3).
Theoretical contributions to global land-use knowledge: This study makes three substantive contributions to global land-use science. First, it challenges the pervasive urban-centric bias in land-use and biodiversity projection literature. While dozens of studies have quantified the biodiversity impacts of future urban expansion—from global ecoregions [28] to protected areas [9,29] and fine-resolution natural habitats [21,30]—none have systematically examined rural built-up expansion as an independent driver. By demonstrating that rural expansion can outpace urban expansion as a threat to biodiversity, our study forces a fundamental reorientation of future land-use scenario modeling. Second, this study extends the application of Zipf’s law from urban systems to coupled urban-rural systems. Previous applications of scaling laws have focused exclusively on city size distributions [51,67]; we show that scaling characteristics apply to both settlement types, providing a methodological innovation transferable to other countries undergoing similar rural transitions. Third, our study provides the first empirical quantification of rural expansion’s biodiversity impacts under SSP scenarios. The finding that cropland displacement—an indirect consequence of built-up expansion—causes greater habitat loss than direct encroachment reveals a previously overlooked mechanism of biodiversity loss. This mechanism is not unique to China; it operates in any country with farmland protection policies that incentivize the conversion of natural habitats elsewhere. Our methodological framework is therefore transferable to other rapidly developing countries—including India, Indonesia, Nigeria, and Brazil—where rural built-up expansion and cropland displacement are likely to intensify in coming decades.
Limitations: This study has four limitations. First, our historical built-up land data are constrained to 2009–2020 due to the absence of comprehensive, province-level surveys prior to 2009 in China. This restricts our ability to capture long-term trends and may affect model calibration for periods outside this window. Second, our System Dynamics model assumes structural stationarity—that historical relationships between GDP, population, and per capita built-up area persist into the future. It does not endogenously simulate abrupt policy regime shifts (e.g., radical reform of the Hukou system) or technological discontinuities that could decouple land consumption from economic growth. Third, our analysis is restricted to terrestrial vertebrates (amphibians, birds, mammals, reptiles) listed in the IUCN Red List. Impacts on plants, invertebrates, and unassessed species are not quantified, likely resulting in an underestimation of total biodiversity loss. Fourth, the Area of Habitat (AOH) analysis assumes static species ranges and does not account for species dispersal or adaptive migration, which may lead to an overestimation of direct habitat loss.
Future directions: Future research should address these limitations in four directions. First, extending the historical time series using remote sensing products (e.g., Landsat-derived built-up layers dating back to 1985) could validate our findings over longer timescales and reduce calibration uncertainty. Second, coupling our agent-based model with species distribution models would enable more explicit biodiversity impact assessments that account for habitat fragmentation, edge effects, and species-specific dispersal capacities. Third, comparative studies across other rapidly urbanizing countries—particularly India, Indonesia, and Vietnam—would test the generalizability of our findings beyond China’s unique institutional context (e.g., Hukou system, collective rural land ownership). Fourth, future research should incorporate three-dimensional urban growth modeling to capture vertical densification, which may partially offset horizontal expansion pressures, particularly in highly urbanized scenarios like SSP5 [68]. Furthermore, integrating NPP-based assessments could help quantify the indirect carbon cycle impacts of built-up land expansion, as global urban expansion has been shown to offset approximately 30% of climate-driven increases in terrestrial net primary productivity [69]. Such advancements would provide a more complete picture of built-up expansion’s biodiversity consequences and inform more targeted conservation strategies.
Author Contributions
Conceptualization, Roujing Li, Hao Geng, Ya Zhou and Liqiang Zhang; methodology, Roujing Li and Hao Geng; validation, Roujing Li, Hao Geng, Ya Zhou and Liqiang Zhang; formal analysis, Roujing Li and Hao Geng; investigation, Roujing Li and Hao Geng; resources, Ya Zhou and Liqiang Zhang; data curation, Roujing Li and Hao Geng; writing—original draft preparation, Roujing Li and Hao Geng; writing—review and editing, Ya Zhou and Liqiang Zhang; visualization, Roujing Li and Hao Geng; supervision, Ya Zhou and Liqiang Zhang; project admin-istration, Ya Zhou and Liqiang Zhang; funding acquisition, Ya Zhou and Liqiang Zhang All authors have read and agreed to the published version of the manuscript.
Funding
The work was supported by the National Natural Science Foundation of China under Grant 42293272.
Institutional Review Board Statement
Not applicable.
Informed Consent Statement
Not applicable.
Data Availability Statement
The data can be derived from the following resources available in the public domain: the Second and Third National Land Survey Data, available at https://data.casearth.cn/ [32]; the China’s Mul-ti-Period Land Use Land Cover Remote Sensing Monitoring Dataset (CNLUCC), available at https://www.resdc.cn/DOI/DOI.aspx?DOIID=54 [33]; the SSP Database, available at https://tntcat.iiasa.ac.at/sspdb [40]; the Chinese Soil Texture Spatial Distribution Dataset, available at https://www.resdc.cn/data.aspx?DATAID=260 [41]; and the MODIS NPP dataset (MOD17A3), available at https://www.usgs.gov/ [43]. The socioeconomic and rural development data used in this study were obtained from the statistical yearbooks cited in the article, including the China City Statistical Yearbook [34], China Business Management Statistical Yearbook (2009–2020) [35], China Rural Cooperative Economic Statistical Yearbook (2009–2020) [36], and China Rural Policy and Reform Statistical Yearbook (2009–2020) [37]. The species distribution and conservation status data were obtained from the IUCN Red List of Threatened Species. The derived simulation out-puts and processed data generated during the current study are available from the corresponding author upon reasonable request.
Conflicts of Interest
The authors declare no conflict of interest.
References
- Montgomery, M.R. The urban transformation of the developing world. Science 2008, 319, 761–764. [Google Scholar] [CrossRef] [Scilit] [PubMed]
- United Nations, Department of Economic and Social Affairs. World Urbanization Prospects: The 2018 Revision; United Nations: New York, NY, USA, 2019. [Google Scholar]
- Chen, G.; Li, X.; Liu, X.; Chen, Y.; Liang, X.; Leng, J.; Xu, X.; Liao, W.; Qiu, Y.; Wu, Q.; et al. Global projections of future urban land expansion under shared socioeconomic pathways. Nat. Commun. 2020, 11, 537. [Google Scholar] [CrossRef] [Scilit] [PubMed]
- Huang, K.; Li, X.; Liu, X.; Seto, K.C. Projecting global urban land expansion and heat island intensification through 2050. Environ. Res. Lett. 2019, 14, 114037. [Google Scholar] [CrossRef] [Scilit]
- Seto, K.C.; Fragkias, M.; Güneralp, B.; Reilly, M.K. A meta-analysis of global urban land expansion. PLoS ONE 2011, 6, e23777. [Google Scholar] [CrossRef] [Scilit] [PubMed]
- van Vliet, J. Direct and indirect loss of natural area from urban expansion. Nat. Sustain. 2019, 2, 755–763. [Google Scholar] [CrossRef] [Scilit]
- Curtis, P.G.; Slay, C.M.; Harris, N.L.; Tyukavina, A.; Hansen, M.C. Classifying drivers of global forest loss. Science 2018, 361, 1108–1111. [Google Scholar] [CrossRef] [Scilit] [PubMed]
- Geist, H.J.; Lambin, E.F. Proximate causes and underlying driving forces of tropical deforestation. BioScience 2002, 52, 143–150. [Google Scholar] [CrossRef] [Scilit]
- Seto, K.C.; Güneralp, B.; Hutyra, L.R. Global forecasts of urban expansion to 2030 and direct impacts on biodiversity and carbon pools. Proc. Natl. Acad. Sci. USA 2012, 109, 16083–16088. [Google Scholar] [CrossRef] [Scilit] [PubMed]
- Cumming, G.S.; Buerkert, A.; Hoffmann, E.M.; Schlecht, E.; von Cramon-Taubadel, S.; Tscharntke, T. Implications of agricultural transitions and urbanization for ecosystem services. Nature 2014, 515, 50–57. [Google Scholar] [CrossRef] [Scilit] [PubMed]
- Zhang, X.; Brandt, M.; Tong, X.; Ciais, P.; Yue, Y.; Xiao, X.; Zhang, W.; Wang, K.; Fensholt, R. A large but transient carbon sink from urbanization and rural depopulation in China. Nat. Sustain. 2022, 5, 321–328. [Google Scholar] [CrossRef] [Scilit]
- McDonald, R.I.; Forman, R.T.T.; Kareiva, P.; Neugarten, R.; Salzer, D.; Fisher, J. Urban effects, distance, and protected areas in an urbanizing world. Landsc. Urban Plan. 2009, 93, 63–75. [Google Scholar] [CrossRef] [Scilit]
- Ke, X.; van Vliet, J.; Zhou, T.; Verburg, P.H.; Zheng, W.; Liu, X. Direct and indirect loss of natural habitat due to built-up area expansion: A model-based analysis for the city of Wuhan, China. Land Use Policy 2018, 74, 231–239. [Google Scholar] [CrossRef] [Scilit]
- Xu, W.; Xiao, Y.; Zhang, J.; Yang, W.; Zhang, L.; Hull, V.; Wang, Z.; Zheng, H.; Liu, J.; Polasky, S. Strengthening protected areas for biodiversity and ecosystem services in China. Proc. Natl. Acad. Sci. USA 2017, 114, 1601–1606. [Google Scholar] [CrossRef] [Scilit] [PubMed]
- Myers, N.; Mittermeier, R.A.; Mittermeier, C.G.; Da Fonseca, G.A.B.; Kent, J. Biodiversity hotspots for conservation priorities. Nature 2000, 403, 853–858. [Google Scholar] [CrossRef] [Scilit] [PubMed]
- Ministry of Ecology and Environment; Chinese Academy of Sciences. China Biodiversity Red List: Higher Plants Volume. 2013. Available online: http://www.mee.gov.cn/gkml/hbb/bgg/201309/W020130912562095920726.pdf (accessed on 15 November 2025).
- Ministry of Ecology and Environment; Chinese Academy of Sciences. China Biodiversity Red List: Vertebrates Volume. 2015. Available online: https://www.mee.gov.cn/gkml/hbb/bgg/201505/W020150525496758954804.pdf (accessed on 15 November 2025).
- Lu, Y.; Yang, Y.; Sun, B.; Yuan, J.; Yu, M.; Stenseth, N.C.; Bullock, J.M.; Obersteiner, M. Spatial variation in biodiversity loss across China under multiple environmental stressors. Sci. Adv. 2020, 6, eabd0952. [Google Scholar] [CrossRef] [Scilit] [PubMed]
- Wahnschafft, R.; Wei, F. Urban China: Toward Efficient, Inclusive, and Sustainable Urbanization. Nat. Resour. Forum 2015, 39, 151–152. [Google Scholar] [CrossRef] [Scilit]
- Wang, S.; Bai, X.; Zhang, X.; Reis, S.; Chen, D.; Xu, J.; Gu, B. Urbanization can benefit agricultural production with large-scale farming in China. Nat. Food 2021, 2, 183–191. [Google Scholar] [CrossRef] [Scilit] [PubMed]
- Li, G.; Fang, C.; Li, Y.; Wang, Z.; Sun, S.; He, S.; Qi, W.; Bao, C.; Ma, H.; Fan, Y.; et al. Global impacts of future urban expansion on terrestrial vertebrate diversity. Nat. Commun. 2022, 13, 1628. [Google Scholar] [CrossRef] [Scilit] [PubMed]
- Cao, Y.; Tseng, T.-H.; Wang, F.; Jacobson, A.; Yu, L.; Zhao, J.; Carver, S.; Locke, H.; Zhao, Z.; Yang, R. Potential wilderness loss could undermine the post-2020 global biodiversity framework. Biol. Conserv. 2022, 275, 109753. [Google Scholar] [CrossRef] [Scilit]
- Liu, Z.; Fang, C.; Huang, S.; Li, G.; Bao, C.; Sun, S.; Guan, L.; Liu, M. Global rural settlement expansion rivals its urban counterpart in biodiversity impact. Commun. Earth Environ. 2025, 6, 63. [Google Scholar]
- Geng, H.; van Vliet, J.; Albert, J.; Zhang, L.; Qu, Y.; Huang, K. Rural development outpaces urban expansion in threatening biodiversity in China. Resour. Conserv. Recycl. 2025, 215, 108176. [Google Scholar] [CrossRef] [Scilit]
- Li, F.; Wu, S.; Liu, H.; Yan, D. Biodiversity loss through cropland displacement for urban expansion in China. Sci. Total Environ. 2024, 907, 167988. [Google Scholar] [CrossRef] [Scilit] [PubMed]
- Zheng, W.; Li, S.; Ke, X.; Li, X.; Zhang, B. The impacts of cropland balance policy on habitat quality in China: A multiscale administrative perspective. J. Environ. Manag. 2022, 323, 116182. [Google Scholar] [CrossRef] [Scilit]
- Zhang, X.; Wan, W.; Estoque, R.C. Impacts of urban and cropland expansions on natural habitats in Southeast Asia. Nat. Commun. 2025, 16, 8479. [Google Scholar] [CrossRef] [Scilit] [PubMed]
- McDonald, R.I.; Güneralp, B.; Huang, C.-W.; Seto, K.C.; You, M. Conservation priorities to protect vertebrate endemics from global urban expansion. Biol. Conserv. 2018, 224, 290–299. [Google Scholar] [CrossRef] [Scilit]
- Güneralp, B.; Seto, K.C. Futures of global urban expansion: Uncertainties and implications for biodiversity conservation. Environ. Res. Lett. 2013, 8, 014025. [Google Scholar] [CrossRef] [Scilit]
- Simkin, R.D.; Seto, K.C.; McDonald, R.I.; Jetz, W. Biodiversity impacts and conservation implications of urban land expansion projected to 2050. Proc. Natl. Acad. Sci. USA 2022, 119, e2117297119. [Google Scholar] [CrossRef] [Scilit] [PubMed]
- Cheng, G.; Pan, C.; Zhou, Y. Urban-rural disparities in the ecological impact of built-up land expansion: A comprehensive assessment from China. Appl. Geogr. 2025, 179, 103618. [Google Scholar] [CrossRef] [Scilit]
- National Land Science Data Center. Second and Third National Land Survey Data. 2023. Available online: https://data.casearth.cn/https://www.casearth.cn/ (accessed on 15 November 2025).
- Xu, X.; Liu, J.; Zhang, S.; Li, R.; Yan, C.; Wu, S. China’s Multi-Period Land Use Land Cover Remote Sensing Monitoring Dataset (CNLUCC); Resource and Environmental Science Data Registration and Publication System, Chinese Academy of Sciences: Beijing, China, 2018; Available online: https://www.resdc.cn/DOI/DOI.aspx?DOIID=54 (accessed on 15 November 2025).
- National Bureau of Statistics. China City Statistical Yearbook; China Statistics Press: Beijing, China, 2023.
- National Bureau of Statistics. China Business Management Statistical Yearbook (2009–2020); China Statistics Press: Beijing, China, 2021.
- National Bureau of Statistics. China Rural Cooperative Economic Statistical Yearbook (2009–2020); China Statistics Press: Beijing, China, 2021.
- National Bureau of Statistics. China Rural Policy and Reform Statistical Yearbook (2009–2020); China Statistics Press: Beijing, China, 2021.
- Shumway, R.H.; Stoffer, D.S. Time Series Analysis and Its Applications: With R Examples, 4th ed.; Springer: Cham, Switzerland, 2017. [Google Scholar]
- Rural Development Institute, Chinese Academy of Social Sciences. Rural Green Book: Analysis and Forecast of China’s Rural Economic Situation (2018–2019); Social Sciences Academic Press: Beijing, China, 2019. [Google Scholar]
- IIASA. SSP Database. Available online: https://tntcat.iiasa.ac.at/sspdb (accessed on 15 November 2025).
- Xu, X. Chinese Soil Texture Spatial Distribution Dataset; Resource and Environment Science Data Center, Chinese Academy of Sciences: Beijing, China, 2006; Available online: https://www.resdc.cn/data.aspx?DATAID=260 (accessed on 15 November 2025).
- Xu, X. Chinese Meteorological Element Annual Spatial Interpolation Dataset; Resource and Environmental Science Data Registration and Publishing System: Beijing, China, 2022. [Google Scholar] [CrossRef]
- United States Geological Survey. MODIS NPP Dataset (MOD17A3). Available online: https://www.usgs.gov/ (accessed on 15 November 2025).
- Xu, Q.L.; Yang, K.; Wang, G.L.; Yang, Y.L. Agent-based modeling and simulations of land-use and land-cover change according to ant colony optimization: A case study of the Erhai Lake Basin, China. Nat. Hazards 2015, 75, 95–118. [Google Scholar]
- Kriegler, E.; O’Neill, B.C.; Hallegatte, S.; Kram, T.; Lempert, R.J.; Moss, R.H.; Wilbanks, T. A new scenario framework for climate change research: The concept of shared climate policy assumptions. Clim. Change 2014, 122, 401–414. [Google Scholar] [CrossRef] [Scilit]
- Riahi, K.; van Vuuren, D.P.; Kriegler, E.; Edmonds, J.; O’Neill, B.C.; Fujimori, S.; Bauer, N.; Calvin, K.; Dellink, R.; Fricko, O.; et al. The Shared Socioeconomic Pathways and their energy, land use, and greenhouse gas emissions implications: An overview. Glob. Environ. Change 2017, 42, 153–168. [Google Scholar] [CrossRef] [Scilit]
- Kriegler, E.; O’Neill, B.C.; Hallegatte, S.; Kram, T.; Lempert, R.J.; Moss, R.H.; Wilbanks, T. The need for and use of socio-economic scenarios for climate change analysis: A new approach based on shared socio-economic pathways. Glob. Environ. Change 2012, 22, 807–822. [Google Scholar] [CrossRef] [Scilit]
- van Vuuren, D.P.; Edmonds, J.; Kainuma, M.; Riahi, K.; Thomson, A.; Hibbard, K.; Hurtt, G.C.; Kram, T.; Krey, V.; Lamarque, J.-F.; et al. A new scenario framework for Climate Change Research: Scenario matrix architecture. Clim. Change 2014, 122, 373–386. [Google Scholar] [CrossRef] [Scilit]
- Yan, J.; Chen, Y.; Li, X.; Liu, X. The evolution and institutional analysis of China’s rural homestead system. J. Geogr. Sci. 2021, 31, 565–584. [Google Scholar]
- Liu, D.; Zheng, X.; Wang, H. Land-use Simulation and Decision-Support system (LandSDS): Seamlessly integrating system dynamics, agent-based model, and cellular automata. Ecol. Model. 2020, 417, 108924. [Google Scholar] [CrossRef] [Scilit]
- Fragkias, M.; Seto, K.C. Evolving rank-size distributions of intra-metropolitan urban clusters in South China. Comput. Environ. Urban Syst. 2009, 33, 189–199. [Google Scholar] [CrossRef] [Scilit]
- Jiang, B.; Yin, J.; Liu, Q. Zipf’s law for all the natural cities around the world. Int. J. Geogr. Inf. Sci. 2015, 29, 498–522. [Google Scholar] [CrossRef] [Scilit]
- Tilman, D.; Clark, M.; Williams, D.R.; Kimmel, K.; Polasky, S.; Packer, C. Future threats to biodiversity and pathways to their prevention. Nature 2017, 546, 73–81. [Google Scholar] [CrossRef] [Scilit] [PubMed]
- Brooks, T.M.; Pimm, S.L.; Akçakaya, H.R.; Buchanan, G.M.; Butchart, S.H.M.; Foden, W.; Hilton-Taylor, C.; Hoffmann, M.; Jenkins, C.N.; Joppa, L. Measuring terrestrial area of habitat (AOH) and its utility for the IUCN Red List. Trends Ecol. Evol. 2019, 34, 977–986. [Google Scholar] [CrossRef] [Scilit] [PubMed]
- Cai, X.; Zhang, X.; Wang, D. Land availability for biofuel production. Environ. Sci. Technol. 2011, 45, 334–339. [Google Scholar] [CrossRef] [Scilit] [PubMed]
- Fritz, S.; See, L.; van der Velde, M.; Nalepa, R.A.; Perger, C.; Schill, C.; McCallum, I.; Schepaschenko, D.; Kraxner, F.; Cai, X.; et al. Downgrading recent estimates of land available for biofuel production. Environ. Sci. Technol. 2013, 47, 1688–1694. [Google Scholar] [PubMed]
- Lambin, E.F.; Meyfroidt, P. Global land use change, economic globalization, and the looming land scarcity. Proc. Natl. Acad. Sci. USA 2011, 108, 3465–3472. [Google Scholar] [CrossRef] [Scilit] [PubMed]
- Havlík, P.; Schneider, U.A.; Schmid, E.; Böttcher, H.; Fritz, S.; Skalský, R.; Aoki, K.; De Cara, S.; Kindermann, G.; Kraxner, F.; et al. Global land-use implications of first and second generation biofuel targets. Energy Policy 2011, 39, 5690–5702. [Google Scholar] [CrossRef] [Scilit]
- Bruinsma, J. World Agriculture: Towards 2015/2030: An FAO Study; Routledge: London, UK, 2017. [Google Scholar]
- Fischer, G.; van Velthuizen, H.T.; Nachtergaele, F.O. Global Agro-Ecological Zones Assessment: Methodology and Results; IIASA: Laxenburg, Austria, 2000. [Google Scholar]
- Yang, Y.; Nan, Y.; Liu, Z.; Zhang, D.; Sun, Y. Direct and indirect losses of natural habitat caused by future urban expansion in the transnational area of Changbai Mountain. Sustain. Cities Soc. 2020, 63, 102487. [Google Scholar] [CrossRef] [Scilit]
- Eitelberg, D.A.; van Vliet, J.; Verburg, P.H. A review of global potentially available cropland estimates and their consequences for model-based assessments. Glob. Change Biol. 2015, 21, 1236–1248. [Google Scholar]
- van Vliet, J.; Eitelberg, D.A.; Verburg, P.H. A global analysis of land take in cropland areas and production displacement from urbanization. Glob. Environ. Change 2017, 43, 107–115. [Google Scholar] [CrossRef] [Scilit]
- Reynolds, S.J.; Ibáñez-Álamo, J.D.; Sumasgutner, P.; Mainwaring, M.C. Urbanisation and nest building in birds: A review of threats and opportunities. J. Ornithol. 2019, 160, 841–860. [Google Scholar] [CrossRef] [Scilit]
- Soifer, L.G.; Donovan, S.K.; Brentjens, E.T.; Bratt, A.R. Piecing together cities to support bird diversity: Development and forest edge density affect bird richness in urban environments. Landsc. Urban Plan. 2021, 213, 104122. [Google Scholar] [CrossRef] [Scilit]
- Reader, M.O.; Santos, M.J. Global responses in biodiversity and ecosystem services to future land use change. In Proceedings of the World Biodiversity Forum 2026, Davos, Switzerland, 21–26 June 2026. WBF2026-880. [Google Scholar]
- Gabaix, X. Zipf’s law for cities: An explanation. Q. J. Econ. 1999, 114, 739–767. [Google Scholar] [CrossRef] [Scilit]
- Wang, K.; He, T.; Xiao, W.; Yang, R. Projections of future spatiotemporal urban 3D expansion in China under shared socioeconomic pathways. Landsc. Urban Plan. 2024, 247, 105043. [Google Scholar] [CrossRef] [Scilit]
- Liu, X.; Pei, F.; Wen, Y.; Li, X.; Wang, S.; Wu, C.; Cai, Y.; Wu, J.; Chen, J.; Feng, K.; et al. Global urban expansion offsets climate-driven increases in terrestrial net primary productivity. Nat. Commun. 2019, 10, 5558. [Google Scholar] [CrossRef] [Scilit] [PubMed]

Disclaimer/Publisher’s Note: The statements, opinions and data contained in all publications are solely those of the individual author(s) and contributor(s) and not of MDPI and/or the editor(s). MDPI and/or the editor(s) disclaim responsibility for any injury to people or property resulting from any ideas, methods, instructions or products referred to in the content. |
© 2026 by the authors. Published by MDPI on behalf of the International Society for Photogrammetry and Remote Sensing. Licensee MDPI, Basel, Switzerland. This article is an open access article distributed under the terms and conditions of the Creative Commons Attribution (CC BY) license.