


Abstract
Urban heat island effects increasingly challenge pedestrian mobility by intensifying thermal stress and reducing the attractiveness of walking during hot periods. However, most pedestrian routing systems still prioritize distance or travel time, while environmental conditions such as heat exposure and shade are rarely incorporated into operational route generation. Existing comfort-aware approaches often rely on static maps, simulated microclimatic indicators, or descriptive greenery measures, limiting their direct integration into user-configurable pedestrian navigation. This study develops a thermal comfort-aware pedestrian routing framework that integrates heterogenic data sources including observed land surface temperature, pedestrian-perspective tree-canopy coverage, and network distance into a unified multi-criteria pathfinding model. The workflow proceeds in four steps: first, airborne thermal imagery is processed to derive a high-resolution land surface temperature layer; second, Google Street View images are sampled at street-segment locations and segmented using SegFormer to extract visible tree-canopy coverage; third, both environmental indicators are aggregated to a cleaned pedestrian network; and fourth, normalized distance, temperature, and canopy attributes are combined through a user-adjustable edge-cost formulation and solved using Dijkstra’s algorithm. The framework is implemented as an operational web-based routing tool for the historic center of Clermont-Ferrand, France. The routable graph includes 551 nodes and 796 edges, with 600 segments carrying GSV-derived canopy information and 623 segments carrying airborne-derived LST values. Across the network, we observed LST ranges from 19.5 °C to 39.1 °C, while canopy coverage ranged from 0 to 70.6%. For a representative origin–destination pair, the coolest route reduces average LST by nearly 5 °C and almost triples canopy coverage compared with the shortest path, although at the cost of a 72% longer distance. These results demonstrate that the framework can generate interpretable comfort–efficiency trade-offs and support user-comfort pathfinding as an operational approach for heat-resilient pedestrian navigation.
1. Introduction
Walking is perhaps the most intimate way humans experience the city, not as a static map but as a sensation of light, shade, and heat. It nurtures both individual well-being and urban vitality, yet this simple act is increasingly challenged by rising temperatures and intensifying urban heat island (UHI) effects, which expose pedestrians to growing thermal stress and discourage outdoor movement. Thermal comfort, however, is not confined to a single moment; it emerges as a continuous “thermal experience,” in which the body perceives and remembers a succession of microclimatic conditions along a journey, shaping future behavior and the perception of urban space [1]. In this context, the quality of pedestrian environments becomes a central concern for designing livable and resilient cities, especially as climate change amplifies the frequency and severity of heatwaves. Shading from urban vegetation plays a critical role in mitigating heat exposure [2], yet capturing these fine-scale environmental variations remains difficult with conventional top-down data sources. Recent advances in street-level imagery and computer vision now offer the means to observe cities from the pedestrian perspective, revealing how thermal conditions interact with walking patterns and underscoring the importance of integrating environmental comfort into urban analysis and navigation [3,4,5].
In the context of climate-responsive urban design, there is a growing need to rethink how cities are navigated and experienced at the human scale. Designing future cities is not only about efficiency but about creating environments that are livable and resilient under increasing climatic pressures. This study is motivated by the need to better understand and quantify the spatial distribution of shading and ambient heat, which are the two principal drivers of pedestrian thermal comfort, and to translate them into actionable information for urban analysis and navigation. The objective is to develop a routing framework capable of capturing these environmental qualities from a pedestrian perspective and recommending paths that enhance thermal comfort, encouraging walking even under adverse climatic conditions.
However, the increasing availability of environmental data does not automatically translate into improved pedestrian decision-making. Most contemporary navigation systems remain primarily focused on minimizing travel distance or travel time, whereas environmental conditions are generally treated as secondary considerations or ignored altogether. As a result, pedestrians may be guided through routes characterized by high thermal exposure despite the existence of nearby alternatives offering greater shade and lower heat stress. Recent studies have shown that heat exposure can significantly influence pedestrian route choice behavior and accessibility, particularly during periods of elevated thermal stress [6,7]. This limitation becomes increasingly relevant as cities experience more frequent and intense heatwaves, creating a need for navigation approaches that explicitly account for environmental quality alongside geometric efficiency.
Despite substantial advances in thermal remote sensing, street-level environmental analysis, and comfort-aware mobility research, important methodological gaps remain. Satellite-derived vegetation indices such as the NDVI provide city-wide canopy estimates but miss pedestrian-level visibility and the lateral shading that condition walking comfort [8]. Street-level imagery has been widely leveraged for greenery quantification, for instance, through the Green View Index [5,9], but most studies stop at descriptive mapping rather than embedding these indicators into routing logic. Conversely, thermal comfort routing studies typically rely on modeled microclimatic indices (e.g., UTCI, MRT) rather than directly sensed temperature fields, which may limit the representation of observed thermal conditions at the street scale [10].
The gap addressed in this study is the lack of an implemented pedestrian routing tool that operationally integrates measured high-resolution thermal observations, pedestrian-perspective canopy information derived from street-level image analysis, and network geometry within a single, user-configurable cost formulation. While previous studies have advanced heat-aware routing, greenery mapping, and thermal comfort assessment, these components are often treated separately or remain dependent on modeled comfort indicators, aggregated heat layers, or predefined environmental variables. This study responds to that gap by combining airborne-derived LST, GSV-derived canopy coverage, and pedestrian network distance in a unified multi-criteria routing tool capable of generating alternative routes under different comfort–efficiency preferences.
To address these limitations, this study proposes a multi-criteria pedestrian pathfinding framework that integrates three complementary data sources into a unified edge-cost formulation. First, airborne thermal imagery provides spatially distributed land surface temperature observations across the study area, capturing the actual UHI signature rather than a modeled approximation. Second, Google Street View (GSV) imagery is sampled at street-segment coordinates and processed with SegFormer, a transformer-based semantic segmentation model, to extract tree-canopy coverage as a pedestrian-perspective shading proxy [11,12,13]. Third, the pedestrian network provides the geometric backbone along which distance is measured. These three signals are combined into an edge-weighting scheme that allows shortest-path algorithms to identify routes that balance distance, shade, and ambient heat.
The main methodological contributions of this work are three-fold
- A reproducible pipeline for extracting pedestrian-perspective tree-canopy coverage from Google Street View imagery using a transformer-based semantic segmentation model, applied across the historic center of Clermont-Ferrand, France.
- A multi-criteria edge-cost formulation integrates airborne-derived land surface temperature, GSV-derived canopy coverage, and pedestrian network distance into a single routable graph.
- An implemented pedestrian pathfinding tool operationalizes this formulation, enabling the generation and comparison of distance-oriented, heat-oriented, canopy-oriented, and balanced routes within the same urban network.
2. Related Work
2.1. Pedestrian Thermal Comfort and Route Choice
Across Europe, the transition toward sustainable urban development has placed strong emphasis on active mobility, with walkability emerging as a central pillar of low-carbon transport strategies and livable city design [14]. Walking supports public health, social interaction, and low-carbon mobility, yet its attractiveness is increasingly challenged by rising temperatures and the growing intensity of the UHI. Recent studies have demonstrated that pedestrian thermal comfort is not determined by a single location, but rather by a sequence of environmental exposures experienced along a journey. This cumulative “thermal experience” influences both immediate route choices and longer-term mobility behavior [1].
A growing body of evidence suggests that pedestrians actively respond to thermal conditions when navigating urban environments. Under hot weather conditions, individuals tend to reduce outdoor activity, modify travel schedules, or seek alternative routes that provide greater thermal relief [15]. Experimental studies further demonstrate that pedestrians exhibit a measurable preference for shaded paths, even when these routes require additional travel distance, highlighting the importance of environmental quality in route selection [7]. More recently, Basu et al. [6] showed that heat exposure can significantly influence pedestrian route choice behavior and accessibility, emphasizing the need for navigation approaches that explicitly account for thermal conditions rather than focus exclusively on distance or travel time.
These findings indicate that thermal exposure constitutes an important determinant of pedestrian mobility and provides a strong justification for integrating environmental conditions into route planning frameworks.
2.2. Pedestrian-Scale Environmental Observation
The ability to incorporate thermal comfort into pedestrian navigation depends on the availability of environmental information at scales relevant to human perception. Thermal remote sensing has long been employed to characterize urban heat patterns and identify areas of elevated thermal stress. While air temperature remains the primary determinant of physiological thermal comfort, LST observations provide valuable information on the spatial distribution of urban heat accumulation and have become a widely used indicator for investigating surface urban heat islands and thermal heterogeneity within cities [16,17].
LST is therefore used in this study as an observed spatial indicator of surface heat accumulation and intra-urban thermal contrast [16,17]. Several studies have reported quantitative relationships between remotely sensed LST and near-surface air temperature in urban contexts [18,19]. However, this relationship is not fixed and varies with land cover, season, time of day, vegetation, and local urban morphology [20]. Consequently, airborne-derived LST is used here as a relative observed temperature layer to describe the spatial distribution of surface heat accumulation along the pedestrian network. Moreover, recent work using street-view photographs has shown that perceived thermal comfort during heatwaves can be related to remotely sensed surface temperature, sky-view conditions, and visible green/blue infrastructure [21]. This supports the use of LST, when combined with pedestrian-perspective environmental indicators such as GSV-derived canopy coverage, to characterize relative thermal favorability along urban walking routes.
At the pedestrian scale, vegetation plays a critical role in moderating thermal exposure through shading and radiative cooling effects [2]. Consequently, urban canopy coverage has emerged as an important indicator of environmental quality, shading potential, and pedestrian thermal comfort [22]. Traditional approaches based on satellite imagery and vegetation indices such as the NDVI provide city-wide estimates of vegetation abundance, but they often fail to represent how greenery is perceived from the street level. Recent studies have therefore increasingly relied on street-level imagery to capture environmental conditions from the pedestrian perspective. Early initiatives such as Treepedia demonstrated the potential of combining Google Street View (GSV) imagery with computer vision techniques to quantify visible urban greenery through the Green View Index (GVI) [23]. Subsequent research refined these approaches and highlighted the importance of image sampling strategies and viewing perspectives for reliable environmental assessment [24].
Beyond greenery quantification, street-level imagery is increasingly being used to evaluate environmental conditions directly related to pedestrian comfort. Li et al. [22] demonstrated that GSV-derived tree-canopy information can be used to estimate the shading contribution of street trees and assess their role in reducing heat exposure. Urban et al. [21] further showed that thermal perception during heatwaves can be inferred from street-view imagery, establishing links between perceived thermal comfort, urban morphology, vegetation, and visible environmental characteristics. More recently, the “Seeing the Heat” project in Milan [25] combined Google Street View imagery, computer vision, and microclimatic modeling to investigate how vegetation, shadows, sky visibility, and urban form influence thermal comfort across the city. These studies illustrate a transition from using street-level imagery solely for visual characterization toward employing it as a source of environmental information relevant to thermal comfort assessment.
Recent advances in deep learning have further enhanced the extraction of environmental features from street imagery. Semantic segmentation methods enable the automated identification of vegetation, buildings, roads, and other urban elements at large scales. Transformer-based architectures, such as SegFormer [26], have demonstrated state-of-the-art performance by simultaneously capturing local details and global contextual information, making them particularly suitable for extracting pedestrian-scale environmental indicators from complex urban scenes. These developments establish street-level image analysis as a powerful approach for characterizing urban environments from the perspective of pedestrians.
2.3. Environmental Information in Pedestrian Routing
The integration of environmental information into pedestrian navigation systems has emerged as an active research area in recent years. Early studies explored the incorporation of subjective environmental qualities into route planning. Quercia et al. [27], for example, demonstrated that routes optimized for beauty, quietness, and perceived attractiveness can substantially improve the walking experience while requiring only minor deviations from the shortest path. Such work established the broader principle that route quality can extend beyond geometric efficiency.
More recent studies have focused specifically on thermal comfort and environmental exposure. Bolívar-Anillo et al. [28] addressed pedestrian routing under increased urban temperatures in Barranquilla, Colombia, by identifying pedestrian routes with improved thermal comfort conditions. This study is highly relevant because it explicitly connects thermal comfort with route selection; however, the framework relies on thermal comfort indicators derived from climatic and urban–environmental variables, whereas the present study combines directly observed thermal information and street-level canopy measurements. Similarly, Al Shammas et al. [29] proposed a GIS-based routing framework that incorporates walkability and comfort indicators, including solar exposure and greenery-related variables, into route selection. Neset et al. [30] developed one of the earliest heat-aware navigation tools by integrating urban heat information into pedestrian routing systems. Other studies have adopted more physically detailed approaches. Ma et al. [31] generated thermally optimized pedestrian routes using ENVI-met V5.5.1 simulations and PET calculations, demonstrating substantial reductions in pedestrian thermal discomfort compared with conventional shortest-path solutions. Similarly, Wen et al. [32] introduced a dynamic shade-oriented routing framework based on solar-radiation modeling and time-dependent shadow patterns, while Buo et al. [10] developed a real-time routing system that minimizes thermal exposure using mean radiant temperature (MRT) estimates derived from urban microclimatic conditions. In parallel, personalized multi-criteria navigation approaches have demonstrated the importance of accommodating heterogeneous user preferences when combining environmental and mobility-related criteria within route selection processes [33].
To facilitate a comparison between the routing approaches most closely related to the present study, Table 1 summarizes their environmental information sources, routing objectives, and methodological characteristics.
Table 1.
Comparison of environmental data sources and routing implementations in recent comfort-aware pedestrian routing studies.
Table 1 reveals several common characteristics of existing comfort-aware routing approaches. First, environmental conditions are predominantly derived from simulations, comfort models, or aggregated indicators, including PET fields, MRT estimates, solar-radiation models, and urban heat maps. Second, vegetation is typically represented indirectly through modeled shading effects or generalized greenery indicators rather than through direct pedestrian-perspective observations. Third, several frameworks require microclimatic simulations or thermal-comfort modelling workflows prior to route generation, increasing data and computational requirements. This may limit their transferability across large urban areas or require substantial pre-processing before implementation.
In contrast, the framework proposed in this study focuses on the operational integration of heterogeneous observed data sources within a fully implemented routing tool. Airborne thermal imagery provides high-resolution (1 m) measurements of urban heat accumulation across the study area, while Google Street View imagery processed through semantic segmentation provides pedestrian-perspective estimates of street-level canopy coverage. These two environmental layers are combined with pedestrian network distance in a unified multi-criteria cost formulation, enabling the simultaneous consideration of heat exposure, shading potential, and route length. The contribution therefore lies not only in combining thermal and canopy indicators, but also in translating them into an operational, user-configurable routing workflow implemented at the scale of the historic city-center pedestrian network, rather than remaining limited to descriptive mapping or prototype-level illustration.
3. Methodology
3.1. Overview of the Framework
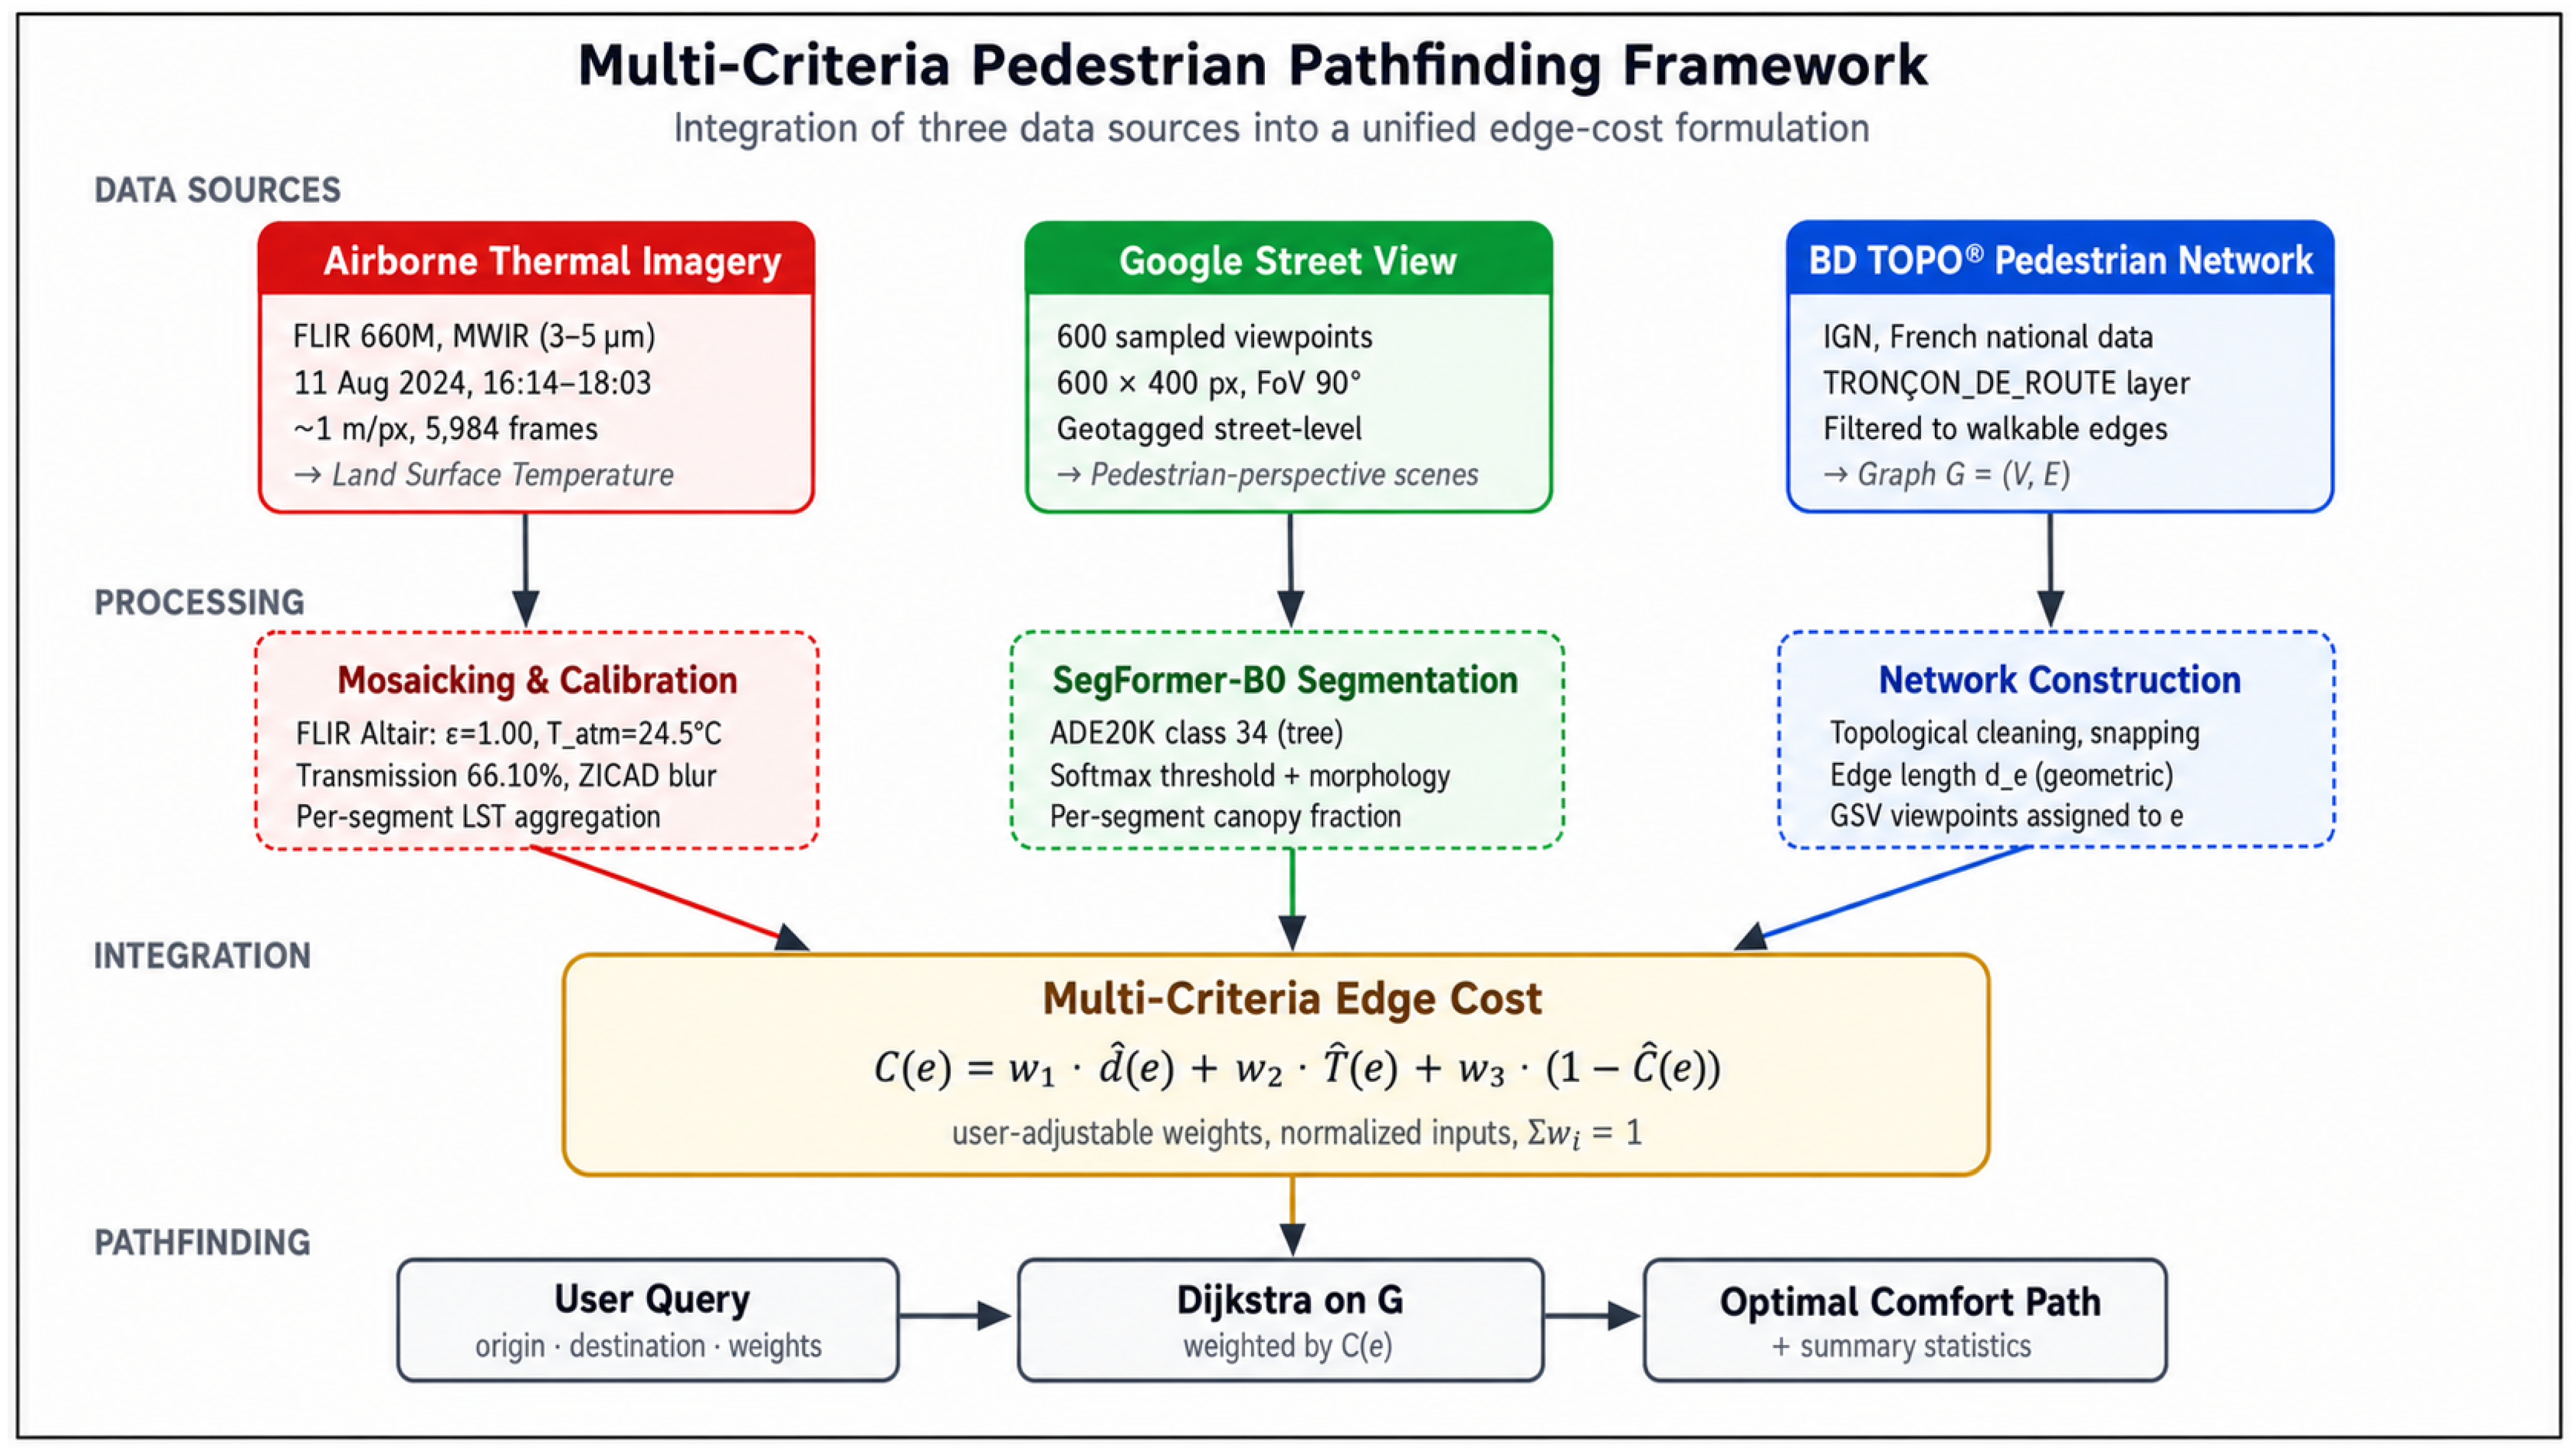
The proposed framework integrates three complementary data sources, airborne thermal imagery, Google Street View (GSV) imagery, and the street network database from the French National Institute of Geographic and Forest Information (IGN BD TOPO, [34]), into a unified, multi-criteria edge-cost formulation that supports thermal-comfort-aware pedestrian routing. The pipeline consists of four sequential stages. First, the three data sources are independently acquired and pre-processed: thermal imagery is mosaicked and calibrated to land surface temperature (LST); GSV imagery is sampled at street-segment locations and processed by a transformer-based semantic segmentation model to extract tree-canopy coverage; and the BD TOPO pedestrian network is filtered and topologically cleaned. Second, both the LST raster and the canopy fraction are spatially aggregated to individual street segments, producing two scalar attributes per edge in addition to its geometric length. Third, these three attributes are normalized and combined into a single edge cost through a user-adjustable linear weighted formulation. Fourth, given an origin, a destination, and a set of weights expressing user preferences, Dijkstra’s algorithm is used to compute the minimum-cost path on the weighted graph. The complete workflow is summarized in Figure 1.
Figure 1.
Overview of the multi-criteria pedestrian pathfinding framework.
3.2. Study Area
The framework is applied to Clermont-Ferrand, a medium-sized city located in central France within the Limagne plain. The municipal territory covers approximately 42.7 km2 and lies between the Chaîne des Puys volcanic range to the west and the Livradois-Forez mountains to the east. This basin morphology constrains atmospheric circulation and promotes thermal inversions that intensify heat accumulation within the urban fabric.
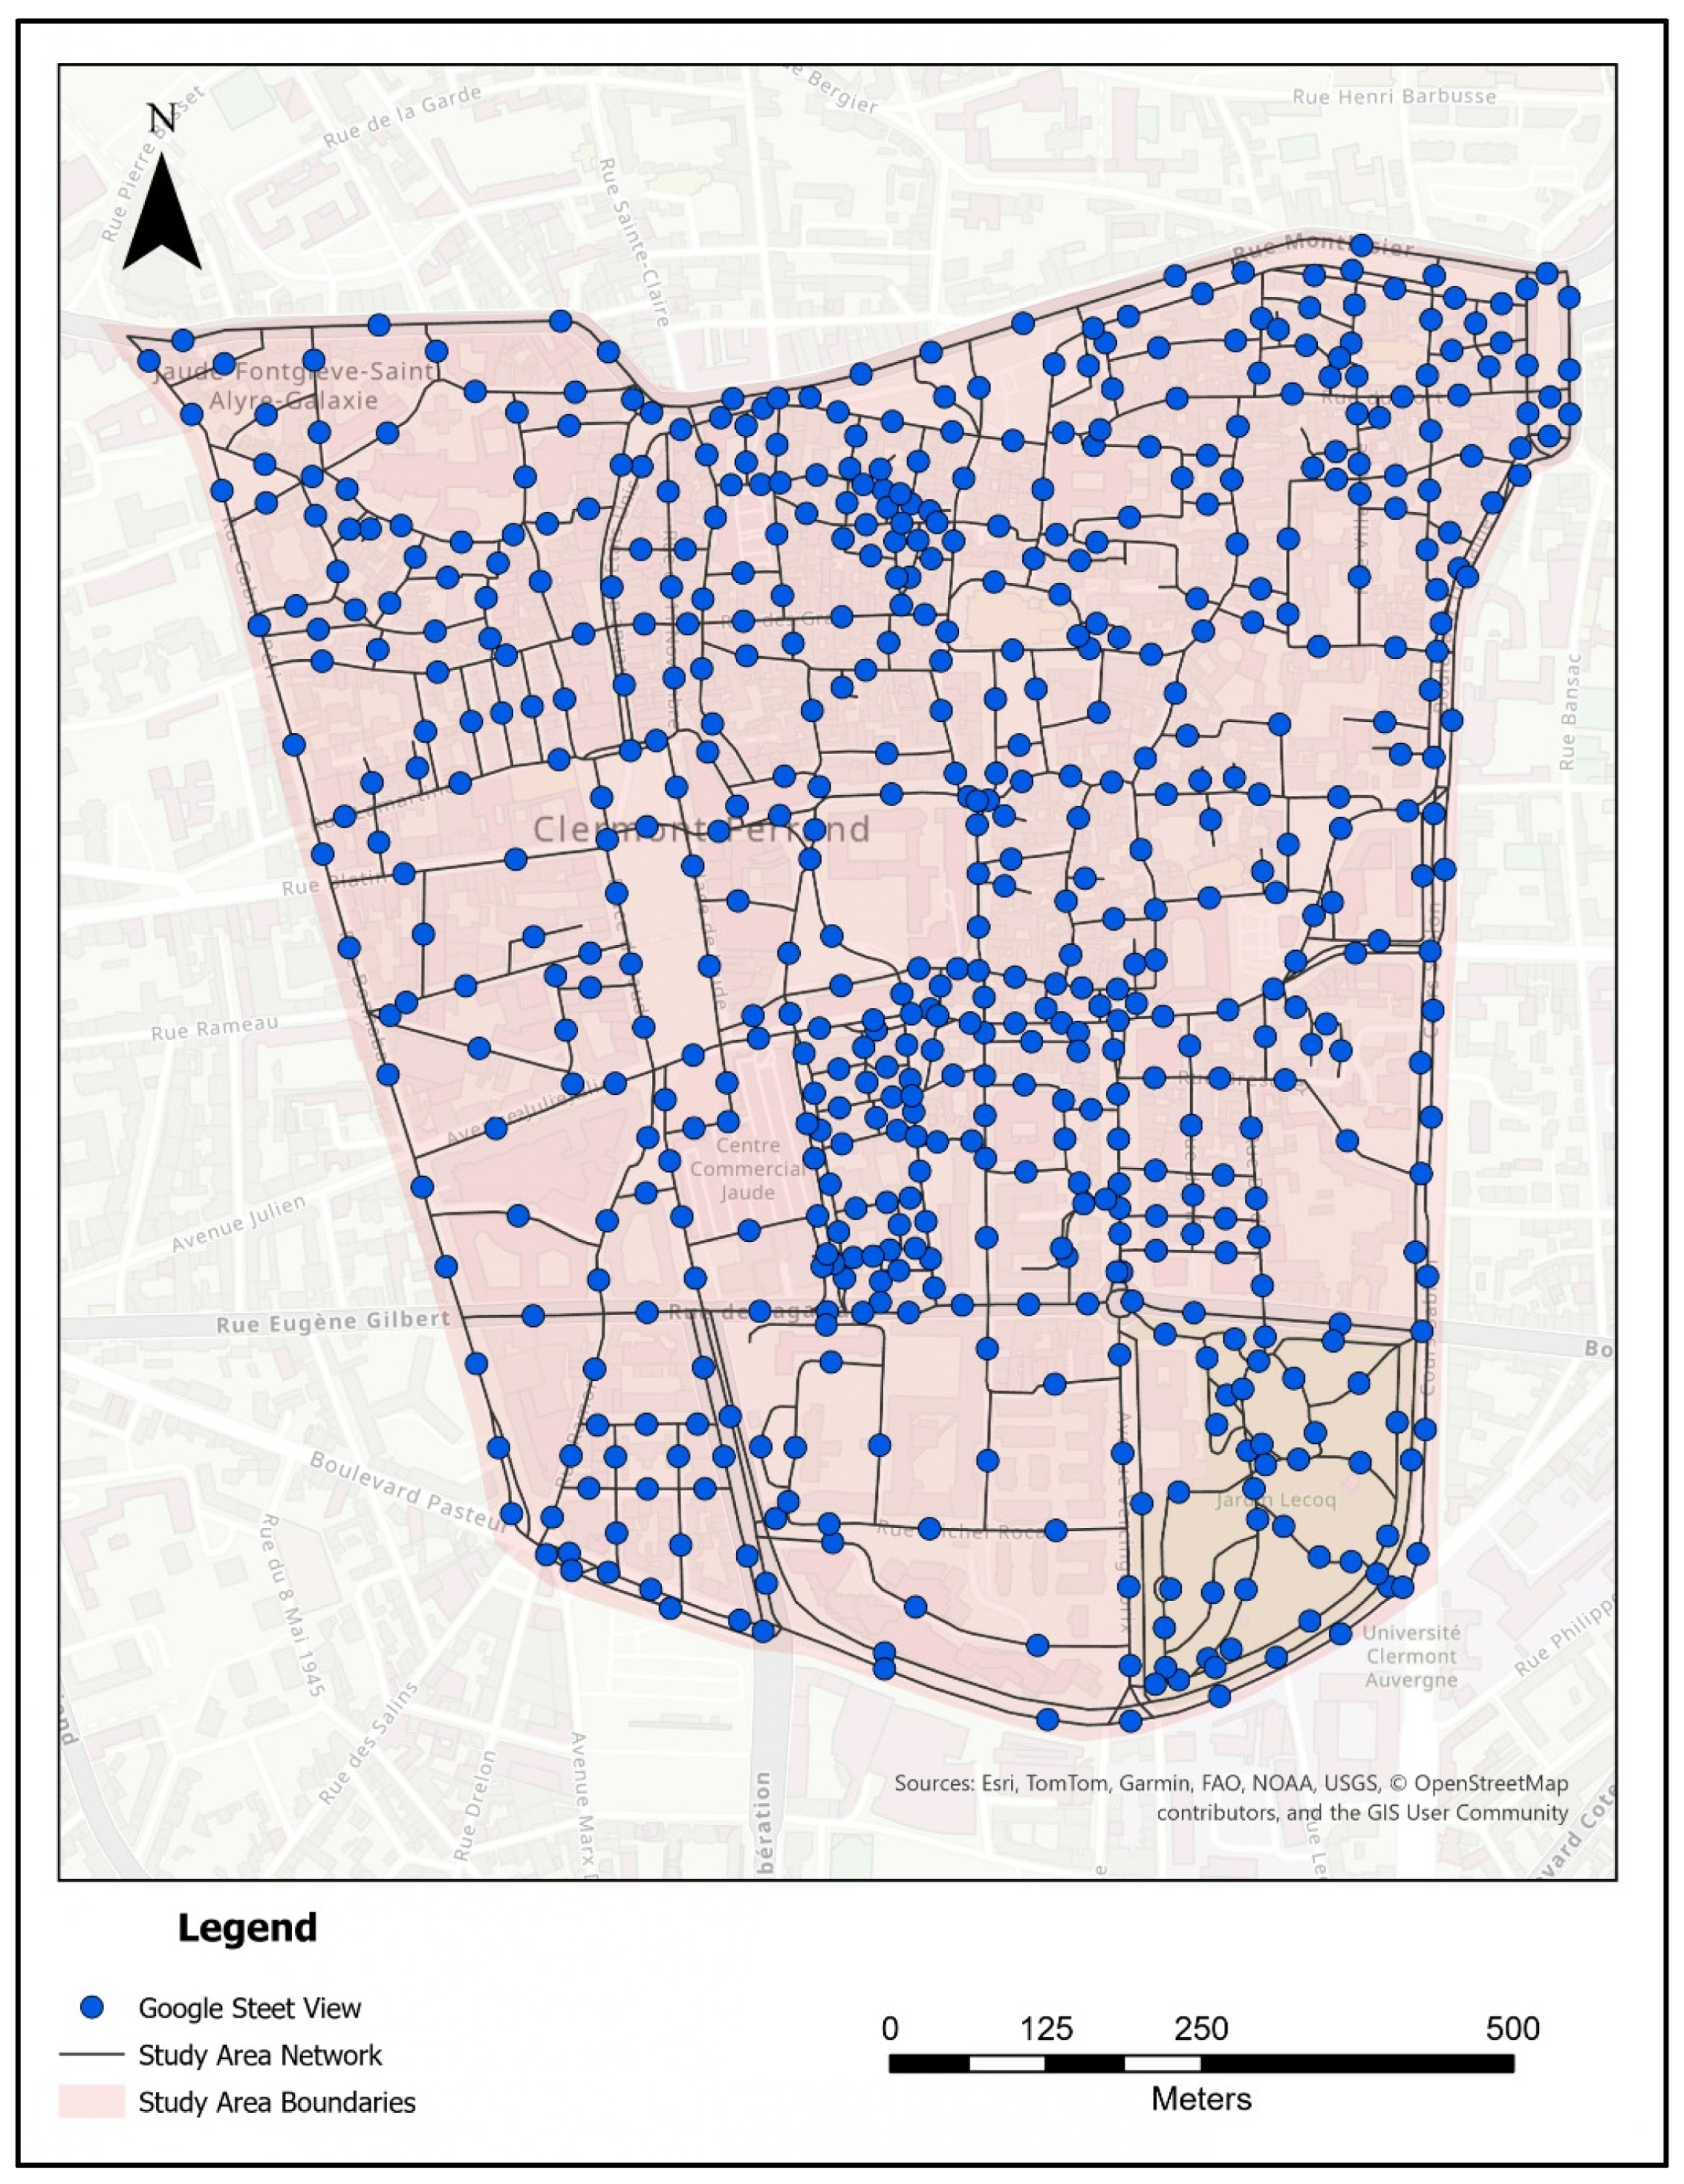
The present study focuses specifically on the historic and highly urbanized city center rather than the entire municipal territory. This central district features dense built morphology, intense pedestrian activity, and limited vegetation cover, making it particularly susceptible to UHI effects and pedestrian thermal discomfort during extreme summer conditions. Figure 2 shows the boundary of the study area, and the collected GSV points.
Figure 2.
Study area (center of Clermont-Ferrand) and GSV collected points.
In recent decades, Clermont-Ferrand has experienced increasingly intense and recurrent heatwaves, reinforcing its relevance as a case study for UHI-aware pedestrian mobility analyses. The city recorded its highest observed temperature of 40.9 °C during the exceptional June 2019 European heatwave, establishing a historic local record [35]. Summer 2022 was also characterized by multiple prolonged heatwave episodes across the Auvergne-Rhône-Alpes region, with temperatures frequently exceeding 35 °C and generating severe thermal stress conditions in urban environments [36]. These recurring heatwave events, combined with the city’s basin topography and compact urban structure, increase Clermont-Ferrand’s exposure to urban overheating and intensify thermal discomfort for pedestrians.
3.3. Data Sources
3.3.1. Pedestrian Street Network
The pedestrian network is derived from the IGN BD TOPO dataset, the authoritative source [34]. The TRONÇON_DE_ROUTE layer provides the geometric and attribute information for road segments, including hierarchy, surface, and access restrictions. The raw layer is filtered to retain only segments accessible to pedestrians (excluding motorways and other restricted classes), and the resulting geometry is topologically cleaned by snapping near-coincident endpoints and removing dangling fragments. The cleaned network is then represented as an undirected graph G = (V, E), in which each vertex v ∈ V corresponds to an intersection or terminal node and each edge e ∈ E corresponds to a walkable segment. Each edge is assigned to a geometric length d(e), measured in meters, which serves as the baseline distance attribute in the cost formulation.
3.3.2. Google Street View Imagery
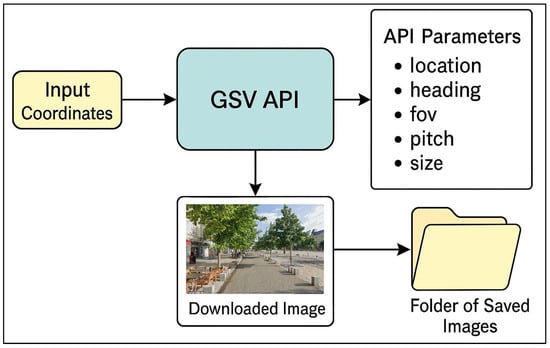
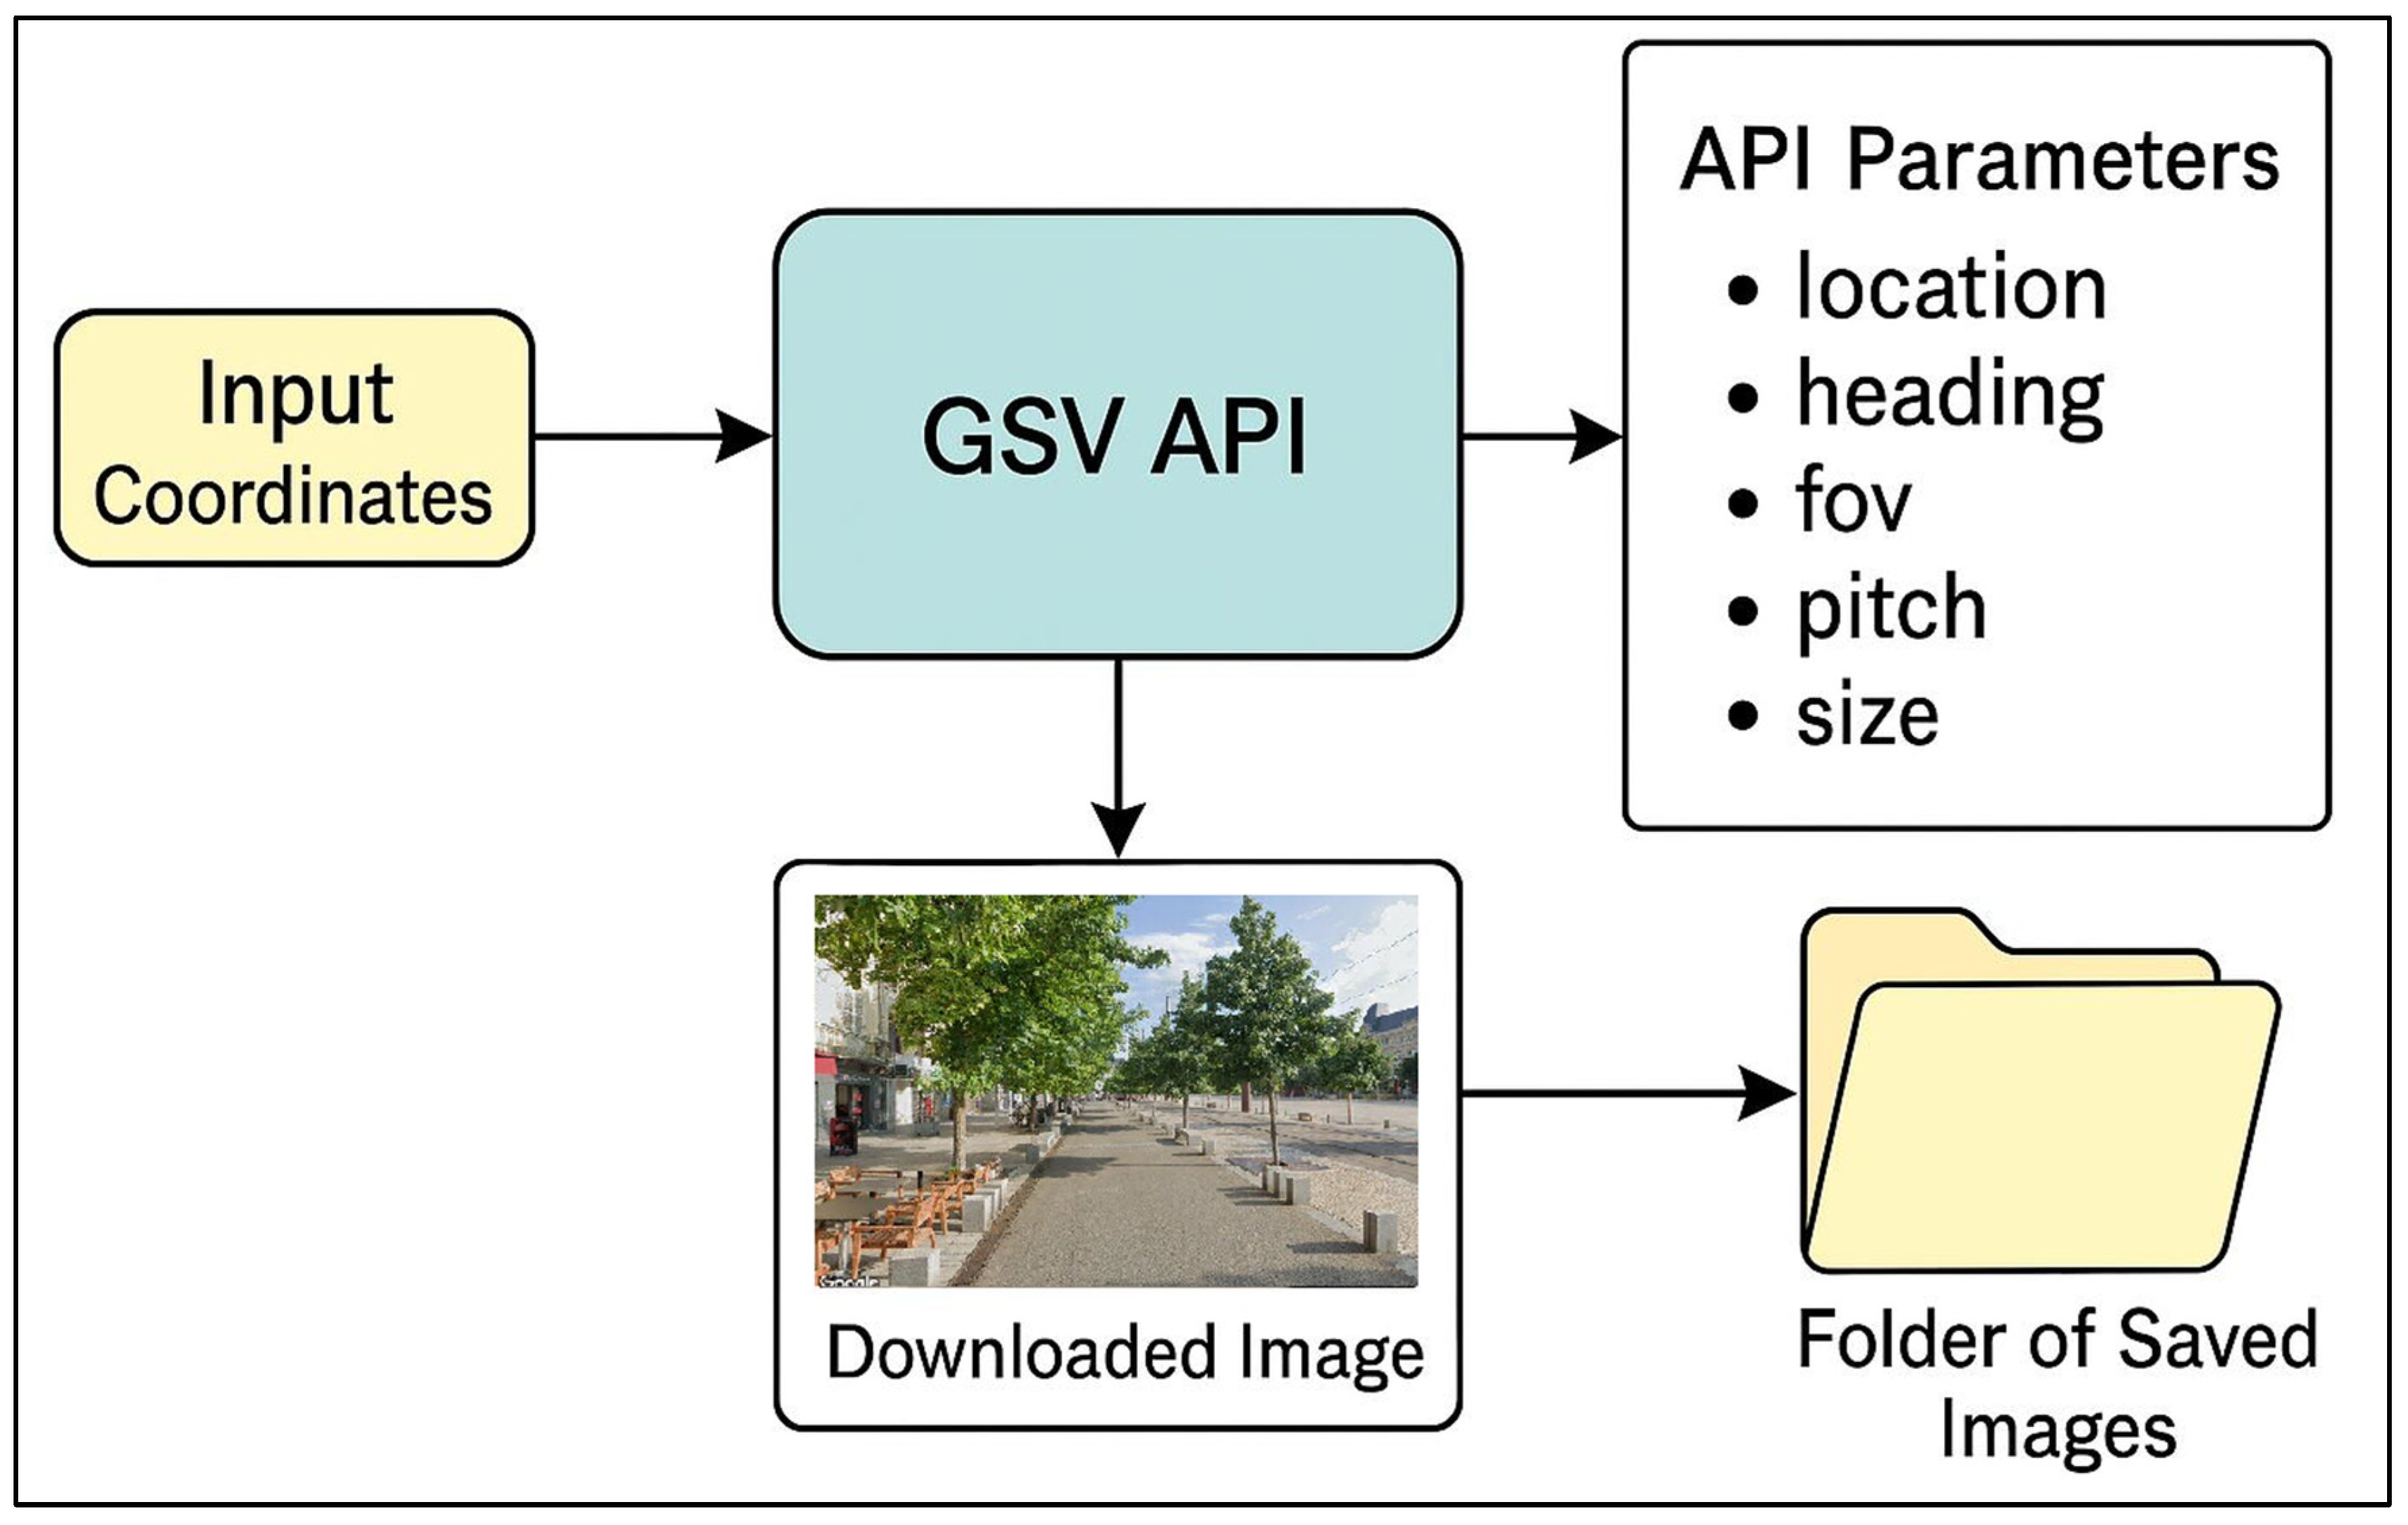
Pedestrian-perspective imagery is obtained from the Google Street View (GSV) Static API. For each street segment in the cleaned network, a single GSV viewpoint is sampled at the segment midpoint and downloaded with the following parameters: image size 600 × 400 pixels, field of view (FoV) 90°, and pitch 0° (horizon-aligned). The 90° FoV was selected as a balance between contextual breadth and image distortion, since GSV imagery originates from spherical panoramas and wider crops introduce stronger geometric warping. A total of 600 georeferenced images were collected across the study area, providing consistent and globally available street-level observations. The acquisition strategy is intentionally simple: a single front-facing image per viewpoint is used, at the cost of providing only a partial view of the surroundings. Multi-heading and orientation-aware sampling, such as aligning the camera heading with the segment azimuth or collecting multiple views per segment, are therefore identified as possible extensions in the Discussion. Figure 3 shows the pipeline for collecting the images using the GSV API.
Figure 3.
Pipeline overview for collecting the GSV images.
3.3.3. Airborne Thermal Imagery
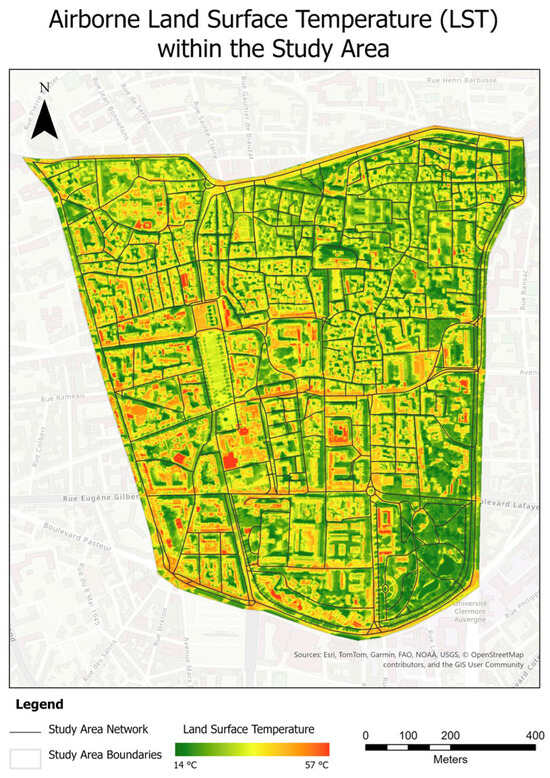
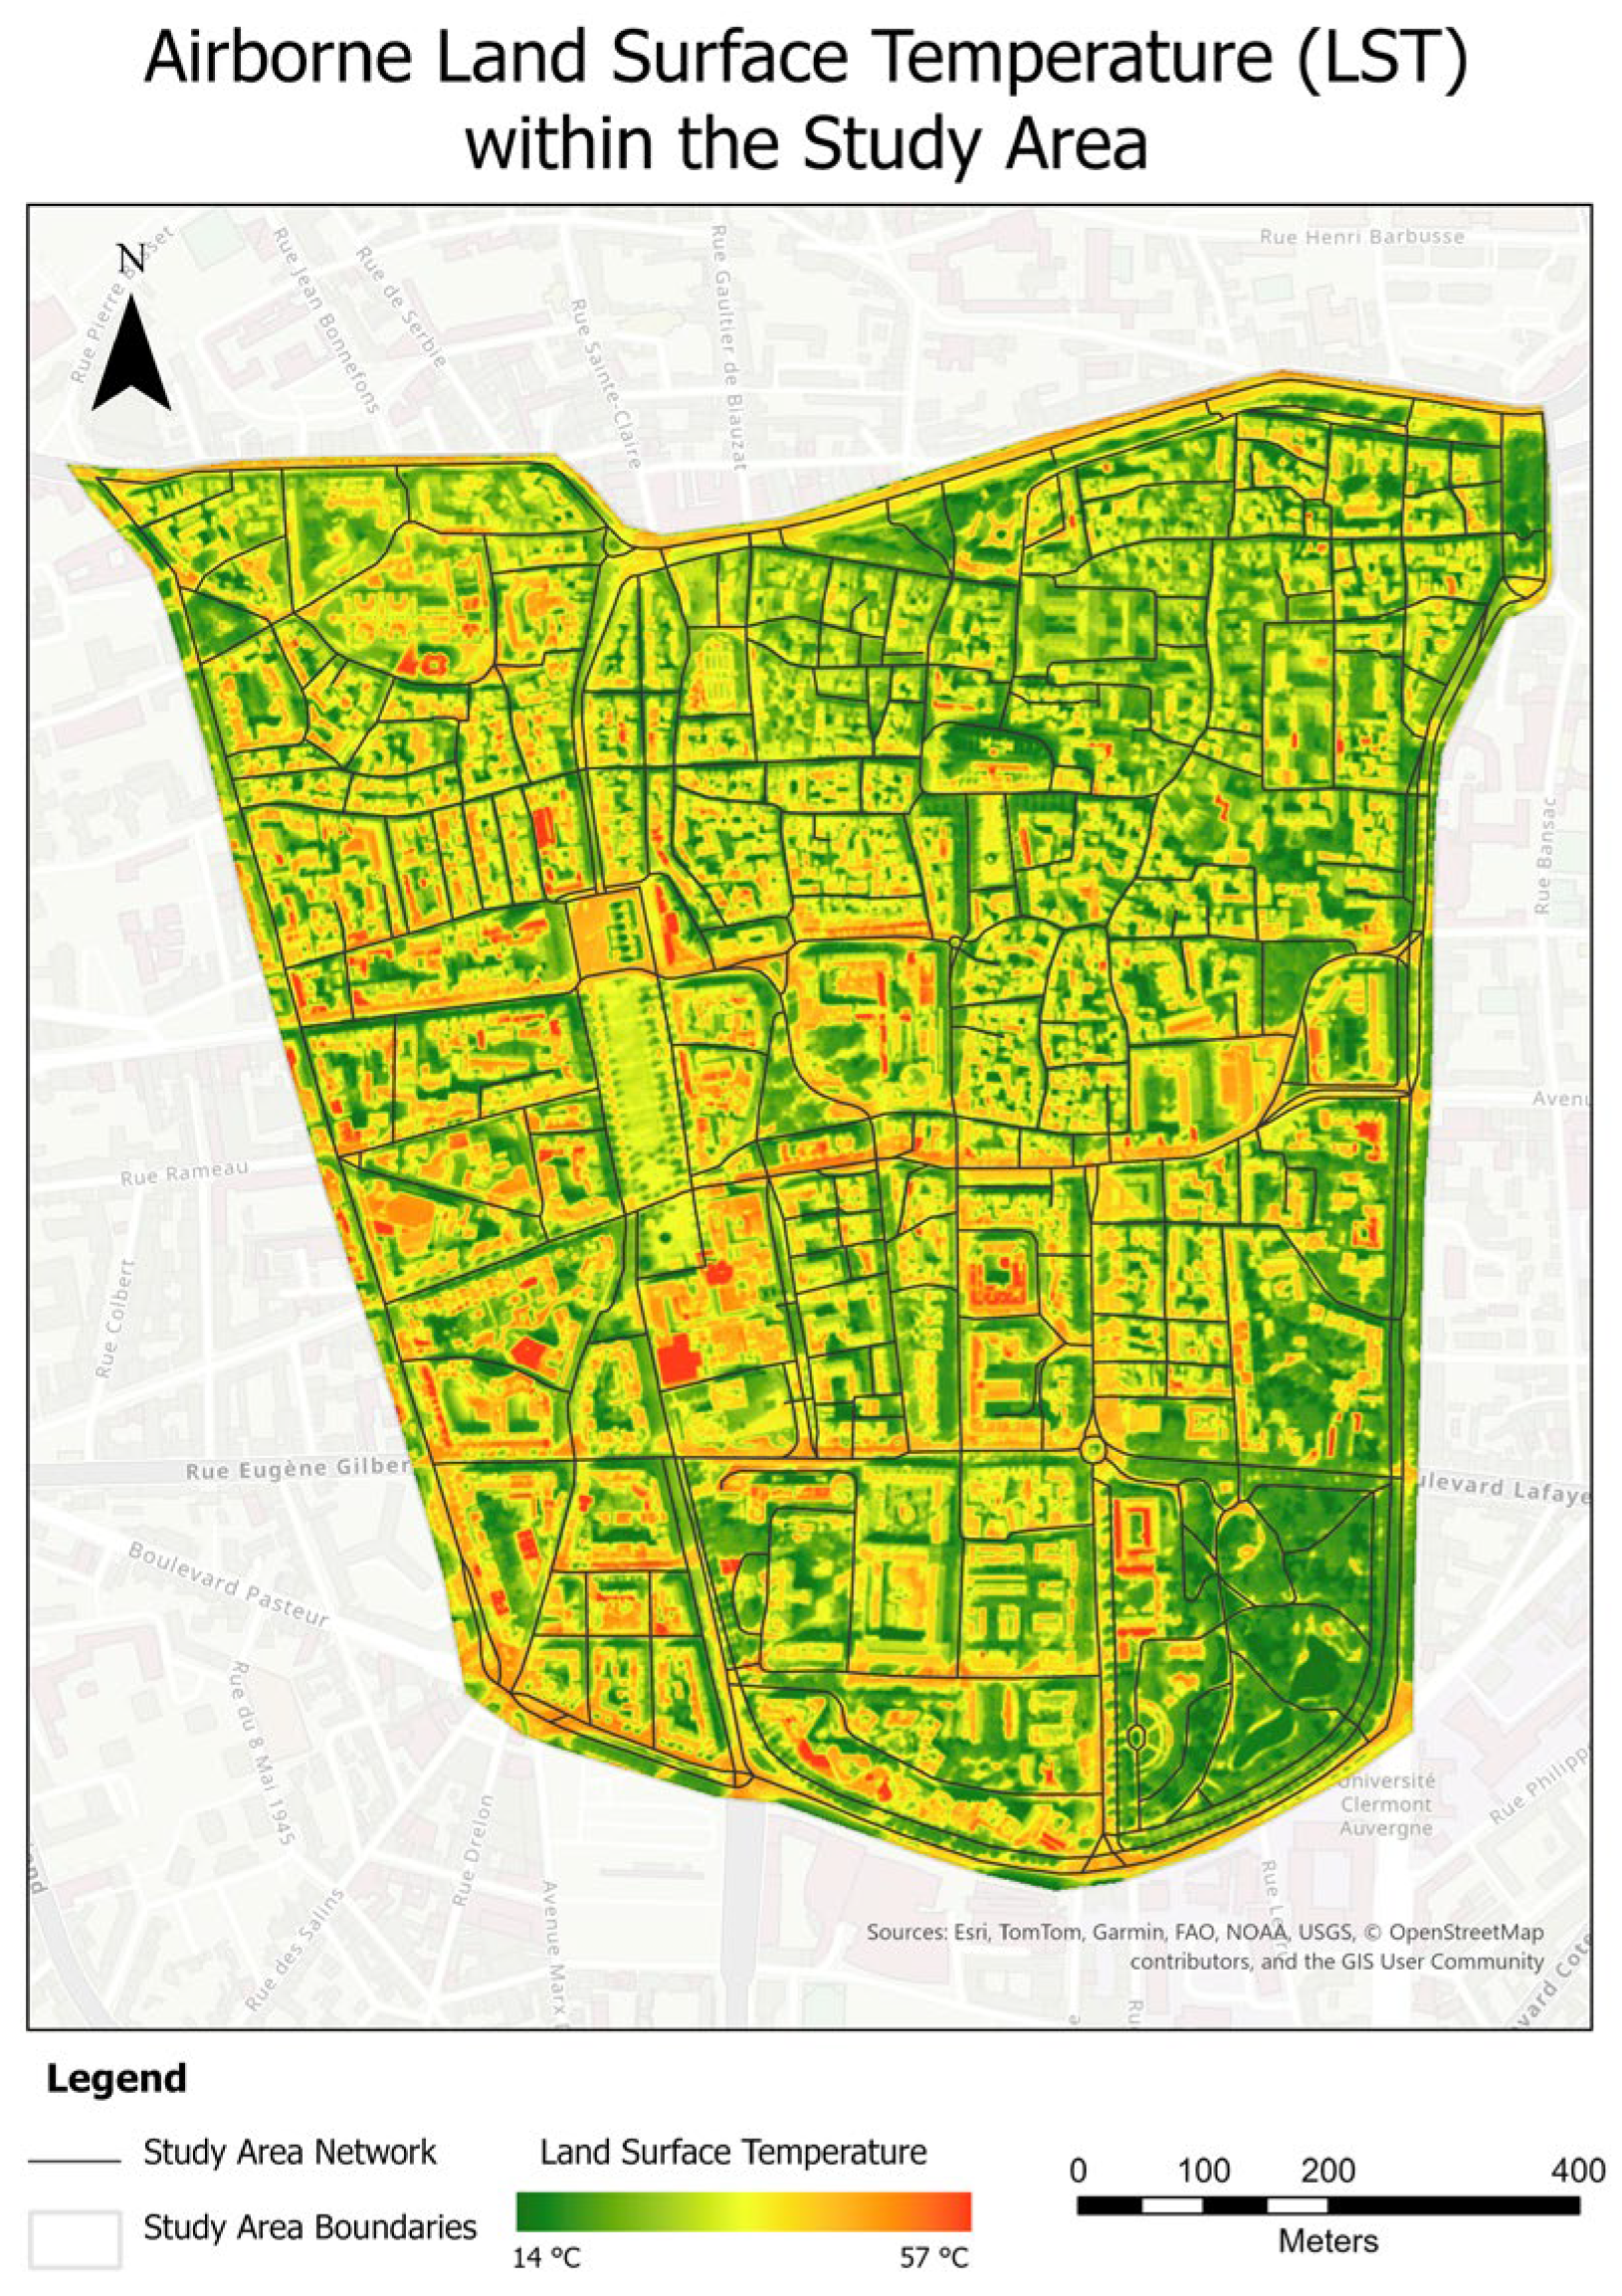
Airborne thermal data were acquired by the Clermont Auvergne Metropolis [37] authority on 11 August 2024, during a heatwave officially declared by Météo-France over the Puy-de-Dôme department (Figure 4). The acquisition was carried out by Aerodata France using an FLIR 660M (Silver 660M) thermal camera with a 27 mm focal length, mounted on a Partenavia P68C aircraft (F-HPEI). The sensor is an indium antimonide (InSb) detector with a 640 × 512-pixel array, a noise-equivalent temperature difference (NETD) below 25 mK, and an operational waveband of 3–5 µm in the mid-wave infrared (MWIR) range [38]. The flight plan consisted of 26 north–south-oriented axes, with 40% lateral overlap and approximately 93% longitudinal overlap (one frame every 0.5 s), yielding a ground sampling distance better than 1 m per pixel and a total of 5984 individual frames. Acquisition began at 16:14 and ended at 18:03 local time, a deliberately chosen window to capture the late-afternoon thermal signature of urban surfaces, when accumulated solar radiation produces the strongest contrasts between materials. The reference air temperature recorded at the Aulnat meteorological station (Météo-France) during the acquisition window was 35.4–37.4 °C.
Figure 4.
Surface temperature map of Clermont-Ferrand during summer 2024. Adapted from Clermont Auvergne Metropolis [37].
Radiometric calibration was performed in FLIR Altair with the following parameters: emissivity ε = 1.00, environmental temperature T_env = 35 °C, atmospheric temperature T_atm = 24.5 °C, and atmospheric transmission τ = 66.10%. The thermal frames were exported as 8 bit grayscale TIFF rasters encoding apparent temperature in degrees Celsius, with a captured range of +2 °C to +84 °C. Following French regulations, a Gaussian blur with a 10 m kernel was applied within the ZICAD (Zone Interdite à la Captation Aérienne de Données) protected zone [38]. The product of this stage is a contiguous LST raster covering the metropolitan area at sub-metric resolution. It is important to note that the FLIR 660M, like all thermal infrared sensors, measures the radiative temperature of surfaces (LST) rather than the air temperature.
3.4. Tree Canopy Extraction from Street-Level Imagery
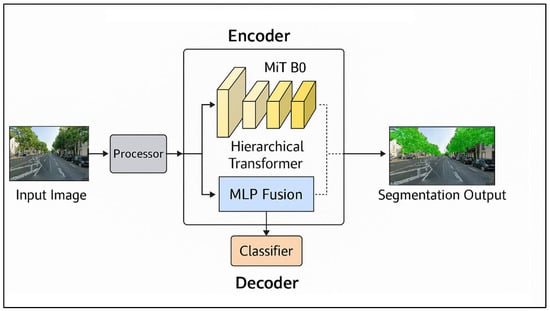
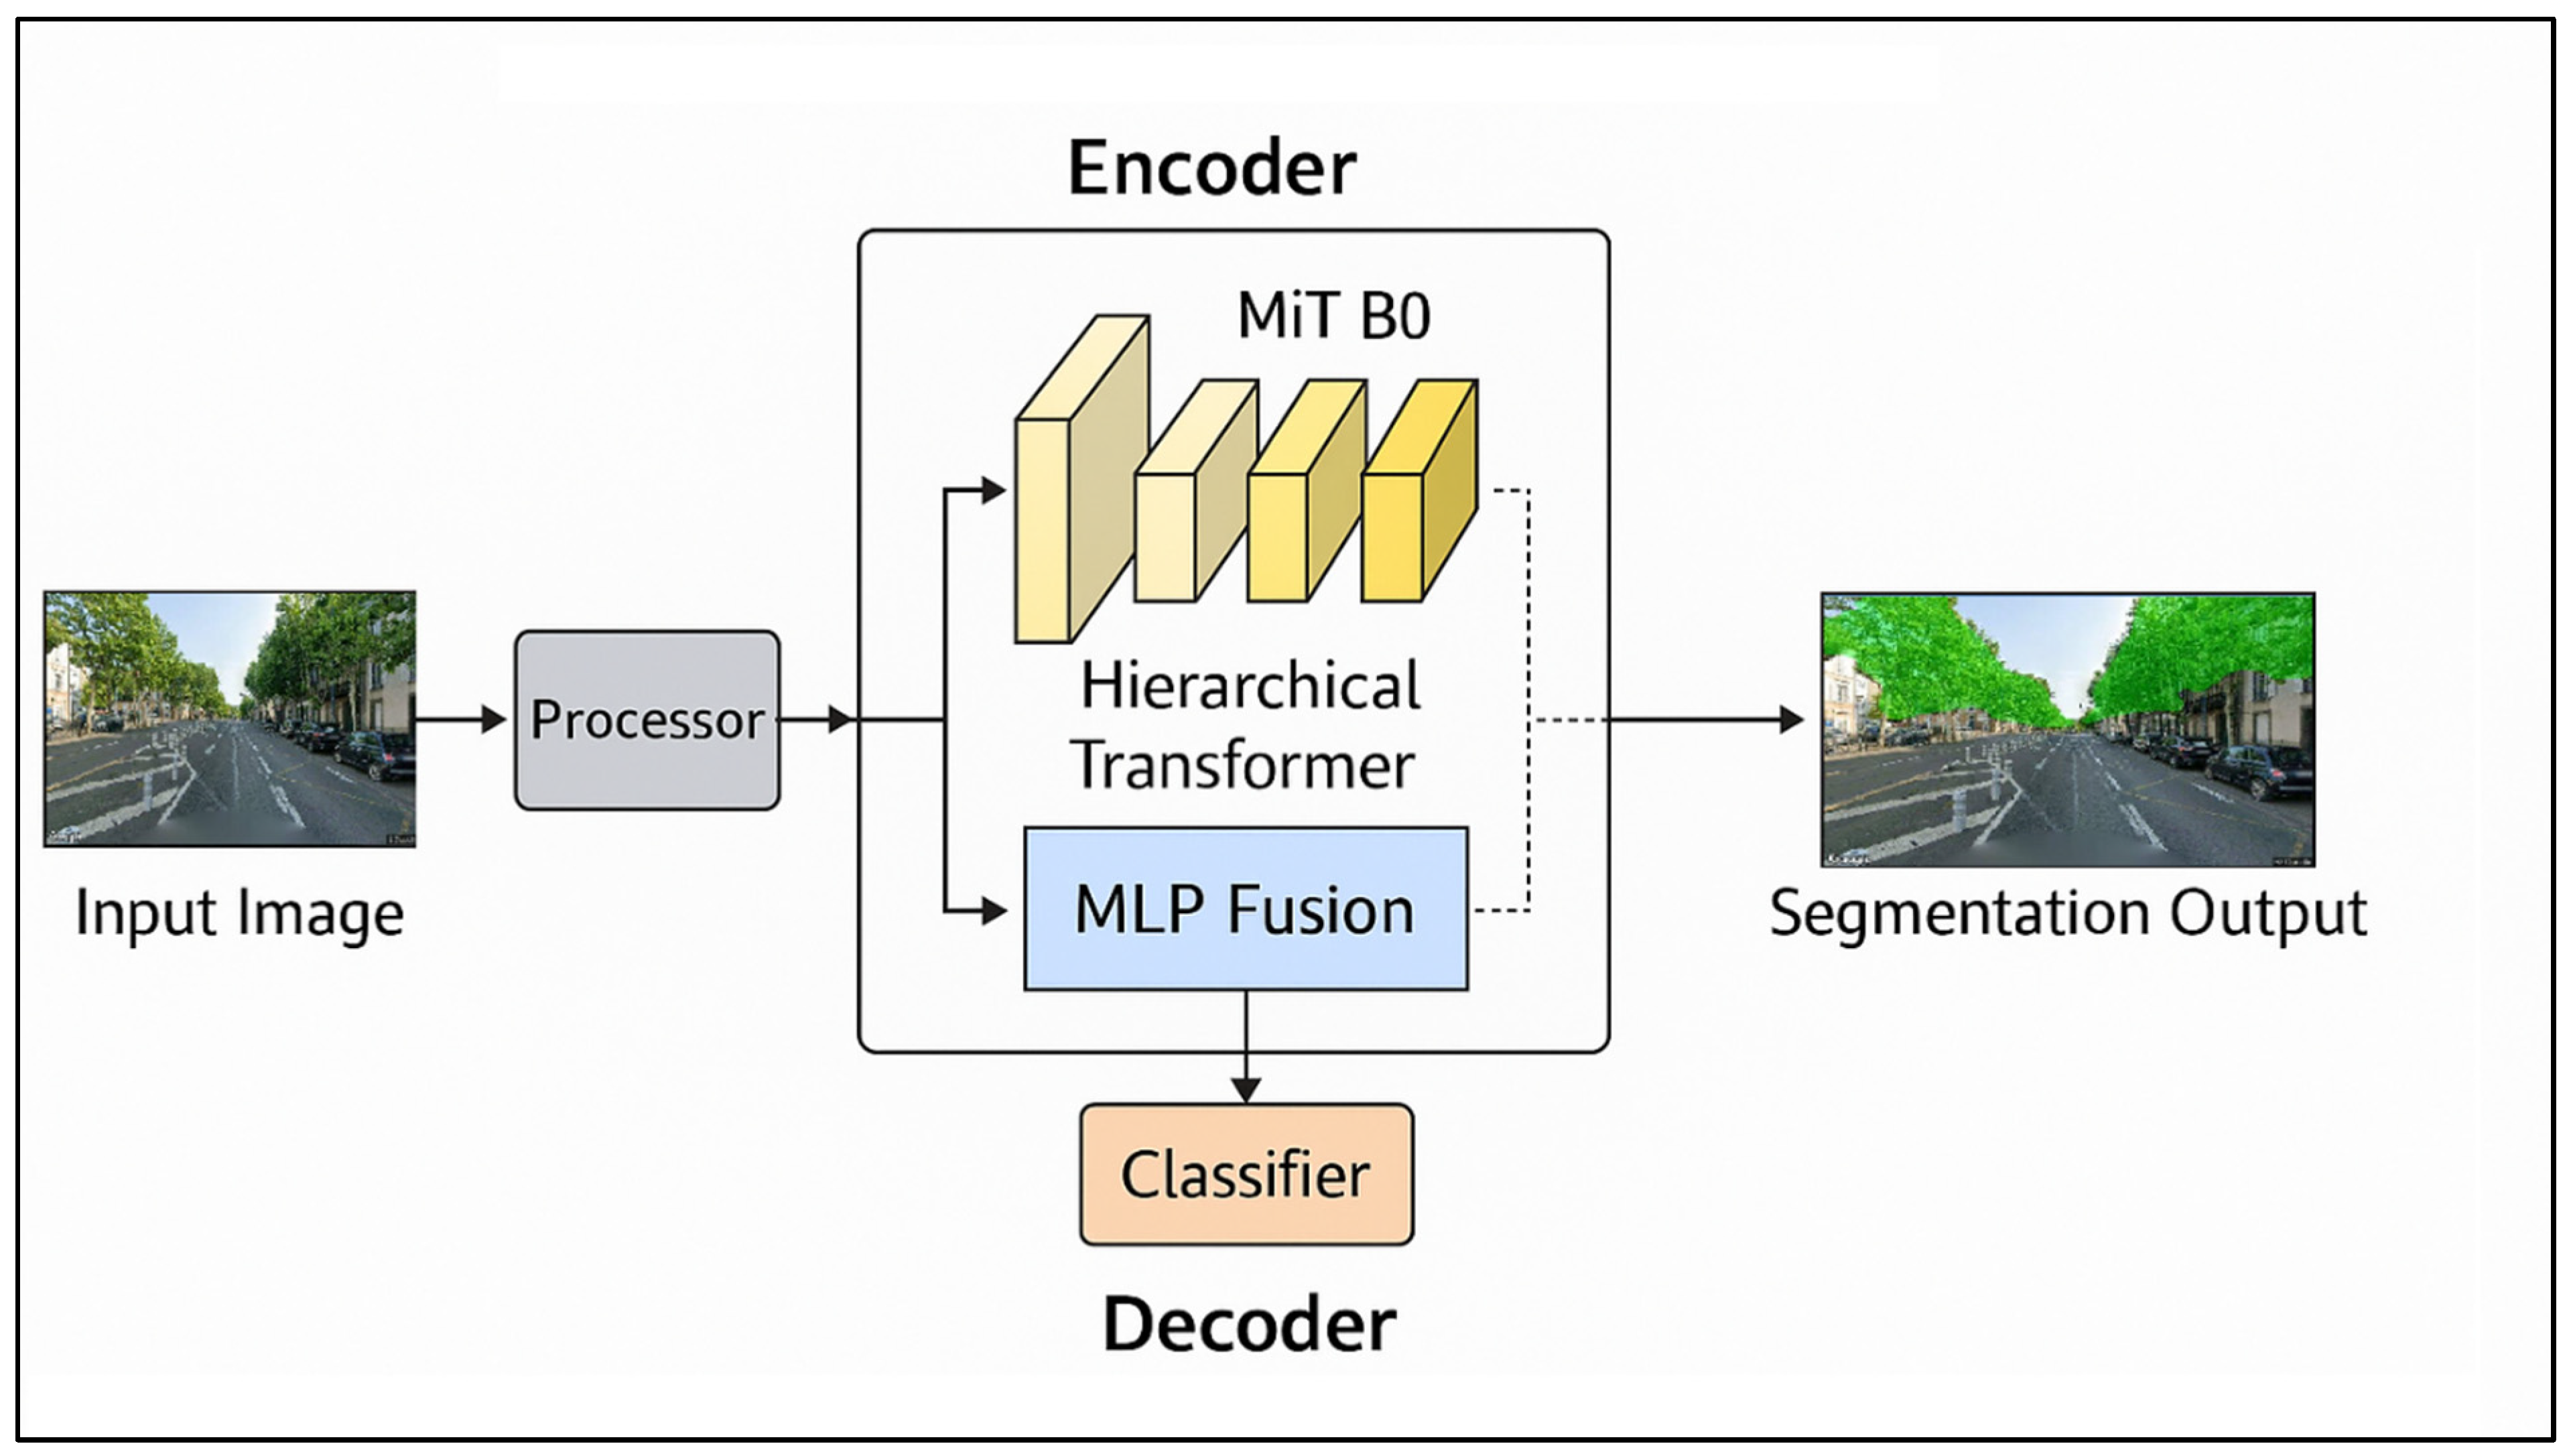
Pedestrian-perspective tree-canopy coverage is extracted using SegFormer [26], a transformer-based semantic segmentation architecture (Figure 5). We adopt the SegFormer-B0 variant, the lightest configuration in the SegFormer family, with approximately 3.7 million parameters, pre-trained on the ADE20K dataset [39], which annotates 150 semantic categories at the pixel level and includes “tree” as class 34. SegFormer-B0 was selected for two reasons. First, its hierarchical Mix Vision Transformer (MiT) encoder produces multi-scale feature maps at four progressively coarser spatial resolutions, capturing both the fine texture of foliage and the broader spatial context of the scene without relying on positional embeddings; the resulting design is robust to variations in input resolution and to the systematic framing differences that occur across GSV viewpoints. Second, its lightweight all-MLP decoder fuses the multi-scale features into a dense per-pixel prediction with a small computational footprint, enabling inference at scale on standard hardware, an important practical consideration when processing hundreds of viewpoints across an urban network.
Figure 5.
SegFormer architecture overview—encoder–decoder without positional embeddings.
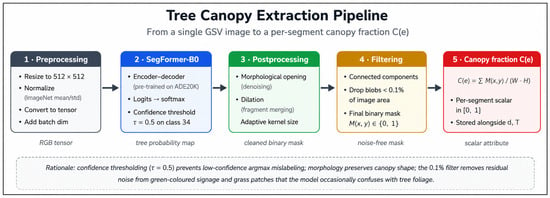
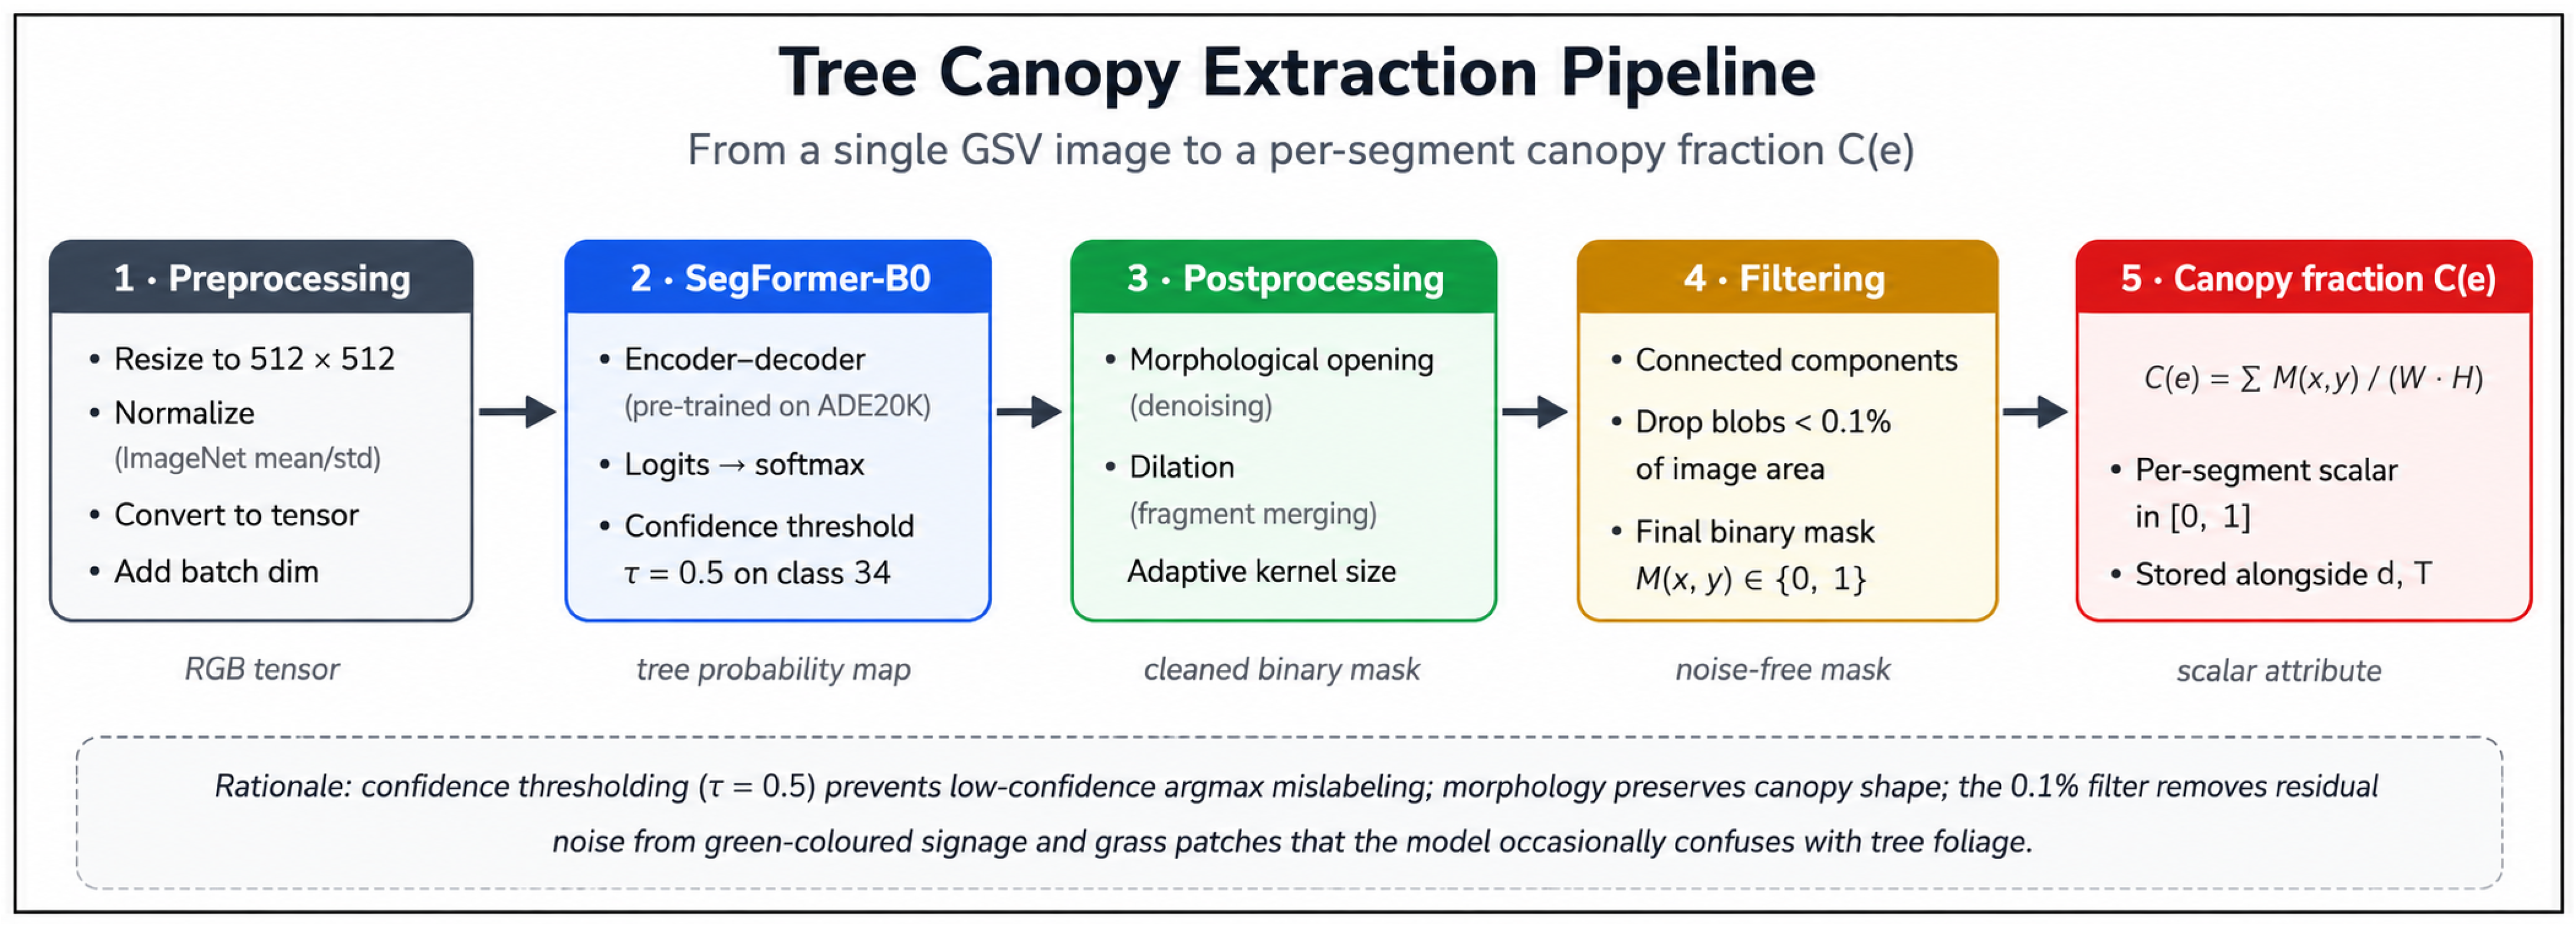
The inference pipeline operates in five stages, as summarized in Figure 6. First, each GSV image is pre-processed by the SegformerImageProcessor: resized to 512 × 512 pixels, normalized using ImageNet statistics, and converted to a PyTorch (2.12.1) tensor with an added batch dimension. Second, the model produces a logit map of shape H × W × 150, on which a softmax operation yields per-pixel class probabilities. Rather than relying solely on argmax, which empirically produced empty masks for low-confidence tree pixels in our pilot tests, we apply a confidence threshold τ = 0.5 on the softmax probability of class 34: a pixel is labeled as tree only when its predicted tree probability exceeds τ. Third, the resulting binary mask is post-processed with morphological opening to remove isolated noise and morphological dilation to reconnect fragmented canopy regions, with kernel sizes adaptively scaled to the input resolution. Fourth, connected components covering less than 0.1% of the image area are filtered out as residual noise. This step removes the small, scattered green-colored artefacts (signage, grass strips, painted markings) that the model occasionally confuses with tree foliage. Fifth, for each segment e of the canopy fraction C(e) ∈ [0, 1] is computed as the ratio of pixels labeled as a tree to the total number of pixels in the GSV image associated with that segment.
Figure 6.
Tree canopy extraction pipeline applied to each GSV viewpoint.
It should be noted that the extracted canopy fraction does not represent a direct measurement of cast shade. Actual shade depends on solar geometry, time of day, street orientation, canopy density, tree height, and surrounding building morphology [7,40]. In this study, GSV-derived canopy coverage is therefore interpreted as a pedestrian-perspective indicator of visible greenery and shading potential rather than a deterministic shadow model. This interpretation is consistent with previous studies showing that street greenery contributes to physical and psychological thermal comfort and influences pedestrians’ walking experience [4,41], while GSV-derived tree-canopy information has also been used to characterize the shade provision of street trees. Since the value is computed as the proportion of pixels classified as trees, small or sparse trees contribute only proportionally to the segment-level canopy score.
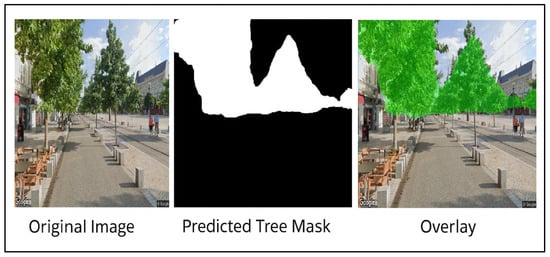
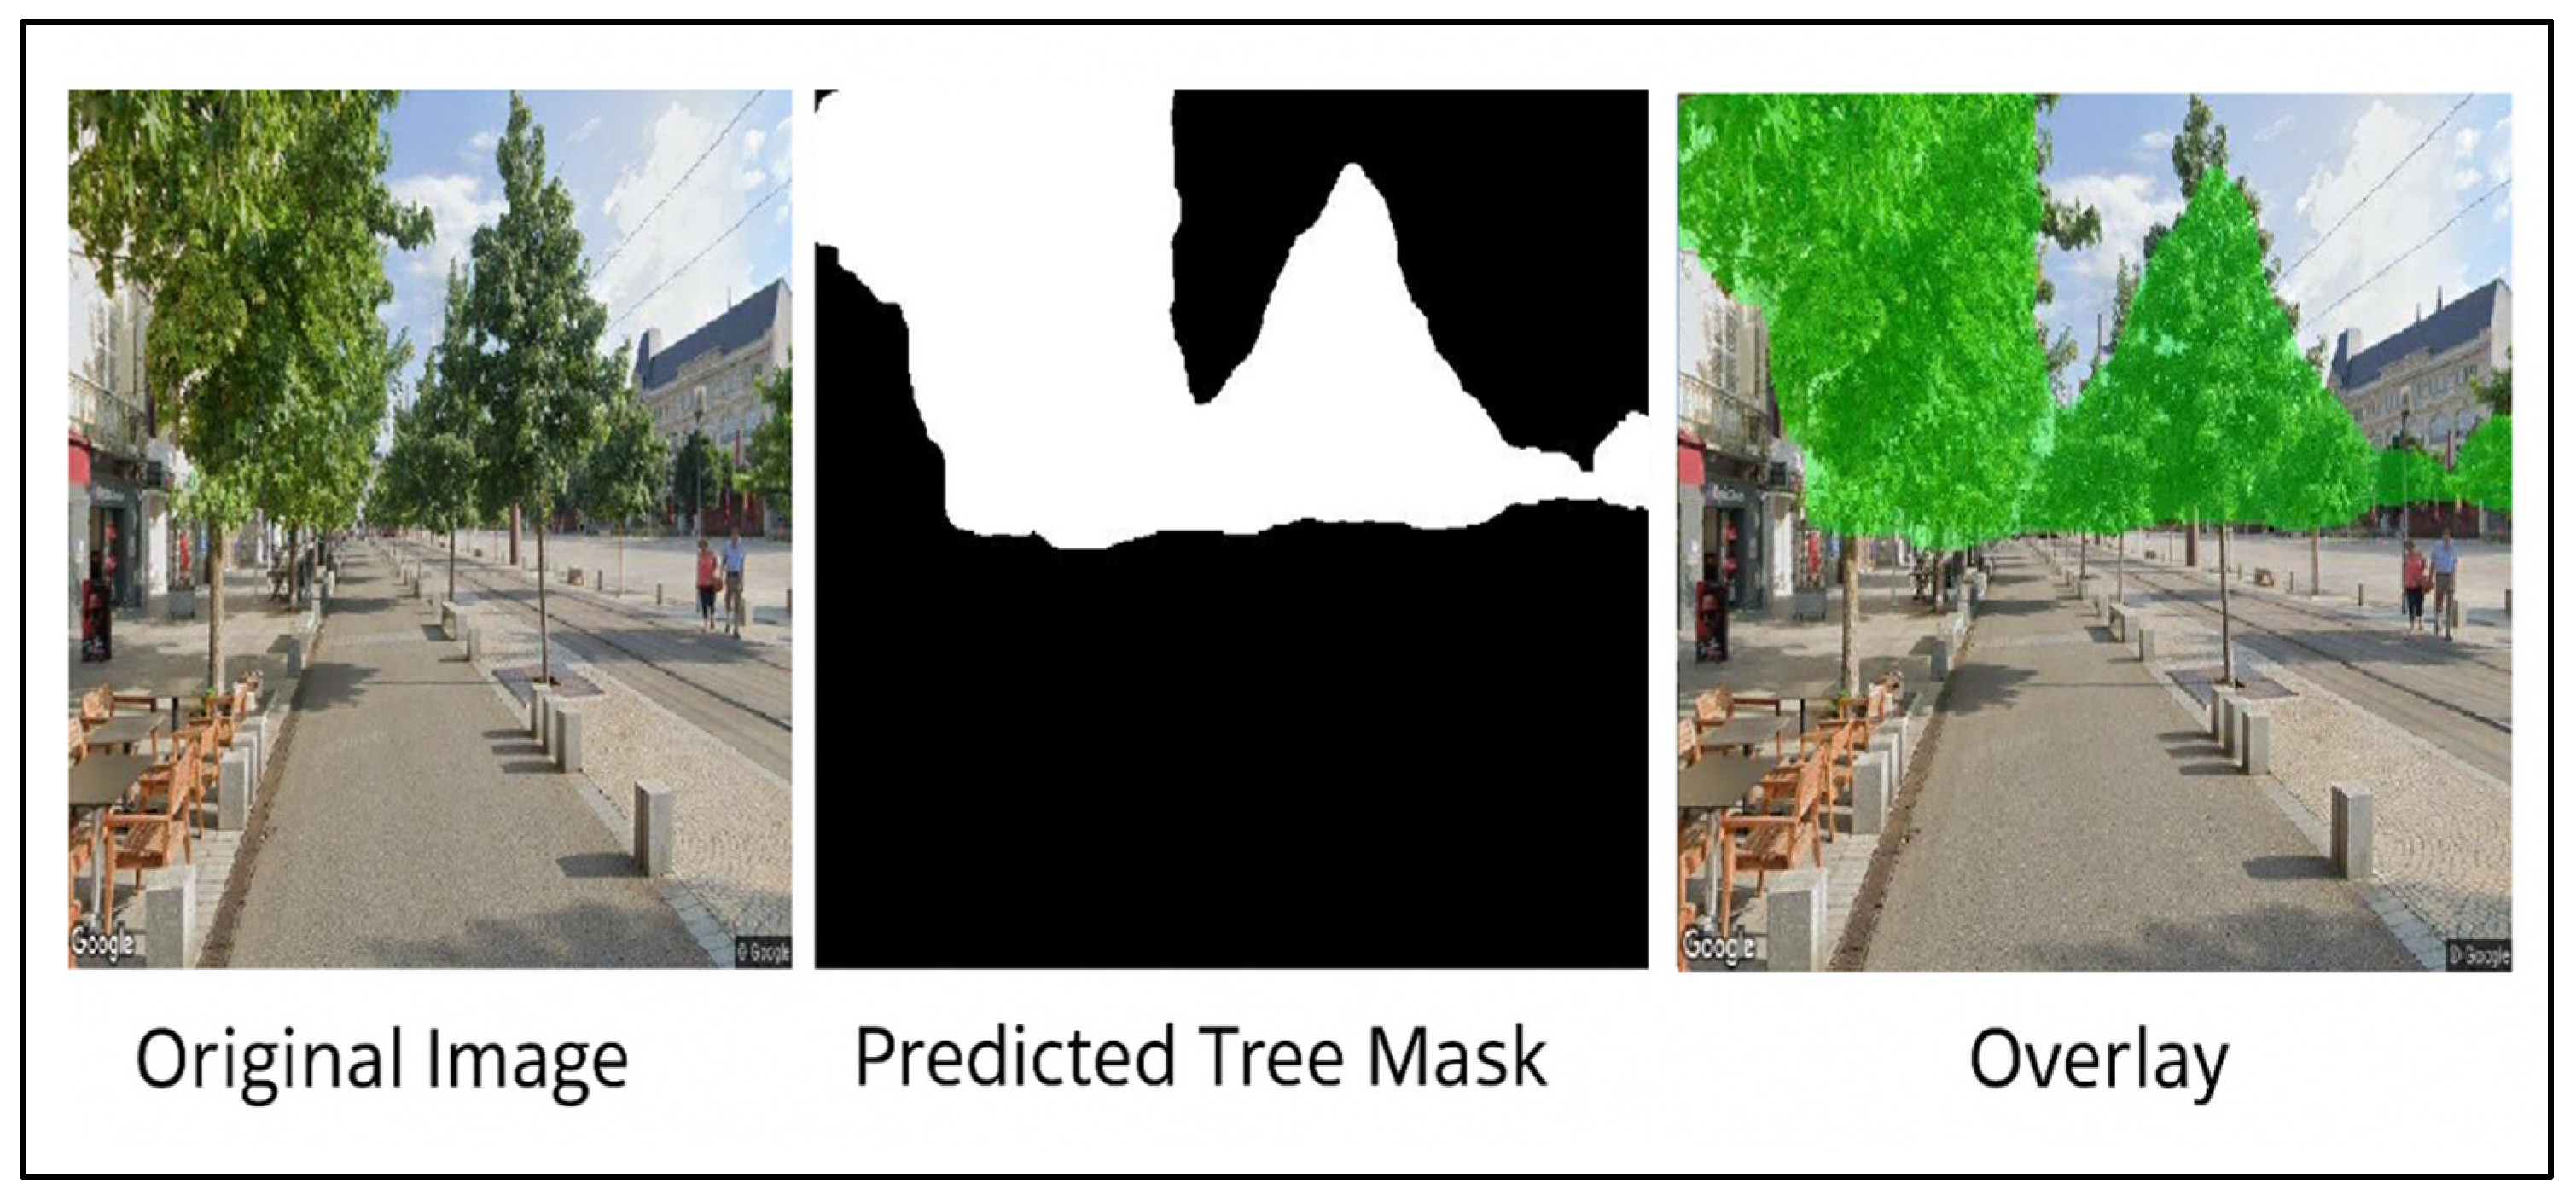
This procedure produces, for each segment e in the network, a scalar canopy attribute C(e) reflecting the visible vegetation cover from a pedestrian standing at the segment midpoint and looking along the street axis. Outputs are stored as binary PNG masks, RGB overlay visualizations for visual quality control, and a tabular file that links each segment identifier to its canopy fraction (Figure 7).
Figure 7.
Overlay visualization with segmented tree regions in green.
3.5. Aggregation of LST onto the Pedestrian Network
To assign a thermal attribute to each segment e, we aggregate the LST raster onto the network through a buffer-and-zonal-statistics procedure. For each segment, a planar buffer of width δ is constructed around the segment geometry; the buffer width is chosen to approximate the half-width of a typical pedestrian corridor (sidewalk plus immediately adjacent surfaces). The set of LST raster cells whose centroids fall within this buffer constitute support for the segment. The segment-level temperature attribute T(e) is then computed as the arithmetic mean of LST values over this support:
where R(e) denotes the set of raster cells associated with segment e and LST(r) is the calibrated land surface temperature at the cell. The resulting per-segment temperature field T(e) constitutes the second routing attribute, complementing the canopy fraction C(e) and the geometric length d(e).
T(e) = (1/|R(e)|) · Σ_{r ∈ R(e)} LST(r)
3.6. Multi-Criteria Edge-Cost Formulation
The three segment-level attributes, geometric length d(e), per-segment LST T(e), and canopy fraction C(e), are heterogeneous in unit and in interpretation. Distance and temperature are penalties (lower is better), whereas canopy is a benefit (higher is better). To combine them within a single scalar cost, each attribute is first transformed into a comparable, dimensionless penalty in [0, 1] by min–max normalization across the network:
Ĉ(e) = (C(e) − C_min)/(C_max − C_min)
The canopy attribute is then inverted (1 − Ĉ(e)) so that a higher canopy yields a lower cost, aligning the three normalized terms in the same direction. The resulting multi-criteria edge cost is defined as a convex combination:
with non-negative weights summing to one (w1 + w2 + w3 = 1). The weight vector (w1, w2, w3) is fully exposed to the user via an interactive interface (described in Section 3.7), allowing pedestrians to configure the trade-off between geometric efficiency, thermal exposure, and shading according to their personal sensitivity to heat, the time of day, or contextual constraints. Setting (w1, w2, w3) = (1, 0, 0) recovers the conventional shortest-path solution; setting (0, 1, 0) yields the route minimizing exposure to elevated surface temperatures; and setting (0, 0, 1) yields the route maximizing canopy coverage. Intermediate combinations produce a continuum of compromise routes between these three extremes.
This user-adjustable weighting strategy reflects the inherently heterogeneous nature of pedestrian preferences and thermal perception. The relative importance assigned to distance, heat exposure, and shading conditions may vary considerably among individuals depending on factors such as age, health status, trip purpose, prevailing weather conditions, and personal tolerance to heat. Furthermore, pedestrian route choice research has shown that individuals do not respond uniformly to environmental information; rather, they selectively perceive, interpret, and trade-off multiple route attributes when making navigation decisions [42]. Consequently, the proposed framework is not intended to impose a universal behavioral weighting scheme but rather to provide a flexible decision-support mechanism through which users can express their own comfort–efficiency trade-offs. This perspective is consistent with research on personalized pedestrian navigation [43] and multi-criteria route selection approaches, where route preferences are explicitly treated as user-dependent rather than as fixed parameters [29,33].
Accordingly, evaluating the framework involves assessing its ability to generate routing alternatives under different preference configurations, rather than identifying a single optimal weighting combination applicable to all pedestrians.
The choice of a linear weighted formulation is deliberate. It is monotonically additive, which makes the cost compatible with classical shortest-path algorithms; it is interpretable, since each term contributes proportionally to its weight; and it is reproducible, since the normalization is defined globally across the network. Multiplicative or Pareto-based formulations were considered but rejected for this stage of the work: the multiplicative form causes a single near-zero attribute to dominate the cost in counter-intuitive ways, while a Pareto formulation would return a set of non-dominated paths rather than a single recommendation, which is at odds with the navigational use case targeted here. The linear form also aligns with the formulation adopted in comparable comfort-aware routing systems [29,33].
3.7. Pathfinding and User Interaction
Once each edge is assigned its multi-criteria cost C(e), the optimal route between an origin o and a destination t is computed by Dijkstra’s algorithm on the weighted graph G = (V, E), with edge weights given by C(e). The user interaction layer is structured as a lightweight web interface. The user selects o and t directly on a map of the network and configures the weight vector (w1, w2, w3) through three interactive sliders that auto-balance to ensure Σwi = 1. To facilitate use without prior calibration, four predefined presets are provided: Fastest (70/15/15), coolest (20/50/30), Greenest (20/30/50), and balanced (33/33/34). Once the query is submitted, Dijkstra’s algorithm computes the optimal path, which is displayed on the map alongside summary statistics: total walked distance, average LST along the path, mean canopy coverage along the path, and a normalized comfort score in [0, 100] derived from the same three attributes used in the cost formulation. The interface also enables direct comparison between routes obtained under different weight configurations, supporting both individual decision-making and the qualitative analysis of comfort-distance trade-offs at the city scale.
3.8. Implementation and Reproducibility
The full pipeline is implemented in Python (3.12). SegFormer inference uses the HuggingFace Transformers library on top of PyTorch; image post-processing relies on OpenCV and Pillow; raster operations on the LST mosaic and zonal aggregation use rasterio and geopandas; and network construction and Dijkstra routing use NetworkX. The interactive interface uses HTML/JavaScript with HTML5 Canvas rendering. All three data sources used in this study, the BD TOPO pedestrian network, the GSV viewpoints, and the airborne LST mosaic, are referenced in a common projected coordinate system (RGF93/Lambert-93, EPSG:2154) prior to integration, ensuring spatial consistency across processing stages.
4. Results
This section presents the operational results of the proposed framework. Since the main contribution of the study is a methodological framework and an implemented routing tool, the results are presented as a worked example that shows what the system produces in practice. The section reports the implemented pedestrian network, the spatial coverage of the environmental attributes, and the comparison of route alternatives generated under different user-preference configurations.
4.1. The Integrated Tool: Implementation and Network Coverage
The framework was implemented as a fully operational web-based tool covering the city center of Clermont-Ferrand. The routable graph derived from the pedestrian street network database comprises 551 nodes and 796 routable edges, fully connected as a single component. Of the 799 source segments, 600 carry a directly measured tree-canopy fraction obtained from SegFormer-B0 segmentation of Google Street View imagery, while 623 carry a directly measured land surface temperature (LST) value from the airborne thermal acquisition. The remaining segments fall outside the GSV viewpoint sample or the airborne footprint and are assigned the network-median value as a transparent fallback. Across the network, observed LST ranges from 19.5 °C to 39.1 °C and canopy fraction from 0 to 70.6%, indicating substantial spatial variability in both dimensions and confirming that routing decisions can meaningfully exploit either or both signals.
4.2. Route Comparison Results for the OD Scenario
To illustrate the application of the proposed framework, a representative origin–destination (OD) scenario was selected within the historic center of Clermont-Ferrand. The selected area corresponds to a dense and highly walkable part of the city center, characterized by compact urban morphology, intense pedestrian activity, mineral surfaces, and spatially heterogeneous vegetation cover. These characteristics make it particularly suitable for testing a routing approach that balances distance, heat exposure, and canopy-related comfort. The OD scenario is therefore used as a worked example to demonstrate how the model generates alternative routes under different user-preference configurations, rather than serving as a statistically representative sample of all possible pedestrian trips.
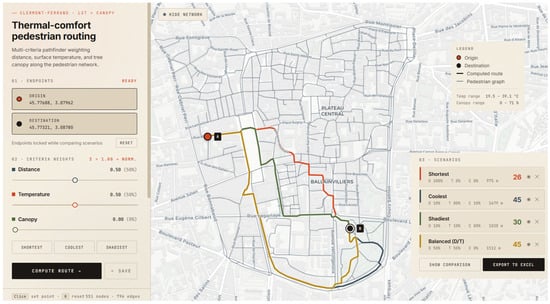
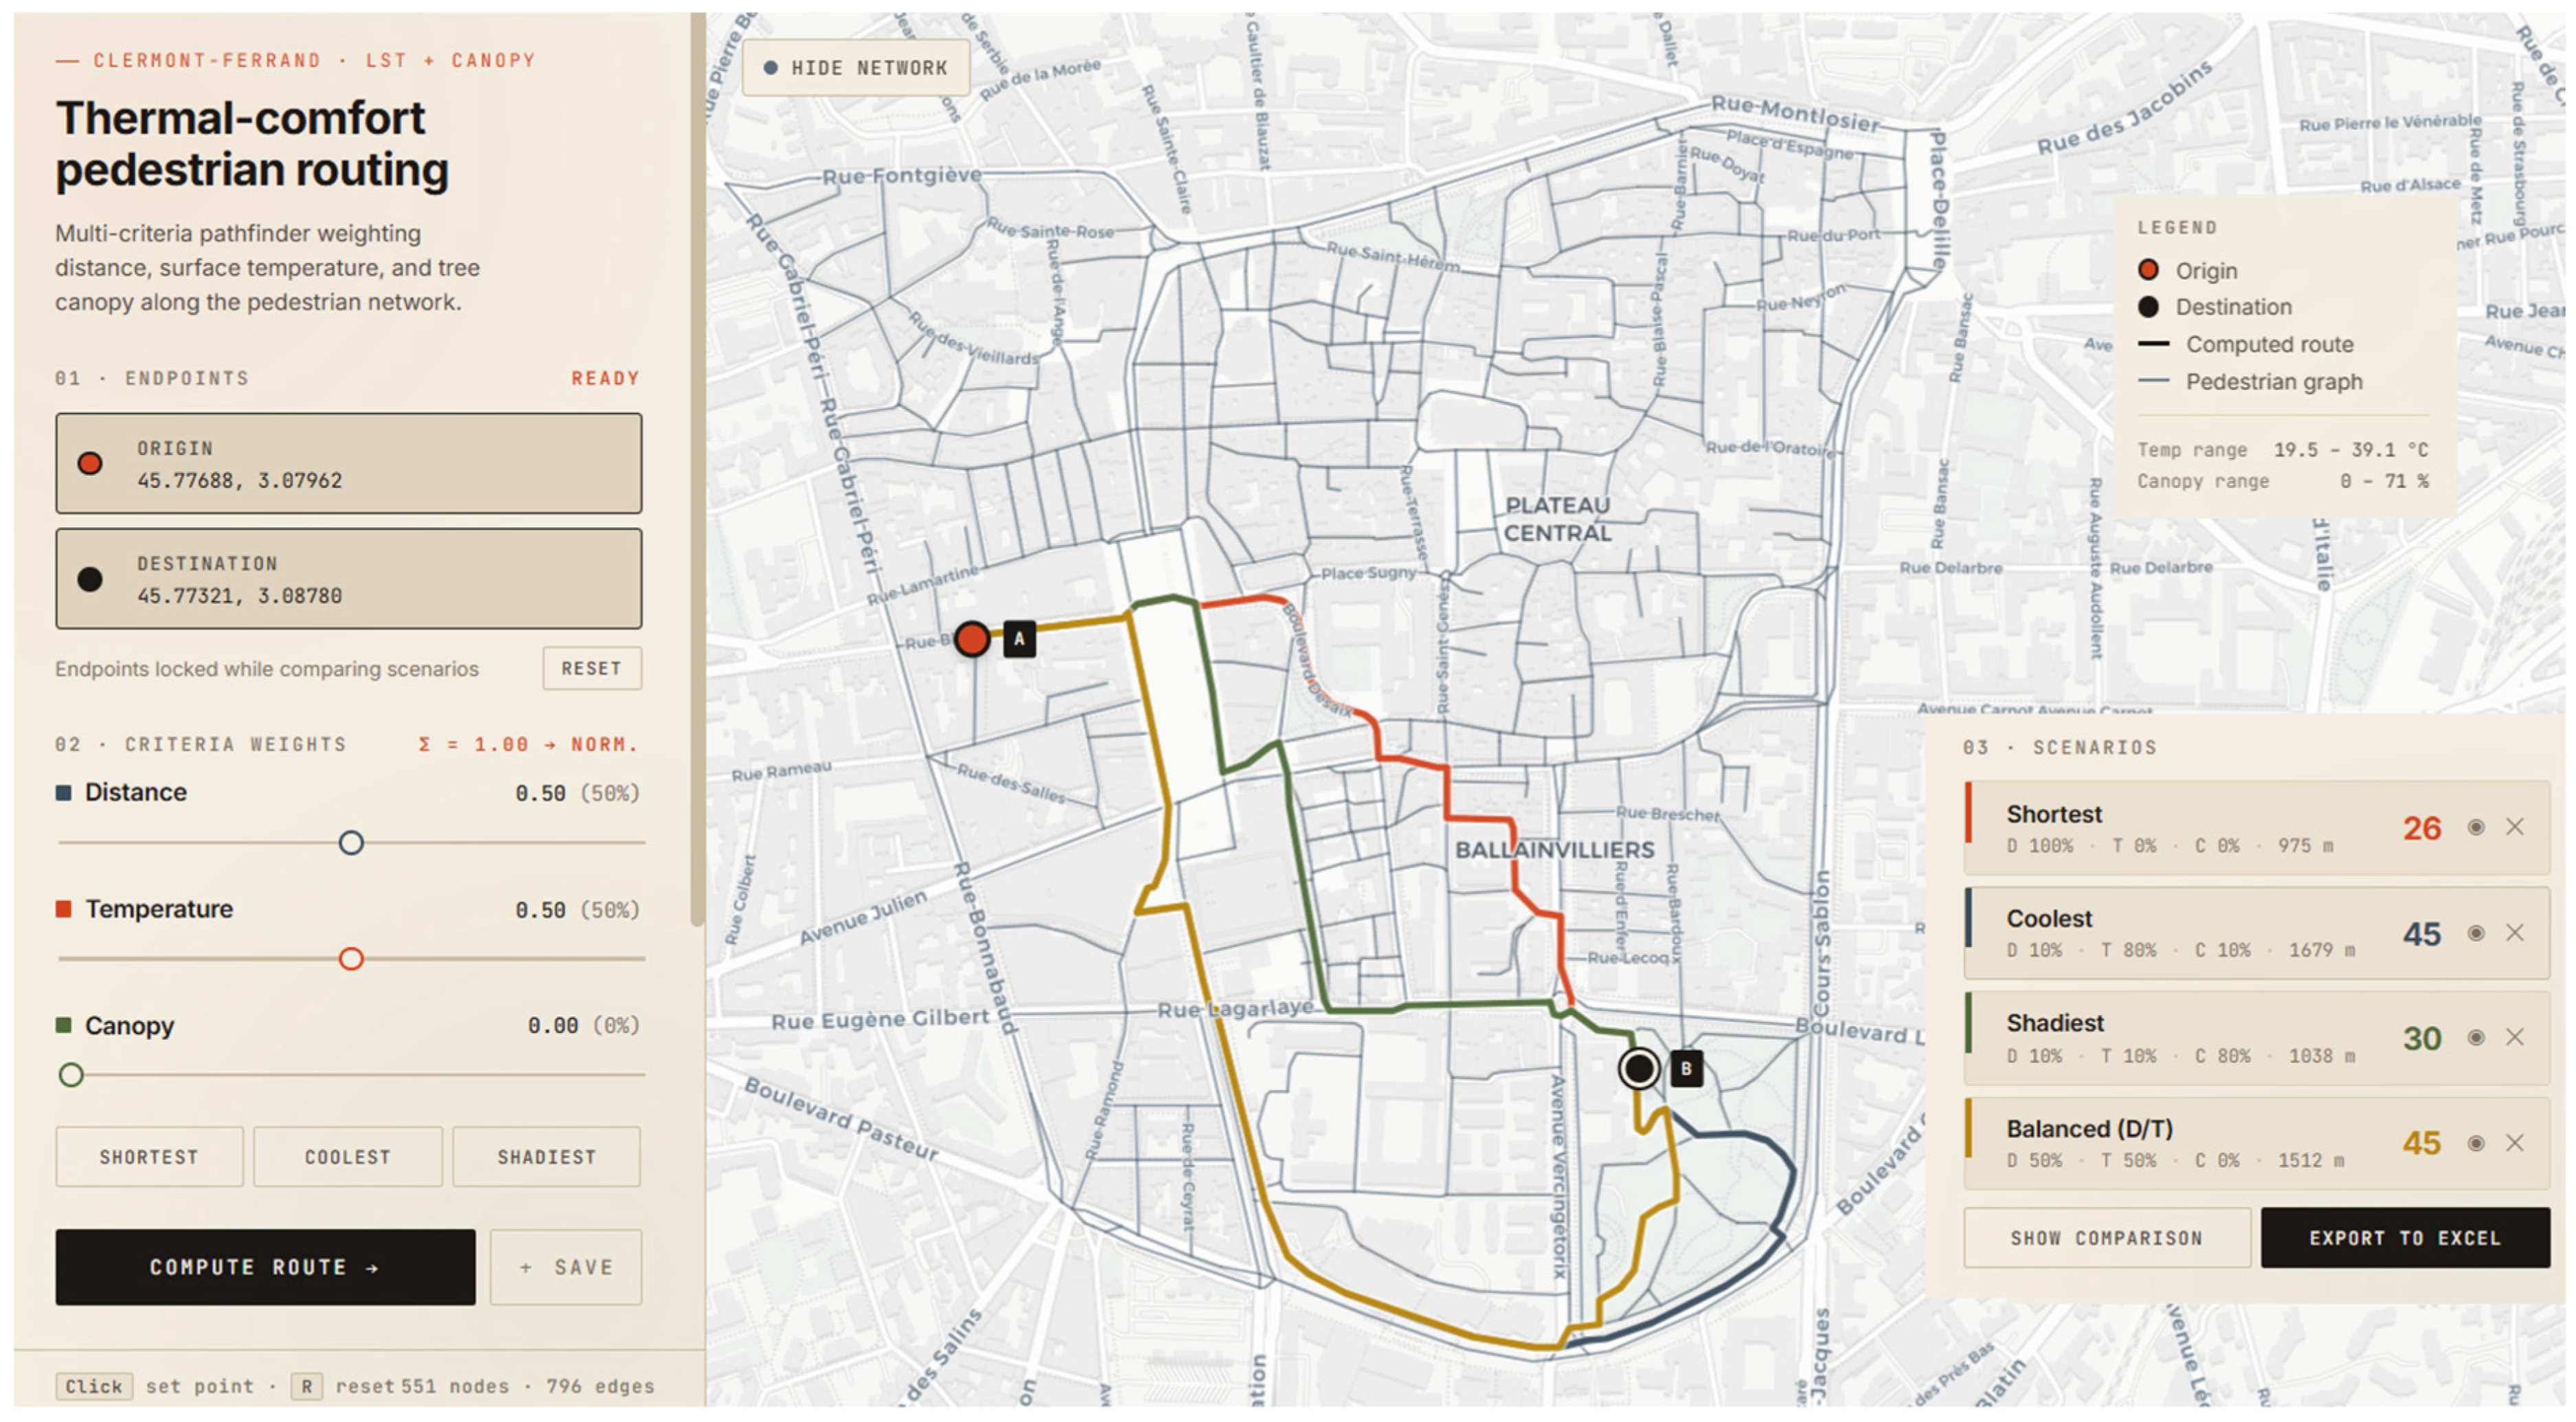
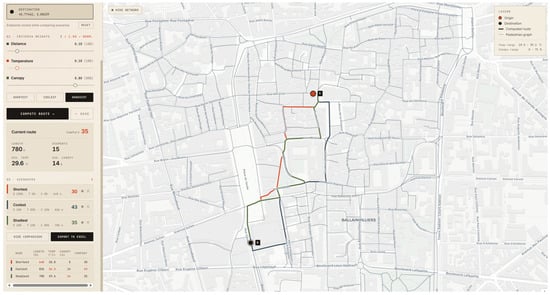
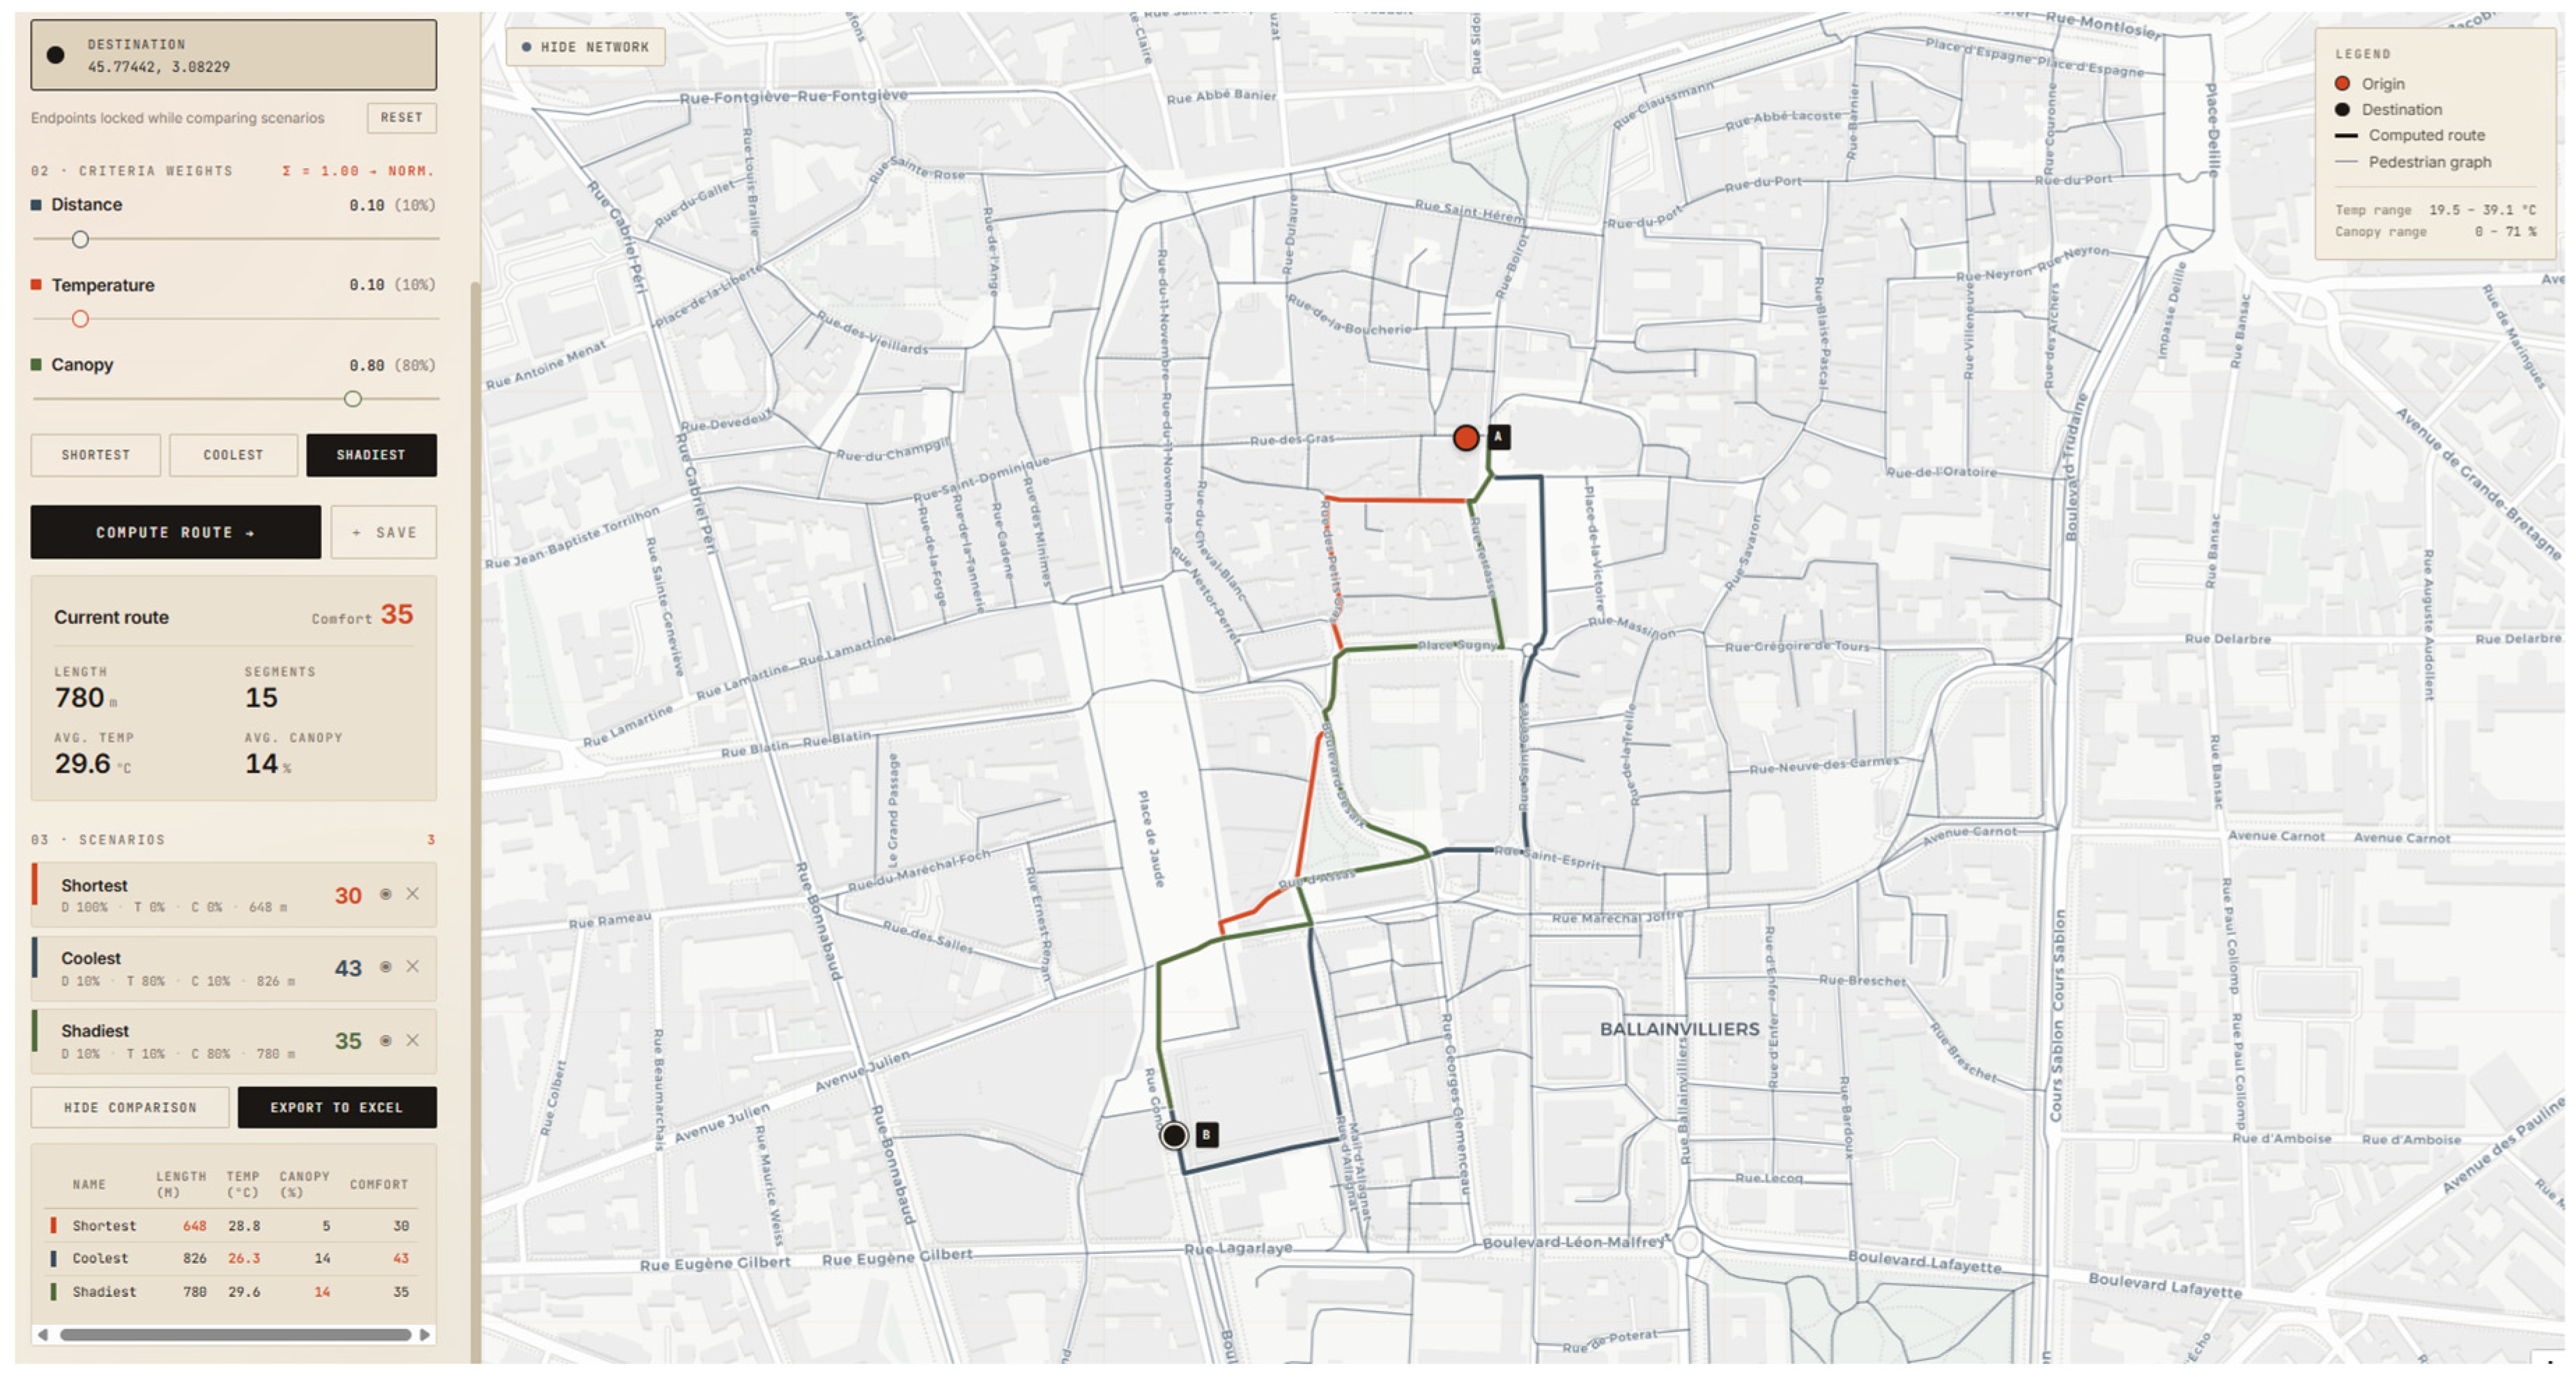
Figure 8 shows the user-facing interface of the tool. The left panel exposes the three-dimensional control surface; origin and destination; weight sliders for distance, temperature, and canopy; and four canonical presets (shortest, coolest, shadiest, balanced), together with the summary metrics of the most recent route and an accumulating list of saved scenarios. The right panel renders the pedestrian network on a Leaflet map and overlays the computed routes. The example shown corresponds to a single origin–destination pair in the city center, evaluated under all four presets, with the resulting routes overlaid for visual comparison.
Figure 8.
The thermal-comfort pedestrian routing tool applied to an origin–destination pair in central Clermont-Ferrand.
The four scenarios computed for this OD pair are summarized in Table 2. They illustrate the range of trade-offs that the user can navigate between geometric efficiency, exposure to elevated surface temperatures, and pedestrian-perspective canopy.
Table 2.
Summary metrics of four routing scenarios for a single OD pair (city center of Clermont-Ferrand). Weights (D/T/C) refer to distance, temperature, and canopy.
Three observations emerge from this single OD pair. First, the trade-offs are substantial and non-trivial: minimizing thermal exposure (coolest) produces a route 72% longer than the geometric shortest path, while reducing the average LST by nearly 5 °C and almost tripling the canopy coverage along the route. Second, the comparison between coolest and balanced (D/T) shows that a 50/50 weighting between distance and temperature recovers almost the same average LST (26.11 °C vs. 26.08 °C) and almost the same average canopy (16.0% vs. 16.5%) on a route that is 10% shorter, suggesting that the largest gains in thermal comfort are obtained at moderate weight settings rather than at the extreme. Third, the shadiest preset yields a smaller benefit than the coolest in this particular pair, gaining only +3.3 percentage points of canopy over the shortest path, which is a faithful reflection of the underlying network, where canopy is sparse in the dense historic core and the algorithm has limited material to work with on this dimension. Together, these observations confirm that the tool surfaces real, interpretable trade-offs rather than producing artifacts of normalization.
To further examine whether these trade-offs are specific to the initial OD pair, two OD explanatory examples were tested within the same study area using the same three routing configurations: shortest, coolest, and shadiest.
Explanatory Example 1 (Figure 9) illustrates a clear trade-off between heat reduction, canopy exposure, and route length. Compared with the shortest route, the coolest route reduces average LST by approximately 2.5 °C, but increases route length from 648 m to 826 m (Table 3). The shadiest route achieves a similar increase in canopy coverage while requiring a shorter detour than the coolest route, which shows that the relative efficiency of each preference setting depends on the local distribution of heat and vegetation along the network.
Figure 9.
Explanatory Example 1 comparing shortest, coolest, and shadiest routes in central Clermont-Ferrand.
Table 3.
Summary metrics of routing alternatives in Explanatory Example 1. Weights (D/T/C) refer to distance, temperature, and canopy.
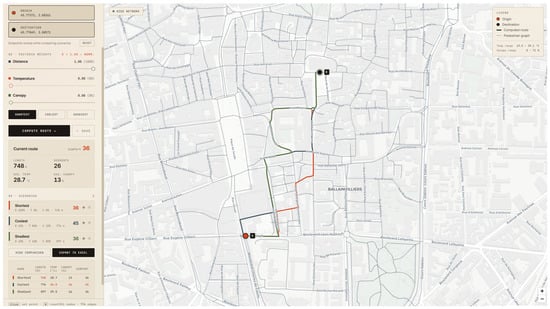
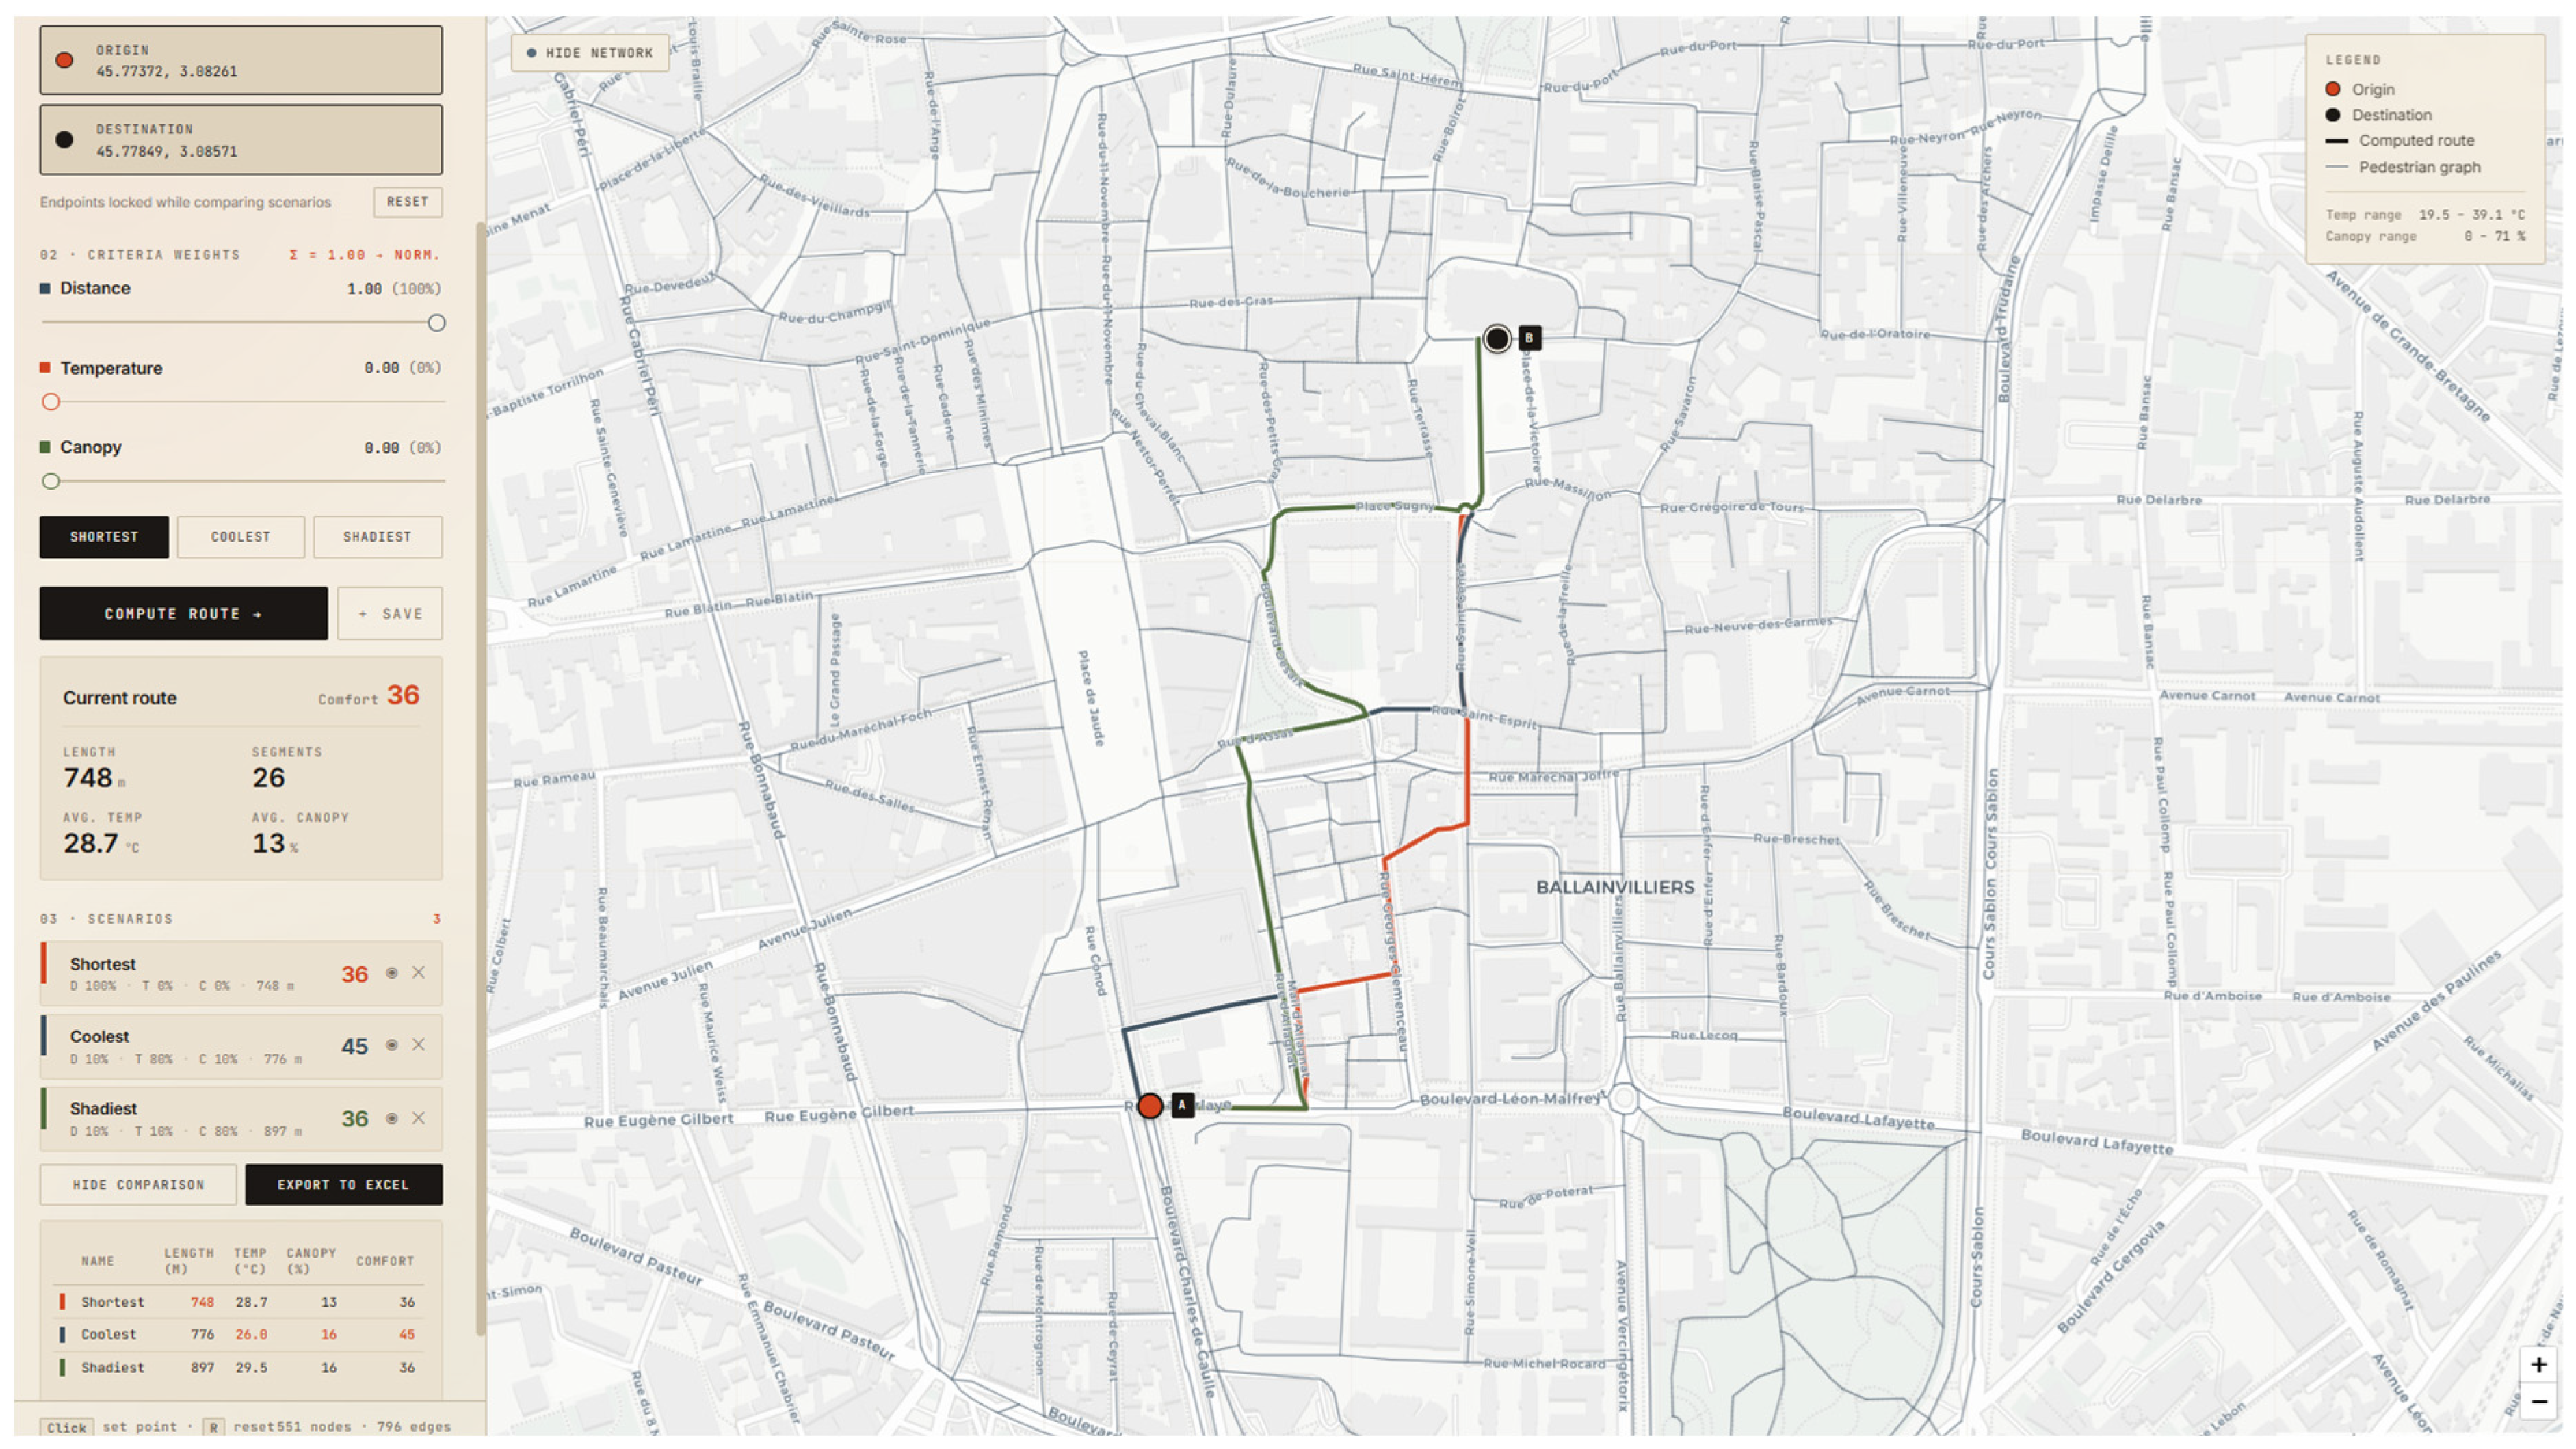
Explanatory Example 2 (Figure 10) shows a different balance between the same criteria. The coolest route again reduces average LST by approximately 2.7 °C compared with the shortest route, but with only a limited increase in distance. In contrast, the shadiest route increases canopy coverage but requires a larger detour (Table 4). This confirms that the distance cost of comfort-oriented routing is not fixed but depends on the spatial configuration of the pedestrian network and environmental attributes.
Figure 10.
Explanatory Example 2 comparing shortest, coolest, and shadiest routes in central Clermont-Ferrand.
Table 4.
Summary metrics of routing alternatives in Explanatory Example 2. Weights (D/T/C) refer to distance, temperature, and canopy.
These examples strengthen the interpretation of the tool as a generator of comfort–efficiency trade-offs across multiple OD pairs, while a systematic large-scale OD sensitivity analysis remains a direction for future work.
5. Discussion
This section discusses the broader significance of the results and situates the proposed framework within the wider context of comfort-aware pedestrian routing. Building on the operational outcomes reported in Section 4, the discussion interprets the methodological contribution of the tool, its scalability, and its limitations, and introduces the broader concept of user-comfort pathfinding.
5.1. What the Tool Delivers Methodologically: Methodological Contribution
Beyond the numerical example, the tool itself is the principal contribution of this study. We highlight three capabilities that distinguish it from descriptive comfort-aware mapping studies and from prior comfort-aware routing approaches.
Live, user-controllable trade-offs. In contrast to systems that compute a single comfort-aware path with hard-coded weights or expert-elicited preferences [29], the proposed tool exposes the weight vector to the user as a continuous control surface. Pedestrians can therefore configure their own trade-off in real time as a function of their personal sensitivity to heat, the time of day, the urgency of the trip, or contextual constraints (e.g., presence of vulnerable companions, proximity of a heatwave). The four canonical presets—shortest, coolest, shadiest, and balanced—provide pedagogical anchor points but do not exhaust the space; any convex combination of weights is admissible, and the comparison table accumulates as many scenarios as the user wishes to construct.
Empirically grounded inputs. Existing thermal-routing studies typically rely on numerical microclimatic simulations (ENVI-met, SOLWEIG) or modeled comfort indices (UTCI, PET) computed from coarse meteorological inputs. The present framework instead consumes two empirical signals: a directly measured airborne LST mosaic and a pedestrian-perspective canopy fraction extracted from on-the-ground imagery. Although LST is not air temperature and canopy fraction is not a radiative-transfer simulation—limitations we discuss in Section 5.4—the resulting indicators are closer to what pedestrians perceive than indices derived from upper-air or rooftop weather data.
Reproducible, scenario-based analysis. The tool’s saved-scenarios mechanism, side-by-side comparison table, and Excel export turn what would otherwise be ephemeral interactive queries into structured, archivable records. A planner, a researcher, or a participant in a stakeholder workshop can save a sequence of scenarios for the same OD pair, export them as an .xlsx workbook, and re-open them later for documentation, reporting, or reference records. This transforms the tool from a demonstration into an analytical instrument: the same workflow used here for a single OD pair can be applied at scale to systematic origin–destination samplings, comparative neighborhood studies, or before-and-after assessments of urban interventions.
5.2. Toward User-Comfort Pathfinding: Introducing a Generic Concept
The most consequential outcome of this work is conceptual, not numerical. By formalizing routing around a multi-criteria edge cost in which any pedestrian-relevant attribute can occupy a weighted slot, the framework opens the door to a broader notion that we propose to call user-comfort pathfinding. In this study, we instantiate it on the thermal dimension, with two complementary signals (LST and canopy); however, the architecture is intrinsically agnostic to the nature of the attributes, and the same machinery can, in principle, accommodate any factor that contributes to a pedestrian’s experience of a route.
The English word comfort itself is broader than thermal sensation. The Oxford English Dictionary [44] distinguishes three senses of the term that, taken together, frame the conceptual scope of the proposed paradigm:
- (i)
- Mental satisfaction and restfulness: the cognitive and affective dimension, related to the perceived pleasantness, safety, and esthetic quality of the environment a pedestrian moves through;
- (ii)
- Physical refreshment and material well-being: the bodily dimension, encompassing thermal comfort, ergonomic walking conditions, air quality, and other factors that affect the body directly during the journey;
- (iii)
- The conditions which produce or promote the state of being comfortable: the environmental dimension, recognizing that comfort is not only a sensation but also a property of the surrounding urban form: the presence of shade, the geometry of sidewalks, the absence of noise, or the availability of resting points along the route.
In the present paper we have implemented an explicit, measurable proxy for the second of these senses, the bodily dimension of comfort under thermal stress, through the combination of LST and canopy fraction along a route. We have also touched the third, environmental sense indirectly, in the form of the canopy variable, which represents one of the urban-form conditions that promote comfort. The first sense, the cognitive and affective dimension, remains beyond the scope of this study; quantifying it would require additional data sources (perceptual surveys, audio measurements, semantic analysis of streetscape imagery) that we discuss as future work in Section 5.4.
A further extension of user-comfort pathfinding would be to incorporate user-generated experiential data into the routing logic. This direction is supported by studies such as Quercia et al. [27], who used crowdsourced perceptions to recommend routes that are not only short but also beautiful, quiet, and pleasant, as well as by recent street-view-based approaches that combine user ratings, AI analysis, and visual urban attributes to assess perceived safety, inclusivity, greenery [45] (Mushkani and Koseki, 2025), sidewalk condition, seating, maintenance, and façade or building-exterior appearance [46] (Liang Xiucheng et al., 2024). In future implementations, pedestrians could provide feedback on perceived heat, shade, safety, pleasantness, walking difficulty, or visual comfort after completing a route. Aggregated and anonymized feedback could then be used to update segment-level comfort attributes, calibrate the relative weights assigned to different criteria, or identify locations where modeled indicators diverge from lived pedestrian experience. Such integration would transform the framework from a system based only on observed environmental layers into an adaptive routing approach informed by both measured urban conditions and user perception, provided that appropriate privacy and consent procedures are followed.
This explicit alignment between an operational routing framework and a multi-faceted definition of comfort has, to the best of our knowledge, not been articulated in the prior literature. Existing comfort-aware routing studies operate at the level of a specific physiological index [31,32] or a curated set of environmental factors [29], without explicitly framing their work as a step toward a more general notion of pedestrian comfort. Our framework makes this generality explicit and provides technical scaffolding to extend it.
5.3. Scalability of the Framework
The proposed framework is scalable along two complementary axes: methodologically, in the dimensions of comfort it can accommodate, and geographically, in the urban contexts to which it can be transferred.
Methodological scalability. The multi-criteria edge cost C(e) = Σi wi · i(e) is a convex combination of normalized, pedestrian-relevant attributes. In the present study, i ∈ {distance, temperature, canopy}; however, the formulation is intrinsically extensible to additional attributes whenever the corresponding spatial data become available. Several promising candidates can be identified considering the three-fold definition of comfort introduced above. For the bodily dimension, air quality (PM2.5, NO2) along each segment, sidewalk slope, surface roughness, and noise exposure could be added as additional weighted terms. For the cognitive and affective dimension, perceived safety, derivable from streetscape imagery via deep learning [27], esthetic quality, crowding, lighting at night, and proximity to amenities could similarly enter the cost. Each new dimension extends the framework without altering its core logic: the algorithm remains a Dijkstra search on a weighted graph; only the attribute vector and the weight vector change. This compositional property makes user-comfort pathfinding a natural common substrate for studies that have so far developed in disciplinary isolation.
Geographic scalability. The framework requires three input layers: a pedestrian network (municipal database or OpenStreetMap), a thermal layer at adequate resolution (airborne thermal mosaic in our case; Landsat or ECOSTRESS at coarser scales for larger areas), and pedestrian-perspective imagery (Google Street View in our case; Mapillary or proprietary equivalents elsewhere). All three data sources are increasingly available across cities of the Global North, and partial substitutes exist for cities where one or another is missing. The transformer-based segmentation pipeline is itself transferable: SegFormer-B0 was used here without fine-tuning, and its pre-training on ADE20K provides reasonable performance on European street scenes; performance in non-European urban contexts could be improved by fine-tuning on a small annotated subset, which the modular architecture of the pipeline accommodates without modification of the routing logic. Replicating the framework in a new study area therefore works to (i) prepare the three input layers in the local CRS, (ii) run the SegFormer pipeline on the local GSV/Mapillary imagery, and (iii) re-use the routing backend and frontend without code changes.
These two scalability axes are independent. A study can extend the methodological scope (adding noise or air quality dimensions) without changing the geographic scope, or replicate the geographic scope (a new city) without changing the methodological scope. Both extensions are first-class citizens of the framework rather than departures from it.
5.4. Limitations and Avenues for Future Work
Several limitations should be acknowledged. First, the thermal component of the cost function relies on land surface temperature (LST) derived from airborne MWIR imagery. Although LST provides a high-resolution spatial indicator of surface heat accumulation, it does not directly represent pedestrian-level air temperature, mean radiant temperature, or a physiological thermal comfort index. Future work could therefore compare airborne-derived LST with pedestrian-level thermal measurements, microclimatic model outputs, and perceived thermal comfort surveys. Field measurements of pedestrian-level air temperature, mean radiant temperature, humidity, and wind conditions would help characterize the relationship between airborne-derived LST and human thermal exposure. Such data would also support calibration of the routing model and strengthen the physiological interpretation of the generated route alternatives.
Second, the thermal dataset represents a single late-afternoon heatwave acquisition rather than diurnal or seasonal conditions. Routes are therefore optimized for one specific thermal state. Multi-temporal airborne acquisitions, repeated measurements under different weather conditions, or integration with microclimatic models such as SOLWEIG could improve temporal representativeness.
Third, the canopy fraction was estimated from a single front-facing GSV image per street segment. While this strategy is simple and reproducible, it captures only part of the surrounding streetscape and may introduce orientation-related bias. Future implementations could improve canopy representativeness through multi-heading image capture, orientation-aware camera alignment based on street geometry, or panoramic image processing.
Fourth, SegFormer-B0 was used without fine-tuning on local GSV imagery, and no manually annotated GSV tree masks or independent field-survey canopy datasets were available for supervised accuracy assessment. As a result, occasional misclassification of vegetation-related features may remain. Future work could annotate a representative subset of GSV images or collect field-based canopy observations to evaluate segmentation performance using precision, recall, F1-score, and IoU, as well as to support fine-tuning of SegFormer on local street-view imagery.
Fifth, the routing evaluation is based on a representative origin–destination scenario that is used to demonstrate the operational behavior of the framework. Future work could extend the evaluation through systematic large-scale OD sampling across the full study area and through application to additional urban contexts. This would allow statistical comparison of route characteristics, including distance, average LST, canopy coverage, and comfort cost scores across many route scenarios and weighting configurations.
A distinction should also be made between technical benchmarking and behavioral validation. The present study technically compares routing outcomes generated on the same network under different weighting configurations, including the conventional shortest-path baseline. However, it does not benchmark the framework against independent comfort-routing algorithms, nor does it validate the generated routes against observed pedestrian choices. Future work could address these two dimensions separately by comparing the model with additional implementable baselines and by validating route preferences using surveys, observed trajectories, or discrete choice experiments.
Finally, the user-adjustable weighting scheme was designed as a flexible preference framework rather than as a behaviorally calibrated route choice model. Future research could incorporate pedestrian surveys, observed route choice data, or discrete choice experiments to compare user-defined weights with population-based preference models. Additional pedestrian–environment factors, such as sidewalk quality, accessibility, safety, air quality, and noise, could also be incorporated to extend the framework beyond thermal-comfort-aware routing toward broader user-comfort pathfinding.
These limitations do not undermine the principal contribution of the study: the development of an operational user-comfort routing framework that integrates heterogeneous environmental data sources into a routable pedestrian network. Rather, they define clear directions for improving the temporal, behavioral, and empirical validation of the proposed approach.
6. Conclusions
This study presented a methodological framework and an operational tool for thermal-comfort-aware pedestrian routing in urban environments increasingly affected by urban heat island dynamics. The framework integrates three independent and complementary data sources: airborne-derived land surface temperature, pedestrian-perspective canopy coverage extracted from Google Street View imagery using SegFormer-B0, and a topologically cleaned pedestrian network. These data sources are combined within a user-adjustable multi-criteria edge-cost formulation, allowing Dijkstra’s algorithm to generate routes that balance distance, exposure to elevated surface temperatures, and visible tree-canopy coverage.
When applied to the historic center of Clermont-Ferrand, the framework demonstrates how heterogeneous environmental data can be translated into route alternatives with different comfort–efficiency trade-offs. The results show that comfort-aware routing does not produce a single universally optimal path, but rather a set of alternatives that depend on the relative importance assigned to distance, heat exposure, and canopy coverage. In this sense, the proposed tool supports a more human-centered interpretation of pedestrian routing, where environmental quality is considered alongside geometric efficiency.
Beyond this case study, the work contributes to the broader concept of user-comfort pathfinding. In the present implementation, comfort is represented through thermal exposure and pedestrian-perspective canopy coverage. However, the same cost-function structure could incorporate additional pedestrian-relevant attributes, such as sidewalk quality, accessibility, safety, air quality, noise, lighting, or perceived streetscape comfort, provided that suitable spatial data are available. The framework is therefore extensible both methodologically, through the inclusion of additional comfort dimensions, and geographically, through application to other urban contexts where pedestrian networks, thermal layers, and street-level imagery can be obtained.
Several directions remain important for future research. Future work should improve the temporal representativeness of the thermal layer through multi-temporal acquisitions or complementary microclimatic modelling, strengthen the validation of the canopy layer through annotated GSV samples or field-based canopy observations, extend the evaluation through systematic OD sampling and application to additional cities, and incorporate pedestrian surveys, observed route-choice data, or discrete choice experiments to calibrate user preferences. These extensions would support stronger empirical validation and help develop the framework from a methodological demonstration into a more comprehensive user-comfort pathfinding approach for climate-resilient pedestrian navigation.
Supplementary Materials
The following supporting information can be downloaded at: https://www.mdpi.com/article/10.3390/ijgi15070313/s1, Video S1: Pathfinding Tool Demonstration.
Author Contributions
Conceptualization, Saffa Mansour and Aurelie Talon; methodology, Saffa Mansour, Mohammed Itair and Rani El Meouche; software, Saffa Mansour and Mohammed Itair; validation, Rani El Meouche, Aurelie Talon and Pierre Breul; formal analysis, Saffa Mansour and Mohammed Itair; investigation, Saffa Mansour, Mohammed Itair and Aurelie Talon; data curation, Saffa Mansour and Mohammed Itair; writing—original draft preparation, Saffa Mansour and Mohammed Itair; writing—review and editing, Saffa Mansour, Mohammed Itair, Rani El Meouche and Aurelie Talon; visualization, Saffa Mansour and Mohammed Itair; supervision, Rani El Meouche, Aurelie Talon and Pierre Breul. All authors have read and agreed to the published version of the manuscript.
Funding
This research received no external funding.
Data Availability Statement
The data presented in this study are available upon reasonable request from the corresponding author. A supplementary video is provided to demonstrate the interactive use of the routing tool (Pathfinding Tool Demonstration Video) (See the Supplementary Material). The video illustrates how a user selects an origin and destination, adjusts the distance, temperature, and canopy weights, applies the predefined routing presets, and visually compares the resulting route alternatives on the map. It is intended to complement Figure 8 by showing the operational workflow of the implemented tool rather than only its static interface.
Acknowledgments
The authors gratefully acknowledge Clermont Auvergne Métropole for their support in providing essential datasets, particularly the high-resolution thermal imagery. We also extend our sincere thanks to GAPAVE for supporting the doctoral study of the first author.
Conflicts of Interest
The authors declare no conflicts of interest.
References
- Zhao, H.; Xu, G.; Shi, Y.; Zhai, Y.; Zhao, L.; Brown, R.D. Evaluation of Pedestrian Thermal Comfort from a Whole-Trip Perspective: An Outdoor Empirical Study. Sustain. Cities Soc. 2024, 115, 105872. [Google Scholar] [CrossRef] [Scilit]
- Taher, H.; Elsharkawy, H.; Rashed, H.F. Urban Green Systems for Improving Pedestrian Thermal Comfort and Walkability in Future Climate Scenarios in London. Buildings 2024, 14, 651. [Google Scholar] [CrossRef] [Scilit]
- Krüger, E.L.; Costa, T. Interferences of Urban Form on Human Thermal Perception. Sci. Total Environ. 2019, 653, 1067–1076. [Google Scholar] [CrossRef] [Scilit] [PubMed]
- Lu, Y.; Sarkar, C.; Xiao, Y. The Effect of Street-Level Greenery on Walking Behavior: Evidence from Hong Kong. Soc. Sci. Med. 2018, 208, 41–49. [Google Scholar] [CrossRef] [Scilit] [PubMed]
- Li, X.; Zhang, C.; Li, W.; Ricard, R.; Meng, Q.; Zhang, W. Assessing Street-Level Urban Greenery Using Google Street View and a Modified Green View Index. Urban For. Urban Green. 2015, 14, 675–685. [Google Scholar] [CrossRef] [Scilit]
- Basu, R.; Colaninno, N.; Alhassan, A.; Sevtsuk, A. Hot and Bothered: Exploring the Effect of Heat on Pedestrian Route Choice Behavior and Accessibility. Cities 2024, 155, 105435. [Google Scholar] [CrossRef] [Scilit]
- Melnikov, V.R.; Christopoulos, G.I.; Krzhizhanovskaya, V.V.; Lees, M.H.; Sloot, P.M.A. Behavioural Thermal Regulation Explains Pedestrian Path Choices in Hot Urban Environments. Sci. Rep. 2022, 12, 2441. [Google Scholar] [CrossRef] [Scilit] [PubMed]
- Hua, J.; Cai, M.; Shi, Y.; Ren, C.; Xie, J.; Chung, L.C.H.; Lu, Y.; Chen, L.; Yu, Z.; Webster, C. Investigating Pedestrian-Level Greenery in Urban Forms in a High-Density City for Urban Planning. Sustain. Cities Soc. 2022, 80, 103755. [Google Scholar] [CrossRef] [Scilit]
- Zhu, J.; Huang, Y.; Cao, Z.; Zhang, Y.; Ding, Y.; Du, J. Evaluating Urban Greenery Through the Front-Facing Street View Imagery: Insights from a Nanjing Case Study. ISPRS Int. J. Geo-Inf. 2025, 14, 287. [Google Scholar] [CrossRef] [Scilit]
- Buo, I.; Khan, W.H.; Crabtree, E.; Emmott, F.; Hariyani, D.; Middel, A. Cool Routes: Real-Time Human Thermal Exposure Routing. Build. Environ. 2026, 298, 114622. [Google Scholar] [CrossRef] [Scilit]
- Anguelov, D.; Dulong, C.; Filip, D.; Frueh, C.; Lafon, S.; Lyon, R.; Ogale, A.; Vincent, L.; Weaver, J. Google Street View: Capturing the World at Street Level. Computer 2010, 43, 32–38. [Google Scholar] [CrossRef] [Scilit]
- Han, X.; Wang, L.; Seo, S.H.; He, J.; Jung, T. Measuring Perceived Psychological Stress in Urban Built Environments Using Google Street View and Deep Learning. Front. Public Health 2022, 10, 891736. [Google Scholar] [CrossRef] [Scilit] [PubMed]
- Li, X.; Ratti, C.; Seiferling, I. Mapping Urban Landscapes Along Streets Using Google Street View. In Proceedings of the Advances in Cartography and GIScience; Peterson, M.P., Ed.; Springer International Publishing: Cham, Switzerland, 2017; pp. 341–356. [Google Scholar]
- European Commission. Active Mobility: Walking and Cycling—Mobility and Transport. Available online: https://transport.ec.europa.eu/transport-themes/urban-transport/active-mobility-walking-and-cycling_en (accessed on 10 May 2026).
- Abuwaer, N.; Ullah, S.; Vinodhkumar, B.; Al-Ghamdi, S.G. Walkability under the Influence of Extreme Temperatures: The Impact of Climate Change on Outdoor Thermal Discomfort in Saudi Arabia. City Environ. Interact. 2025, 28, 100241. [Google Scholar] [CrossRef] [Scilit]
- Voogt, J.A.; Oke, T.R. Thermal Remote Sensing of Urban Climates. Remote Sens. Environ. 2003, 86, 370–384. [Google Scholar] [CrossRef] [Scilit]
- Weng, Q. Thermal Infrared Remote Sensing for Urban Climate and Environmental Studies: Methods, Applications, and Trends. ISPRS J. Photogramm. Remote Sens. 2009, 64, 335–344. [Google Scholar] [CrossRef] [Scilit]
- Goldblatt, R.; Addas, A.; Crull, D.; Maghrabi, A.; Levin, G.G.; Rubinyi, S. Remotely Sensed Derived Land Surface Temperature (LST) as a Proxy for Air Temperature and Thermal Comfort at a Small Geographical Scale. Land 2021, 10, 410. [Google Scholar] [CrossRef] [Scilit]
- Scolio, M.; Kremer, P.; Zhang, Y.; Shakya, K.M. Spatial-Temporal Modeling of the Relationship between Surface Temperature and Air Temperature in Metropolitan Urban Systems. Urban Clim. 2024, 55, 101921. [Google Scholar] [CrossRef] [Scilit]
- Sun, T.; Sun, R.; Chen, L. The Trend Inconsistency between Land Surface Temperature and Near Surface Air Temperature in Assessing Urban Heat Island Effects. Remote Sens. 2020, 12, 1271. [Google Scholar] [CrossRef] [Scilit]
- Urban, J.; Pikl, M.; Zemek, F.; Novotný, J. Using Google Street View Photographs to Assess Long-Term Outdoor Thermal Perception and Thermal Comfort in the Urban Environment during Heatwaves. Front. Environ. Sci. 2022, 10, 878341. [Google Scholar] [CrossRef] [Scilit]
- Li, X.; Ratti, C.; Seiferling, I. Quantifying the Shade Provision of Street Trees in Urban Landscape: A Case Study in Boston, USA, Using Google Street View. Landsc. Urban Plan. 2018, 169, 81–91. [Google Scholar] [CrossRef] [Scilit]
- Cai, B.Y.; Li, X.; Seiferling, I.; Ratti, C. Treepedia 2.0: Applying Deep Learning for Large-Scale Quantification of Urban Tree Cover. arXiv 2018. [Google Scholar] [CrossRef] [Scilit]
- Biljecki, F.; Zhao, T.; Liang, X.; Hou, Y. Sensitivity of Measuring the Urban Form and Greenery Using Street-Level Imagery: A Comparative Study of Approaches and Visual Perspectives. Int. J. Appl. Earth Obs. Geoinf. 2023, 122, 103385. [Google Scholar] [CrossRef] [Scilit]
- Transform Transport. Exploring Transport Security Perception with NLP and Geo-Social Media. 2025. Available online: https://transformtransport.org/research/exploring-transport-security-perception-with-nlp-and-geo-social-media/ (accessed on 10 May 2026).
- Xie, E.; Wang, W.; Yu, Z.; Anandkumar, A.; Alvarez, J.M.; Luo, P. SegFormer: Simple and Efficient Design for Semantic Segmentation with Transformers. arXiv 2021. [Google Scholar] [CrossRef] [Scilit]
- Quercia, D.; Schifanella, R.; Aiello, L.M. The Shortest Path to Happiness: Recommending Beautiful, Quiet, and Happy Routes in the City. In Proceedings of the 25th ACM Conference on Hypertext and Social Media, Santiago, Chile, 1–4 September 2014. [Google Scholar]
- Bolívar-Anillo, H.J.; Benites, S.V.; Almeida, G.R.; Llanos, S.d.J.O.; Taba-Charris, V.; Acuña-Ruiz, K.A.; Vargas, B.S.R.; Aguillón, P.F.C.; Moreno, H.S.; Iglesias-Navas, M.A.; et al. Addressing Increased Temperatures in Cities: Determination of Pedestrian Routes with Thermal Comfort in Barranquilla, Colombia. Sustainability 2025, 17, 5211. [Google Scholar] [CrossRef] [Scilit]
- Al Shammas, T.; Gullón, P.; Klein, O.; Escobar, F. Development of a GIS-Based Walking Route Planner with Integrated Comfort Walkability Parameters. Comput. Environ. Urban Syst. 2023, 103, 101981. [Google Scholar] [CrossRef] [Scilit]
- Neset, T.-S.; Navarra, C.; Graça, M.; Opach, T.; Wilk, J.; Wallin, P.; Andersson, L.; Santos Cruz, S.; Monteiro, A.; Rød, J.K. Navigating Urban Heat—Assessing the Potential of a Pedestrian Routing Tool. Urban Clim. 2022, 46, 101333. [Google Scholar] [CrossRef] [Scilit]
- Ma, X.; Zeng, T.; de Dear, R.; Xie, Y.; Yuan, C.; Lu, S. Active Route Choice to Minimize Pedestrian Thermal Discomfort in a High-Density Subtropical City. Sustain. Cities Soc. 2025, 131, 106697. [Google Scholar] [CrossRef] [Scilit]
- Wen, J.; Abuhani, D.A.; Mazzarello, M.; Duarte, F.; Norford, L.; Xu, R.; Wong, N.H.; Ratti, C. Walking Smart in the Heat: A Dynamic Shade-Oriented Pathfinding Approach to Enhance Pedestrian Comfort in Arid Cities. Comput. Environ. Urban Syst. 2025, 122, 102337. [Google Scholar] [CrossRef] [Scilit]
- Brito, M.; Martins, B.; Santos, C.; Medeiros, I.; Araujo, F.; Seruffo, M.; Oliveira, H.M.; Cerqueira, E.; Rosário, D. Personalized Experience-Aware Multi-Criteria Route Selection for Smart Mobility. In Proceedings of the 41st Brazilian Symposium on Computer Networks and Distributed Systems (SBRC 2023), Brasília, Brazil, 22–26 May 2023. [Google Scholar]
- National Institute of Geographic and Forest Information (IGN) IGN. BD TOPO. Available online: https://cartes.gouv.fr/rechercher-une-donnee/dataset/IGNF_BD-TOPO?redirected_from=geoservices.ign.fr (accessed on 10 May 2026).
- Extreme Weather Watch. Clermont-Ferrand Weather Records. Available online: https://www.extremeweatherwatch.com/cities/clermont-ferrand (accessed on 10 May 2026).
- French Public Health Agency. Public Health Bulletin on the Heat Wave in Auvergne-Rhône-Alpes: Summer 2022 Report. Available online: https://www.santepubliquefrance.fr/en/regions-et-territoires/auvergne-rhone-alpes/regional-bulletin/public-health-bulletin-heat-wave-auvergne-rhone-alpes-summer-2022-report (accessed on 10 May 2026).
- Clermont Auvergne Metropolis. Thermographie 1 m—Clermont-Ferrand—Été 2024. Available online: https://www.data.gouv.fr/datasets/thermographie-1-m-clermont-ferrand-ete-2024 (accessed on 10 May 2026).
- Aerodata France. Clermont_2024_Thermo_Rapport_Mission (3).Pdf. Available online: https://drive.uca.fr/lib/7d6ced64-79c9-47ff-bed7-49887dfa6eea/file/Clermont_2024_thermo_rapport_mission%20(3).pdf (accessed on 10 May 2026).
- Zhou, B.; Zhao, H.; Puig, X.; Xiao, T.; Fidler, S.; Barriuso, A.; Torralba, A. Semantic Understanding of Scenes through the ADE20K Dataset. arXiv 2016. [Google Scholar] [CrossRef] [Scilit]
- Gangwisch, M.; Fröhlich, D.; Christen, A.; Matzarakis, A. Geometrical Assessment of Sunlit and Shaded Area of Urban Trees Based on Aligned Orthographic Views. Atmosphere 2021, 12, 968. [Google Scholar] [CrossRef] [Scilit]
- Klemm, W.; Heusinkveld, B.G.; Lenzholzer, S.; van Hove, B. Street Greenery and Its Physical and Psychological Impact on Thermal Comfort. Landsc. Urban Plan. 2015, 138, 87–98. [Google Scholar] [CrossRef] [Scilit]
- Tong, Y.; Bode, N.W.F. The Principles of Pedestrian Route Choice. J. R. Soc. Interface 2022, 19, 20220061. [Google Scholar] [CrossRef] [Scilit] [PubMed]
- Shah, U.; Wang, J. A Personalised Pedestrian Navigation System (Short Paper). In Proceedings of the 12th International Conference on Geographic Information Science (GIScience 2023); Schloss Dagstuhl—Leibniz-Zentrum für Informatik: Dagstuhl, Germany, 2023; Volume 277, pp. 67:1–67:6. [Google Scholar] [CrossRef]
- Oxford English Dictionary. Comfort. Available online: https://www.oed.com/dictionary/comfort_n (accessed on 10 February 2026).
- Mushkani, R.; Koseki, S. Street Review: A Participatory AI-Based Framework for Assessing Streetscape Inclusivity. Cities 2026, 170, 106602. [Google Scholar] [CrossRef] [Scilit]
- Liang, X.; Chang, J.H.; Gao, S.; Zhao, T.; Biljecki, F. Evaluating Human Perception of Building Exteriors Using Street View Imagery. Build. Environ. 2024, 263, 111875. [Google Scholar] [CrossRef] [Scilit]

Disclaimer/Publisher’s Note: The statements, opinions and data contained in all publications are solely those of the individual author(s) and contributor(s) and not of MDPI and/or the editor(s). MDPI and/or the editor(s) disclaim responsibility for any injury to people or property resulting from any ideas, methods, instructions or products referred to in the content. |
© 2026 by the authors. Published by MDPI on behalf of the International Society for Photogrammetry and Remote Sensing. Licensee MDPI, Basel, Switzerland. This article is an open access article distributed under the terms and conditions of the Creative Commons Attribution (CC BY) license.