


Abstract
Quantitative assessment of historical urban waterlogging on the Qinghai–Tibet Plateau (QTP) is severely hindered by the lack of early instrumental records. To bridge this data gap during the initial rapid urbanization period (1985–2003), this study proposes an integrated retrospective framework combining Large Language Models (LLMs)-based semantic mining, spatial reconstruction, and Extreme Gradient Boosting (XGBoost)- SHapley Additive exPlanations (SHAP) modeling under a Spatial Block Cross-Validation (SBCV) strategy. Historical disaster archives were transformed into spatially explicit training samples, enabling the reconstruction of a high-resolution urban waterlogging susceptibility atlas across the QTP. The results indicate that high-susceptibility areas are predominantly concentrated within urbanized river valleys and account for approximately 45% of the total urban built-up area across the QTP. The proposed framework achieved an Area Under the Receiver Operating Characteristic Curve (AUC) of 0.9793 under the SBCV strategy, indicating good spatial transferability within the study area. SHAP analysis revealed that geomorphic variables contributed more strongly than most climatic variables, highlighting the important role of a geomorphic confinement effect in shaping susceptibility patterns. Comparative analyses further suggest a spatial transition from basin-dominated accumulation patterns to increasingly valley-confined susceptibility distributions under stronger topographic constraints. In addition, surface albedo and land surface temperature were identified as influential predictors, likely reflecting integrated thermal-hydrological conditions associated with antecedent soil moisture and local urban thermal dynamics. This study establishes a historical risk baseline for the QTP and provides a reproducible and cost-effective framework for historical hazard assessment in other data-scarce mountainous and high-altitude regions.
1. Introduction
Due to ongoing climate warming, the frequency and intensity of extreme weather events have increased worldwide [1]. As the “Third Pole of the World” and the “Asian Water Tower,” the Qinghai–Tibet Plateau (QTP) exhibits extremely high climate sensitivity. Its warming rate is approximately twice the global average, manifesting a prominent “climate amplifier” effect [2]. In recent years, along with the transition of the QTP climate from “warm-dry” to “warm-wet,” the frequency and intensity of extreme precipitation events have surged dramatically [3].
Simultaneously, accelerated urbanization on the QTP has driven the concentration of population, economic activities, and infrastructure within river valleys. Constrained by the strict topographic confinement of high mountains and deep gorges, urban built-up areas are predominantly restricted to narrow river terraces and low-lying basins [4]. Furthermore, exacerbated by the inadequacies of early urban drainage systems and the alteration of surface runoff processes driven by glacier retreat and permafrost degradation, urban waterlogging—frequently triggered by extreme, short-duration intense precipitation—has emerged as a leading compound hydrological hazard, severely threatening the security of human settlements in plateau environments [5].
In response to these escalating hydrological hazards, extensive research has been conducted; however, existing studies predominantly focus on macro-scale basin runoff evolution [6] or the spatiotemporal distribution of flash floods [7]. Historical reconstructions of micro-scale urban waterlogging events within plateau cities remain extremely scarce. While traditional physical hydrological models (e.g., SWAT [8] or HEC-RAS [9]) excel in simulating basin-scale runoff, their historical application across the QTP is severely constrained by the absence of early micro-topographic data and the sparse distribution of meteorological stations [10]. This limitation is particularly pronounced for the period from 1985 to 2003, which marked not only a dramatic transitional phase in the QTP’s climate [11] but also the initial stage of urban spatial expansion and population agglomeration [12]. Hampered by the limited spatiotemporal resolution of early satellite imagery (e.g., Landsat-5), persistent cloud cover, and a lack of dense instrumental meteorological records, reconstructing micro-scale disasters during this period faces a severe data scarcity problem. At that time, the only historical clues regarding waterlogging were widely scattered across local chronicles and government disaster archives. However, these records typically provide only macro-level administrative divisions without precise geographic coordinates, rendering them directly unusable for high-resolution spatial susceptibility mapping.
In recent years, driven by the rapid advancement of natural language processing (NLP) and text mining technologies, the utilization of Large Language Models (LLMs) to extract disaster features from unstructured historical archives and news reports has emerged as a cutting-edge frontier in disaster informatics. For instance, Fu et al. [13] employed the BERT model to automatically extract spatiotemporal flood information from news texts, thereby constructing China’s first county-level urban flood dataset. Similarly, Mayo et al. [14] leveraged LLMs to successfully extract high-resolution spatial clues for floods from global news reports. Furthermore, studies by Gu et al. [15] and Han et al. [16] have demonstrated that natural language texts can effectively bridge the monitoring gaps left by remote sensing satellites in complex environments such as densely populated cities, while also enabling the intelligent identification of multidimensional spatial entity attributes through instruction tuning.
Nevertheless, transforming these coarse-grained textual records into refined micro-spatial coordinates—a process known as spatialization or spatial downscaling—during historical periods lacking precise instrumental records remains a formidable challenge in disaster reconstruction. Recent international studies have begun to explore text spatialization technologies based on geographical a priori rules. For example, Wang et al. [17] successfully converted flood records from ancient Chinese chronicles into digital spatial atlases. Paprotny et al. [18] utilized proxy variables such as elevation and land use to ‘downscale’ 150 years of macro-level European flood texts into spatially explicit grids at a 100 m resolution. Additionally, Tellman et al. [19] and Rosvold et al. [20] systematically transformed global disaster text databases into micro-level GIS entities. These studies demonstrate the feasibility and scientific value of incorporating multi-source geographical constraints for the spatial reconstruction of historical disasters. However, applying such text downscaling frameworks to the alpine cities of the QTP—which are characterized by extreme topographic confinement and highly complex surface heterogeneity—remains a notable gap in the literature.
To bridge this historical data gap and overcome the bottleneck of coarse spatial granularity inherent in traditional disaster archives, we propose an integrated “Semantic Mining–Spatial Relocation–Machine Learning Interpolation” framework tailored for data-scarce alpine regions.
Within this framework, we first utilize LLMs to conduct semantic parsing of historical disaster texts. Acknowledging the permanent loss of true micro-level coordinates, we introduce physical topographic indices highly correlated with surface runoff (e.g., Height Above Nearest Drainage (HAND) and Slope) as an essential engineering compromise to spatialize historical data. This approach allows us to dynamically “anchor” macro-level administrative disaster records to hydrologically meaningful micro-geomorphic units.
Building upon this foundation and leveraging the Google Earth Engine (GEE) cloud computing platform, we integrate these topography-constrained anchor points with multi-source environmental variables, including topographic, climatic, and surface thermal indicators. Utilizing the non-linear modeling capability of the Extreme Gradient Boosting (XGBoost) algorithm, we spatially generalize the reconstructed disaster information and generate a gridded urban waterlogging susceptibility map for the QTP during 1985–2003. Combined with the SHapley Additive exPlanations (SHAP) framework, we further investigate the relative contributions of environmental drivers to the reconstructed susceptibility patterns. Particular attention is given to the role of the geomorphic confinement effect in shaping the spatial heterogeneity of urban waterlogging across plateau cities. Through this integrated framework, the study aims to (1) reconstruct historical urban waterlogging susceptibility under severe data constraints, (2) identify the dominant environmental controls associated with susceptibility distributions, and (3) provide a transferable framework for historical disaster reconstruction in other data-scarce alpine and mountainous regions.
2. Materials and Methods
2.1. Study Area
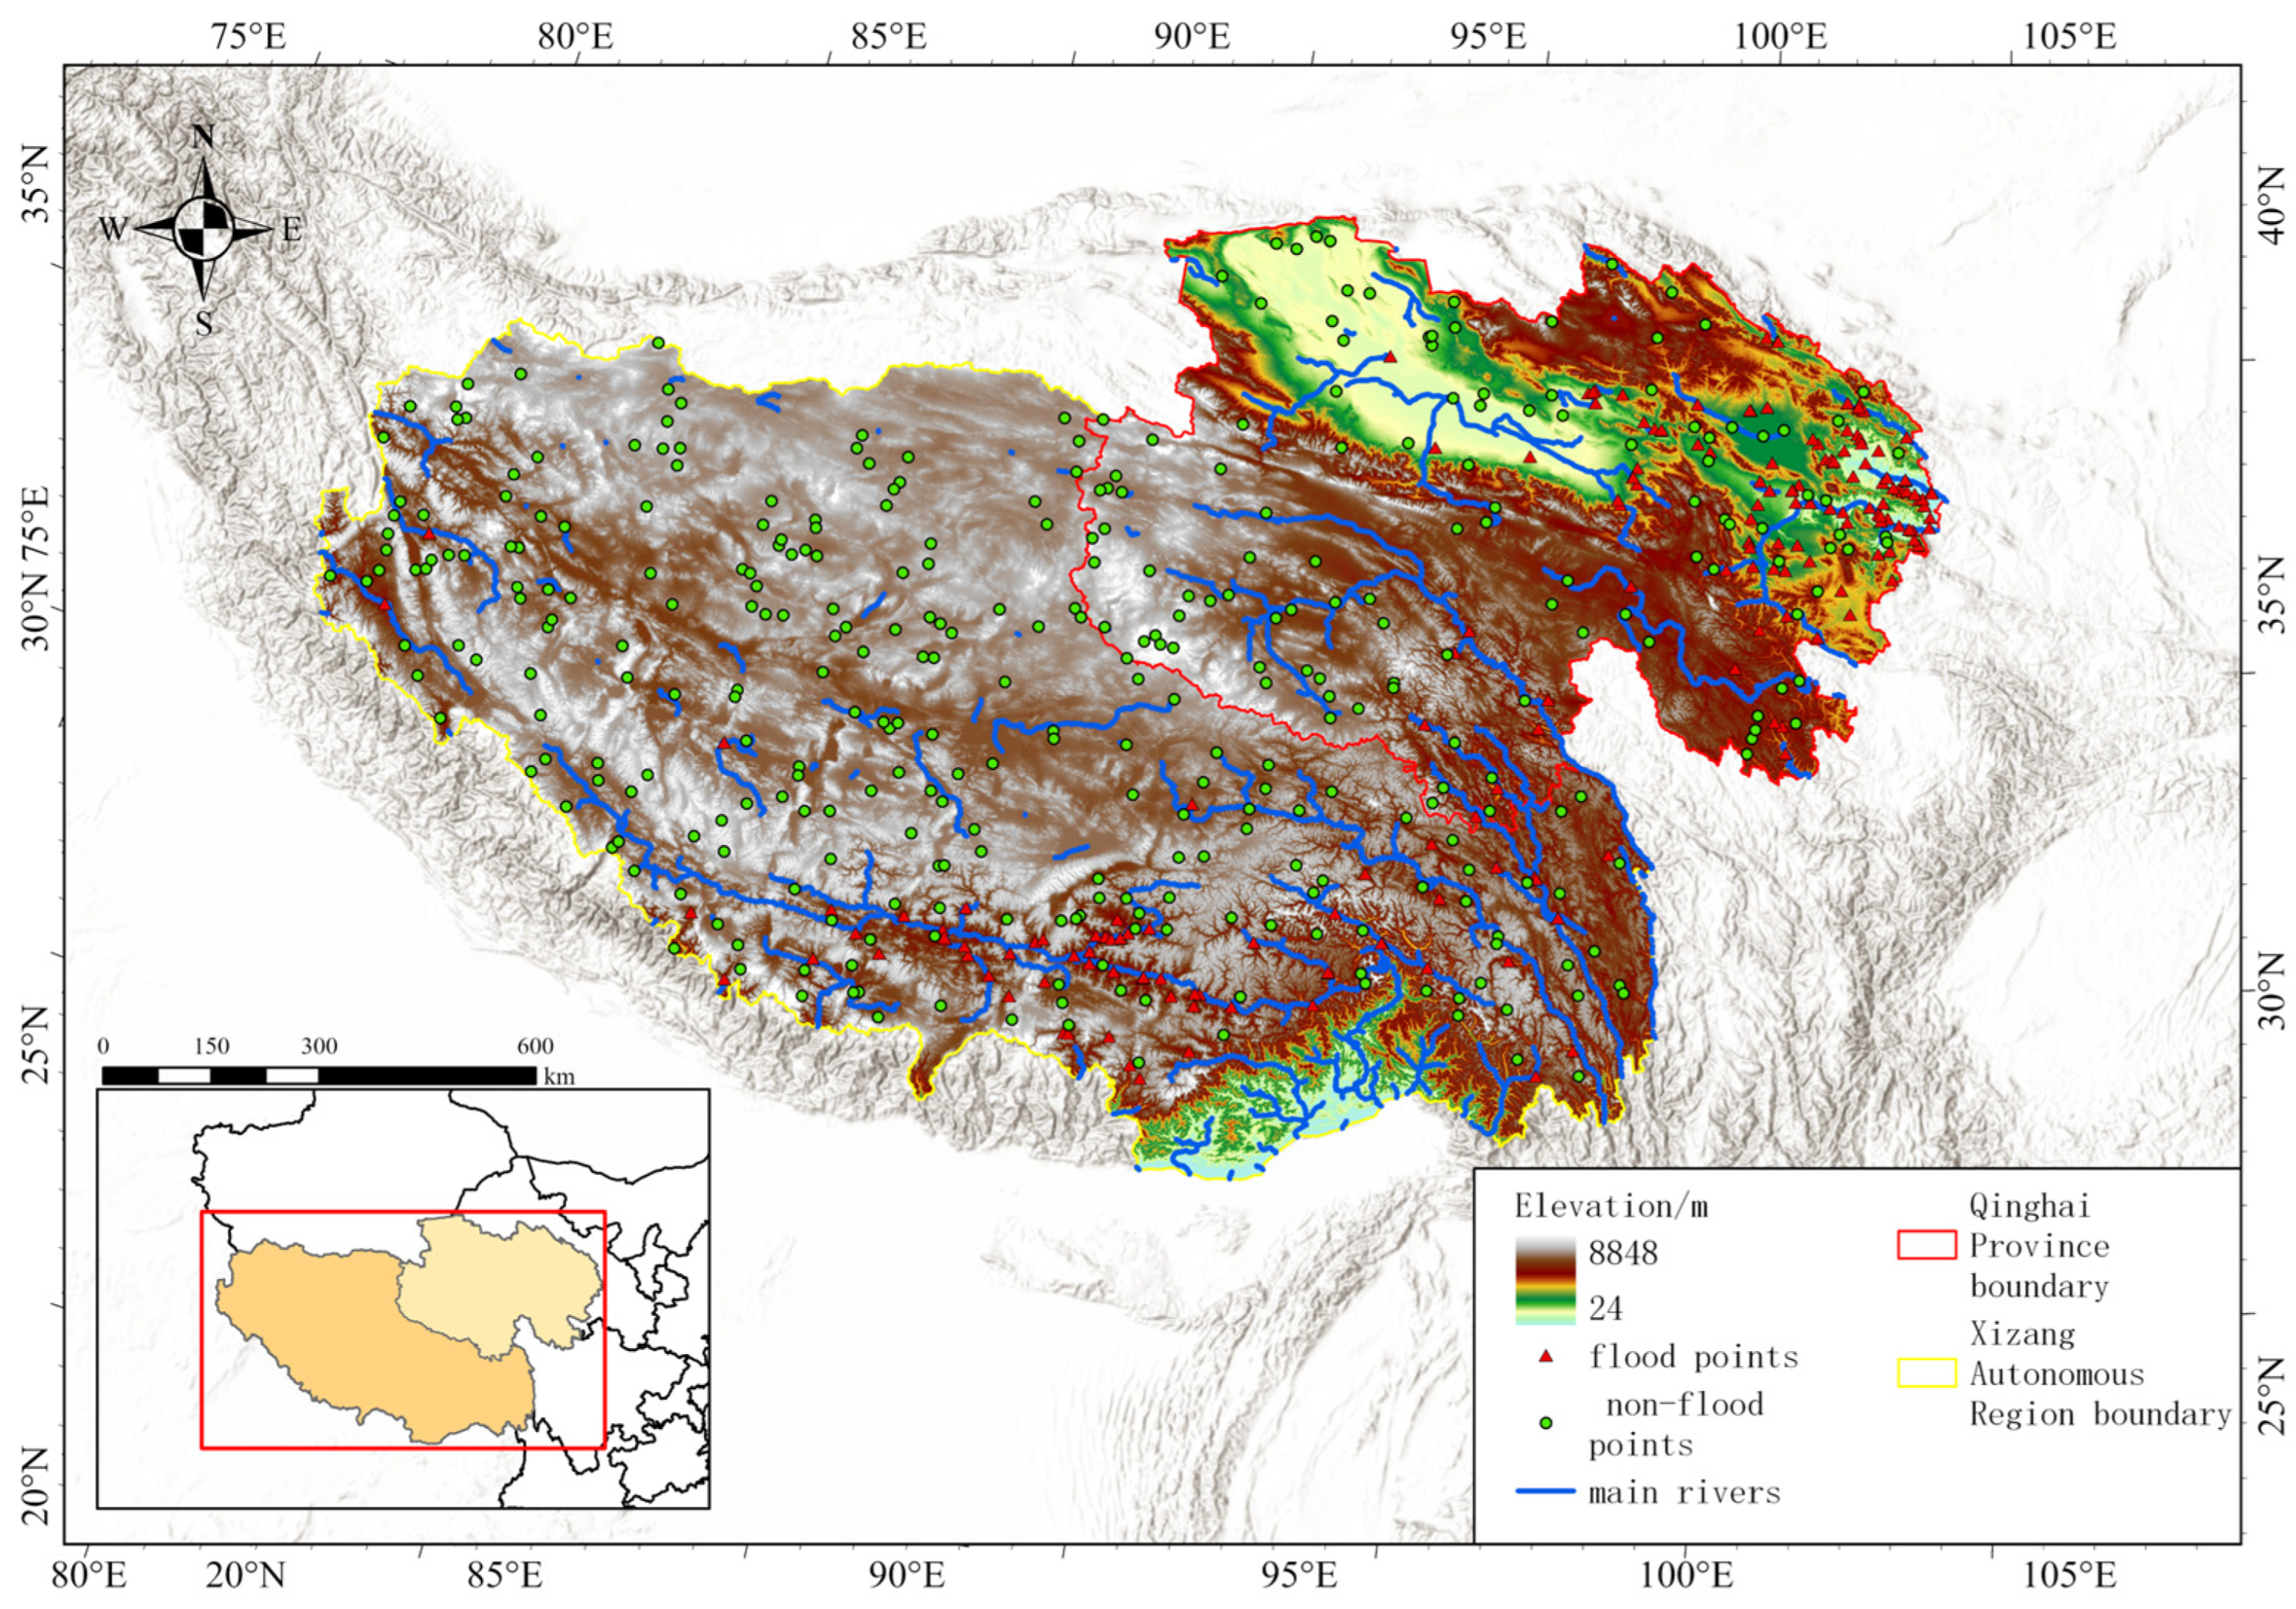
Situated in south-central Eurasia, the QTP features a complex alpine geomorphology with an average elevation exceeding 4000 m, and this study specifically focuses on its valley urban areas below 4500 m within Qinghai Province and the Tibet Autonomous Region (Figure 1).
Figure 1.
Study Area.
Constrained by this harsh environment, regional urban settlements are highly agglomerated in narrow, low-lying river valley terraces, forming typical “geomorphic traps” that are highly vulnerable to surface runoff convergence [21]. Driven by accelerated regional warming, the non-linear coupling of extreme short-duration precipitation with high-altitude cryospheric processes (e.g., permafrost thawing and snow/ice melt) frequently exceeds the capacity of early drainage systems [5,11], making these topographically confined cities highly susceptible to severe urban waterlogging.
2.2. Methodological Framework
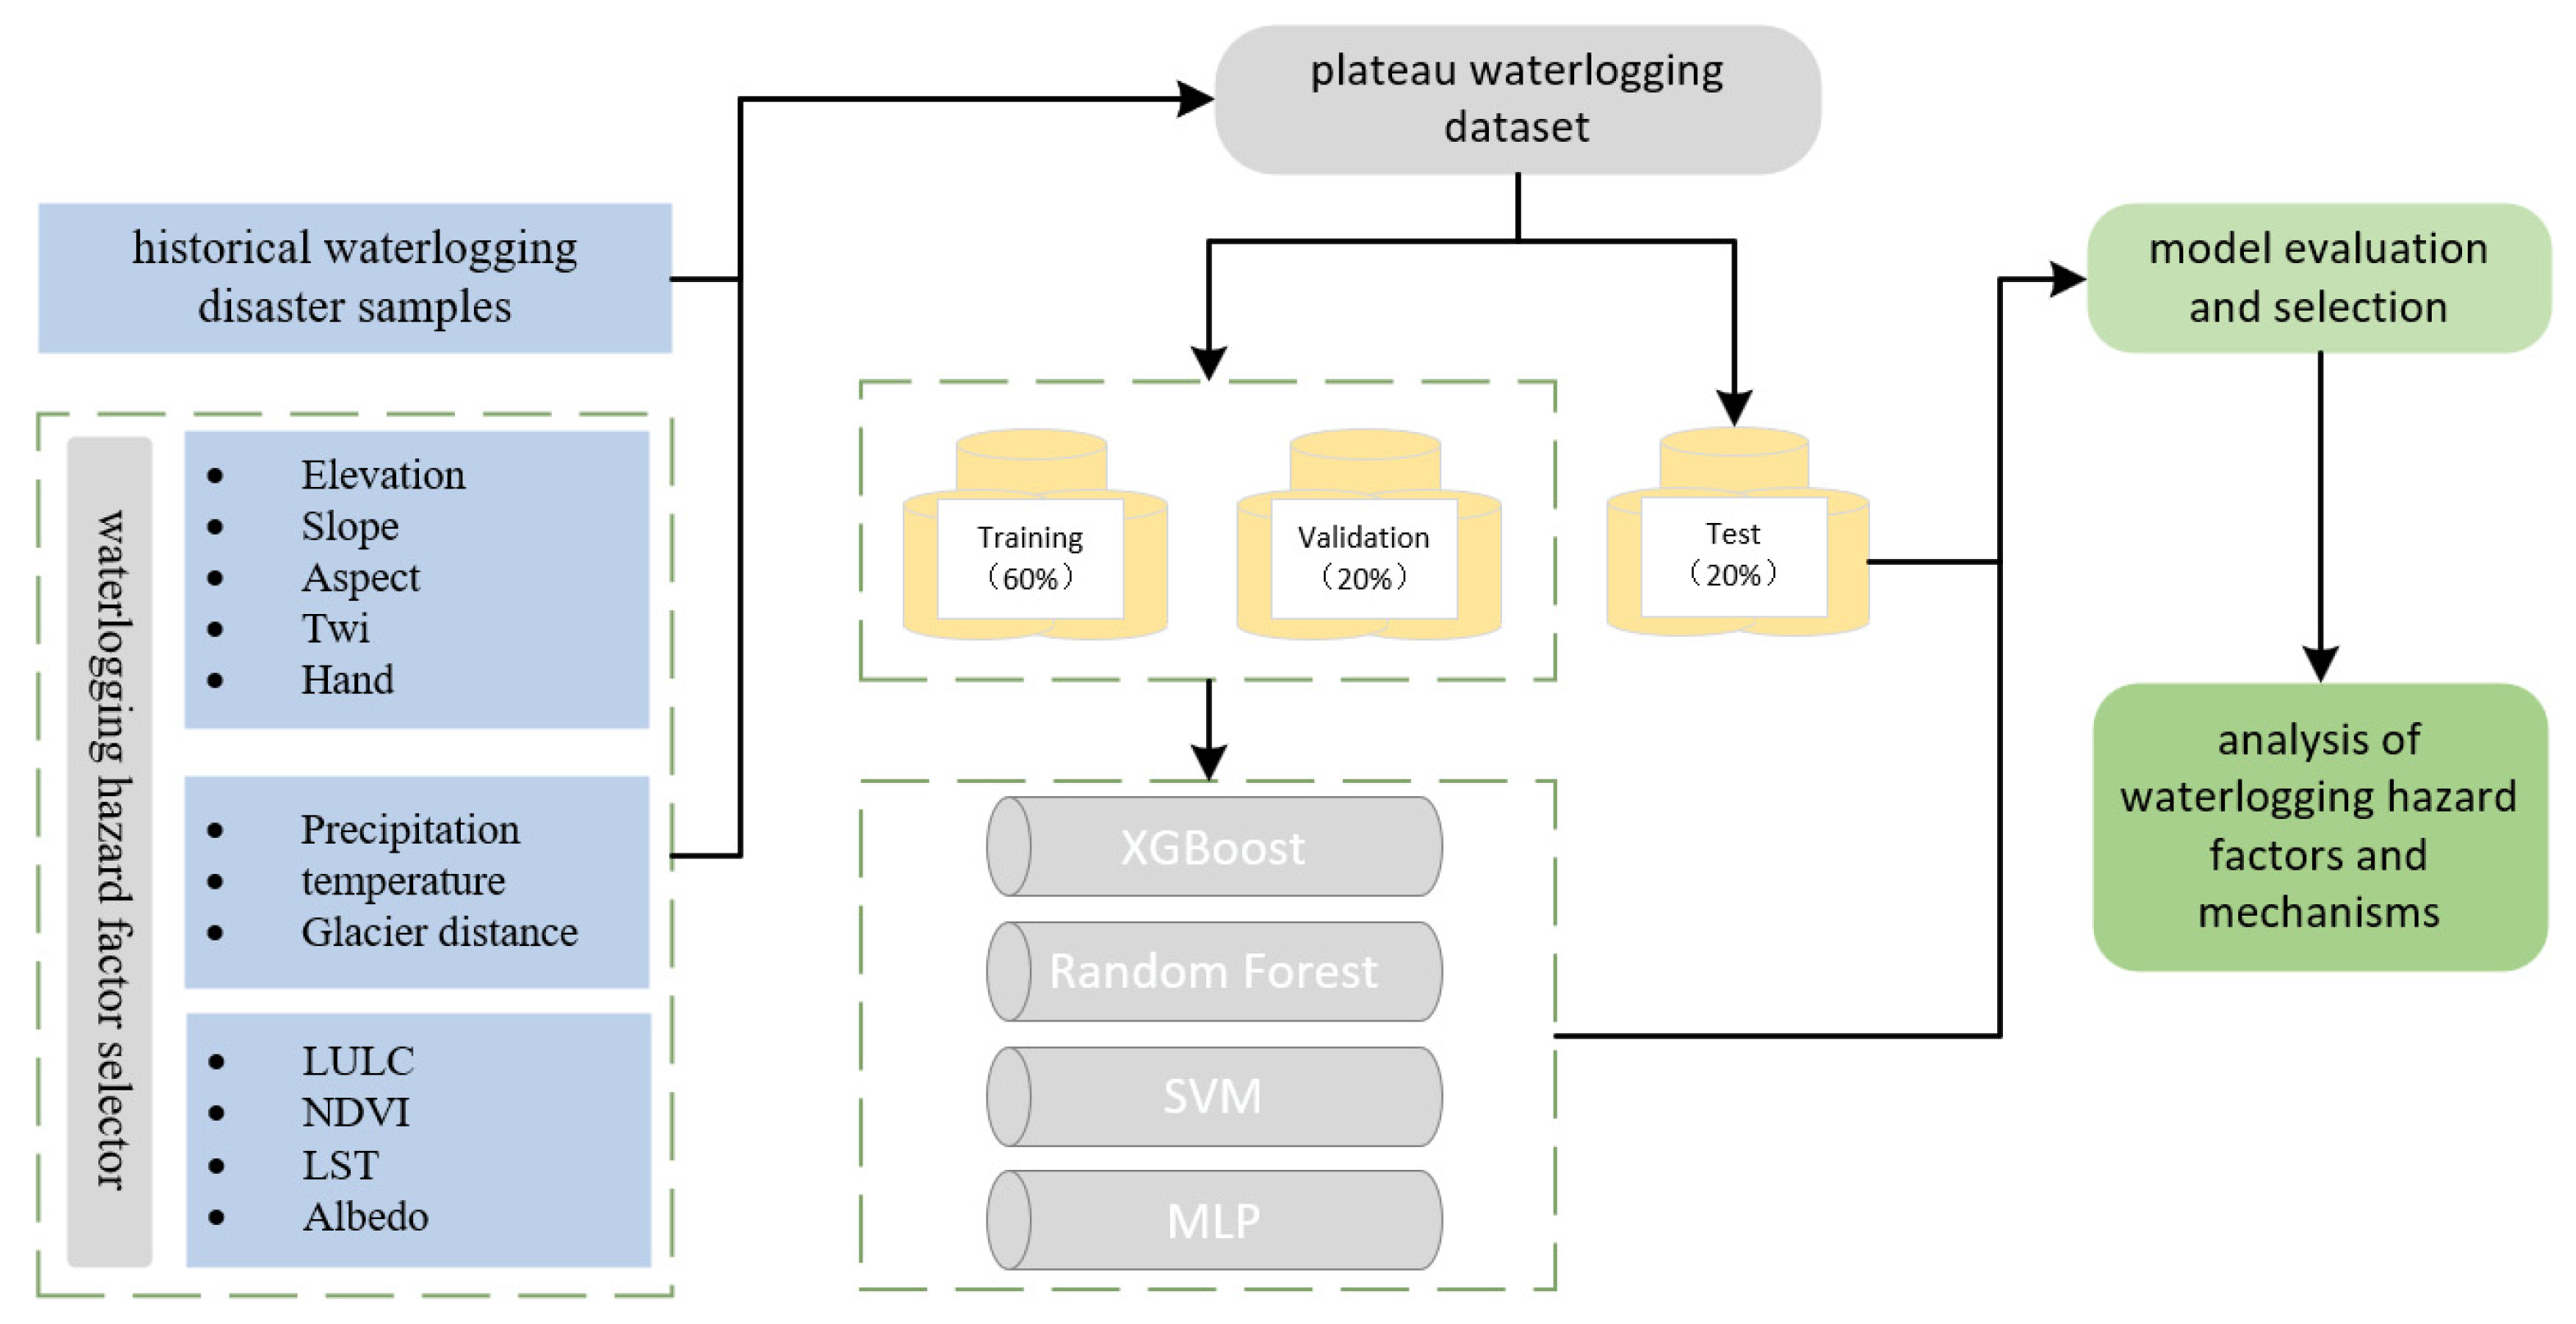
Figure 2 illustrates the methodological framework for the urban waterlogging retrospective evaluation developed in this study. The core workflow is divided into four distinct phases: data integration, model construction, accuracy validation, and attribution mechanism analysis.
Figure 2.
Methodological Framework. The green dashed lines indicate schematic grouping of modules and are not related to any quantitative analysis.
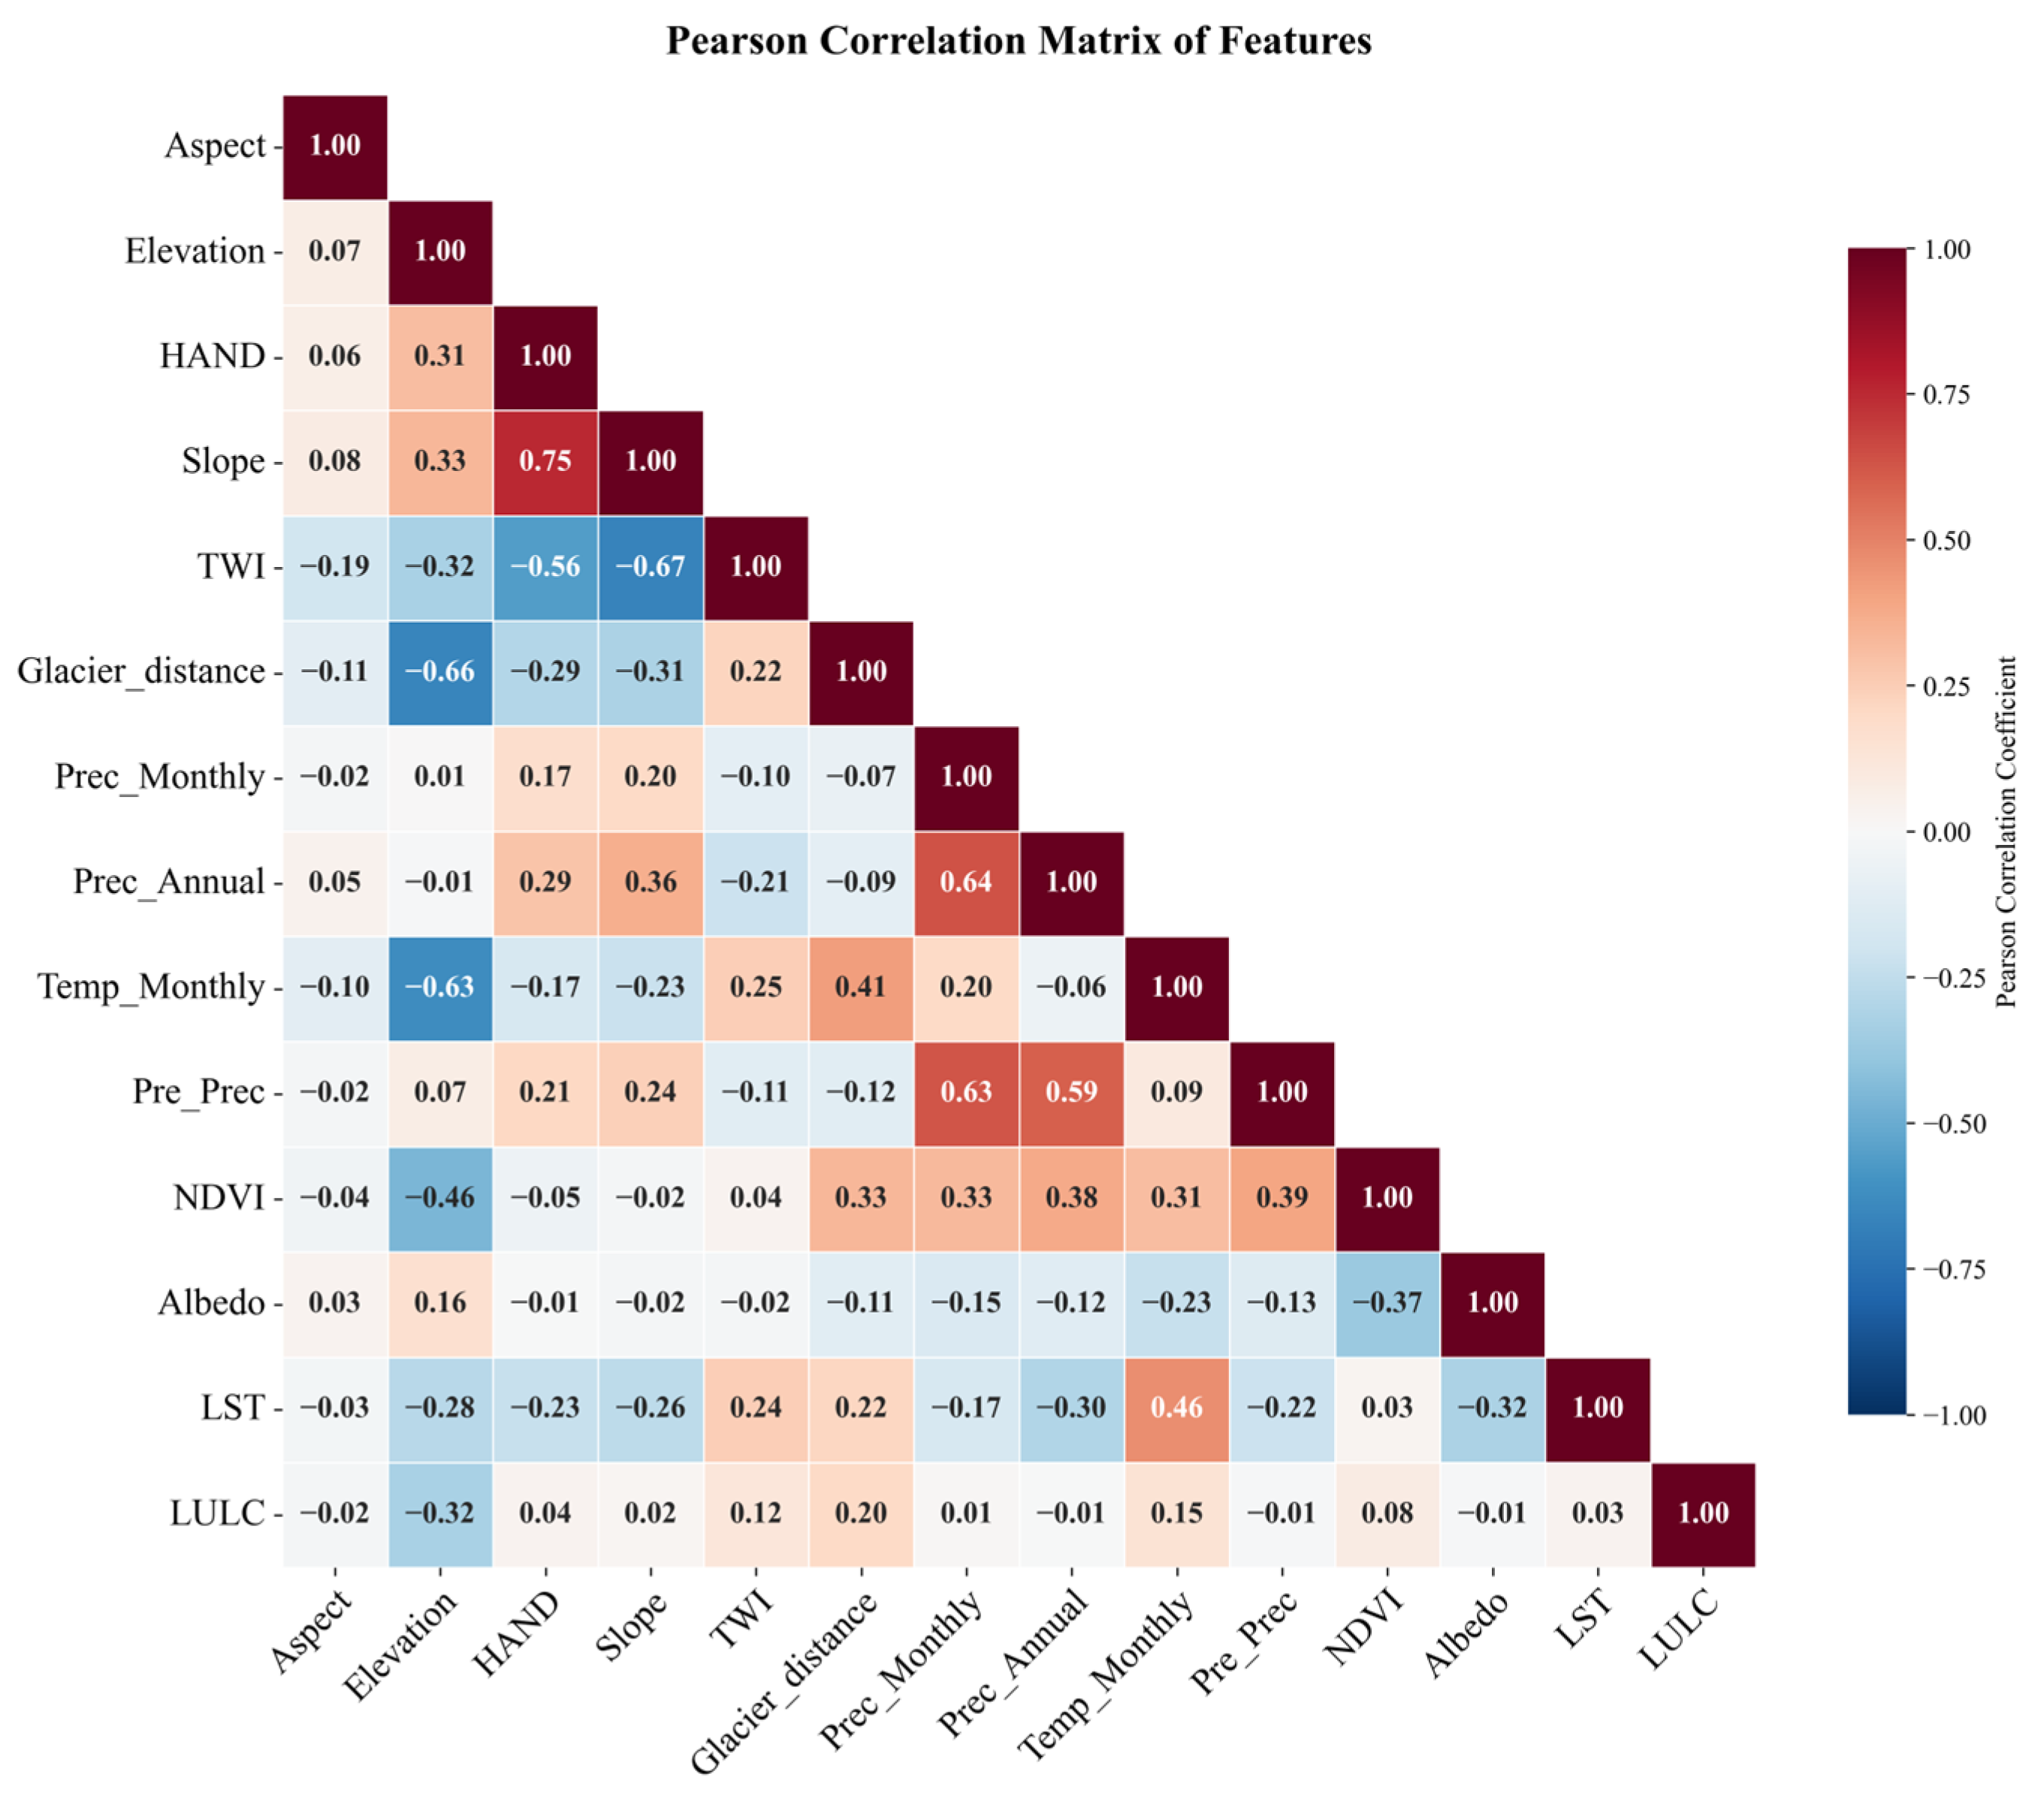
First, during the data integration and preprocessing phase, an environmental variable dataset comprising 14 flood-inducing factors—covering physical-geomorphic constraints, climatological-hydrological dynamics, and ecological-underlying surface regulation—was constructed. To explicitly align the macro-climatic drivers with the core micro-topographic constraints, all spatial datasets were uniformly resampled to a 30 m resolution and spatially coupled with the reconstructed historical disaster samples. Crucially, prior to model training, a Pearson correlation analysis was conducted to diagnose multicollinearity among the environmental factors. Features exhibiting a high correlation coefficient were excluded to reduce multicollinearity and facilitate model interpretation.
Second, in the model construction and validation phase, we shifted the paradigm from conventional forward-prediction to a retrospective spatial downscaling framework. We integrated XGBoost, Random Forest (RF), Support Vector Machine (SVM), and Multi-Layer Perceptron (MLP) to capture the environmental characteristics associated with historical disaster occurrences. To mitigate potential spatial target leakage and over-optimistic performance estimates, a strict Spatial Block Cross-Validation (SBCV) strategy was implemented. The model exhibiting the best spatial generalization performance was selected to reconstruct the spatial distribution of historical urban waterlogging susceptibility.
Finally, in the physical mechanism attribution phase, a multi-level explanatory framework was constructed. The SHAP framework was coupled to characterize the marginal effects and relative contributions of individual factors to waterlogging within the established modeling framework, thereby improving the interpretability of the machine-learning framework and providing insights into potential environmental controls associated with waterlogging susceptibility. To further characterize potential non-linear response transitions, SHAP values were analyzed using equal-frequency binning. Linear interpolation was applied to identify the approximate locations where the mean SHAP contribution crossed zero, providing statistical reference points for interpreting susceptibility transitions.
2.3. Sample Preparation and Class Balancing Strategy
2.3.1. Historical Flood Data Reconstruction and Sample Screening
The historical urban waterlogging dataset constructed in this study primarily integrates core archives, including natural disaster statistical data from Qinghai Province and the Tibet Autonomous Region [22,23]. Focusing on historical urban waterlogging events that occurred in the Qinghai and Tibet regions, we utilized LLMs to semantically recognize and parse unstructured text in the disaster archives, extracting key information such as the administrative affiliations of disaster sites and the exact timing of the events.
To resolve the limitation of coarse spatial granularity in historical disaster archives—which prevents their direct application in fine-scale simulations—this study proposes a spatial reconstruction and fine-scale calibration workflow. First, the baseline coordinates of the administrative units corresponding to the disaster sites were designated as the initial geographical reference. Subsequently, by integrating multi-temporal remote sensing products (particularly the China Land Cover Dataset (CLCD)) and incorporating the HAND index and localized micro-topographic hydrological features as physical constraints, the disaster points were dynamically repositioned to potential hydrologically plausible urban locations aligned with topographic catchment patterns and hydrological processes.
During this spatial reconstruction, the temporal coverage of high-precision environmental covariates imposed a rigid constraint on sample screening. Specifically, the CLCD—the core data used to characterize urban underlying surface features—started in 1985. Consequently, historical textual records prior to this year could not be constrained by accurate land-use spatial data, making it difficult to improve confidence in the reliability of micro-scale spatial repositioning. Based on the modeling principle of “strict spatiotemporal covariate matching,” redundant records prior to 1985 were excluded, and the final study period was strictly delimited to 1985–2003. Through this temporal truncation and spatial calibration, a total of 500 disaster sample points exhibiting physical-geomorphic consistency were reconstructed.
It is crucial to explicitly define the epistemological nature of these reconstructed samples. Due to the inherent lack of precise GPS coordinates in historical archives, these points are not “direct field observations” in the conventional sense, but rather “physically anchored weak labels (Silver Standard data).” Although HAND was used as an auxiliary constraint during spatial reconstruction, its role was limited to the initial localization of historical records and did not directly determine the subsequent susceptibility predictions. The spatial repositioning relies on a simple, low-dimensional topographic constraint. In contrast, the machine learning algorithm is tasked with uncovering the high-dimensional, non-linear relationships across 14 heterogeneous variables (e.g., dynamically coupling specific HAND values with extreme precipitation clusters and glacier proximity). Consequently, this step represents an essential “weakly supervised” engineering compromise, converting coarse administrative records into a high-resolution spatial downscaling matrix applicable to data-scarce alpine regions. Despite being reconstructed proxy points, this dataset records the precise temporal sequence (year, month, and day) and calibrated geospatial coordinates (longitude and latitude) of each disaster event, providing the sample basis for subsequent spatial risk pattern analysis and susceptibility assessment.
2.3.2. Negative Sample Selection and Class-Balance Sampling Strategy
To achieve high-precision binary machine learning modeling, constructing a representative and spatially independent negative sample dataset is of paramount importance. Leveraging the GEE cloud computing platform, this study adopted an integrated strategy of “spatial filtering—physical geomorphic constraints—class-balance sampling” for negative sample screening.
First, to reduce the influence of spatial autocorrelation and potential target leakage between positive and negative samples, a 2 km spatial buffer was established around the reconstructed historical waterlogging points. Negative samples were then selected outside these buffer zones, thereby increasing the spatial separation between positive and negative samples and reducing potential spatial dependence.
Second, to address the profound concern regarding trivial classification (i.e., merely differentiating valleys from mountain peaks), topographic catchment characteristics were introduced as critical filtering thresholds. Specifically, mountainous terrains with slopes exceeding 20° were excluded because previous studies have shown that steep slopes substantially increase construction costs and are associated with higher risks of soil erosion and landslides, thereby limiting the concentration of urban development in such areas [24]. Consequently, these terrains are less representative of the urban environments targeted in this study. By restricting the negative samples to relatively moderate topographies, we intentionally avoided creating an extreme “mountain vs. valley” geomorphic contrast. Instead, this constraint encourages the model to capture more nuanced micro-topographic and hydro-climatic differences within potentially vulnerable areas, rather than relying on macroscopic elevation differences. However, we acknowledge that in the highly heterogeneous Qinghai–Tibet Plateau, extracting pure background features inevitably introduces a certain degree of geomorphic differentiation from the exact flood-prone valley bottoms; this is an essential engineering compromise necessary to establish a definitive non-flooded baseline in a data-scarce region.
Finally, addressing the scarcity of historical disaster records, this study followed a strict 1:1 ratio principle to randomly sample the filtered safe zones, constructing a balanced dataset comprising 500 positive and 500 negative samples. This approach effectively reduced potential classification bias associated with class imbalance during model training.
2.4. Waterlogging Hazard Factor Selector
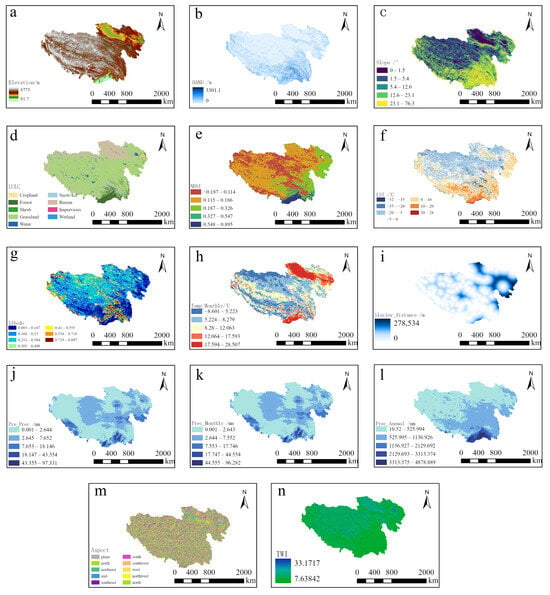
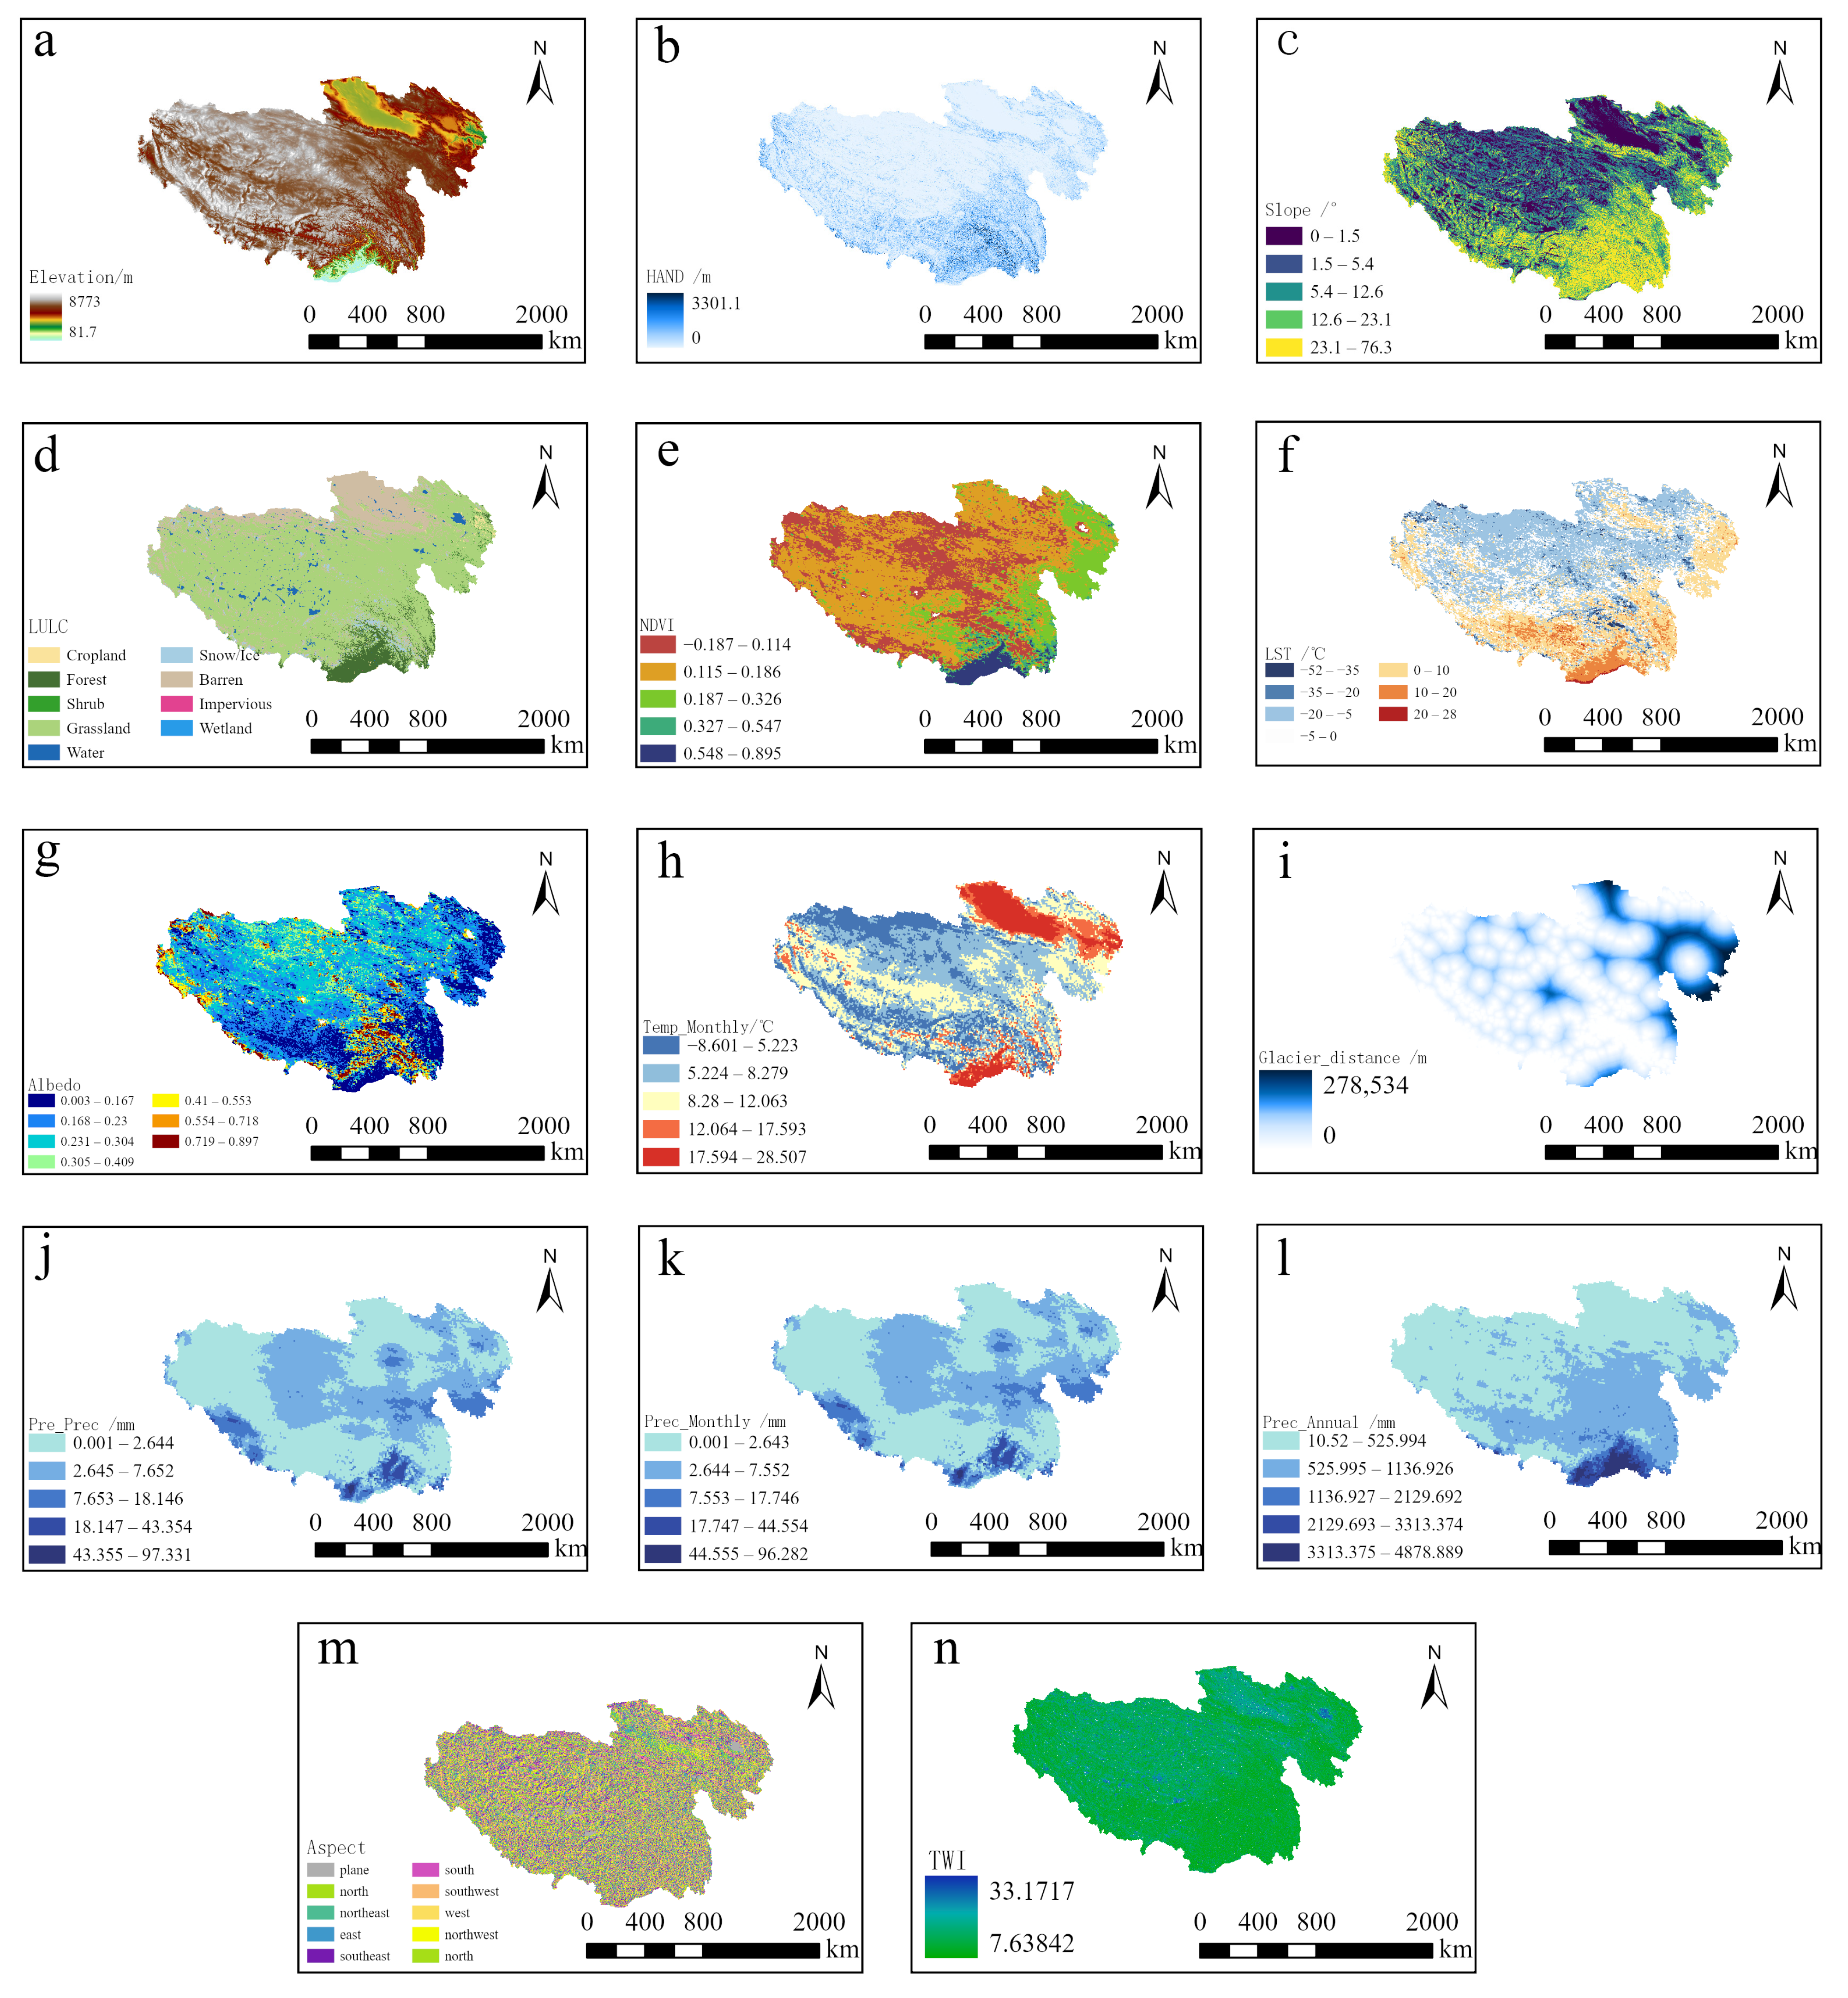
To systematically characterize the multidimensional disaster-inducing mechanisms of urban waterlogging, this study selected 14 environmental variables across three dimensions—physical-geomorphic constraints, climatological-hydrological dynamics, and ecological-underlying surface regulation—to construct a comprehensive waterlogging covariate dataset (Table 1). To harmonize the spatial resolution of multi-source heterogeneous datasets and facilitate their integration within a unified analytical framework, all spatial datasets were resampled to a common resolution of 30 m (Figure 3).
Table 1.
Database and data source.
Figure 3.
Dataset of Urban Waterlogging Factors: (a) Elevation; (b) HAND; (c) Slope; (d) LULC; (e) NDVI; (f) LST; (g) Albedo; (h) Temp_Monthly; (i) Glacier_distance; (j) Pre_Prec; (k) Prec_Monthly; (l) Prec_Annual; (m) Aspect; (n) TWI.
Regarding data sources, LULC data were derived from the CLCD product provided by Yang [25]; Glacier_distance was extracted based on Liu et al. [26], and ecological factors (NDVI, LST, Albedo) were extracted from NOAA AVHRR-Climate Data Record (CDR) based on Song [27]; meteorological variables (Precipitation, Temperature) were obtained from the long-term China Meteorological Forcing Dataset (CMFD) dataset calibrated by He et al. [28]; geomorphic factors (Elevation, Slope, Aspect, TWI, HAND) were acquired from the high-precision MERIT Hydro dataset developed by Yamazaki et al. [29].
It should be noted that the coarse meteorological datasets (e.g., 0.1° CMFD) and 500 m remote sensing products were resampled to a spatial resolution of 30 m using bilinear interpolation. We explicitly state that this resampling process does not create any new micro-scale meteorological information. The primary objective of unifying the resolution to 30 m is strictly to align the calculation matrix with the core micro-topographic variables, which physically dictate the localized accumulation of urban waterlogging. Consequently, the resampled meteorological data act as a uniformly distributed “macro-climatic background field” for a given valley, rather than providing precise micro-climatic variances.
In terms of physical-geomorphic constraints, topography and geomorphology act as the “containers” governing runoff convergence. Compared with conventional elevation, the HAND index introduced in this study quantifies the relative vertical height of urban areas to the nearest drainage channel, thereby capturing localized inundation risks driven by micro-topography with higher precision [30]. Slope, as the core factor regulating runoff velocity, directly determines the duration of surface runoff generation and concentration [31]. Meanwhile, TWI identifies potential waterlogging hotspots by quantifying the topographic control on runoff accumulation [32,33]. In addition, slope aspect regulates local thermal distribution and snowmelt rates by modulating solar radiation received by slopes [34]. The mathematical expression of is formulated as follows, where denotes the upslope contributing area per unit contour length, and represents the local slope angle:
Regarding climatological-hydrological dynamics, precipitation acts as the direct trigger for waterlogging, with its intensity and spatiotemporal distribution dictating the evolution and scale of flood disasters [35]. To comprehensively capture the lag and cumulative effects of precipitation on waterlogging across various temporal scales, this study extracted annual total precipitation (Prec_Annual), monthly total precipitation (Prec_Monthly), and antecedent precipitation of the previous month (Pre_Prec) from the CMFD. Specifically, the derived factor Pre_Prec was calculated by aggregating the daily precipitation records for the entire month prior to the respective flood occurrence. Temperature not only regulates evapotranspiration in plateau cities but also serves as a critical driver triggering glacier and permafrost ablation under warming scenarios [36]. Consequently, the monthly mean temperature (Temp_Monthly) from the CMFD was incorporated. As a localized hazard trigger, glacier distance (Glacier_distance) quantifies the potential threat from surging glacial runoff and glacial lake outburst floods (GLOFs); urban areas closer to glaciers face heightened vulnerability to cascading ice-and-snow disaster chains under climate warming [37]. To construct this variable, the Euclidean Distance spatial analysis tool in ArcGIS was utilized to calculate the shortest straight-line distance from each sample point to the nearest glacier polygon boundaries.
Concerning ecological-underlying surface regulation, LULC types influence runoff processes by altering the infiltration capacity of the underlying surface. The expansion of urban impervious surfaces significantly impedes infiltration capacity, leading to advanced and intensified peak discharge [38]. Conversely, the NDVI plays a critical role in mitigating runoff and detaining floods through canopy interception [39]. LST and Albedo jointly reflect the surface energy budget balance. Empirical studies have shown that the continuous decline in Albedo over the past two decades has enhanced surface heat absorption, accelerating localized hydrological cycles and further intensifying extreme hydrological risks driven by rapid cryospheric melt [40].
2.5. Model Evaluation and Selection
2.5.1. Multi-Algorithm Ensemble Modeling Framework
To systematically evaluate urban waterlogging susceptibility on the QTP, this study constructed a modeling framework integrating multiple algorithms. Considering the heterogeneity and non-linear characteristics of geo-environmental factors, we selected four representative machine learning models: XGBoost, RF, SVM, and MLP.
Among these, XGBoost, an ensemble algorithm based on Gradient Boosting Decision Trees (GBDT), incorporates regularization terms to effectively mitigate overfitting, exhibiting significant advantages in handling complex associations within the spatial distribution of geographic features. The RF model enhances robustness against noisy data through a bagging strategy. Concurrently, SVM and MLP provide baseline references for model predictions from the perspectives of structural risk minimization and deep non-linear fitting, respectively.
2.5.2. Model Evaluation and Performance Metrics
To comprehensively quantify the predictive performance of different algorithms, this study established a robust evaluation metric system encompassing both classification accuracy and generalization capability.
First, the Receiver Operating Characteristic (ROC) curve was employed as a visual diagnostic tool to intuitively illustrate the trade-off between the true positive rate and false positive rate across various discrimination thresholds [41]. On this basis, the Area Under the Receiver Operating Characteristic Curve (AUC) was calculated as a quantitative index to evaluate the overall discriminatory performance of the models [42]. An AUC value closer to 1.0 indicates a superior class-discriminant capability of the model in distinguishing between waterlogging and non-waterlogging samples.
2.6. Model Validation Strategy
To reduce potential performance inflation caused by spatial autocorrelation and to assess spatial generalization capability, an SBCV strategy was implemented. Initially, a total of 1000 sample points were acquired, comprising 500 historical flood points (positive samples) and 500 non-flood points (negative samples).
Instead of conventional random splitting, the entire study area was spatially discretized into a 0.5° × 0.5° geographic grid framework. A group-based partitioning technique was then applied to divide these spatial blocks into mutually exclusive subsets at an approximate ratio of 6:2:2.
Specifically, the Training Set (~60% of blocks) was utilized for model parameter learning, incorporating a 5-fold Spatial Grouped Cross-Validation (GroupKFold) to conduct Bayesian hyperparameter optimization. The Validation Set (~20% of blocks) was designated for independent performance monitoring during the training phase. Finally, the Test Set (~20% of blocks) served as a geographically independent test dataset reserved exclusively for final model evaluation, thereby providing a more robust assessment of spatial generalization capability.
To quantitatively assess the predictive capabilities of the constructed models, their performance was evaluated using multiple statistical metrics on the spatially independent test set. While the confusion matrix serves as a standard tool for illustrating the classification performance of binary classifiers, this study calculated Precision, Recall, and F1-score using a macro-averaging approach. These metrics, together with the AUC, were jointly used to evaluate different aspects of model performance. Higher values generally indicate better predictive performance. The mathematical formulations of these metrics are defined as follows:
where , and represent the predicted Precision, Recall, and F1-Score for the class, respectively. On this basis, the macro-average algorithm is applied to calculate the arithmetic mean across all classes for each respective metric. The resulting metrics—namely , , and —denote the macro-averaged Precision, Recall, and F1-Score, respectively. For the binary classification task in this study, the total number of classes is set to . Specifically, designates the non-waterlogging samples, and designates the waterlogging samples.
2.7. Analysis of Disaster Mechanisms
Traditional machine learning models, owing to their inherent “black-box” nature, typically struggle to directly elucidate the specific contribution mechanisms of individual covariates to waterlogging occurrence. To address this limitation, this study introduced the SHAP interpretability framework. Based on the Shapley value theory from cooperative game theory, SHAP quantifies the facilitating or suppressing effects of various environmental variables on the probability of urban waterlogging by calculating their marginal contributions. By leveraging SHAP summary plots and dependence plots, this approach not only ranks the relative importance of environmental variables but also helps characterize potential non-linear relationships between predictor variables and susceptibility patterns. As outlined in Section 2.2, this methodology improves the interpretability of the machine-learning framework and facilitates the exploration of possible disaster-related environmental controls. Furthermore, the SHAP response curves provide statistical reference points for identifying potential transition ranges in susceptibility responses.
2.8. Spatial Susceptibility Mapping and Risk Classification
Following the model evaluation and interpretation, the optimal machine learning model was applied as the spatial downscaling engine to infer the occurrence probability of urban waterlogging across all targeted plateau valleys. To explicitly delineate the spatial boundaries of different risk zones and assist urban disaster management, the continuous probability map was categorized into five distinct risk levels: Low, Low-medium, Medium, Medium-high, and High.
Rather than relying on manually defined thresholds, susceptibility classes were generated using the Natural Breaks (Jenks) optimization algorithm. As a data-driven classification method widely applied in geographical and environmental studies [43,44], the algorithm seeks to minimize intra-class variance while maximizing inter-class variance. This iterative optimization process maximizes the Goodness of Variance Fit (), which is mathematically expressed as follows:
where represents the Sum of Squared Deviations from the Array Mean (i.e., the total variance of the entire dataset), and denotes the Sum of Squared Deviations from the Class Means (i.e., the variance within the classified groups). The value ranges from 0 to 1, with values closer to 1 indicating a superior classification fit. By identifying natural groupings within the susceptibility distribution, the Jenks Natural Breaks method provides a data-driven means of classifying susceptibility levels and facilitates the representation of spatial heterogeneity while reducing the influence of subjective threshold selection.
3. Results
3.1. Feature Correlation Analysis
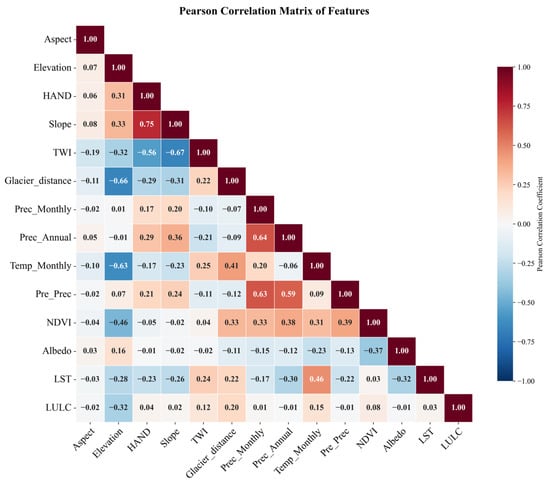
Prior to spatial downscaling modeling, a Pearson correlation analysis was conducted to diagnose multicollinearity among the 14 environmental covariates. As illustrated in the correlation matrix (Figure 4), no feature pairs exhibited excessive correlation, with all absolute Pearson coefficients remaining strictly below the predefined exclusion threshold of 0.80 (). Consequently, all 14 environmental factors were fully retained to construct the multi-algorithm spatial modeling matrix. This pre-screening procedure helps reduce potential multicollinearity and information redundancy, thereby improving the interpretability of the subsequent SHAP analysis and facilitating the assessment of the relative contributions of individual environmental factors.
Figure 4.
Correlation Matrix.
3.2. Model Performance Evaluation Under Spatial Block Cross-Validation
To rigorously evaluate the capability of the selected algorithms to characterize spatial waterlogging susceptibility, model performance was assessed using the independent, geographically isolated Test Set established within the SBCV framework. The comparative results, evaluated through macro-averaged metrics, are detailed in Table 2.
Table 2.
Performance comparison of model.
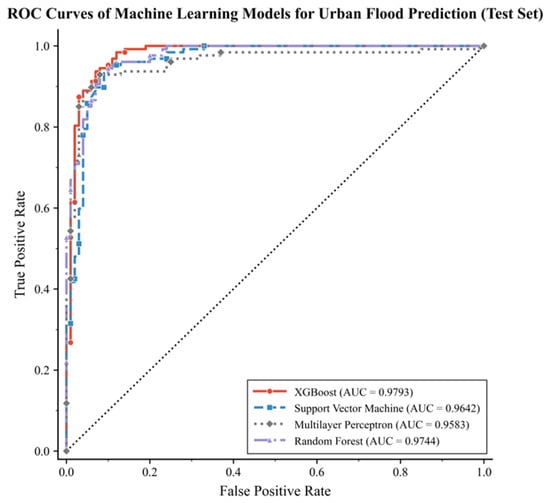
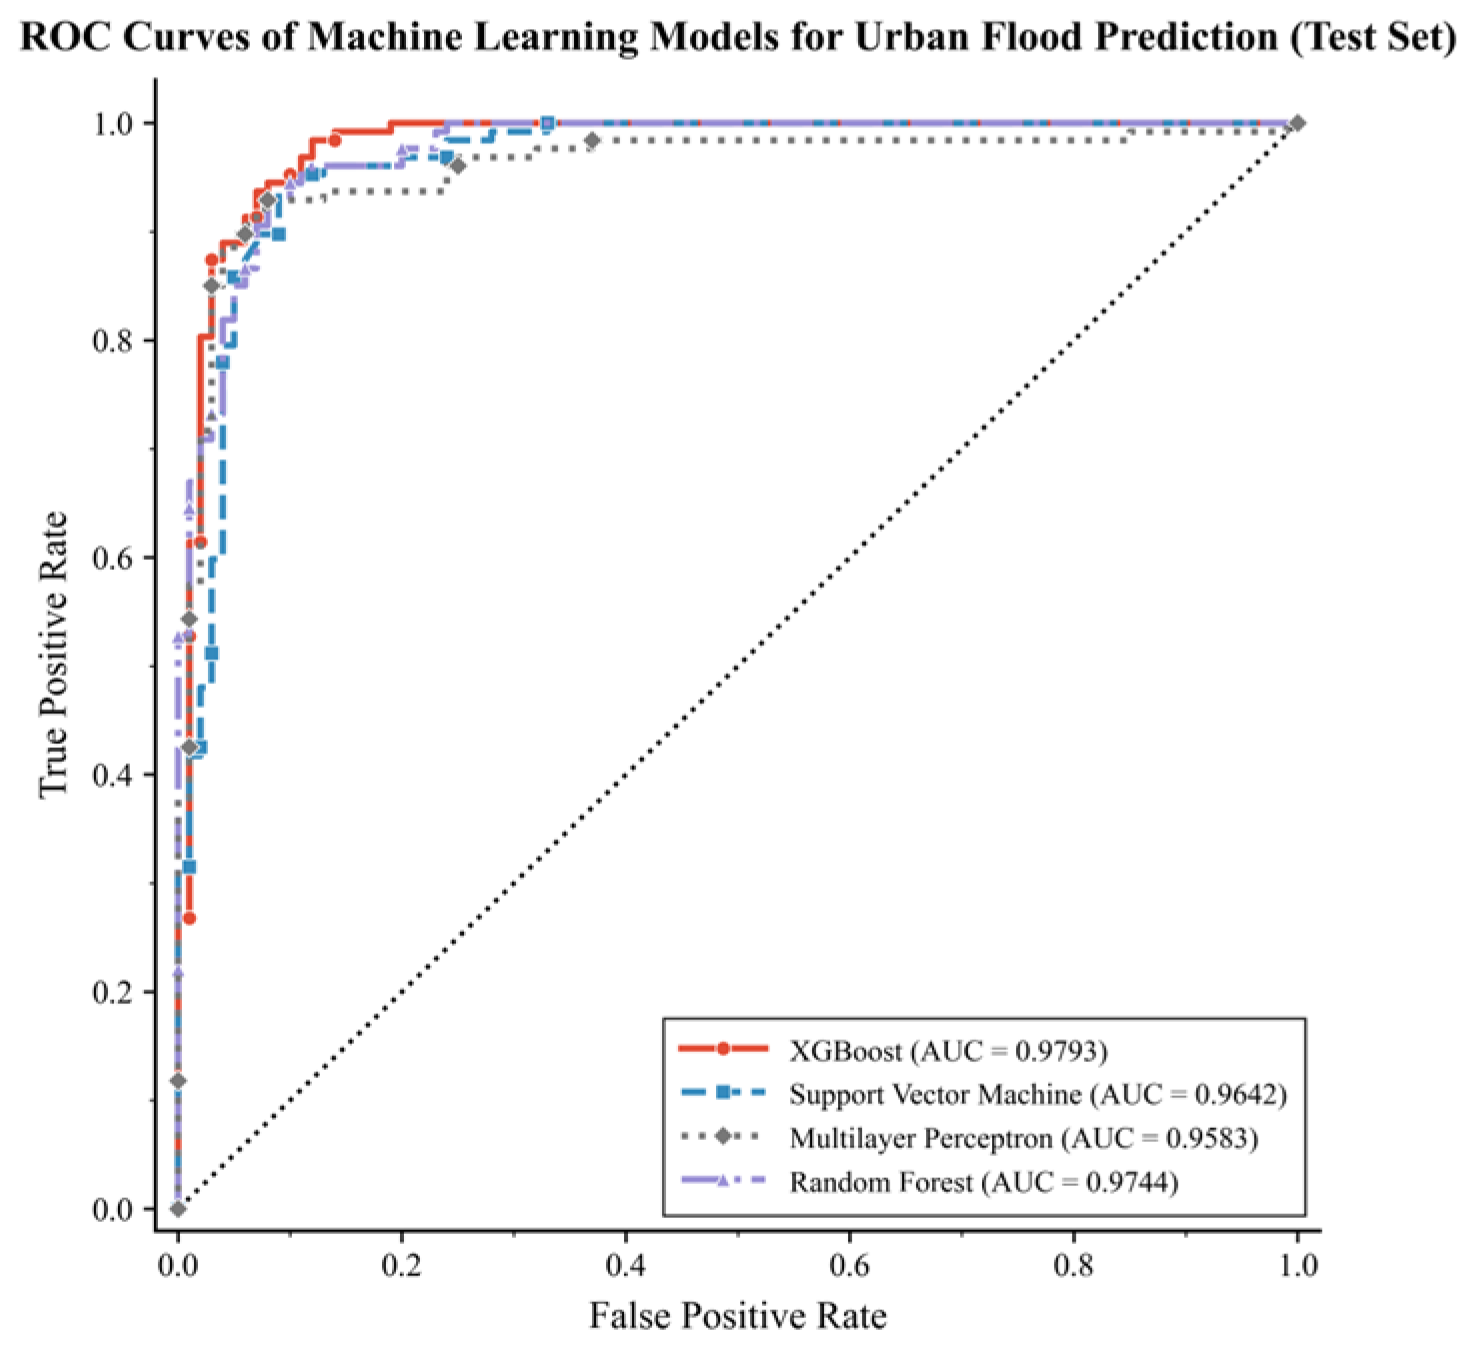
The evaluation results suggest that all four machine learning models were able to identify non-linear associations between environmental variables and historical waterlogging occurrence, with AUC values consistently exceeding 95.00% (Figure 5). Among the evaluated models, XGBoost achieved the highest performance on the spatially independent test set. As summarized in Table 2, XGBoost achieved an AUC of 97.93%, a Macro-Precision of 92.32%, and a Macro-Recall of 92.56%, outperforming SVM, Random Forest, and MLP across key metrics. These performance metrics were obtained under the SBCV framework, which evaluates model performance using geographically separated spatial blocks. The high AUC achieved under SBCV suggests that the model retained strong predictive capability when evaluated on geographically independent regions. These results further indicate that the model identified reproducible statistical associations between hydro-climatic, geomorphic variables and historical waterlogging occurrence within the study area.
Figure 5.
ROC curve data of model on test set. The black dotted diagonal line indicates the performance of a random classifier (AUC = 0.5).
While macro-averaged metrics provide a holistic view of overall model stability, the precision in accurately delineating actual historical waterlogging locations (Class 1) is paramount for reliable spatial risk assessment. Misclassifying naturally safe background areas as high-risk zones can lead to severe overestimations of regional vulnerability. Therefore, a targeted evaluation of the models’ discriminatory performance specifically for positive samples was conducted (Table 3).
Table 3.
Predictive performance specifically for inundation instances (Class 1).
The comparative analysis reveals that XGBoost maintains a pronounced advantage in identification precision for actual waterlogging instances (94.35%), surpassing SVM (93.61%), Random Forest (93.49%), and significantly outperforming MLP (90.15%). While the MLP model achieved slightly higher recall (93.70%), reflecting extreme sensitivity to potential risks, its comparatively lower precision indicates a pronounced tendency toward over-classification. In practical applications within resource-scarce plateau cities, relying on algorithms with high false-positive tendencies would introduce a substantial number of pseudo-risk zones, ultimately leading to inefficient spatial planning and mitigation strategies.
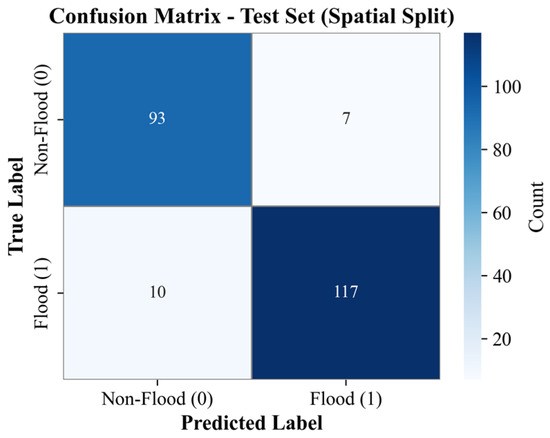
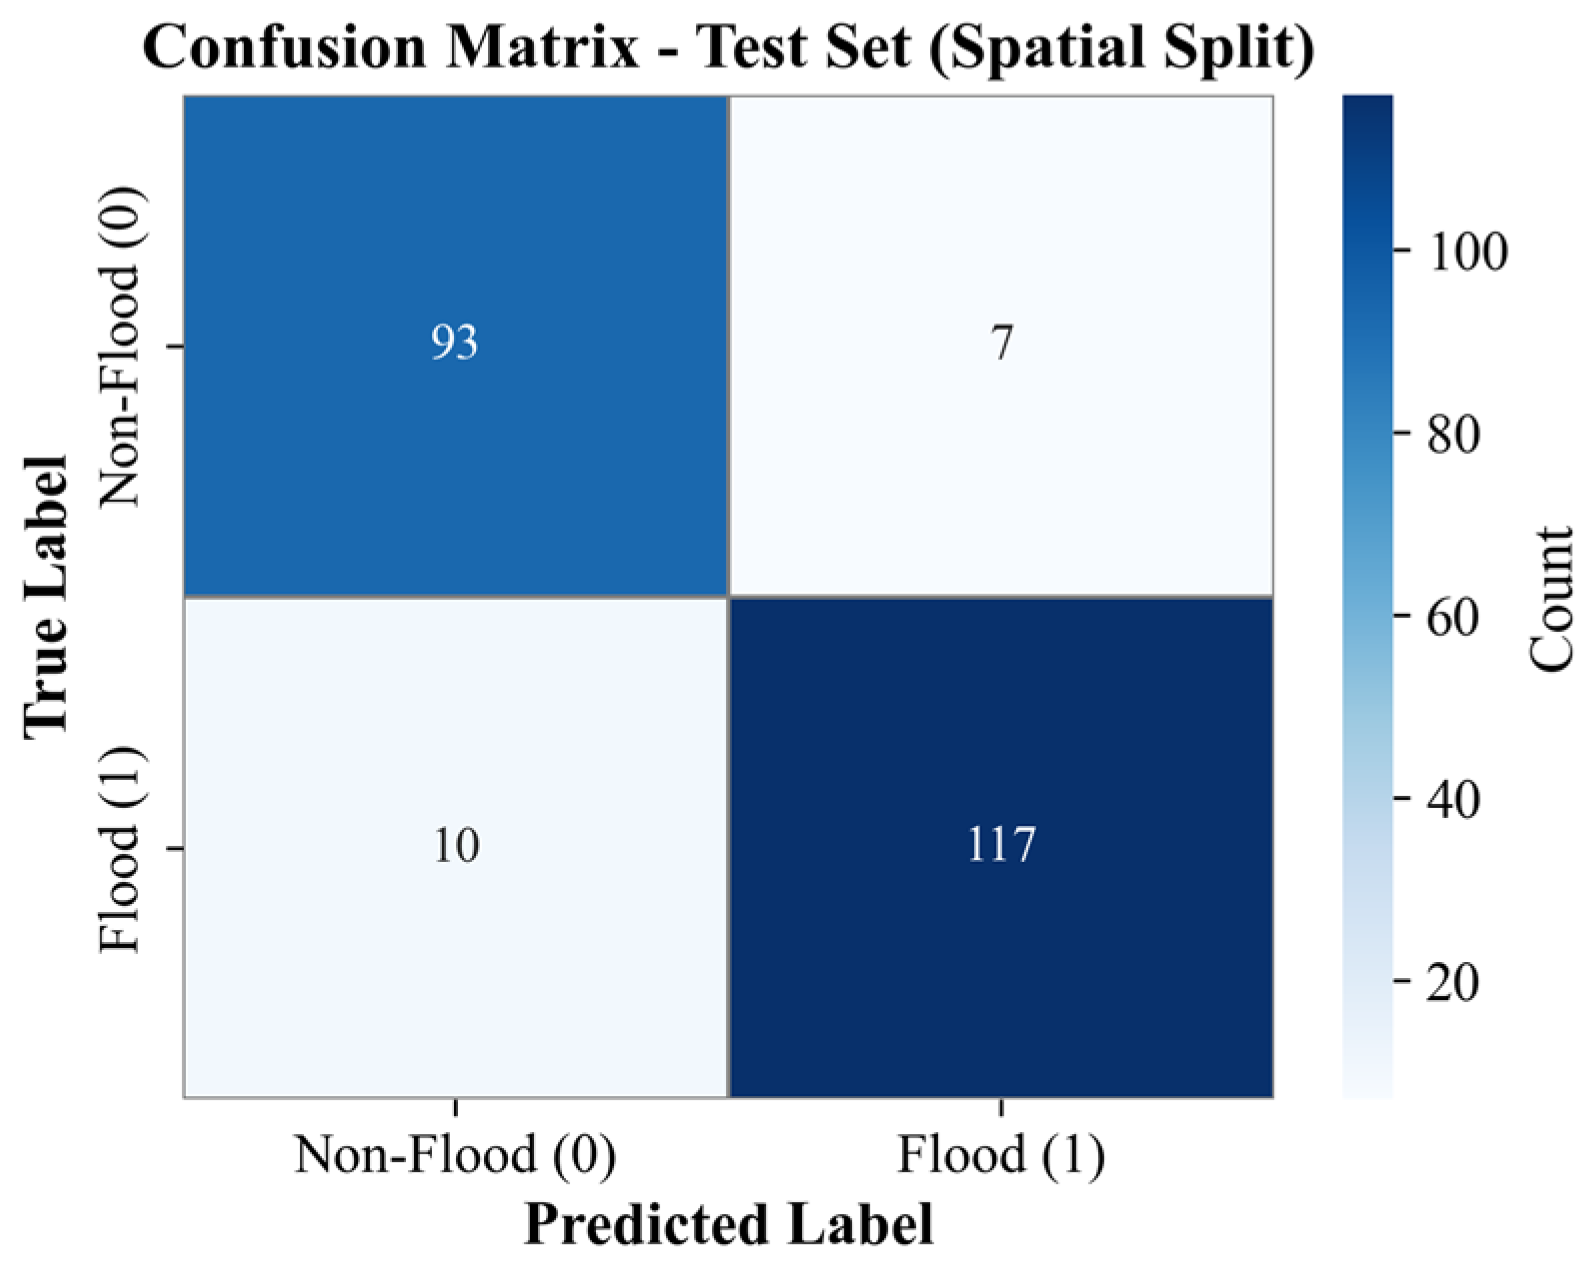
To intuitively evaluate the classification granularity of the optimal XGBoost model, the confusion matrix derived from the independent spatial test set is illustrated in Figure 6. Specifically, among the 127 actual waterlogging samples in the spatial test set, XGBoost accurately identified 117 instances (True Positives, TP = 117). Conversely, out of the 100 non-waterlogging background samples, only 7 were erroneously classified as high-risk zones (False Positives, FP = 7). These results confirm that XGBoost effectively balances sensitivity and specificity within complex alpine geomorphologies. By minimizing the erroneous classification of naturally safe topographies while maintaining robust identification of historical disaster locations, these results indicate that XGBoost provides the most suitable susceptibility modeling framework among the evaluated algorithms for subsequent susceptibility mapping and SHAP-based attribution analysis.
Figure 6.
Confusion matrix of XGBoost (Test Set).
3.3. Spatial Pattern and Geomorphic Gradient-Based Disaster Patterns
3.3.1. Macroscopic Spatial Differentiation of Susceptibility
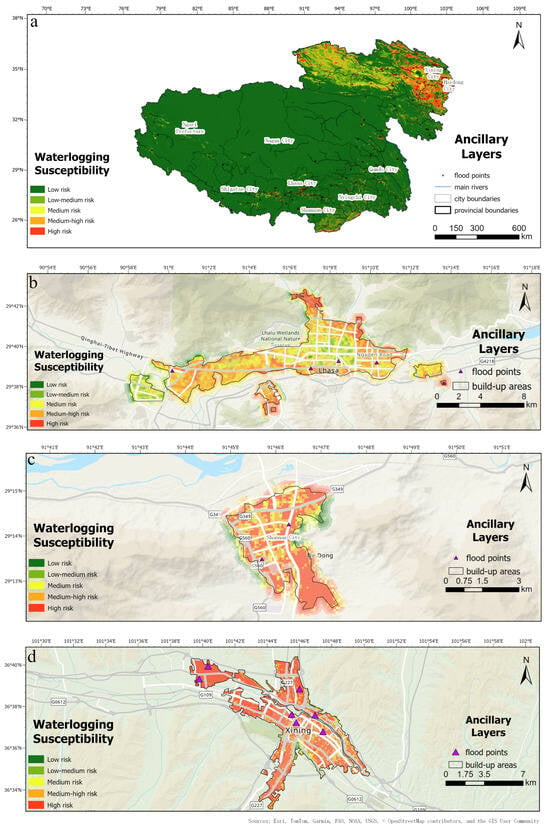
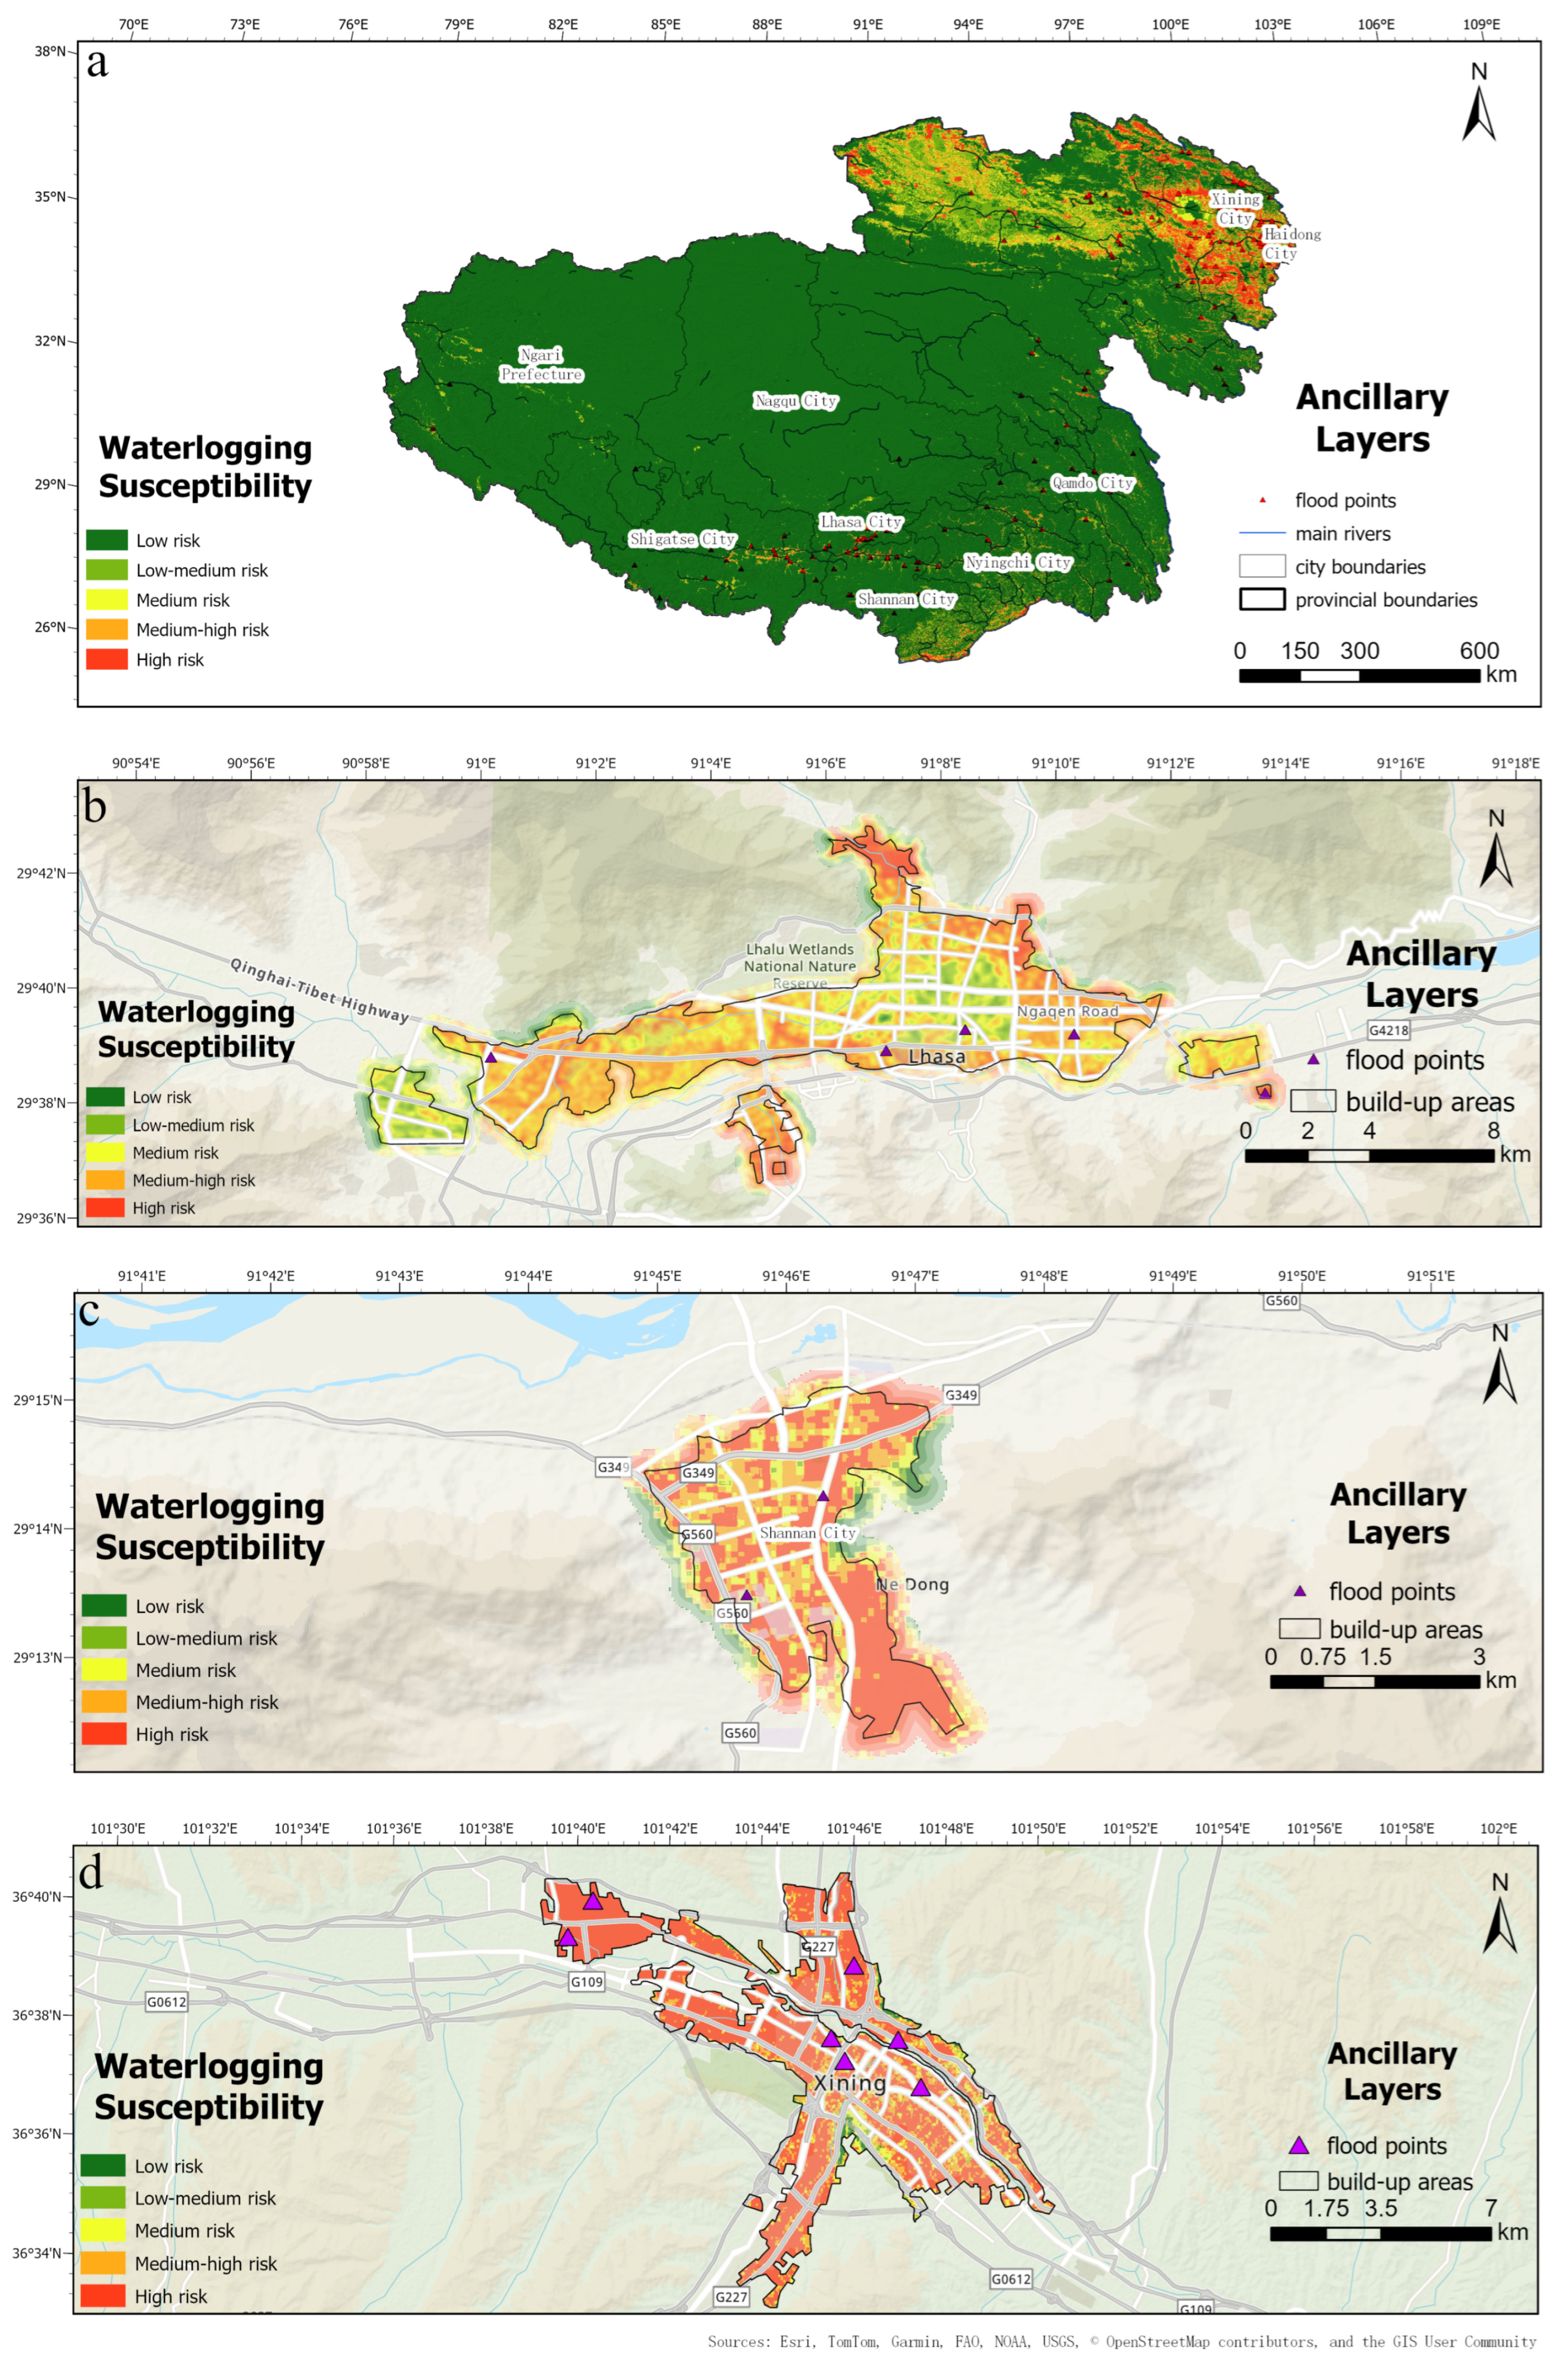
Following the model evaluation, the calibrated XGBoost was deployed to generate a continuous spatial waterlogging susceptibility map for the QTP, categorized into five levels utilizing the Natural Breaks (Jenks) classification method (Figure 7). Across the entire QTP, Level 4–5 susceptibility zones are predominantly concentrated within major river valleys and urbanized corridors, whereas the northwestern hinterland is largely characterized by Level 1–2 classes. Consequently, at the macroscopic scale, the high-susceptibility zones exhibit a pronounced “high in the southeast, low in the northwest” footprint with a strong tendency toward “river-corridor clustering.”
Figure 7.
Spatial reconstruction of urban waterlogging susceptibility across the QTP generated using the calibrated XGBoost model. (a) Susceptibility reconstruction for the entire study area; (b) Lhasa; (c) Shannan; (d) Xining. Area-based statistics discussed in the text were calculated within urban built-up areas.
In the Tibet Autonomous Region, high-risk belts are primarily distributed in strip-like configurations along major river channels (e.g., Yarlung Zangbo and Lhasa Rivers) in the eastern and southern regions, where topographic relief is significant. Conversely, the plateau hinterland (Nagqu) and western region (Ali) exhibit exceptionally low susceptibility, largely shielded by the prevailing arid climate and flat Gobi desert landforms. In Qinghai Province, susceptibility presents a typical “dense in the east” pattern. High-risk zones are intensely clustered in the Huangshui Valley (e.g., Xining City) along the eastern margin. Positioned in the active transition zone to the Loess Plateau, this area experiences severe topographic dissection, which, superimposed on intensive urban expansion, forms a prominent hotspot of waterlogging risk.
To quantitatively characterize the susceptibility structure of plateau urban environments, area proportions of the five susceptibility classes were calculated within urban built-up areas across the QTP and three representative cities (Table 4). At the regional scale, High susceptibility areas account for 45.18% of the total urban built-up area, substantially exceeding the proportions of the remaining classes, indicating that urban development on the QTP is predominantly concentrated within environments exhibiting elevated waterlogging susceptibility. Significant inter-city differences are also evident. Xining exhibits the highest proportion of High susceptibility areas (67.63%), followed by Shannan (42.03%) and Lhasa (23.63%). In contrast, low-susceptibility classes occupy only a limited proportion of the urban landscapes in all three cities. These results suggest a clear increase in susceptibility from relatively open basin environments toward more topographically constrained valley systems.
Table 4.
Area proportion (%) of susceptibility classes within urban built-up areas.
3.3.2. Geomorphic Confinement Effects in Representative Cities
To delve into the evolutionary mechanisms of waterlogging risks under varied geomorphic constraints, we conducted a targeted spatial extraction for the core built-up areas of three representative cities: Lhasa (an alpine wide basin), Shannan (a valley terrace), and Xining (a deeply dissected valley). The quantitative metrics of their highest susceptibility class (Level 5, Very High Risk) are compared in Table 5.
Table 5.
Comparative analysis of high-risk zones in typical plateau cities.
The comparative results indicate a profound “geomorphic confinement effect”: as the degree of topographic confinement escalates, both the spatial footprint and the intensity of the urban disaster risk exhibit a pronounced gradient-driven expansion.
- Alpine Wide Basins (Lhasa): Characterized by expansive flat terrain, Lhasa exhibits a relatively balanced risk gradient. The High-Risk zone accounts for 23.63% of the built-up area, with a mean occurrence probability of 0.89. Within these high-risk grids, the mean HAND is extremely low (4.99 m) alongside a near-flat slope (1.28°). This reflects a classic “low-lying inundation” (ponding) pattern, where extremely flat basin environments provide limited gravitational drainage, rendering waterlogging risks highly dependent on micro-topographic depressions.
- Valley Terraces (Shannan): Situated on narrower river terraces, Shannan’s Level 5 proportion increases sharply to 42.03%, accompanied by an elevated mean probability of 0.92. The slight rise in mean HAND (6.93 m) and slope (2.06°) suggests that urban construction is forced to extend slightly upward along the valley flanks. Despite this, the primary core remains situated in the vulnerable bottomland, exhibiting heightened spatial clustering of risk.
- Deeply Dissected Valleys (Xining): Xining displays an entirely different hydrodynamic logic. Constrained by steep mountains on both sides, the city’s expansion is strictly restricted to narrow river corridors. Level 5 encompasses 67.63% of the urban analysis area, substantially exceeding the proportions observed in Lhasa and Shannan, with the mean probability peaking at an extreme 0.98. More importantly, the mean HAND within these high-risk zones reaches 12.89 m (with a slope of 2.25°), significantly higher than the flat basins. This elevated HAND indicator suggests that high-susceptibility areas are not exclusively concentrated within immediate river-bank depressions but are also distributed across urban sectors located along confined valley slopes and drainage pathways.
Additionally, a spatial co-occurrence pattern between lower Albedo values and highly susceptible urban sectors was observed. The highly confined, high-risk areas in Xining and Shannan are characterized by lower mean surface Albedo (0.14 and 0.12, respectively) compared to the broader basin of Lhasa (0.16). The underlying physical interpretation of this statistical association is further discussed in Section 4.
3.4. SHAP-Based Attribution and Risk Feature Interpretation
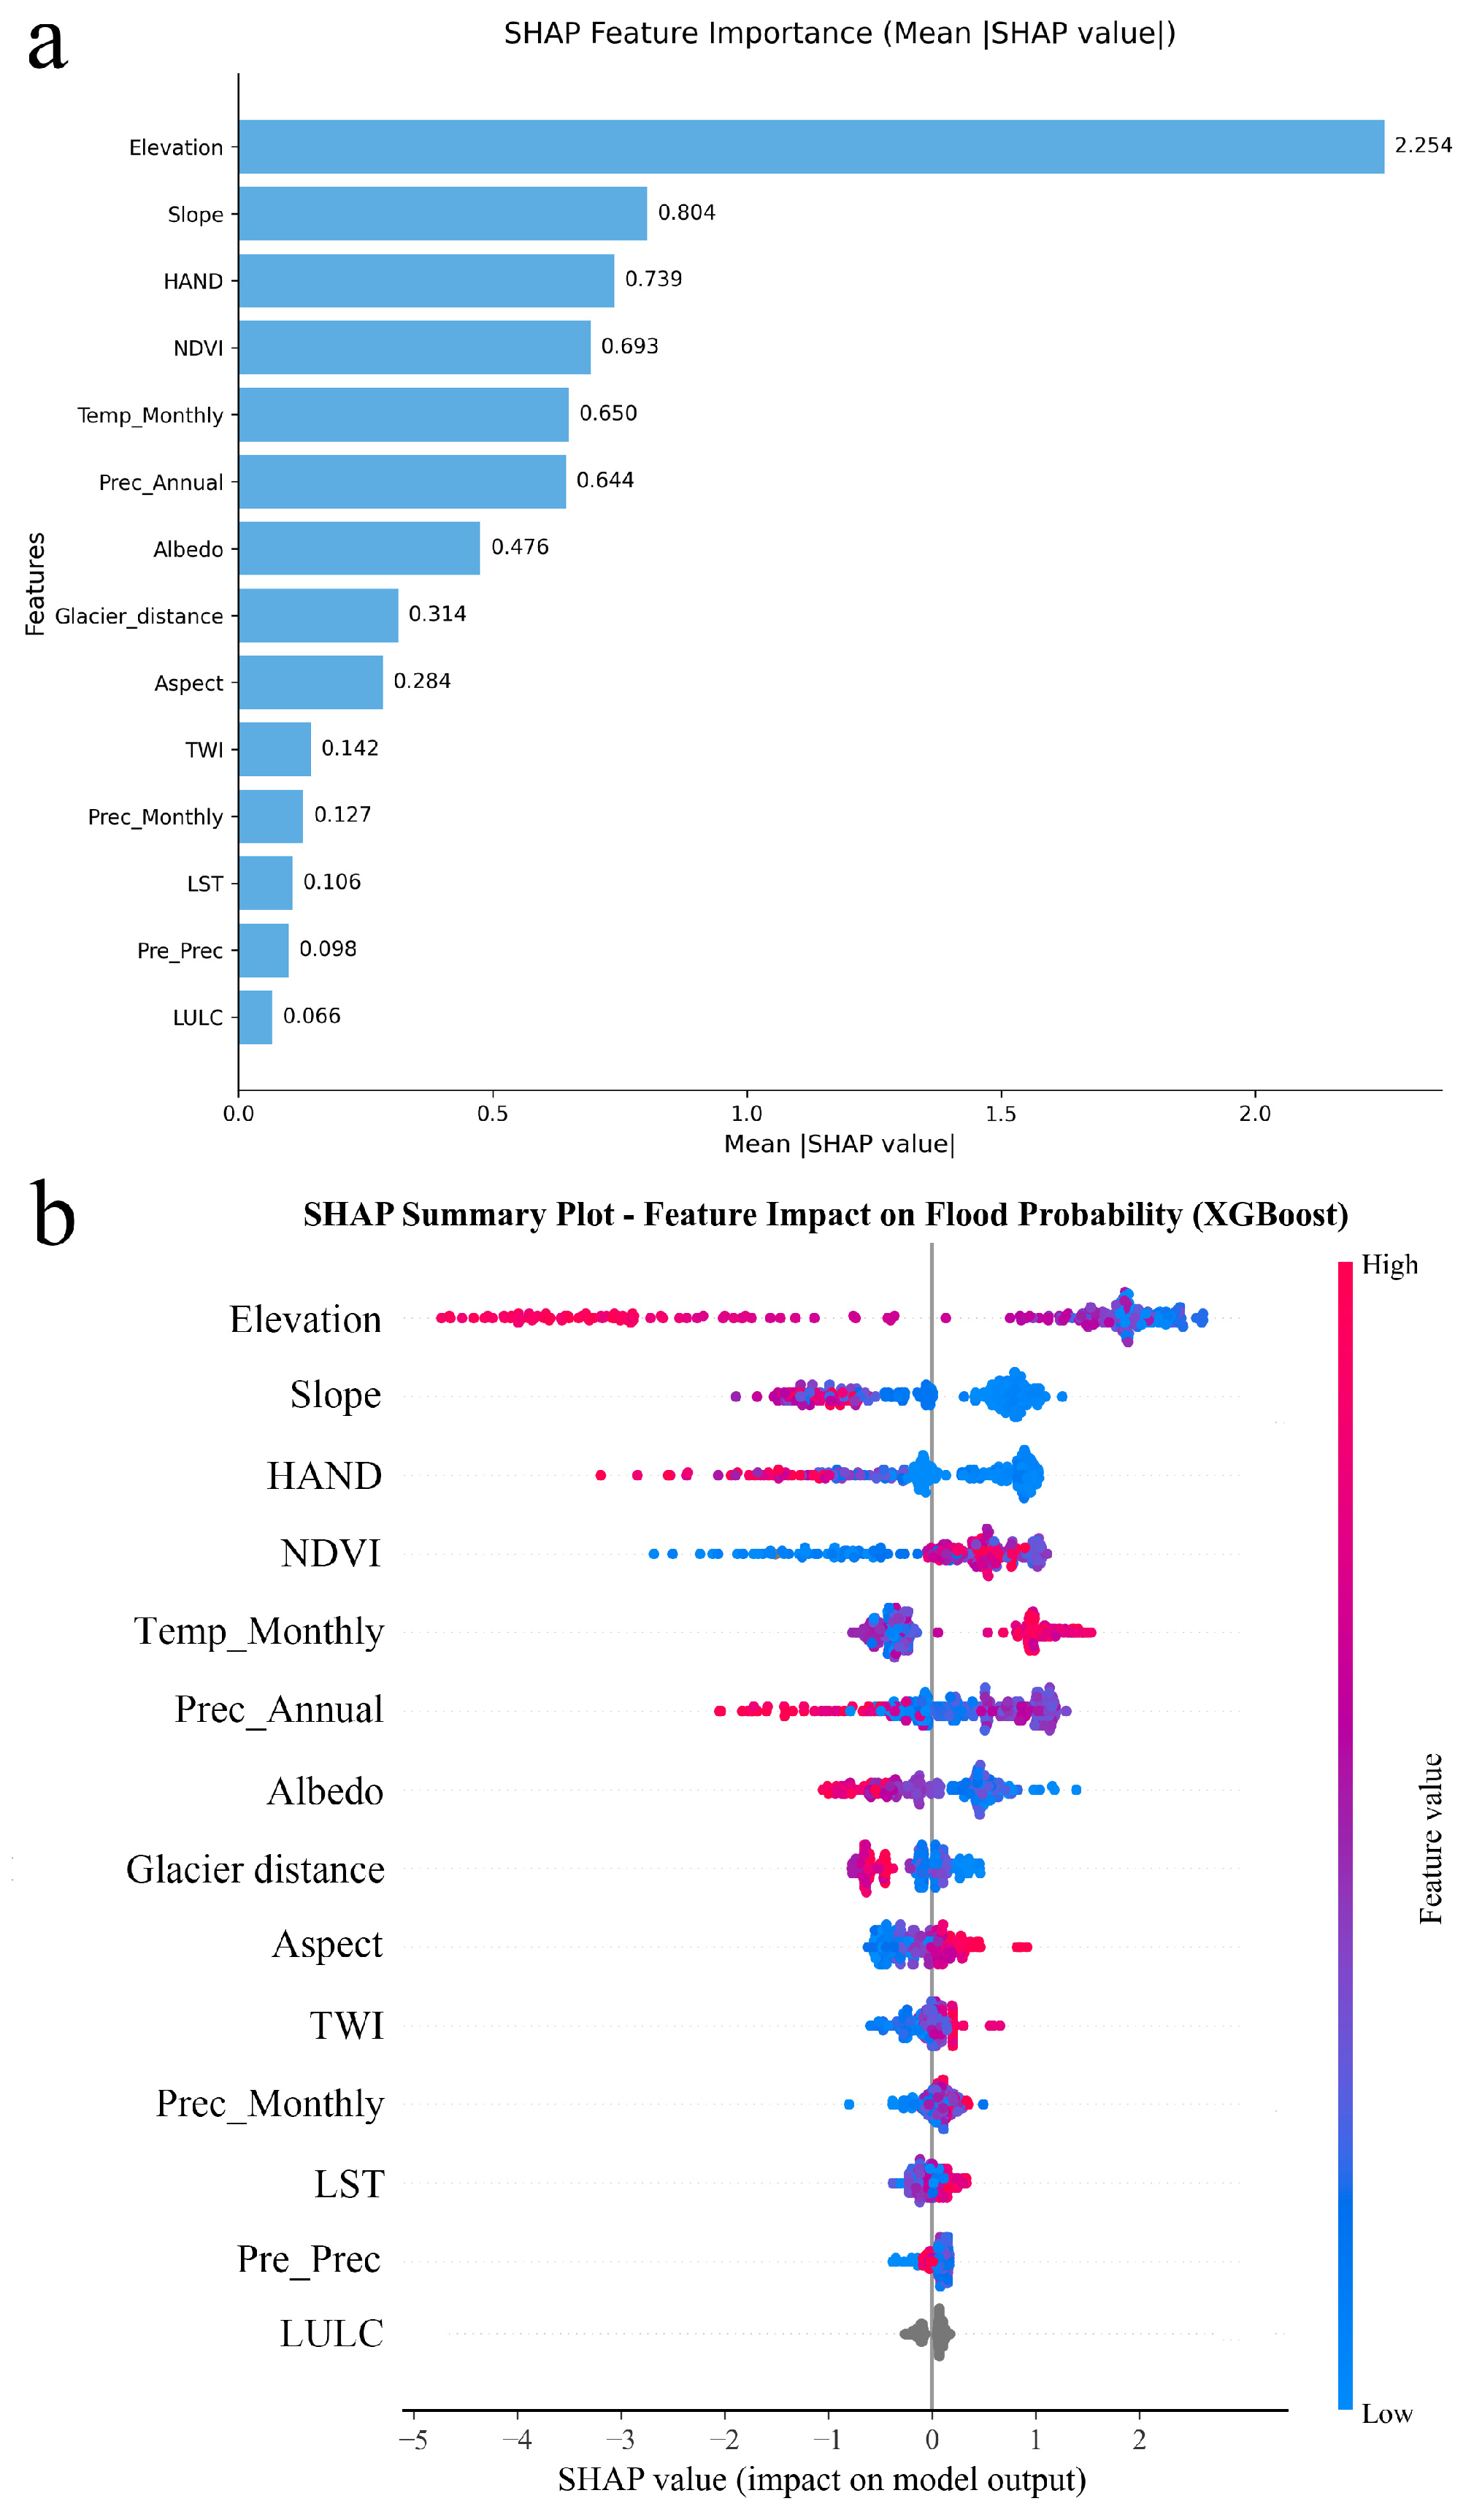
While machine learning models capture complex non-linear associations, the SHAP framework enables the deconstruction of these global predictions into localized marginal contributions (Figure 8). This section reports the statistical attribution patterns identified by the model, providing data-driven insights into the environmental features associated with QTP urban waterlogging.
Figure 8.
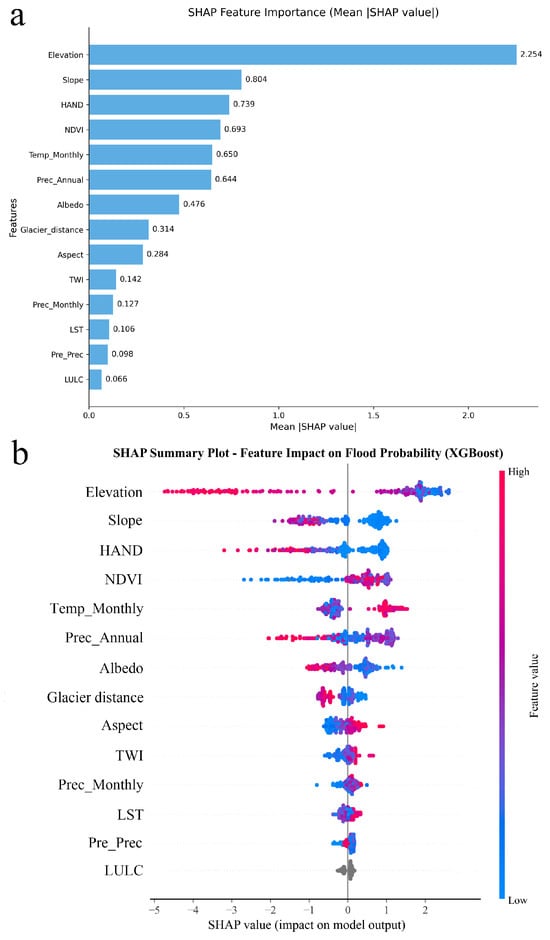
Contribution of each feature to XGBoost based on SHAP: (a) bar chart; (b) summary plot.
3.4.1. Global Feature Importance
An evaluation of the global SHAP feature importance reveals a hierarchy heavily dominated by topography. Elevation (Mean |SHAP| = 2.254) emerges as the most prominent predictive feature, followed by Slope (0.804) and HAND (0.739). Land surface and meteorological factors, such as NDVI (0.693), Monthly Precipitation (0.127), and Pre-precipitation (0.098), exert secondary but distinct modulatory effects. This ranking indicates that geomorphic variables contribute more strongly to model predictions than short-term meteorological variables within the current modeling framework.
3.4.2. Topographic Features and Threshold-like Responses
The binned SHAP data reveal marked transition zones and non-linear responses for key topographic variables, reflecting the non-linear spatial controls governing susceptibility patterns.
HAND: An apparent threshold-like response is observed near 56.5 m. Within the binned intervals below this value, the SHAP marginal contribution shifts to positive (reaching up to +1.03), indicating a strong statistical association with waterlogging occurrences. Conversely, areas with HAND > 84.7 m consistently exhibit negative SHAP values (ranging from −0.60 to −2.54), acting as a suppressing factor in the model’s output.
Slope: Slope exhibits a clear negative contribution pattern. Areas with gentle slopes are predominantly associated with positive SHAP values, whereas steep slopes consistently suppress susceptibility. This pattern suggests that low-gradient surfaces are more conducive to runoff accumulation and temporary ponding, while steep terrain facilitates rapid drainage and limits waterlogging development.
Elevation: The model identifies a pronounced non-linear transition near 4000 m. Below this altitude (specifically within the 1928 m to 2896 m interval), the SHAP contribution peaks (+2.38). Above the 4139 m interval, the SHAP values drop substantially to −3.71, consistent with the limited number of reconstructed historical waterlogging samples located in extremely high-altitude alpine zones.
3.4.3. Interpretation of Land Surface and Climatic Proxies
According to the SHAP analysis, dense vegetation (NDVI > 0.21) exhibited a positive contribution to waterlogging probability (SHAP values up to +0.90), whereas Annual Precipitation showed a complex negative association. Given the environmental context of the QTP, these SHAP-derived associations should be interpreted as statistical relationships and spatial proxies rather than direct evidence of physical disaster-inducing mechanisms.
Due to the arid alpine background, high NDVI regions are predominantly spatially coincident with low-elevation riparian oases, valley bottoms, and urban built-up areas. Given the strong environmental gradients across the QTP, NDVI may partially covary with topographic variables such as elevation and valley morphology. Therefore, its positive SHAP contribution should not be interpreted as an isolated vegetation effect. Instead, the model likely leverages high NDVI as a composite spatial proxy reflecting favorable hydro-geomorphic settings and concentrated human settlements. Similarly, the negative association with Annual Precipitation reflects a spatial mismatch: high annual rainfall concentrates in uninhabited high-altitude mountains, whereas urban valleys typically situate in rain-shadow regions but are triggered by acute events, as reflected by the positive SHAP contributions of Monthly Precipitation (>44.1 mm) and Pre-precipitation (>25.5 mm).
3.4.4. Surface Albedo as an Integrated Environmental Indicator
The model identifies Surface Albedo as a relevant modifying factor, where values below 0.18 generate a positive SHAP contribution (up to +0.66). The observed relationship should be interpreted as a statistical association identified by the data-driven framework rather than evidence of a direct physical causal mechanism. Rather than representing a singular physical process, this threshold zone likely acts as an integrated environmental indicator within the model. Low surface Albedo in plateau river valleys may be associated with higher antecedent soil moisture, variations in vegetation cover, or the presence of urban impervious surfaces (e.g., asphalt). The potential coupled physical mechanisms—such as the interaction between urban thermal dynamics and localized convective precipitation—require further investigation and are discussed in Section 4.
4. Discussion
4.1. Thermal-Hydrological Feedback and Cryospheric Interactions
A distinctive finding of this study is the statistical association between surface energy balance factors (Albedo and LST) and extreme waterlogging susceptibility. Rather than acting as isolated meteorological triggers, these variables likely serve as integrated environmental signals that reflect a complex “thermal-hydrological” feedback loop unique to the QTP.
One possible explanation for this association, consistent with previous cryospheric and boundary-layer studies, involves two concomitant processes. First, low Albedo often coincides with high antecedent soil moisture (darker saturated surfaces), indicating an impaired infiltration capacity prior to storm events. Second, in urbanized valleys, expansive Low-Albedo impervious surfaces (e.g., asphalt) heavily absorb shortwave radiation. Previous meteorological studies on the plateau have suggested that such urban underlying surfaces can trigger localized Urban Heat Island (UHI) effects. Under the intense solar radiation of the QTP, this anomalous sensible heat flux may thicken the atmospheric boundary layer and potentially exacerbate localized short-duration convective storms. Furthermore, long-term warming and localized thermal anomalies are theoretically linked to the degradation of underlying permafrost and the melting of seasonal snowpack. The resultant thickening of the active layer may promote a shift from infiltration-excess runoff toward saturation-excess runoff, inherently amplifying peak flows. While these physical chains require further validation through in situ hydrodynamic and boundary-layer observations, our SHAP-derived attributions statistically align with the escalating hydrological volatility observed in warming alpine regions.
4.2. Heterogeneity and the Geomorphic Confinement Effect
The most striking scientific insight and conceptual framework derived from our downscaling model is the proposed “geomorphic confinement effect.” The results suggest that waterlogging risk on the QTP is not solely driven by meteorological conditions, but is strongly conditioned by the degree of geomorphic confinement imposed by valley architecture. As geomorphic confinement intensifies, the spatial footprint of the High-risk zone expands drastically from Lhasa (23.63%) to Shannan (42.03%), peaking in Xining (67.63%). Simultaneously, the mean HAND within these High-risk zones surges from 4.99 m to 12.89 m. This gradient reveals three distinct evolutionary modes of urban waterlogging mechanisms:
Basin Ponding (e.g., Lhasa): In wide alpine basins, risk is heavily anchored in ultra-flat micro-depressions. The extremely low HAND (<5 m) suggests that stagnant gravitational drainage is the primary vulnerability.
Terrace Concentration (e.g., Shannan): In valley terraces, human settlements are squeezed onto narrow riparian strips. The risk becomes highly clustered, indicating a severe spatial overlap between limited buildable land and the natural floodplains.
Valley Convergence (e.g., Xining): In deeply incised canyons, the remarkably high-risk proportion and elevated HAND (12.89 m) suggest that susceptibility is not restricted to bottomland puddles. Instead, these urban sectors may be affected by rapid hillslope runoff convergence originating from adjacent steep mountainsides.
These heterogeneous mechanisms imply that mitigation priorities may differ substantially among geomorphic settings. In wide-valley cities such as Lhasa, improving drainage connectivity and maintaining river-channel conveyance capacity may be particularly important. In contrast, canyon-type cities such as Xining may require greater attention to runoff interception and slope-flow management at the mountain–urban interface. Future engineering assessments are needed to evaluate the effectiveness of these strategies under specific local conditions.
Traditional urban flood studies commonly emphasize precipitation intensity, drainage capacity, or impervious surface expansion. Our results suggest that on the QTP, geomorphic confinement may act as an important conditioning factor that shapes how these drivers are translated into spatial patterns of waterlogging susceptibility, thereby contributing to the pronounced heterogeneity observed across different valley settings.
A notable finding is that topographic variables constitute the dominant component of the feature importance hierarchy within the current modeling framework, with Elevation, Slope, and HAND contributing substantially more than precipitation-related variables. This ranking differs from many lowland urban flood studies, where interpretable machine learning frameworks often identify rainfall intensity and impervious-surface characteristics as the primary predictors [45,46]. The discrepancy likely reflects the geomorphic confinement effect identified in this study, whereby urban exposure on the QTP is strongly constrained by valley morphology and topographic architecture, aligning with recent explainable AI findings in other mountainous or high-altitude basins where terrain dominates flood susceptibility [47]. Consequently, the results suggest that topographic factors provide an important spatial framework within which short-term meteorological triggers influence urban waterlogging susceptibility.
4.3. Non-Linear Responses and Statistical Transition Boundaries
The SHAP binning analysis derived several marked response transitions that offer statistical proxies for plateau disaster dynamics. However, it is crucial to recognize that specific numerical values (e.g., the ~44.1 mm transition for monthly precipitation or the ~14.8 km boundary for glacier distance) are inherently dependent on the regional dataset, sampling strategy, and model architecture of this study.
Rather than interpreting these specific numbers as universal physical constants, their scientific value lies in illustrating the highly non-linear nature of plateau urban waterlogging. For instance, the precipitation breakpoint suggests a qualitative leap in risk, reflecting the empirical threshold where the prevalent natural infiltration and early-stage rudimentary drainage systems are systematically overwhelmed by acute convective storms. Similarly, the threshold-like response to glacier proximity statistically delineates an effective spatial radius where glacial meltwater supply synergistically interacts with valley catchments. Beyond this zone, the cryospheric exacerbation effect on urban localized flooding appears to decay significantly. These statistical breakpoints highlight that waterlogging on the QTP responds to environmental drivers through abrupt state changes rather than gradual linear accumulations.
4.4. Methodological Implications and Global Scalability
This study addresses an important challenge in historical disaster research: the scarcity of reliable observations prior to the deployment of dense gauge networks. By integrating LLM-based semantic mining with a spatial downscaling framework (XGBoost-SHAP under SBCV), we demonstrated the potential of transforming unstructured historical archives into spatially explicit susceptibility maps.
This retrospective approach holds significant potential for global generalizability. Other data-scarce high-altitude regions experiencing rapid climate change and early undocumented urbanization—such as the Andes in South America and the Pamirs in Central Asia—face similar challenges. Our framework provides a cost-effective, reproducible pathway to explore long-term historical risk baselines in these regions, which is an essential prerequisite for formulating resilient climate adaptation strategies.
Previous urban flood susceptibility studies based on machine-learning approaches generally reported AUC values ranging from approximately 0.85 to 0.94, depending on data availability, spatial resolution, and environmental complexity [48,49,50]. The AUC achieved in this study (0.9793) falls within the upper end of this range, suggesting that the proposed framework is capable of capturing the dominant controls of urban waterlogging across the QTP despite the substantial limitations of historical observations.
4.5. Uncertainties, Limitations, and Future Outlook
Despite the robust cross-validation, the historical reconstruction inevitably entails inherent limitations. First, historical disaster archives are inherently subject to reporting bias. Textual records tend to document severe events with significant socioeconomic impacts, meaning our positive samples approximate “recorded severe waterlogging” rather than a comprehensive inventory of all minor ponding events. Second, there is an inherent scale mismatch between the high-resolution topographic data (30 m) and the coarser meteorological covariates (e.g., 0.1° precipitation). While spatial interpolation and buffering facilitate modeling, they introduce localized blurring, limiting the model’s capacity to simulate ultra-fine hydrodynamic processes. Lastly, the current data-driven framework establishes statistical associations rather than strict physical causality.
Future research should prioritize coupling machine learning susceptibility maps with physics-based 2D hydrodynamic models. Furthermore, incorporating higher-resolution dynamic remote sensing products (e.g., SAR-based impervious surface monitoring) and in situ soil moisture observations will be vital for unraveling the underlying physical mechanisms of multi-hazard cascading effects in alpine cities.
An additional source of uncertainty arises from the spatial reconstruction procedure used to generate historical flood samples. Because precise coordinates were unavailable in historical archives, reconstructed sample locations were partially constrained by geomorphic indicators, particularly the HAND index and local hydrological features. Consequently, the subsequent importance assigned to these variables by the SHAP framework should be interpreted with caution. Their high contributions may reflect both genuine hydro-geomorphic controls on waterlogging occurrence and the prior topographic assumptions embedded during sample reconstruction. Therefore, the identified “Geomorphic Confinement Effect” should be viewed as a data-supported interpretation derived from reconstructed historical samples rather than fully independent physical evidence. Future studies based on independent observations or physics-based hydrodynamic simulations are required to further validate these relationships.
5. Conclusions
This study developed an integrated retrospective framework—combining LLMs-based semantic mining, historical disaster reconstruction, and XGBoost-SHAP modeling—to evaluate urban waterlogging susceptibility across the QTP during 1985–2003. By transforming fragmented historical archives into spatially explicit training samples, this approach enabled the reconstruction of a long-term susceptibility atlas for a data-scarce period of early rapid urbanization. The core conclusions of this study are summarized as follows:
First, the proposed retrospective framework is feasible and reliable under severe historical data constraints. Rather than relying on dense gauge networks, the integration of qualitative disaster texts and quantitative topographic/environmental features provided a practical framework for reconstructing historical hazard processes in data-sparse alpine regions.
Second, a pronounced “geomorphic confinement effect” was identified as an important factor shaping the spatial differentiation of urban waterlogging on the QTP. Within the established modeling framework, geomorphic variables exhibited higher explanatory importance than most meteorological variables, highlighting the strong influence of valley morphology and topographic architecture on susceptibility patterns. Comparative analyses revealed three distinct disaster patterns—basin ponding (e.g., Lhasa), terrace concentration (e.g., Shannan), and valley convergence (e.g., Xining). This conceptual framework suggests that, under similar hydrometeorological conditions, increasing topographic confinement is associated with a progressive expansion of susceptibility from riverbank depressions toward areas influenced by rapid hillslope runoff, emphasizing the importance of incorporating geomorphic settings into urban flood-risk management.
Third, thermal-hydrological interactions act as critical secondary modulators of extreme susceptibility. Surface Albedo and land surface temperature exhibited significant statistical associations with high-risk zones. While direct causality requires future observational validation, these non-linear responses may reflect coupled physical processes, potentially linked to antecedent soil moisture anomalies, urban heat island effects, and cryospheric thermal degradation.
Finally, the established methodology offers transferable value for global mountain research. Beyond establishing a vital historical baseline for flood-risk management and climate adaptation on the QTP, this weakly supervised reconstruction framework provides a replicable, cost-effective pathway for historical hazard assessment in other data-scarce, high-altitude regions globally (e.g., the Andes and the Pamirs), where long-term observations are limited but climate-related risks are rapidly escalating.
Author Contributions
Conceptualization, Yuheng Liu and Libin Su; methodology, Yuheng Liu; software, Yuheng Liu; validation, Yuheng Liu, Libin Su and Yongtao Yang; formal analysis, Yuheng Liu; investigation, Yuheng Liu, Yonggang Guo and Tongliang Gong; resources, Libin Su and Tongliang Gong; data curation, Yuheng Liu and Yonggang Guo; writing—original draft preparation, Yuheng Liu; writing—review and editing, Libin Su and Yongtao Yang; visualization, Yuheng Liu; supervision, Libin Su; project administration, Libin Su; funding acquisition, Libin Su. All authors have read and agreed to the published version of the manuscript.
Funding
This research was funded by the Key Research and Development Plan of the Tibet Autonomous Region, grant number XZ202501ZY0004 (Key technologies for non-equilibrium regulation of water-sediment-energy and water engineering safety in Tibet’s rivers and lakes) and the National Natural Science Foundation of China, grant number U22A20596 (Research on the evolution mechanism and safety control of highway slope disasters under high altitude and high intensity conditions).
Data Availability Statement
The public environmental datasets used in this study are available from the National Tibetan Plateau Data Center (https://data.tpdc.ac.cn/), the National Climate Data Center of China (https://www.ncdc.ac.cn/portal/), and the MERIT Hydro dataset (https://global-hydrodynamics.github.io/MERIT_Hydro/). The custom code and processed waterlogging database are not publicly available due to ongoing research projects but can be made available by the corresponding author on reasonable request.
Acknowledgments
The authors would like to sincerely thank the National Tibetan Plateau Data Center (TPDC) and the National Cryosphere Desert Data Center (NCDDC) for generously providing the hazard samples and environmental impact factor datasets utilized in this study. We are also grateful to Dai Yamazaki for providing the MERIT Hydro dataset, which was instrumental in our geospatial analysis.
Conflicts of Interest
The authors declare that there is no conflict of interest.
References
- Legg, S. IPCC, 2021: Climate Change 2021—The Physical Science basis. Interaction 2021, 49, 44–45. [Google Scholar]
- Gao, X.-J.; Su, B.; Xiao, C.-D. Interpretation of IPCC SR1.5 on cryosphere change and its impacts. Clim. Change Res. 2019, 15, 395–404. [Google Scholar] [CrossRef]
- Chug, D.; Pathak, A.; Indu, J.; Jain, S.K.; Jain, S.K.; Dimri, A.P.; Niyogi, D.; Ghosh, S. Observed Evidence for Steep Rise in the Extreme Flow of Western Himalayan Rivers. Geophys. Res. Lett. 2020, 47, e2020GL087815. [Google Scholar] [CrossRef] [Scilit]
- Yin, C.; Zhu, A.L.; Zhou, Q.; Meng, F.; Chen, R.; Liu, F.; Chen, Q.; Guo, X. Rapid urban expansion and potential disaster risk on the Qinghai-Tibetan Plateau in the 21st century. Landsc. Ecol. 2024, 39, 35. [Google Scholar] [CrossRef] [Scilit]
- Yanling, Y.; Yue, W.; Quanliang, C.; Yujing, L. Temporal and spatial variation characteristics of extreme precipitation in central and eastern Tibetan Plateau. J. Arid Meteorol. 2023, 41, 714–722. [Google Scholar] [CrossRef]
- Fernández, D.; Lutz, M.A. Urban flood hazard zoning in Tucumán Province, Argentina, using GIS and multicriteria decision analysis. Eng. Geol. 2010, 111, 90–98. [Google Scholar] [CrossRef] [Scilit]
- Ya, R.; Wu, J.; Tang, R.; Zhou, Q. Increased flood susceptibility in the Tibetan Plateau with climate and land use changes. Ecol. Indic. 2023, 156, 111086. [Google Scholar] [CrossRef] [Scilit]
- Qin, Z.; Peng, T.; Wang, J.; Dong, X.; Chang, W.; Ma, H.; Liu, J.; Wang, G. Design flood revision for the upper Huaihe River Basin based on SWAT model. J. Lake Sci. 2021, 33, 595–606. [Google Scholar] [CrossRef] [Scilit]
- Rubio, C.; Yu, I.; Kim, H.; Jeong, S. Index-based flood risk assessment for Metro Manila. Water Supply 2020, 20, 851–859. [Google Scholar] [CrossRef] [Scilit]
- Su, F.; Pritchard, H.D.; Yao, T.; Huang, J.; Ou, T.; Meng, F.; Sun, H.; Li, Y.; Xu, B.; Zhu, M. Contrasting fate of western Third Pole’s water resources under 21st century climate change. Earth’s Future 2022, 10, e2022EF002776. [Google Scholar] [CrossRef] [Scilit]
- Shi, Y.; Shen, Y.; Li, D.; Zhang, G.; Ding, Y.; Hu, R.; Kang, E. Discussion on the Present Climate Change from Warm-Dry to Warm Wet in Northwest China. Quat. Sci. 2003, 23, 152–164. [Google Scholar]
- Chao, Y.; Yang, G. Evolving relationship between rural development and urbanization in China since 1949. Econ. Geogr. 2019, 39, 139–145. [Google Scholar] [CrossRef]
- Fu, S.; Schultz, D.M.; Lyu, H.; Zheng, Z.; Zhang, C. Creating a national urban flood dataset for China from news texts (2000–2022) at the county level. Hydrol. Earth Syst. Sci. 2025, 29, 767–783. [Google Scholar] [CrossRef] [Scilit]
- Mayo, R.; Zlydenko, O.; Bootbool, M.; Fronman, S.; Gilon, O.; Hassidim, A.; Kratzert, F.; Loike, G.; Matias, Y.; Nakar, Y. Groundsource: A dataset of flood events from news. EarthArXiv 2026. [Google Scholar] [CrossRef] [Scilit]
- Gu, H.; Xiao, J.; Shen, D.; Zhang, C.; Xiao, S.; Niu, Z.; Yu, F.; Environment. A combination of social media and satellite data improves flood monitoring in China. Commun. Earth 2026, 7, 116. [Google Scholar] [CrossRef] [Scilit]
- Han, Y.; Liu, J.; Luo, A.; Wang, Y.; Bao, S. Fine-Tuning LLM-Assisted Chinese Disaster Geospatial Intelligence Extraction and Case Studies. ISPRS Int. J. Geo-Inf. 2025, 14, 79. [Google Scholar] [CrossRef] [Scilit]
- Wang, P.K.; Lin, K.-H.E.; Liao, Y.-C.; Liao, H.-M.; Lin, Y.-S.; Hsu, C.-T.; Hsu, S.-M.; Wan, C.-W.; Lee, S.-Y.; Fan, I.C.; et al. Construction of the REACHES climate database based on historical documents of China. Sci. Data 2018, 5, 180288. [Google Scholar] [CrossRef] [Scilit] [PubMed]
- Paprotny, D.; Sebastian, A.; Morales-Nápoles, O.; Jonkman, S.N. Trends in flood losses in Europe over the past 150 years. Nat. Commun. 2018, 9, 1985. [Google Scholar] [CrossRef] [Scilit] [PubMed]
- Tellman, B.; Sullivan, J.A.; Kuhn, C.; Kettner, A.J.; Doyle, C.S.; Brakenridge, G.R.; Erickson, T.A.; Slayback, D.A. Satellite imaging reveals increased proportion of population exposed to floods. Nature 2021, 596, 80–86. [Google Scholar] [CrossRef] [Scilit] [PubMed]
- Rosvold, E.L.; Buhaug, H. GDIS, a global dataset of geocoded disaster locations. Sci. Data 2021, 8, 61. [Google Scholar] [CrossRef] [Scilit] [PubMed]
- Mi, R.; Ni, S.L.; Liu, S.M. Analysis of grid distribution characteristics of agricultural population in China based on land use data. Arid. Land Geogr. 2025, 48, 1006–1019. [Google Scholar] [CrossRef]
- Liu, G. The Statistics of Natural Disasters in Tibet Autonomous Region (1950–2002); National Tibetan Plateau Data Center: Xining, China, 2014. [Google Scholar]
- Qinghai Provincial Bureau of Statistics. The Statistics of Natural Disasters in Qinghai (1950–2000). National Tibetan Plateau/Third Pole Environment Data Center (TPDC), China. 2015. Available online: https://data.tpdc.ac.cn/ (accessed on 5 July 2026).
- Boldbaatar, G.; Gombodorj, G.; Donorov, D.; Andriambololonaharisoamalala, R.; Indra, M.; Purevtseren, M. Land suitability analysis in monocentric post-socialist city: Case of Ulaanbaatar, Mongolia. PLoS ONE 2024, 19, e0308762. [Google Scholar] [CrossRef] [Scilit] [PubMed]
- Jie, Y. China’s 30 m annual land cover dataset and its dynamic changes (1985–2022). Earth Syst. Sci. Data 2023, 13, 3907–3925. [Google Scholar] [CrossRef]
- Shiyin, L.; Wanqin, G.; Junli, X. The Second Glacial Catalogue Data Set of China (v1.0). National Cryosphere Desert Data Center. 2020. Available online: https://cstr.cn/CSTR:11738.11.ncdc.Westdc.2020.656 (accessed on 5 July 2026).
- Song, X. Dataset of Vegetation Index, Albedo and Land Surface Temperature on the Qinghai Tibet Plateau (1981–2020). Dataset. National Tibetan Plateau/Third Pole Environment Data Center (TPDC), China. 2024. Available online: https://data.tpdc.ac.cn/en/data/ (accessed on 5 July 2026).
- He, J.; Yang, K.; Li, X.; Tang, W.; Shao, C.; Jiang, Y.; Ding, B. China Meteorological Forcing Dataset v2.0 (1951–2024). National Tibetan Plateau. 2025. Available online: https://cstr.cn/18406.11.Atmos.tpdc.302088 (accessed on 5 July 2026).
- Yamazaki, D.; Ikeshima, D.; Sosa, J.; Bates, P.D.; Allen, G.H.; Pavelsky, T.M. MERIT Hydro: A high-resolution global hydrography map based on latest topography dataset. Water Resour. Res. 2019, 55, 5053–5073. [Google Scholar] [CrossRef] [Scilit]
- Rennó, C.D.; Nobre, A.D.; Cuartas, L.A.; Soares, J.V.; Hodnett, M.G.; Tomasella, J.; Waterloo, M.J. HAND, a new terrain descriptor using SRTM-DEM: Mapping terra-firme rainforest environments in Amazonia. Remote Sens. Environ. 2008, 112, 3469–3481. [Google Scholar] [CrossRef] [Scilit]
- Khosravi, K.; Nohani, E.; Maroufinia, E.; Pourghasemi, H.R. A GIS-based flood susceptibility assessment and its mapping in Iran: A comparison between frequency ratio and weights-of-evidence bivariate statistical models with multi-criteria decision-making technique. Nat. Hazards 2016, 83, 947–987. [Google Scholar]
- Sørensen, R.; Zinko, U.; Seibert, J. On the calculation of the topographic wetness index: Evaluation of different methods based on field observations. Hydrol. Earth Syst. Sci. 2006, 10, 101–112. [Google Scholar] [CrossRef] [Scilit]
- Chowdhuri, I.; Pal, S.C.; Chakrabortty, R. Flood susceptibility mapping by ensemble evidential belief function and binomial logistic regression model on river basin of eastern India. Adv. Space Res. 2020, 65, 1466–1489. [Google Scholar] [CrossRef] [Scilit]
- Chu, D.; Liu, L.; Wang, Z. Snow Cover on the Tibetan Plateau and Topographic Controls. Remote Sens. 2023, 15, 4044. [Google Scholar] [CrossRef] [Scilit]
- Wang, B.; Bao, Q.; Hoskins, B.; Wu, G.; Liu, Y. Tibetan Plateau warming and precipitation changes in East Asia. Geophys. Res. Lett. 2008, 35, L14702. [Google Scholar] [CrossRef] [Scilit]
- Sun, H.; Yao, T.-D.; Su, F.-G.; Ou, T.; He, Z.; Tang, G.; Chen, D. Increased glacier melt enhances future extreme floods in the southern Tibetan Plateau. Adv. Clim. Change Res. 2024, 15, 431–441. [Google Scholar] [CrossRef] [Scilit]
- Worni, R.; Huggel, C.; Stoffel, M. Glacial lakes in the Indian Himalayas—From an area-wide glacial lake inventory to on-site and modeling based risk assessment of critical glacial lakes. Sci. Total Environ. 2013, 468–469, S71–S84. [Google Scholar] [CrossRef] [Scilit] [PubMed]
- Siswanto, S.Y.; Francés, F. How land use/land cover changes can affect water, flooding and sedimentation in a tropical watershed: A case study using distributed modeling in the Upper Citarum watershed, Indonesia. Environ. Earth Sci. 2019, 78, 550. [Google Scholar] [CrossRef] [Scilit]
- Dekker, S.C.; Rietkerk, M.; Bierkens, M.F.P. Coupling microscale vegetation–soil water and macroscale vegetation–precipitation feedbacks in semiarid ecosystems. Glob. Change Biol. 2007, 13, 671–678. [Google Scholar] [CrossRef] [Scilit]
- Lin, X.; Wen, J.; Liu, Q.; You, D.; Wu, S.; Hao, D.; Xiao, Q.; Zhang, Z.; Zhang, Z. Spatiotemporal Variability of Land Surface Albedo over the Tibet Plateau from 2001 to 2019. Remote Sens. 2020, 12, 1188. [Google Scholar] [CrossRef] [Scilit]
- Chapi, K.; Singh, V.P.; Shirzadi, A.; Shahabi, H.; Bui, D.T.; Pham, B.T.; Khosravi, K. A novel hybrid artificial intelligence approach for flood susceptibility assessment. Environ. Model. Softw. 2017, 95, 229–245. [Google Scholar] [CrossRef] [Scilit]
- Tsangaratos, P.; Ilia, I. Comparison of a logistic regression and Naïve Bayes classifier in landslide susceptibility assessments: The influence of models complexity and training dataset size. Catena 2016, 145, 164–179. [Google Scholar] [CrossRef] [Scilit]
- Chen, J.; Yang, S.T.; Li, H.W.; Zhang, B.; Lv, J.R. Research on Geographical Environment Unit Division Based on the Method of Natural Breaks (Jenks). Int. Arch. Photogramm. Remote Sens. Spat. Inf. Sci. 2013, XL-4/W3, 47–50. [Google Scholar] [CrossRef] [Scilit]
- Su, H.; Ma, X.; Li, M. An improved spatio-temporal clustering method for extracting fire footprints based on MCD64A1 in the Daxing’anling Area of north-eastern China. Int. J. Wildland Fire 2023, 32, 679–693. [Google Scholar] [CrossRef] [Scilit]
- Zhao, J.; Zhang, C.; Wang, J.; Abbas, Z.; Zhao, Y. Machine learning and SHAP-based susceptibility assessment of storm flood in rapidly urbanizing areas: A case study of Shenzhen, China. Geomat. Nat. Hazards Risk 2024, 15, 2311889. [Google Scholar] [CrossRef] [Scilit]
- Zhou, Y.; Lu, H.; Liu, S.; Zhang, S. An Explainable Ensemble Machine Learning Framework for Flood Susceptibility Mapping Using Social Media Data: A Case Study of Guangzhou, China. Remote Sens. 2026, 18, 1495. [Google Scholar] [CrossRef] [Scilit]
- He, F.; Liu, S.; Mo, X.; Wang, Z. Interpretable flash flood susceptibility mapping in Yarlung Tsangpo River Basin using H2O Auto-ML. Sci. Rep. 2025, 15, 1702. [Google Scholar] [CrossRef] [Scilit] [PubMed]
- Bersabe, J.T.; Jun, B.-W. The machine learning-based mapping of urban pluvial flood susceptibility in Seoul integrating flood conditioning factors and drainage-related data. ISPRS Int. J. Geo-Inf. 2025, 14, 57. [Google Scholar] [CrossRef] [Scilit]
- Qin, Y.; Yu, Y.; Liu, J.; Liu, R. Machine learning-based identification of key factors and spatial heterogeneity analysis of urban flooding: A case study of the central urban area of Ordos. Sci. Rep. 2025, 15, 24749. [Google Scholar] [CrossRef] [Scilit] [PubMed]
- Zhang, X.; Guo, D. Interpretable machine learning framework for urban flood susceptibility assessment: A multi-model comparison with spatial heterogeneity analysis in Yancheng. Sci. Rep. 2026. [Google Scholar] [CrossRef] [Scilit] [PubMed]

Disclaimer/Publisher’s Note: The statements, opinions and data contained in all publications are solely those of the individual author(s) and contributor(s) and not of MDPI and/or the editor(s). MDPI and/or the editor(s) disclaim responsibility for any injury to people or property resulting from any ideas, methods, instructions or products referred to in the content. |
© 2026 by the authors. Published by MDPI on behalf of the International Society for Photogrammetry and Remote Sensing. Licensee MDPI, Basel, Switzerland. This article is an open access article distributed under the terms and conditions of the Creative Commons Attribution (CC BY) license.